
 Submit a Paper
 Propose a Special lssue
 Open Access
ARTICLE

Evaluation of the Air Leakage Flowrate in Sintering Processes
1
School of Mechanical Engineering and Automation, Northeastern University, Shenyang, 110819, China
2
Anshan Iron & Steel Corp., Anshan, 114051, China
* Corresponding Authors: Xiangwei Kong. Email: ,
Fluid Dynamics & Materials Processing 2023, 19(11), 2791-2812. https://doi.org/10.32604/fdmp.2023.029692
Received 03 March 2023; Accepted 25 May 2023; Issue published 18 September 2023
 View Full Text
 Download PDF
Abstract
Iron ore sintering is a pre-treatment technology by which ore fines are converted into porous and permeable sinters, which are the used in blast furnaces. This process can be adversely affected by air leakage phenomena of various types. As experimental measurements are relatively difficult and often scarcely reliable, here a theoretical model based on typical fluid-dynamic concepts and relationships is elaborated. Through the analysis of two extreme cases, namely, those in which leakage is due to a small hole or a full rupture, a generalized hole-bed model is introduced, which for the first time also includes a complete bed permeability equation and can deal with different leakage position conditions. The results show that the model can evaluate the influence of leakage on the system at one time and be used to calculate the flowrate and pressure drop. Notably, the obtained results are within a 15% deviation with respect to available experiment values, used for comparison.Graphic Abstract
Keywords
Nomenclature
| A | area of cross-section, m2 |
| Ce | flow coefficient of the thin wall hole for equal-diameter systems |
| Cv | area correction coefficient for the variable-diameter system |
| d | diameter, m |
| dp | average particle diameter, m |
| Em | prediction error of different models, % |
| Ep | pressure change rate, % |
| Eq | prediction error of different processes, % |
| Ft | total friction |
| G | a custom middle calculation parameter (cf.Eq. (20)) |
| K | total flow coefficient |
| L | bed depth, m |
| l1 | a custom middle calculation parameter (cf.Eq. (4)) |
| l2 | a custom middle calculation parameter (cf.Eq. (4)) |
| M | molecular weight of air, 29 g/mol |
| n | total number of wind boxes |
| P | pressure, Pa |
| ΔP | pressure difference, Pa |
| q | flowrate of the sintering sub-bed system, kg/s |
| Q | flowrate, kg/s |
| R | constant of gas, 8314 kJ/kmol |
| T | temperature, K |
| u | velocity, m/s |
| Greek symbols | |
| ρ | density, kg/m3 |
| μ | viscosity of air, kg/ms |
| γ | bed porosity |
| ζ3 | local resistance coefficient of the hole |
| Subscripts | |
| 0 | point on the bed surface |
| 1 | point inside the system in region B |
| 2 | points inside the system |
| 3 | leakage point |
| a | point in the atmosphere |
| b | point inside the bed |
| e | equal-diameter systems in Figs. 3b and 4b |
| max | maximum |
| min | minimum |
| mea | measurement value |
| i | position number of wind boxes |
| B | region B |
| C | region C |
| D | region D |
| E | region E |
| Abbreviations | |
| Given | given values |
The sintering process is the main raw material processing process for blast furnace smelting, and more than 75% of the blast furnace burden comes from sintering. The air leakage of the sintering system is a comprehensive challenge to increasing production and energy saving in the sintering process [1,2]. It reduces the main exhaust system’s negative pressure and the effective air flowrate per unit area, which worsens the sinter quality, power consumption, leads to reduced production, and can result in the sintering machine being severely damaged. Thus, air leakage detection and control are very important for sintering manufacturing.
Currently, the leakage rate and point tests are used together to evaluate the impacts on the sintering system. Appropriate instruments such as the pitot tube and thermal anemometer are often used to measure leakage points [3]. Acoustic methods [4,5] have also been tried in the detection of sintering air leakage. However, there are still some obvious problems with these detection methods. The mixture of multipoint, multiposition, multiform leakage, and multiprocess conditions increase the problems’ complexity, leading to bad measurement repeatability and relatively large inaccuracy. Further, the high consumption of various resources and low precision have not been improved effectively. Additionally, the unclear interaction between leakage and the sintering processes has been an issue in the field.
On the other hand, research on the development of generalized gas leakage, especially those considering both hole size and pressure changes in pipelines, partly benefits the quantitative evaluation of sintering air leakage. The early outflow models for the gas release rate estimation treats the pipeline as a vessel discharging through an orifice and assume that the leakage does not affect container pressure. The difference in modeling conditions between pipelines and pressure vessels demonstrates that the model accuracy is generally insufficient. But these models are still important steps in the development of leakage modeling. Crowl et al. [6] deduced a leakage calculation model suitable for pressure pipelines. The model assumes that the pressure in the pipeline will not change due to leakage, while the leakage flowrate and velocity increase with the hole diameter. Woodward et al. [7] presented the transient leakage model of the pressure vessel, judged the flow state of the orifice according to the pressure relationship, and calculated the leakage rate and leakage amount. Jo et al. [8] improved the hole model by adding the correction factor for the pressure and velocity. The pressure drop caused by friction was considered, and it was found that the results were still too large compared with those of the original model. These results indicate that the conventional outflow models treating the pipeline as a vessel discharging through an orifice are inadequate.
A pipe model used for flow estimation under full fracture conditions have gradually appeared, which considers the pressure drop of full fracture, but has a significant deviation for other leakage diameters. Various forms of previous pipe models were summarized by Turton [9], and two previously unpublished relationships for adiabatic frictional flow pipes to directly evaluate the flow rate, were introduced. Levenspiel [10] established a leakage model for when the pipe was fully broken and analyzed the pressure drop along the pipeline. Picard et al. [11] proved that using the perfect-gas theory could result in the underestimation of leakage in high-pressure sour-gas pipelines. Thus, the model was slightly modified so that the initial mass of fluid in the pipeline is determined based on real fluid theory. A conservative approximation of the depressurization process results is closer to the real situation.
A hole-pipe model was proposed by Montiel et al. [12], which was the first one that can realize the coupling calculation of leakage hole diameter and pipe pressure. Dong et al. [13,14] added a compressibility factor Z into the state equation of a perfect gas to decrease deviation from the real gas in engineering calculation. The applicability of the hole-pipe model in high-pressure gas was improved. Luo et al. [15] derived a simple model to estimate gas release rate by correcting Jo et al. [8] model considering kinetic energy changes in a high-pressure pipeline. These modifications decreased error to less than seven percent. Kostowski et al. [16,17] paid attention to modeling the steady-state flow of natural gas in distribution pipelines. Their research results showed that an appropriate choice of the flow model and the discharge coefficient allows one to reduce the uncertainty of the estimated leakage. The work of Bahadori [18,19] also confirmed the important role of the flow coefficient. Developing hole-pipe models with flow coefficients is significant for sintering air leakage.
With the help of computational fluid dynamics (CFD), the development of leakage and diffusion models adapted to various specific scenarios has made great progress. A numerical model for simulating the fluid dynamics following the rupture in pressurized pipeline networks was described by Mahgerefteh et al. [20,21]. The work indicates the importance of accounting for pipeline system configuration complexity. Using the results of optimal design-based CFD simulations, Bagheri et al. [22] presented a set of soil-classified models that consider the emission of sour natural gas in silty, sandy, and gravelly soils. Natural gas leakage and diffusion in three layouts (an enclosed layout, a patch layout, and a street canyon layout) were simulated by Liu et al. [23] using a three-dimensional CFD model. Sun et al. [24] proposed a 3D model based on a coupled Eulerian-Lagrangian approach to investigate gas leakage’s underwater release characteristics and diffusion law. Siddiqui et al. [25] proposed a CFD-based model for indoor risk assessment considering the accidental release of a sustained, small, undetected leak of a dense toxic gas (chlorine) in an industrial indoor environment. Deng et al. [26] established a dispersion model based on CFD, which can take any terrain into account. Then, the dispersion scenarios of released gas in four different terrains were studied. High-dimensional models established by CFD can consider more leakage factors and local boundaries, thus another possible CFD method for careful consideration of sintering air leakage is provided. However, limited by the short pipe model and computing efficiency, it is difficult for CFD models to meet the requirements of real-time estimation and engineering.
Given the practice earlier mentioned in generalized gas leakage, it is necessary to develop accurate and simple estimation tools that incorporate previous studies’ results, and have fewer computations and resource consumption than the CFD method for predicting sintering air leakage.
However, there is still a significant gap in the leakage between the pipelines and the sintering bed. Compared to natural gas pipelines, the sintering system is a comprehensive system that combines a fixed bed and a thermal negative pressure pipeline, which is obviously more complex, and the operating state between the leakage and the fixed bed is mutually affected. In this study, taking the complete bed resistance items and the flow coefficient into account, a new hole-bed model is first proposed. The pressure drop in the sintering bed is estimated using the combination of Ergun’s equation and the air leakage item. The sintering air leakage is placed in the process background to better achieve air leakage evaluation at different positions, and the model validations are performed in a laboratory environment.
2 General Description of Air Leakage Models
Iron ore sintering is a pre-treatment technology to convert ore fines into porous and permeable sinters, which are the most important burden materials for blast furnaces, wherein air passes through the material layer and discharges through flue pipes. The sintering material is transported from the ignitor to the tail of the machine, and the Sintering process is usually studied as a fixed bed due to the slow speed of the material flow.
The general occurrence of holes and gaps in different regions can be found everywhere on the sintering machine, with seals and connections also having some air leakage. In principle, they can all be regarded as differential pressure type leakage. Under the steady-state sintering process, the leakage flowrate is related to where the leakage is located, and the influence of leakage at different positions on sintering pressure is also different. As shown in Fig. 1, the sintering system is divided into different regions according to different equivalent diameters. Region B represents the transitional cavity between the sintering bed and wind boxes, which is the same size as the bed. Regions C, D, and E represent the wind boxes, wind legs, and flue pipe. From region B to region D, the equivalent diameters become increasingly smaller.
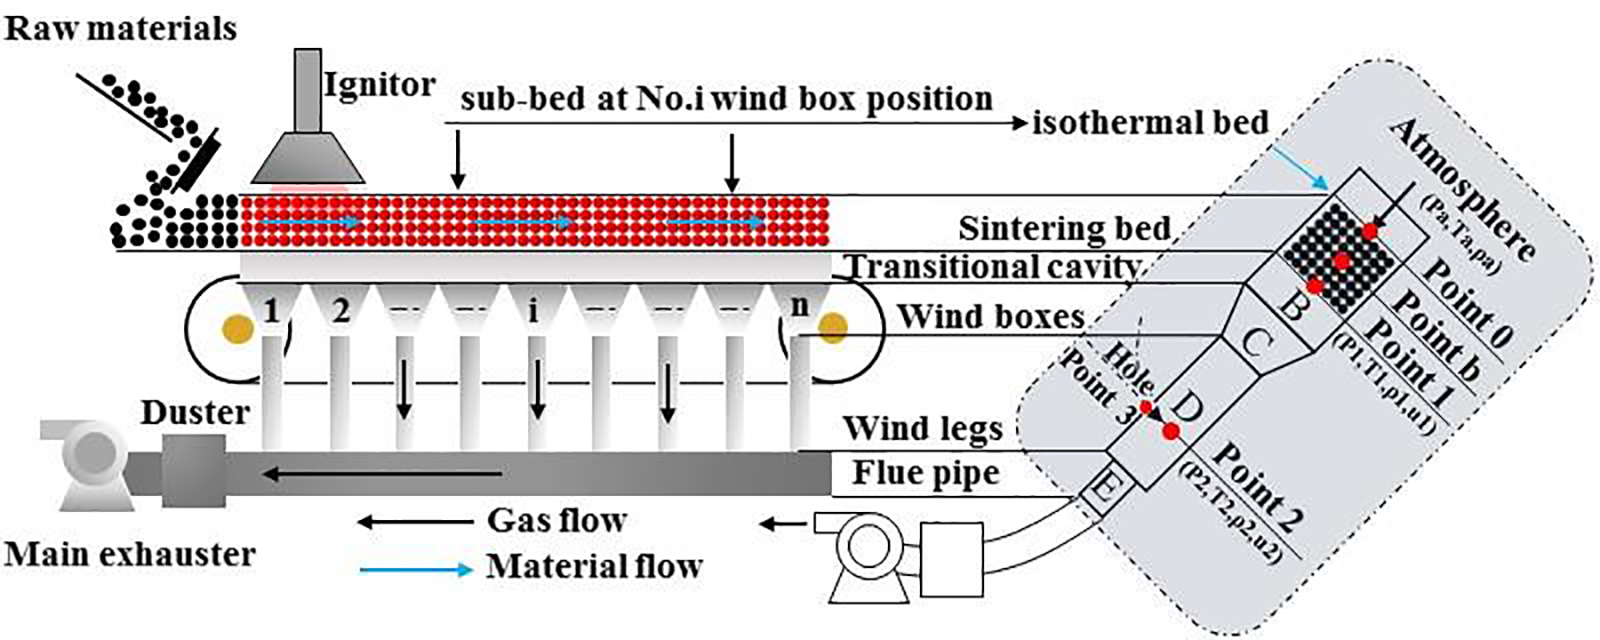
Figure 1: Schematic of a typical sintering process
The main air leakage points in the different regions are as follows:
• Region B: leakage in region B including bed surface cracks and holes, cracks between sintering pallets, the sealing devices of the head and tail, slide-way sealings, etc.
• Region C and D: wind boxes and legs; abrasion and corrosion points; connector leakage.
• Region E: flue pipe; abrasion and corrosion points, leakage in double plug-in plate dust valve.
Therefore, the equivalent leakage can occur at any diameter position. Several assumptions were made:
(1) Hole leakage is typically selected to discuss the interaction effects between the leakage and the sintering process because their clear analytical solutions can be obtained easily. The research methods and results reference other differential pressure leakages in the sintering system. Therefore, all leakage points are equivalent to one hole for research.
(2) The sintering system is stable in operation and process, so the thermal state of the whole sintering bed is also stable.
(3) Only the bed resistance is considered, and other local resistance and the way resistance are ignored.
(4) Considering the pressure and temperature variation in the sintering bed, the ideal gas assumption transforms the different sub-bed systems into an isothermal bed.
As shown in Fig. 1: Point 0 is on the bed surface; Point 1 is in region B; Point 2 is on a level with the equivalent hole inside the sintering system; Point 3 is the leakage point; Point a is in the atmosphere; Point b is in the sintering bed; i is the wind box number, and can represent the sub-bed position.
2.2 Gas Flow Model in the Sintering System
The gas flow model of the sintering system is the basis for analyzing air leakage. The equations of Bernoulli, bed resistance [27], continuity, ideal gas state, and given state conditions are applied for the model in Fig. 1 as follows:
From point 0 to point 1,
From point 1 to point 2,
where ΔPb = P0−P1is the pressure drop of the sintering bed and always has a positive value according to the direction of pressure integration, Pa, and Ftis the total friction. The Ergun equation fits the friction data well for laminar, turbulent, and transitional flows and is widely used in packed beds.
There are three variables (Qb, ub, Tb) to be solved. First, the main equation about ub is obtained from Eq. (1) as follows:
Eq. (3) can be written as:
According to the root formula, removing the unreasonable negative value solution:
Then, the flowrate Qbof the sintering bed is obtained:
As shown in Eqs. (6) and (7), the solutions of Qb and ub depend on Tb finally. According to given conditions of the temperature and pressure at each wind box position, the flow conservation between the whole sintering bed and sub-bed systems is utilized to solve the Tbed as follows:
Finally, Tb is listed as follows:
So far, the values that have been placed in region B of the simplified model are obtained from Eqs. (6)–(9). They include the pressure Pb, the density ρb, the temperature Tb, the velocity ub, and the flowrate Qb.
And then, all the state values that have been placed in the other regions (Regions C, D, and E) can be obtained by Eq. (2).
Thus, Eqs. (6)–(9) and (2) are the main equations of the gas flow model in the sintering system.
2.3 Proposed Models for Different Leakage Positions
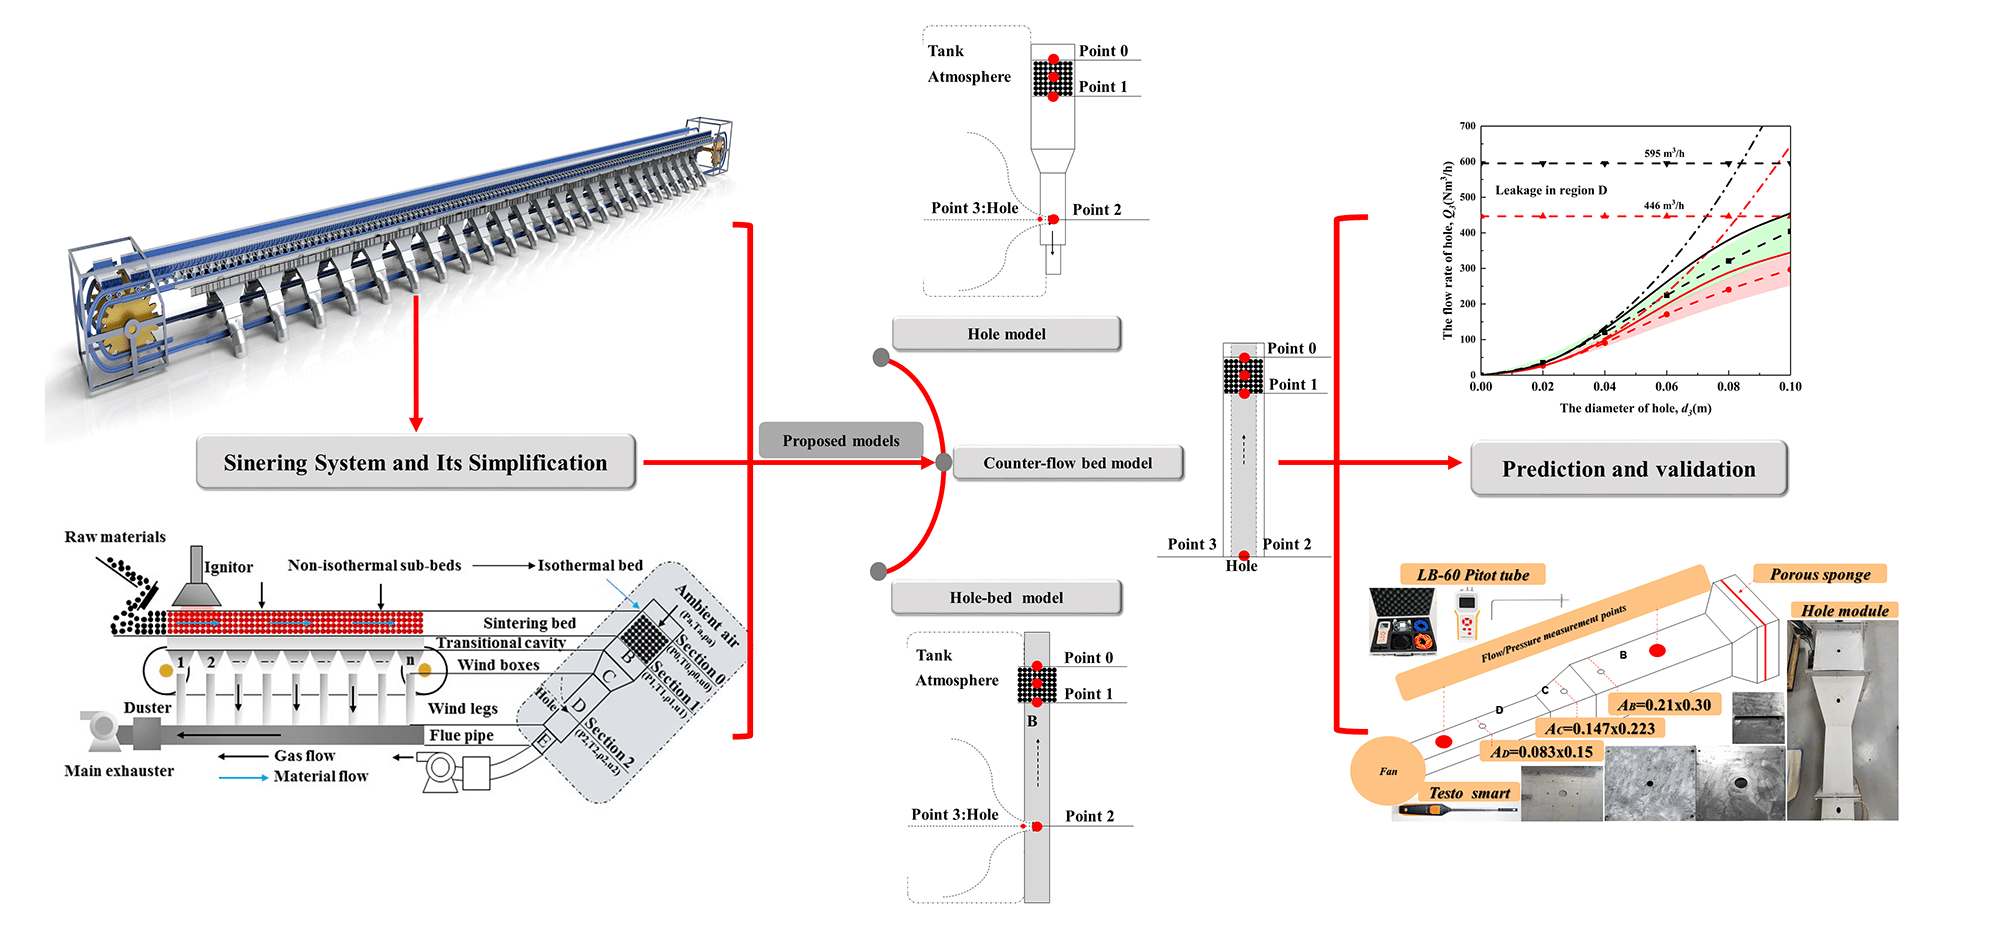
The leakage evaluation model is proposed based on the above-mentioned flow model. Such a model consists of a blending of the two limiting cases obtained by considering a small hole (hole model for different leakage positions, which assumes that the hole is small enough to keep the pressure unaffected) and a full rupture of the sintering system (counter-flow bed model for different leakage positions, in which the sintering process stops, and the maximum leakage flow limit is achieved).
2.3.1 Hole Model for Different Leakage Positions
In this model, the hole is small enough to keep the pressure inside the sintering system unaffected. The atmosphere is simplified to a large tank, as shown in Fig. 2. The principles of orifice outflow from the tank are applied to the model as follows:
Considering that the value of ua is much less than u3, the leakage flowrate Q3 is derived below:
Eq. (11) is the basic formula of constant outflow from small thin-walled orifices in fluid mechanics. For the circular thin-walled orifices, the flow coefficient Ce = 0.60.

Figure 2: The hole model for different leakage positions; (a) equal-diameter systems; (b) variable-diameter systems
In fact, Ce is only suitable for equal diameter systems (Fig. 2a). As shown in Fig. 2b, when the hole occurs at different leakage positions, the form of the outer wall of the virtual tank will change, and so does the resistance through the hole. As it is difficult to determine the flow coefficient directly by the general achievements of fluid mechanics. the leakage flowrate needs to be corrected according to its diameter position, as given in Eq. (12).
Here, K is the total flow coefficient suitable to the different leakage positions, which contains the Ce in equal-diameter systems. Amax and Amin are the maximum and minimum areas of different regions, m2.
Not only the thin wall hole but other differential pressure type leakages can be also expressed in forms similar to Eq. (12), such as Q = KAΔPm (the expressions with known leakage area) or some other empirical formulas based on pressure difference (the expressions of the pressure difference for sealing, connection, penetration, etc., with unknown leakage area). Because Eq. (12) is clearer and more convenient for discussion and expression by comparison with the other expressions, after it is deeply coupled with the other leakage models, it is more conducive to obtaining a clear analytical solution without iteration.
2.3.2 Counter-Flow Bed Model for Different Leakage Positions
The full rupture is the other extreme case different from small holes. The case analysis has great benefits to the proposal of the hole-bed model. As shown in Fig. 3a, leakage holes can occur in any diameter position. Because Point 2 is on a level with the hole inside the sintering system, both the diameter and area of Point 2 (d2 and A2) can represent the position of the leakage hole.

Figure 3: The counter-flow bed model for different leakage positions; (a) variable-diameter systems; (b) equal-diameter systems
When a full rupture appears at different positions, the sintering process stops, and the maximum leakage flow limit is achieved. Point 2 and Point 3 have the same state conditions, thus, A3 = A2(AE ≤ A2 ≤ AB), P3 = P2 = Pa = given, and the hole velocity u3 are different under different full-rupture positions. Moreover, there is a clear many-to-one relationship between different diameter positions A2and the rupture pressure Pa (many maximum leakage diameter limits correspond to one rupture pressure). Therefore, the following relationships must be done for modeling the full rupture case:
(1) The flowrate through the whole bed in the steady running state can be regarded as the maximum leakage limit. So, the relationship Qb = Q2 = Q3is obtained. At the rupture position, P2 = Pa = 101325 Pa means the leakage gas must pass across the bed in the opposite direction (see Fig. 3b). So, the calculation of Q3 is the application of the gas flow model (i.e., Eqs. (6)–(9)) in the counter-flow direction in region B.
(2) When full ruptures appear in different diameter positions, different maximum leakage diameter/area limits must be given (AE ≤ A2 ≤ AB) to simulate the many-to-one relationship mentioned earlier. To ensure the consistency of the pressure relationships, these new equal-diameter systems (Fig. 3b) are actually equivalent to the sub-bed systems. Thus, carefully contrasting the same points of two systems between Figs. 3a and 3b, the state values (P, T, ρ, u) of Points 0, 1, and b in region B are always the same. Except for u, the other state values (P, T, ρ) of Point 2 in region C/D/E are also always the same.
(3) The full rupture in region B (A2 = AB = Ab) is a special case. For the equal-diameter system which can correctly reflect the maximum leakage flowrate Qb for the other equal-diameter systems (AE ≤ A2 < AB), a coefficient Cvwith cross-section area ratio must be considered to achieve the total flow conservation in full ruptures at different positions.
Due to the presented analysis, leakage in the variable-diameter system (Fig. 3a) is converted into that in the equal-diameter systems (Fig. 3b) for further solving.
First, taking the condition given by Eq. (13) to replace the given pressure conditions of Eqs. (6)–(9), the state parameters ( Pb, Tb, ρb, ub) and the flowrate limit Qt are obtained. Their expressions and values are the same as those of Eqs. (6)–(9). However, it should be noted that the results are obtained by using the counter-flow conditions and the direction of pressure integration is the opposite. This point is especially important for further models.
The state relationships of each point between the two systems are given by Eqs. (14) and (15). Points 0, 1, and b are in region B, with the same state values. In other regions (C/D/E), the area correction coefficient Cv is used for the total flow conservation.
According to the area and flowrate relationships between the whole sintering bed and sub-bed systems, Cv can be easily obtained, as follows:
At this time, all state values of the variable-diameter system in Fig. 3a can be solved by the equal-diameter systems in Fig. 3b. And the leakage flowrate Q3 can be expressed as:
Eq. (16) is equivalent to Eq. (7) from the form.
2.3.3 Hole-Bed Model for Different Leakage Positions
Taking account of the sintering processes, different diameter positions, the flow coefficient, and different hole sizes, the hole-bed model proposed here can better evaluate the air leakage flowrate and its impacts on the sintering process.
Fig. 4 shows that all the airflow through the hole also flows through the sintering bed. As obtained in Section 2.3.2, the solution of the variable-diameter system depends on the equal-diameter systems. The same method continues to be used for the hole-bed model. The state relationships of Points 0, 1, 2, and b inside the two systems (Figs. 4a and 4b) are given by Eqs. (14) and (15). According to the flow conservation from holes to counter-flow beds, the state relationships of Point 3 between the two models (Figs. 4a and 4b) are given by Eq. (17).
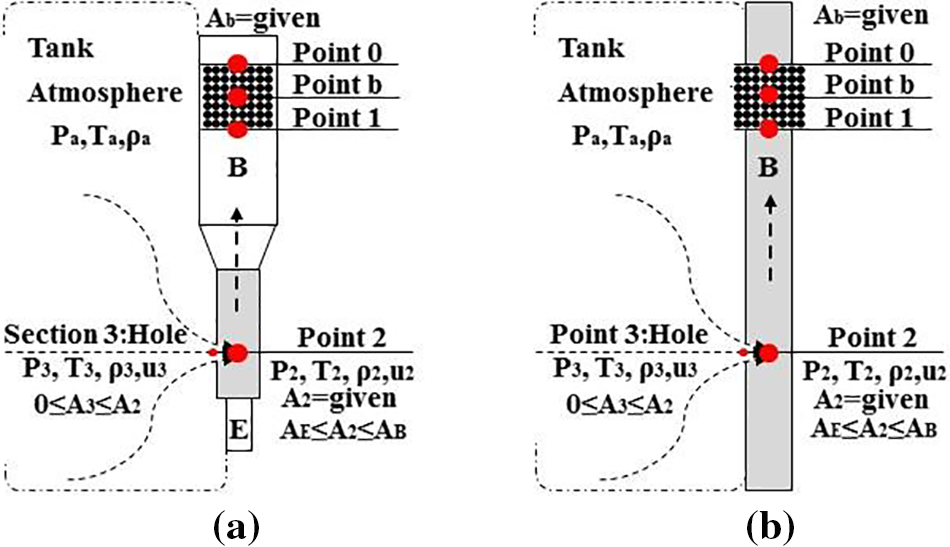
Figure 4: The hole-bed model for different leakage positions; (a) the variable-diameter system; (b) the equal-diameter system
For the sintering system, the pressure P2 is equal everywhere in different regions. Thus, comparing Eqs. (11) and (17), it is obvious that the existence of Cv will make the total flow coefficient K of the hole model exceed the theoretical limit and probably lead to a too high u3(even supersonic speed). Thus, Eq. (17) of the hole-bed model is not entirely correct. However, it clearly indicates that the trend of leakage flowrate is rising with the increase of Cv and there is an exact linear relationship between K and Cv. At this time, all coefficients could be unified in the total flow coefficient K by an ideal treatment and meet the universality research results of orifice outflow (K = 0.60−1.0). Therefore, between the K ε (Kmin−Kmax) and Cv ε (Ab/Amax, Ab/Amin), a linear interpolation is used to unify the coefficient Cv in the general range of C and ensure the smoothness of the result. The total flow coefficient K for different leakage positions is obtained as follows:
According to Eqs. (17), and (18), the hole model for variable-diameter systems can be summarized and expressed as Eq. (12).
Considering the variable-diameter system in Fig. 4a, Eq. (12) of the hole model for different leakage positions, Eq. (16) of the counter-flow bed model for different leakage positions, the continuity equation, the state equation, and the given conditions are listed as follows:
To solve P2 and Tb, Eq. (19) is transferred into the main Eq. (21) about G
According to the root formula, the analytical solution of G can be written directly (see the item inside the square bracket in Eq. (23)). And then, P2 can be derived by Eq. (20) as follows:
Tb is obtained by Eq. (9) based on the counter-flow direction, which is completely consistent with the solution method and process in the counter-flow bed model (see Section 2.3.2).
Therefore, the analytical solution of the leakage flowrate at different diameter positions is given as follows:
Eq. (23) is the hole–bed model for different diameter positions, covering various hole parameters (A3, ρa, Ta, Pa, K), containing different diameter positions (A2), considering more complete bed resistance terms (Ergun equation: turbulent loss term l1, viscous loss term l2), and coupling more detailed sintering process parameters (Pb, Tb, dp, ε, H, μ, Ab). Therefore, such a model can better evaluate the effects of hole sizes and positions on the sintering bed pressure and provides a bridge for the deeper coupling between process and leakage. In the future, more leakage types and more detailed processes can be considered to improve the models.
A typical 360 m2 sintering machine is shown in Fig. 1, and the given conditions for the hole-bed model are listed in Tables 1 and 2. Most status parameters can be obtained in the sintering plant supervision system. Some parameters depend on the sintering machine structure. Using these original conditions, the hole-bed model for different leakage positions can be used to evaluate air leakage effects on the sintering system.


3.1 Results of the Hole Model for Different Leakage Positions
As shown in Fig. 5, when leakage occurs at different diameter positions (Regions B, C, D, E), the leakage flowrate Q3 follows a similar uptrend as the increase of the hole diameter d3. But the leakage flowrate in region E rises even faster and goes above the maximum limit of 521,890 Nm3/h at the earliest in all regions (when d3 > 1.12 m in region E; d3 > 1.16 m in region D; d3 > 1.38 m in region C; d3 > 1.45 m in region B).
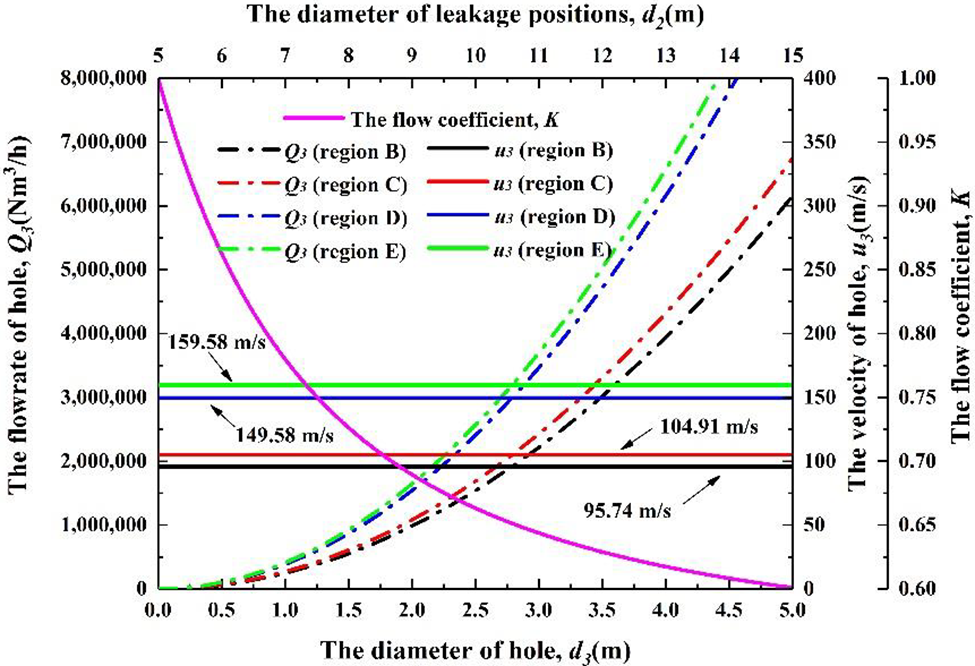
Figure 5: The results of the hole model
However, the velocity only varies between different regions. At the same leakage position, the hole velocity is always constant. The hole model ignores the effect of leakage on internal pressure and keeps the internal and external system pressure drop in only small fluctuations, so the velocity is held constant in the same region. This assumption is reasonable for small holes, however, because the flowrate is rising with the increase of leakage hole diameter without any limitation, this also causes the overestimation of the leakage flowrate.
Variations in the flow coefficient cause the difference in velocity and flowrate between different regions. According to the processing method of K, Fig. 5 also shows the variational curve of the flow coefficient K with the variation in the diameter of the leakage position d2. The flow coefficient of each region is 0.6 (Region B), 0.66 (Region C), 0.94 (Region D), and 1.0 (Region E). From region B to region D, the flow coefficient K, the velocity, and flow rate are getting bigger.
3.2 Results of the Counter-Flow Bed Model for Different Leakage Positions
The model is suitable for full ruptures of the system. As shown in Fig. 6, no matter where the leakage occurs (Regions B, C, D, E), the leakage flowrate is the same (521,890.56 Nm3/h). However, it should be noted that the full rupture area A3 is different in different regions (region B, A3 = AB; region C, A3 = AC; region D, A3 = AD; region E, A3 = AE). The rupture pressure P3 in different regions is the same as the atmospheric pressure of 101,325 Pa. So, the full rupture pressure drop is considered in this model at different leakage positions. Because this model always calculates the flowrate with the full rupture diameter, the leakage flowrate Q3 is not affected by the hole diameter d3.
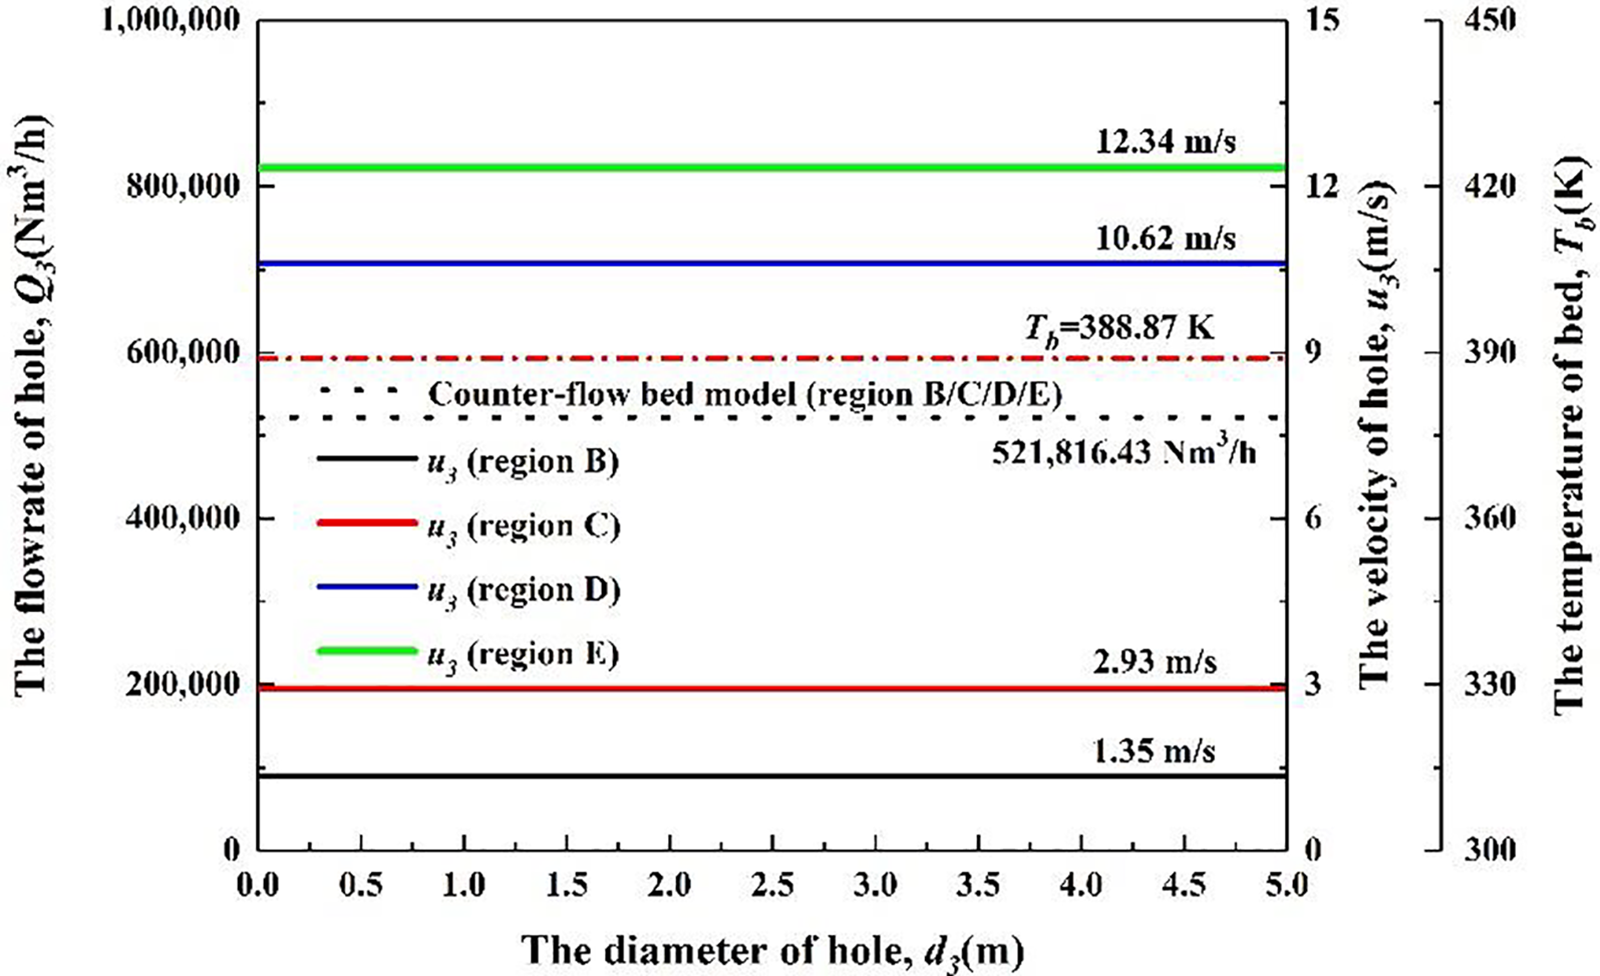
Figure 6: The results of the counter-flow bed model
From the velocity point of view, the velocity u3 in the same region remains unchanged. While the full rupture position is different, the smaller the diameter of the leakage position (AE < AD < AC < AB), the larger the hole velocity u3, as it depends on the flow conservation relationship of the full ruptures at different positions.
3.3 Results of the Hole-Bed Model for Different Leakage Positions
3.3.1 Results for Different Positions
In Fig. 7a, the solid lines correspond to the leakage flowrate at different positions (Regions B, C, D, E) when the hole is small. The flowrate results of the proposed model here are close to those of the hole model (dash-dotted lines). When the hole is large, the results are close to those of the bed model (dotted lines), and it is consistent with reality. Based on the respective advantages of the other two models, variations in hole sizes and their effect on system pressure can be considered at the same time by the hole-bed model. When the leakage is in different diameter regions, even the same hole sizes correspond to different flowrates. The smaller the diameter of the leakage region, the larger the leakage flowrate. It is convenient to evaluate flowrate at different leakage holes and positions at once without consuming many resources.
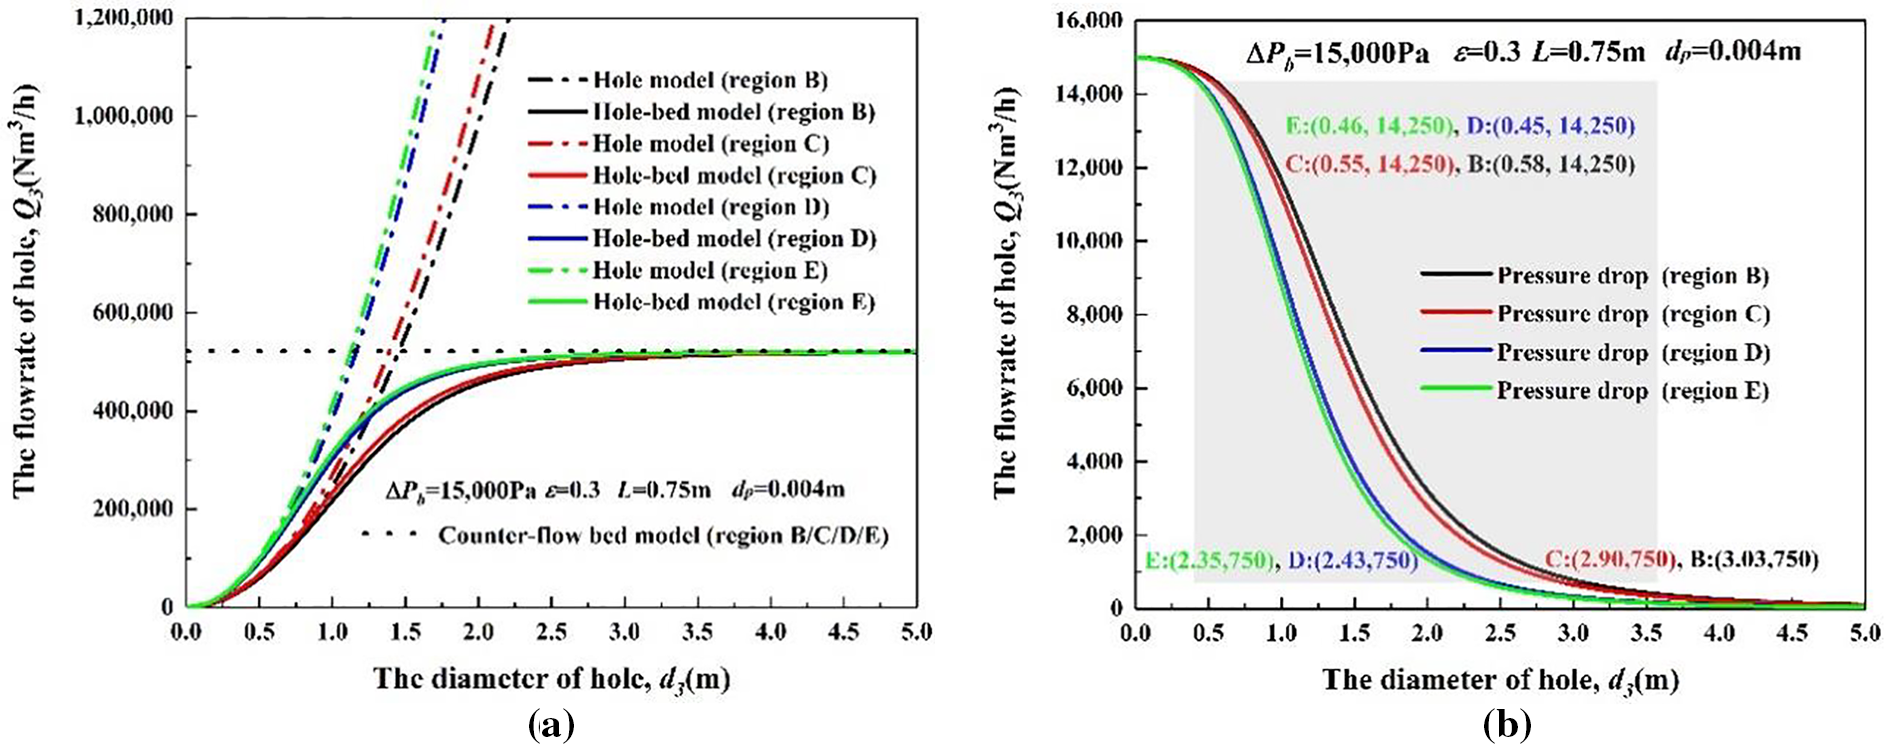
Figure 7: The results of the hole-bed model; (a) relationship between hole diameter and leakage flowrate, (b) relationship between hole diameter and system pressure drop
The definition of small hole specification is fuzzy and uncertain. In natural gas pipelines, according to long-term practical experience, some researchers define the small hole size as a diameter of d < 20 mm. Some use the diameter ratio d3/d2 = 0.15–0.30 as the boundaries. Either way, the boundary between the models is generally discussed based on the deviation within 5%.
The prediction error of different models is expressed as:
where Q3,h is the flowrate of the hole model and Q3,h−bis the flowrate of the hole–bed model.
Based on the results of Fig. 7a, the small hole boundary (Em = 5%) in each region is approximately 0.73 m (Region B), 0.69 m (Region C), 0.58 m (Region D), and 0.56 m (Region E). The corresponding diameter ratio is 0.048 (Region B), 0.067 (Region C), 0.108 (Region D), and 0.112 (Region E). There are no certain and unified model boundaries for leakage at different positions.
The pressure drop results of the hole-bed models are shown in Fig. 7b. The larger the leakage hole diameter, the lower the pressure drop. The definition of the pressure change rate can be given by Eq. (25).
When the leakage hole is small, the pressure drop of the sintering system reduces but not by much. With the hole diameter coming into the important boundaries (Ep = 5%), the pressure declines rapidly (Ep: 5%–95%). This indicates that the effective airflow across the sintering bed will decrease synchronously and thus, when the hole diameters continue to increase, the pressure changes gradually. Although the pressure trends of each region are similar, the leakage hole diameters in region E reach the boundaries of 5% earlier than the others (see Fig. 7b; when d3 > 0.45 m in region E, d3 > 0.46 m in region D, d3 > 0.55 m in region C; d3 > 0.58 m in region B).
For holes of the same sizes at different positions, air leakage brings varying degrees of harm. Leakages at the positions in the smaller diameter region are more harmful to the sintering production because there are faster change rates (in order of harm; region E > region D > region C > region B).
To summarise, 0.45–0.73 m is the important scope of leakage diameter and it is better to control the leakage below this range.
3.3.2 Results for Different Processes
The hole-bed model builds a theoretical linkage and bridge between the leakages and the sintering process through the Ergun equation for the first time. The flowrate results are more complex in the different processes and positions.
Taking the leakage flowrate in regions B and D as the boundaries, those of the other regions under the same process are all included in the range. As shown in Fig. 8, with the change of process parameters, the flowrate of the same hole diameters in the same regions are different, the differences of which are slight in the small holes and gradually closer to the differences between different process conditions as hole diameters rise. This is because the change of process parameters leads to different maximum flow limits. The coupling between leakage and process is achieved by the model through the bed permeability, which practically performs a kind of flowrate distribution mechanism. The maximum flow limits depend on the general model of fixed bed based on the Ergun equation, and its general conclusion applies to sintering air leakage.
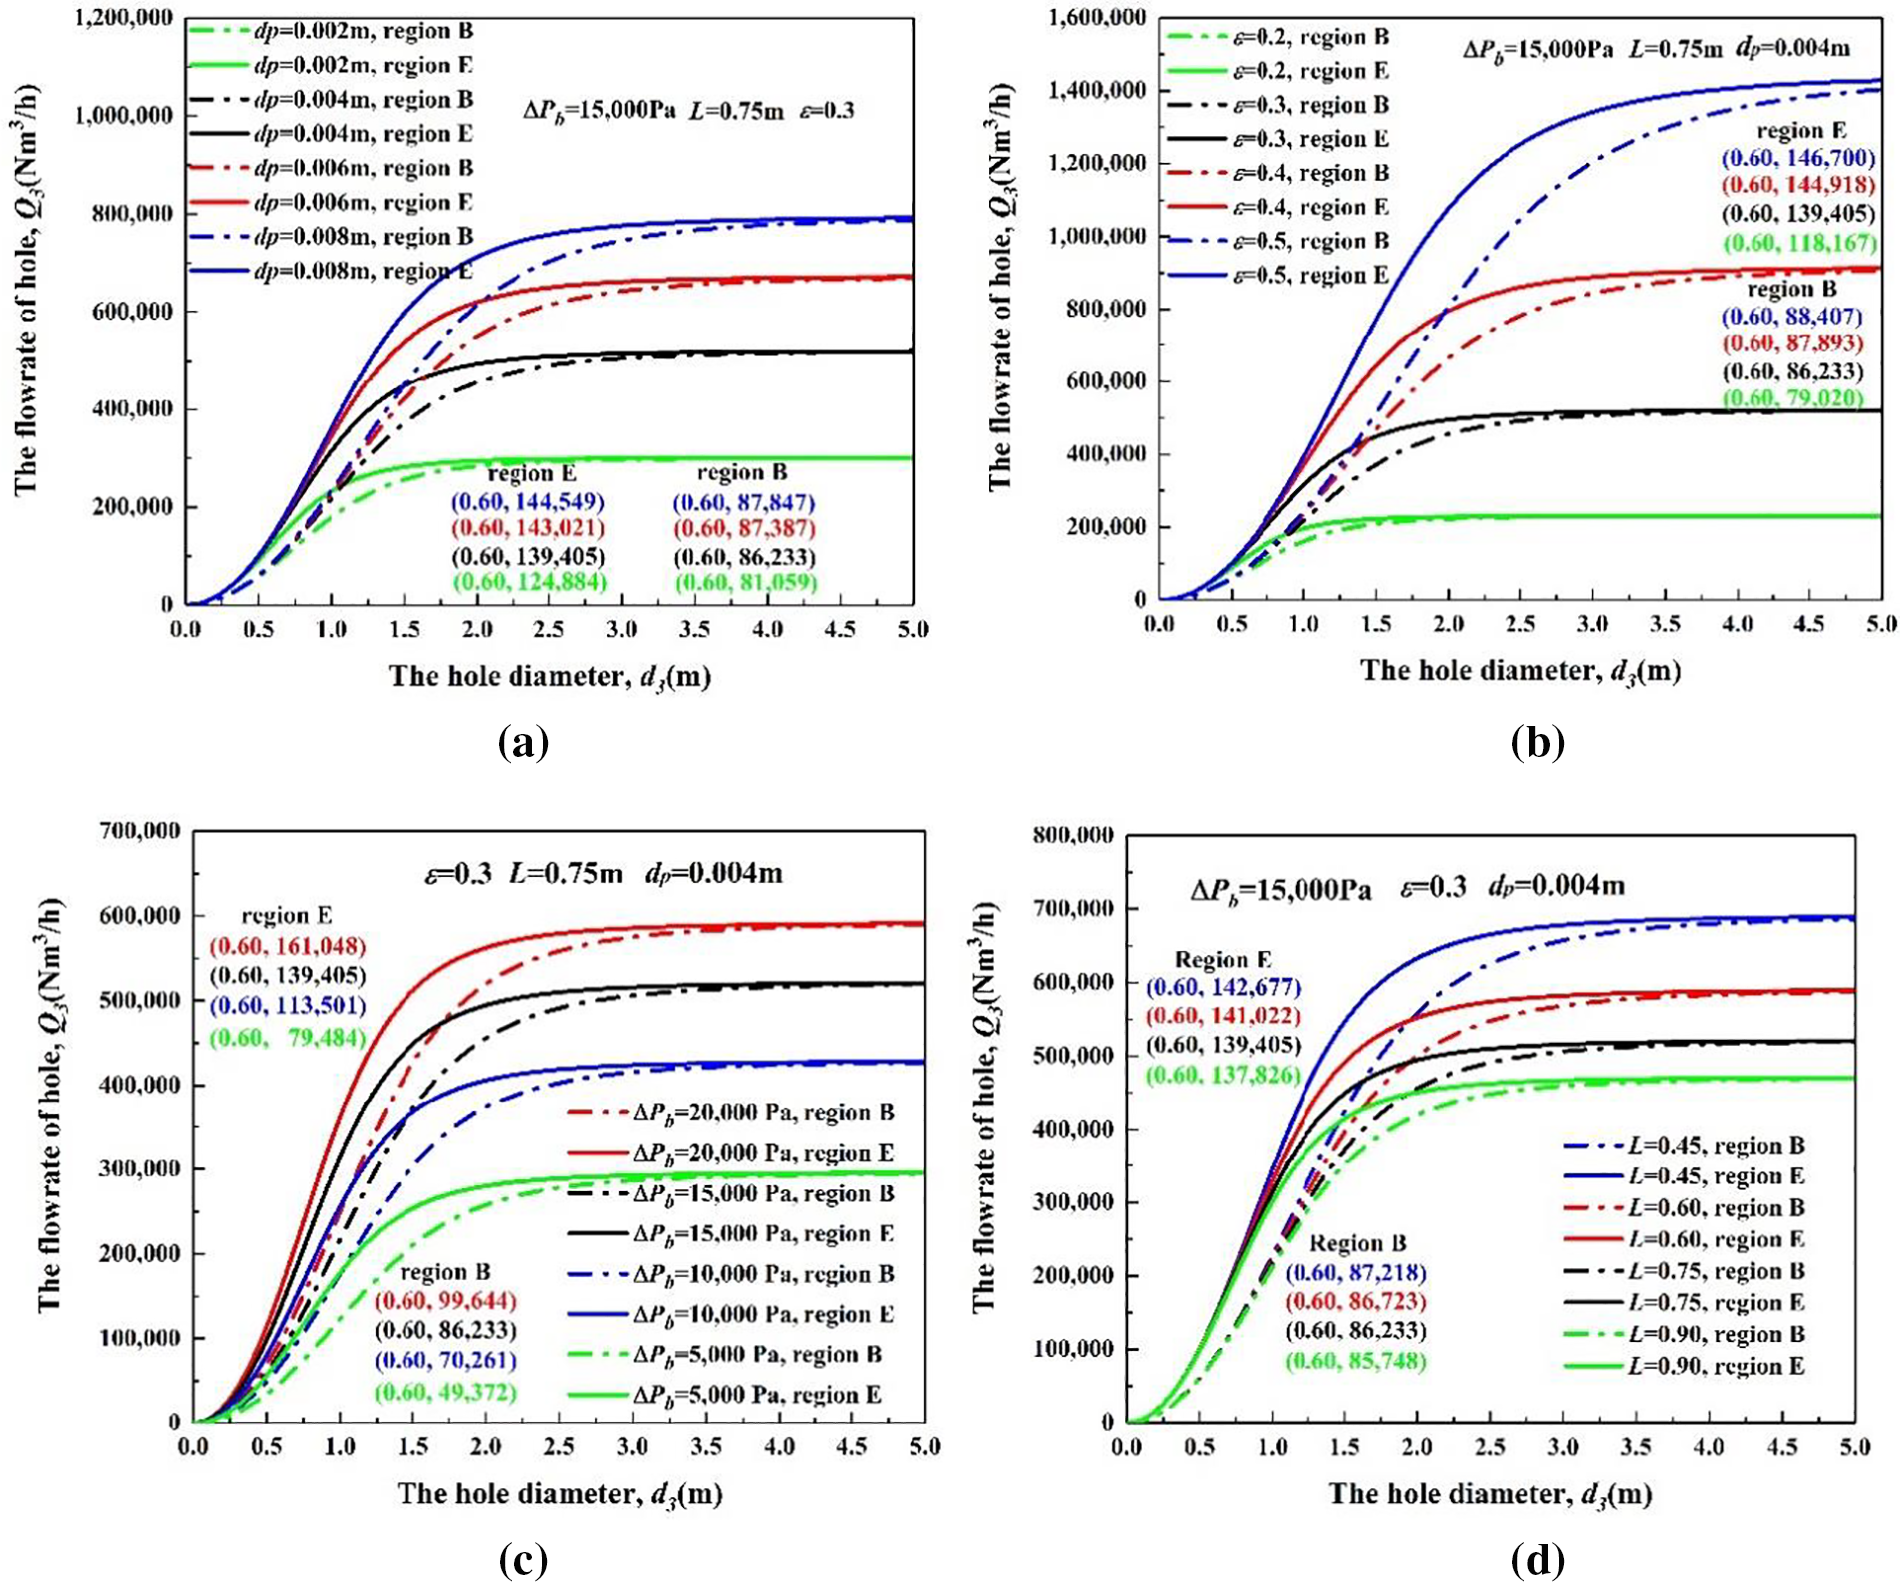
Figure 8: Relationship between hole diameter and leakage flowrate under different positions and processes; (a) initial pressure drop, (b) porosity, (c) bed depth, (d) particle diameters
The prediction error of different processes is expressed as:
where Q3,b−p are the leakage flowrate based on the typical process in a certain region (ΔPb = 15,000 Pa, ε = 0.3, L = 0.75, dp = 0.004, in regions B or E). The typical hole diameters (d3 = 0.60) in regions B and E were selected to display the differences between processes. Thus, when d3 = 0.60, in region B, Q3,b−p = 86,233 and in region E, Q3,b−p = 139,405. Q3,o−p is the leakage flowrate under other processes in the same region. When d3 = 0.60, each Q3,o−p are marked in the figures.
When d3 = 0.60, Eq under different processes are obtained, and given as follows:
Fig. 8a: ΔP = (20, 15, 10, 5);
For region B, Eq = (15.55%, 0%, −18.52%, −42.75%), and for region E, Eq = (15.52%, 0%, −18.58%, −42.98%).
Fig. 8b: ε = (0.2, 0.3, 0.4, 0.5);
For region B, Eq = (−8.37%, 0%, 1.93%, 2.52%), and for region E, Eq = (−15.23%, 0%, 3.95%, 5.23%).
Fig. 8c: L = (0.45, 0.60, 0.75, 0.90);
For region B, Eq = (1.14%, 0.57%, 0%, −0.56%), and for region E, Eq = (2.35%, 1.16%, 0%, −1.13%).
Fig. 8d: dp = (0.002, 0.004, 0.006, 0.008);
For region B, Eq = (−6.00%, 0%, 1.34%, 1.87%), and for region E, Eq = (−10.42%, 0%, 2.59%, 3.69%).
For the small holes (d3 < 0.60), various process factors influence the leakage to varying degrees and according to the Eq obtained, porosity and pressure drop are the significant ones. Bed depth activity does not evidently affect the estimation. For large holes (d3 > 0.60), the impacts of the four factors on leakage flow rate are all significant and may not be neglected.
Thus, the sintering processes and leakage positions greatly affect the reproducibility of the measurement. Because the previous measurement always needs to be performed under the same process and the measurement workload at different positions is huge, the measured results cannot be compared with each other, and the mechanism is not clear. The hole-bed model overcomes these shortcomings, and the leakage flowrate at different positions and processes can be measured at one time. Furthermore, it has great guiding significance for the evaluation of other differential pressure type leakage. The main difference is whether a clear analytical solution can be obtained.
To verify the validity of the examined models, experimental verifications in the field and laboratory were performed.
4.1 Experimental Verifications in the Field
The bed model validation was carried out by field test. To ensure accuracy, it is better to verify according to the process and operating parameters. The measurement parameters and conditions were available on-site in the sintering plant supervision system. The results of the countercurrent bed model (Tb = 389 K; Q3 = 521,816 Nm3/h) show that it is completely within the actual average operating results of the sintering plant (390–460 K; 450,000−550,000 Nm3/h).
4.2 Experimental Verifications in the Laboratory
Considering the sintering pressure range (10−17 kPa), leakage velocity considering the flow coefficient is usually high (74.62−162.16 m/s) in the hole model. The field test process also shows that the results are all beyond the measurement range of the available anemometers (45 m/s), while some other leakage usually does not have an exact leakage area and is difficult to be measured directly. This also shows the outstanding advantages of using mathematical models to replace manual measurement. Therefore, the hole and hole-bed model validations must be carried out under laboratory conditions.
Applying the similarity principle, an experimental device was established to study and verify the leakage models. The wind box, wind leg, and the experiment device are shown in Fig. 9. Considering the measurement space limitation for too-small hole diameter and the convenience of hole processing, the leakage hole size was set to 0.02, 0.04, 0.06, 0.08, and 0.10 m in region B, 0.02 m in region C, 0.02, 0.04, 0.06, 0.08, and 0.10 m in region D. The area of each region is marked in Fig. 9.
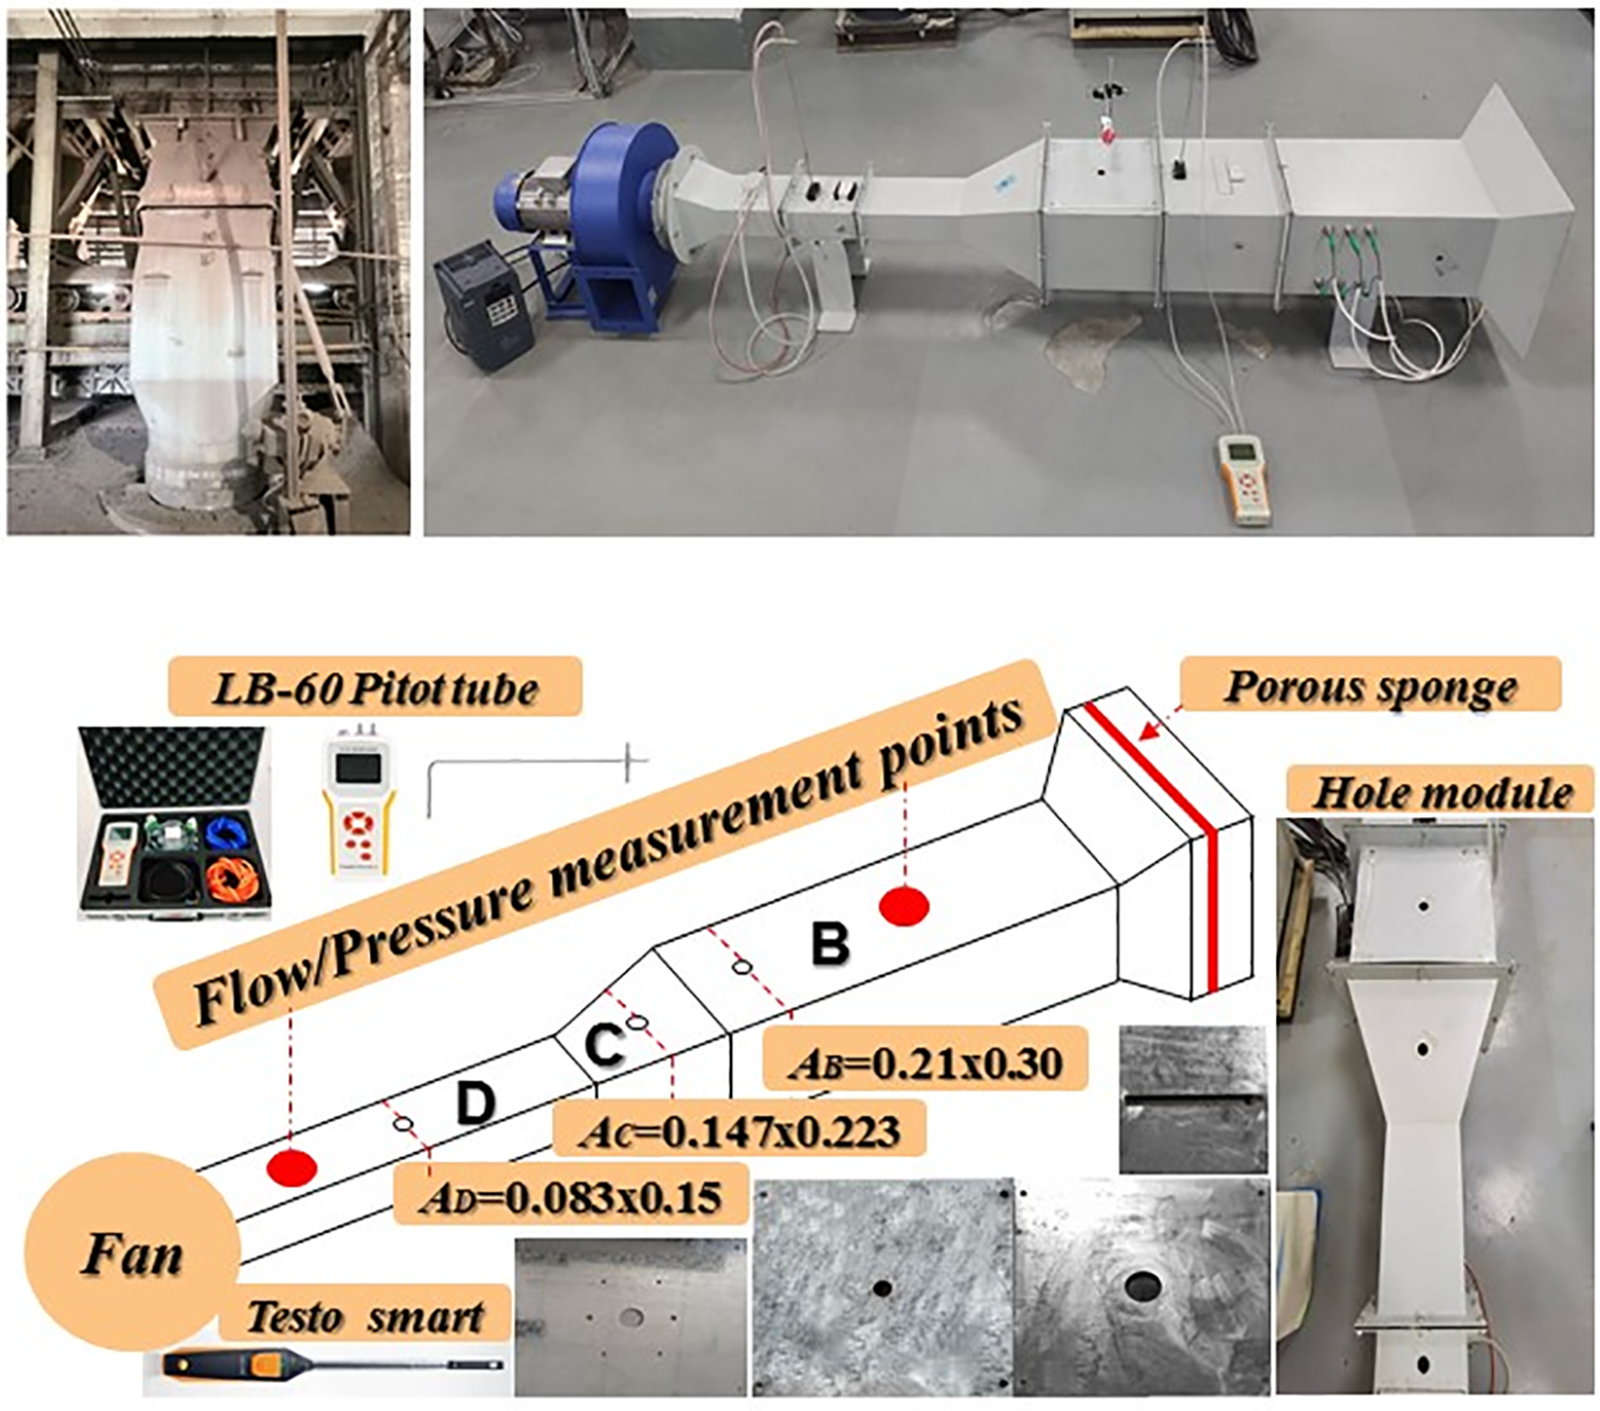
Figure 9: The wind box and wind leg, and the experimental device
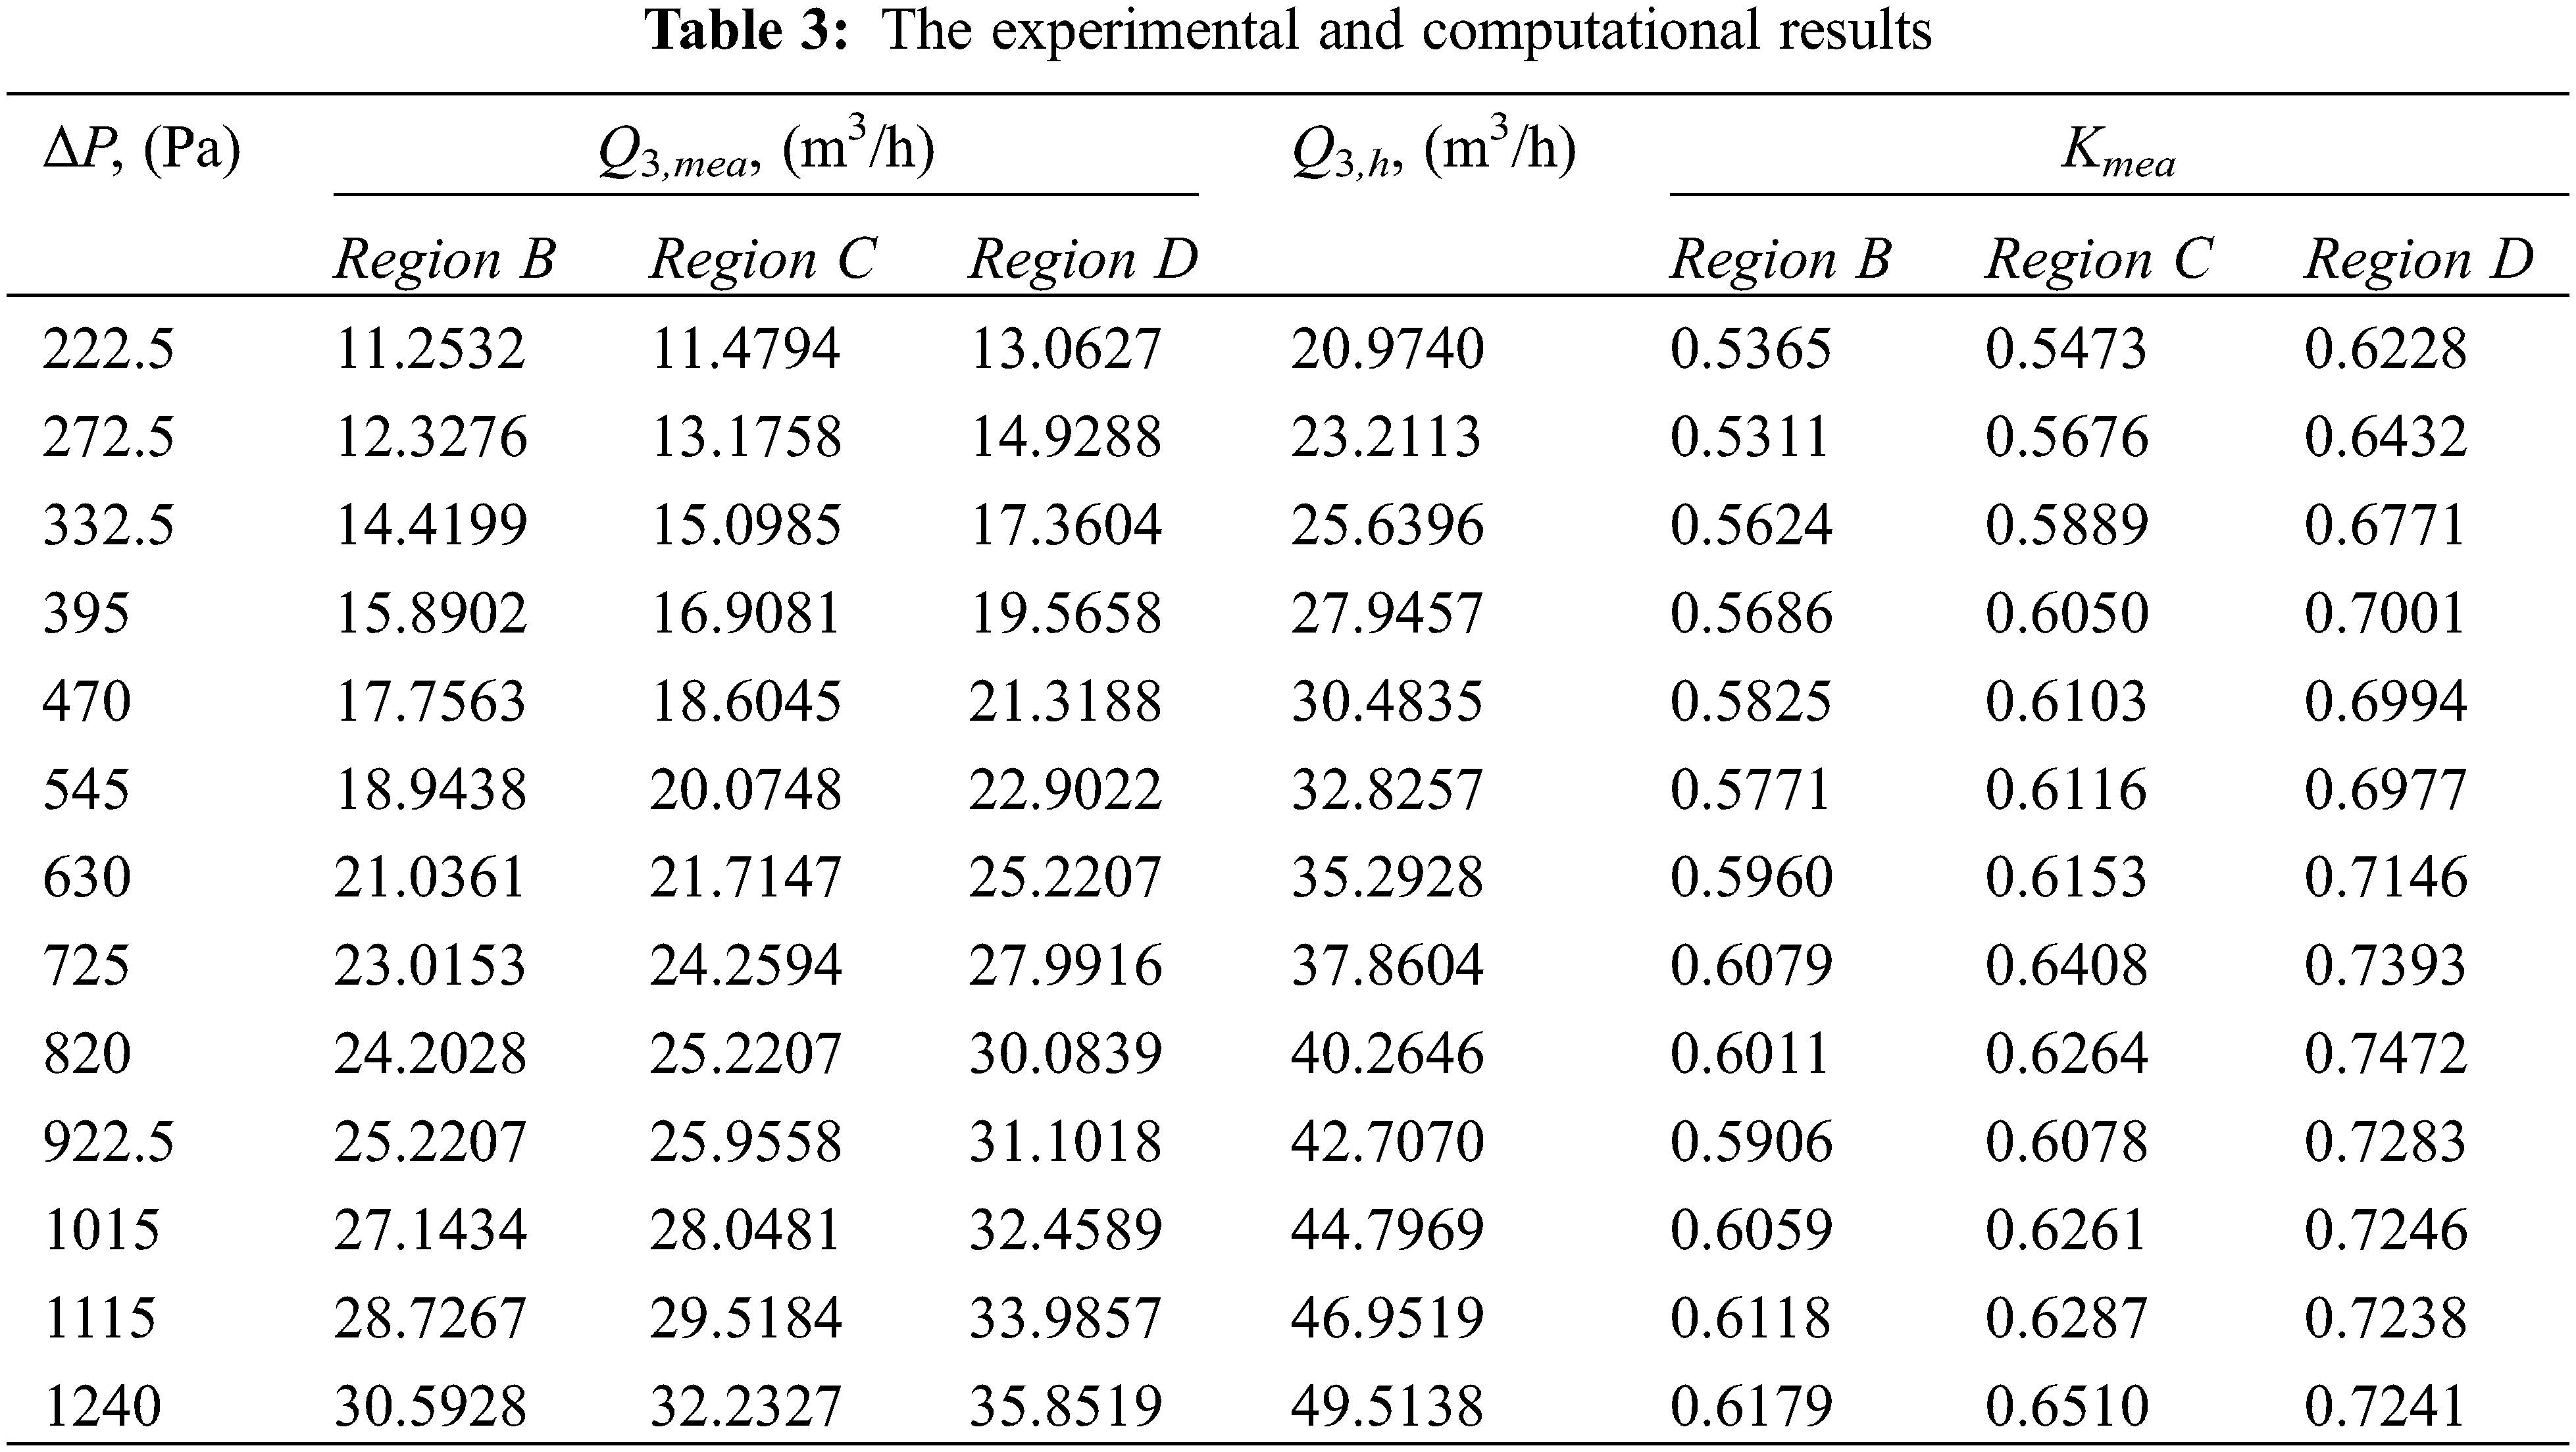
The hole model was verified as follows: Using the frequency changer to control the fans’ rotational speed, the pressure drop and hole flowrate under each leakage condition (d3 = 0.02, the same hole size in regions B, C, and D) was tested. Considering the lack of an exact small hole boundary, the measurement of the average pressure drop at the time of the test was used instead of the initial measurement. This means that the verification method treats each hole as a small one, thus enhancing reliability. Given conditions of the atmosphere were Pa = 101325 Pa, Ta = 300 K.
Table 3 presents the measurement results for the hole model in the laboratory. The test was performed based on the condition that three holes occur in regions B, C, and D simultaneously. At this time, the leakage in the different regions shares the system pressure, which is more convenient to compare, and multi-point simultaneous leakage is more realistic. The results clearly show that the flowrate and flow coefficient in the different regions, for the same hole size, are significantly different. The larger the area correction coefficient Cv is, the smaller the flow coefficient as well as the leakage flowrate. The results of the flow coefficient are also approximately applicable to a single-point leakage in regions B, C, or D, or two-point leakage with other different leakage combinations (B/C, B/D, C/D). The results are similar, and are therefore not listed repeatedly. Therefore, the average flow coefficients of each leakage region were obtained and are: K = 0.58–0.60 (Region B); K = 0.60–0.62 (Region C); and K = 0.70–0.72 (Region D). However, in contrast to the experiment K values, the previous setting of the upper and lower limits of K (0.6–1.0) is not completely reasonable. Therefore, Eq. (18) is replaced by Eq. (27) based on the small hole experiment results.
4.2.2 Hole-Bed Model Verification
The experimental verification was based on leakage holes of various sizes in different regions (B and D). Taking the single-point leakage in region B as an example, the experiment was carried out following the given steps: Use porous material for plugging (L = 0.015 m, ε = 0.3, dp = 0.004 m) and operate the fan by the frequency converter to form two groups of initial pressure drop (ΔPb = 1290, 755 Pa) under no-leakage state. The pitot tubes were used to measure the system pressure and flowrate at two measuring points, and the average value between the two points was used to reduce the error. Different circular leakage hole modules (d3 = 0.02, 0.04, 0.06, 0.08, and 0.10 m) were used to simulate leakage from small to large. Note that the fan flowrate is kept constant (595, 446 m3/h) between leakages of different hole sizes under the same pressure drop, and measure the hole velocity with the thermal anemometer.
The same experiment steps were also performed once for leakage in region D. Based on the experimental operating parameters, the results of the hole-bed model were compared with the experiments to complete the model validation.
Taking ±15% of the experimental values as the reasonable prediction interval, Fig. 10 shows the verification of the hole-bed model in different leakage regions. Whether in regions B or D, the leakage estimation deviation of the hole-bed model is basically within the reasonable interval, and the actual deviation is even within 10% in the relatively small diameter range (0–0.06 m, accounting for 20% of the total diameter range). The total flowrate estimated by the hole-bed model was 543 m3/h (1290 Pa) and 411 m3/h (755 Pa), and so their estimated deviation was −8.74% and −7.85%, respectively.
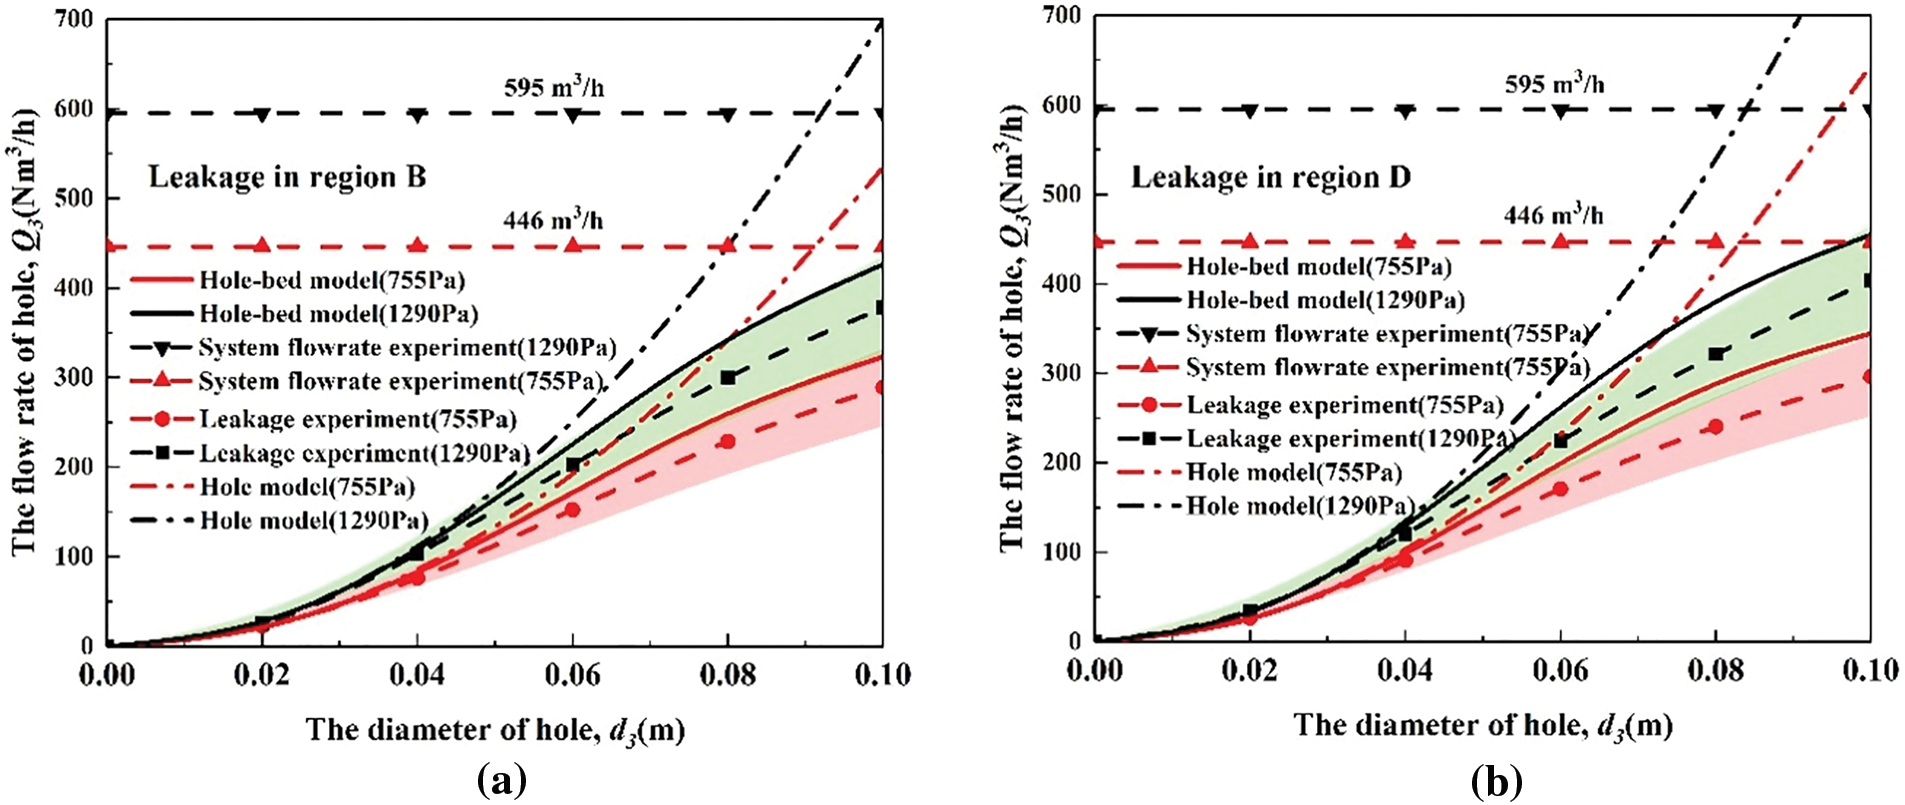
Figure 10: Validations of the hole-bed models: (a) leakage in region B; (b) leakage in region D
However, there is an alternating transformation of positive and negative deviations between small holes and full rupture in the hole-bed model, which means that there is still room for improvement in the model and flow coefficient.
The flow coefficient is related to many factors, such as Reynolds number, hole geometry, the ratio of hole diameter to pipe diameter, and so on [28,29]. Moreover, the dependency of the discharge coefficient on pressure is demonstrated by the literature and experimental data [16].
For multiple leakage forms with unclear leakage areas, the generalized flow coefficient can even include the leakage area, which provides a connection for discussing multiform leakage. A deeper discussion of coefficients should cover all these aspects, which are outside the scope of this article and are not discussed here.
In this work, new models have been developed from the application of the bed resistance equation and the steady orifice outflow model in fluid mechanics, which are less complicated with fewer computations than existing approaches, and suitable for engineers to evaluate air leakage flowrate through holes at different positions in the sintering system. The following conclusions have been drawn from the study:
(1) In the hole model, the difference in various leakage positions is considered in the determination of the flow coefficient; in the counter-flow bed model, the sintering process background is coupled, and the full rupture pressure relationship at different positions is considered in the form of equal-diameter sub-bed systems. These two models are suitable for two extreme cases (where the leakage hole is too small or there is full fracture); obviously, both have some limitations.
(2) The hole-bed model takes all aspects into account for the first time through the combination of the above two models, which means more leakage types and detailed processes coupling becomes possible. Under the steady-state process, the leakage flowrate of various diameters in different positions can be predicted at one time, and the pressure drop caused by leakages can be calculated. The calculation results show that the position and process factors cannot be ignored.
(3) Experiments show that the preset flow coefficient (0.60–1.0) is not completely reasonable, and the hole-bed model achieves a reasonable prediction accuracy by using the experimental coefficient (0.58–0.70).
The hole-bed model establishes a bridge between sintering air leakage and the process for the first time, which still has huge room for development and improvement, especially in multipoint, multiposition, multiform leakage, and more detailed processes and their combined cases. Therefore, it will play a significant role in developing accurate tools for leakage evaluation, reducing resource consumption, and clarifying the relationship between leakage and the sintering process.
Funding Statement: The authors received no specific funding for this study.
Conflicts of Interest: The authors declare that they have no conflicts of interest to report regarding the present study.
References
1. Wang, Y. Z., Zhang, J. L., Liu, Z. J., Du, C. B. (2017). Recent advances and research status in energy conservation of Iron Ore sintering in China. The Journal of the Minerals, Metals & Materials Society, 69(11), 2404–2411. [Google Scholar]
2. Quan, X. K., Zhang, N. N., Yu, G., Liu, Q. F., Ma, L. B. (2022). Prediction of air leakage rate of sintering furnace based on BP neural network optimized by PSO. Wireless Communications and Mobile Computing, 2022, 56371787. [Google Scholar]
3. Sakaue, H. (2009). Improvement of production by decreasing air leak at Nagoya No. 3 sintering plant. Tetsu to Hagane-Journal of the Iron and Steel Institute of Japan, 95(7), 52–55. [Google Scholar]
4. Pasha, S., Ritz, C., Stirling, D., Zulli, P., Pinson, D. et al. (2018). A deep learning approach to the acoustic condition monitoring of a sintering plant. Proceedings, APSIPA Annual Summit and Conference 2018, pp. 1803–1809, Honolulu, Hawaii, USA. [Google Scholar]
5. Shiau, J. S., Huang, T. Y., Liu, S. H., Hsieh, C. M., Yeh, P. Y. (2018). Energy saving technology for lowering air leakage of sintering pallets and dust collectors in sinter plant. Journal of Mechanics Engineering and Automation, 8, 233–249. [Google Scholar]
6. Crowl, D. A., Louvar, J. F. (2012). Chemical process safety: Fundamentals with application, 3rd edition, pp. 122–146. Upper Saddle River, NJ, USA: Pearson. [Google Scholar]
7. Woodard, J. L., Mudan, K. S. (1991). Liquid and gas discharge rates through holes in process vessels. Journal of Loss Prevention in the Process Industries, 4, 161–165. [Google Scholar]
8. Jo, Y. D., Ahn, B. J. (2003). A simple model for the release rate of hazardous gas from a hole on high-pressure pipelines. Journal of Hazardous Materials, 97, 31–46. [Google Scholar] [PubMed]
9. Turton, R. (1985). A new approach to non-choking adiabatic compressible flow of an ideal gas m pipes with friction. The Chemical Engineering Journal, 30, 159–160. [Google Scholar]
10. Levinspiel, O. (2014). Engineering flow and heat exchange, 3rd edition, pp. 20–51. New York, NY, USA: Springer. [Google Scholar]
11. Picard, D. J., Bishnoi, P. R. (1989). The importance of real-fluid behavior in predicting release rates resulting from high-pressure sour-gas pipeline ruptures. The Canadian Journal of Chemical Engineering, 67, 3–9. [Google Scholar]
12. Montiel, H., Vilchez, J. A., CasaL, J., Arnaldos, J. (1998). Mathematical modelling of accidental gas releases. Journal of Hazardous Materials, 59, 211–233. [Google Scholar]
13. Dong, Y. H., Gao, H. L., Zhou, J. E., Feng, Y. R. (2002). Evaluation of gas release rate through holes in pipelines. Journal of Loss Prevention in the Process Industries, 15, 423–428. [Google Scholar]
14. Dong, Y. H., Gao, H. L., Zhou, J. E., Feng, Y. R. (2003). Mathematical modeling of gas release through holes in pipelines. Chemical Engineering Journal, 92, 237–241. [Google Scholar]
15. Luo, J. H., Zheng, M., Zhao, X. W., Huo, C. Y., Yang, L. (2006). Simplified expression for estimating release rate of hazardous gas from a hole on high-pressure pipelines. Journal of Loss Prevention in the Process Industries, 19, 362–366. [Google Scholar]
16. Kostowski, W. J., Skorek, J. (2012). Real gas flow simulation in damaged distribution pipelines. Energy, 45, 481–488. [Google Scholar]
17. Kostowski, W. J., Skorek, J. (2006). Application of experimental flow characteristics of pipeline ruptures in gas network simulation. Chemical and Process Engineering-Inzynieria Chemiczna i Procesowa, 27(2), 579–596. [Google Scholar]
18. Bahadori, A. (2012). A simple predictive tool to estimate flow coefficient for subsonic natural gas flow through nozzle-type chokes. Journal of Natural Gas Science and Engineering, 7, 1–6. [Google Scholar]
19. Bahadori, A. (2012). Estimation of flow coefficient for subsonic natural gas flow through orifice-type chokes using a simple method. Journal of Natural Gas Science and Engineering, 9, 39–44. [Google Scholar]
20. Mahgerefteh, H., Oke, A., Atti, O. (2006). Modelling outflow following rupture in pipeline networks. Chemical Engineering Science, 61, 1811–1818. [Google Scholar]
21. Mahgerefteh, H., Saha, P., Economou, I. G. (1999). Fast numerical simulation for full bore rupture of pressurized pipelines. AIChE Journal, 45, 1191–1201. [Google Scholar]
22. Bagheri, M., Sari, A. (2022). Study of natural gas emission from a hole on underground pipelines using optimal design-based CFD simulations: Developing comprehensive soil classified leakage models. Journal of Natural Gas Science and Engineering, 102, 104583. [Google Scholar]
23. Liu, A. H., Huang, J., Li, Z. W., Chen, J. Y., Huang, X. F. et al. (2018). Numerical simulation and experiment on the law of urban natural gas leakage and diffusion for different building layouts. Journal of Natural Gas Science and Engineering, 54, 1–10. [Google Scholar]
24. Sun, Y., Cao, X., Liang, F., Bian, J. (2020). Investigation on underwater gas leakage and dispersion behaviors based on coupled Eulerian-Lagrangian CFD model. Process Safety and Environmental Protection, 136, 268–279. [Google Scholar]
25. Siddiqui, M., Jayanti, S., Swaminathan, T. (2012). CFD analysis of dense gas dispersion in indoor environment for risk assessment and risk mitigation. Journal of Hazardous Materials, 209, 177–185. [Google Scholar] [PubMed]
26. Deng, Y. J., Hu, H. B., Yu, B., Sun, D. L., Hou, L. et al. (2018). A method for simulating the release of natural gas from the rupture of high-pressure pipelines in any terrain. Journal of Hazardous Materials, 342, 418–428. [Google Scholar] [PubMed]
27. Ergun, S. (1952). Fluid flow through packed columns. Chemical Engineering Progress, 48(2), 89–94. [Google Scholar]
28. Dziubiński, M., Marcinkowski, A. (2006). Discharge of newtonian and non-newtonian liquids from tanks. Chemical Engineering Research and Design, 84(12), 1194–1198. [Google Scholar]
29. Kayser, J. C., Shambaugh, R. L. (1991). Discharge coefficients for compressible flow through small-diameter orifices and convergent nozzles. Chemical Engineering Science, 46(7), 1697–1711. [Google Scholar]
Cite This Article
 Copyright © 2023 The Author(s). Published by Tech Science Press.
This work is licensed under a Creative Commons Attribution 4.0 International License , which permits unrestricted use, distribution, and reproduction in any medium, provided the original work is properly cited.
 Downloads
 Citation Tools