
 Submit a Paper
 Propose a Special lssue
 Open Access
ARTICLE
Optimization of the Plugging Agent Dosage for High Temperature Salt Profile Control in Heavy Oil Reservoirs
1 School of Petroleum Engineering, Yangtze University, Wuhan, 430000, China
2 Petroleum Engineering Technology Research Institute of Shengli Oilfield, SINOPEC, Dongying, 257067, China
3 Postdoctoral Scientific Research Working Station of Shengli Oilfield, SINOPEC, Dongying, 257067, China
4 Petro China Changqing Oilfield Branch No. 1 Gas Production Plant, Yan’an, 716000, China
* Corresponding Author: Yuhui Zhou. Email:
(This article belongs to the Special Issue: Meshless, Mesh-Based and Mesh-Reduction Methods Based Analysis of Fluid Flow in Porous Media)
Fluid Dynamics & Materials Processing 2023, 19(2), 421-436. https://doi.org/10.32604/fdmp.2022.020665
Received 06 December 2021; Accepted 25 February 2022; Issue published 29 August 2022
 View Full Text
 Download PDF
Abstract
After steam discharge in heavy oil reservoirs, the distribution of temperature, pressure, and permeability in different wells becomes irregular. Flow channels can easily be produced, which affect the sweep efficiency of the oil displacement. Previous studies have shown that the salting-out plugging method can effectively block these channels in high-temperature reservoirs, improve the suction profile, and increase oil production. In the present study, the optimal dosage of the plugging agent is determined taking into account connection transmissibility and inter-well volumes. Together with the connectivity model, a water flooding simulation model is introduced. Moreover, a non-gradient stochastic disturbance algorithm is used to obtain the optimal plugging agent dosage, which provides the basis for the high-temperature salting-out plugging agent adjustment in the field.Keywords
As a type of crude oil, heavy oil has a history of more than 150 years since its discovery by the United States in the Nakodochez heavy oil field in Texas in 1866. Heavy oil reserves are abundant throughout the world. The global heavy oil reserves are estimated to be 991.18 billion tons and the recoverable resources are 126.74 billion tons. Most heavy oils are produced in America. The total recoverable resources of heavy oil in this area are 72.69 billion tons, of which South America and North America account for 32% and 25%, respectively. Total recoverable resources of heavy oil in the Middle East amount to 17.67 billion tons, accounting for 14% of the total [1]. Asia, Russia, Europe, and Africa have considerable reserves of heavy oil. Therefore, heavy oil has a vital role in the oil industry [2].
Heavy oil refers to crude oil with a viscosity greater than 50 mPa·s and a density greater than 0.92 g/cm3 under reservoir conditions, thereby showing poor fluidity, high viscosity, and a high freezing point [3–5]. The extraction of heavy oil from reservoirs often requires the reduction of viscosity by increasing the reservoir temperature and improving the fluidity of the heavy oil [6]. Currently, mainstream heavy oil recovery technologies include steam stimulation, steam flooding, hot water flooding, and in-situ combustion. After heavy oil steam discharge, the reservoir deficit is large, and the distributions of temperature, pressure, and permeability between the wells are uneven [7–12]. Steam channeling or water channeling rapidly advances along the direction of high permeability to form a channel in the high-permeability layer, which intensifies the contrast between the high-and low-permeability layers [13]. The injected high-temperature steam or hot water breaks through the high-permeability layer, leading to the loss of a large amount of steam or hot water. The multi-directional steam or water channeling leads to the escape and diffusion of steam or hot water. Simultaneously, high-pressure and high-temperature zones are produced around the channeled wells. This not only wastes the heat energy resources, but also results in unsafe factors that affect reservoir development [14–17]. To improve the oil displacement effect, an appropriate profile control is required to adjust the oil displacement plane and sweep efficiency. Previous studies have shown that the salting-out plugging method can effectively block the gas or water channeling channel of the reservoir, improve the gas absorption profile, and increase periodic oil production [18].
Studies have been conducted on controlling the high-temperature salting-out profile. Qu et al. [19] conducted experiments to evaluate a plugging agent suitable for fire-flooding profile control and verified the plugging ratio of the agent. The results showed that NaCl and Na2SiO3 are two suitable plugging agents. However, this study did not discuss the factors influencing the plugging effect. Jiang et al. [20] conducted experiments on two plugging agents suitable for fire-flooding plugging adjustment, evaluated the performance of the two plugging agents, and analyzed the influencing factors. The results showed that the plugging ratio of NaCl improved with increasing temperature above 300°C; however, this temperature is unfavorable for Na2SiO3. At temperatures above 500°C, an NaCl plugging agent should be used for profile control. However, their study did not consider the effect of the plugging agent dosage on the plugging ratio. Cui et al. [21] established a comprehensive salting-out model considering the reservoir water evaporation, NaCl precipitation in water, and the change in reservoir porosity/permeability, and analyzed the reservoir water evaporation and salting-out during the development of high-temperature gas reservoirs. Their model can describe the salt precipitation of high-temperature gas reservoirs and establish a relationship between salt precipitation and porosity/permeability to analyze the influence of salt precipitation on production. Their study shows that the high-temperature reservoir water flooding process also has a salting-out phenomenon; namely, high-temperature salting-out profile control is also suitable for hot water flooding. Simultaneously, the quantitative description of the salting-out amount in high-temperature salting-out profile control laid the foundation for determining the plugging agent dosage in high-temperature salting-out profile control. Jiang et al. [22] conducted studies on plugging agents for high-temperature profile control during fire flooding and investigated the influence of NaCl and Na2SiO3 concentrations, injection amount, and other factors on the plugging rate. The results showed that the plugging rate increased significantly with an increase in the plugging agent concentration, and the plugging rate was the highest in the saturated solution. The plugging ratios of the two plugging agents were enhanced with an increase in the injection volume. This study analyzed the effects of plugging agent concentration and plugging dose on the plugging ratio. However, this study only qualitatively analyzed the factors influencing the plugging ratio without quantitative analysis. Jiang et al. [23] studied the variation in porosity and permeability of high-temperature salting-out profile control in heavy oil reservoirs and established a comprehensive salting-out model considering the reservoir water evaporation, NaCl precipitation in water, and variation of reservoir porosity/permeability. Studies show that the change in porosity/permeability caused by salting-out follows certain rules. The porosity/permeability model of salting-out was fitted and corrected experimentally, and the calculated plugging rate was close to the experimental results. The research results reflect the variation of porosity/permeability in the high-temperature salting-out profile control of heavy oil reservoirs, which provides a reference for the temporary plugging technology implemented in the field. However, this study did not investigate the optimization of the agent dosage in salting-out profile control.
Zhao et al. [24] pioneered an interwell connectivity method named interwell numerical simulation model (INSIM). This method uses parameters, such as the interwell connection transmissibility and interwell volume, to reflect the entire reservoir. The reservoir was discretized and simplified into a series of connected units. Considering the connected unit as the object, the material balance equation can be established and the pressure can be calculated. Simultaneously, the shock wave theory is introduced to track the saturation front to obtain dynamic data, such as the pressure and production of the injection-production well, and to realize the rapid simulation and prediction of oil and water well production. This method is the first to achieve the prediction and optimization of production for water-driven reservoirs using actual dynamic data. In this method, the model is rectified using a historical fitting and optimization algorithm, and the connection transmissibility and interwell volume between wells are obtained by inversion. The connectivity was identified to quantitatively reveal the dominant connectivity direction, water injection splitting efficiency, and water intrusion. The interwell connectivity method only considers two characteristic parameters, the connection transmissibility and interwell volume, which do not involve rigorous geological modeling. It can quickly and accurately reflect the state of a real reservoir and significantly shorten the simulation time. Thus, it is suitable for the real-time production prediction of reservoirs.
There is little research on the optimization of the plugging agent dosage in salt profile control. Simultaneously, considering that the connectivity model has the advantages of fast simulation speed and real-time production prediction of reservoirs, this study establishes the function of the plugging agent dosage on the connection transmissibility and interwell volume based on the connectivity model. Additionally, a water flooding simulation model was established after high-temperature salting-out profile control, and a simulation of the reservoir production performance after high-temperature salting-out profile control was achieved. Based on the optimization theory, we established an optimization model of the plugging agent dosage for high-temperature salting-out profile control. The gradient-free random disturbance algorithm was used to obtain the optimal plugging agent dosage to provide the basis for the on-site construction and operation of high-temperature salting-out profile control.
2 Establishing the Connection Parameters after High Temperature Salting-Out Profile Control
According to Jiang et al. [23], assuming that the plugging agent evenly enters the capillary pores and all salts precipitate during the salting-out process, the salt volume can be calculated by
where n denotes the number of PVs;
To adapt to actual reservoirs, in this study, A is assumed to be the seepage cross-section between the oil and water wells, and L is assumed to be the well spacing between the oil and water wells.
The volume equation of the salting-out zone is
where d is the inner diameter of the sand-filled pipe (cm) and Lc is the length of the salting-out zone (cm).
Using the empirical formula of the experimental data, the relationship between the injection amount of the plugging agent and the correction length of the salting-out zone is obtained as follows:
Salt precipitation changes the reservoir porosity. Based on Cui et al.’s mathematical model of salting-out for reservoir water evaporation [21], the relationship between the reservoir porosity and precipitated salt accumulation was obtained by considering the influence of the precipitated salt on the reservoir porosity.
where
The change in reservoir porosity affects the permeability, and the relationship between the porosity and permeability can be described by the Kozeny-Carman equation [25,26]:
where K is the reservoir permeability (um2); K0 is the initial permeability of the reservoir (um2); and b is the relational index (integer). The optimal value of b in the Kozeny-Carman equation during the salting-out process was estimated to be 4 using error analysis [21].
According to the above five equations, we can deduce the relationship between the amount of plugging agent n, reservoir permeability K, and reservoir porosity
where K is the reservoir permeability (um2); K0 is the initial permeability of the reservoir (um2);
According to a study by Zhao et al. [24], the interwell connectivity model considers well points as the basic unit and simplifies the complex geological description between the wells into two important characteristic parameters: connection transmissibility Tij and interwell volume Vij. The former represents the seepage velocity under a unit pressure difference, which can better reflect the average seepage capacity and the dominant conduction direction between the wells. The latter represents the material basis of the connected unit, which reflects the control range and volume of water flooding between the wells.
If wells i and j are production and water injection wells, respectively, then the equation for the initial interwell volume is
The calculation formula of the connection transmissibility at the initial time is
where
Combined with the previous derivation, Eq. (7) is introduced into Eq. (8), and the calculation formula for the interwell volume at the initial time after injecting the plugging agent is
Combining Eqs. (6) and (9), the calculation formula for the connection transmissibility at the initial time after injecting the plugging agent is as follows:
where
Eqs. (10) and (11) reflect the relationship of the blocking dose
Zhao et al. [27] used the split coefficient to calculate the liquid flow ratio of other wells around an injection well.
where t represents the time steps. Nj is the number of nodes connected to node j, and the pressure is lower than that at node j.
The plugging agent of high-temperature salting-out profile control is carried by the injection fluid of the well into the channel; therefore, the split coefficient can be used to calculate the distribution ratio of the injection plugging dose to the surrounding well. Assuming that n PV plugging agents are injected into injection well j, the calculation formula of plugging dose
The initial connection transmissibility and interwell volume between the injection and production wells after the injection of the plugging agent can be calculated using the above method. Combined with the INSIM model, we can derive the reservoir production simulation model after the injection of the plugging agent, which lays the foundation for the subsequent optimization of the plugging agent dosage. The establishment of the yield prediction model after plugging adjustment and the optimization of the plugging agent dosage are described as follows.
3 Study on the Optimization Method of the Plugging Agent Dosage
Based on Zhao et. al.’s research [24], the interwell volume of well i was considered as the object, and the material balance equation after profile control was established as follows:
where
where
The above equation is rewritten by the implicit pressure explicit saturation (IMPES) method to obtain its difference form. The saturation tracking calculation can be used to solve the equation. The specific process is obtained from Zhao et al. [24], which is not described here.
The INSIM model can be used to predict the production after profile control. To optimize the production efficiency of oilfields, the objective function of the economic net present value (NPV) is introduced. The formula is as follows:
where
Considering the actual production, the operation of a single well has certain limitations, such as the upper and lower boundaries of the injection amount of the plugging agent in a single well and those of the liquid production in a production well. Therefore, it is necessary to set corresponding constraints for the control variables according to the actual situation.
To solve the optimization model, this study selects a gradient-free stochastic perturbation algorithm. The gradient-free stochastic perturbation algorithm is also known as the simultaneous perturbation stochastic approximation (SPSA) algorithm. This method is similar to the finite-difference method, which was first proposed by Spall in 1992 [28]. Wang et al. [29] first introduced the SPSA algorithm for the optimization of reservoir production in 2007, and Bangerth et al. [30] applied it for well location optimization. The SPSA algorithm obtains the search direction by synchronous perturbation of the control variables, which is always uphill, and the expected value is the real gradient [31]. Moreover, the algorithm is easy to calculate, and each iteration step is only required to calculate the objective function without solving the gradient; therefore, it can easily be combined with our model. The specific method involves randomly changing the number of plugging agents within the constraint range by programming, and calculating the corresponding yield by using the yield model in this study to obtain the NPV value and the optimal solution after multiple iterations. The plugging agent dosage used at this time is the optimal value.
4 Demonstration of the Conceptual Model
To verify the reliability of the plugging agent dosage optimization model proposed in this study, a two-dimensional heterogeneous reservoir model with a high-permeability strip was selected for verification. The model is a one-injection-four-production simulation model. The number of model grids was 50 × 50 × 1; the length, width, and height of the grid were 10 m, respectively. The initial water saturation, average porosity, crude oil viscosity, and initial reservoir pressure were 0.2, 0.2, 100 mPa·s, 25 MPa, respectively. The permeability range of the high-permeability strip was 200–750 mD, and that of the low-permeability region was 2–10 mD. The permeability field of the model is shown in Fig. 1, where I1 is a water injection well, and P1, P2, P3, and P4 are production wells. Hot water flooding was employed according to the situation of the well group. The commercial reservoir simulation software CMG was used for the five-year simulation, and the output obtained by the simulation was considered as the real output.
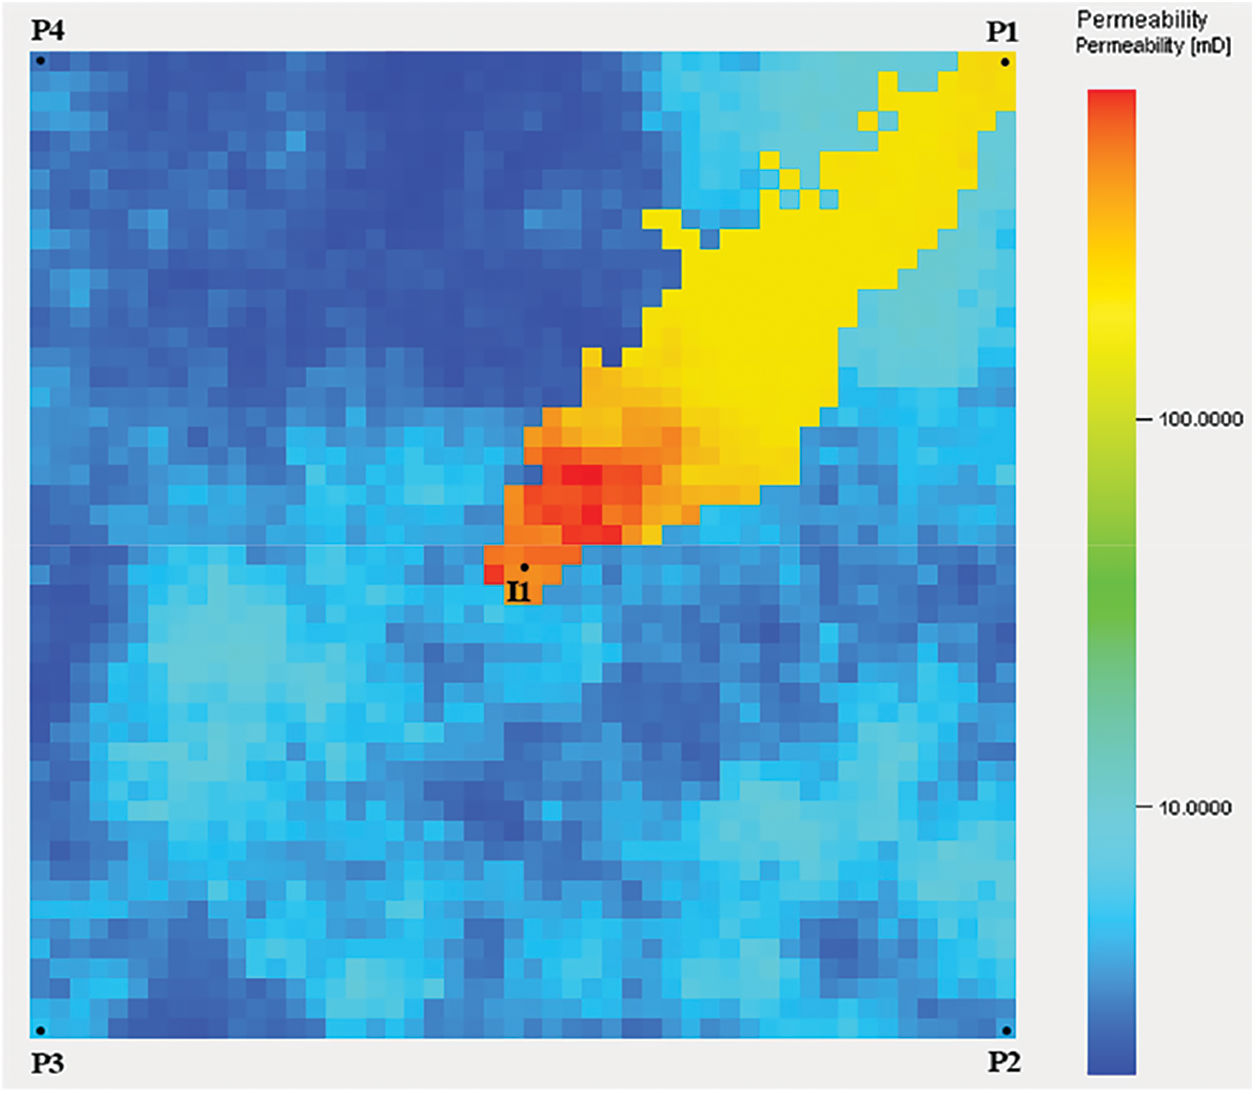
Figure 1: Permeability field diagram
Based on the physical property data of the above grid model, a connectivity model was established, and the production was historically simulated. The fitting results for the cumulative oil production and water cut of the reservoir are shown in Fig. 2. Notably, the fitting degree is considerably high, indicating that the INSIM model is consistent with the grid model. Fig. 3 shows the inversion results of the connection transmissibility of the reservoir. Notably, the connection transmissibility between wells I1 and P1 is higher than that of the surrounding wells. This shows that there is a high-permeability strip between wells I1 and P1, which is consistent with the grid model. This indicates the reliability of the connectivity model.
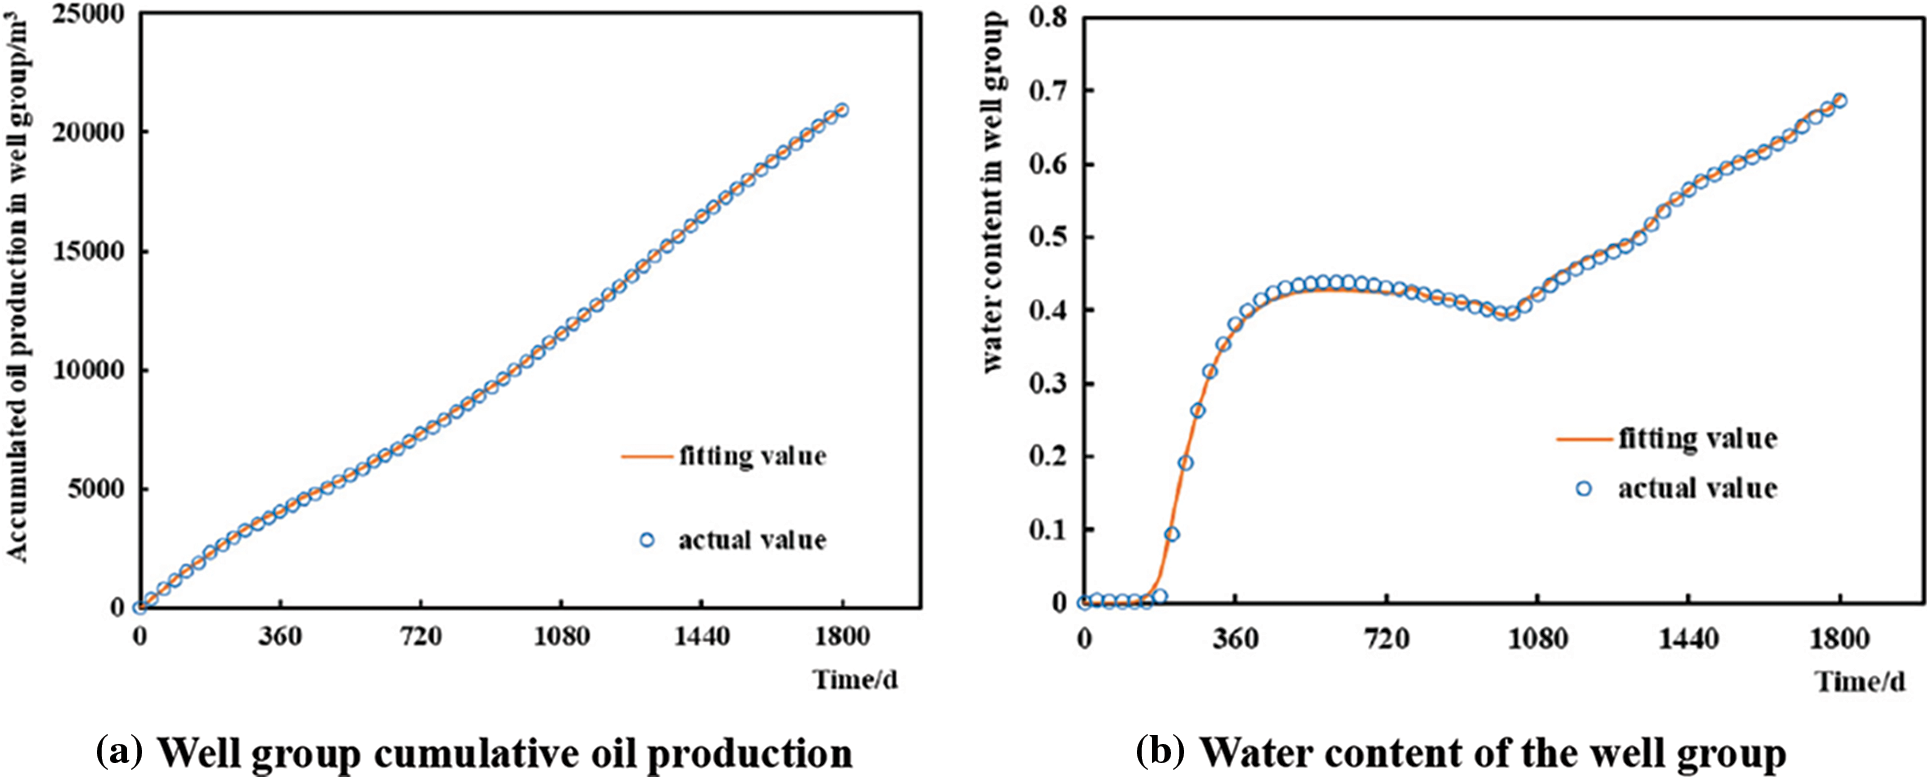
Figure 2: Fitting result
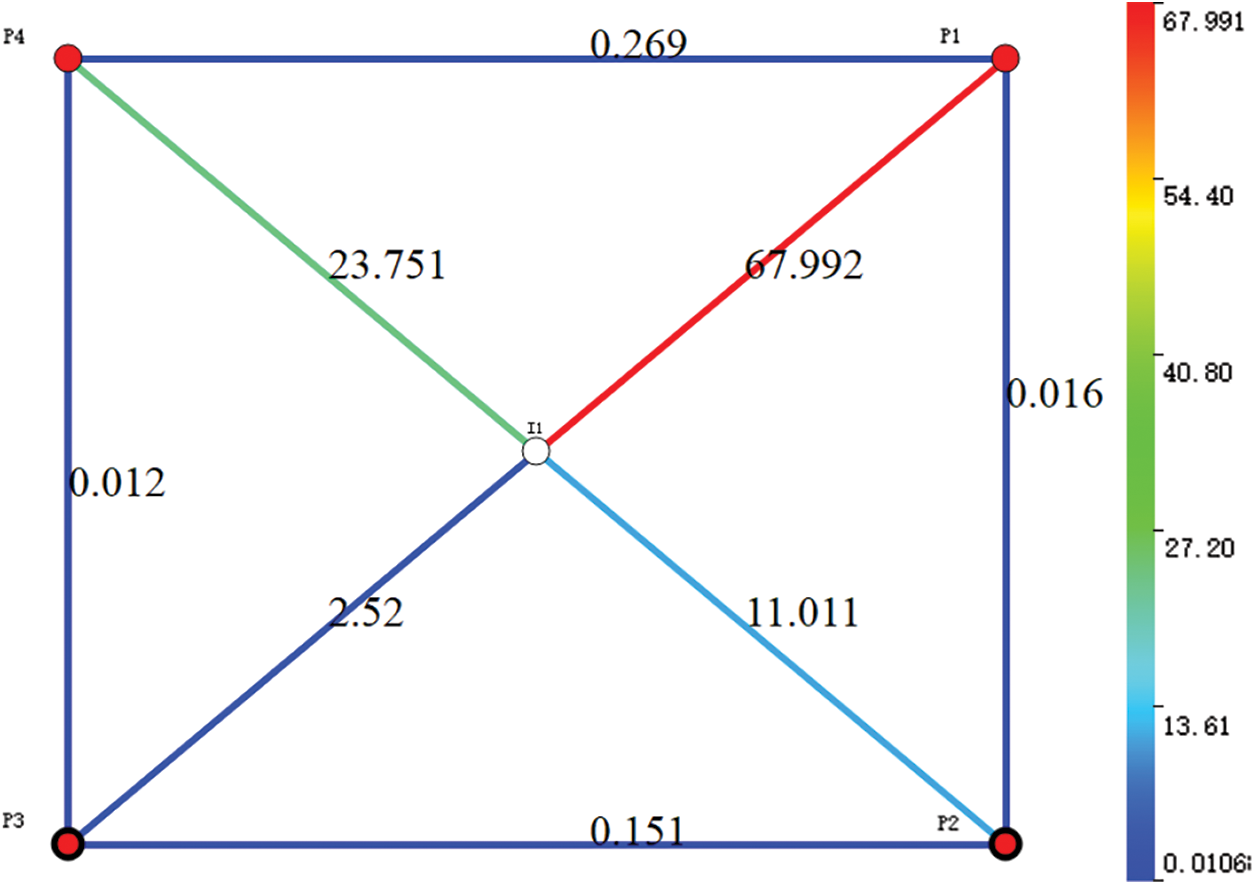
Figure 3: Connection transmissibility
Fig. 4 shows the oil production and water cut of the P1 production well. Notably, water appears in well P1 after half a year of production, and the water cut continues to increase. The water cut reached 80% in two years and the production continued to decline. Combined with the geological conditions, we concluded that the well undergoes serious water channeling. The reservoir temperature is high; therefore, it is necessary to conduct high-temperature salting-out profile control for the well group.
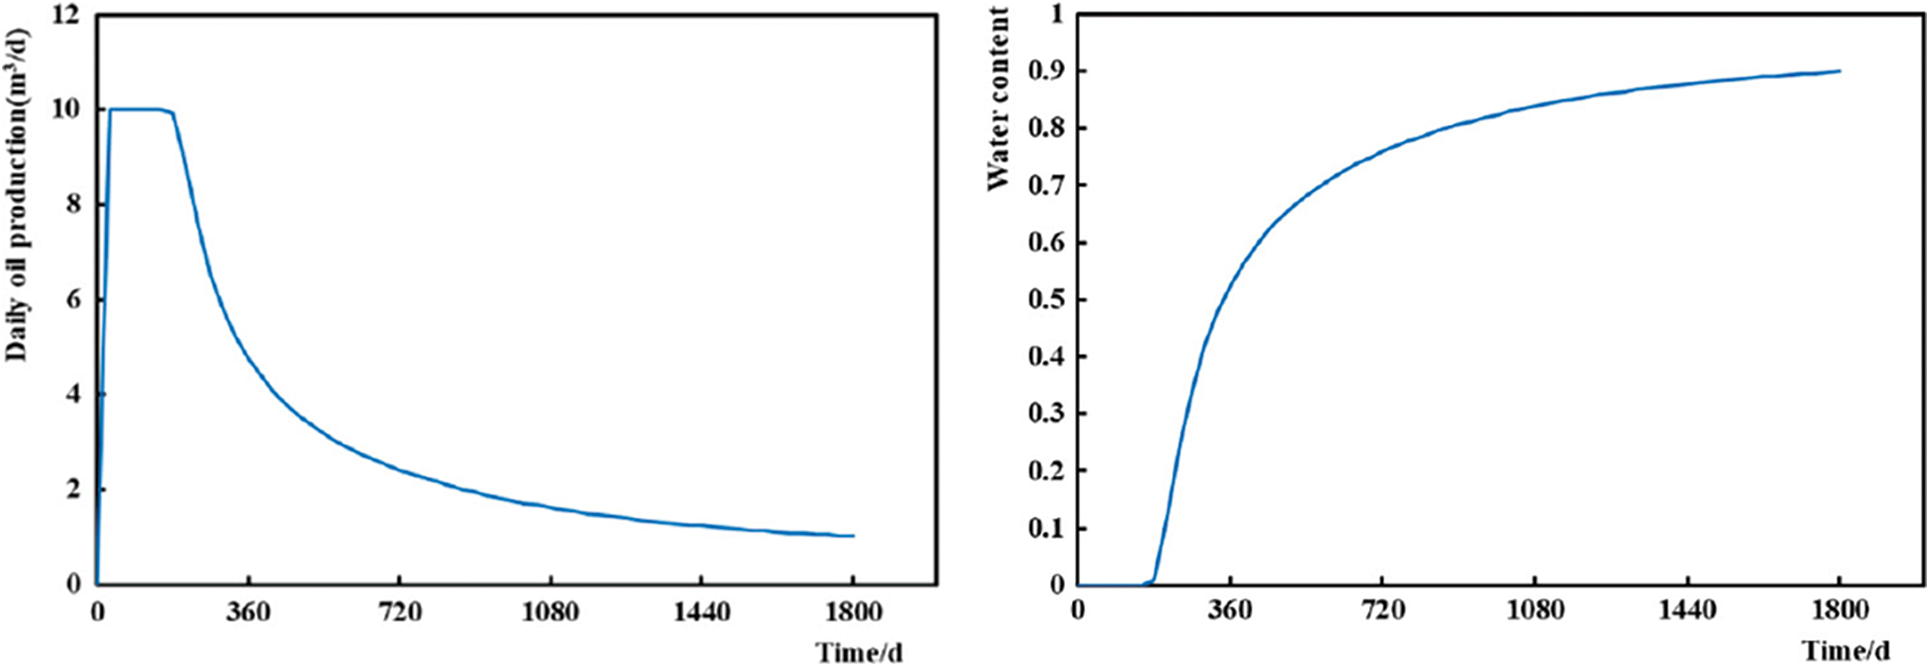
Figure 4: Daily oil production and water cut of well P1
Subsequently, it is necessary to determine the number of injected plugging agents. Using this method to optimize the plugging agent can help determine the amount of plugging agent required to maximize the economic benefits of the well group. The initial injection volume of the plugging agent was set to 1000 m3, the boundary under random disturbance was set to 500 m3, and the upper boundary was set to 4000 m3. The crude oil price in the NPV parameter was set to 434.504 USD/barrel, the water injection cost was set to 0.07815 USD/m3, and the plugging agent price was set to 78.1482 USD/m3. The optimization began on the 1801st day, and the optimization simulation lasted for one year. After 100 iterations, the plugging agent dosage to obtain the maximum economic benefit was 891.12 m3. Fig. 5 compares the connection transmissibility before and after the profile control. This figure shows that the connection transmissibility of the original high-permeability area decreased, along with the reservoir heterogeneity.
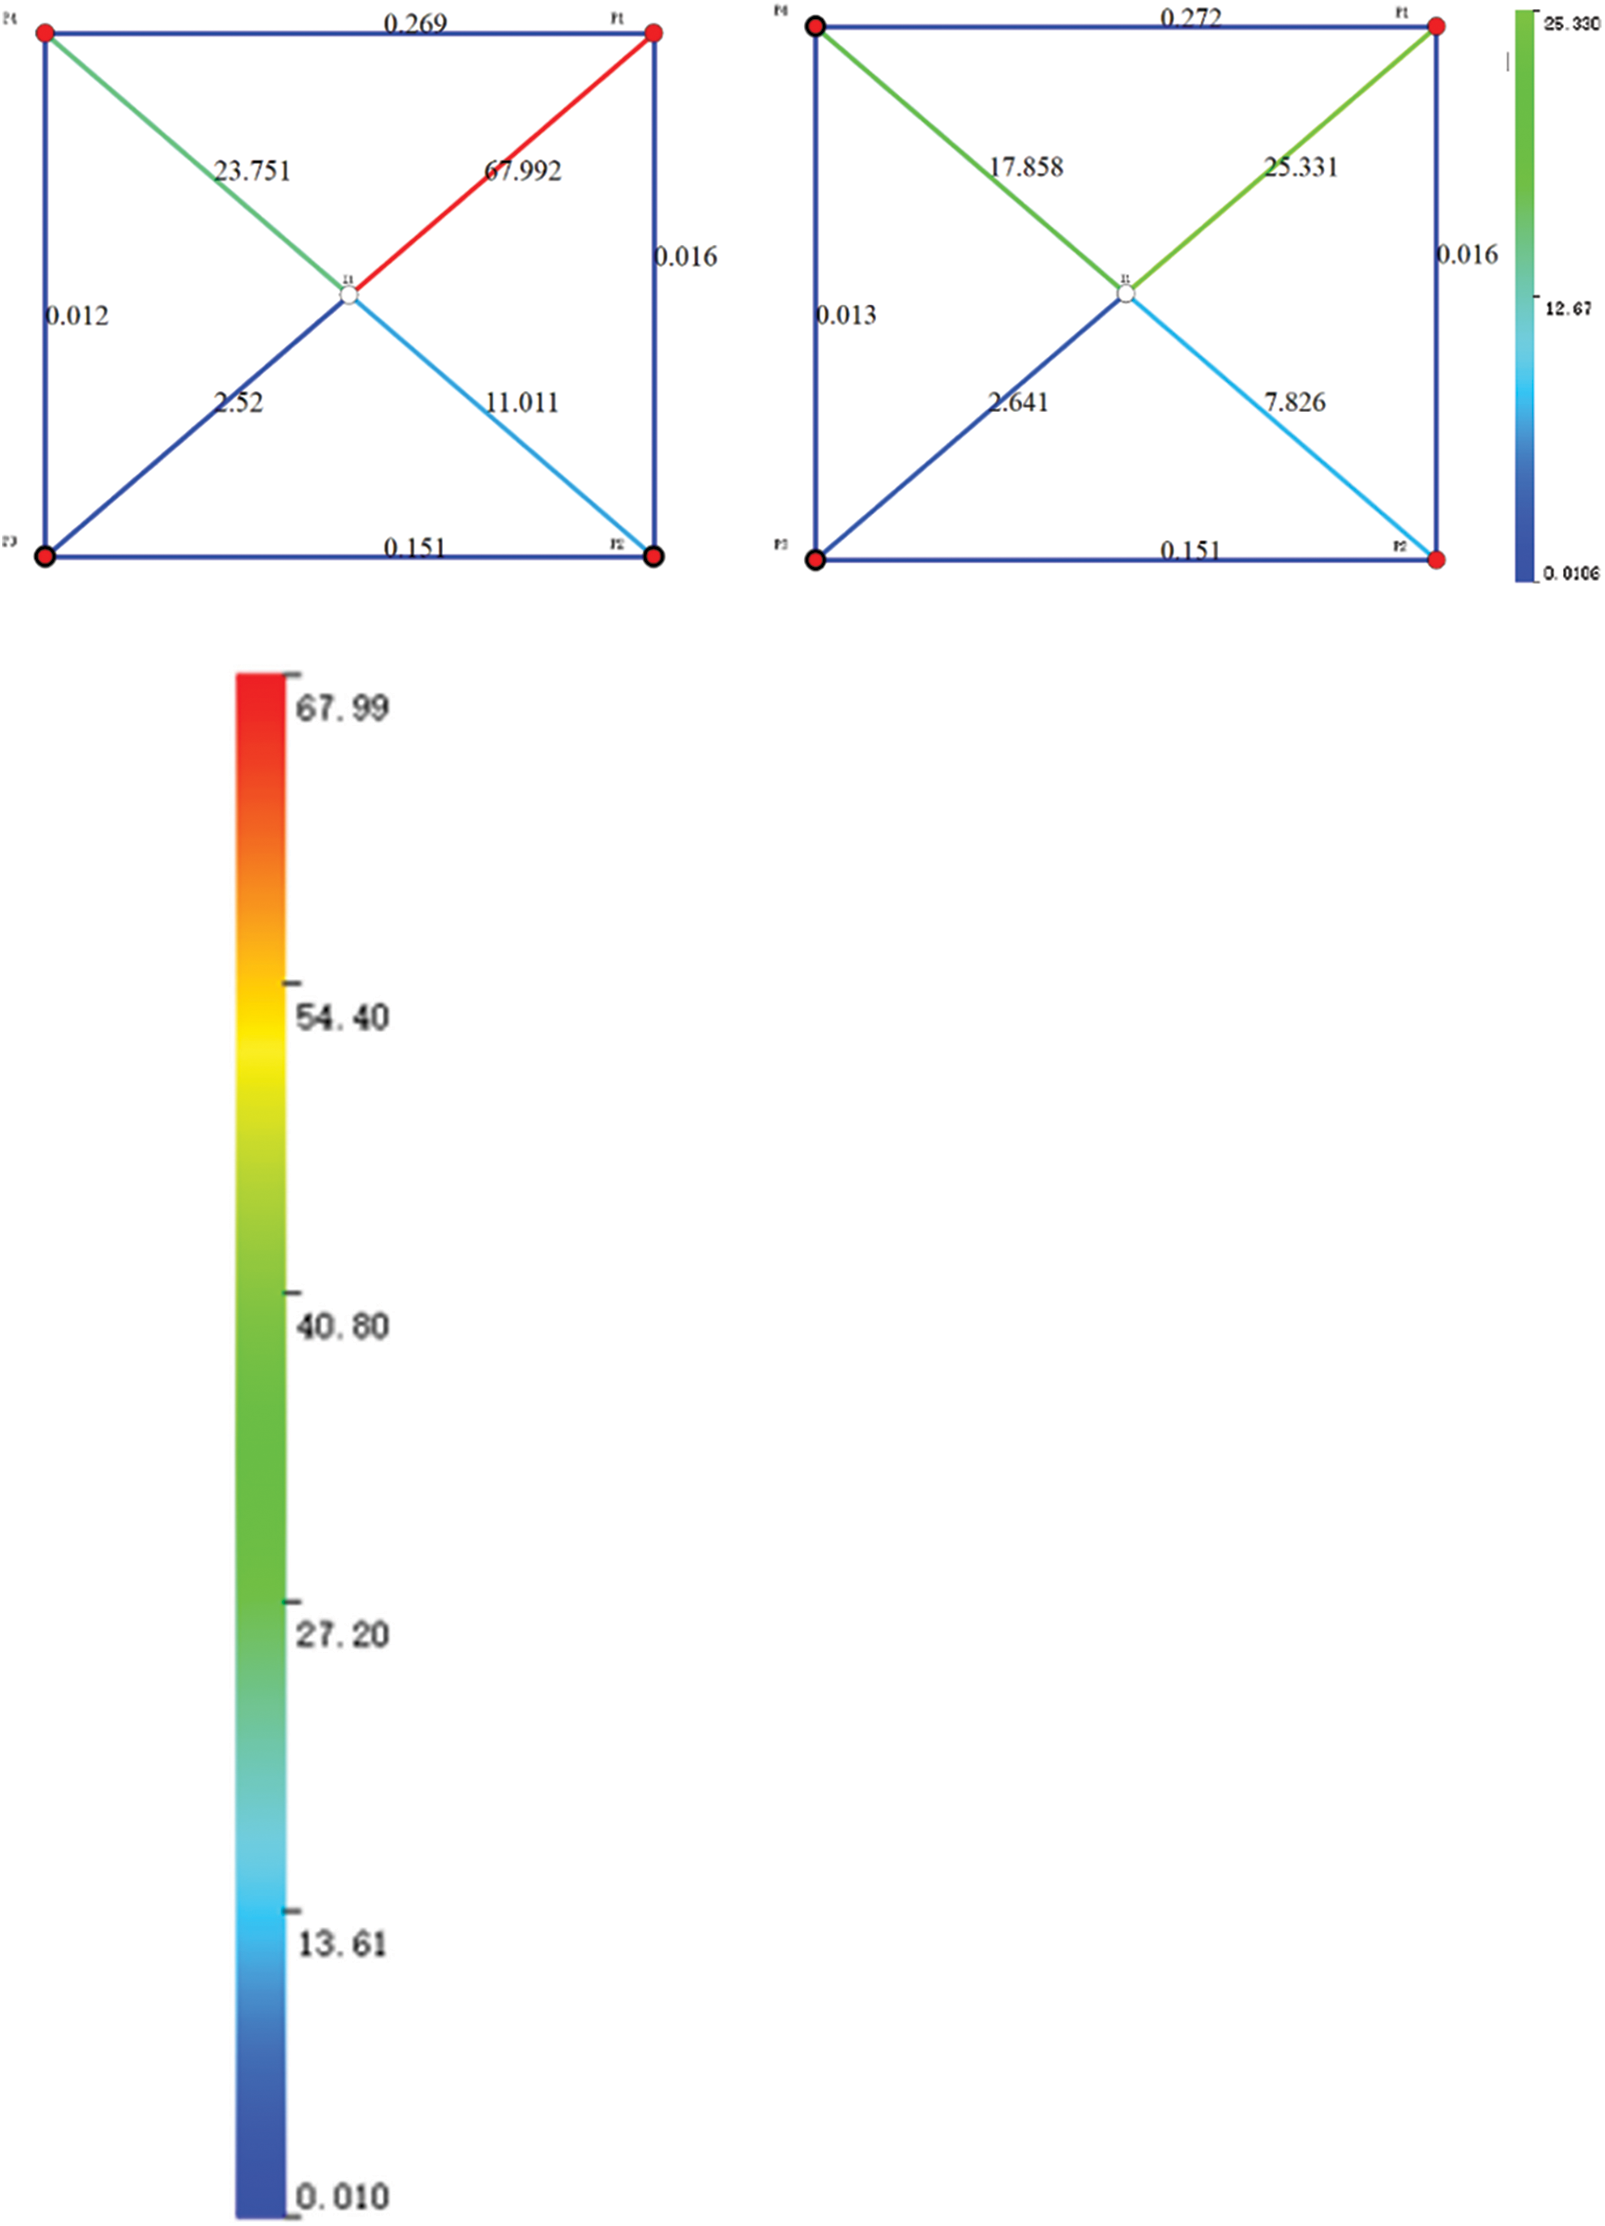
Figure 5: Connection transmissibility before and after the profile control
The simulated yield of the optimized plugging agent dosage (891.12 m3) was compared with that of the original plugging adjustment scheme (plugging agent dosage of 1000 m3). Fig. 6 shows a comparison of the cumulative oil production of the well group before and after optimizing the plugging agent dosage. This figure shows that the cumulative oil production rate of the two plugging adjustment schemes improved, but that of the plugging adjustment scheme optimized by this method is more obvious. The cumulative oil production in one year in the original scheme was 5813 m3, and that in the optimized scheme increased to 6421 m3 (an increase of 10.5%). Fig. 7 shows the daily oil production of well P1 with water channeling. This figure shows that compared with that in the original scheme, the average daily oil production of the optimized plugging scheme increased more, from 2.1 to 3.0 m3/d (an increase of 44.5%). In summary, the optimization effect of this model is fairly evident.
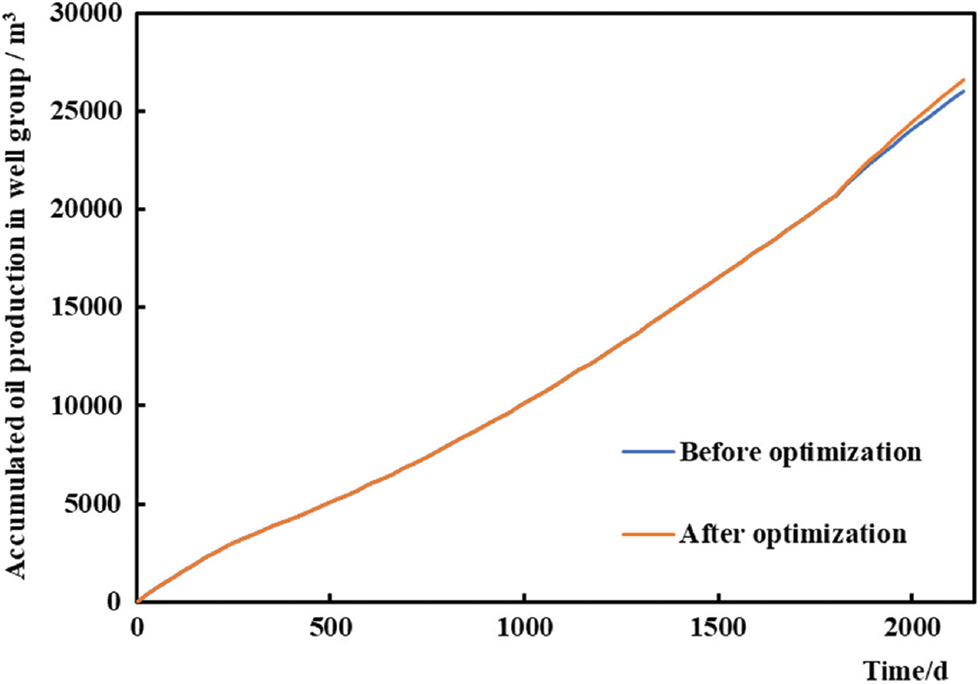
Figure 6: Comparison of the cumulative oil production before and after optimization
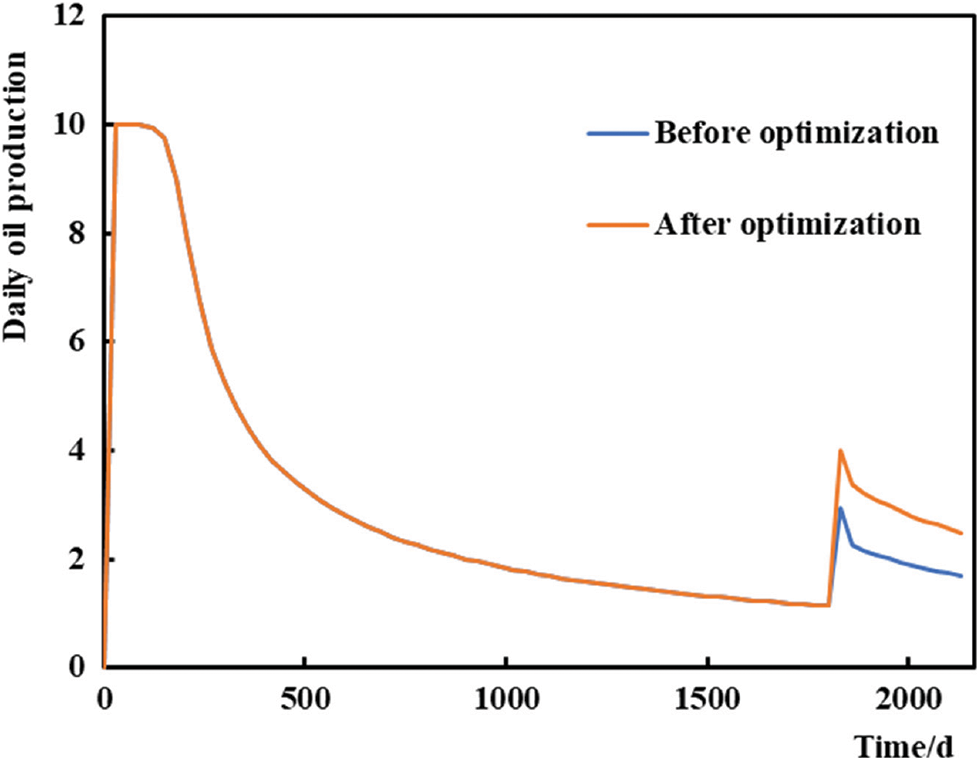
Figure 7: Comparison of the daily oil production in well P1
This model was applied to a practical reservoir to further verify its reliability. The burial depth of the reservoir was 808–1298 m; the original reservoir temperature was 47°C; the initial average pressure of the reservoir was 7 MPa; the average porosity was 30%; the permeability was approximately 4000 mD; and the viscosity of crude oil is 400 mPa·s. The reservoir has one injection well, B1W, and seven production wells, namely, B2H, B3H, B4H, B5H, B6H, B7H, and B8Z. Fig. 8 shows a well location map of the reservoir.
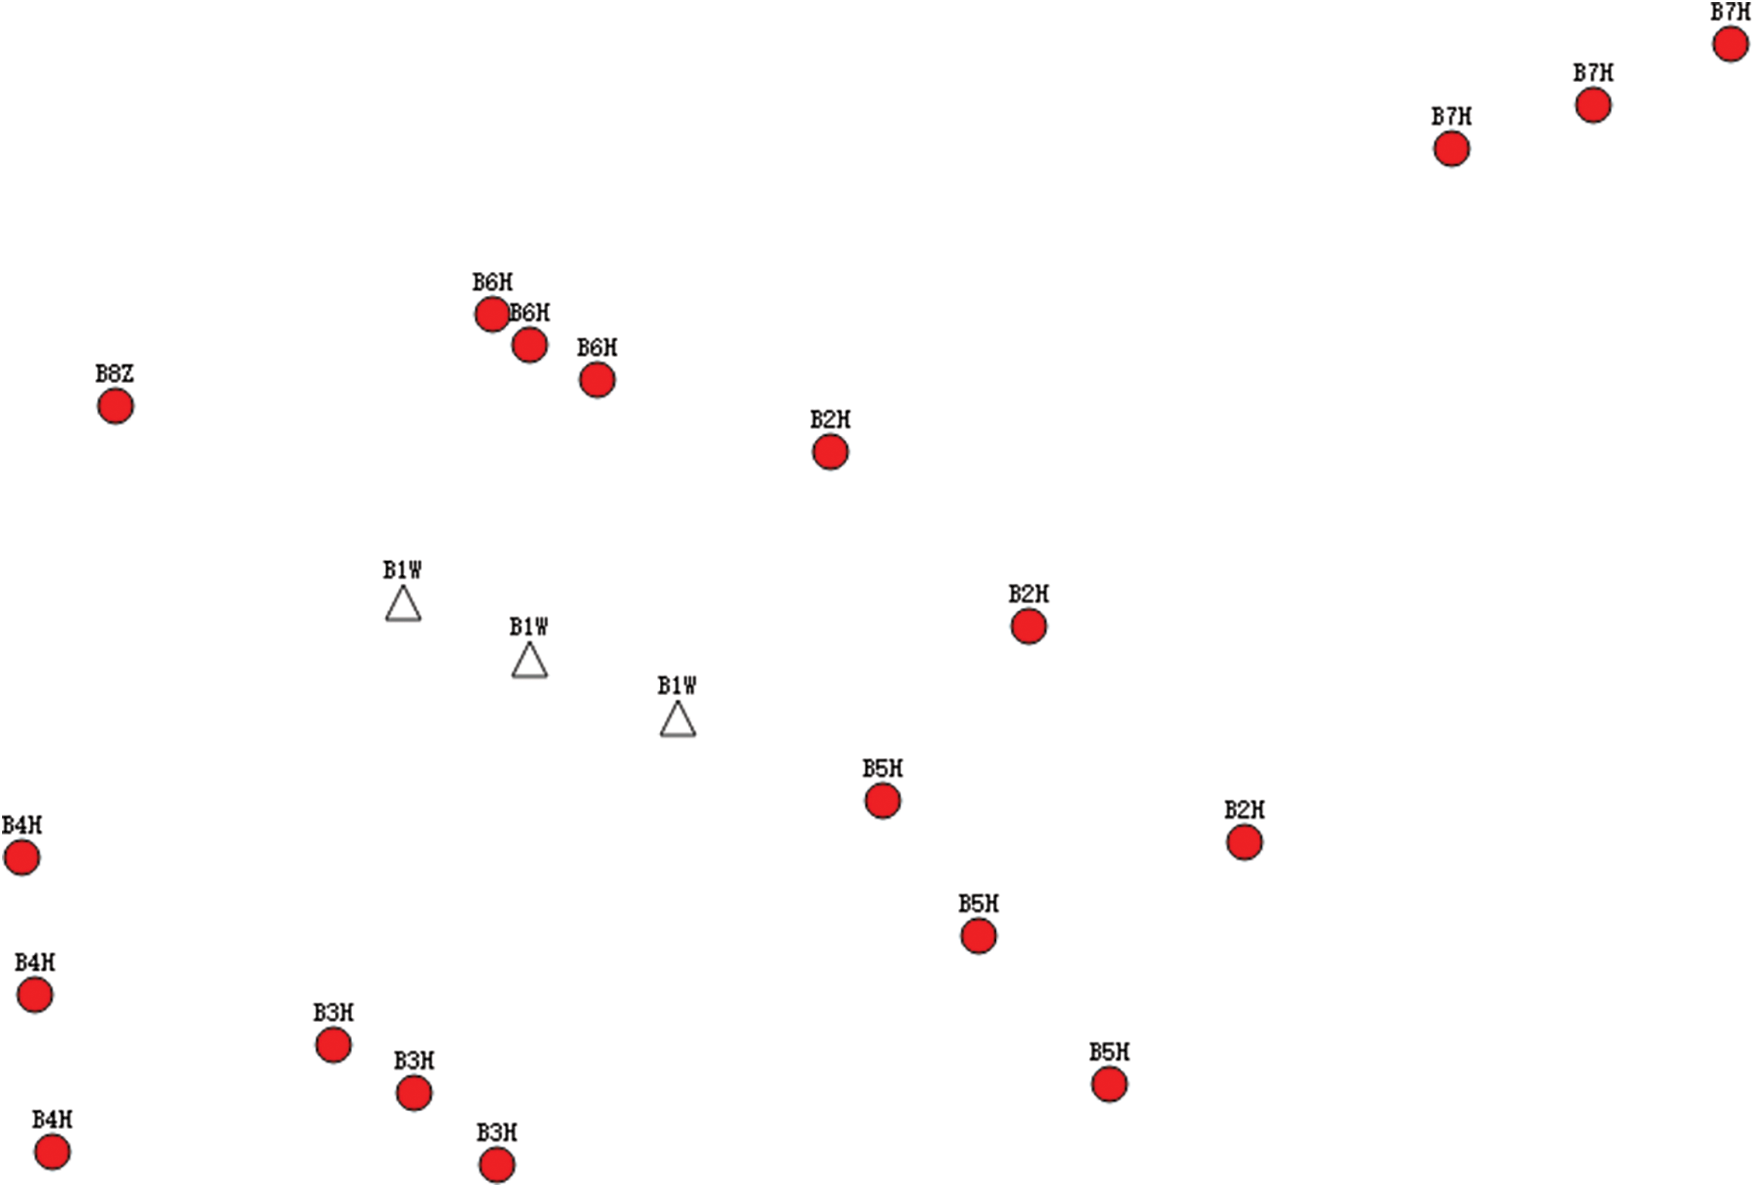
Figure 8: Well location diagram
The reservoir is a typical heavy oil reservoir that is mainly exploited through thermal recovery and salting out. The reservoir production began in January 2020 and continued for 390 days. The reservoir was exploited using hot-water flooding. The water content of the reservoir increased in the last three months, and the current water content was 55%. The production data showed that the water content of B5H well was high and the production was low. Notably, there is a dominant channel for water channeling in this well. Historically, high-temperature salting-out profile control has been conducted in reservoirs. The amount of the plugging agent was 2000 m3, but the plugging effect was not significant. Thus, it is necessary to optimize the amount of the plugging agent.
A connectivity model was established according to geological and production data and historical matching was conducted. Fig. 9 shows the fitting results of the cumulative oil production and water content in the reservoir, and Fig. 10 shows the fitting results of the daily oil production and water content of the single well B5H.
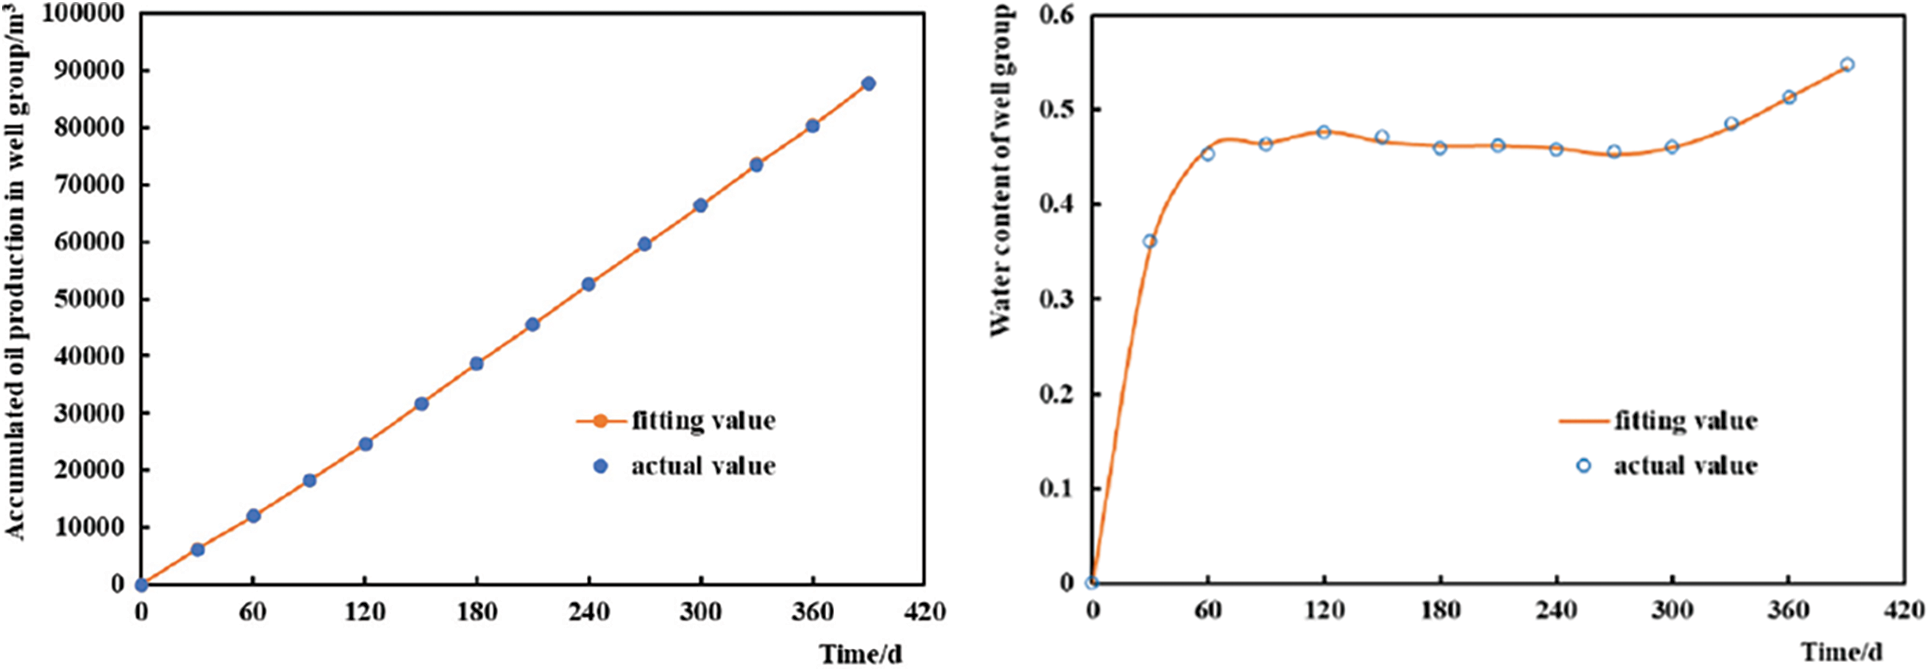
Figure 9: Reservoir fitting results
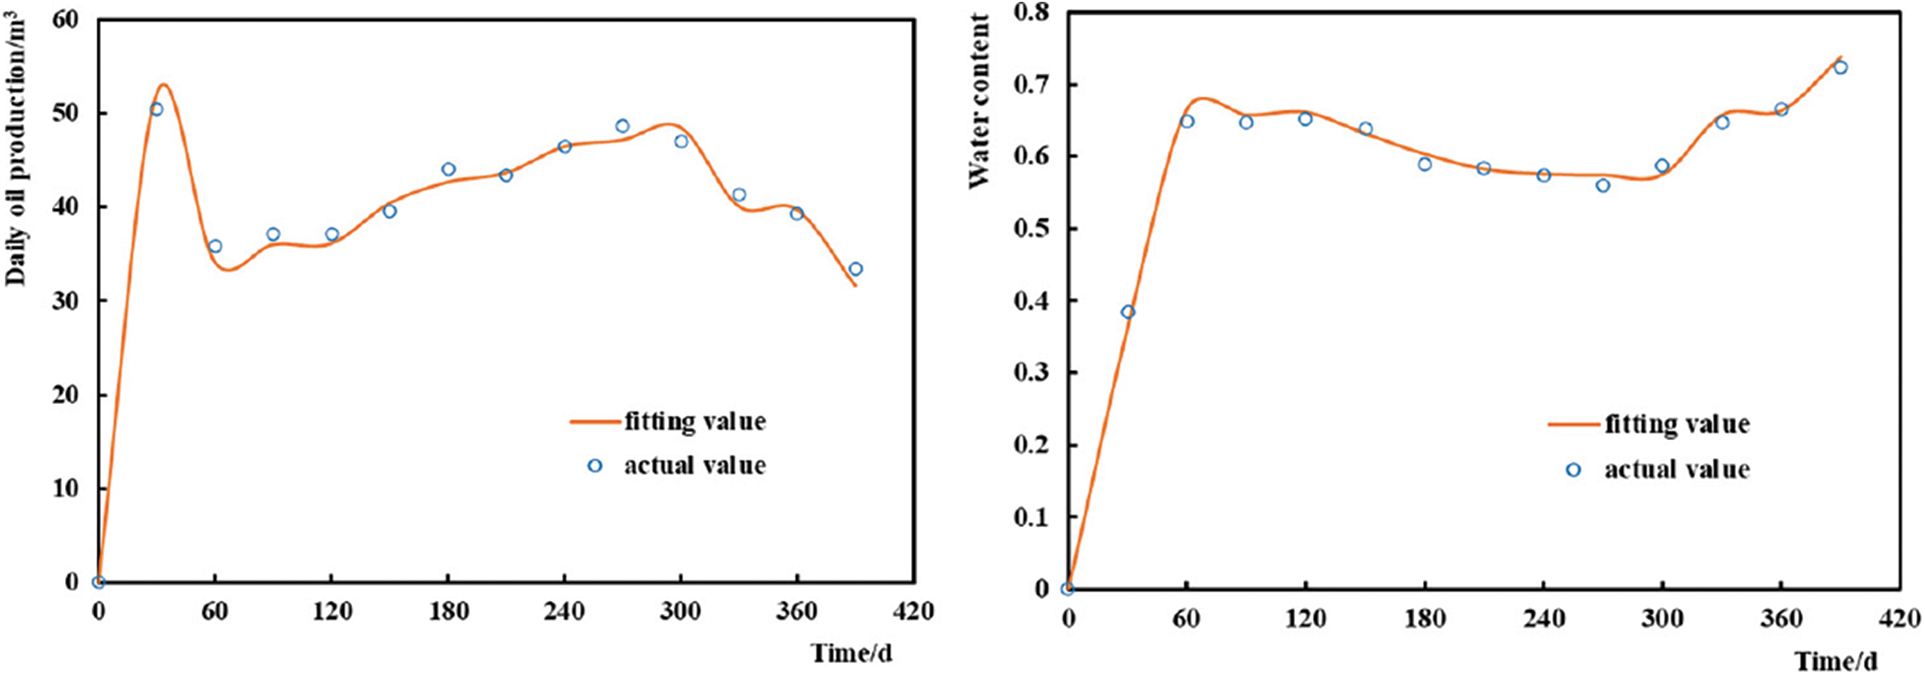
Figure 10: Well B5H fitting results
Fig. 11 shows the connection transmissibility map of the reservoir after fitting. Notably, the connection transmissibility between wells B1W and B5H is significantly higher than that between other wells, and the inversion results are consistent with the field measurements.
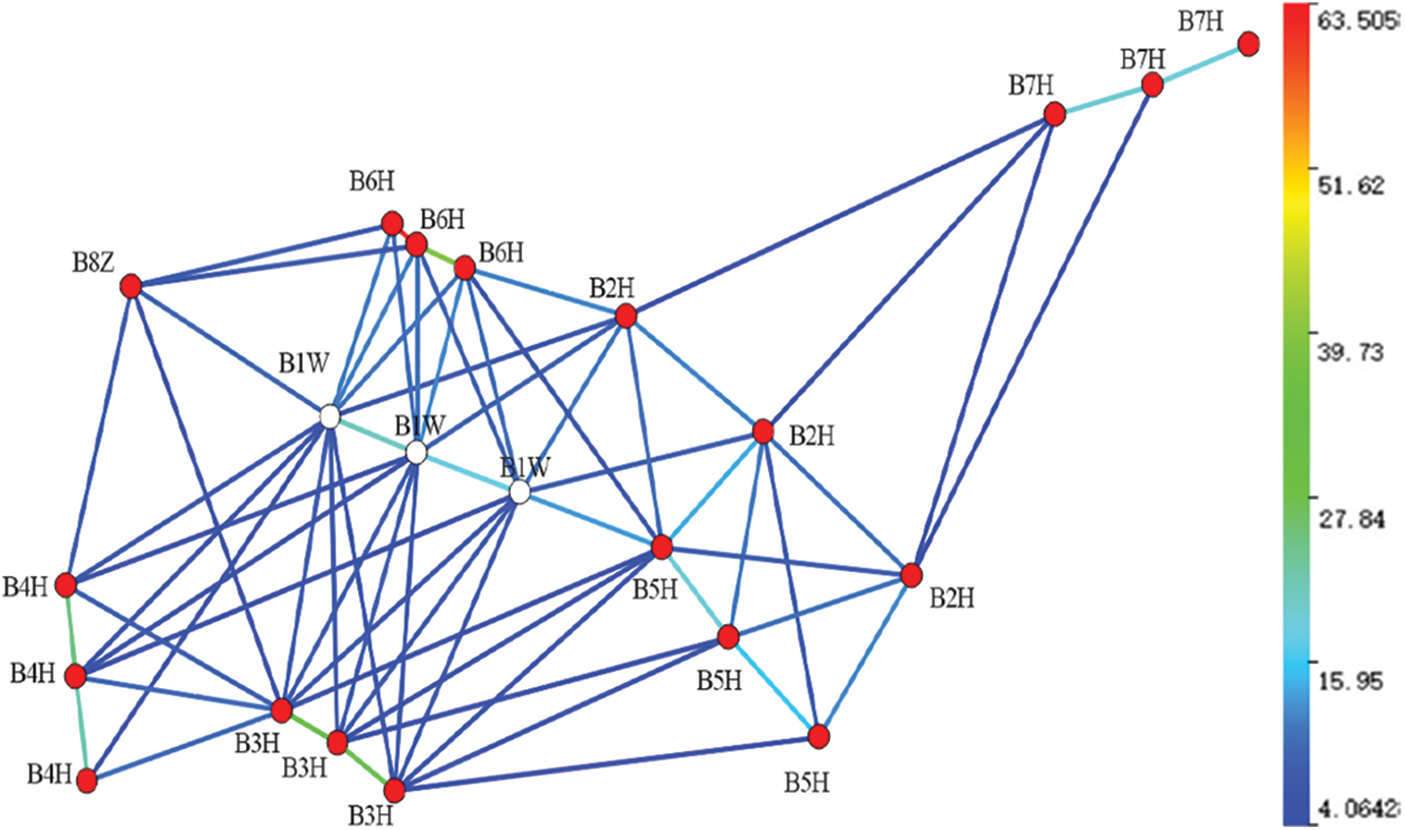
Figure 11: Connection transmissibility
The optimal plugging agent dosage was determined using the method described in this study. The initial injection amount of the plugging agent in the program was set to 2000 m3, the lower boundary of the plugging agent dosage was set to 500 m3, and the upper boundary was set to 8000 m3. The crude oil price in the NPV parameter was 434.504 USD/barrel; the water injection cost was set to 0.07815 USD/m3; and the plugging agent price was set to 78.1482 USD/m3. The optimization starts after 391 days with an interval of 30 days to optimize the simulation for 9 months. Finally, the plugging agent dosage to obtain the maximum economic benefit was 3426.39 m3.
The simulated production results of the optimized plugging agent dosage (3426.39 m3) were compared with those of the original plugging scheme (plugging agent dosage of 2000 m3). Fig. 12 shows a comparison of the simulated cumulative oil production values of the reservoir before and after the plugging agent dosage was optimized. Simultaneously, the actual cumulative oil production value of the reservoir after plugging adjustment is obtained. Fig. 12 also shows that the actual cumulative oil production in the field is basically consistent with the simulation results. Compared with that of the original scheme, the cumulative oil production of the optimized plugging adjustment scheme increased more significantly. The simulated cumulative oil production of the original scheme for nine months was 7.78 × 10⁴ m3, and that of the optimized scheme for nine months increased to 8.55 × 10⁴ m3. The simulation results show that the cumulative oil production of the optimized scheme increased by 10.0%. Profile control was conducted according to the amount of plugging agent obtained in this optimization scheme. After nine months of production, the actual cumulative oil production was 8.37 × 10⁴ m3, showing an increase of approximately 7.6%.
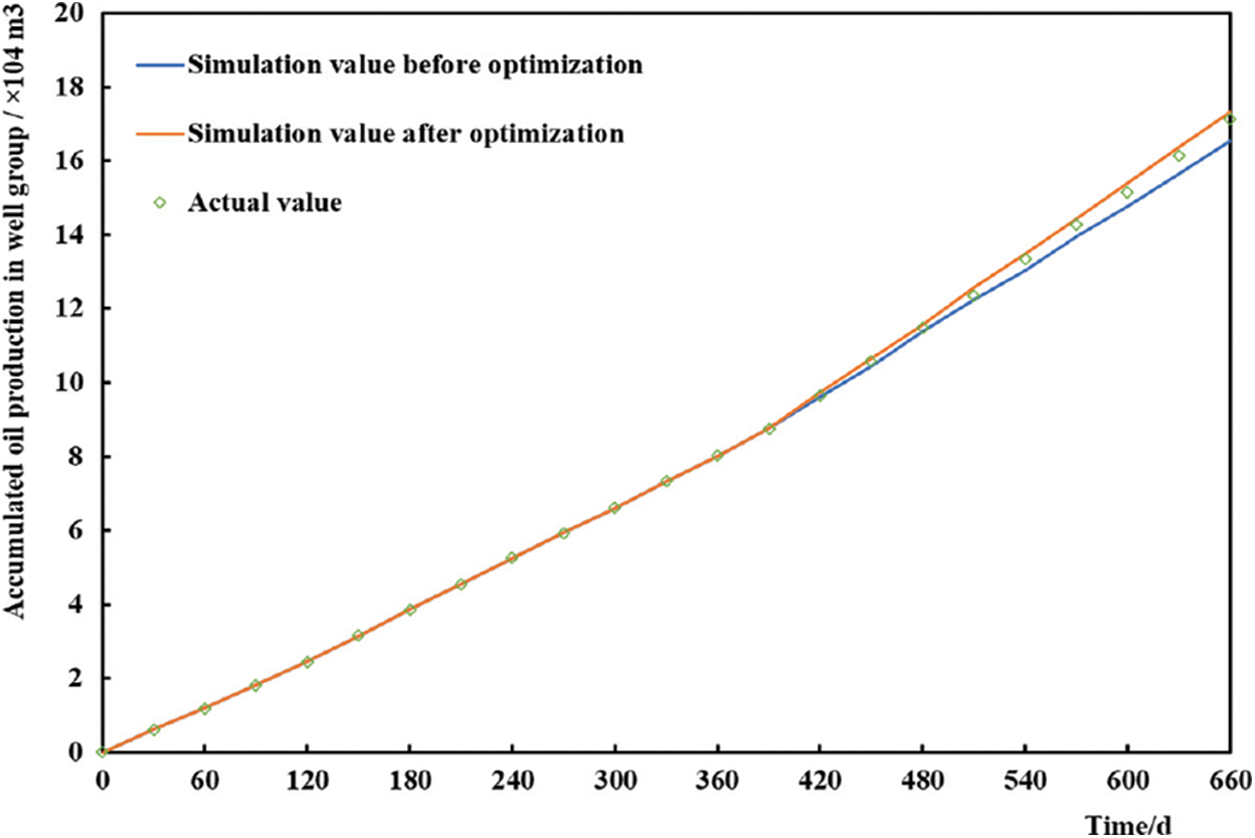
Figure 12: Comparison of the accumulative oil production
Fig. 13 shows the daily oil production change of water-channeling well B5H. Compared with that of the original scheme, the daily oil production of the optimized scheme increased more. Compared with that in the original scheme, the simulated average daily oil production increased from 34.94 to 37.66 m3/d (an increase of 7.8%). The average daily oil production of well B5H in nine months was 36.40 m3/d, which is 4.2% higher than that simulated by the original plugging scheme. The field implementation shows that the optimization model of the agent dosage for the high-temperature salting-out profile control proposed in this study has a good optimization effect and can provide a basis for field execution.
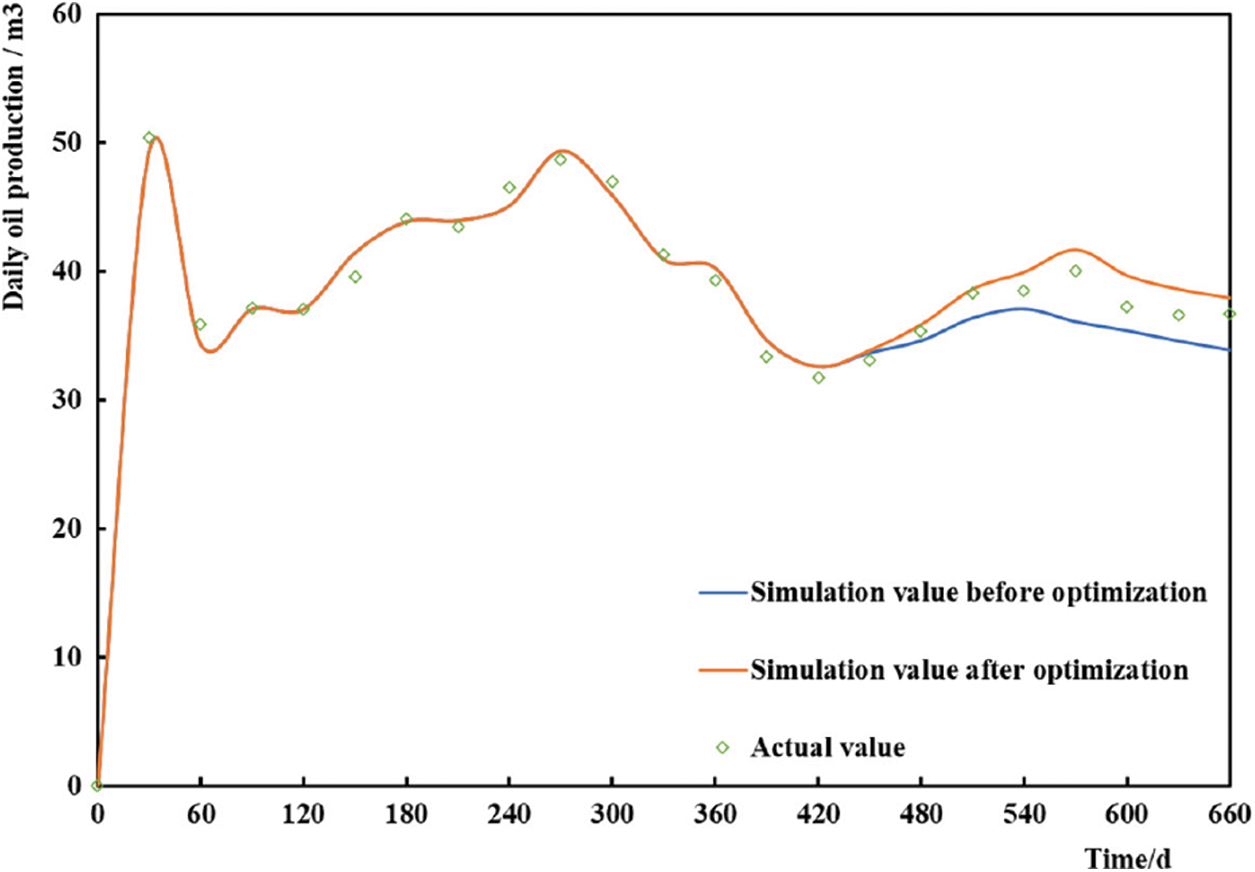
Figure 13: Comparison of the daily oil production of well B5H
(1)Models of the connection transmissibility and interwell volume after high-temperature salt profile control were established.
(2)A production prediction model was established after controlling the high-temperature salting-out profile. Based on this, we established an optimization model of the plugging agent dosage for the high-temperature salting-out profile control. Additionally, we proposed a method for determining the dosage of the plugging agent for the high-temperature salting-out profile control.
(3)The method was applied to an actual reservoir and achieved reliable results. This shows that the optimization method can determine the optimal plugging agent dosage for high-temperature salting-out profile control and provides a basis for field implementation.
Acknowledgement: Thanks to China Postdoctoral Science Foundation and Shandong Provincial Natural Science Foundation for their support of this article.
Funding Statement:This study was supported by China Postdoctoral Science Foundation (No. 2021M702304) and Shandong Provincial Natural Science Foundation Youth Fund (No. ZR2021QE260). Author Mingjing Lu has received the grant.
Conflicts of Interest:The authors declare that they have no conflicts of interest to report regarding the present study.
References
1. Liu, Z. D., Wang, H. J., Blackbourn, G., Ma, F., He, Z. J. et al. (2019). Heavy oils and oil sands: Global distribution and resource assessment. Acta Geologica Sinica-English Edition, 93(1), 199–212. DOI 10.1111/1755-6724.13778. [Google Scholar] [CrossRef]
2. Demirbas, A., Bafail, A., Nizami, A. S. (2016). Heavy oil upgrading: Unlocking the future fuel supply. Petroleum Science and Technology, 34(4), 303–308. DOI 10.1080/10916466.2015.1136949. [Google Scholar] [CrossRef]
3. Sánchez-Lemus, M. C., Schoeggl, F., Taylor, S. D., Yarranton, H. W. (2016). Physical properties of heavy oil distillation cuts. Fuel, 180, 457–472. DOI 10.1016/j.fuel.2016.04.059. [Google Scholar] [CrossRef]
4. Hinkle, A., Shin, E. J., Liberatore, M. W., Herring, A. M., Batzle, M. (2008). Correlating the chemical and physical properties of a set of heavy oils from around the world. Fuel, 87(13–14), 3065–3070. DOI 10.1016/j.fuel.2008.04.018. [Google Scholar] [CrossRef]
5. Santos, R., Loh, W., Bannwart, A. C., Trevisan, O. V. (2014). An overview of heavy oil properties and its recovery and transportation methods. Brazilian Journal of Chemical Engineering, 31(3), 571–590. DOI 10.1590/0104-6632.20140313s00001853. [Google Scholar] [CrossRef]
6. Greaser, G. R., Ortiz, J. R. (2001). New thermal recovery technology and technology transfer for successful heavy oil development. SPE International Thermal Operations and Heavy Oil Symposium, Porlamar, Margarita Island, Venezuela. DOI 10.2118/69731-MS [Google Scholar] [CrossRef]
7. Yuan, S. B., Jiang, H. Y., Wang, L., Ji, Y. C., Zhu, H. F. (2013). Research on adaptability to insitu combustion in heavy oil reservoir after steam huff and puff. Xinjiang Petroleum Geology, 34(3). [Google Scholar]
8. Qu, Y. G. (2003). Effect of heterogeneity of heavy oil reservoir on development of burned oil layer. Petroleum Geology and Recovery Efficiency, 2013(6), 65–68. [Google Scholar]
9. Zhao, X. T., Fu, M. J., Wang, Z. B., Dong, L. Y., Tang, J. Y. (2013). Research progress of heavy oil thermal recovery system. Special Oil & Gas Reservoirs, 2013, 1–4. [Google Scholar]
10. Santos, R., Loh, W., Bannwart, A. C., Trevisan, O. V. (2014). An overview of heavy oil properties and its recovery and transportation methods. Brazilian Journal of Chemical Engineering, 31(3), 571–590. DOI 10.1590/0104-6632.20140313s00001853. [Google Scholar] [CrossRef]
11. Langevin, D., Poteau, S., Hénaut, I., Argillier, J. F. (2004). Crude oil emulsion properties and their application to heavy oil transportation. Oil & Gas Science and Technology, 59(5), 511–521. DOI 10.2516/ogst:2004036. [Google Scholar] [CrossRef]
12. Kirmani, F. U. D., Raza, A., Gholami, R., Haidar, M. Z., Fareed, C. S. (2021). Analyzing the effect of steam quality and injection temperature on the performance of steam flooding. Energy Geoscience, 2(1), 83–86. DOI 10.1016/j.engeos.2020.11.002. [Google Scholar] [CrossRef]
13. Swadesi, B., Ahmad Muraji, S., Kurniawan, A., Widiyaningsih, I., Widyaningsih, R. et al. (2021). Optimizing the development strategy of combined steam flooding & cyclic steam stimulation for enhanced heavy oil recovery through reservoir proxy modeling. Journal of Petroleum Exploration and Production Technology, 11(12), 4415–4427. DOI 10.1007/s13202-021-01301-3. [Google Scholar] [CrossRef]
14. Xu, G. Y. (2014). Research and application of gas channeling oil increasing technology. Inner Mongolia Petrochemical Industry, 2014(2), 90–94. [Google Scholar]
15. Al-Saedi, H. N., Flori, R. E., Brady, P. V. (2018). Enhanced heavy oil recovery by thermal-different aqueous ionic solutions-low salinity water flooding. SPE Kingdom of Saudi Arabia Annual Technical Symposium and Exhibition, Dammam, Saudi Arabia. DOI 10.2118/192179-MS. [Google Scholar] [CrossRef]
16. Pinilla, A., Asuaje, M., Pantoja, C., Ramirez, L., Gomez, J. et al. (2021). CFD study of the water production in mature heavy oil fields with horizontal wells. PLoS One, 16(10), e0258870. DOI 10.1371/journal.pone.0258870. [Google Scholar] [CrossRef]
17. Ahmadi, M., Chen, Z. (2020). Challenges and future of chemical assisted heavy oil recovery processes. Advances in Colloid and Interface Science, 275, 102081. DOI 10.1016/j.cis.2019.102081. [Google Scholar] [CrossRef]
18. Jiang, H. Y., Zhao, L. M., Wu, T., Yuan, S. B., Wang, B. Y. et al. (2017). Influence factors of high temperature salting profile control for fire flooding on heavy crude oil reservoir. Oilfield Chemistry, 34(4), 658–662. [Google Scholar]
19. Qu, Z. Q., Wu, T., Wang, L., Jiang, H. Y., Lin, S. S. (2011). Experimental study on temporary plugging mechanism of profile control by fire flooding for heavy oil. Inner Mongulia Petrochemical Industry, 2011(22), 154–156. [Google Scholar]
20. Jiang, H. Y., Yuan, S. B., Wu, T., Pengfei, M., Li, J. et al. (2015). Profile control technology by inorganic salt out under high-temperature conditions for preventing fire flooding gas channeling. Petroleum Science and Technology, 33(10), 1157–1164. DOI 10.1080/10916466.2015.1057594. [Google Scholar] [CrossRef]
21. Cui, G. D., Ren, S. R., Zhang, L., Ren, B., Zhuang, Y. et al. (2016). Formation water evaporation induced salt precipitation and its effect on gas production in high temperature natural gas reservoirs. Petroleum Exploration and Development, 43(5), 749–757. DOI 10.1016/S1876-3804(16)30097-0. [Google Scholar] [CrossRef]
22. Jiang, H. Y., Zhao, L. M., Wu, T., Yuan, S. B., Wang, B. Y. et al. (2017). Influence factors of high temperature salting profile control for fire flooding on heavy crude oil reservoir. Oilfield Chemistry, 34(4), 658–662. [Google Scholar]
23. Jiang, H. Y., Chen, T. T., Xiao, Z. L., Li, X. F. (2021). Porosity and permeability characterization method of high temperature salting out profile control in heavy oil reservoir. Mathematics in Practice and Theory, 51(7), 82–89. [Google Scholar]
24. Zhao, H., Kang, Z., Zhang, X., Sun, H., Cao, L. et al. (2015). INSIM: A data-driven model for history matching and prediction for waterflooding monitoring and management with a field application. SPE Reservoir Simulation Symposium, Houston, Texas, USA. DOI SPE-173213-MS. [Google Scholar]
25. Nghiem, L., Sammon, P., Grabenstetter, J., Ohkuma, H. (2004). Modeling CO2 storage in aquifers with a fully-coupled geochemical EOS compositional simulator. SPE/DOE Symposium on Improved Oil Recovery, Tulsa, Oklahoma. DOI 10.2118/89474-MS. [Google Scholar] [CrossRef]
26. Izgec, O., Demiral, B., Bertin, H. J., Akin, S. (2006). Experimental and numerical modeling of direct injection of CO2 into carbonate formations. SPE Annual Technical Conference and Exhibition, San Antonio, Texas, USA. DOI 10.2118/100809-MS. [Google Scholar] [CrossRef]
27. Zhao, H., Xu, L., Guo, Z., Zhang, Q., Liu, W. et al. (2020). Flow-path tracking strategy in a data-driven interwell numerical simulation model for waterflooding history matching and performance prediction with infill wells. SPE Journal, 25(2), 1007–1025. DOI 10.2118/199361-PA. [Google Scholar] [CrossRef]
28. Spall, J. C. (1992). Multivariate stochastic approximation using a simultaneous perturbation gradient approximation. IEEE Transactions on Automatic Control, 37(3), 332–341. DOI 10.1109/9.119632. [Google Scholar] [CrossRef]
29. Wang, C., Li, G., Reynolds, A. C. (2009). Production optimization in closed-loop reservoir management. SPE Journal, 14(3), 506–523. DOI 10.2118/109805-PA. [Google Scholar] [CrossRef]
30. Bangerth, W., Klie, H., Wheeler, M. F., Stoffa, P. L., Sen, M. K. (2006). On optimization algorithms for the reservoir oil well placement problem. Computational Geosciences, 10(3), 303–319. DOI 10.1007/s10596-006-9025-7. [Google Scholar] [CrossRef]
31. Spall, J. C. (1998). Implementation of the simultaneous perturbation algorithm for stochastic optimization. IEEE Transactions on Aerospace and Electronic Systems, 34(3), 817–823. DOI 10.1109/7.705889. [Google Scholar] [CrossRef]
Cite This Article
 Copyright © 2023 The Author(s). Published by Tech Science Press.
This work is licensed under a Creative Commons Attribution 4.0 International License , which permits unrestricted use, distribution, and reproduction in any medium, provided the original work is properly cited.
 Downloads
 Citation Tools