
 Submit a Paper
 Propose a Special lssue
 Open Access
ARTICLE

Numerical Analysis of the Hydrodynamic Behavior of a Remotely Operated Vehicle in Multi-Directional Flow
1
Faculty of Mechanical Engineering and Mechanics, Ningbo University, Ningbo, 315211, China
2
School of Civil and Transportation Engineering, Ningbo University of Technology, Ningbo, 315211, China
3
Engineering Research Center of Industrial Construction in Civil Engineering of Zhejiang, Ningbo University of Technology,
Ningbo, 315211, China
* Corresponding Author: Zhongda Lyu. Email:
Fluid Dynamics & Materials Processing 2023, 19(9), 2361-2384. https://doi.org/10.32604/fdmp.2023.027470
Received 31 October 2022; Accepted 08 February 2023; Issue published 16 May 2023
 View Full Text
 Download PDF
Abstract
In recent years, Remotely Operated Vehicles (ROVs) have played an increasingly important role in the construction and monitoring of underwater pile foundations. However, due to the open frame structure of such vehicles, a gap of knowledge still exists with regard to their hydrodynamic behavior. In this study, the hydrodynamic stability of such vehicles is investigated numerically by means of a multiple reference frame method. The hydrodynamic characteristics of the ROV when it moves horizontally and upward in the vertical plane are examined. It is found that there is interference between the horizontal and vertical thrusters of the ROV. There is also interference between the propeller thrust and drag (or lift). The effect of the vertical thrusters can increase the horizontal thrust by about 5%. The horizontal thrusters create a low-pressure area below the body, which can make vertical drag experienced by the ROV significantly higher.Keywords
With the exploitation of marine resources, the construction of cross-sea bridges [1,2], offshore wind power [3], and maintenance and repair (IMR) operations [4] has started to develop towards deeper waters. Consequently, deep-water pile foundations are developing towards having larger diameters [5,6] to cope with complex marine environments. The construction of large-diameter deep-water pile foundations is a great challenge for underwater operations [7]. In the sea with high velocity currents, the safety of divers cannot be guaranteed, and underwater operations are very dangerous. Unmanned underwater vehicles (UROVs) have been increasingly employed in underwater research and operation technology has advanced. Remotely Operated Vehicles (ROVs) have their unique advantages and play an important role in offshore engineering operations [8,9].
The most crucial function of an ROV as a crucial piece of marine detection and operation equipment is to perform high-load, high-intensity, and high-precision operations in hazardous and complicated deep-sea environments [10,11]. The propulsion system of an ROV is usually designed in different directions (vector layout) for more flexible movement [12]. The ROV is normally propelled by several thrusters for each operational mode. The optimization of the thrust of the vector layout propulsion system must be resolved in order to accomplish ROV motion control with the least amount of energy consumption [13,14]. The modeling and thrust distribution method of vector layout propulsion systems have become a hot and critical topic in current research [15,16].
Currently, the ROV’s thrust distribution is predicated on the assumption that the hydrodynamic performance of its propeller is perfect and uniform environmental flow [17]. However, the construction of a bridge underwater foundation is often accompanied by a complex water flow environment. Thruster to thruster interactions cannot be disregarded since the size of the ROV restricts the spacing between thrusters. The dynamic positioning propulsion system consists of multiple thrusters with a thrust loss of more than 45% between adjacent thrusters [18]. The qualitative effects of propeller-propeller [19,20] and propeller-hull [21,22] interference have been examined, but the complexity of the propeller operating environment in an ROV calls for a different analysis. The hydrodynamics become complicated as the ROV approaches the structure [23–25]. Most bridges are built in places with high velocity currents. Traditional ROV designs, however, seldom take into account propeller thrust in high-speed flow or optimize their profile for flow resistance. Additionally, an ROV must be capable of precise hovering, fixed point surround, and other sophisticated movements in addition to the basic motions of floating up, diving down, forward, and backward to fulfill the requirements of engineering operations. In the current, the propeller thrust will be significantly reduced, and the effect of the propeller will also cause significant interference with the ROV drag. In the current, the thrust force of the propeller and the resistance of the ROV will change with the direction of the ROV’s movement. The existing research usually takes the drag and propeller thrust of the ROV as a fixed value [26], which is inconsistent with the actual situation. This will greatly affect the ROV’s underwater operation performance and stability. Therefore, the hydrodynamic force and propeller thrust of the ROV needs to be simulated accurately. In general, the hydrodynamic simulation of an ROV is more challenging than that of an AUV with a fluid shell. Since the fluid-structure coupling inside the underwater vehicle is not considered, this theoretical model is not applicable to the open-frame ROV. The ROV propulsion system is composed of multiple thrusters. If the layout of the thruster system is not optimized, the thrust loss between adjacent thrusters can exceed 45% [27]. The innovations of this work mainly lie in two aspects. The first innovation is a more accurate propeller model using the multiple reference frame (MRF) method to better simulate the interference between the propeller thrust and ROV drag. The second innovation is to simulate and analyze the resistance and propeller thrust of the ROV during horizontal movement and upward movement in horizontal water flow through horizontal direction, oblique direction, and vertical flow at different speeds. The framework of this study is organized as follows. Section 2 briefly introduces the method of analysis of the numerical model and the details of the model’s implementation of the propeller and ROV. Section 3 introduces the results of the ROV hydrodynamic simulation under horizontal, oblique, and vertical flow field. The conclusions of this work are summarized in Section 4.
Due to the influence of the outer duct of the propeller and the small gap between the propeller blade and the duct, the viscosity of the boundary layer cannot be ignored. Therefore, potential flow theory is not applicable to this problem. At present, three main methods are used for the CFD calculations [28]: Direct Numerical Simulation (DNS), Large-eddy Simulation (LES), and Reynolds-averaged Navier–Stokes (RANS). The DNS is the most accurate but requires extensive calculations. The LES method uses sub-grids to simulate the effect of small-scale vortices on large-scale vortices and to filter small-scale vortices. However, the LES method has a high requirement for meshing, which is difficult to achieve for complex systems. The RANS, the most widely used method, requires less computation. Considering the complexity of the model in this paper, the simulation method selected is the RANS method.
2.1 Governing Equations and Turbulence Model
Turbulence is a complex unsteady random flow whose motion satisfies the continuity and Navier-Stokes equations. Assuming that the fluid is incompressible, the continuity equation and momentum equation of the flow field are as follows:
where ui and uj are the mean values of the velocity components, xi and xj are the three components of coordinates (i, j = 1, 2, 3), p is the mean value under pressure, ρ is fluid density, μ is the dynamic viscosity, t is time, and
where μt is the turbulent viscosity coefficient and μt = ρCμk2/ε, δij is the Kronecker delta, k is the turbulent kinetic energy.
Since Eq. (2) is unsealed, a turbulence model should be introduced. In this paper, the RNG k-ε turbulence model is selected, which includes turbulent kinetic energy k and energy diffusion ε with the expression as follows:
The equation of the turbulent kinetic energy k is
and, the equation of the energy dissipation ε is
where Gk represents the turbulent kinetic energy term generated by the laminar current velocity gradient, Gb is the turbulent kinetic energy term generated by buoyancy, YM represents the contribution of the turbulent expansion to the total dissipation rate incompressible flows, ρ is fluid density, μ is the viscosity coefficient of fluid movement, C1g, C2g, and C3g are constants.
The force state of the ROV is complicated. To determine the motion state of the underwater vehicle, the motion equation needs to be implemented for analysis. Regardless of the structural deformation of the ROV, it can be regarded as a rigid body. The 6-DOF rigid body motion equation of the ROV can be expressed as follows:
where V is the body-fixed linear and angular velocity, MRB is the parameterization of the rigid-body inertia matrix, CRB consists of the Coriolis vector term and the centripetal vector term, FI is the inertial hydrodynamic force, FD is the viscous hydrodynamic force, FR is the combined force of gravity and buoyancy, FThr is the combined thrust of the thrusters. The accelerated motion and rotation of the ROV are not considered, and the weight of the ROV after weight adjustment is equal to the buoyancy. It can be seen from the equation that the force of the robot should be equal to the viscous resistance of the ROV.
To solve this problem, the following calculation method is used in the calculation. The pressure-velocity coupling and the overall solution procedure are based on the semi-implicit method for pressure-linked equation-consistent (SIMPLEC) algorithm [29]. The momentum, turbulent kinetic energy, turbulent dissipation rate are discretized by the second-order upwind method. The iterative calculation shall be stopped until the stress of the structure is no longer changed.
2.2.1 Geometric Model of Ducted Propellers
Ducted propellers manufactured by Tianjin Haoye Co., Ltd. (China) are used for ROVs. The T2020 ducted propeller, which outer diameter is 322 mm, is used for horizontal propelling. The T1080 ducted propeller, which outer diameter is 242 mm, is employed for vertical propelling. A ducted propeller model with the same size and similar shape as the real propeller was implemented for the hydrodynamic simulation. The propeller simulation model is shown in Fig. 1.
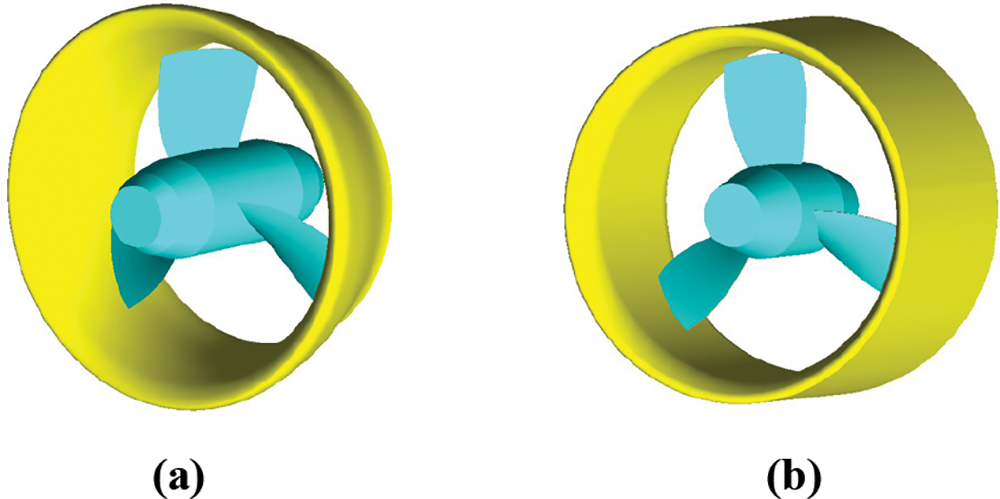
Figure 1: The simulation model of propeller (a) T2020 ducted propeller (b) T1080 ducted propeller
Based on the ROV developed by Ningbo University of Technology, a hydrodynamic model is implemented. The ROV is 1.6 m × 1.2 m × 1.1 m in size and the model is built with the same size. The geometric model is simplified by ignoring the influence of some small structural components on the hydrodynamics. The actual ROV and the ROV model are shown in Fig. 2. The coordinate system of the ROV is defined in Fig. 2c. The global coordinate system is fixed in the ground and the local system is fixed in the centroid of the ROV. The vector of the direction of the flow is in the x0-y0 plane, and the angle between the direction of current and the x0-axis is set to α.
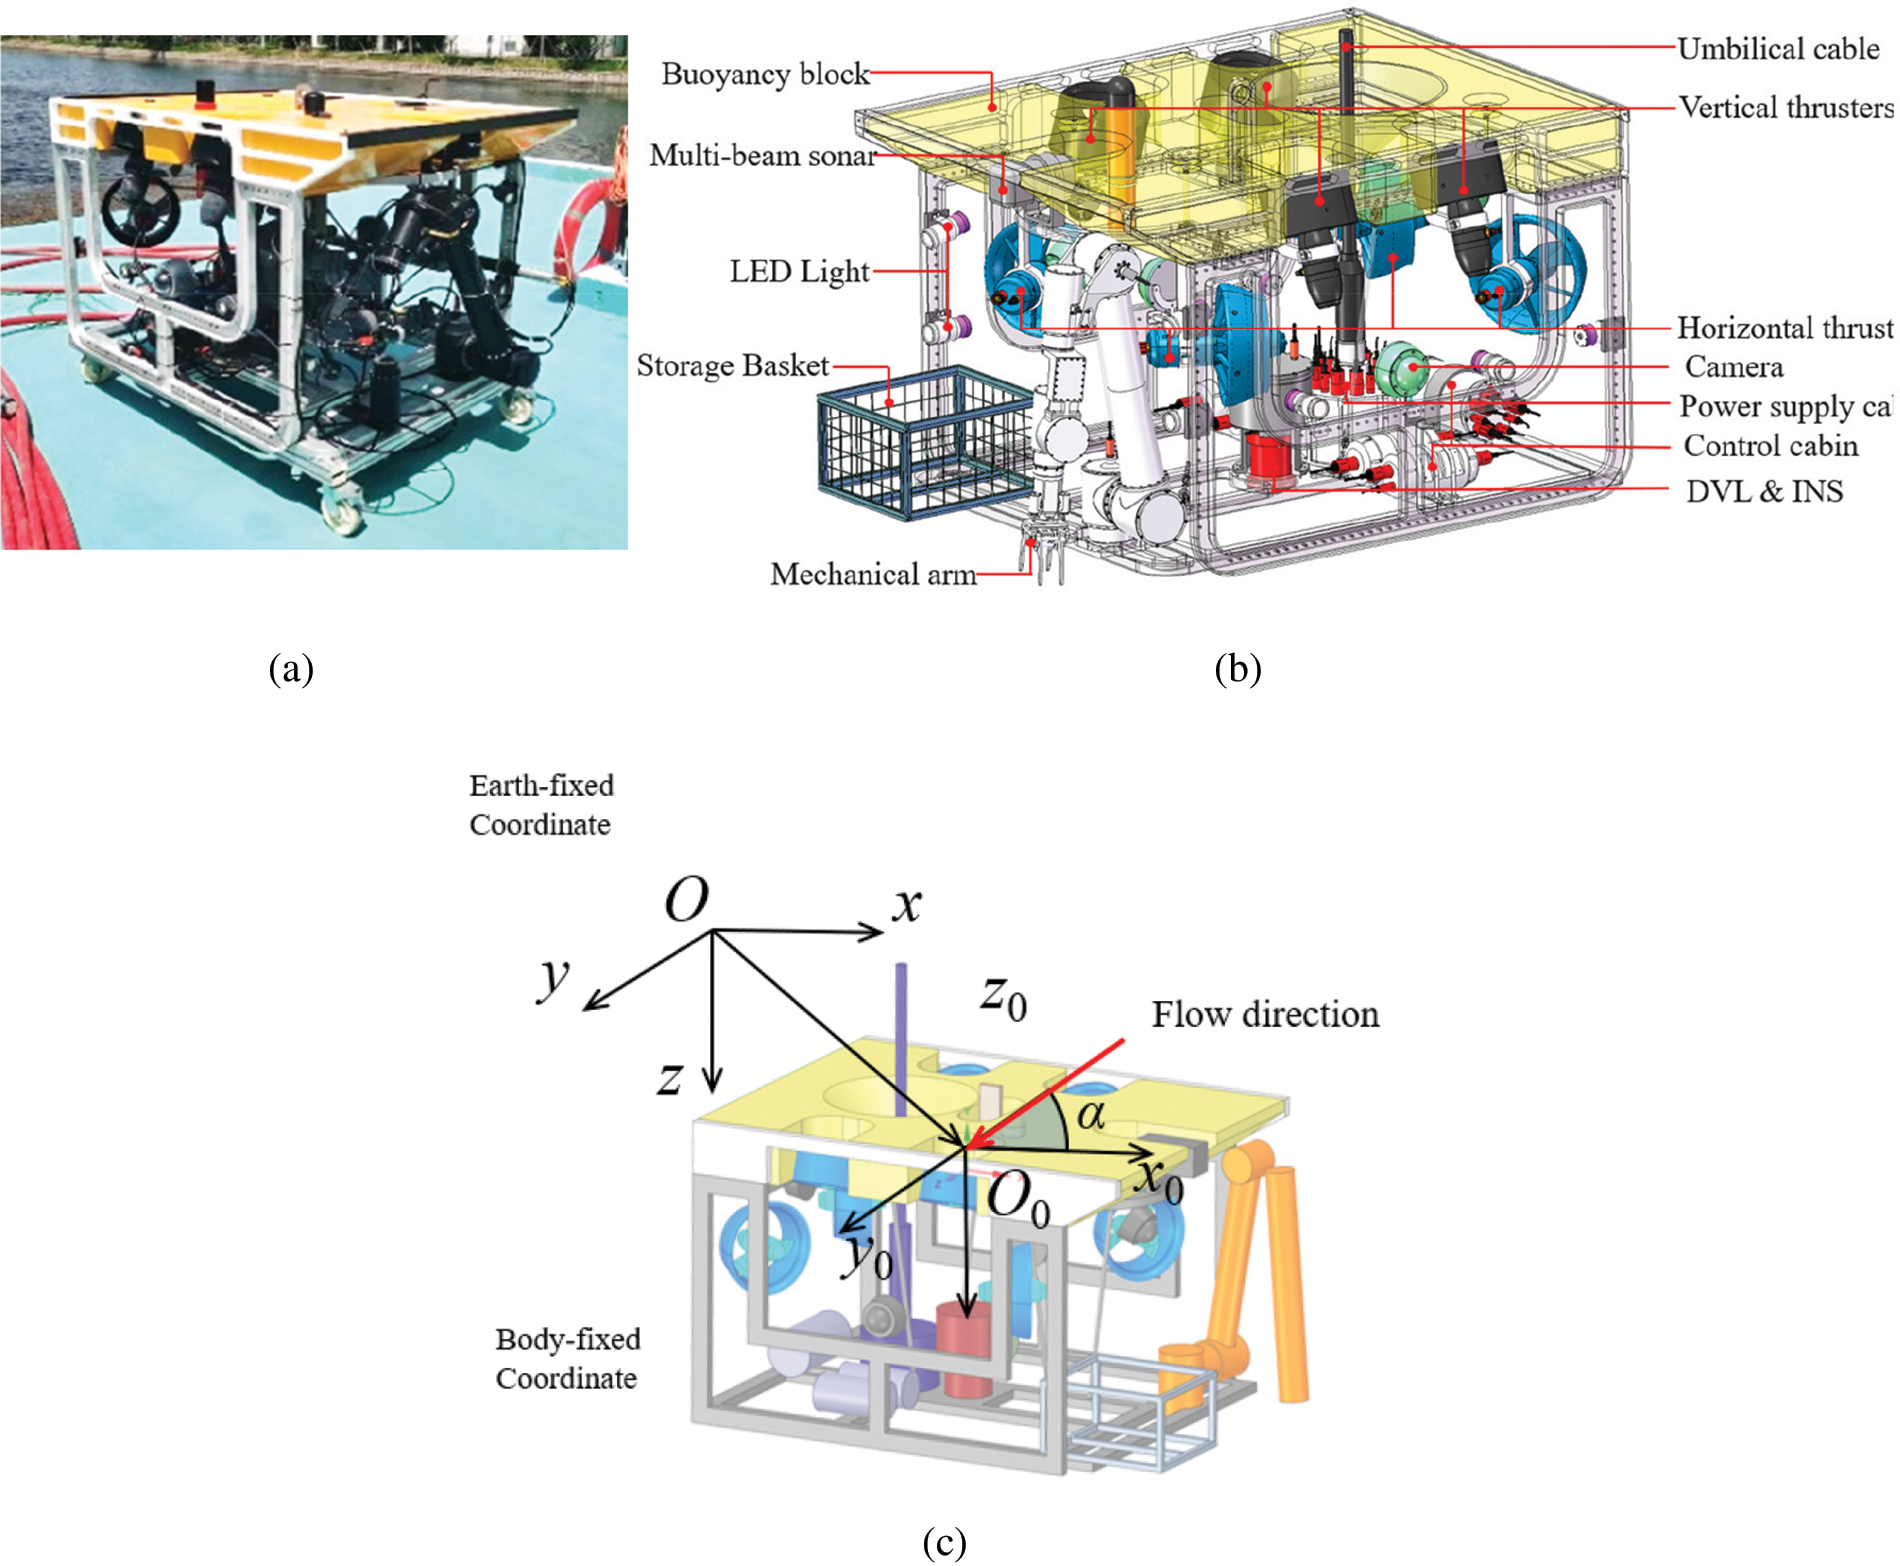
Figure 2: The ROV model (a) The actual ROV (b) Components of the ROV (c) Definition of the coordinate system and the simplified model
To reduce the interaction between the thrusters and meet the need for propulsion, a deflection angle is set between the propellers in the same plane of the vector arrangement propulsion system. As shown in Fig. 3, a coordinate system is implemented with the ROV’s center of gravity as the origin to present the position and deflection angle of each thruster. Each propeller in the figure is named according to its relative position, where ‘H’ stands for horizontal, ‘F’ for front, ‘B’ for back, ‘V’ for vertical, ‘R’ for right, and ‘L’ for left. In the horizontal propeller plane, the deflection angle of the propeller axis and forward direction is 30°. In the vertical plane, the deflection angle between the propeller axis and the upward direction is 20°. To get better propulsion performance, the spatial position of the thruster is as follows: yh1 = 435 mm, yh2 = 324 mm, xh1 = 404 mm, xh2 = 605 mm, xv1 = 215 mm, xv2 = 265 mm.
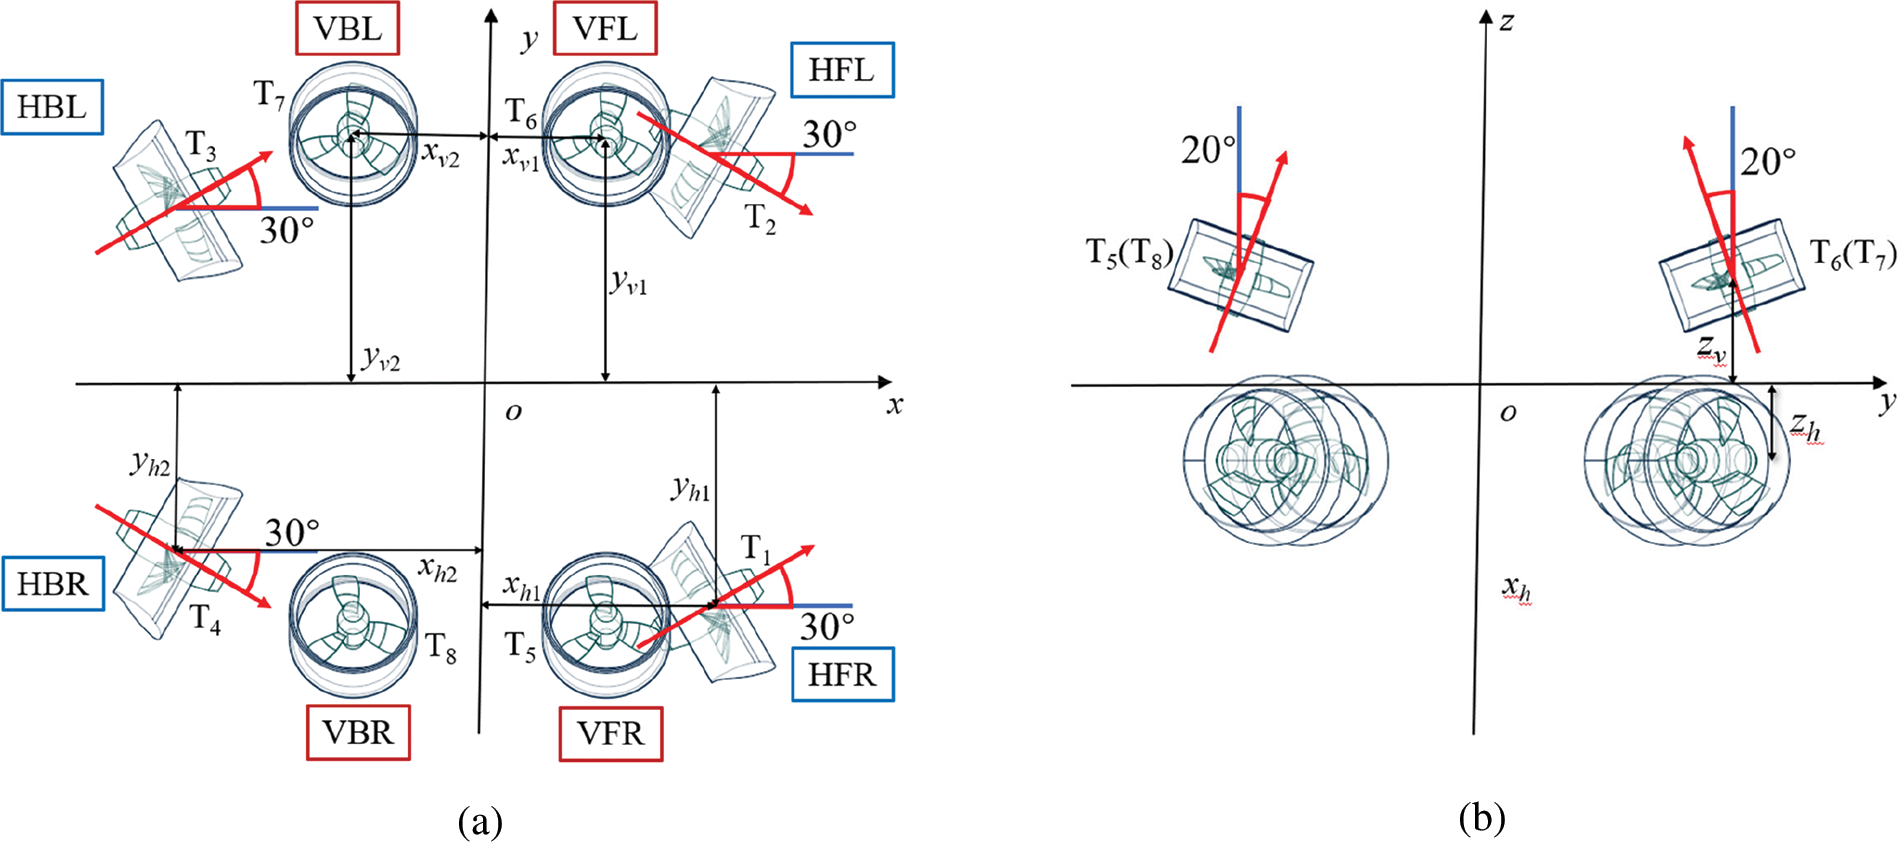
Figure 3: Vector layout propulsion system (a) Horizontal arrangement of vector propulsion system (b) Vertical arrangement of vector propulsion system
The open-frame ROV studied in this paper is not equipped with rudder, wing, and other mechanisms. The movement of the ROV is achieved by the thrust generated by the ducted propeller. According to the thruster layout, regardless of the interaction between the propellers and ambient water velocity, the thrust of the horizontal thruster can be expressed as:
The thrust of the vertical thruster can be expressed as:
where θ1 is the angle between the horizontal propeller axis and the vertical axis, θ2 is the angle between the vertical propeller axis and the normal axis, Ti is the thrust of the ducted propellers. As shown in Fig. 3, θ1 = 30° and θ2 = 20°.
Considering that the deflection angle between the horizontal propellers reaches 60°, and in addition, horizontal and vertical propellers are not in the same plane, the interaction between the propellers does not depend on the theoretical equations.
The thrust force of the propeller under different current velocities is considered. Due to the low current velocity (Vc < 3 m/s), the influence of advance velocity on the thrust is considered linear:
where TA is the thrust under current, T0 is the thrust without current KLT is the thrust ratio under current velocity of 1 m/s, and VC is the advance velocity.
2.3.1 Mesh for Open Water Performance Simulation of Ducted Propeller
The modeling process of the propeller model is introduced with the T2020 thruster as an example. And the T1080 thruster mesh in the same way. To improve the mesh quality, the propeller is placed in Region 1 of the mesh refinement. Region 2 is the area where the duct is located. Region 3 contains the entire computational flow field. The whole computing region is shown in Fig. 4. The inlet is 2.4D from the blade surface (D is the diameter of the propeller). The diameter of the boundary side of the cylindrical region is 4D. The outlet is 8.4D from the propeller disk surface. Unstructured grids are used in the calculation process, and the number of cells in the whole flow field is about 2.78 million.
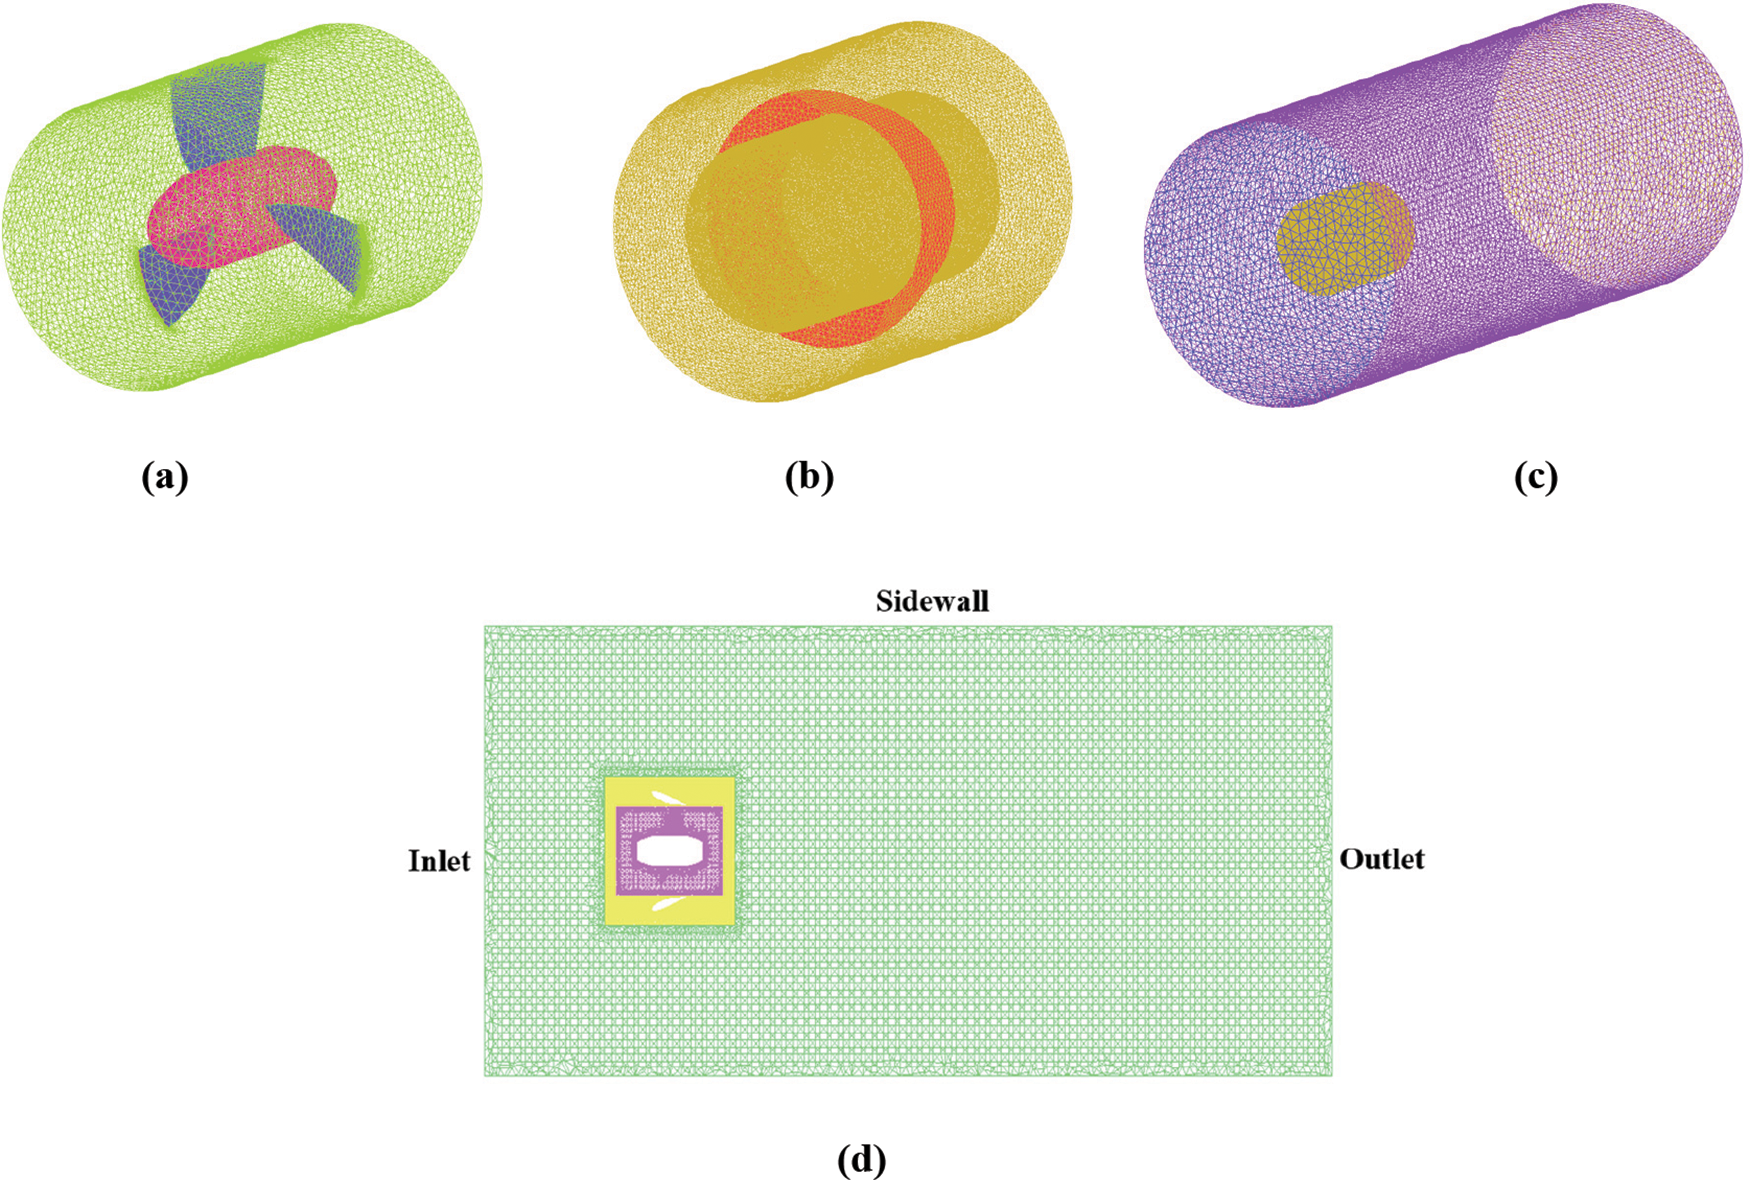
Figure 4: Implementation of the calculation area and its mesh (a) Region 1 (b) Region 2 (c) Region 3 (d) The whole computing region
The simulation is simulated by Fluent 2020 R1. The boundary condition of the inlet is set as a velocity-inlet and the outlet is defined as a pressure-outlet. The part interconnected with each region is set as interface, and the other wall conditions are set as no-slip stationary wall conditions. The propeller regions use MRF to simulate the water motion.
2.3.2 Mesh for Hydrodynamic Performance Simulation of the ROV
The propeller rotation regions and static region are separated, and these regions are divided into separate cells as shown in Fig. 5a. The inlet is 1.6L from the front of the ROV (L is the length of the ROV). The outlet is 5L from the stern of the ROV. The width of the computing region is 5W (W is the width of the ROV). The height of the computing region is 6H (H is the height of the ROV), as shown in Figs. 5b, 5c. Regions of the propeller are separately divided and intensive grids are used. To obtain better simulation results, a dense grid is also used in the closed area of the ROV [30]. The region where the ROV is located is also used with a denser grid for better simulation. After the cell division is completed, all the regions are assembled. The number of cells in each horizontal propeller region is about 0.97 million and the number in each vertical propeller region is about 0.61 million. The whole model has about 10.22 million cells. To accurately simulate the current around the ducted propeller, the grid near the propeller is scratched to a smaller size, as shown in Fig. 5d.
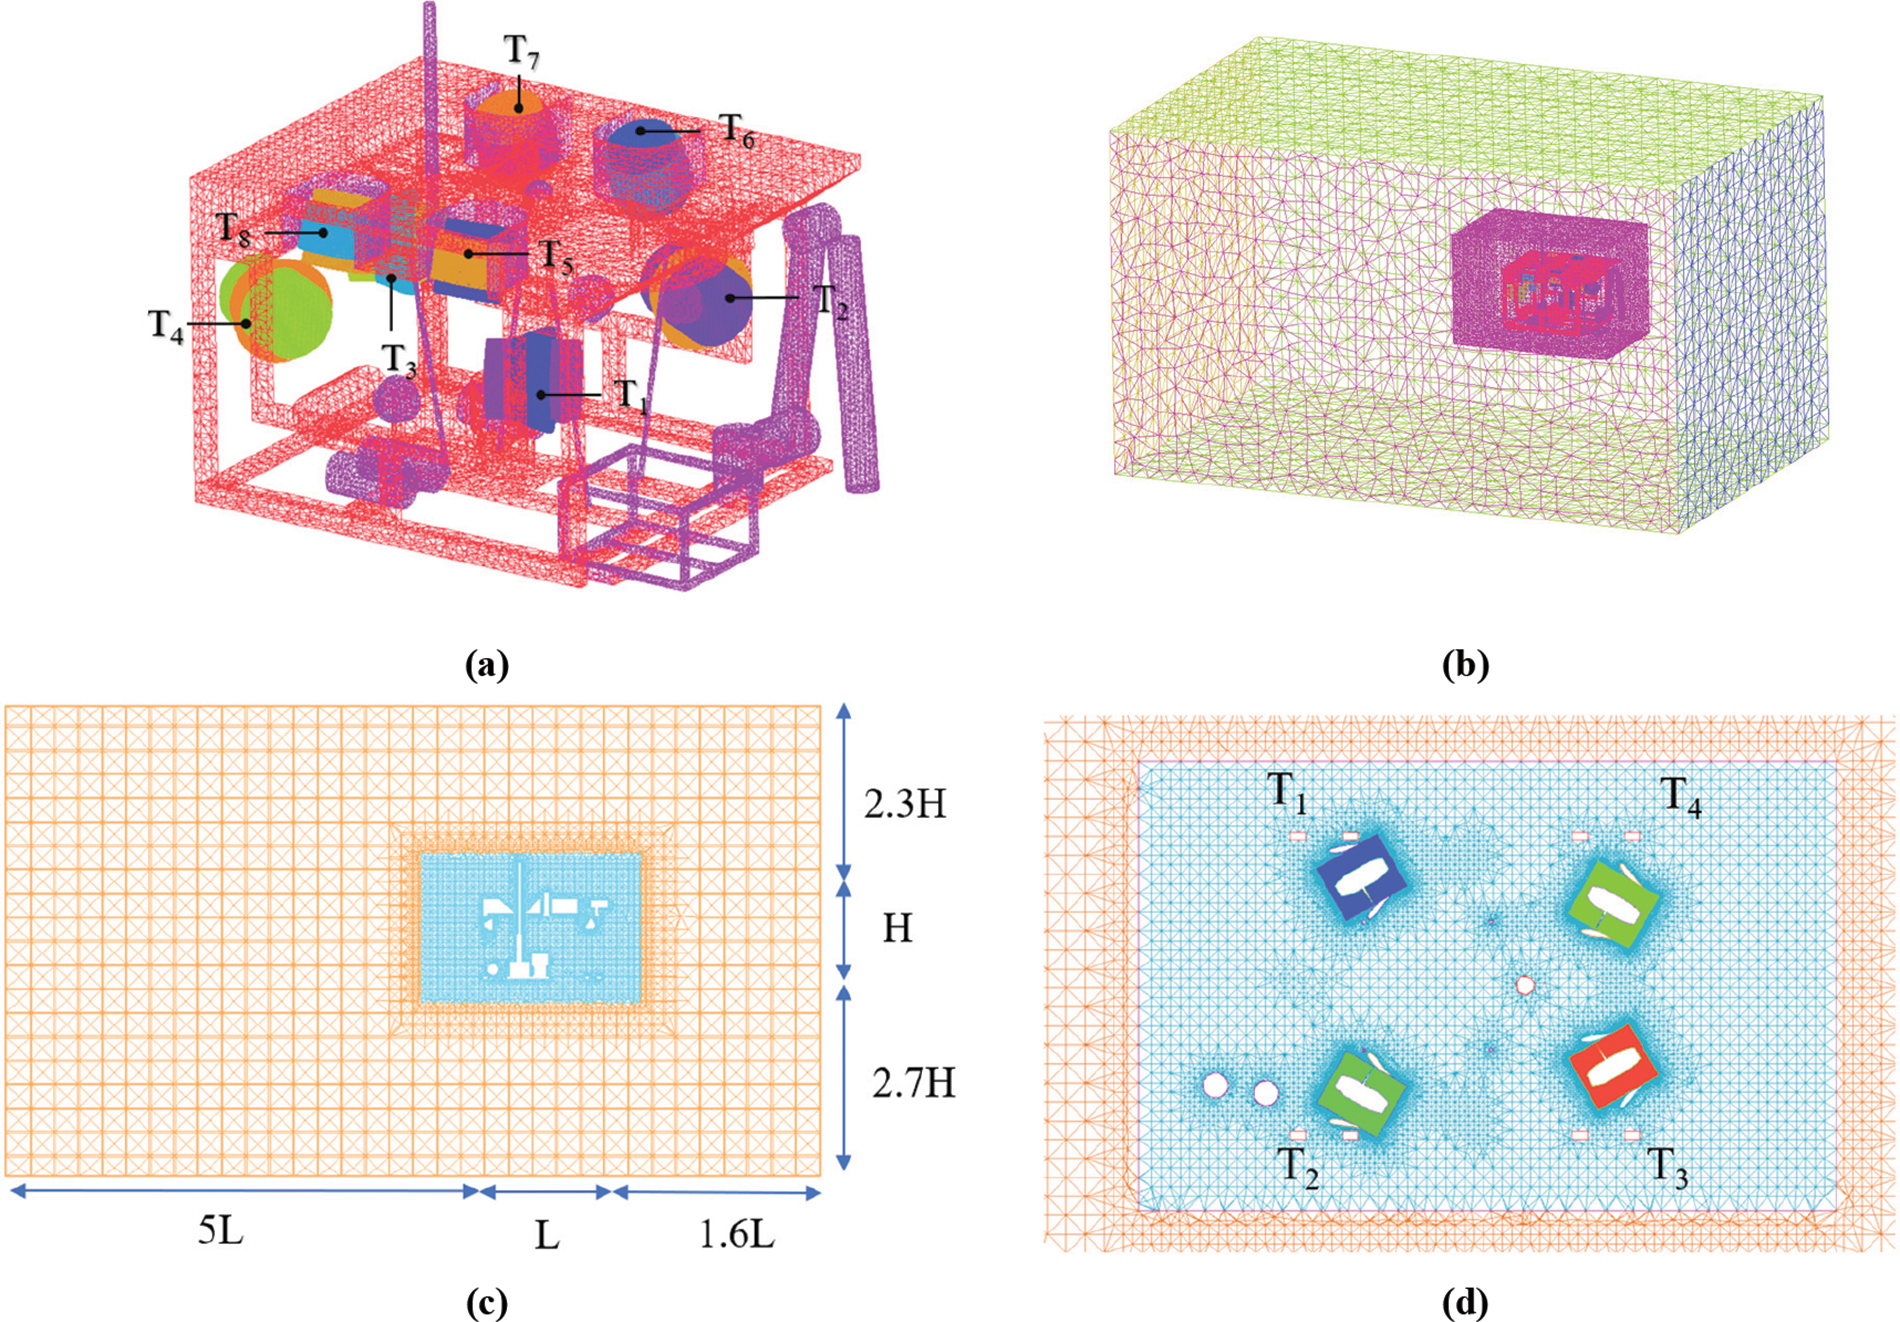
Figure 5: Mesh for the hydrodynamic performance simulation (a) The mesh on the ROV and propeller (b) The calculated flow field and its grid of the ROV (c) The vertical mesh cut plane on the axis of the ROV (d) The horizontal mesh cut plane on the axis of the horizontal propellers
To verify the convergence of the calculation, a convergence analysis is required. The convergence of the model is verified by setting different grid numbers. The simulation thrust for the different meshes is shown in Table 1. The convergence ratio is calculated as follows [31]:

where S1, S2 and S3 are the solutions of the different models. The calculation results are shown in Table 1.
According to the criteria, the model converges when RG is less than 1. As the cells grow, the model converges. Therefore, the number of cells in this model is reasonable. The model using 10.22 million cells can satisfy the calculation accuracy.
Considering the complexity of the bridge construction environment, the ROV’s hydrodynamic characteristics need to be simulated in a variety of flow environments. The direction vector of current is in the vertical plane (i.e., x-z plane), as shown in Fig. 2c. The included angle between the flow direction vector and the horizontal axis is α. Three different flow environments are simulated, that is, horizontal flow (α = 0°), oblique flow (α = 45°), and vertical flow (α = 90°). Since the robot needs to maintain its stability during operation, the ROV is fixed in the simulation and different operating conditions are simulated by changing the velocity and direction of water flow.
The posture of the ROV must be stabilized and maintained by the thrusters for exploration and operation in the water environment. Therefore, to analyze the mutual interference between the propellers and the mutual influence between the propeller and ROV structural frame, three propeller operating conditions are researched: The condition with only horizontal propeller rotating (H); The condition with both horizontal and vertical propellers rotating (H+V); and the condition with all propellers stopped (00). The characteristics of the horizontal flow field, the resistance of the ROV structure, and the thrust of the propeller are examined by varying the flow velocity at the inlet boundary. The simulation results show that when the ambient horizontal flow rate reaches 3 m/s, the thrust of the horizontal propeller is significantly lower than the longitudinal resistance of the ROV. The thrust of the vertical propeller is much lower than the vertical resistance of the ROV when the vertical flow velocity approaches 1.5 m/s. In this case, the ROV will not be able to maintain its own stability and should be avoided as much as possible during actual use. Therefore, vertical and oblique flow velocities higher than 1.5 m/s are not analyzed in the analysis.
3.1 Hydrodynamic Simulation Results under Horizontal Flow
It can be seen from Fig. 6 that there is no significant interference in the horizontal direction for the vector layout of the thrusters when only the horizontal thrusters are working. Fig. 6b shows that there are almost no path lines out of the horizontal upstream propeller and into the downstream horizontal propeller. After the vertical propeller starts operating, some of the path lines out of the vertical propeller enter the horizontal downstream propeller, as shown in Figs. 6c, 6d. Therefore, the work of the vertical propeller will inevitably interfere with the thrust of the horizontal propeller.
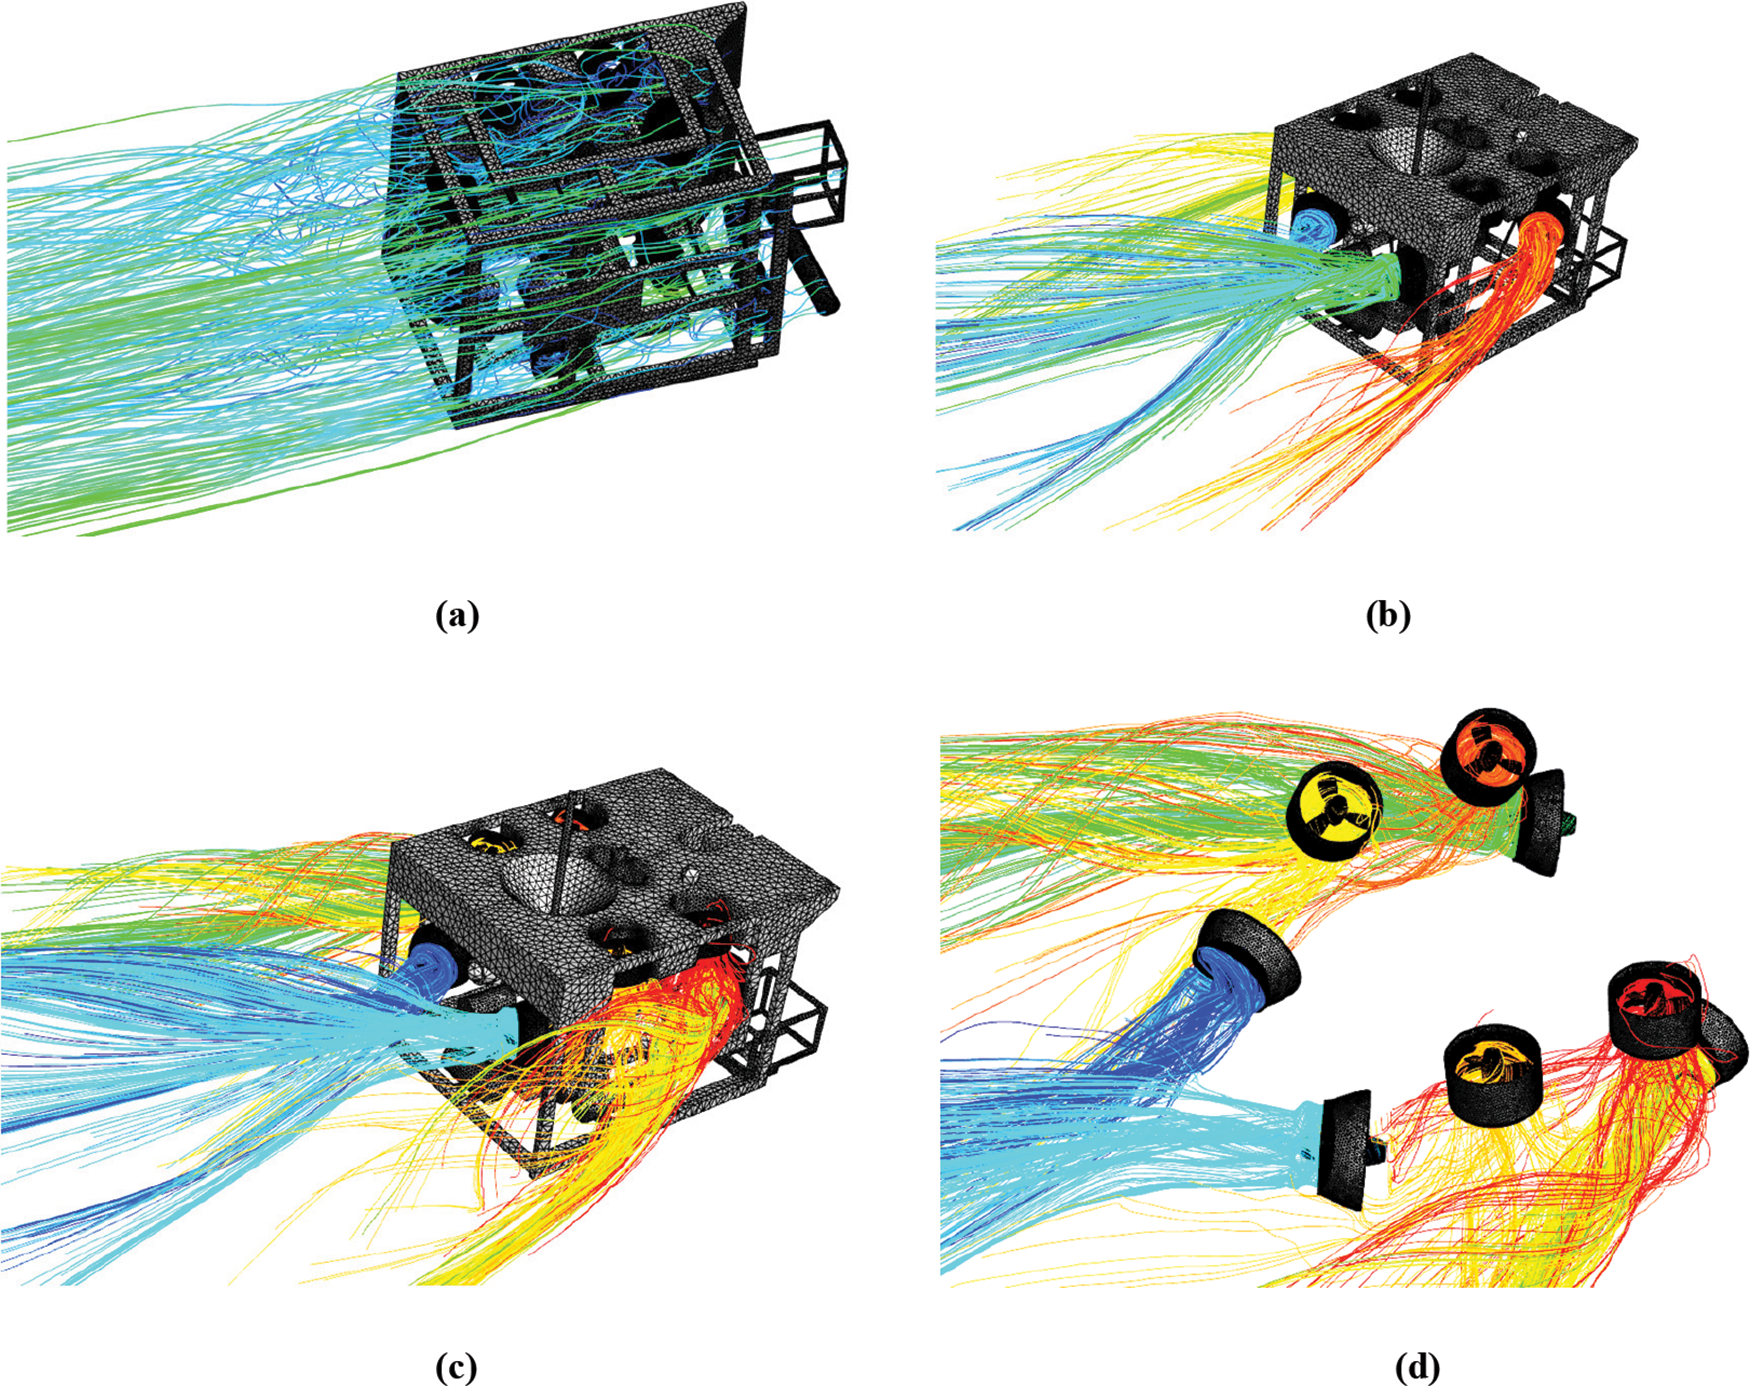
Figure 6: Pathlines from the surface or propellers of the ROV at 1.5 m/s (a) All propellers stopped (b) Horizontal propellers rotating (c) Horizontal and vertical propellers both rotating (d) Horizontal and vertical propellers rotating
The velocity distribution and pressure distribution in Fig. 7 show that the wake of the front thrusters flows from the outside of the ROV frame to the rear, with no direct interaction between the thrusters in the horizontal propeller axis plane. The operation of the horizontal front thruster changes the velocity and distribution of the flow field around the rear horizontal thruster, making the pressure around the rear horizontal thruster drop.
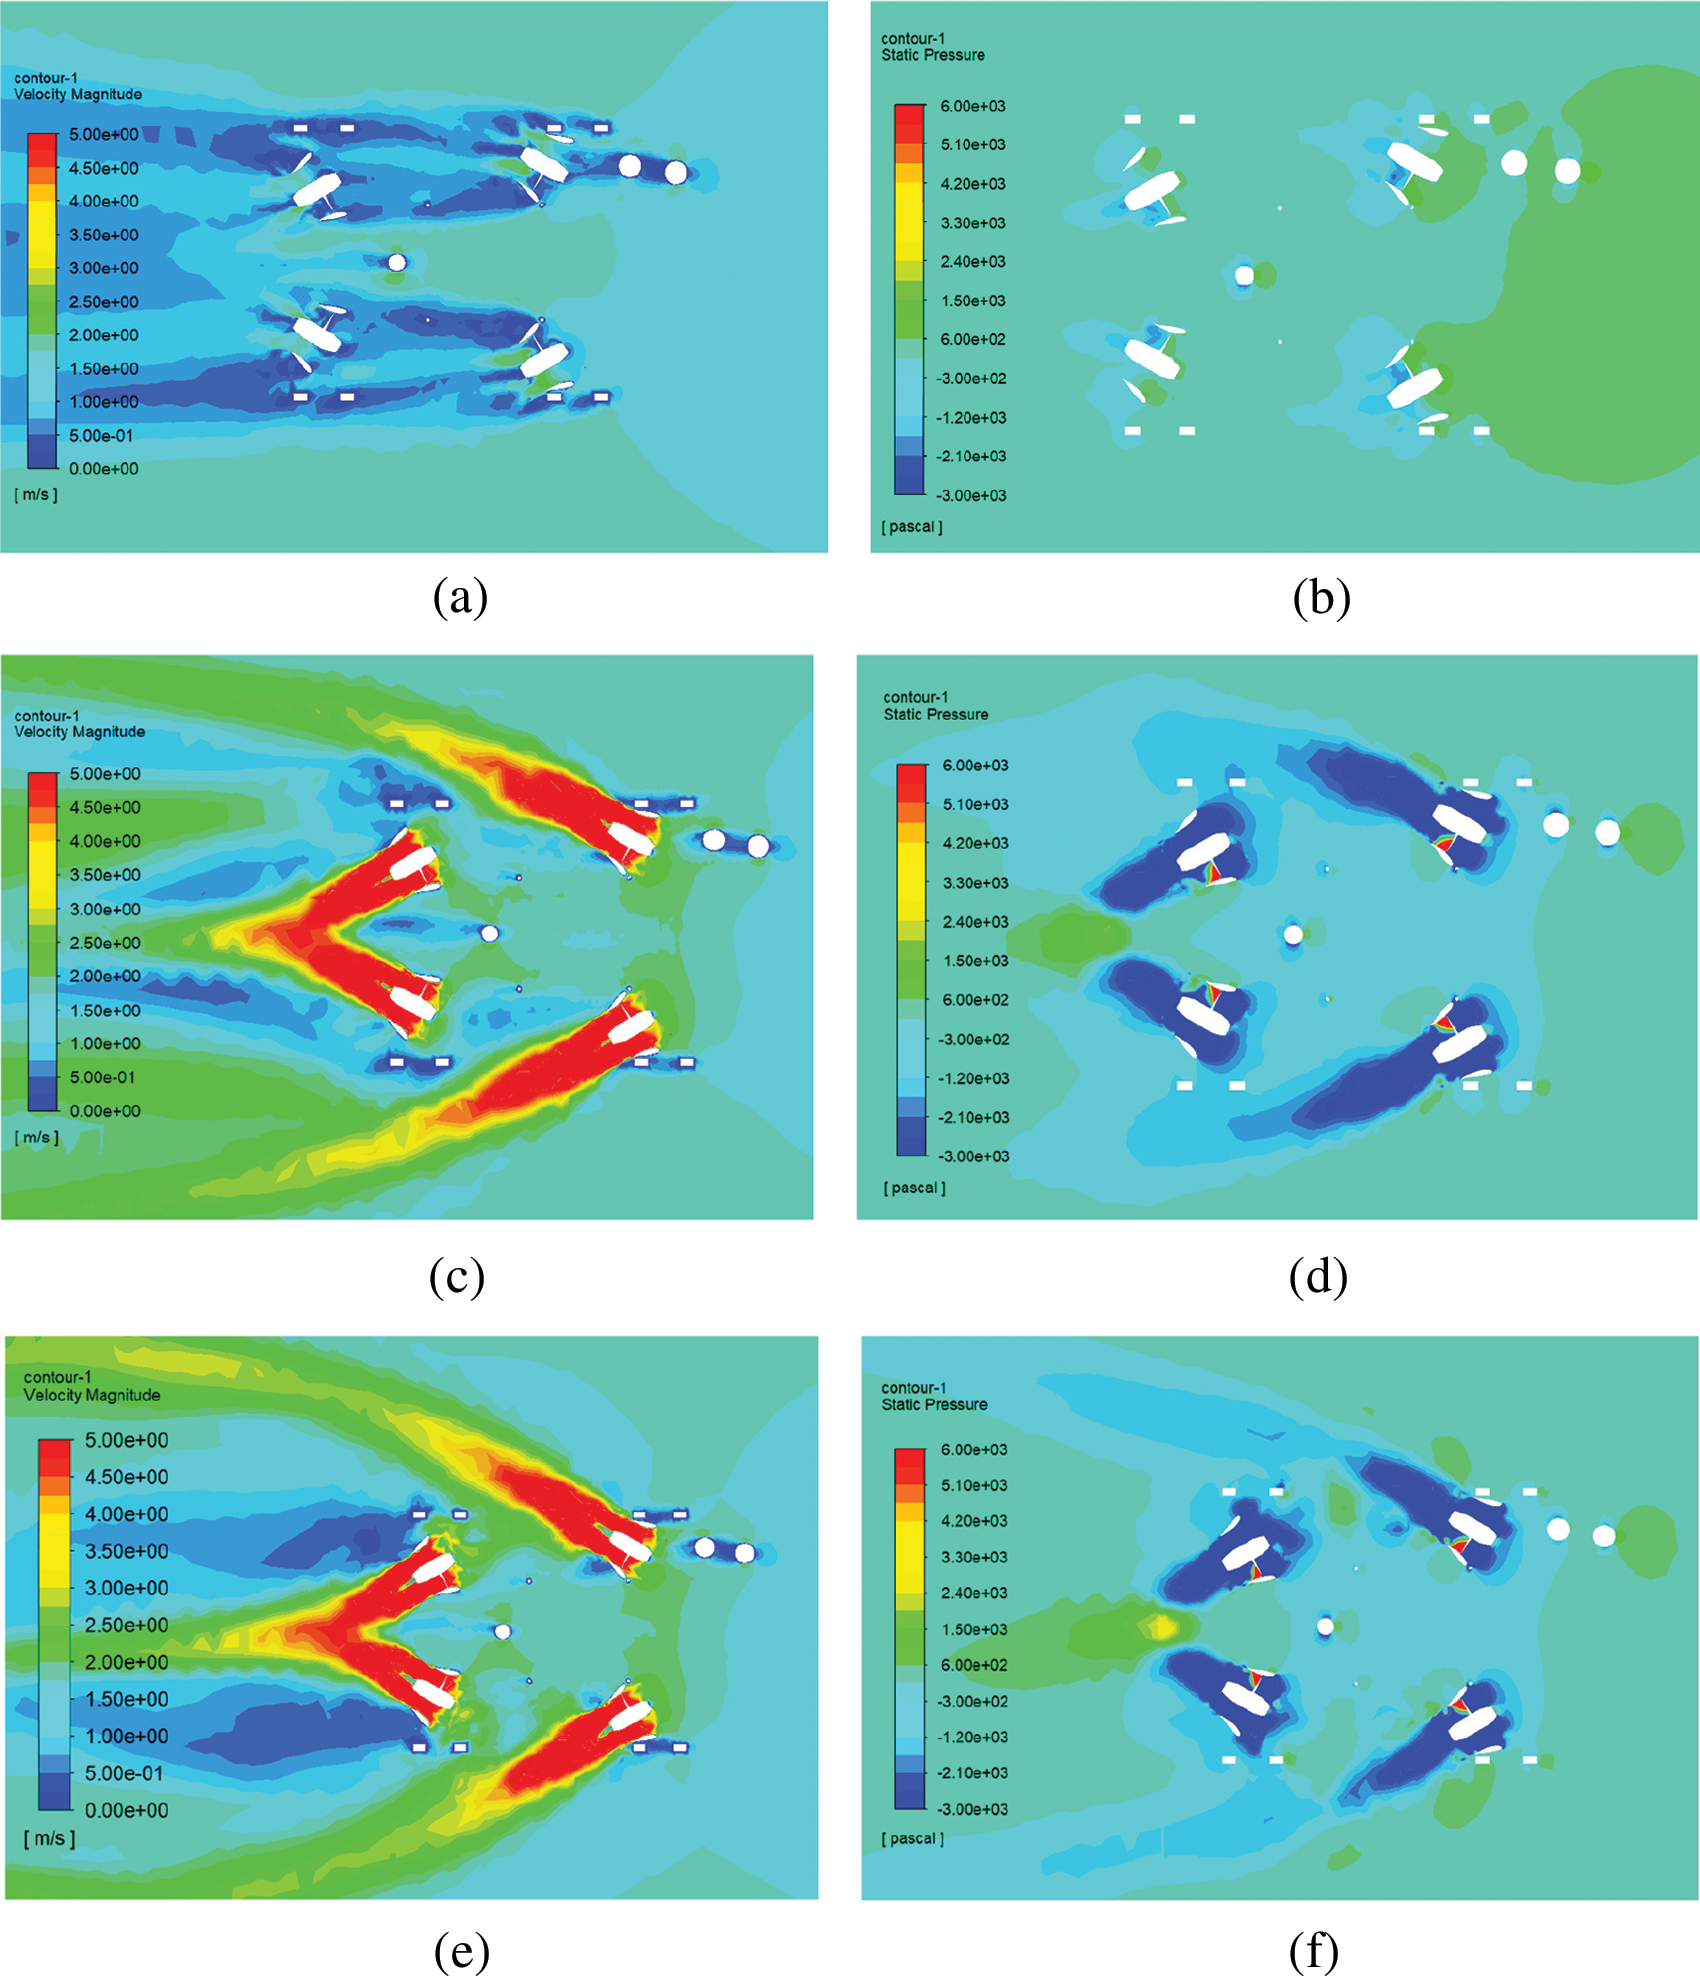
Figure 7: Velocity and pressure distribution on the horizontal plane passing through the horizontal propellers at 1.5 m/s. (a) Velocity distribution with all propellers stopped (b) Pressure distribution with all propellers stopped (c) Velocity distribution with horizontal propellers operating (d) Pressure distribution with horizontal propellers operating (e) Velocity distribution with all propellers operating (f) Pressure distribution with all propellers operating
After the vertical thruster operation, the vertical wake flows out of the outer side of the robot frame without directly affecting the horizontal thruster. Compared with the velocity and pressure distribution diagram at the front end of the horizontal rear thruster inlet, the velocity of the front end of the thruster accelerates and the low-pressure area increases after the vertical thruster operation.
After the operation of the horizontal propeller, the pressure and velocity distribution on the vertical surface in Fig. 8 show that the flow velocity below the buoyancy block slows down and a large area of low pressure appears below the buoyancy plate. After the vertical thruster is activated, the velocity under the buoyancy block increases and the low-pressure area decreases.
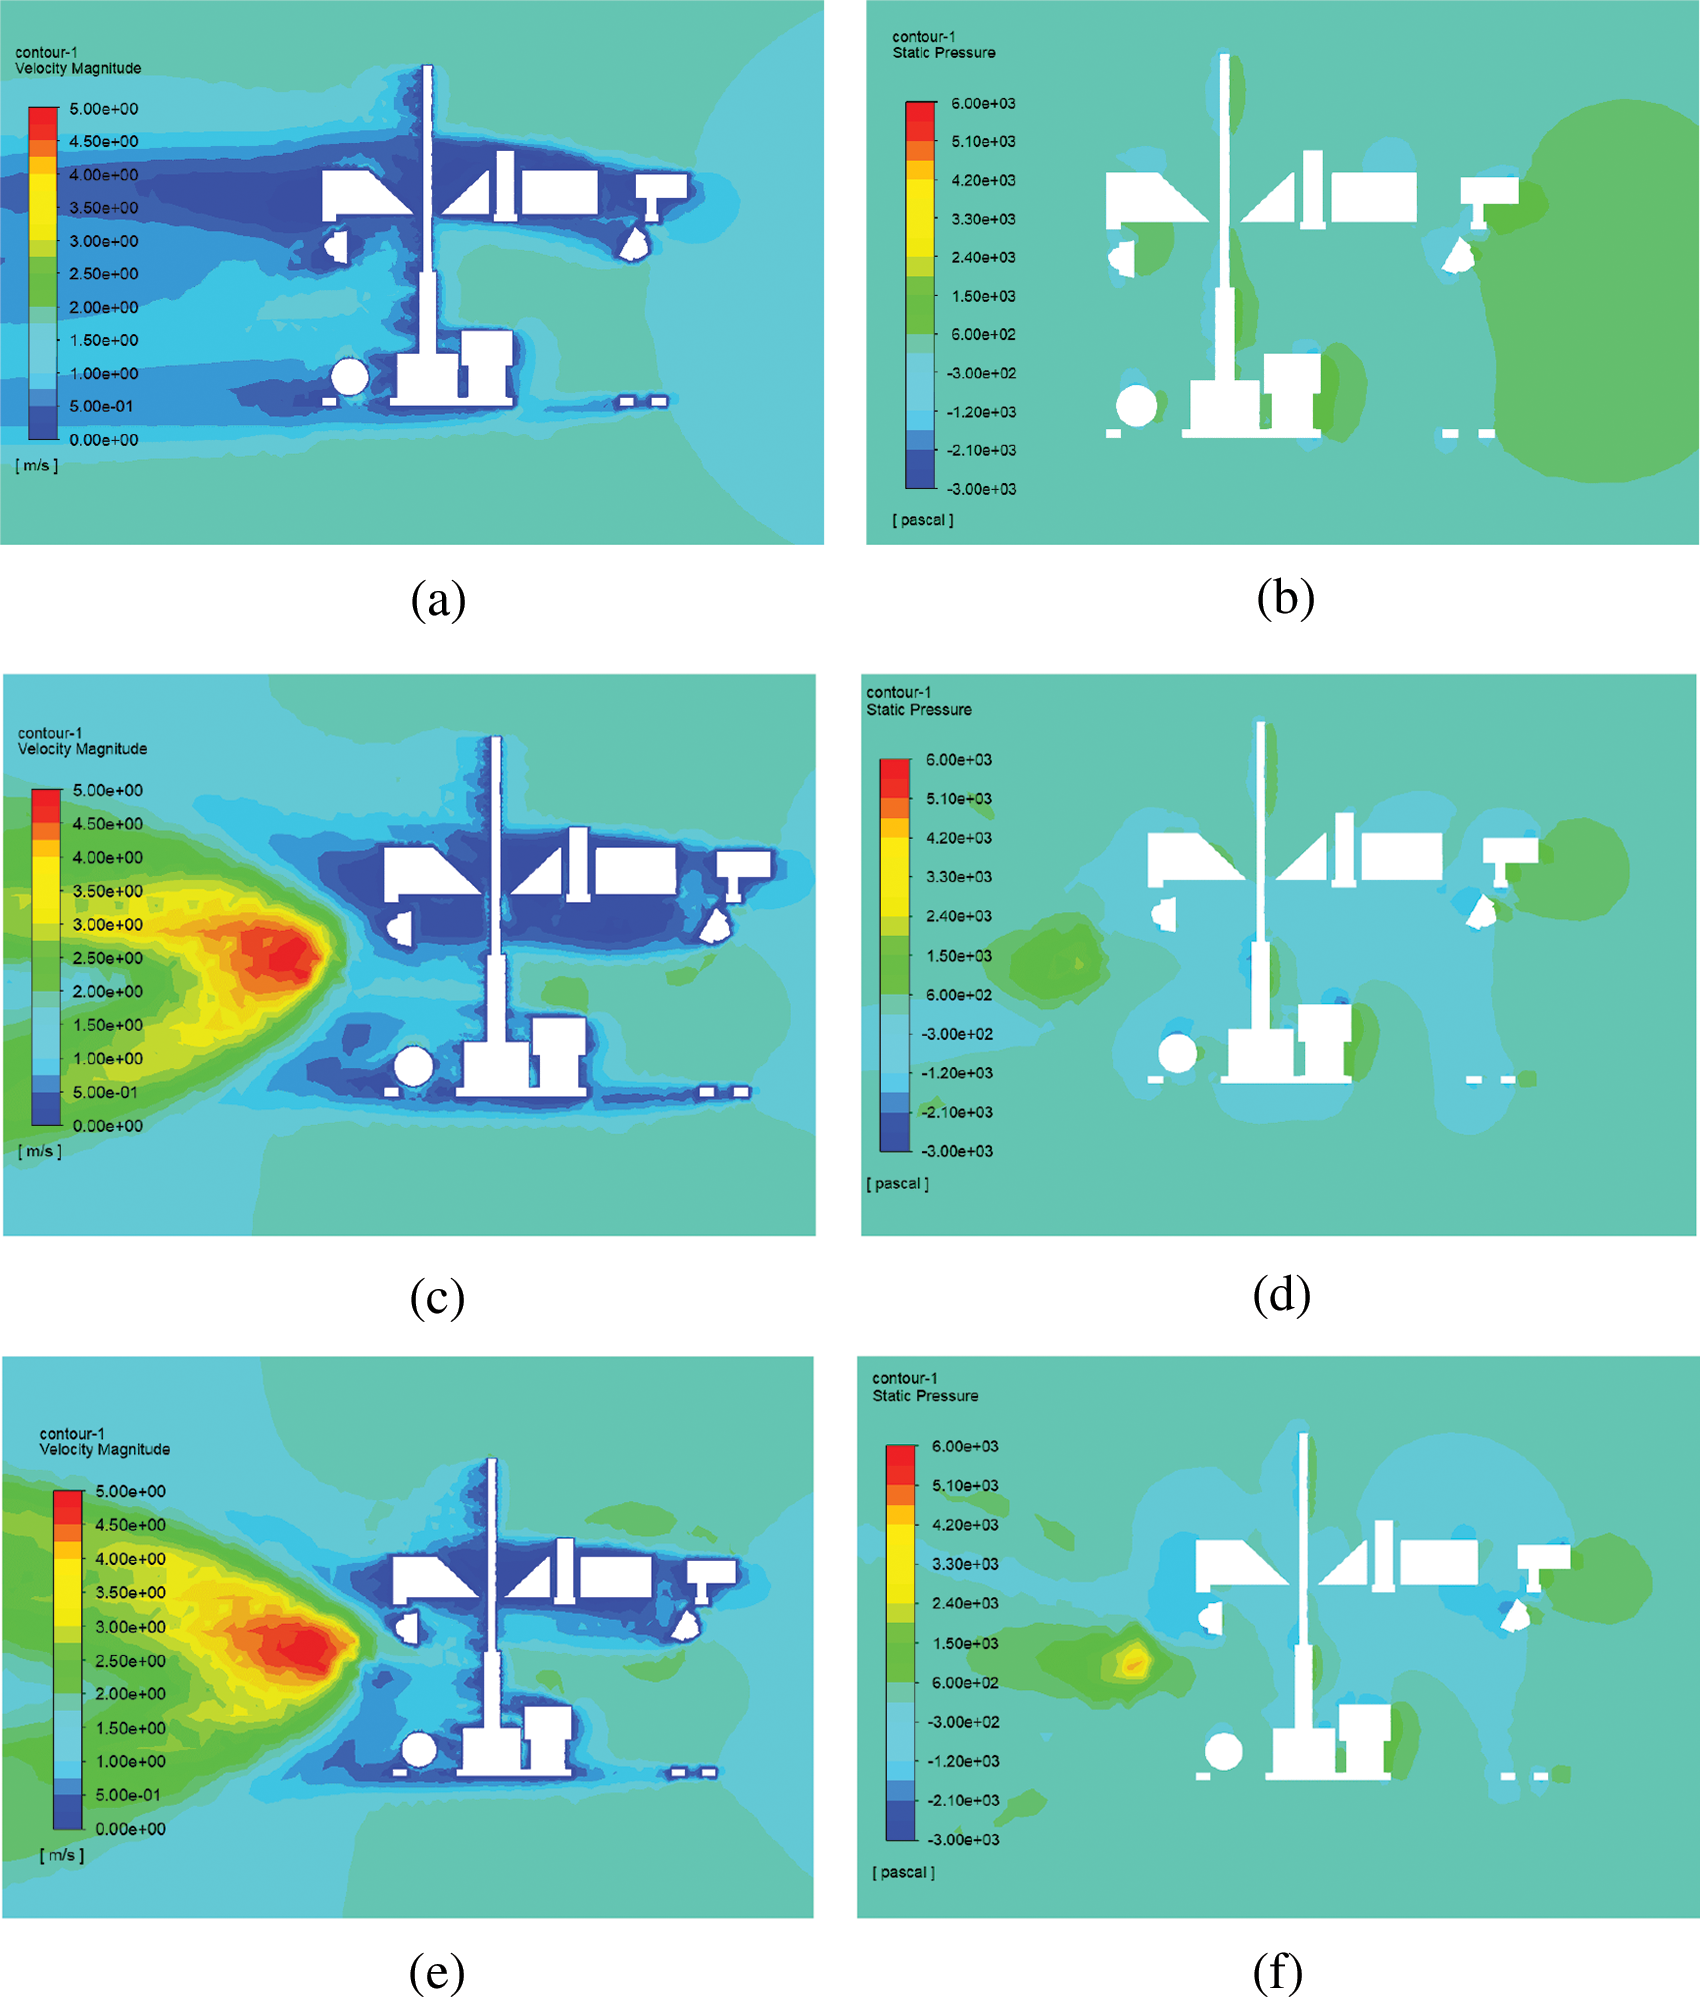
Figure 8: Velocity and pressure distribution on the vertical plane passing through the axis of the ROV at 3.0 m/s. (a) Velocity distribution with all propellers stopped (b) Pressure distribution with all propellers stopped (c) Velocity distribution with horizontal propellers operating (d) Pressure distribution with horizontal propellers operating (e) Velocity distribution with all propellers operating (f) Pressure distribution with all propellers operating
The horizontal and vertical thrusts at different flow rates are plotted in line diagrams by considering the horizontal and vertical propellers and ducts as a whole. As Fig. 9a shows, the horizontal drag increases when the propeller is operating. When the vertical and horizontal propellers operate simultaneously, the horizontal drag reaches its maximum value. After the vertical thrusters have started operating, the drag increases by about 400 N compared to when the horizontal thrusters are operating alone.
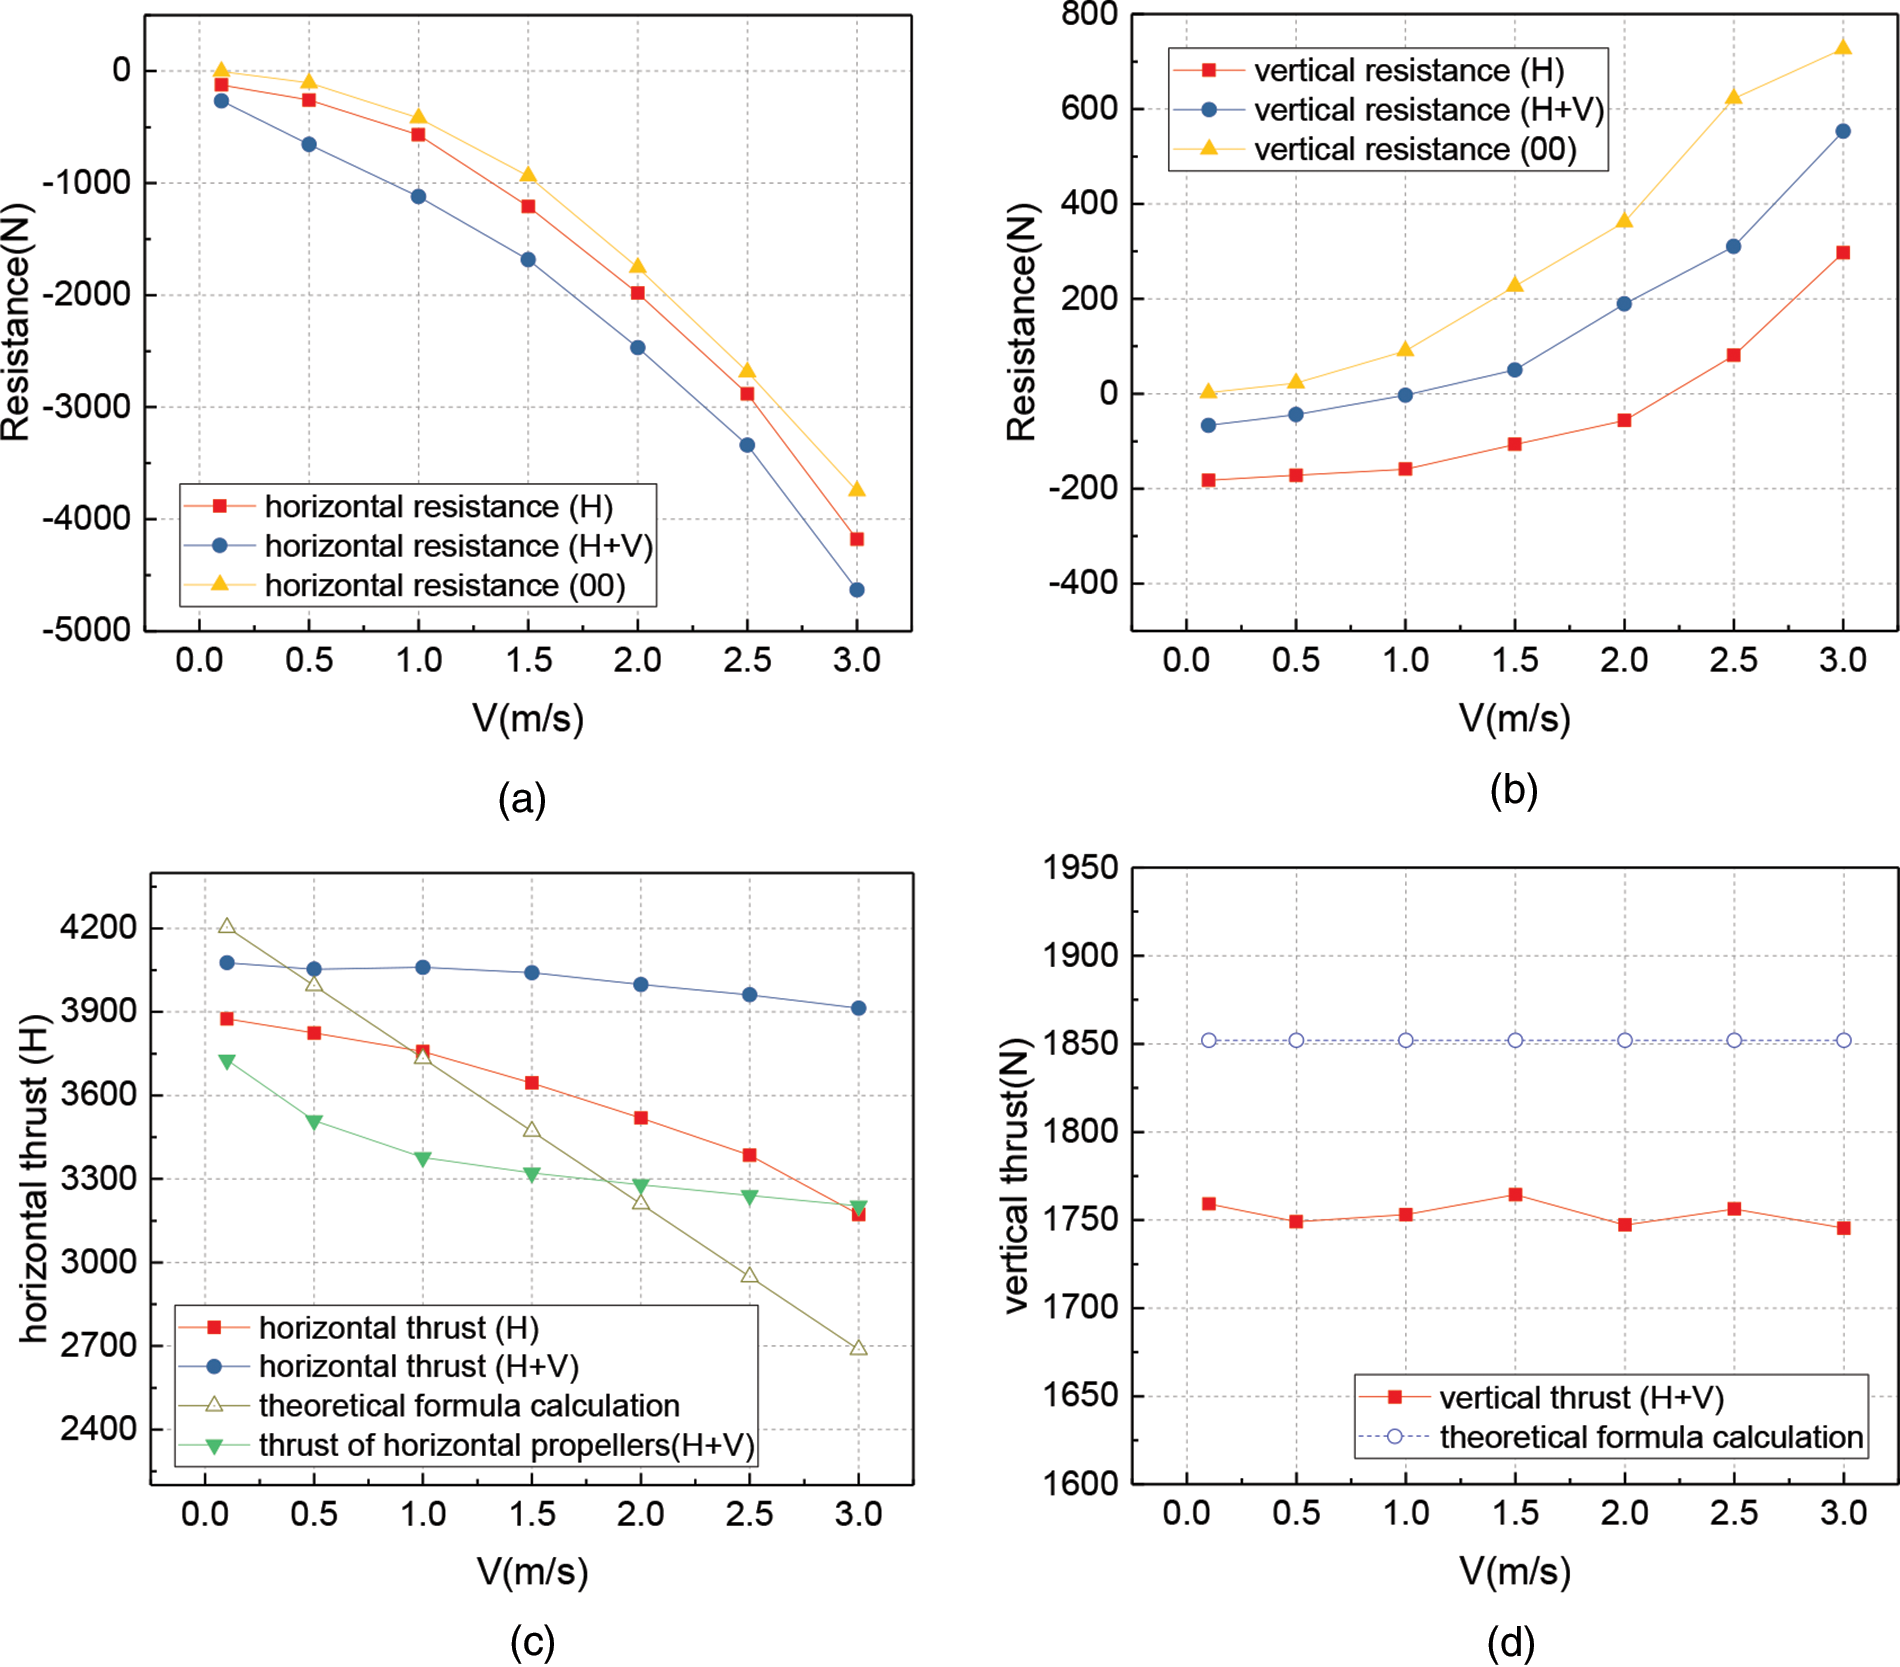
Figure 9: Resistance and thrust (a) Horizontal resistance of the ROV (b) Vertical resistance of the ROV (c) Horizontal thrust of the propellers (d) Vertical thrust of the propellers
On the other hand, the ROV structure generates lift under the action of a head-on water current. The drag curve in Fig. 9b shows that the lift increases as the horizontal current velocity increases. However, the action of the horizontal propeller accelerates the current velocity under the robot structure, which results in a reduction in the pressure under the structure (Fig. 8). As a result, the lift force decreases when the horizontal propeller rotates. When both the horizontal and vertical propellers rotate, the current velocity under the buoyancy body decreases and the pressure increases, leading to an increase in buoyancy on the ROV.
As shown in Fig. 9c, the horizontal propeller thrust obtained from the simulation analysis is lower than the theoretically calculated value at low flow velocity. According to the simulation data, the thrust of the rear horizontal propeller is lower than that of the front horizontal propeller because the current is interfered with by other propellers and the ROV structure. However, the thrust of the horizontal propeller gradually decreases with the increase of the current velocity. The current entering the downstream horizontal propeller is slowed down by the internal structure and the interference of the front horizontal propeller. Therefore, the thrust of the horizontal propeller decreases relatively slowly. It is noteworthy that the thrust of the horizontal propeller increases when the vertical propeller is working. The thrust of the vertical propeller is less affected by the current. The simulated vertical thrust is about 5% lower than the theoretical value.
It is important to note that the total horizontal thrust of the ROV increases with the vertical thruster operation. With the increase of flow velocity, the total horizontal thrust increases more. If the horizontal force of the vertical propeller is not considered, only the thrust curve of the horizontal propeller is plotted. The thrust decreases rather than increases after the vertical propeller operation. It can be seen that the operation of the vertical propeller does not significantly increase the horizontal propeller thrust but changes the pressure distribution inside the ROV so that the vertical thruster generates pressure along the forward direction.
3.2 Hydrodynamic Simulation Results under Oblique Flow
By changing the current velocity from 0.1 to 1.5 m/s, the resistance of buoyancy body, structural frame, and thrust of the propeller are analyzed. Under the current of 1.5 m/s, the vertical propeller produced significantly less thrust than the vertical resistance without considering buoyancy. As a result, higher velocity currents are not simulated. According to the path lines shown in Fig. 10, the path lines from the propellers entering the others are less than that under the condition of horizontal flow. In this case, the thrust interference of the vertical propeller to the horizontal propeller will be smaller than that under the horizontal flow.
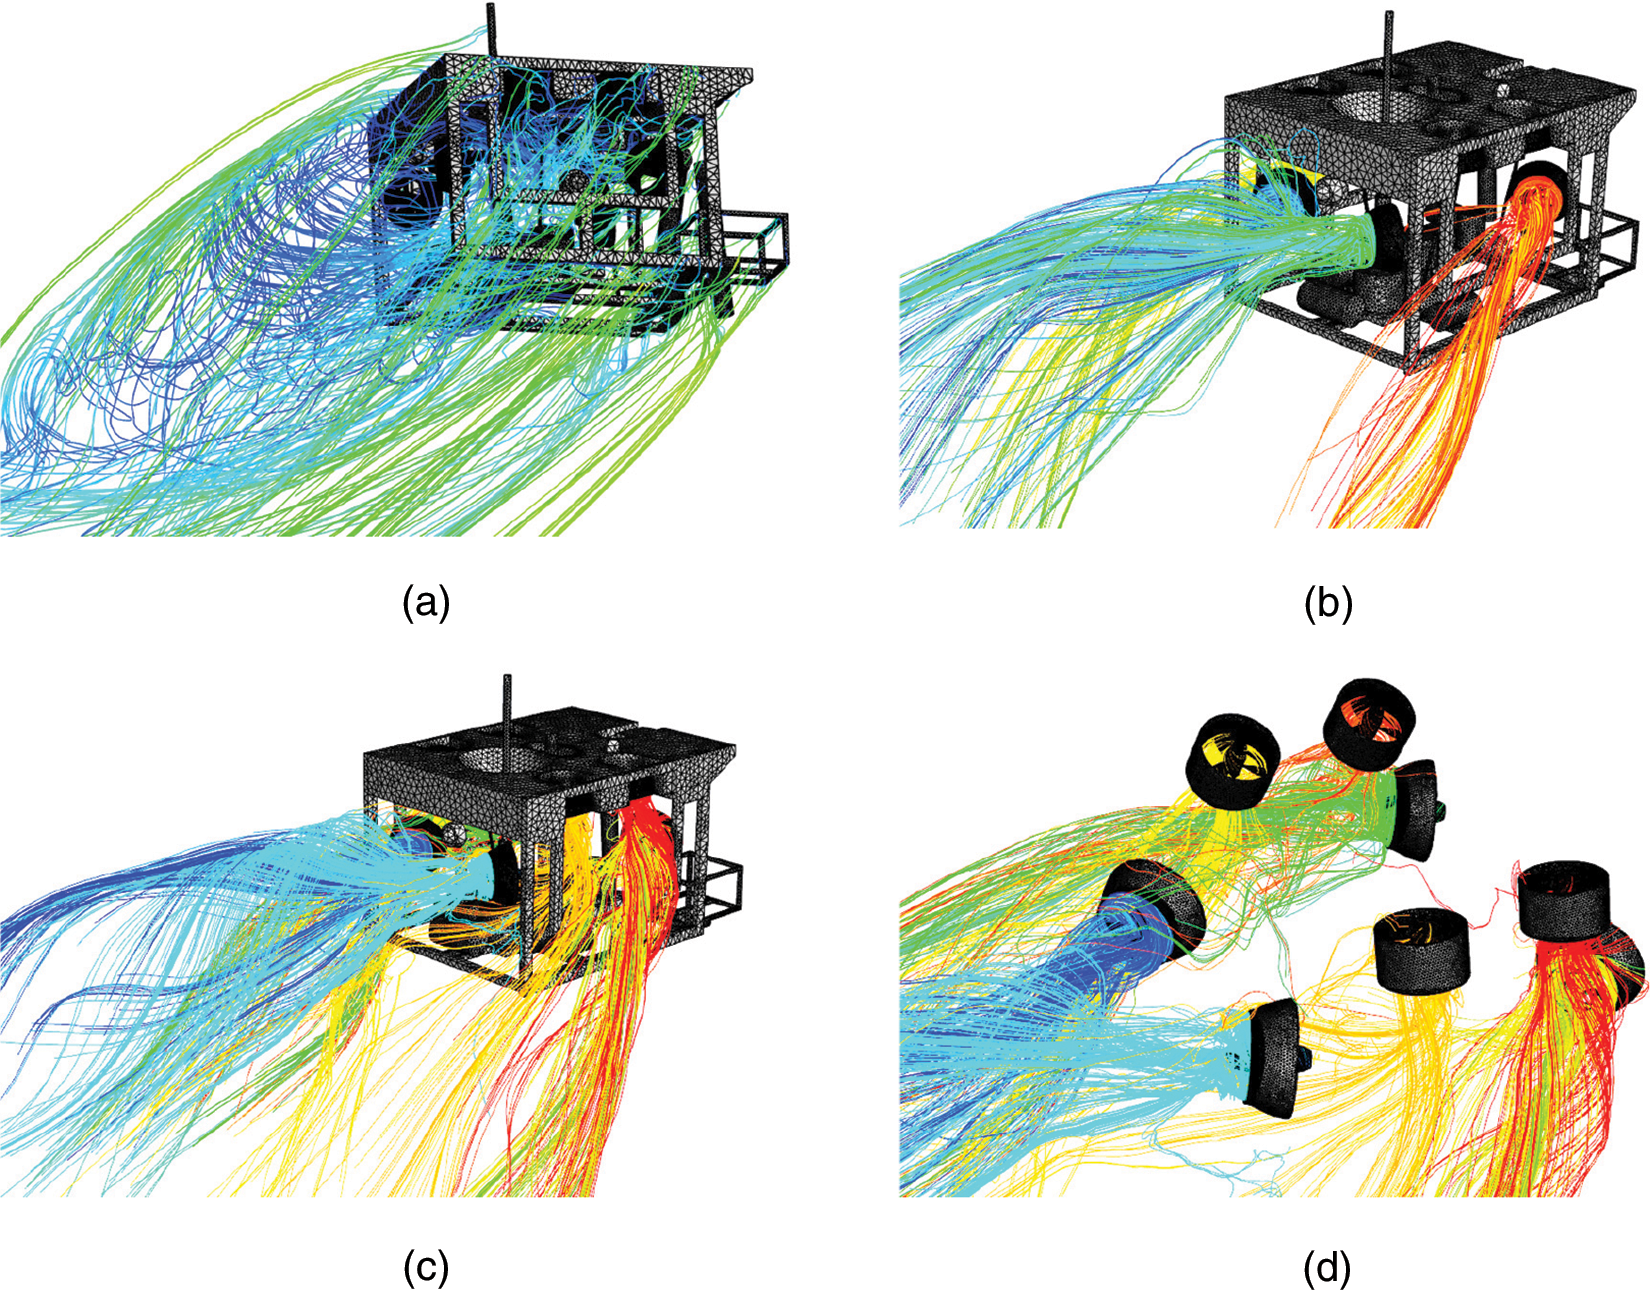
Figure 10: Pathlines from the surface or propellers of the ROV at 1.5 m/s (a) All propellers stopped (b) Horizontal propellers rotating (c) Horizontal and vertical propellers both rotating (d) Horizontal and vertical propellers rotating details
Compared with the horizontal flow, it can be seen from Fig. 11 that the velocity and pressure under the ROV buoyancy block are significantly reduced. It can be deduced that there are many vortices in this region. In this case, the horizontal rear thruster is completely wrapped in the vortex region, and the thrust is interfered with. Because of the vertical flow, the wake of the vertical thruster diverges less, flows faster, and enters the horizontal thruster less, thus causing less disturbance to the horizontal thruster.
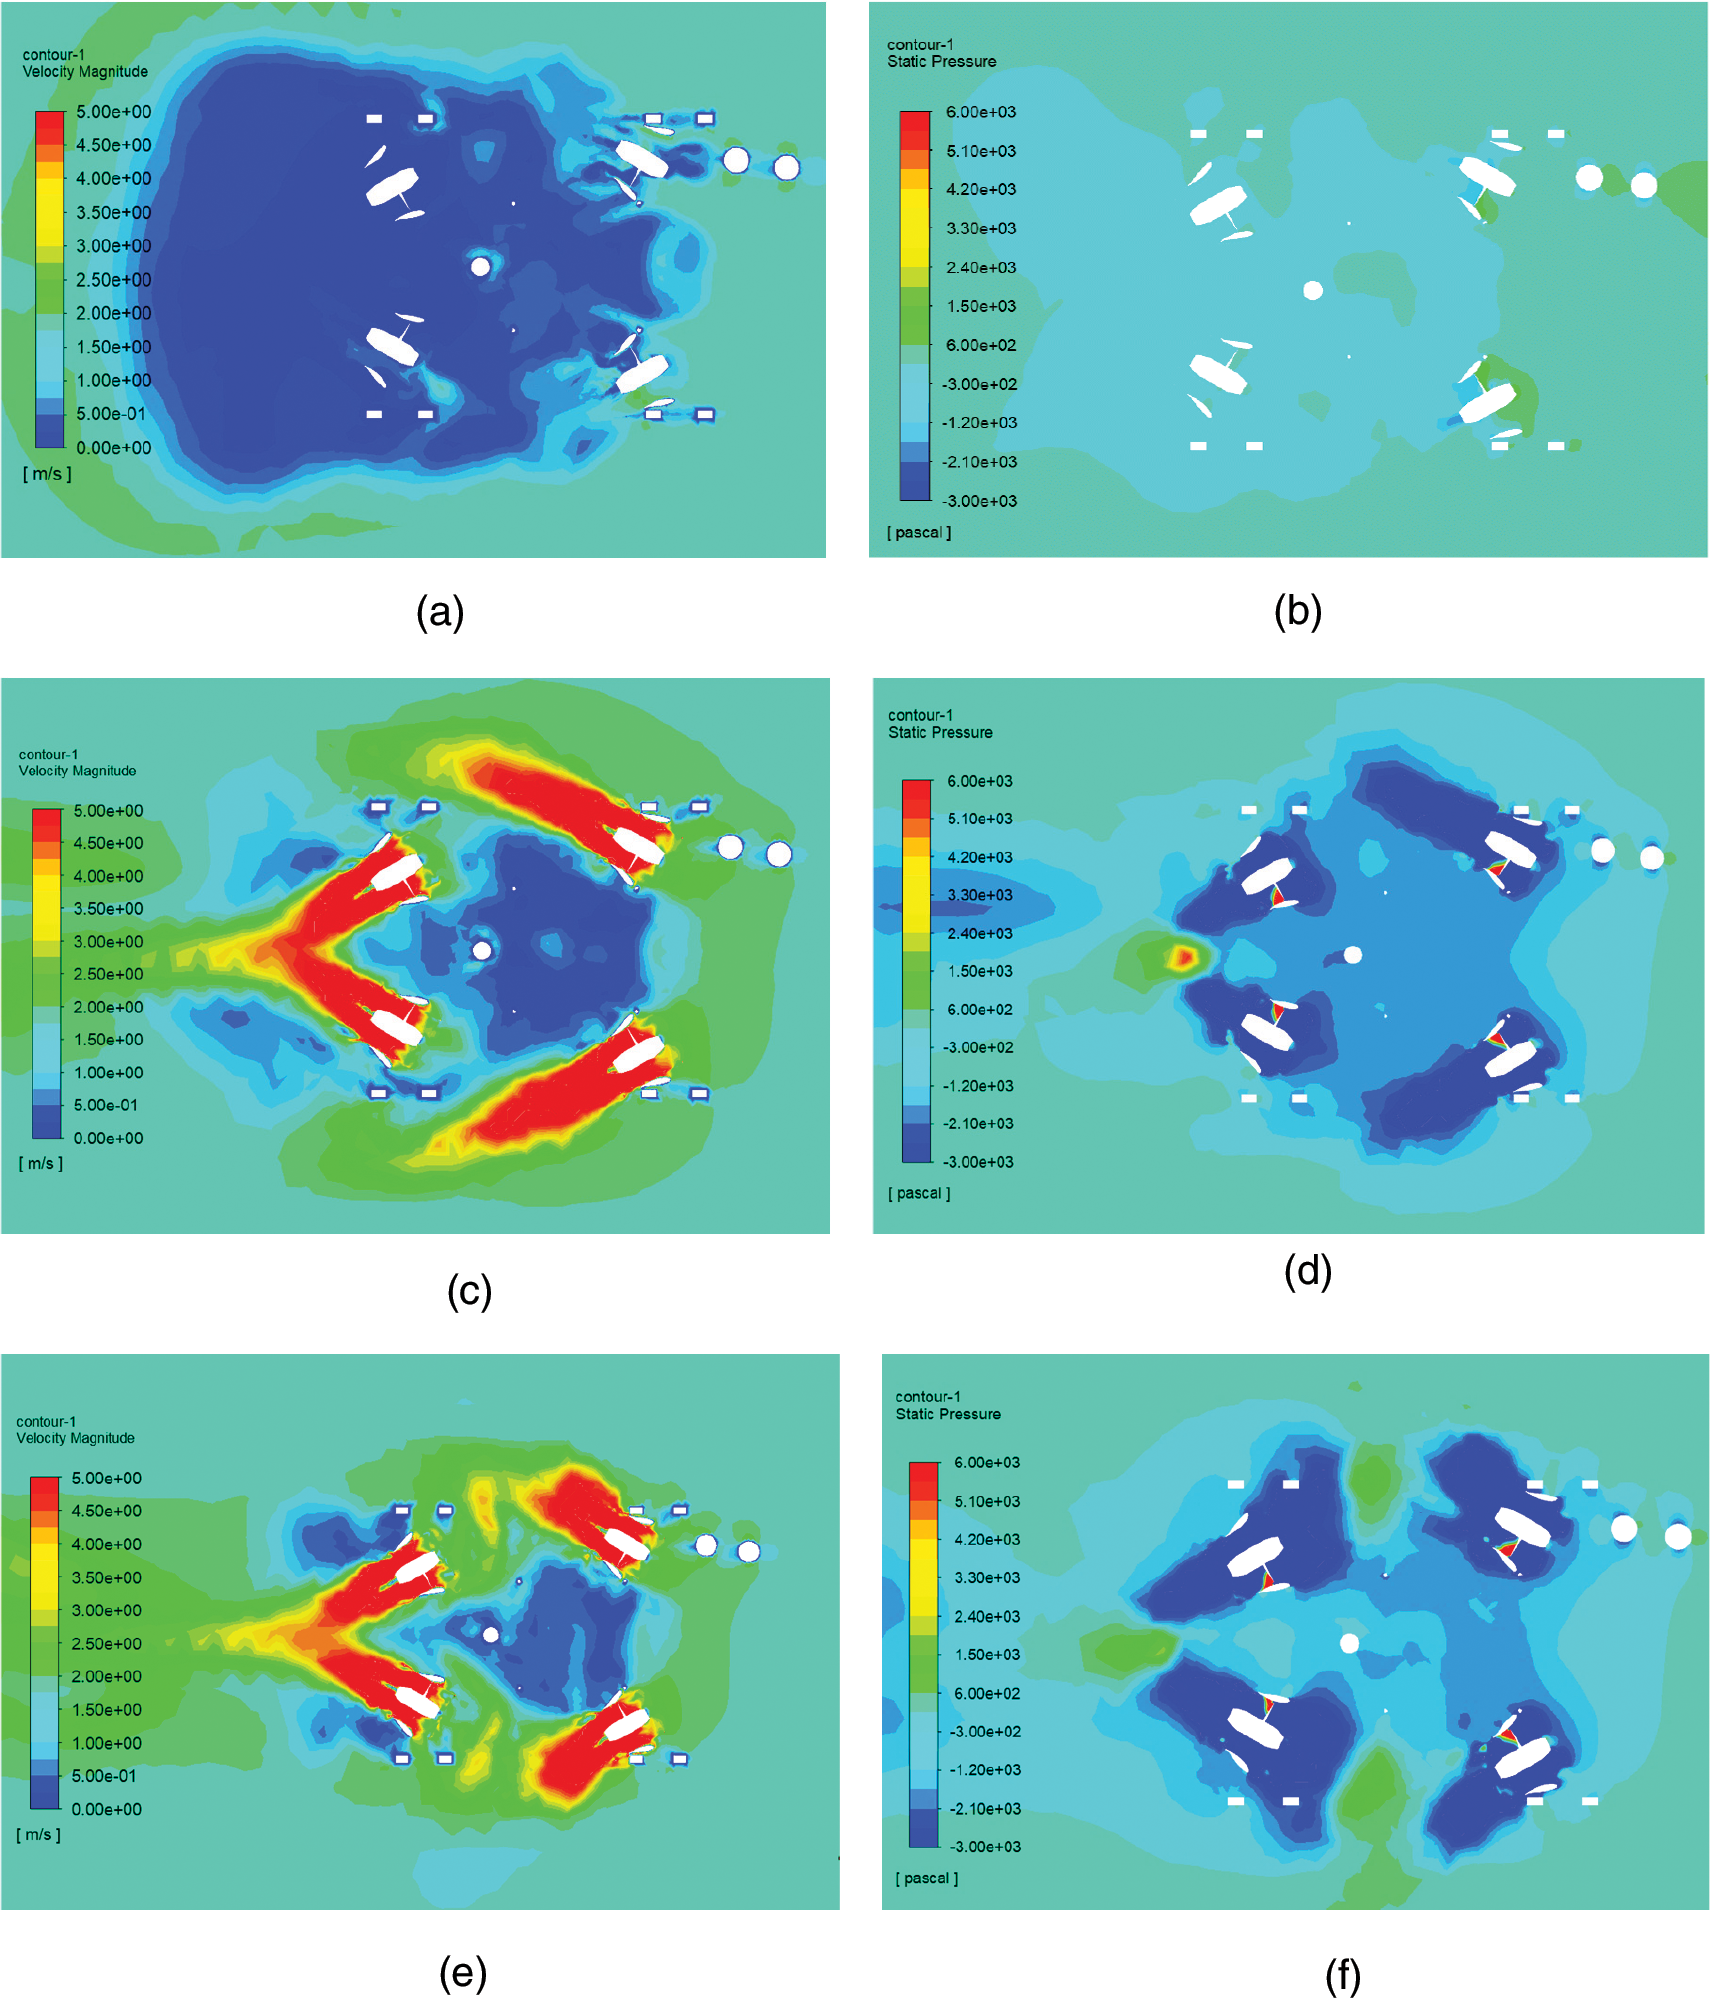
Figure 11: Velocity and pressure distribution on the horizontal plane passing through the horizontal propellers under the water current of 1.5 m/s (a) Velocity distribution with all propellers stopped (b) Pressure distribution with all propellers stopped (c) Velocity distribution with horizontal propellers operating (d) Pressure distribution with horizontal propellers operating (e) Velocity distribution with all propellers operating (f) Pressure distribution with all propellers operating
Fig. 12 illustrating the velocity and pressure distribution on the longitudinal axis shows that, under the influence of oblique water flow, there is a significant area of low pressure under the robot because of the buoyancy block’s blocking action. After the propeller works, the water flow at the bottom of the buoyancy material accelerates, and the pressure in this region is further reduced according to the Bernoulli effect.
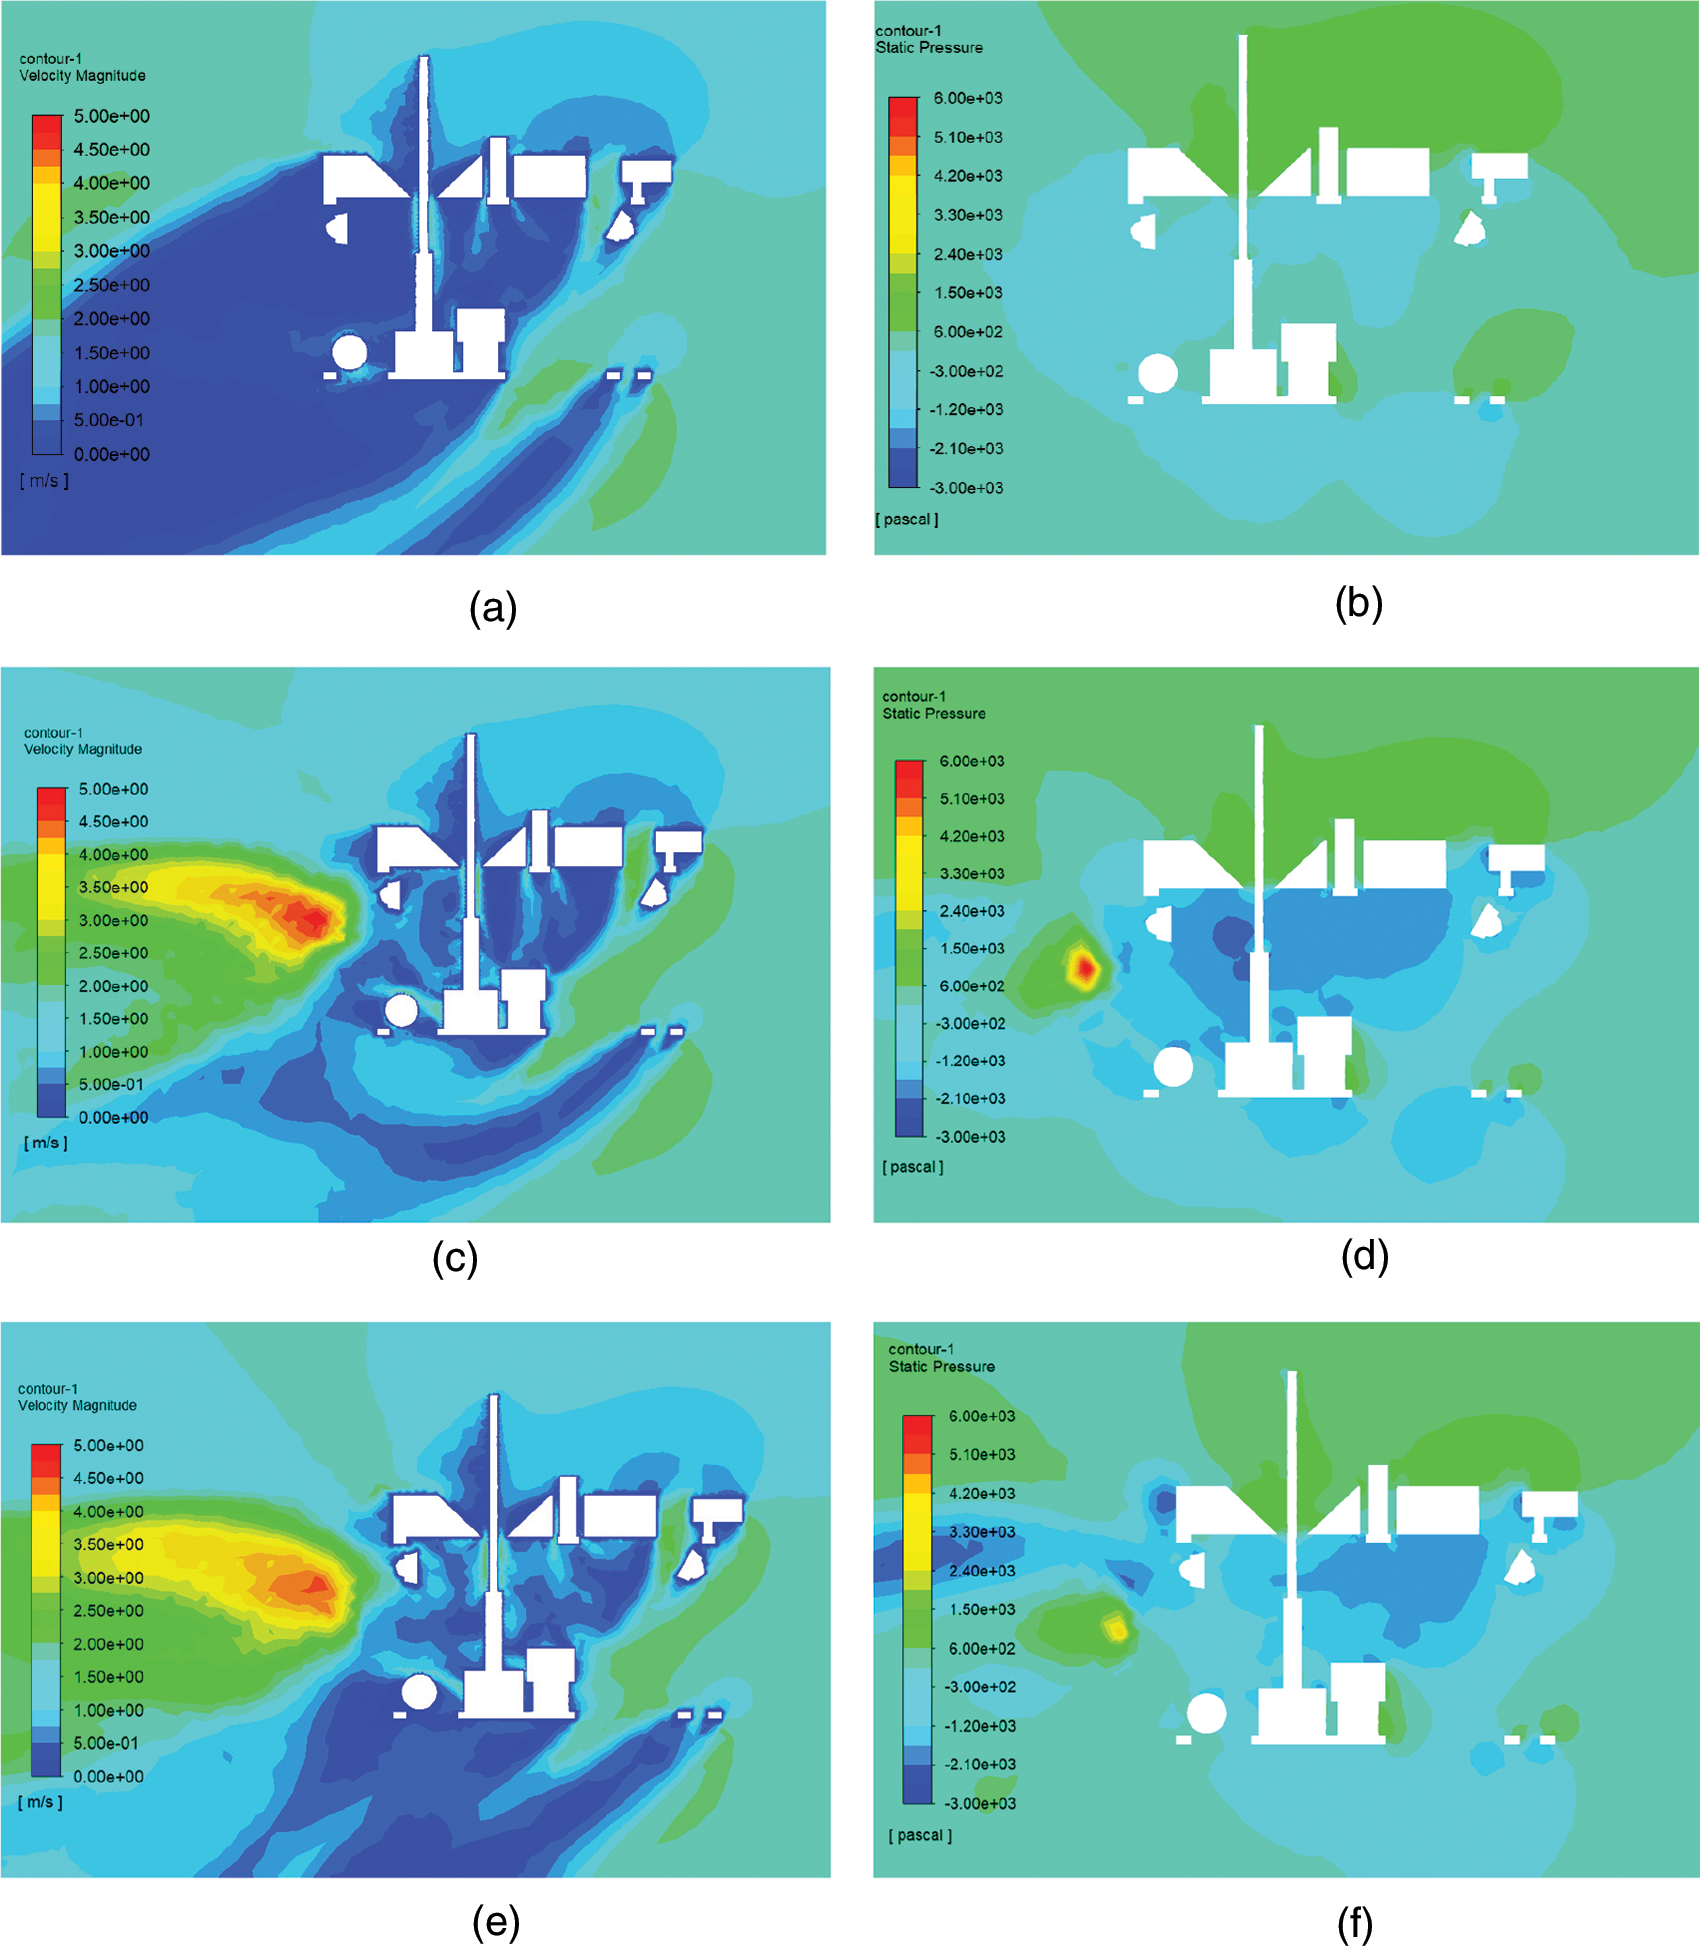
Figure 12: Velocity and pressure distribution on the vertical plane passing through the axis of the ROV under the water current of 1.5 m/s. (a) Velocity distribution with all propellers stopped (b) Pressure distribution with all propellers stopped (c) Velocity distribution with horizontal propellers operating (d) Pressure distribution with horizontal propellers operating (e) Velocity distribution with all propellers operating (f) Pressure distribution with all propellers operating
Similar to the horizontal resistance in a horizontal environment, the horizontal resistance value of the ROV increases significantly after the thruster is operated, as shown in Fig. 13. Notably, compared to the situation in which only the horizontal propeller is working, the horizontal resistance of the ROV rose by more than 600 N when the vertical propeller was functioning. With the increase of flow field velocity, the increase of horizontal resistance also became larger. The comparison of vertical resistance is consistent with the conclusion of the previous analysis. Due to the action of the buoyancy block, the vertical resistance greatly rises in comparison to the horizontal flow under the same flow field velocity condition. The value of the vertical resistance can be observed to rise after the horizontal thruster has operated, roughly in proportion to the rise in horizontal flow. The vertical thrusters no longer significantly reduce vertical drag.
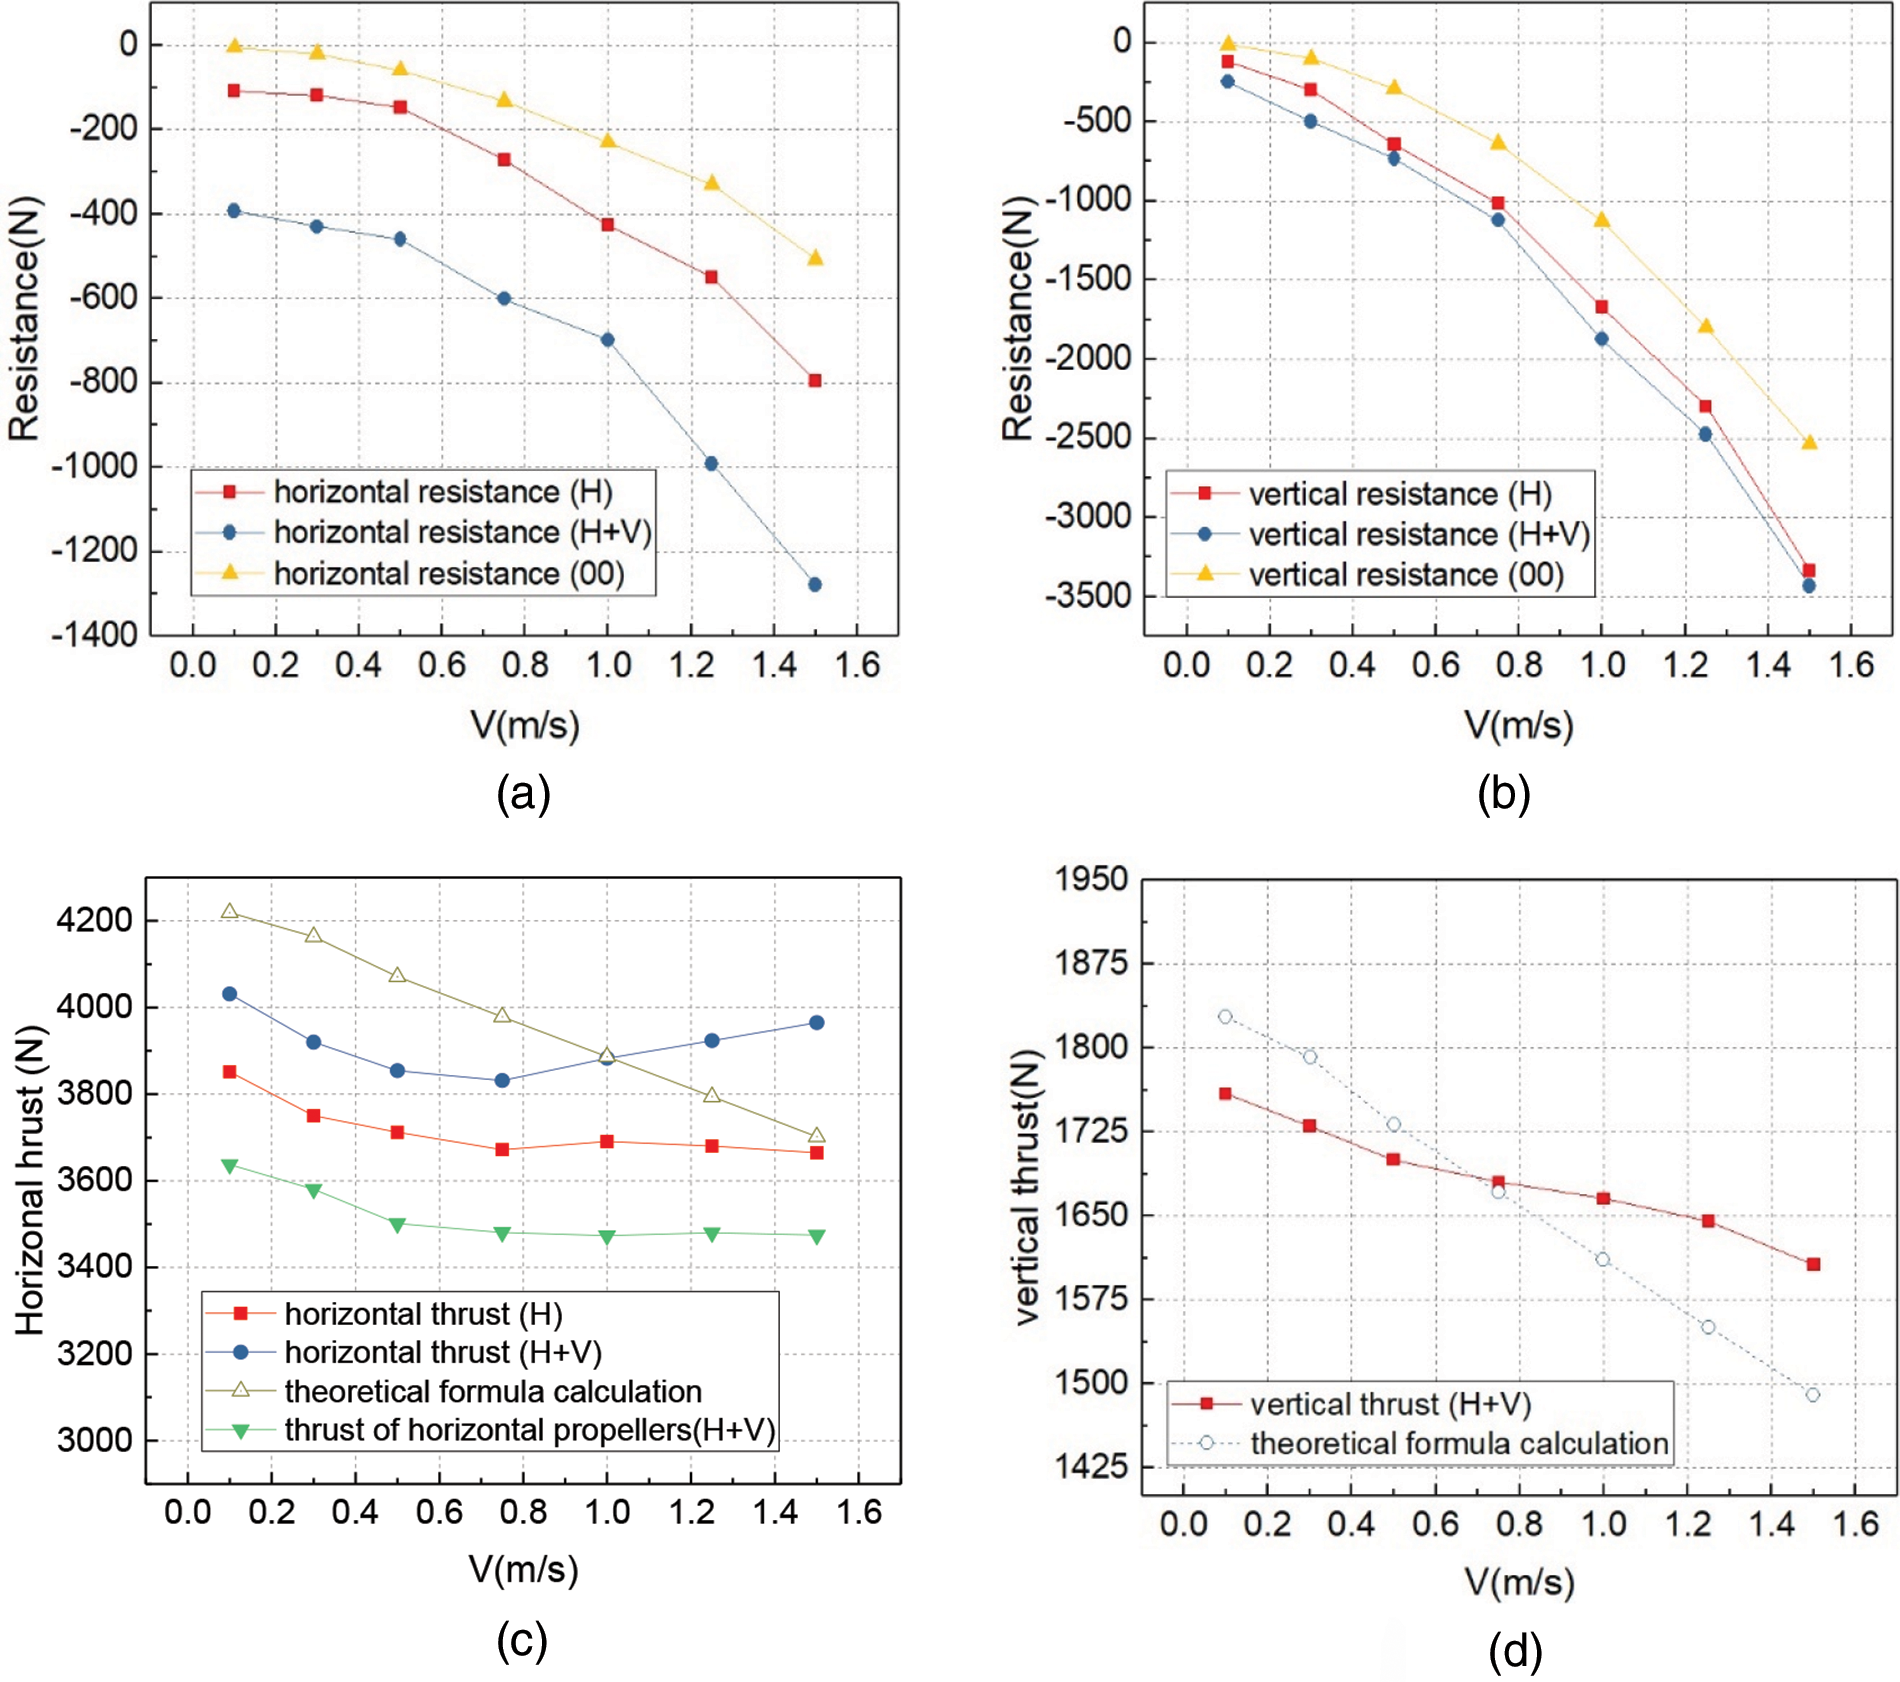
Figure 13: Resistance and thrust (a) Horizontal resistance of the ROV (b) Vertical resistance of the ROV (c) Horizontal thrust of the propellers (d) Vertical thrust of the propellers
Similar to horizontal flow, the horizontal thrust declines as the flow rate rises, although the rate of drop is slower than the theoretical value. The operation of the vertical thruster increases the overall horizontal thrust of the thruster, and increases with the increase of water velocity. Compared with Figs. 13 and 9, the resultant horizontal thrust of the thruster in oblique flow with the same flow velocity is decreased compared with the horizontal flow condition, but the horizontal thrust of the horizontal propeller is increased. The buoyancy block alters the flow field around the propeller because the vertical propeller interacts with the horizontal propeller less, and the horizontal thrust is enhanced by the low horizontal velocity drop. With a rise in water velocity, the vertical propeller’s impact on horizontal thrust increases. According to Fig. 13, when water velocity increases, the flow entering the vertical propeller also increases and the vertical propeller’s thrust drops. The thrust drop rate of the vertical propeller is slower than predicted by theory, similar to the horizontal propeller.
3.3 Hydrodynamic Simulation Results under Vertical Flow
By varying the inlet conditions, the thruster operation of the ROV in vertical flow is simulated and the ROV resistance and thruster thrust are analyzed at flow velocities ranging from 0.1 to 1.5 m/s. As shown in Fig. 14, when flowing from top to bottom, almost all the path lines on the surface of the robot structure enter the ROV structure, forming many chaotic vortices in the frame. This turbulence will disturb the horizontal propellers mounted under the buoyancy block. When only the horizontal propellers are operating, under the influence of vertical flow, the wake of the horizontal propellers produces obvious downward deflection near the downstream of the propellers. At this time, there is almost no interference between horizontal propellers. Due to the vertical flow, only a small amount of path lines flow from the vertical propeller into the horizontal downstream propeller when the vertical propeller is operating. The vertical thruster has the least interference with the horizontal thruster under the vertical flow condition. Under the influence of the buoyancy block, the wake of the vertical propeller does not discernibly interfere with the horizontal propeller.
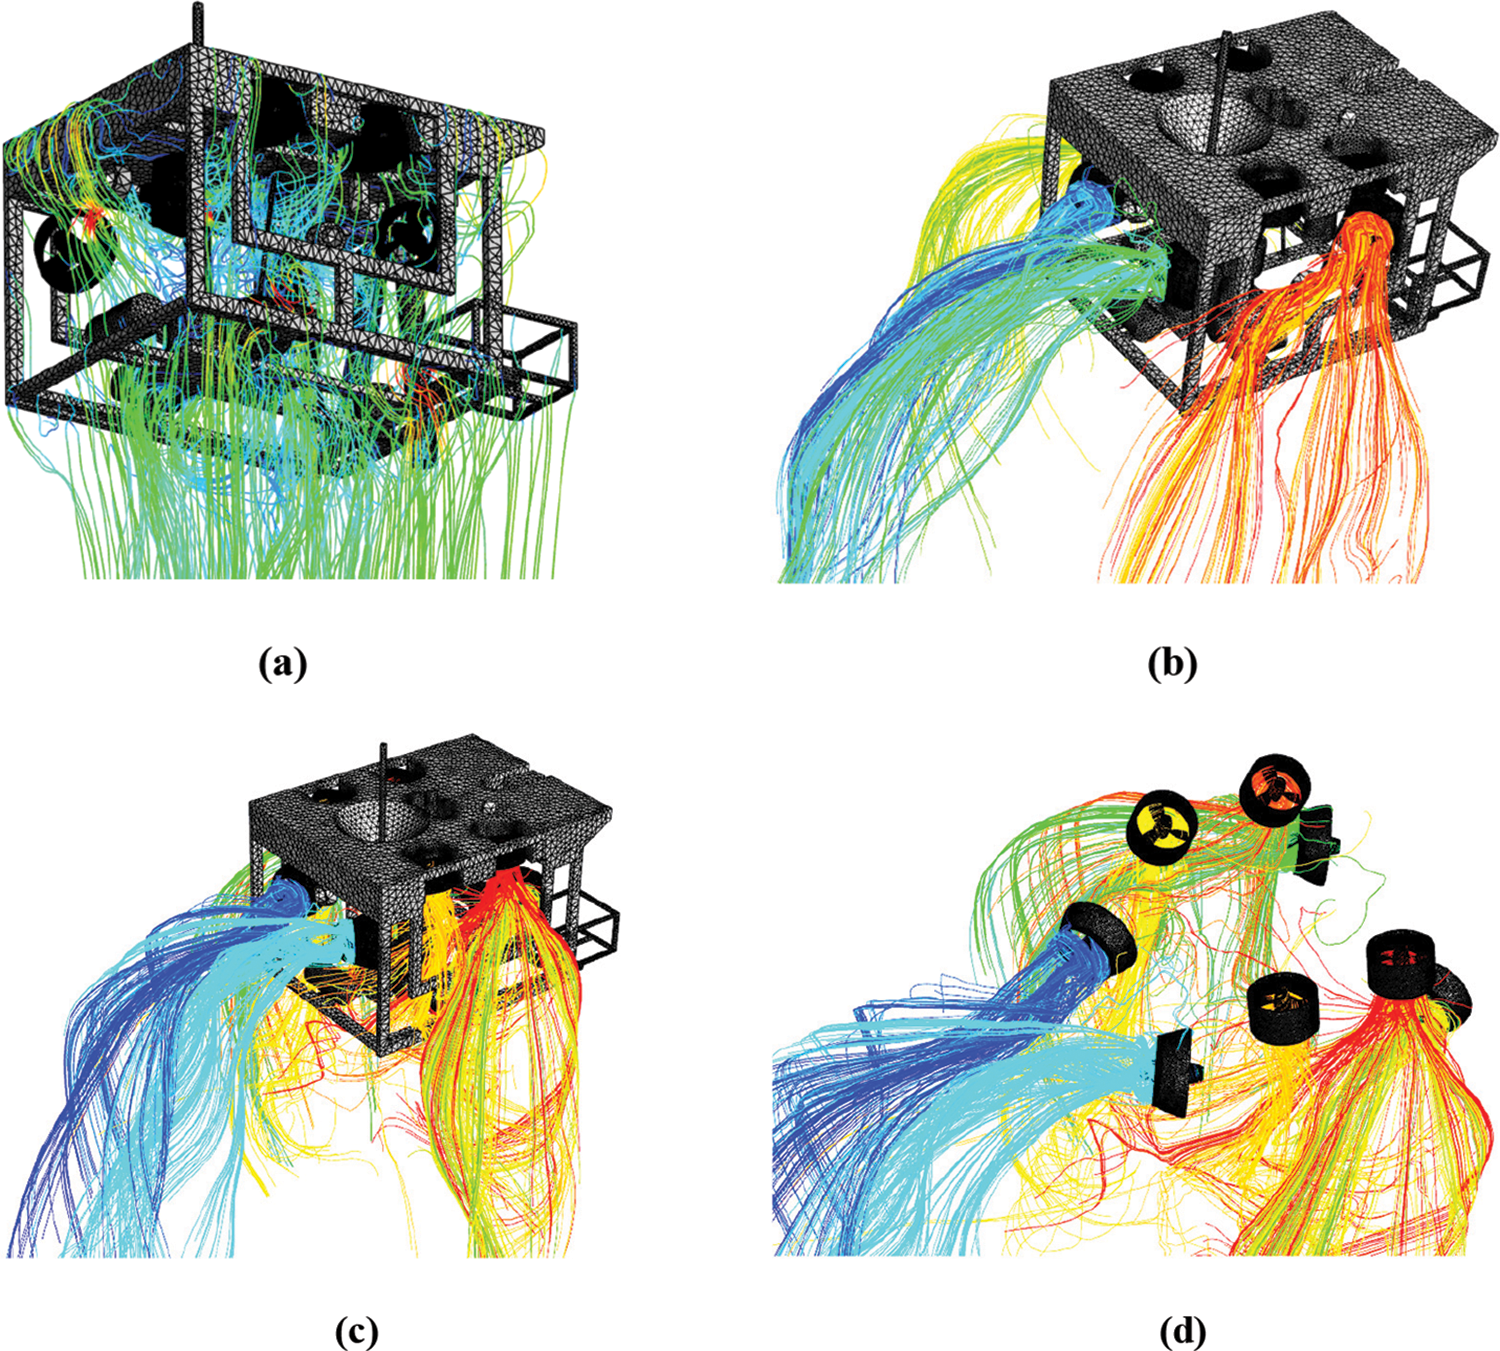
Figure 14: Path lines from the surface or propellers of the ROV at 1.5 m/s (a) All propellers stopped (b) Horizontal propellers rotating (c) Horizontal and vertical propellers both rotating (d) Horizontal and vertical propellers rotating details
Under the influence of the buoyancy block, the horizontal propeller is enveloped by a turbulent region. It can be seen from Fig. 15 that the water flow around the horizontal propeller has a slow speed and low pressure, and the influence of the environmental water flow on the horizontal propeller is weakened. After vertical propeller operation, the high-speed region generated by the wake flow is far away from horizontal propeller, so the thrust has less interference with the horizontal propeller.
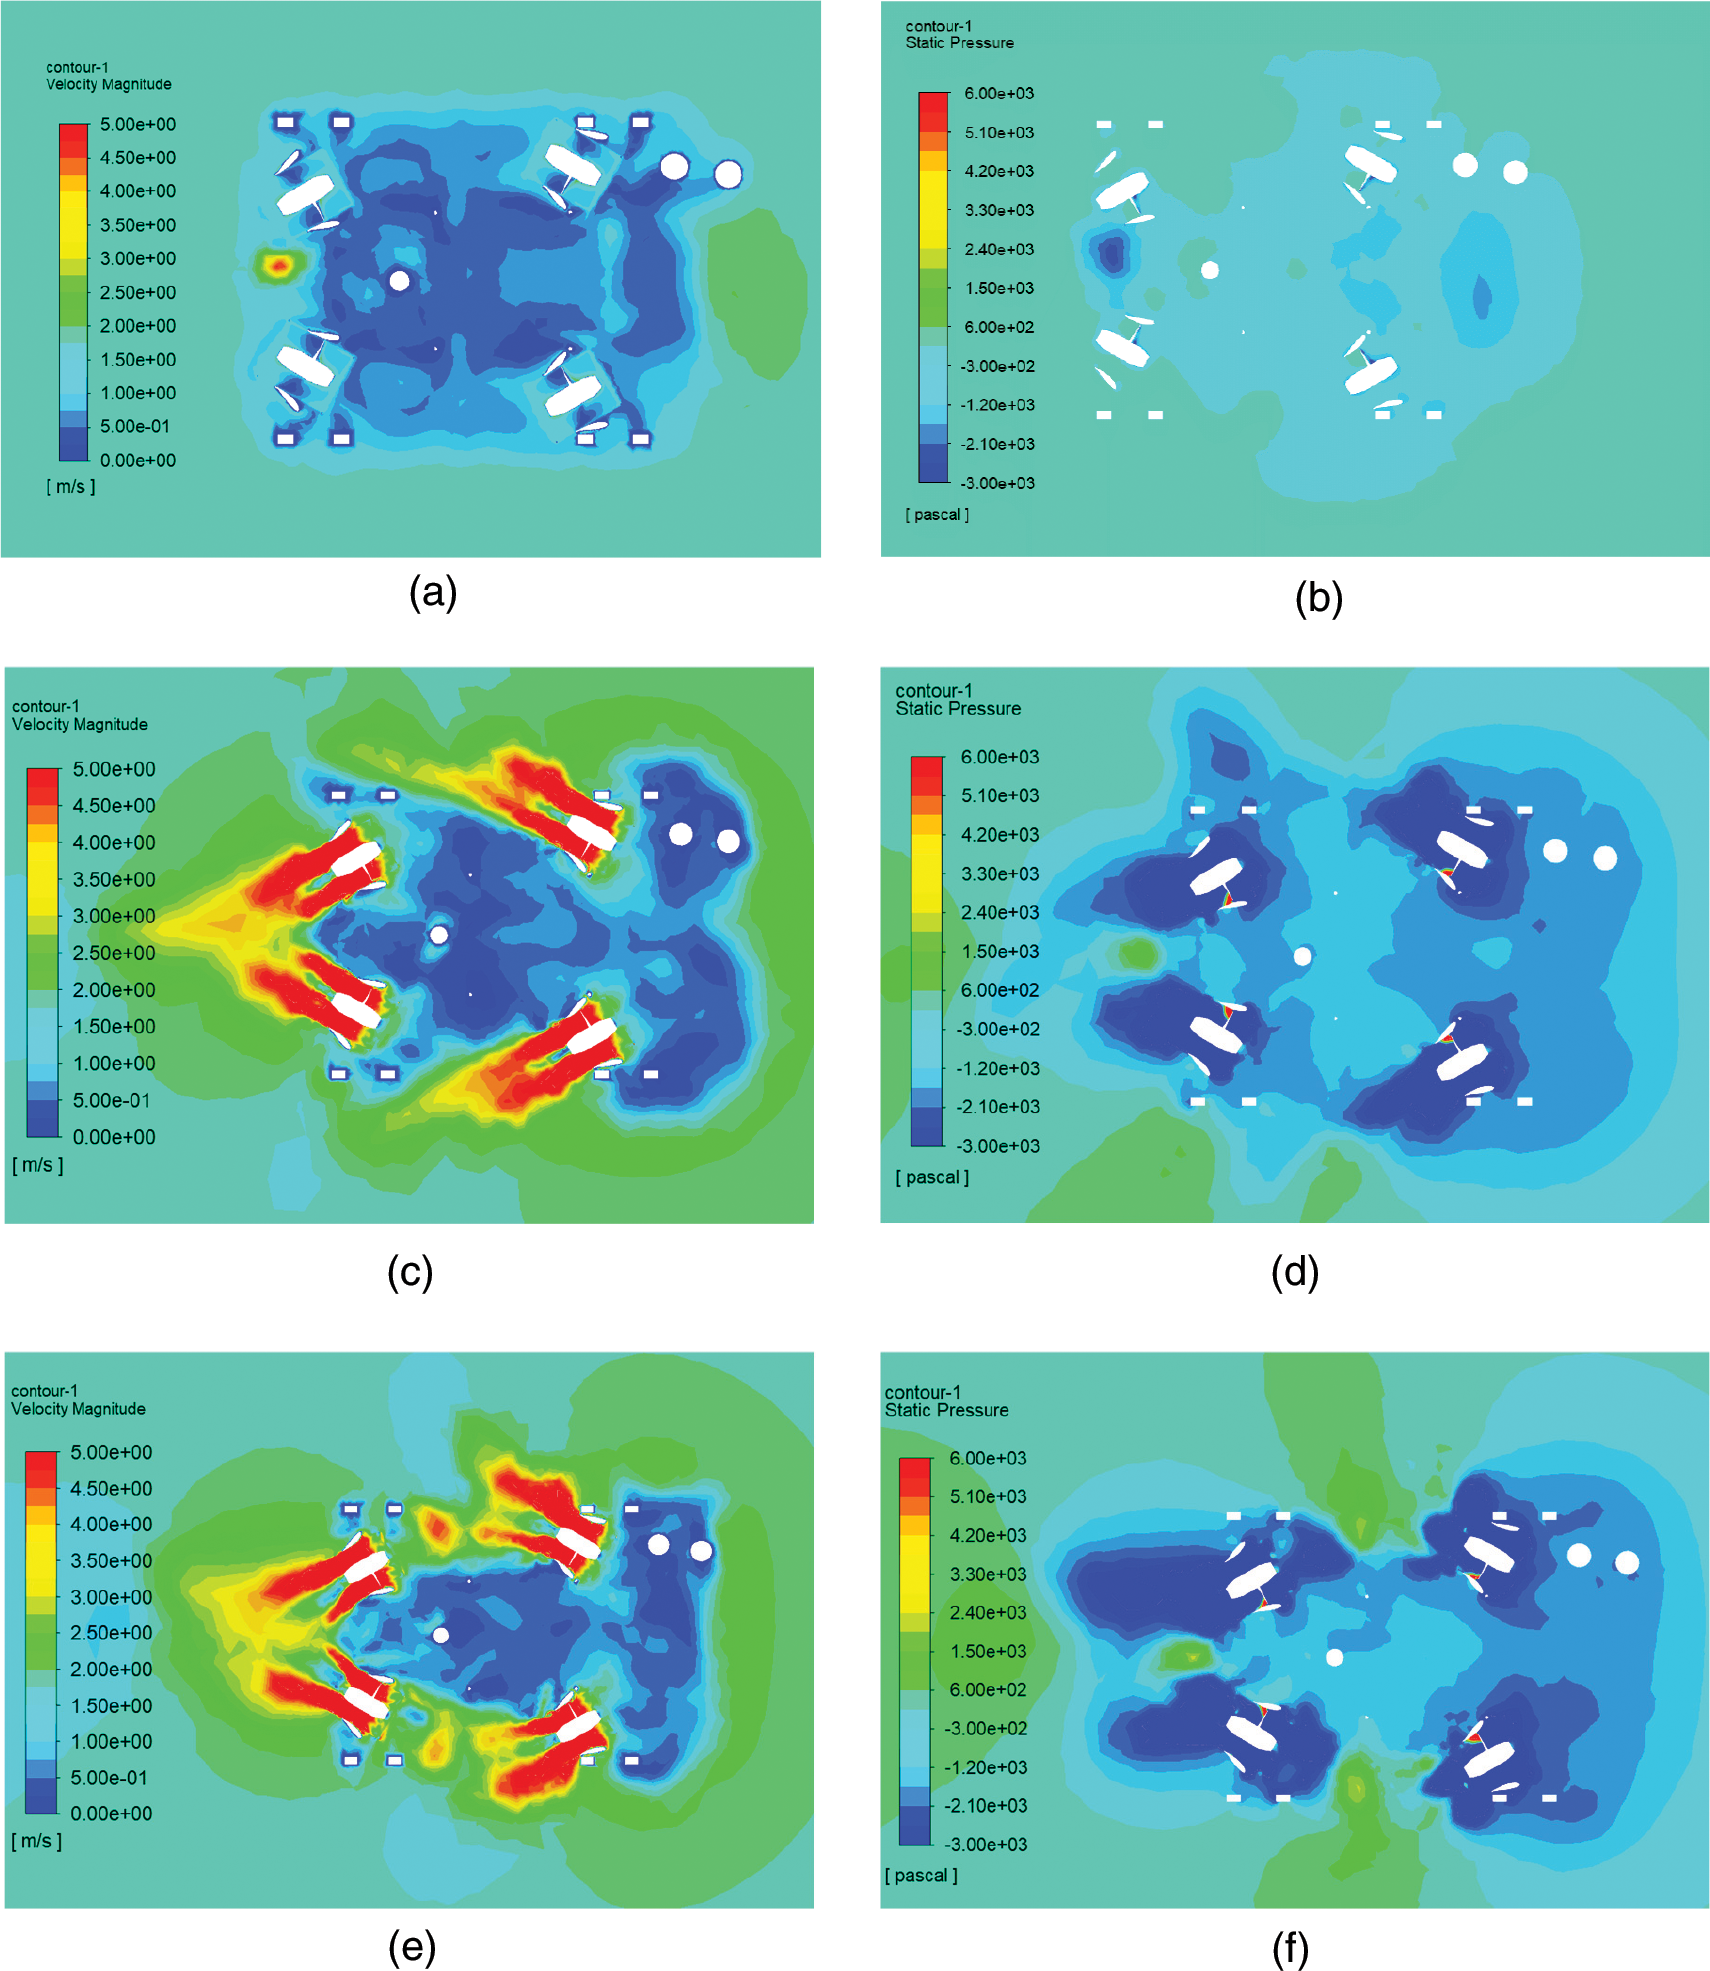
Figure 15: Velocity and pressure distribution on the horizontial plane passing through the horizontial propellers at 1.5 m/s. (a) Velocity distribution with all propellers stopped (b) Pressure distribution with all propellers stopped (c) Velocity distribution with horizontal propellers operating (d) Pressure distribution with horizontal propellers operating (e) Velocity distribution with all propellers operating (f) Pressure distribution with all propellers operating
The pressure at the bottom of the buoyancy block is comparatively low under vertical flow when the propeller is not rotating, as illustrated in Fig. 16, and the vertical resistance on the ROV is higher. When the horizontal thruster rotates, the velocity of the water below the buoyancy block increases, and the pressure in this region decreases, resulting in an increased vertical resistance on the ROV. The rotation of the vertical propeller had no significant effect on the pressure distribution between the upper and lower parts of the ROV.
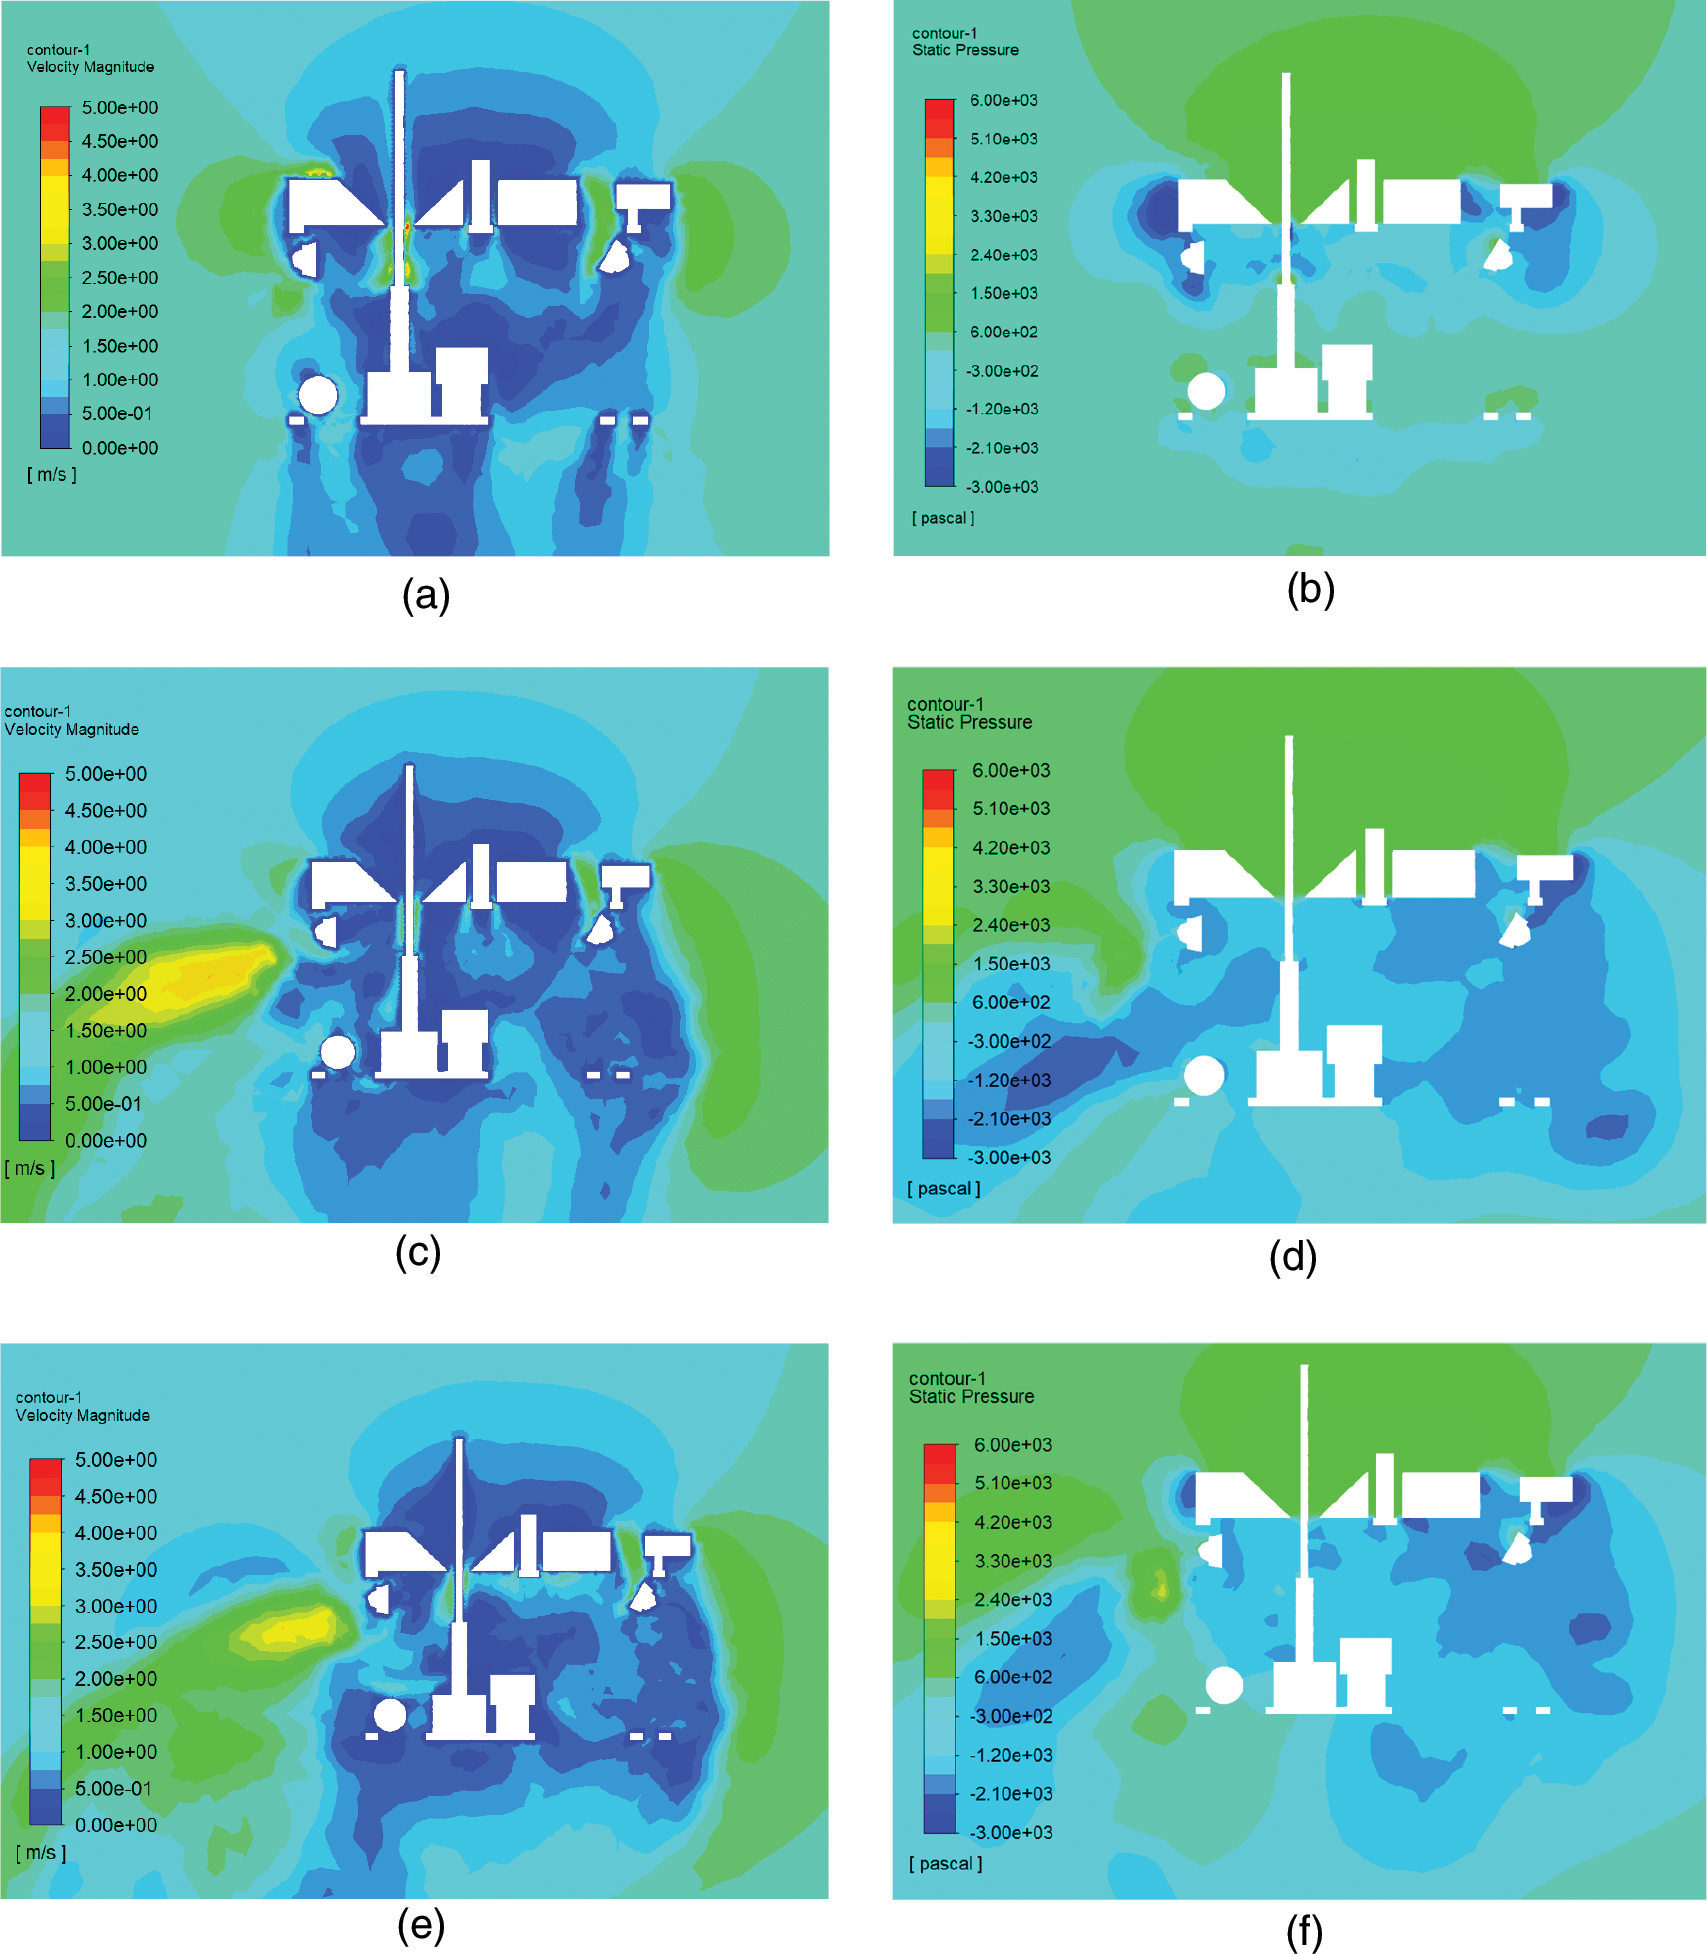
Figure 16: Velocity and pressure distribution on the vertical plane passing through the axis of the ROV under the water current of 1.5 m/s. (a) Velocity distribution with all propellers stopped (b) Pressure distribution with all propellers stopped (c) Velocity distribution with horizontal propellers operating (d) Pressure distribution with horizontal propellers operating (e) Velocity distribution with all propellers operating (f) Pressure distribution with all propellers operating
Fig. 17a reveals the horizontal resistance under this flow. Because the current velocity has no horizontal component, the horizontal resistance is low. When the propellers rotate, due to the change of the flow field, the horizontal resistance changes direction. The vertical resistance of the ROV is the greatest under vertical flow. Similar to the previous situation, the operation of the horizontal thrusters increases the vertical resistance. As shown in Fig. 17c, the rotation of the vertical propeller increases the horizontal thrust in a similar way to the oblique flow in Fig. 13c. As the current velocity increases, the horizontal thrust increases under the influence of the vertical propeller. Different from horizontal flow and oblique flow, in vertical flow, the horizontal thrust with only the horizontal propeller operating is similar to that with both the horizontal and vertical propellers operating. Therefore, the vertical propeller has less interference to the horizontal propeller thrust in vertical flow. The thrust variation of a vertical propeller is similar to that of an oblique flow, but the thrust of a vertical propeller drops more at the same velocity.
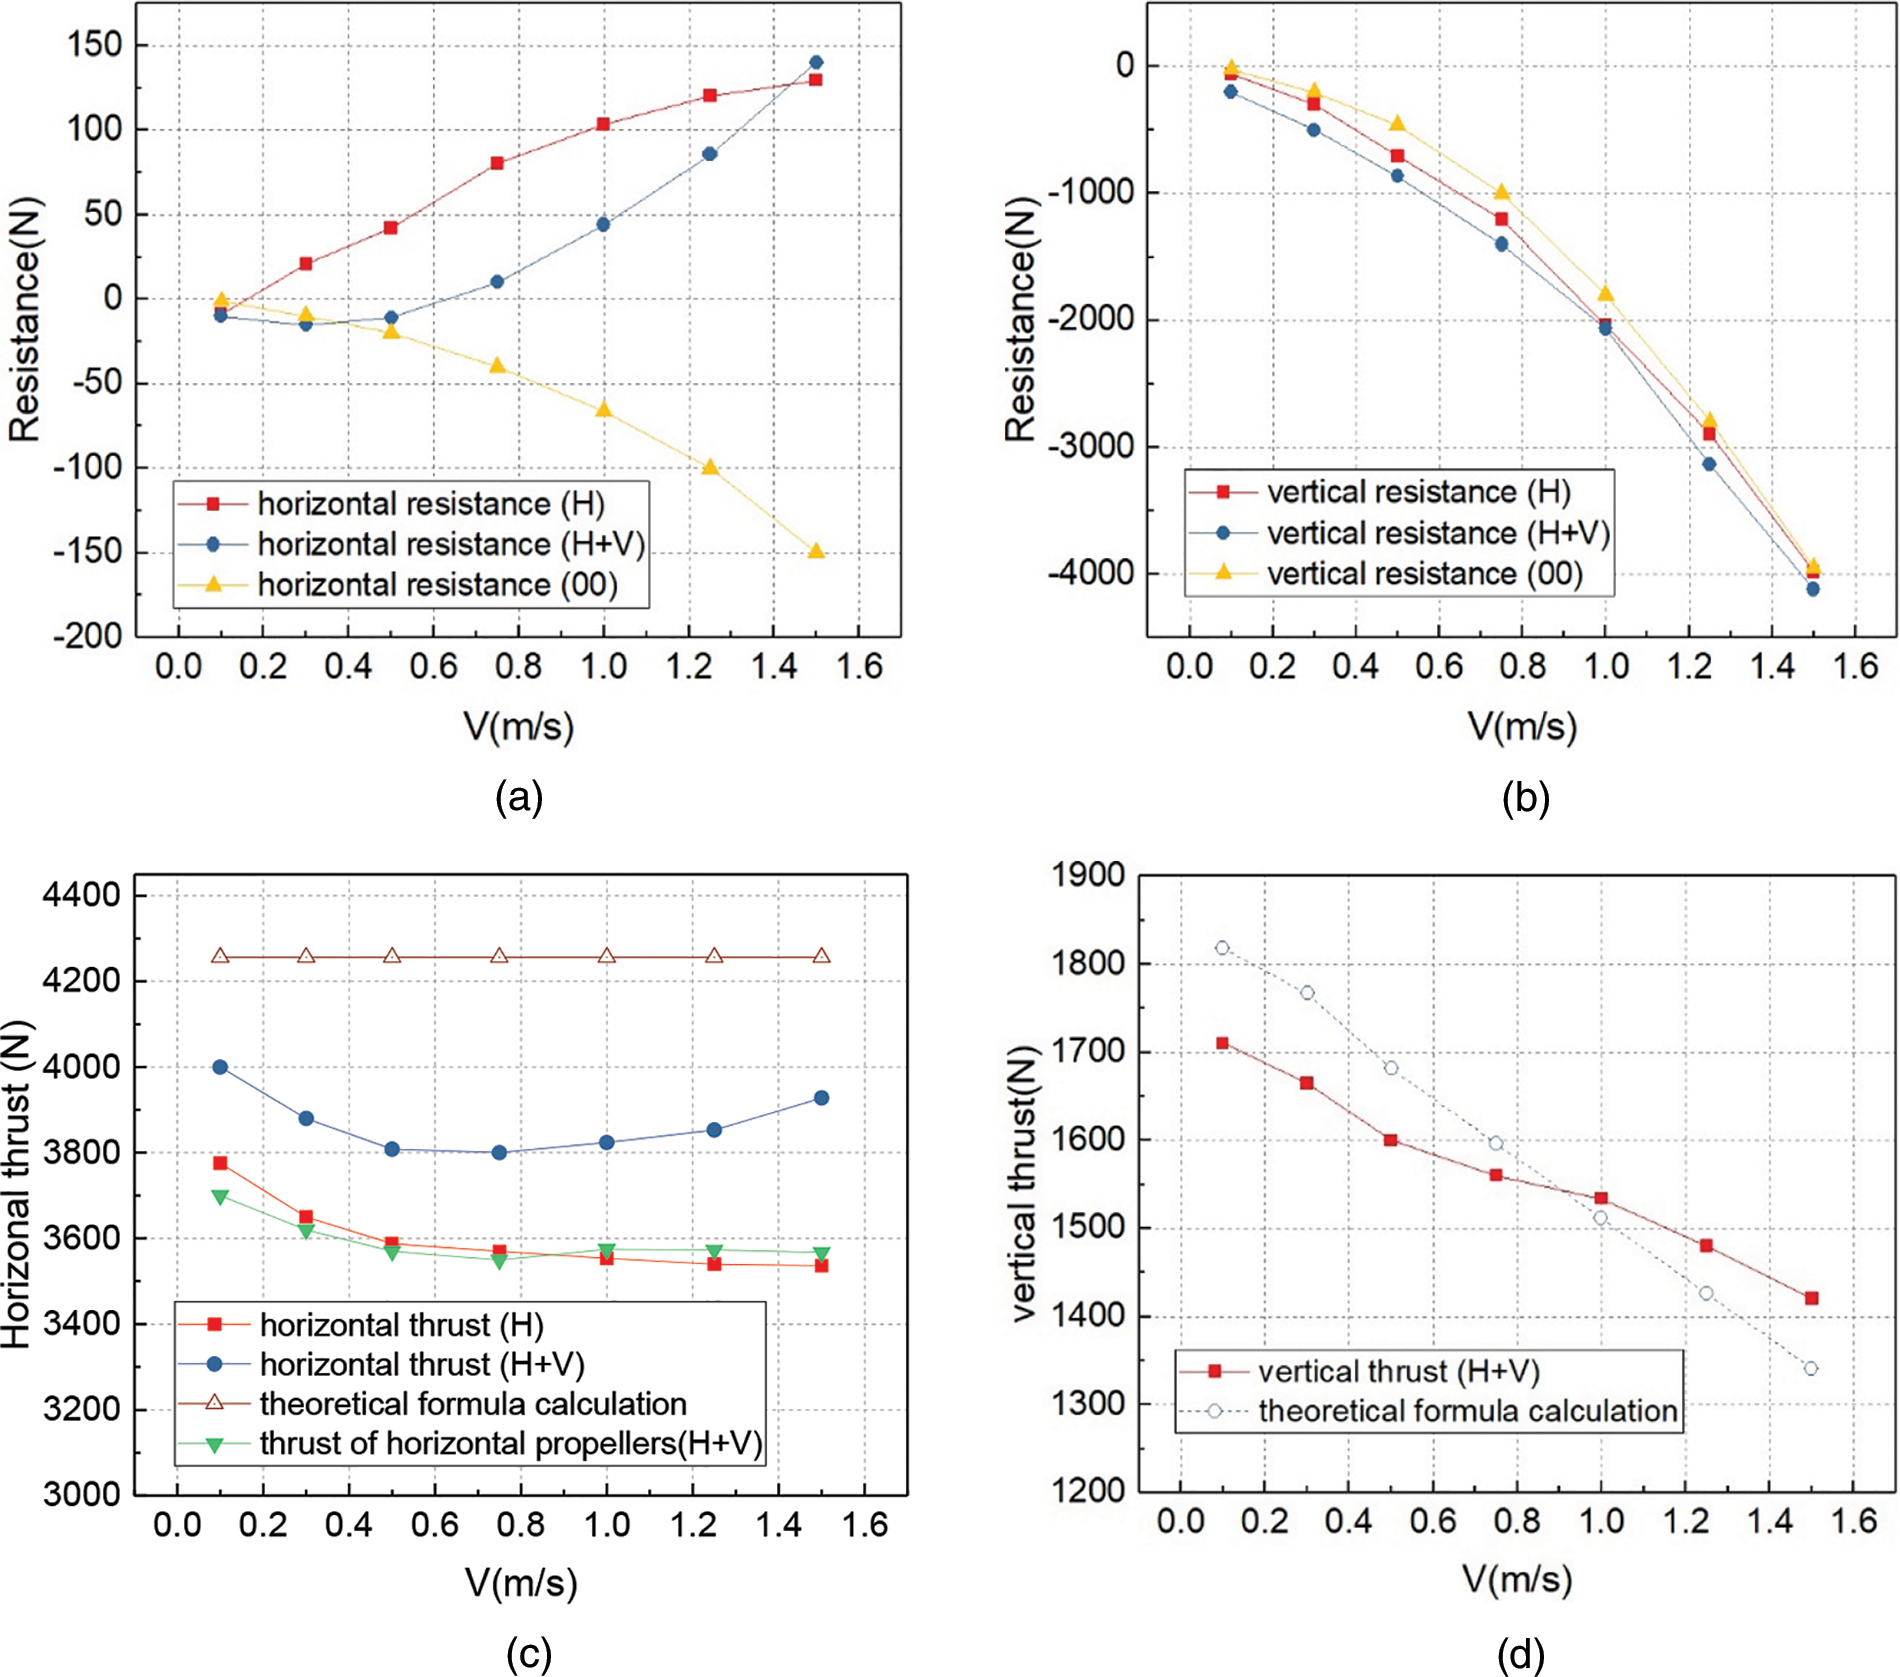
Figure 17: Resistance and thrust (a) Horizontal resistance of the ROV (b) Vertical resistance of the ROV (c) Horizontal thrust of propellers (d) Vertical thrust of propellers
Based on the RANS model, the interaction between the horizontal and vertical propellers and the interaction between the propellers and the ROV are simulated. The hydrodynamic characteristics of the ROV under three different water flow directions were analyzed with the joint action of the propellers as the variable. The conclusions are as follows:
(1) In a favorable attitude, the ROV can provide sufficient thrust to stabilize itself in a flow of 2.6 m/s. In oblique and vertical flows, the ROV can maintain stability in a flow environment of 0.9 m/s while maintaining horizontal thrust.
(2) The horizontal thrust of the propeller decreases with the increase of flow velocity, but the relationship between thrust and flow velocity is not linear and the rate of thrust decline is lower than the theoretical value. The vertical flow also decreases the horizontal thrust of the propeller. Compared with oblique flow and vertical flow, the horizontal thrust of the propeller decreases more in horizontal flow.
(3) The thrust of the horizontal propeller is affected by the direction and speed of water flow. The inlet velocity of the upstream thruster is greatly affected by the water flow and the thrust changes greatly. Due to the influence of the buoyancy block and the upstream thruster on the water flow, the downstream thruster has a lower speed, so the thrust is less affected by the water flow.
(4) The thrust of the horizontal propeller is affected by the vertical propeller. As the vertical propeller pushes down, the horizontal thrust of the propeller increases. At lower flow velocity, the horizontal thrust increases by about 5%. The higher the flow velocity, the greater the increase in horizontal thrust.
(5) Propeller rotation affects the vertical and horizontal resistance of the ROV. At horizontal flow, the lift of the ROV is significantly reduced due to the horizontal propeller, with the maximum lift reduction being about 500 N. At oblique flow, the vertical drag increases significantly under the influence of the horizontal propeller, and the maximum drag increment is about 800 N. The effect of the propeller on the horizontal resistance is more significant in both vertical and oblique flow conditions.
Due to the limitation of computational conditions, the numerical analysis model ignores the structural details, and the results obtained by RANS model are not accurate enough. As computer performance improves, more accurate numerical models can be built and more accurate turbulence models can be used to analyze the problem.
Funding Statement: This work is supported by the Major Special Science and Technology Project (2019B10076) of “Ningbo Science and Technology Innovation 2025”.
Availability of Data and Materials: The data used to support the findings of this study are included within the article and are also available from the corresponding author upon request.
Conflicts of Interest: The authors declare that they have no conflicts of interest to report regarding the present study.
References
1. Wang, Z., Qiu, W. (2021). Characteristics of wave forces on pile group foundations for seacrossing bridges. Ocean Engineering, 235, 109299. https://doi.org/10.1016/j.oceaneng.2021.109299 [Google Scholar] [CrossRef]
2. Hammoud, A., Sahili, J., Madi, M., Maalouf, E. (2021). Design and dynamic modeling of ROVs: Estimating the damping and added mass parameters. Ocean Engineering, 239(4), 109818. https://doi.org/10.1016/j.oceaneng.2021.109818 [Google Scholar] [CrossRef]
3. Xiao, S., Lin, K., Liu, H., Zhou, A. (2021). Performance analysis of monopile-supported wind turbines subjected to wind and operation loads. Renewable Energy, 179(1–4), 842–858. https://doi.org/10.1016/j.renene.2021.07.055 [Google Scholar] [CrossRef]
4. Landstad, O., Halvorsen, H., Øveraas, H., Smines, V., Johansen, T. (2021). Dynamic positioning of rov in the wave zone during launch and recovery from a small surface vessel. Ocean Engineering, 235(3), 109382. https://doi.org/10.1016/j.oceaneng.2021.109382 [Google Scholar] [CrossRef]
5. Zou, X., Cao, X., Zhou, C., Zhou, M., Zhang, X. (2021). Experimental study on the bearing capacity of large-diameter monopile in sand under water flow condition. Ocean Engineering, 224(3), 108708. https://doi.org/10.1016/j.oceaneng.2021.108708 [Google Scholar] [CrossRef]
6. Zhang, Q., Zhang, Y., Lin, H., Feng, L. (2021b). Numerical investigation on bearing capacity of OWT foundation with large diameter monopile under Seismic load. Applied Ocean Research, 108(7), 102518. https://doi.org/10.1016/j.apor.2020.102518 [Google Scholar] [CrossRef]
7. Fan, X. M., Nong, D. P., Cao, S. Y. (2013). Construction quality control for large diameter and very long bored piles in deep water. World Bridges, 41(5), 39–43. https://doi.org/10.3969/j.issn.1671-7767.2013.05.010 [Google Scholar] [CrossRef]
8. Lubis, M. B., Kimiaei, M., Efthymiou, M. (2021). Alternative configurations to optimize tension in the umbilical of a work class rov performing ultra-deep-water operation. Ocean Engineering, 225(3), 108786. https://doi.org/10.1016/j.oceaneng.2021.108786 [Google Scholar] [CrossRef]
9. Zhao, C., Thies, P. R., Johanning, L. (2021). Investigating the winch performance in an ASV/ROV autonomous inspection system. Applied Ocean Research, 115, 102827. https://doi.org/10.1016/j.apor.2021.102827 [Google Scholar] [CrossRef]
10. Christ, R. D., Wernli Sr, R. (2018). The ROV manual: A user guide for remotely operated vehicles. UK: Elsevier. [Google Scholar]
11. Christ, R. D., Wernli Sr, R. L. (2011). The ROV manual: A user guide for observation class remotely operated vehicles. UK: Elsevier. [Google Scholar]
12. Zhou, B., Zhao, M. (2020). Numerical simulation of thruster-thruster interaction for rov with vector layout propulsion system. Ocean Engineering, 210(5), 107542. https://doi.org/10.1016/j.oceaneng.2020.107542 [Google Scholar] [CrossRef]
13. Johansen, T. A., Fossen, T. I. (2013). Control allocation—A survey. Automatica, 49(5), 1087–1103. https://doi.org/10.1016/j.automatica.2013.01.035 [Google Scholar] [CrossRef]
14. Fossen, T. I. (2011). Handbook of marine craft hydrodynamics and motion control. UK: John Wiley & Sons. [Google Scholar]
15. Sahili, J., Hamoud, A. E. H., Jammoul, A. (2018). ROV design optimization: Effect on stability and drag force. 2018 6th RSI International Conference on Robotics and Mechatronics (IcRoM), pp. 413–417. Tehran, Iran, IEEE. [Google Scholar]
16. Soylu, S., Buckham, B. J., Podhorodeski, R. P. (2008). A chattering-free sliding-mode controller for underwater vehicles with fault-tolerant infinity-norm thrust allocation. Ocean Engineering, 35(16), 1647–1659. https://doi.org/10.1016/j.oceaneng.2008.07.013 [Google Scholar] [CrossRef]
17. Wu, B. W. (2017). Research on kinematics modeling and thrust allocation of work-class ROV (Master Thesis). Harbin Engineering University, Harbin. [Google Scholar]
18. Vartdal, M. L., Garen, M. R. (2001). A thruster system which improves positioning power by reducing interaction losses. Dynamic Positioning Conference, Houston, TX, USA. [Google Scholar]
19. Dang, J., Laheij, H. A. N. S. (2004). Hydrodynamic aspects of steerable thrusters. Dynamic Positioning Conference, pp. 1–33. Houston, USA. [Google Scholar]
20. Ye, L., Chang, X., Sun, S., Wang, C., Zhang, H. (2017). Differential propeller design for four-propeller ship. Journal of Harbin Engineering University, 38(5), 668–675. https://doi.org/10.11990/jheu.201512089 [Google Scholar] [CrossRef]
21. Yilmaz, N., Aktas, B., Atlar, M., Fitzsimmons, P. A., Felli, M. (2020). An experimental and numerical investigation of propeller-rudder-hull interaction in the presence of tip vortex cavitation (TVC). Ocean Engineering, 216(5), 108024. https://doi.org/10.1016/j.oceaneng.2020.108024 [Google Scholar] [CrossRef]
22. Yilmaz, N., Atlara, M., Khorasanchi, M. (2019). An improved mesh adaption and refinement approach to cavitation simulation (MARCS) of propellers. Ocean Engineering, 171(3), 139–150. https://doi.org/10.1016/j.oceaneng.2018.11.001 [Google Scholar] [CrossRef]
23. Su, Y. M., Ju, L., Yu, X. Z., Cui, T., Yan, D. J. (2013). Research on interaction between a large underwater carrier and a mini-underwater vehicle. Journal of Ship Mechanics, 17(3), 239–248. https://doi.org/10.3969/j.issn.1007-7294.2013.03.004 [Google Scholar] [CrossRef]
24. Sun, R., Ma, H. Y. (2010). Unsteady behaviors of two moving bodies through inviscid unbounded liquid. Journal of Hydrodynamics, 22, 1027–1032. https://doi.org/10.1016/S1001-6058(10)60070-4 [Google Scholar] [CrossRef]
25. Huyer, S., Grant, J. (2001). Simulation of UUV recovery hydrodynamics. Twenty-Third Symposium on Naval Hydrodynamics, pp. 833–847. France, Val de Reuil. [Google Scholar]
26. Gabl, R., Davey, T., Cao, Y., Li, Q., Li, B. et al. (2020). Experimental force data of a restrained rov under waves and current. Data, 5(3), 57. https://doi.org/10.3390/data5030057 [Google Scholar] [CrossRef]
27. Vartdal, M. L., Garen, M. R. (2001). A thruster system which improves positioning power by reducing interaction losses. Dynamic Positioning Conference, Houston, TX, USA. [Google Scholar]
28. Li, T. (2017). Numerical analysis of open water and self-propulsion performance of controllable pitch propeller (Master Thesis). Dalian, China: Dalian Maritime University. [Google Scholar]
29. Go, J. S., Yoon, H. S., Jung, J. H. (2017). Effects of a duct before a propeller on propulsion performance. Ocean Engineering, 136, 54–66. https://doi.org/10.1016/j.oceaneng.2017.03.012 [Google Scholar] [CrossRef]
30. Zhang, B., Lu, X., She, W. (2019). Resistance performance simulation of remotely operated vehicle in deep sea considering propeller rotation. Proceedings of the Institution of Mechanical Engineers, Part M: Journal of Engineering for the Maritime Environment, 234(2), 585–598. [Google Scholar]
31. ITTC (2017). Uncertainty analysis in CFD Verification and validation, methodology and procedures. Technical report 7.5-03-01-01, Revision 03. International Towing Tank Conference. https://www.ittc.info/media/8153/75-03-01-01.pdf [Google Scholar]
Cite This Article
 Copyright © 2023 The Author(s). Published by Tech Science Press.
This work is licensed under a Creative Commons Attribution 4.0 International License , which permits unrestricted use, distribution, and reproduction in any medium, provided the original work is properly cited.
 Downloads
 Citation Tools