
 Submit a Paper
 Propose a Special lssue
 Open Access
ARTICLE
Analysis of CH4 and H2 Adsorption on Heterogeneous Shale Surfaces Using a Molecular Dynamics Approach
1
Centre of Subsurface Imaging (CSI), Universiti Teknologi PETRONAS, Tronoh, Perak, Malaysia
2
Department of Geosciences, Universiti Teknologi PETRONAS, Bandar Seri Iskandar, Tronoh, Perak, Malaysia
3
Department of Pure & Industrial Chemistry, Faculty of Physical Sciences, Bayero University Kano, Kano, Nigeria
4
Department of Mechanical Engineering, Engineering Institute of Technology, Melbourne Campus Victoria, Melbourne, Australia
* Corresponding Author: Surajudeen Sikiru. Email:
Fluid Dynamics & Materials Processing 2024, 20(1), 31-44. https://doi.org/10.32604/fdmp.2023.029281
Received 10 February 2023; Accepted 24 July 2023; Issue published 08 November 2023
 View Full Text
 Download PDF
Abstract
Determining the adsorption of shale gas on complex surfaces remains a challenge in molecular simulation studies. Difficulties essentially stem from the need to create a realistic shale structure model in terms of mineral heterogeneity and multiplicity. Moreover, precise characterization of the competitive adsorption of hydrogen and methane in shale generally requires the experimental determination of the related adsorptive capacity. In this study, the adsorption of adsorbates, methane (CH4), and hydrogen (H2) on heterogeneous shale surface models of Kaolinite, Orthoclase, Muscovite, Mica, C60, and Butane has been simulated in the frame of a molecular dynamic’s numerical technique. The results show that these behaviors are influenced by pressure and potential energy. On increasing the pressure from 500 to 2000 psi, the sorption effect for CH4 significantly increases but shows a decline at a certain stage (if compared to H2). The research findings also indicate that raw shale has a higher capacity to adsorb CH4 compared to hydrogen. However, in shale, this difference is negligible.Keywords
Nomenclature
| CH4 | Methane |
| H2 | Hydrogen |
| DFT | Density functional theory |
| MD | Molecular Dynamics |
| GCMC | Grand canonical Monte Carlo |
| Θ | Angle |
| φ | Torsion angle |
| χ | Out-of-plane angle |
| Psi | Pounds per square inch |
| Kcal/mol | Kilocalorie per mole |
Shale gas extraction and utilization require a deep understanding of the adsorption and sorption behavior of this unconventional energy source [1–3]. Shale gas is composed of natural gas trapped within dense and impermeable shale rock formations. The interaction between gas molecules, such as methane (CH4), and shale surfaces plays a critical role in the recovery of shale gas [4]. Adsorption refers to the process where gas or liquid molecules adhere to the surface of a solid material, forming a monolayer [5,6]. This interaction is mainly driven by van der Waals forces, which are weak non-covalent interactions between the molecules and the solid surface. The amount of gas or liquid molecules adsorbed on a solid surface (e.g., adsorption of gas molecules on shale surfaces) is dependent on various factors such as surface area, porosity, chemical composition, temperature, and pressure [5,7,8]. Adsorption is widely used in various applications, such as air purification [9], water purification [10], and separation of gas mixtures [11]. Sorption, on the other hand, refers to the process where gas or liquid molecules are both absorbed and absorbed within the pores of a solid material. This process is also influenced by the same factors that affect adsorption, in addition to the pore size and shape. The sorption of gas molecules in shale pores is crucial in the storage and transport of shale gas [4]. The complexity and variability of shale surfaces pose significant challenges in modeling and predicting their adsorption and sorption behavior, leading to inconsistent results from experimental and modeling studies [12–15]. Researchers have employed various techniques, including molecular dynamics (MD) [16–19], grand canonical Monte Carlo (GCMC) [16,20,21], and density functional theory (DFT) [22–24] to study the adsorption and sorption of gases on shale surfaces. However, most studies have focused on modeling shale surfaces as a single component, ignoring the mineral heterogeneity of these surfaces, which has resulted in limitations in the accuracy of the results. To address these limitations, this study aims to simulate the adsorption and sorption behavior of CH4 and hydrogen (H2) on heterogeneous shale surface models, including Kaolinite, Orthoclase, Muscovite, Mica, C60, and Butane, using MD simulation. MD is a simulation method used to study the motion of individual atoms and molecules. It calculates the interactions between particles based on their positions, velocities, and forces [25]. MD simulations are based on the laws of classical mechanics and use interatomic potentials to determine the forces between atoms and molecules. It provides a detailed understanding of the dynamics of materials and can be used to study various physical and chemical processes, such as diffusion, reaction kinetics, and thermal conductivity [26]. We used MD simulation due to its power for predicting the behavior of materials at the molecular level and for understanding the underlying physical and chemical processes.
The purpose of this research paper is to provide a comprehensive examination of the adsorption and sorption processes on shale gas surfaces, using MD simulations. The paper presents the importance of understanding the adsorption and sorption behavior of shale gas for its effective extraction and utilization. The methodology section offers an in-depth explanation of the MD simulation technique and its principles, assumptions, and limitations. The results and discussion section presents the findings from the MD simulations and provides a thorough analysis of the adsorption and sorption behavior of shale gas on various heterogeneous surfaces. The conclusions section highlights the key insights gained from the simulations and offers a comprehensive evaluation of the results.
The MD simulation was conducted in this study to investigate the adsorption properties of H2, and CH4 gases on the heterogeneous shale surfaces to accurately simulate real-life situations [27]. This was carried out using the BIOVIA Materials Studio software, of which the shale gas reservoir minerals used are Kaolinite, Orthoclase, Muscovite, Mica, Butane as the oil, and C60 as the kerogen (Fig. 1). These minerals were imported from the library and geometrically optimized. Subsequently, the particles were combined to build the shale gas reservoir by using the amorphous cell module and applying the force field energy to COMPASS and the electrostatic summation to Ewald. The construction was kept at a temperature of 298 K with loading steps of 1000. Finally, the adsorbates (H2 and CH4) were imported into the vacuum slab before proceeding with the adsorption, sorption, and Forcite tools [28–30].
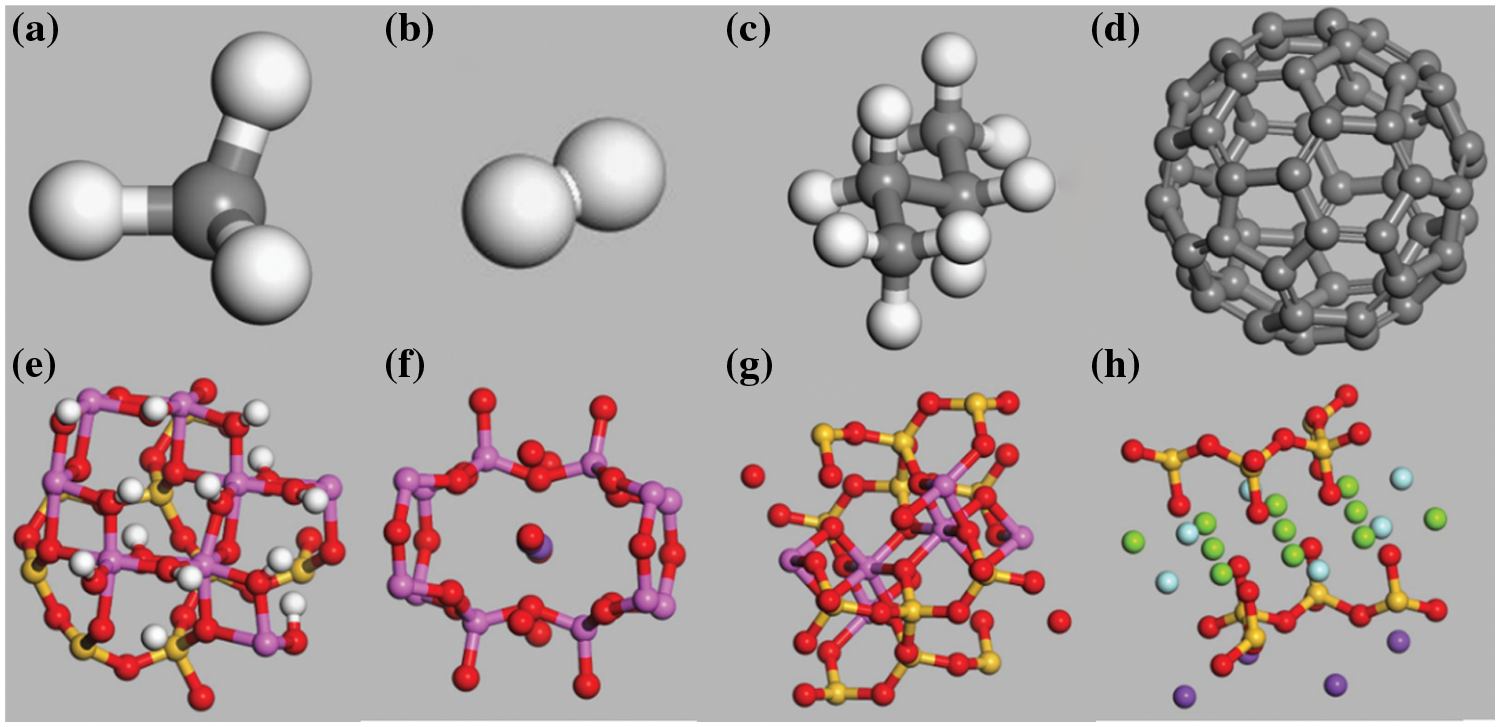
Figure 1: (a) CH4, (b) H2, (c) Butane, (d) C60, (e) Kaolinite, (f) Orthoclase, (g) Muscovite, and (h) Mica
This study utilized Condensed-phase Optimized Molecular Potentials for Atomistic Simulation Study (COMPASS) force field in all our simulations. The accuracy of any simulation method is largely dependent on the molecular force field used [31]. Among ab into force fields, it is the first to be parameterized and experimentally validated [32]. This force field contains necessary files for accurate analysis. With the integration of this force field, the structural, vibrational, conformational, and thermophysical properties of molecules can be predicted precisely and simultaneously, under different atmospheric conditions. It has two functional parts; bonded and non-bonded energies Eqs. (1)–(4) which are used for calculating the governing force between interacting atoms:
where the five items in bonded part represent valence terms comprising of diagonal and off-diagonal cross-coupling terms, i.e., the internal coordinates of bond (b), angle (θ), torsion angle (φ), out-of-plane angle (χ), while the cross terms involve combinations of two or three internal coordinates, that are essential for predicting oscillation frequencies and structural differences associated with conformational changes. The non-bonded part includes non-bonded interactions; van der Waals (
2.2 Modelling of Shale Gas Reservoir Using Material Studio Software
The model of the reservoir was built using Material Studio (MD simulations) software. The elements that are present in a reservoir in natural settings are loaded using the storage file that is contained in the software. The elements that were selected to be in our modeled reservoir were CH4, butane, C60, kaolinite, orthoclase, muscovite, and mica. The element of H2 had to be built as it was not in the storage file. Each of the elements had undergone geometry optimization by changing each of them into a ‘nanocluster’ so that each of the elements used in the reservoir was in its simplest form, which reflects a natural setting reservoir. The amorphous cell module was selected to build the reservoir by combining all the mentioned elements except the adsorbates (H2 and CH4) and in doing so, enabled the construction of a 3D reservoir model.
The reservoir was restructured by cleaving it to a plane of (1 1 1) hkl. A supercell was created which was used to set a boundary condition for our reservoir model. A ‘vacuum slab’ with a thickness of 1.5 nm was created to simulate the movement of the adsorbates in the reservoir and to prepare a proper layer of the system. The adsorbate was then imported into the vacuum slab using the ‘Adsorption Locator Calculation Tool’, and the efficiency of the adsorbent was calculated. By using ‘Sorption calculation’, the sorption of each adsorbate at different pressures was also obtained and recorded.
3.1 Sorption Energy of Methane and Hydrogen at Different Pressures
Several studies have proved that pressure is one of the factors affecting the sorption rate of methane and hydrogen. In this study, we investigated the relationship between pressure and the sorption of CH₄ and H₂ on the shale reservoir interface. It was carried out by simulating the sorption of CH₄ and H₂ at four different pressures: 500, 1000, 1500, and 2000 psi. The different values of pressure were incorporated under the setup section of ‘Sorption Calculation’, with the temperature kept constant at 298 K and loading steps of 1000. Fig. 2 displays the sorption results of CH₄ while Fig. 4 portrays the sorption configuration of H₂ on the shale surface at the four different pressures, respectively. The total sorption energy, average total energy, van der Waals energy, electrostatic energy, and intermolecular energy of the sorption at each pressure were calculated and are given in Figs. 3 and 5. In the Figs. 2, 4 and 6, the pink color is the shale gas reservoir component that has been combined and the red color is the gas adsorption on the shale gas reservoir.
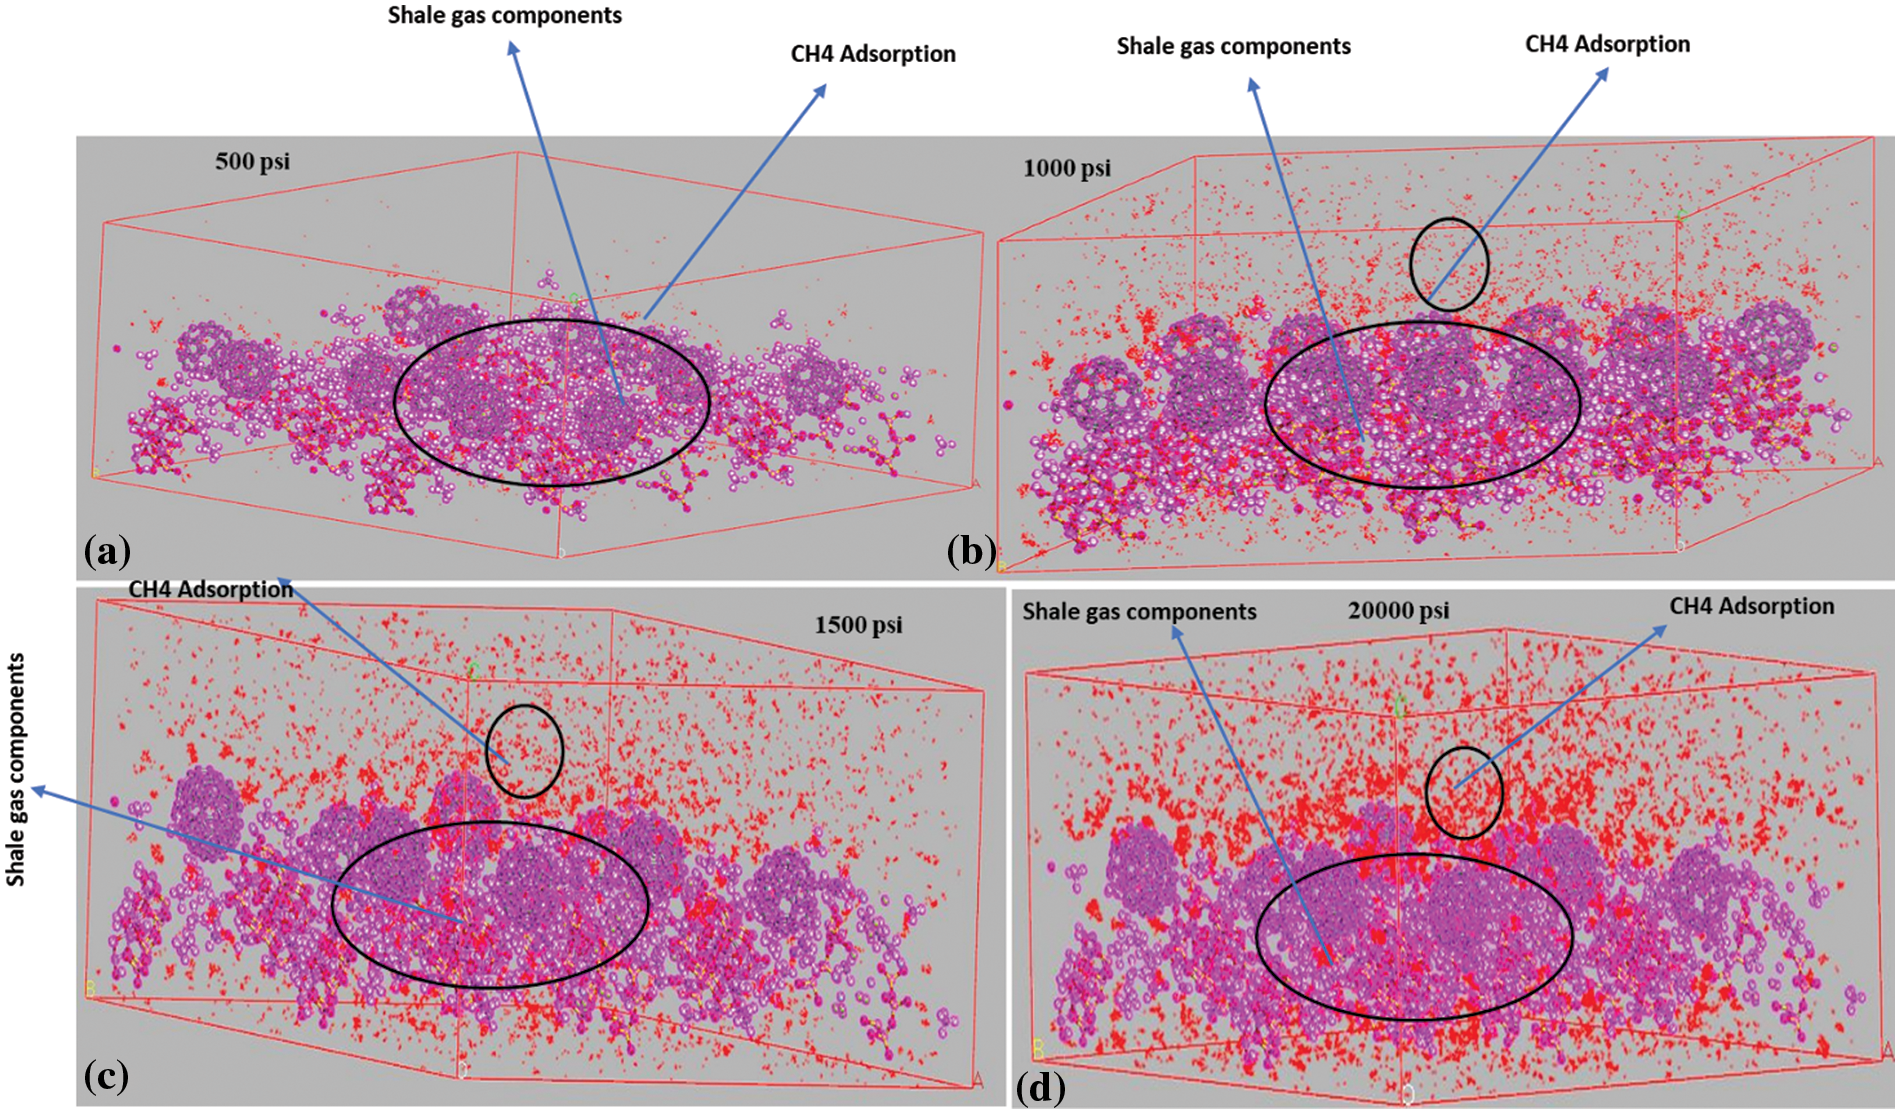
Figure 2: Sorption configuration for CH4; (a) at 500 psi, (b) at 1000 psi, (c) at 1500 psi, and (d) at 2000 psi
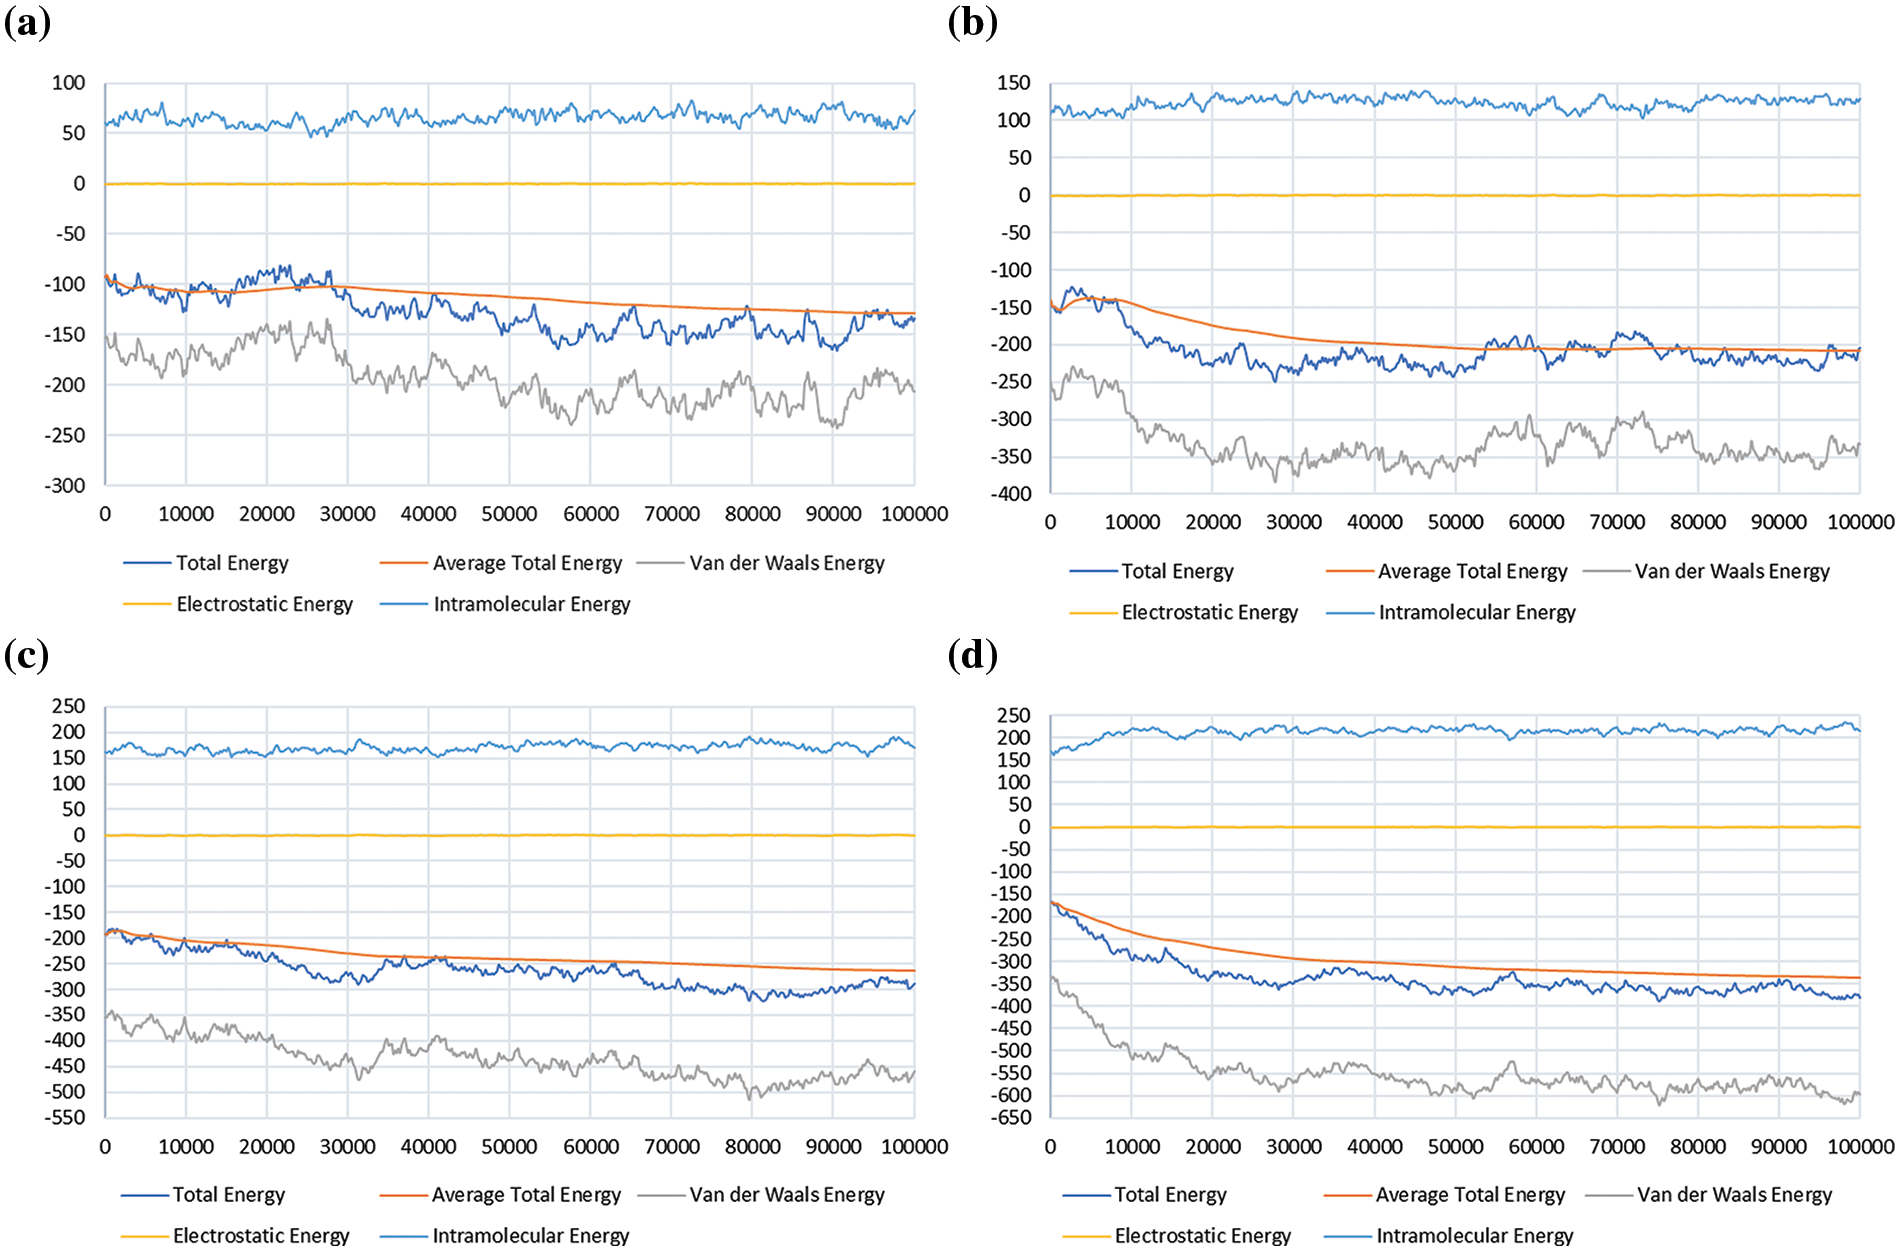
Figure 3: Sorption energy for methane (CH4) in the shale reservoir, showing the total energy, average total energy, van der Waals energy, electrostatic energy, and intramolecular energy; (a) at 500 psi, (b) at 1000 psi, (c) at 1500 psi, and (d) at 2000 psi
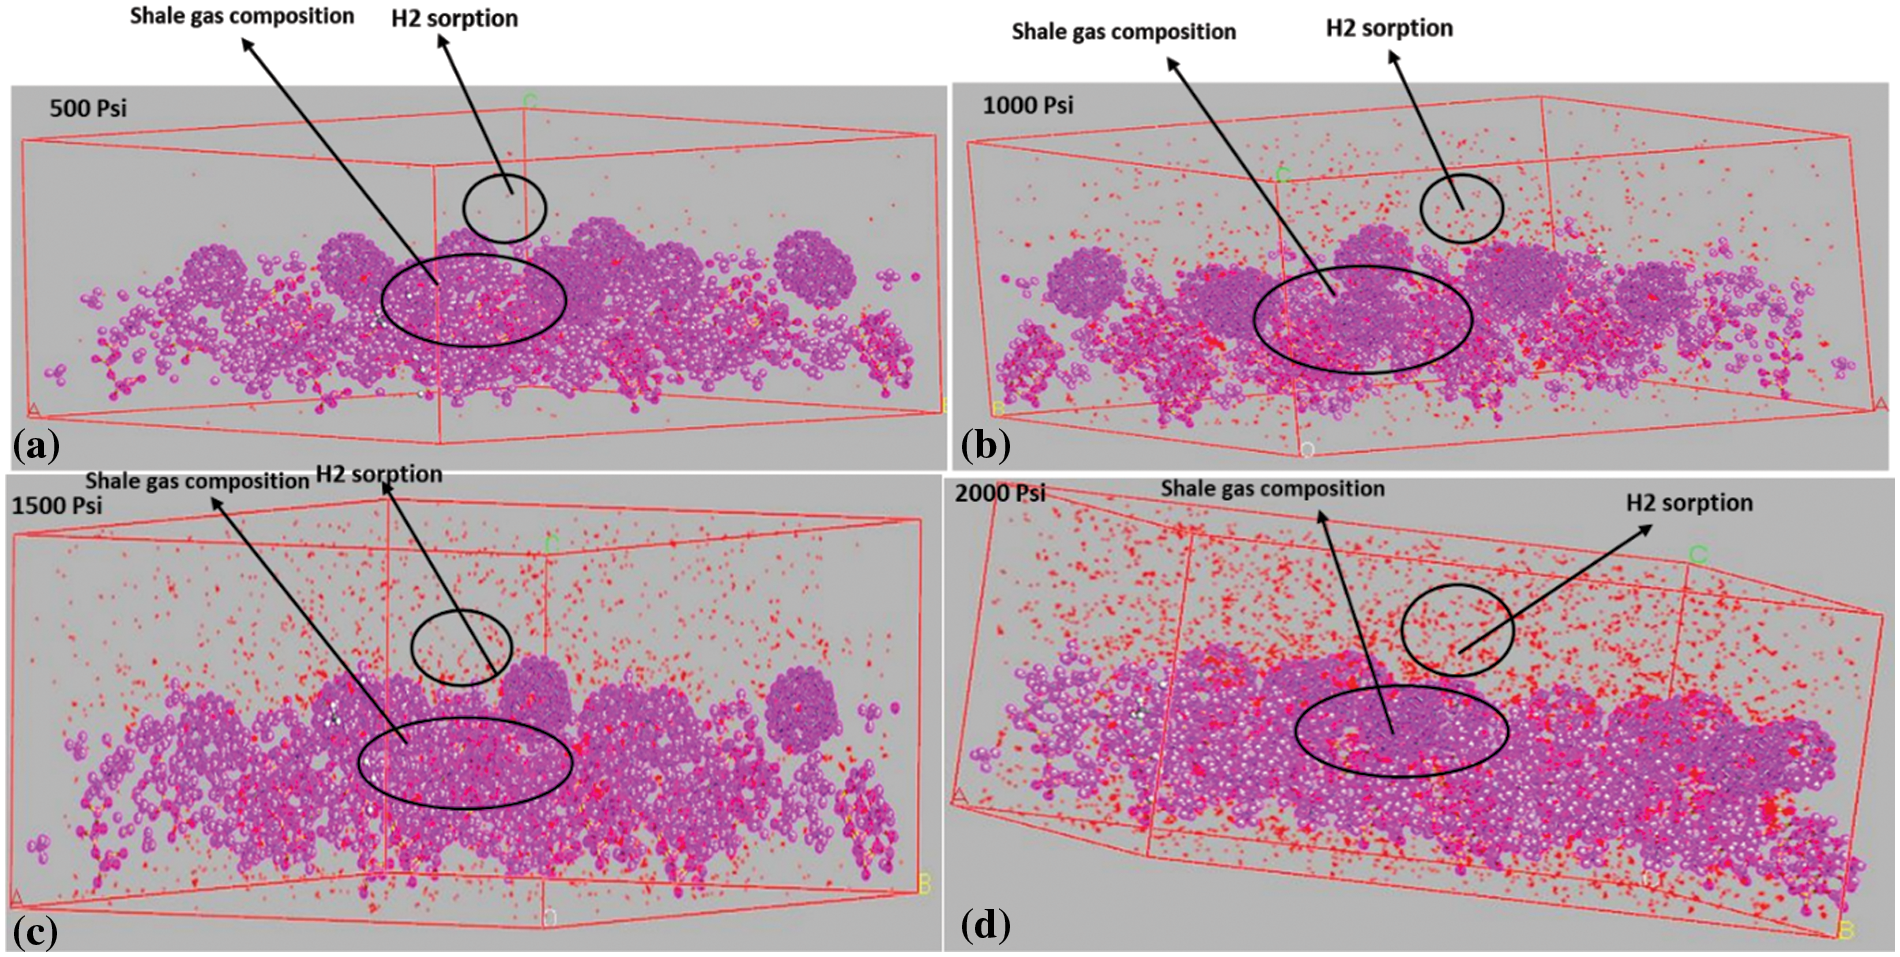
Figure 4: Sorption configuration for H2; (a) at 500 psi, (b) at 1000 psi, (c) at 1500 psi, and (d) at 2000 psi
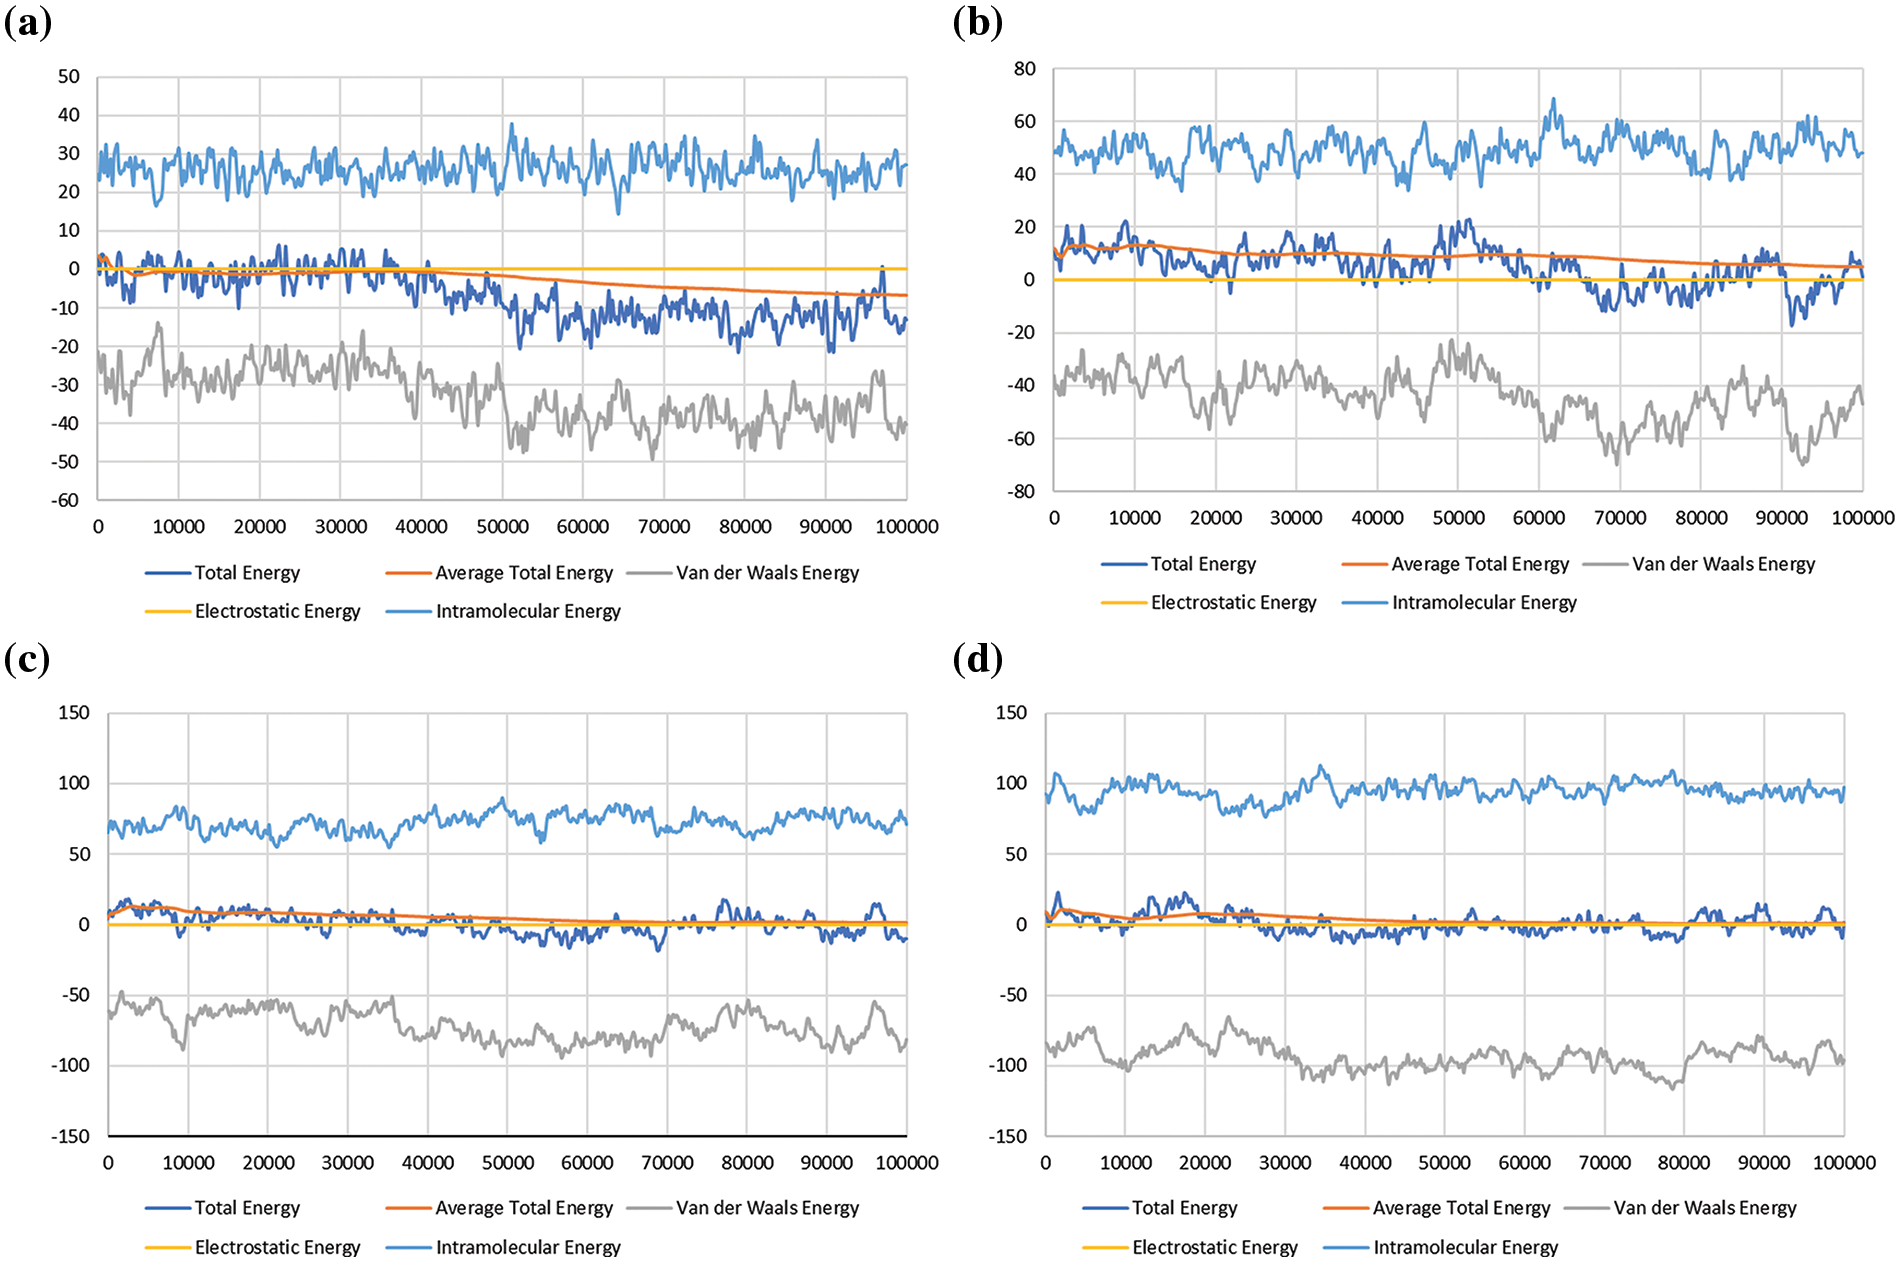
Figure 5: Sorption energy for Hydrogen (H2) in the shale reservoir, showing the total energy, average total energy, van der Waals energy, electrostatic energy, and intramolecular energy; (a) at 500 psi, (b) at 1000 psi, (c) at 1500 psi, and (d) at 2000 psi
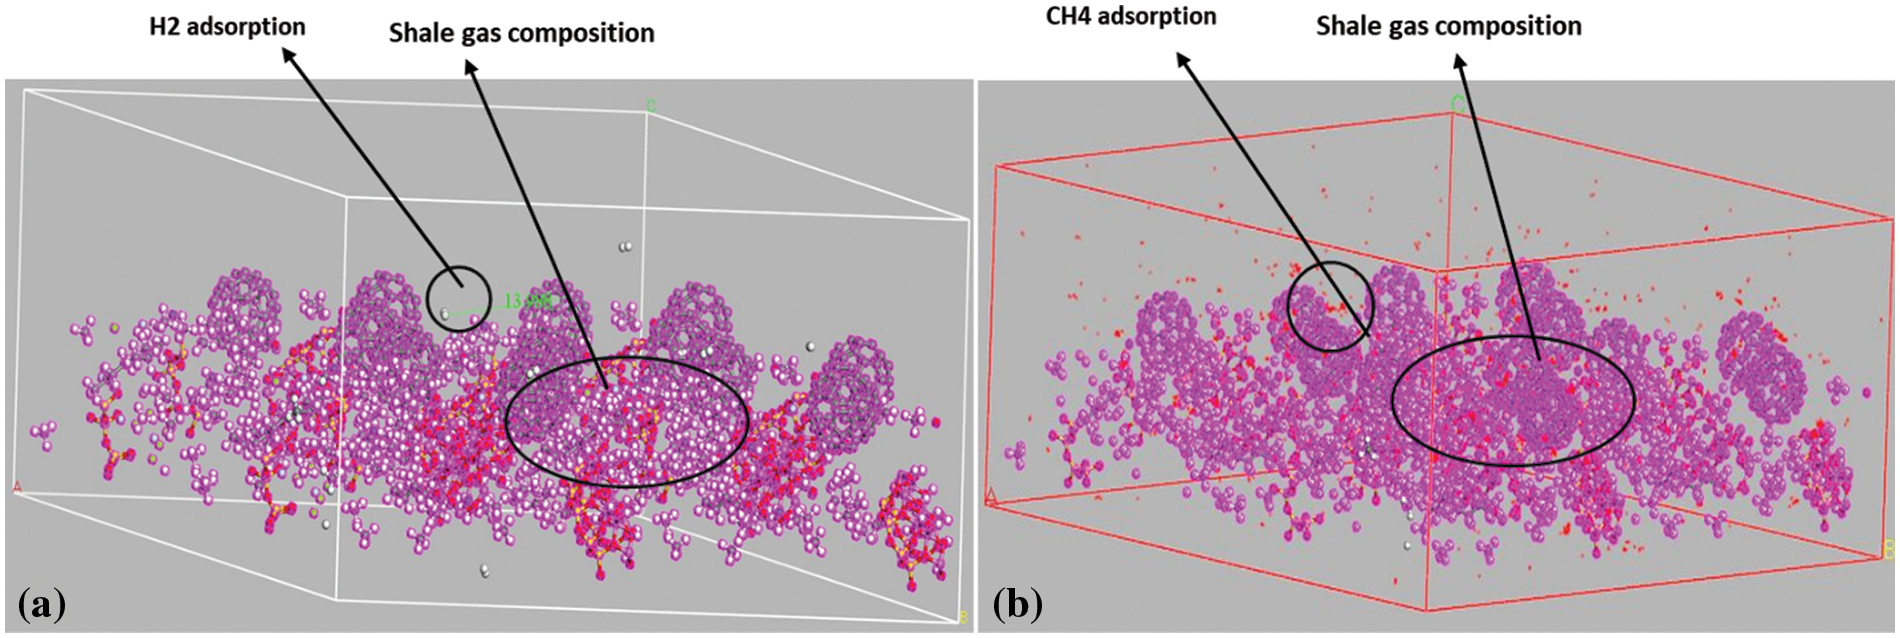
Figure 6: Adsorption configuration of the adsorbates; (a) Hydrogen (H2), and (b) Methane (CH4)
The relationship between pressure and the rate of sorption can depend on the specific sorbent and sorbate system. However, increasing pressure can lead to an increase in the rate of sorption, and increasing the pressure of the gas phase can increase the rate of sorption onto the solid phase. This is because the higher pressure increases the concentration of the sorbate molecules near the surface of the solid, making it more likely for them to be adsorbed. Therefore, the increase in pressure contributes to an increase in bulk density and max adsorption capacity. The relationship between pressure and the rate of sorption in shale gas is described by the Langmuir isotherm, which is a mathematical model that relates the amount of gas sorbed per unit mass of shale to the pressure of the gas in the surrounding environment. According to the Langmuir isotherm, the rate of sorption of gas molecules onto the surface of the shale rock increases with increasing pressure, until a point is reached where the sorption rate levels off and reaches a maximum value. In other words, at low pressures, the sorption rate is low because there are fewer gas molecules available to be absorbed by the shale rock. As the pressure increases, more gas molecules are available, which increases the likelihood of them being absorbed by the shale. However, once the maximum sorption capacity of the shale rock is reached, further pressure increases will not increase the rate of sorption. Understanding the relationship between pressure and sorption rate is important for optimizing the production of shale gas. To maximize the amount of gas that can be extracted from a shale formation, it is important to maintain a high pressure in the wellbore to increase the rate of gas sorption onto the shale rock surface.
The sorption configuration for CH4 at different pressures (Fig. 4) expresses this relationship, as it can be observed that there is an increase in the CH4 molecules in the shale system as the pressure goes up to 1500 psi and a slight decrease from 1500 to 2000 psi. As for the H₂ sorption (Fig. 5), it is observed that the capacity of H₂ molecules in the shale system shows an increasing pattern from 500 to 2000 psi, without the decrease as that of CH4. Thus, it can be deduced that H₂ gases are slower to reach the adsorption saturation compared with CH4.
The graphs (Fig. 5) show that the total sorption energy for CH4 increases as the pressure increases, with the peak value recorded at the range of −250 to −400 kcal/mol. This coincides with the average total energy, which displays a similar increasing pattern with the rise of pressure. The peak value recorded for the average total energy is around −250 to −350 kcal/mol. The total sorption energy and average total energy for H2 (Fig. 5) also increase as the pressure increase, with the peak values at 20–30 kcal/mol and 10–20 kcal/mol, respectively.
As the interaction between CH4 molecules and shale surface is defined by the van der Waals forces, the van der Waals energy is then one of the parameters taken into consideration to portray the sorption energy of CH4 and H2 gases in shale reservoirs. From the study, it was observed that the van der Waals energy of CH4 and H2 molecules increase as the pressure rises. This indicates that the attraction between CH4 or H2 molecules with the shale surface increases as more molecules get adsorbed on the walls of the shale system. The simulation result reveals that the electrostatic energy of the CH4 and H2 molecules are of values below 1, which leads to a straight line parallel to the x-axis on the graph. This can be deduced as meaning that there is no significant electrostatic imbalance on the surface of the shale system as the molecules are absorbed on it. The intramolecular energy of the CH4 or H2 molecules showed a significant increasing pattern with every rise in pressure. The peak recorded value of CH4 was above 200 kcal/mol while for H2 it was around 110 kcal/mol. All five parameters observed in this study increased with an increase in pressure for both CH4 and H2 gases, which indicates that the molecules of the two gases have a high sorption potential on the shale surface.
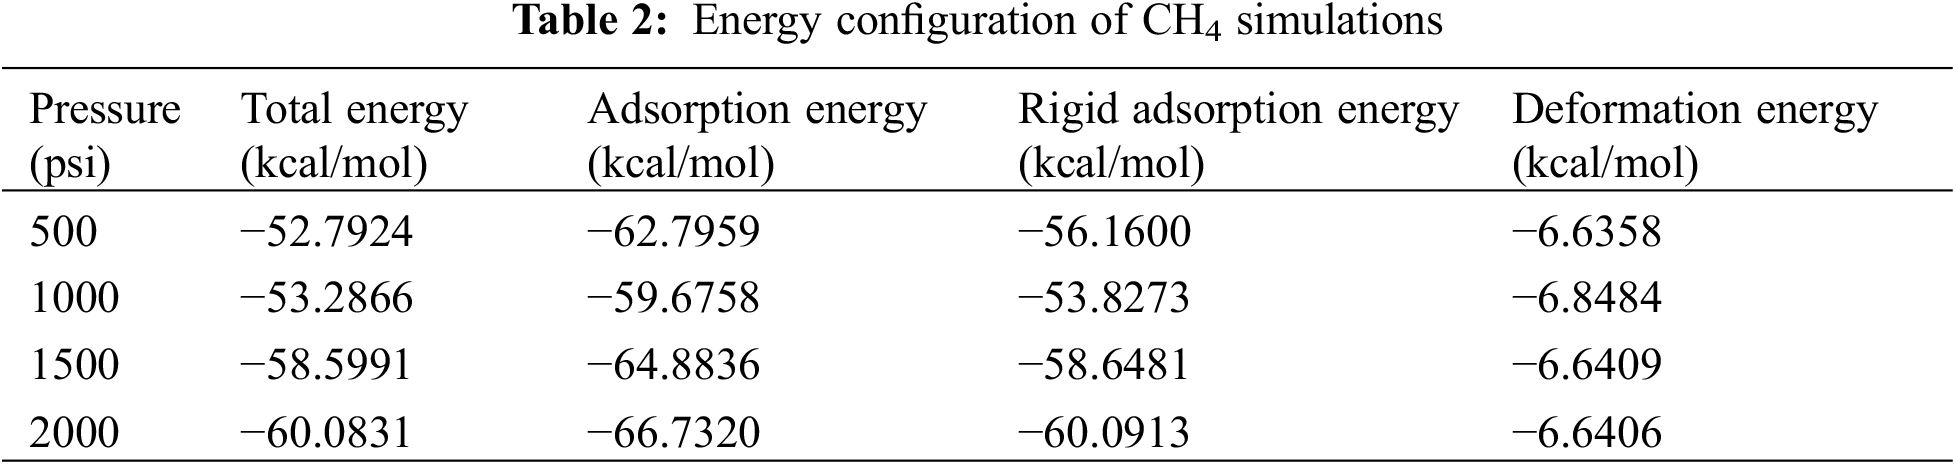
3.2 Adsorption Energies of H2 and CH4
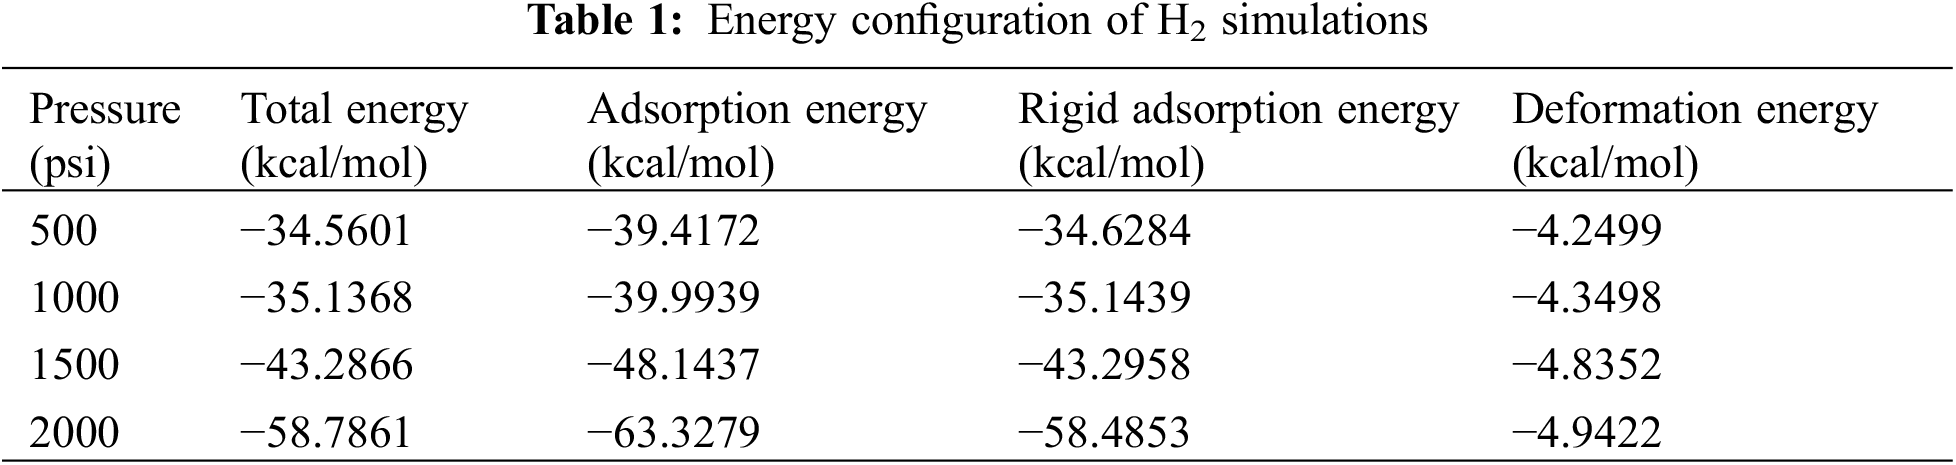
From the simulation data which are shown in Figs. 6 and 7, the efficiency of both adsorbates (H2 and CH4) on the adsorbent (shale). The electrostatic energy and the intramolecular energy recorded in both cases remained constant and the same in both cases as they were not affected by the rate of adsorption that was occurring in the reservoir. The research findings indicate that the raw shale has a higher capacity to adsorb CH4 compared with H2, and this capacity was found to increase uniformly. However, in shale, there was no significant difference observed in CH4 adsorption capacity. This study provides essential insights into the potential of using shale reservoirs for hydrogen storage, which can ultimately facilitate the widespread adoption of a hydrogen-based economy. Tables 1 and 2 show a clear contrast in the adsorption capacity of H2 and CH4. The H2 adsorption capacity exhibited a rise of approximately 5% at a pressure of 2000 psi, while the CH4 adsorption capacity showed an increase of 10% at the same pressure. The H2 adsorption on shale gas was notably higher and showed a substantial increment with a surge in pressure. The amount of H2 adsorbed on the shale gas at 500–2000 psi were −4.2499, −4.3498, −4.8352, and −4.9422, respectively.
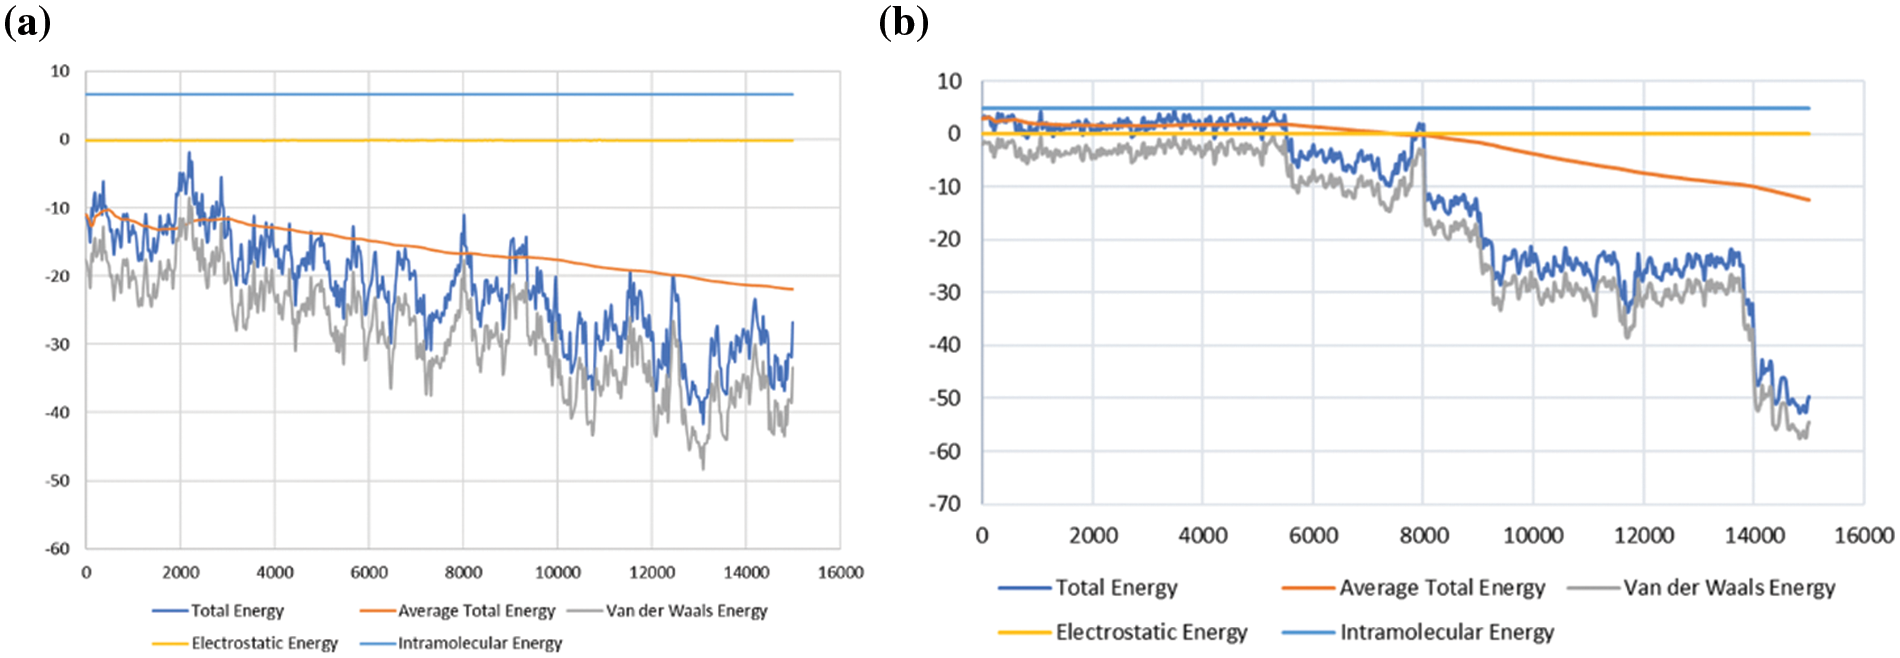
Figure 7: Adsorption energy for the hydrogen (H2) and methane (CH4) in the shale reservoir, showing the total energy, average total energy, van der Waals energy, electrostatic energy, and intramolecular energy; (a) adsorption energy for CH4, and (b) adsorption energy for H2
The presence of cushion gas (CH4) is unnecessary for storing hydrogen in unconventional shale formations because of the extremely low porosity and permeability of the shale. Therefore, datasets of CH4 adsorption and sorption in the CH4/brine/shale system cannot be used to assess the suitability of CH4 as a cushion gas for the adsorption trapping of H2 in shale gas [33]. However, these datasets can provide valuable information for evaluating the amount of methane generated from organic-rich shale because of the reaction between hydrogen and kerogen. The adsorption of gas, such as hydrogen, on shale gas can have a significant effect on the extraction and production of shale gas. Shale gas is typically found in shale rock formations and is trapped within the rock structure. The gas is adsorbed onto the surface of the shale rock, and the amount of gas that can be extracted is dependent on the adsorption capacity of the rock.
H2 is a smaller molecule than CH4, which is the primary component of shale gas and can thus adsorb more readily onto the shale rock surface. This can increase the total amount of gas that is trapped in the rock and potentially increase the production of shale gas. However, the adsorption of H2 can also reduce the permeability of the shale rock, making it more difficult to extract the gas. Additionally, H2 can potentially react with the shale rock minerals, leading to mineral dissolution and alteration of the rock structure, which can further impact the production of shale gas. Therefore, the effect of gas adsorption on shale gas, such as H2, is complex and can have both positive and negative impacts on the extraction and production of shale gas.
The ability of shale to adsorb CH4 molecules is influenced by the presence of various minerals. The structure of the pores in shale, with a diameter of 5.0 nm, can determine the strength of the adsorption capacity due to the exposure of different atoms and chemical bonds in the pore wall. Under conditions of a formation temperature of 298 K and a formation pressure ranging from 3.44738 to 13.78951 MPa, kerogen I exhibits a high excess adsorption amount of 12.318%. Compared with other inorganic minerals, kerogen I have superior adsorption properties, including a strong adsorption potential, high maximum adsorption capacity, low constraining effect on adsorbate molecules, and low physical adsorption heat. This leads to strong and intense adsorption of methane molecules onto the pore wall surface, with the proximity of the molecules and the formation of a thick and high-density adsorption layer (1.5 nm). The strength of the hydrogen bond is greater than that of the van der Waals force, thus, the ability of inorganic clay minerals to adsorb is positively linked to their ability to form hydrogen bonds. Clay minerals with more exposed oxygen atoms are more likely to form these bonds and retain CH4. On the other hand, mica has no significant adsorption properties. The results of a simulation experiment, which showed a saturation gas content close to the data obtained from a physical adsorption experiment, demonstrate that the Monte Carlo isothermal adsorption simulation used in this study accurately reflects real geological conditions and has significant evaluative value.
The total energy, average total energy, and van der Waals forces in Fig. 7a are seen to be much higher than in Fig. 7b, which can be explained by the fact that CH4 has much larger molecules and has more atoms compared to H2. The interaction of CH4 molecules with the shale surface is larger than in H2, and H2 molecules. Due to this, it can be theorized that more CH4 molecules will be adsorbed on the shale surface compared with H2 molecules. Thus, based on the information in Fig. 6, CH4 has a higher rate of adsorption compared to H2.
The quantity of mass contained in a unit of volume is how density is calculated. Since both temperature and pressure, particularly in gas, have an impact on how compact the molecular arrangement is, density values are only meaningful at a given temperature and pressure. Compared with CH4, H2 has a lower-density field (Fig. 8). To support this statement, note that the first element on the periodic table and the lightest molecule is H2. The molecular weight of CH4 is much heavier at 16. This distinction practically translates to a smaller molecule of hydrogen.
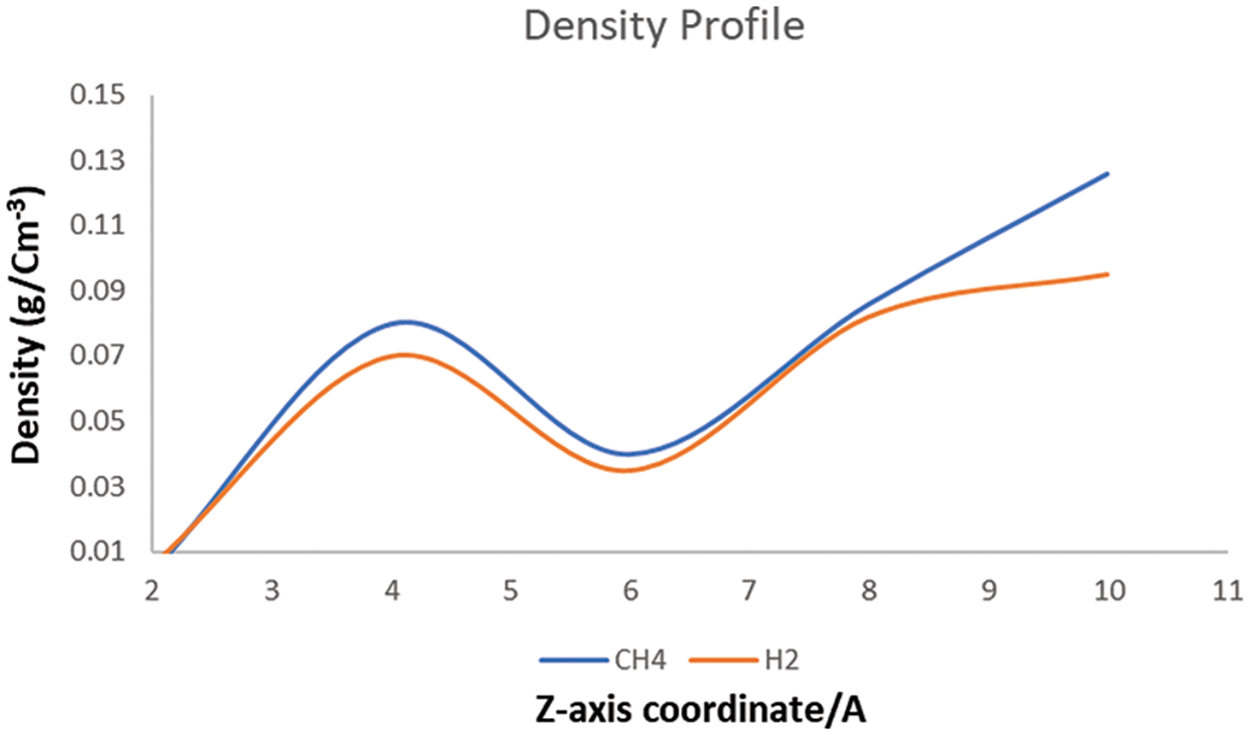
Figure 8: The density field profile of CH4 and H2 on shale gas
The density of H2 gas is much lower than that of CH4 with a density of approximately 0.05 g/cm−3 STP (Fig. 8). The addition of H2 gas to the feedstock can affect the overall density of the resulting shale gas, but the exact impact will depend on the proportions of CH4 and H2 used and the specific conditions of the production process. The density of shale gas is an important factor in determining the economics of extraction, transportation, and storage. Lower-density gases may require more extensive processing or compression to be economically viable, while higher-density gases may pose safety or environmental risks during transport and storage.
The microstructure of shale gas can be analyzed by examining the density profiles. The impact of density on shale gas depends on several factors, including the composition of the gas, the properties of the shale formation, and the extraction methods used, and the density of shale gas is shown in Fig. 9. At a distance spacing of 0.78 nm and a thickness of 1.5 nm, CH4 molecules are closely packed in the shale due to limited space. The diffusion coefficient of shale gas is also determined by the shale gas adsorbed on the clay surface. The diffusion coefficient of H2 determines how quickly H2 molecules can move through the shale rock. If the diffusion coefficient of H2 is high, H2 molecules can move more easily through the shale, which can lead to an increase in the concentration of H2 in the shale gas. On the other hand, if the diffusion coefficient of H2 is low, H2 molecules will have more difficulty moving through the shale, which can result in a decrease in the concentration of H2 in the shale gas. The shale gas molecules become mainly adsorbed on the clay surfaces (as evident in Fig. 6), due to the strong attraction between CH4 molecules, clay sheets, and calcium ions. Although the gas molecules adsorbed on the surfaces still show a slow diffusion, the gas molecules in the middle of the micropore exhibit much faster diffusion. This is because the attraction of the surface to the gas molecule decreases significantly, and the density of the gas also decreases, resulting in a faster diffusion of gas molecules in the middle of the micropore (as shown in Fig. 8).
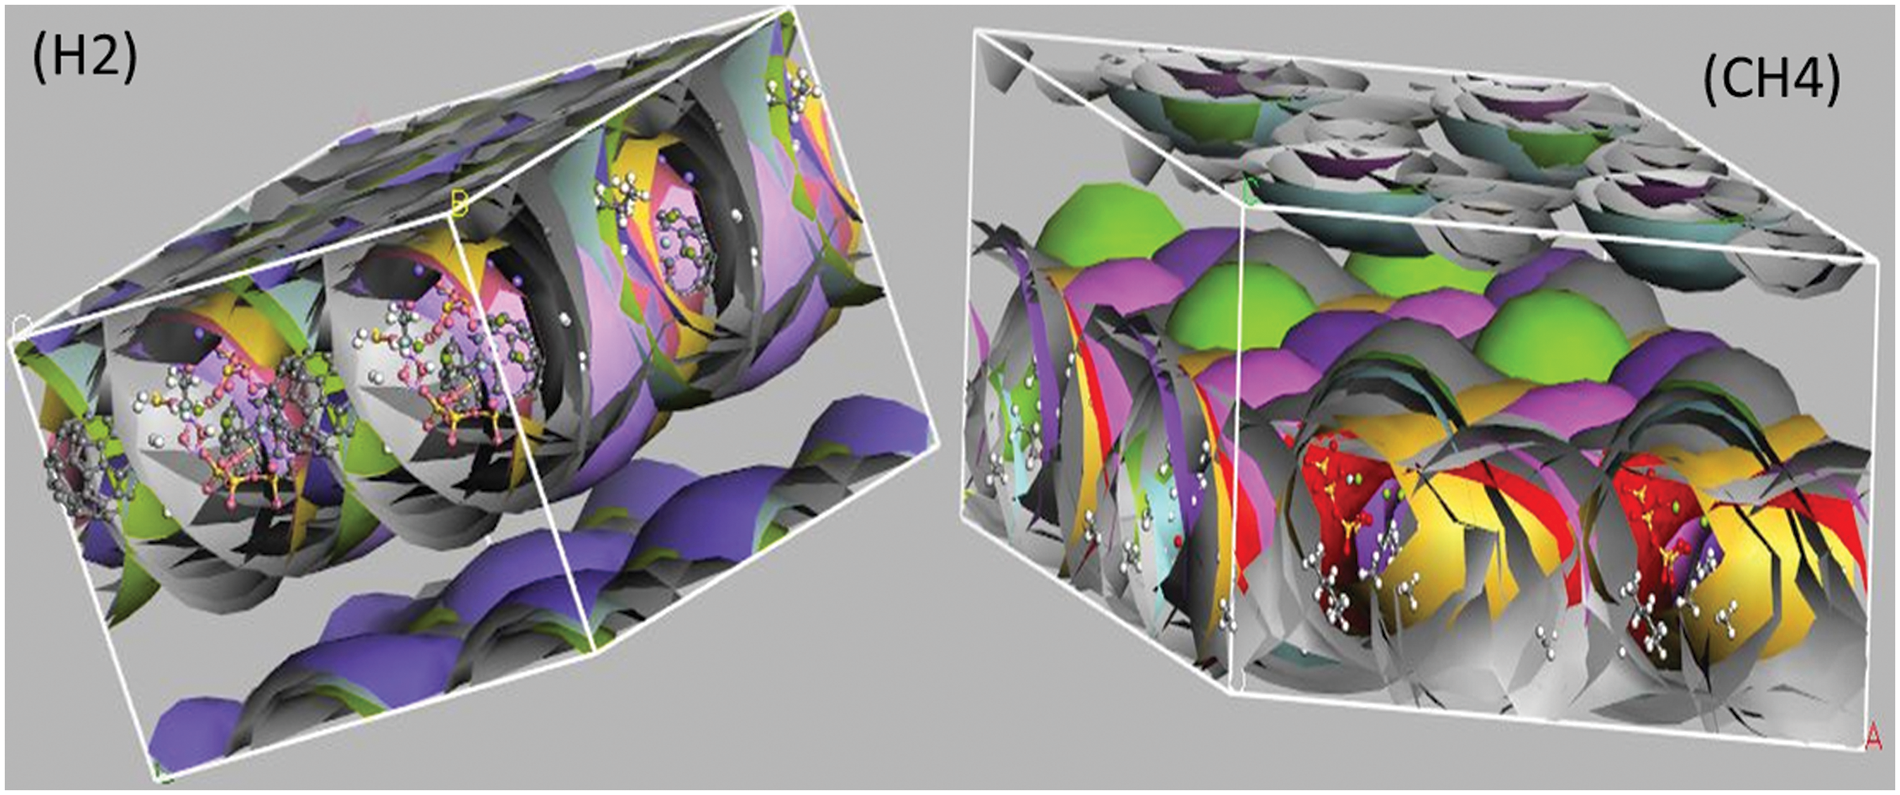
Figure 9: The density field structure of H2, and the density field structure of CH4
3.4 Mean Square Displacement (MSD)
Mean Square Displacement is a method to measure how much a particle’s position has deviated from a reference point over time. The diffusion coefficient provides a more thorough description of how the diffused and collected fluid interact with the infused nanofluid in the shale reservoir, as observed by the MSD. As shown in Fig. 10, shale, CH4, and H2 have a linear trend of increasing MSD in the shale reservoirs. The MSD of H2 increases linearly up to 24 0 nm2, while shale increases slowly to 7.0 nm2, and CH4 increases slowly to 5.5 nm2. In summary, the MSD of H2 has the highest increase gradient compared to shale and CH4 while CH4 has the lowest increase gradient. The convergence data from the stress autocorrelation function, which explains the influence of viscosity in the reservoir medium, were used in the analysis to support the conclusion that the fluid’s viscosity had changed. Smart methods were utilized to define the viscosity of the environment through MD simulation.
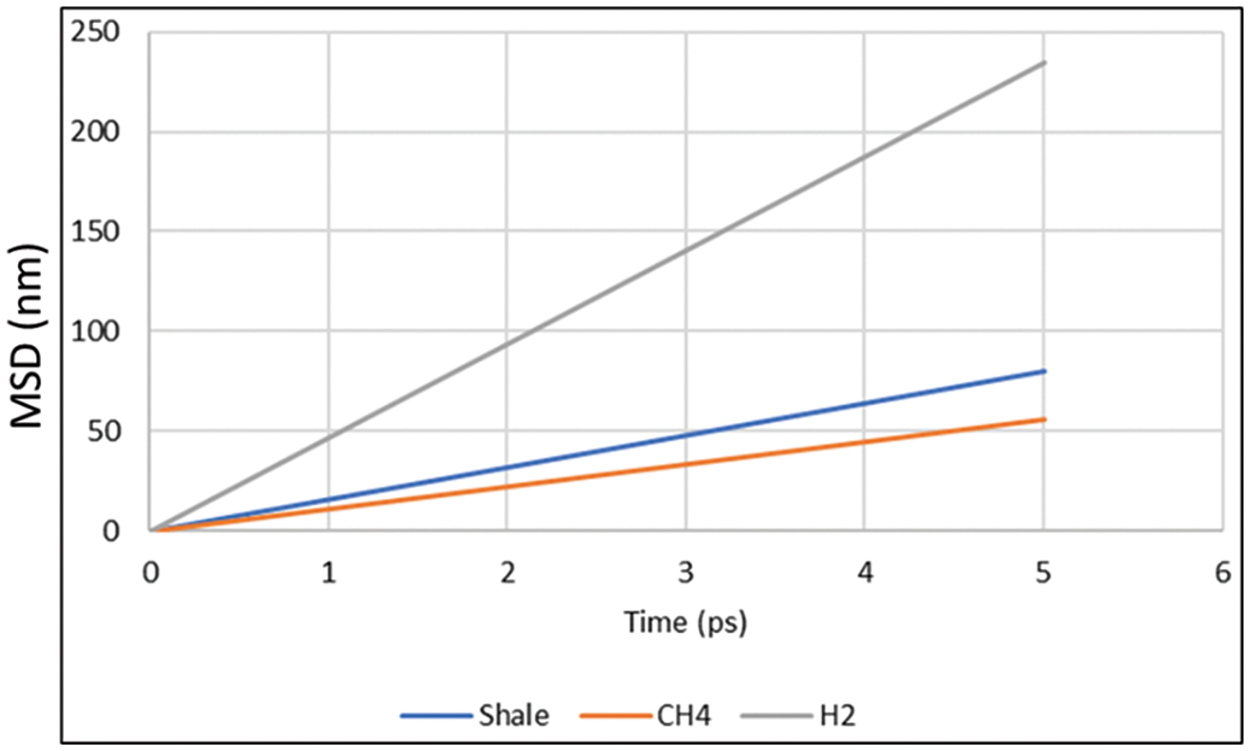
Figure 10: MSD results for shale, CH4, and H2 in the model
4 Validation of Experimental and Simulation Works
According to a study conducted by Xiong et al. in 2017 [34], it was observed that the simulation results and experimental findings reported by Ji et al. [35] demonstrated a closer alignment compared to the results reported by Liu et al. [36] or the findings of the present study. Furthermore, the simulation results regarding methane adsorption in kaolinite, chlorite, and graphite, considering different O/C ratios, exhibited a reasonable level of agreement with the experimental results of methane adsorption on kaolinite, chlorite, and kerogen. It was found that the methane adsorption capacity on kerogen fell within the range of values observed for pores sized between 2 and 20 nm. This suggests that the methane adsorption capacity within a specific pore size is approximately equivalent to that on kaolinite, chlorite, or kerogen. Moreover, although not a perfect match, the simulation results for methane adsorption in quartz, montmorillonite, and illite pores, as well as the experimental results for methane adsorption on the same minerals, exhibited similar magnitudes.
The adsorption properties and efficiencies of methane, CH4, and hydrogen, H2 gases on heterogeneous shale surfaces were investigated in this study by simulating a shale reservoir according to real-life situations using the molecular dynamics (MD) simulation. The study on the sorption configuration and energies of CH4 and H2 at different pressures—500, 1000, 1500, and 2000 psi—reveals that the total energy, average total energy, van der Waals energy, electrostatic energy, and intermolecular energy of the gases increase as the pressure increases. This rising pattern is due to the increase of bulk density and max adsorption capacity of the gases at higher pressure. The results obtained from the simulation also reveal that the total energy, average total energy, and van der Waals energy of CH4 are higher compared with those of H2. This is due to CH4 comprising larger and more molecules compared to H2, which leads to higher interaction with the shale surfaces. In addition, this coincides with the finding from the simulation that the density field of H2 is smaller than CH4. The following conclusions can be drawn from the study:
1. Pressure has a significant effect on the sorption of CH4 and H2 on the shale surface, which is reflected in the increase of total energy, average total energy, van der Waals energy, electrostatic energy, and intermolecular energy of the gases.
2. There is a limiting pressure point for the increase of CH4 sorption, indicating that CH4 reaches sorption saturation quicker than H2.
3. CH4 has a higher rate of adsorption compared to H2 in the shale system as there are more CH4 molecules adsorbed on the shale than the H2 molecules.
Acknowledgement: The authors express their appreciation to the Universiti Teknologi PETRONAS for providing the conducive environment for this research.
Funding Statement: PETRONAS Research fund (PRF) under PETRONAS Teknologi Transfer (PTT) Pre-Commercialization—External: YUTP-PRG Cycle 2022 (015PBC-020).
Author Contributions: The authors confirm contribution to the paper as follows: study conception and design: Surajudeen Sikiru, Surajudeen Sikiru; data collection: Surajudeen Sikiru, Hassan Soleimani, and Amir Rostami; analysis and interpretation of results: Surajudeen Sikiru, Hassan Soleimani, Amir Rostami, Mohammed Falalu Hamza, Lukmon Owolabi Afolabi. All authors reviewed the results and approved the final version of the manuscript.
Availability of Data and Materials: The data for this research work is confidential, the authors did not have permission to release it to the public.
Conflicts of Interest: The authors declare that they have no conflicts of interest to report regarding the present study.
References
1. Bakshi, T., Vishal, V. (2021). A review on the role of organic matter in gas adsorption in shale. Energy & Fuels, 35(19), 15249–15264. [Google Scholar]
2. Aliu, O., Sakidin, H., Jalal, F., Sikiru, S. (2020). Determination of CO2 diffusivity in subsurface systems using molecular dynamics simulation. Proceedings of the 27th National Symposium on Mathematical Sciences (SKSM27), vol. 2266, pp. 050014-1–050014-10. AIP Publishing. [Google Scholar]
3. Babatunde, K. A., Negash, B. M., Jufar, S. R., Ahmed, T. Y., Mojid, M. R. (2022). Adsorption of gases on heterogeneous shale surfaces: A review. Journal of Petroleum Science and Engineering, 208(4), 109466. [Google Scholar]
4. Yang, Y., Liu, S. (2020). Review of shale gas sorption and its models. Energy & Fuels, 34(12), 15502–15524. [Google Scholar]
5. Mudoi, M. P., Sharma, P., Khichi, A. S. (2022). A review of gas adsorption on shale and the influencing factors of CH4 and CO2 adsorption. Journal of Petroleum Science and Engineering, 217(33), 110897. [Google Scholar]
6. Sikiru, S., Yahya, N., Soleimani, H., Ali, A. M., Afeez, Y. (2020). Impact of ionic-electromagnetic field interaction on Maxwell-Wagner polarization in porous medium. Journal of Molecular Liquids, 318(1), 114039. [Google Scholar]
7. Liang, H., Qi, Z., Wang, S., Huang, X., Yan, W. et al. (2022). Adsorption models for shale gas: A mini-review. Energy & Fuels, 36(21), 12946–12960. [Google Scholar]
8. Sikiru, S., Yahya, N., Soleimani, H. (2020). Photon-phonon interaction of surface ionic adsorption within electric double layer in reservoir sandstone. Journal of Materials Research and Technology, 9(5), 10957–10969. [Google Scholar]
9. Ritter, J. A., Yang, R. T. (1991). Pressure swing adsorption: Experimental and theoretical study on air purification and vapor recovery. Industrial & Engineering Chemistry Research, 30(5), 1023–1032. [Google Scholar]
10. Qu, J. H. (2008). Research progress of novel adsorption processes in water purification: A review. Journal of Environmental Sciences, 20(1), 1–13. [Google Scholar]
11. Li, Y., Yi, H., Tang, X., Li, F., Yuan, Q. (2013). Adsorption separation of CO2/CH4 gas mixture on the commercial zeolites at atmospheric pressure. Chemical Engineering Journal, 229, 50–56. [Google Scholar]
12. Liu, S., Sun, B., Xu, J., Li, H., Wang, X. (2020). Study on competitive adsorption and displacing properties of CO2 enhanced shale gas recovery: Advances and challenges. Geofluids, 2020(2), 1–15. [Google Scholar]
13. Memon, A., Li, A., Memon, B. S., Muther, T., Han, W. et al. (2021). Gas adsorption and controlling factors of shale: Review, application, comparison and challenges. Natural Resources Research, 30(1), 827–848. [Google Scholar]
14. Iddphonce, R., Wang, J., Zhao, L. (2020). Review of CO2 injection techniques for enhanced shale gas recovery: Prospect and challenges. Journal of Natural Gas Science and Engineering, 77, 103240. [Google Scholar]
15. Memon, A., Li, A., Muther, T., Ren, X. (2020). An experimental study of gas sorption, adsorbed, and sorbed porosity, and their impact on shale gas-in-place calculations. Journal of Porous Media, 23(10), 985–1000. [Google Scholar]
16. Chen, J., Wang, F., Liu, H., Wu, H. (2017). Molecular mechanism of adsorption/desorption hysteresis: Dynamics of shale gas in nanopores. Science China Physics, Mechanics & Astronomy, 60(1), 1–8. [Google Scholar]
17. Sui, H., Yao, J., Zhang, L. (2015). Molecular simulation of shale gas adsorption and diffusion in clay nanopores. Computation, 3(4), 687–700. [Google Scholar]
18. Pathak, M., Huang, H., Meakin, P., Deo, M. (2018). Molecular investigation of the interactions of carbon dioxide and methane with kerogen: Application in enhanced shale gas recovery. Journal of Natural Gas Science and Engineering, 51, 1–8. [Google Scholar]
19. Jiang, W., Lin, M. (2018). Molecular dynamics investigation of conversion methods for excess adsorption amount of shale gas. Journal of Natural Gas Science and Engineering, 49, 241–249. [Google Scholar]
20. Chandra, D., Vishal, V., Debbarma, A., Banerjee, S., Pradhan, S. P. et al. (2020). Role of composition and depth on pore attributes of Barakar formation gas shales of Ib valley, India, using a combination of low-pressure sorption and image analysis. Energy & Fuels, 34(7), 8085–8098. [Google Scholar]
21. Lyu, F., Ning, Z., Yang, S., Mu, Z., Cheng, Z. et al. (2022). Molecular insights into supercritical methane sorption and self-diffusion in monospecific and composite nanopores of deep shale. Journal of Molecular Liquids, 359(4), 119263. [Google Scholar]
22. Liu, J., Xi, S., Chapman, W. G. (2019). Competitive sorption of CO2 with gas mixtures in nanoporous shale for enhanced gas recovery from density functional theory. Langmuir, 35(24), 8144–8158. [Google Scholar] [PubMed]
23. Chandra, D., Vishal, V., Bahadur, J., Sen, D. (2020). A novel approach to identify accessible and inaccessible pores in gas shales using combined low-pressure sorption and SAXS/SANS analysis. International Journal of Coal Geology, 228, 103556. [Google Scholar]
24. Yang, S., Zhang, B., Zheng, X., Chen, G., Ju, Y. et al. (2021). Insight into the adsorption mechanisms of CH4, CO2, and H2O molecules on illite (001) surfaces: A first-principles study. Surfaces and Interfaces, 23, 101039. [Google Scholar]
25. Allen, M. P. (2004). Introduction to molecular dynamics simulation. Computational Soft Matter: From Synthetic Polymers to Proteins, 23(1), 1–28. [Google Scholar]
26. Van Gunsteren, W. F., Berendsen, H. J. (1990). Computer simulation of molecular dynamics: Methodology, applications, and perspectives in chemistry. Angewandte Chemie International Edition in English, 29(9), 992–1023. [Google Scholar]
27. Yahya, N., Ali, A. M., Wahaab, F. A., Sikiru, S. (2020). Spectroscopic analysis of the adsorption of carbon based nanoparticles on reservoir sandstones. Journal of Materials Research and Technology, 9(3), 4326–4339. [Google Scholar]
28. Ali, A. M., Yahya, N., Mijinyawa, A., Kwaya, M. Y., Sikiru, S. (2020). Molecular simulation and microtextural characterization of quartz dissolution in sodium hydroxide. Journal of Petroleum Exploration and Production Technology, 10(7), 2669–2684. [Google Scholar]
29. Sikiru, S., Yahya, N., Soleimani, H., Musa, A. A., Yusuf, A. (2019). Effect of adsorption on saturated sandstone within electric double layer on solid/liquid inter-phase. Petroleum & Coal, 61(6), 1438–1444. [Google Scholar]
30. Sikiru, S., Soleimani, H., Shafie, A., Kozlowski, G. (2022). Simulation and experimental investigation of dielectric and magnetic nanofluids in reduction of oil viscosity in reservoir sandstone. Journal of Petroleum Science and Engineering, 209(6), 109828. [Google Scholar]
31. Liao, R. J., Zhu, M. Z., Yang, L. J., Zhou, X., Yan, J. M. et al. (2011). Analysis of interaction between transformer oil and cellulosic insulation paper using molecular simulation method. Gaodianya Jishu/High Voltage Engineering, 37(2), 268–275. [Google Scholar]
32. Sun, H. (1998). COMPASS: An ab initio force-field optimized for condensed-phase applications overview with details on alkane and benzene compounds. The Journal of Physical Chemistry B, 102(38), 7338–7364. [Google Scholar]
33. Abid, H. R., Yekeen, N., Al-Yaseri, A., Keshavarz, A., Iglauer, S. (2022). The impact of humic acid on hydrogen adsorptive capacity of eagle ford shale: Implications for underground hydrogen storage. Journal of Energy Storage, 55(1), 105615. [Google Scholar]
34. Xiong, J., Liu, X., Liang, L., Zeng, Q. (2017). Adsorption of methane in organic-rich shale nanopores: An experimental and molecular simulation study. Fuel, 200(7), 299–315. [Google Scholar]
35. Ji, L., Zhang, T., Milliken, K. L., Qu, J., Zhang, X. (2012). Experimental investigation of main controls to methane adsorption in clay-rich rocks. Applied Geochemistry, 27(12), 2533–2545. [Google Scholar]
36. Liu, D., Yuan, P., Liu, H., Li, T., Tan, D. et al. (2013). High-pressure adsorption of methane on montmorillonite, kaolinite and illite. Applied Clay Science, 85(6), 25–30. [Google Scholar]
Cite This Article
 Copyright © 2024 The Author(s). Published by Tech Science Press.
This work is licensed under a Creative Commons Attribution 4.0 International License , which permits unrestricted use, distribution, and reproduction in any medium, provided the original work is properly cited.
 Downloads
 Citation Tools