
 Submit a Paper
 Propose a Special lssue
 Open Access
ARTICLE
Numerical Simulation of Turbulent Diffusion Flames of a Biogas Enriched with Hydrogen
1
Laboratoire des Science et Ingénierie Maritimes, Faculté de Génie Mécanique, Université des Sciences et de la Technologie d’Oran
Mohamed Boudiaf, Oran, Algérie
2
Laboratoire des Carburants Gazeux et de l’Environnement, Faculté de Génie Mécanique, Université des Sciences et de la
Technologie d’Oran Mohamed Boudiaf, Oran, 31000, Algérie
* Corresponding Authors: Naima Krarraz. Email: ;
Fluid Dynamics & Materials Processing 2024, 20(1), 79-96. https://doi.org/10.32604/fdmp.2023.026238
Received 26 August 2022; Accepted 08 June 2023; Issue published 08 November 2023
 View Full Text
 Download PDF
Abstract
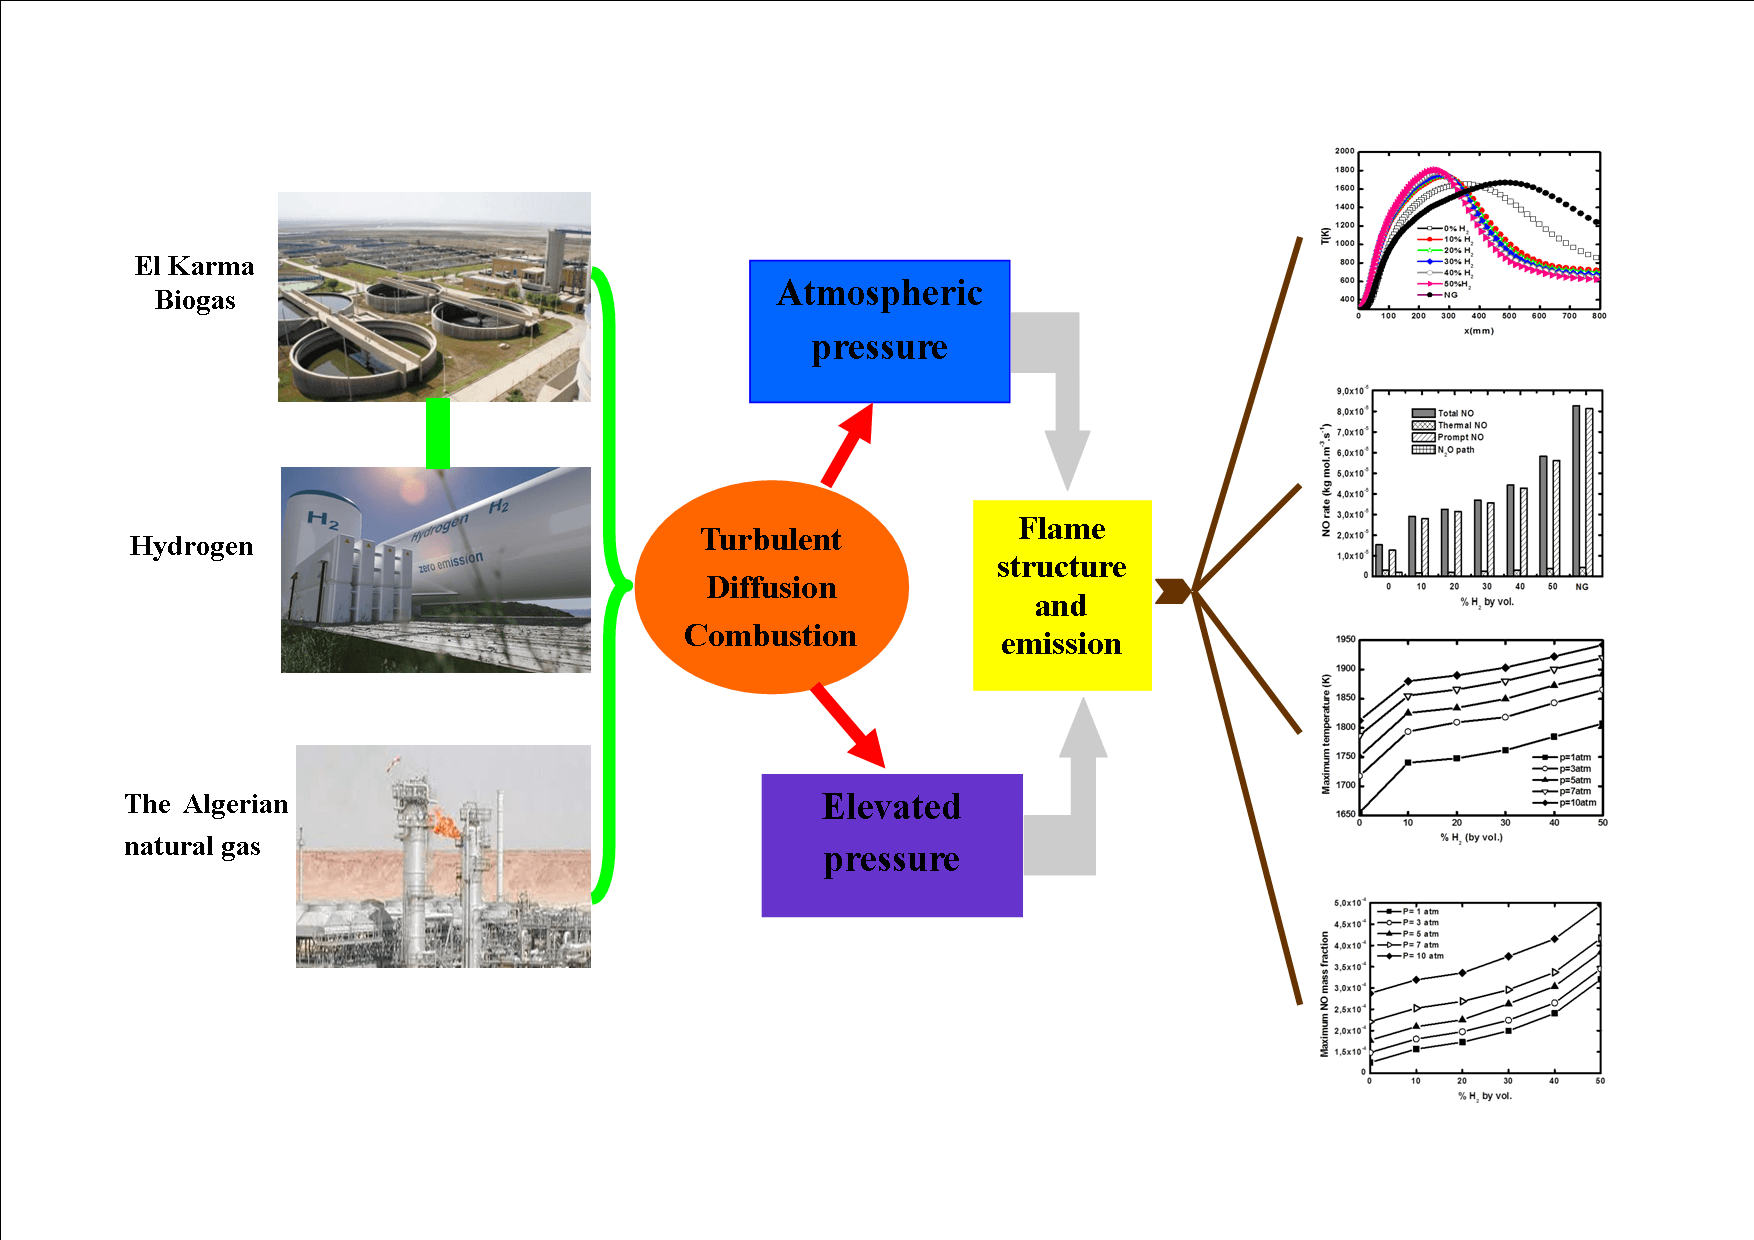
Any biogas produced by the anaerobic fermentation of organic materials has the advantage of being an environmentally friendly biofuel. Nevertheless, the relatively low calorific value of such gases makes their effective utilization in practical applications relatively difficult. The present study considers the addition of hydrogen as a potential solution to mitigate this issue. In particular, the properties of turbulent diffusion jet flames and the related pollutant emissions are investigated numerically for different operating pressures. The related numerical simulations are conducted by solving the RANS equations in the frame of the Reynolds Stress Model in combination with the flamelet approach. Radiation effects are also taken into account and the combustion kinetics are described via the GRI-Mech 3.0 reaction model. The considered hydrogen fuel enrichment spans the range from 0% to 50% in terms of volume. Pressure varies between 1 and 10 atm. The results show that both hydrogen addition and pressure increase lead to an improvement in terms of mixing quality and have a significant effect on flame temperature and height. They also reduce CO2 emissions but increase NOx production. Prompt NO is shown to be the predominant NO formation mechanism.Graphic Abstract
Keywords
In the present environmental and energy context across the world, fossil fuel replacement has become a necessity. It creates energy independence and preserves the environment from pollutant emissions. It also reduces greenhouse effects. Biogas is currently one of the best substitutes to natural gas since it has a lower carbon footprint. The biogas industry can also help provide food security, manage waste, protect water bodies, restore soil health, improve air quality, promote health and sanitation and provide employment [1]. The biogas industry is still in the initial stages of development [1]. The low heat value of this alternative fuel is a barrier to the generalization of its use. Combustion is one of the main issues of biogas utilization and numerous studies are dedicated to biogas flames and pollutant emissions.
Non-premixed biogas flames have been of great interest because they are safer and more stable with many practical applications. One of the earliest papers in the field was by Chandra et al. [2] who fabricated and tested a biogas burner following the ISI standard (IS: 8749-1978). Sarras et al. [3] presented a comparative study of biogas and German natural gas jet flames under the Moderate and Intense Low Dilution (MILD) combustion regime. They compared Eddy Dissipation Concept (EDC) and PDF flamelet models. The results showed that the flamelet model predicted the flame structure and height better than the EDC. In their numerical study, Hoerlle et al. [4] examined the carbon-dioxide effects on laminar diffusion biogas flames employing a global kinetic mechanism and the flamelet model. It was found that chemical effects due to the carbon-dioxide dilution were more important in the fuel-rich side of the flame. The analysis of H2O effects on turbulent biogas combustion performed by Sahin et al. [5] revealed that steam addition decreased the temperature and changed the flame zone positions toward the burner’s downstream. The paper presented by Yilmaz et al. [6] about N2 dilution effects on biogas combustion showed that a level of nitrogen greater than 30% had less effect on flame stability. N2 dilution also decreased both flame temperature and brightness. A numerical investigation on the effect of the carbon-dioxide composition in no-premixed biogas flames examined by Nivethana Kumar et al. [7], a chemical kinetics mechanism with 25 species and 125 reactions and the Open FOAM are used in their simulation. They showed that the flame temperature reduces so the stability decreases with increases in the carbon-dioxide.
Effect of Hydrogen Addition into Biogas in Literature
Despite the attractive properties of biogas as an alternative fuel, it encounters certain obstacles that prevent its generalization in practical installations where it should replace natural gas. Low heating value and flame instabilities are currently the most important problems to solve.
The hydrogen has a wide flammability range in comparison with all other fuels and a high auto-ignition temperature so the hydrogen has unique properties that make for combustion. The authors have studied experimentally and numerically effect of hydrogen addition to the biogas.
Leung et al. [8] then experimentally studied laminar biogas non-premixed jet flame stability under different H2 enrichment levels and co-flowing air streams. They found that the presence of a significant amount of carbon-dioxide in the fuel made its stability lower and narrowed the flame thickness. Another experimental study on laminar biogas diffusion flames by Zhen et al. [9] showed that 5% hydrogen in the fuel was more efficient in flame stability enhancement. Hydrogen addition was also found to increase temperature and reduce flame height. The experimental investigation of biogas-H2 premixed and non-premixed flames presented by Zhen et al. [10] revealed that the former yields higher heat transfer than the latter. Premixed flames had a higher temperature and their total heat transfer was enhanced by hydrogen addition, while for diffusion flames, heat transfer decreased with H2 enrichment. The influence of several operating conditions on laminar counter-flow biogas diffusion flames was examined by Mameri et al. [11]. They found that carbon-dioxide increment decreased both flame temperature and NO index. Hydrogen addition increased heating value but also promoted NO formation. High strain rates produced fewer NO pollutants. Mameri et al. [12] also conducted a numerical simulation of laminar biogas hydrogenated counter–flow diffusion flames under MILD regime. The chemical effect of carbon-dioxide in the oxidizer reduced the flame temperature and species production except for CO which was enhanced. Laminar non-premixed biogas hydrogen flame stabilization was described through the experimental study of Zhen et al. [13]. Three compositions of biogas were considered and the amount of added hydrogen was varied from 5% to 25% of the biogas by volume. They concluded that flame stabilization was not solely dependent on laminar burning velocity but also depended on the critical flow velocity. Amez et al. [14] experimentally treated biogas–hydrogen mixture combustion in conventional natural gas systems. Results showed that biogas combustion in conventional systems was really improved by H2 addition and that pure biogas flames were unstable when their carbon-dioxide content is high. Flame and ignition behavior were experimentally investigated by Amez et al. [15] in a conventional 100 kW burner. The tests were performed with three biogases: a rich biogas with 30% carbon-dioxide, a standard biogas (with 40% CO2), and an energetically poor biogas with 50% carbon-dioxide. The flame structure was the closest to the natural gas flame when H2 enrichment was 10% for both standard and rich biogas but the flame temperature remained lower than that of natural gas in all cases.
The idea of adding hydrogen to enhance laminar biogas combustion has already been proposed by many authors but few studies have been devoted to biogas H2 enrichment in turbulent flames. Therefore, the aim of this study is the investigation of biogas flames enriched with hydrogen under turbulent regimes and different operating pressures, by focusing on flame structure and pollutant emissions, in comparison to natural gas produced in Algeria. The chosen biogas is produced in the El Karma wastewater treatment plant situated in Algeria. Since biogas technology is in its infancy in Algeria, specific studies related to Algeria biogas are currently needed as there is an intention to replace natural gas by biogas in the Algerian industry. Moreover, the use of a constant biogas composition avoids biogas upgrading, which is very expensive.
The numerical simulation performed in the present paper is based on the Reynolds Averaged Navier Stokes (RANS) coupled with the laminar flamelet models. The detailed GriMech3.0 mechanism describes the combustion chemistry. El Karma biogas is enriched with H2 at levels from 0% to 50% by volume in the pressure range of 1 to 10 atm. Radiation effects are considered and NO pollutant emissions are calculated, and their production routes explored.
This article is organized into three sections. After introducing the flames’ configurations, simulation details, and models, the results and discussion section presents the numerical simulation results with comments. A conclusion summarizes the main finding and recommendations.
The numerical calculations are achieved on the turbulent confined co-flow diffusion jet flame of Brookes et al. [16] illustrated in Fig. 1. The flame is confined of internal diameter 155 mm. A cylindrical nozzle was therefore constructed with an annular premixed pilot flame, surrounding the main jet fuel jet to ensure flame stability. The diameter orifice for the main fuel flow is 4.07 mm.
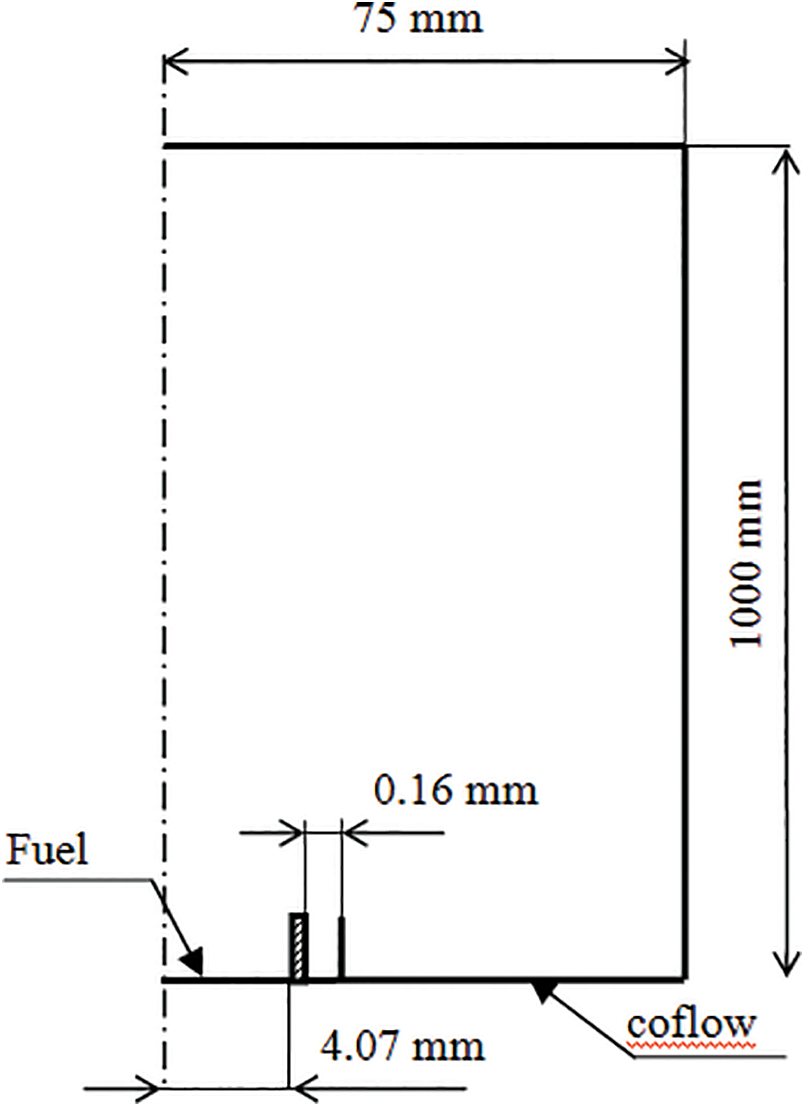
Figure 1: Flame configuration of Brookes et al. [16]
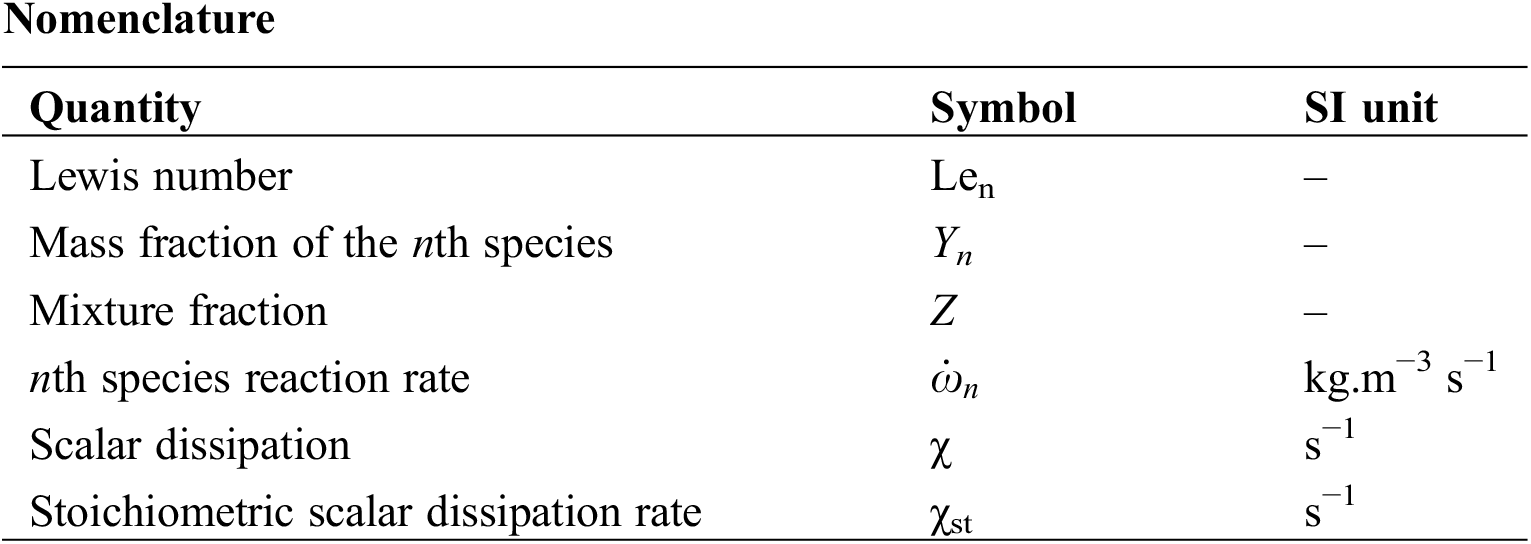
The mathematical model used is based on the Favre-averaged governing equations of mass, momentum, species, and energy respectively given by:
where Yn, T, ρ are the nth species mass fraction, temperature, and density, respectively.
Dn is the molecular mass diffusivity of the nth specie.
The Reynolds Stress Model (RSM) is used for turbulence. The RSM closes the RANS equations by solving the transport equations for the Reynolds stresses without using the eddy-viscosity and it directly computes the individual components of the Reynolds stress tensor, this model is used by these authors in their simulation [17–19]. The combustion is modeled using the laminar flamelet model. Flamelet equations provide a one-dimensional description of the local flame structure in the mixture fraction space. The flamelet equations are given by Pitsch et al. [20] as:
where Len is the Lewis number which is the ratio of the thermal diffusivity to the molecular mass diffusivity of the nth specie Dn. It is given by:
Z is the rate of the fuel in the fuel–oxidizer mixture. It is an important variable in non-premixed flames since it reflects the mixing quality. The mixture fraction is given by Sivathanu et al. [21] as:
Zi is the elemental mass fraction for element i.
The two input parameters in Eqs. (6) and (7) are the mixture fraction Z and the stoichiometric scalar dissipation rate χst.
Mesh Sensitivity
In our simulations, three models with the same geometry and boundary condition but different element sizes are tested illustrated in Table 1 to determine the optimal node spacing and density that would give the desired accuracy [22]. Computations were performed using meshes fineness for the burner with 6000 quadratical cells to minimize computation time.
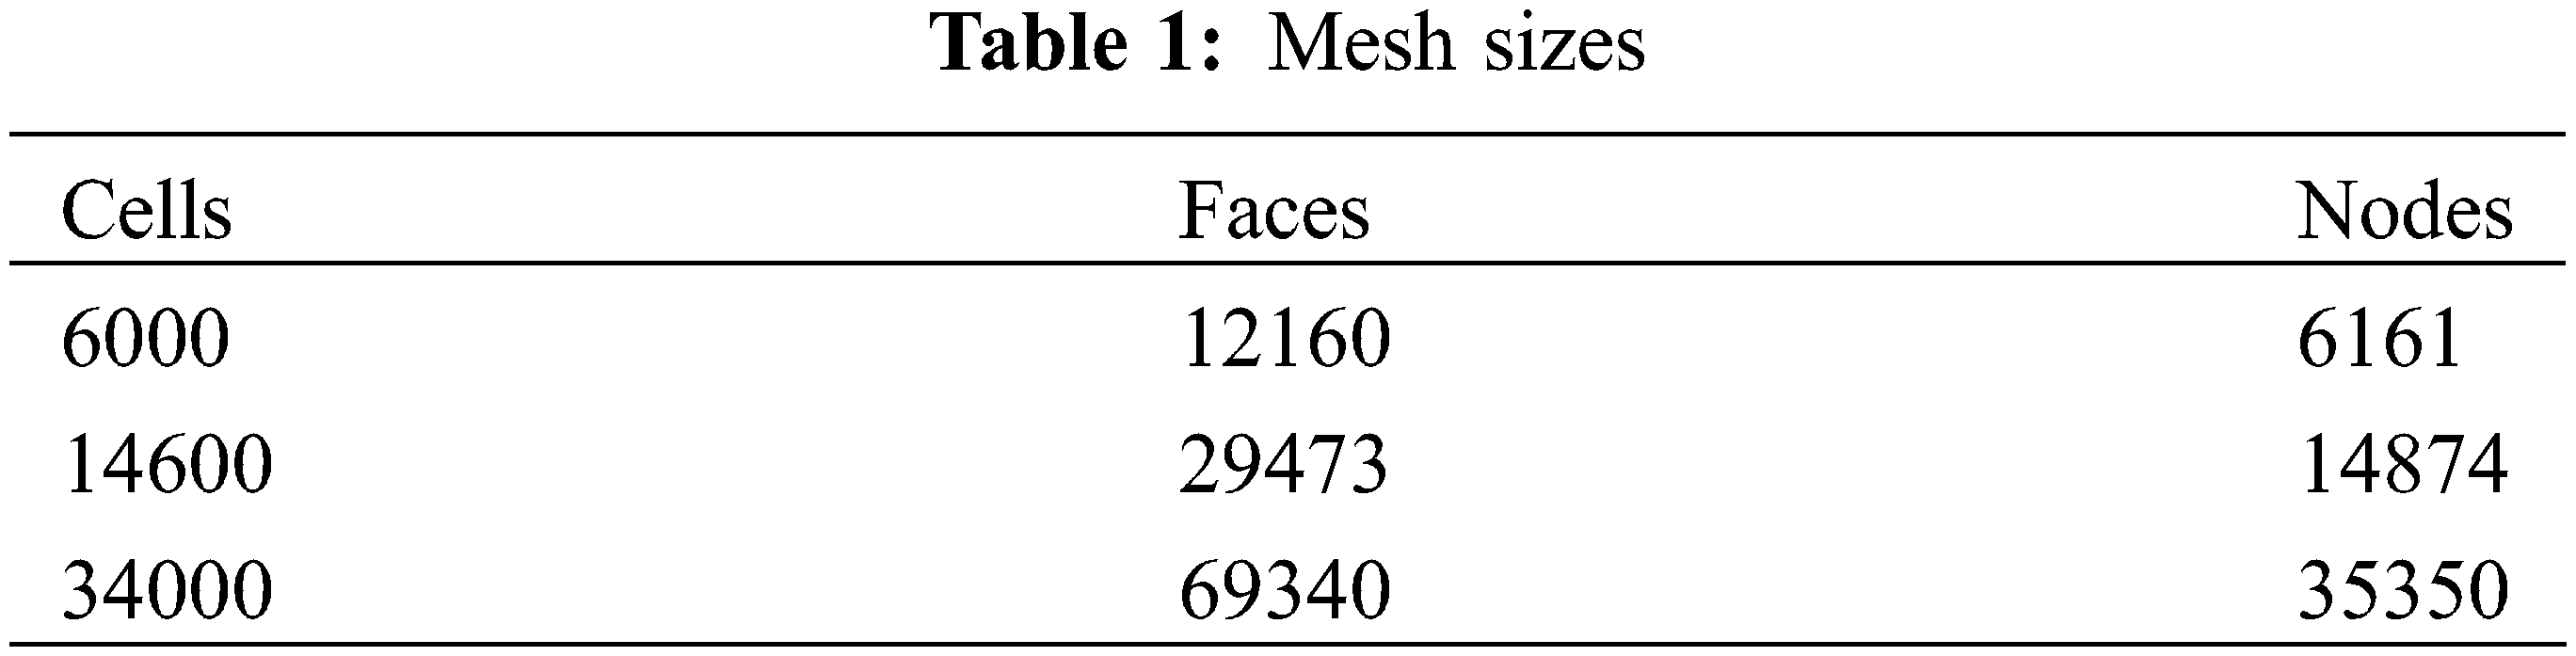
The percentage parameters variation experienced by the quantities representative by the radial temperature when the density of the mesh is increased; de difference between 6000 and 14600 cells does not exceed 4.15% and 5.4% for 6000 and 34000 cells.
In this study, the CFD software Fluent [23] based on the finite-volume methods is solved using algebraic approximations of differential equations, they are solved in 2-D axisymmetric space by pressure-based solver. The Simple scheme is used for pressure-velocity coupling and spatial discretization, the PRESTO scheme for pressure, and the second-order upwind scheme was used for all other equations and the criterion of convergence is 10−6 for the terms of the transport equations [24,25]. In order to simulate the viscous, turbulent, incompressible, steady reacting flow of a Newtonian fluid, the following models are used: Energy, Turbulence–RSM with Non-Equilibrium wall functions, Radiation–DO, Species–Non-premixed (flamelet model) and NOx.
Radiation effects are taken into consideration and calculated using the discrete ordinates (DO) model.
Calculations are performed with Fluent 6.3 [23] CFD code; its authors used the same version [26,27]. The GriMech3.0 [28] mechanism is used to describe the biogas oxidation chemistry. This detailed mechanism with 53 species and 325 reactions has been successfully applied to biogas combustion and gave good pollutant emission predictions [29,30].
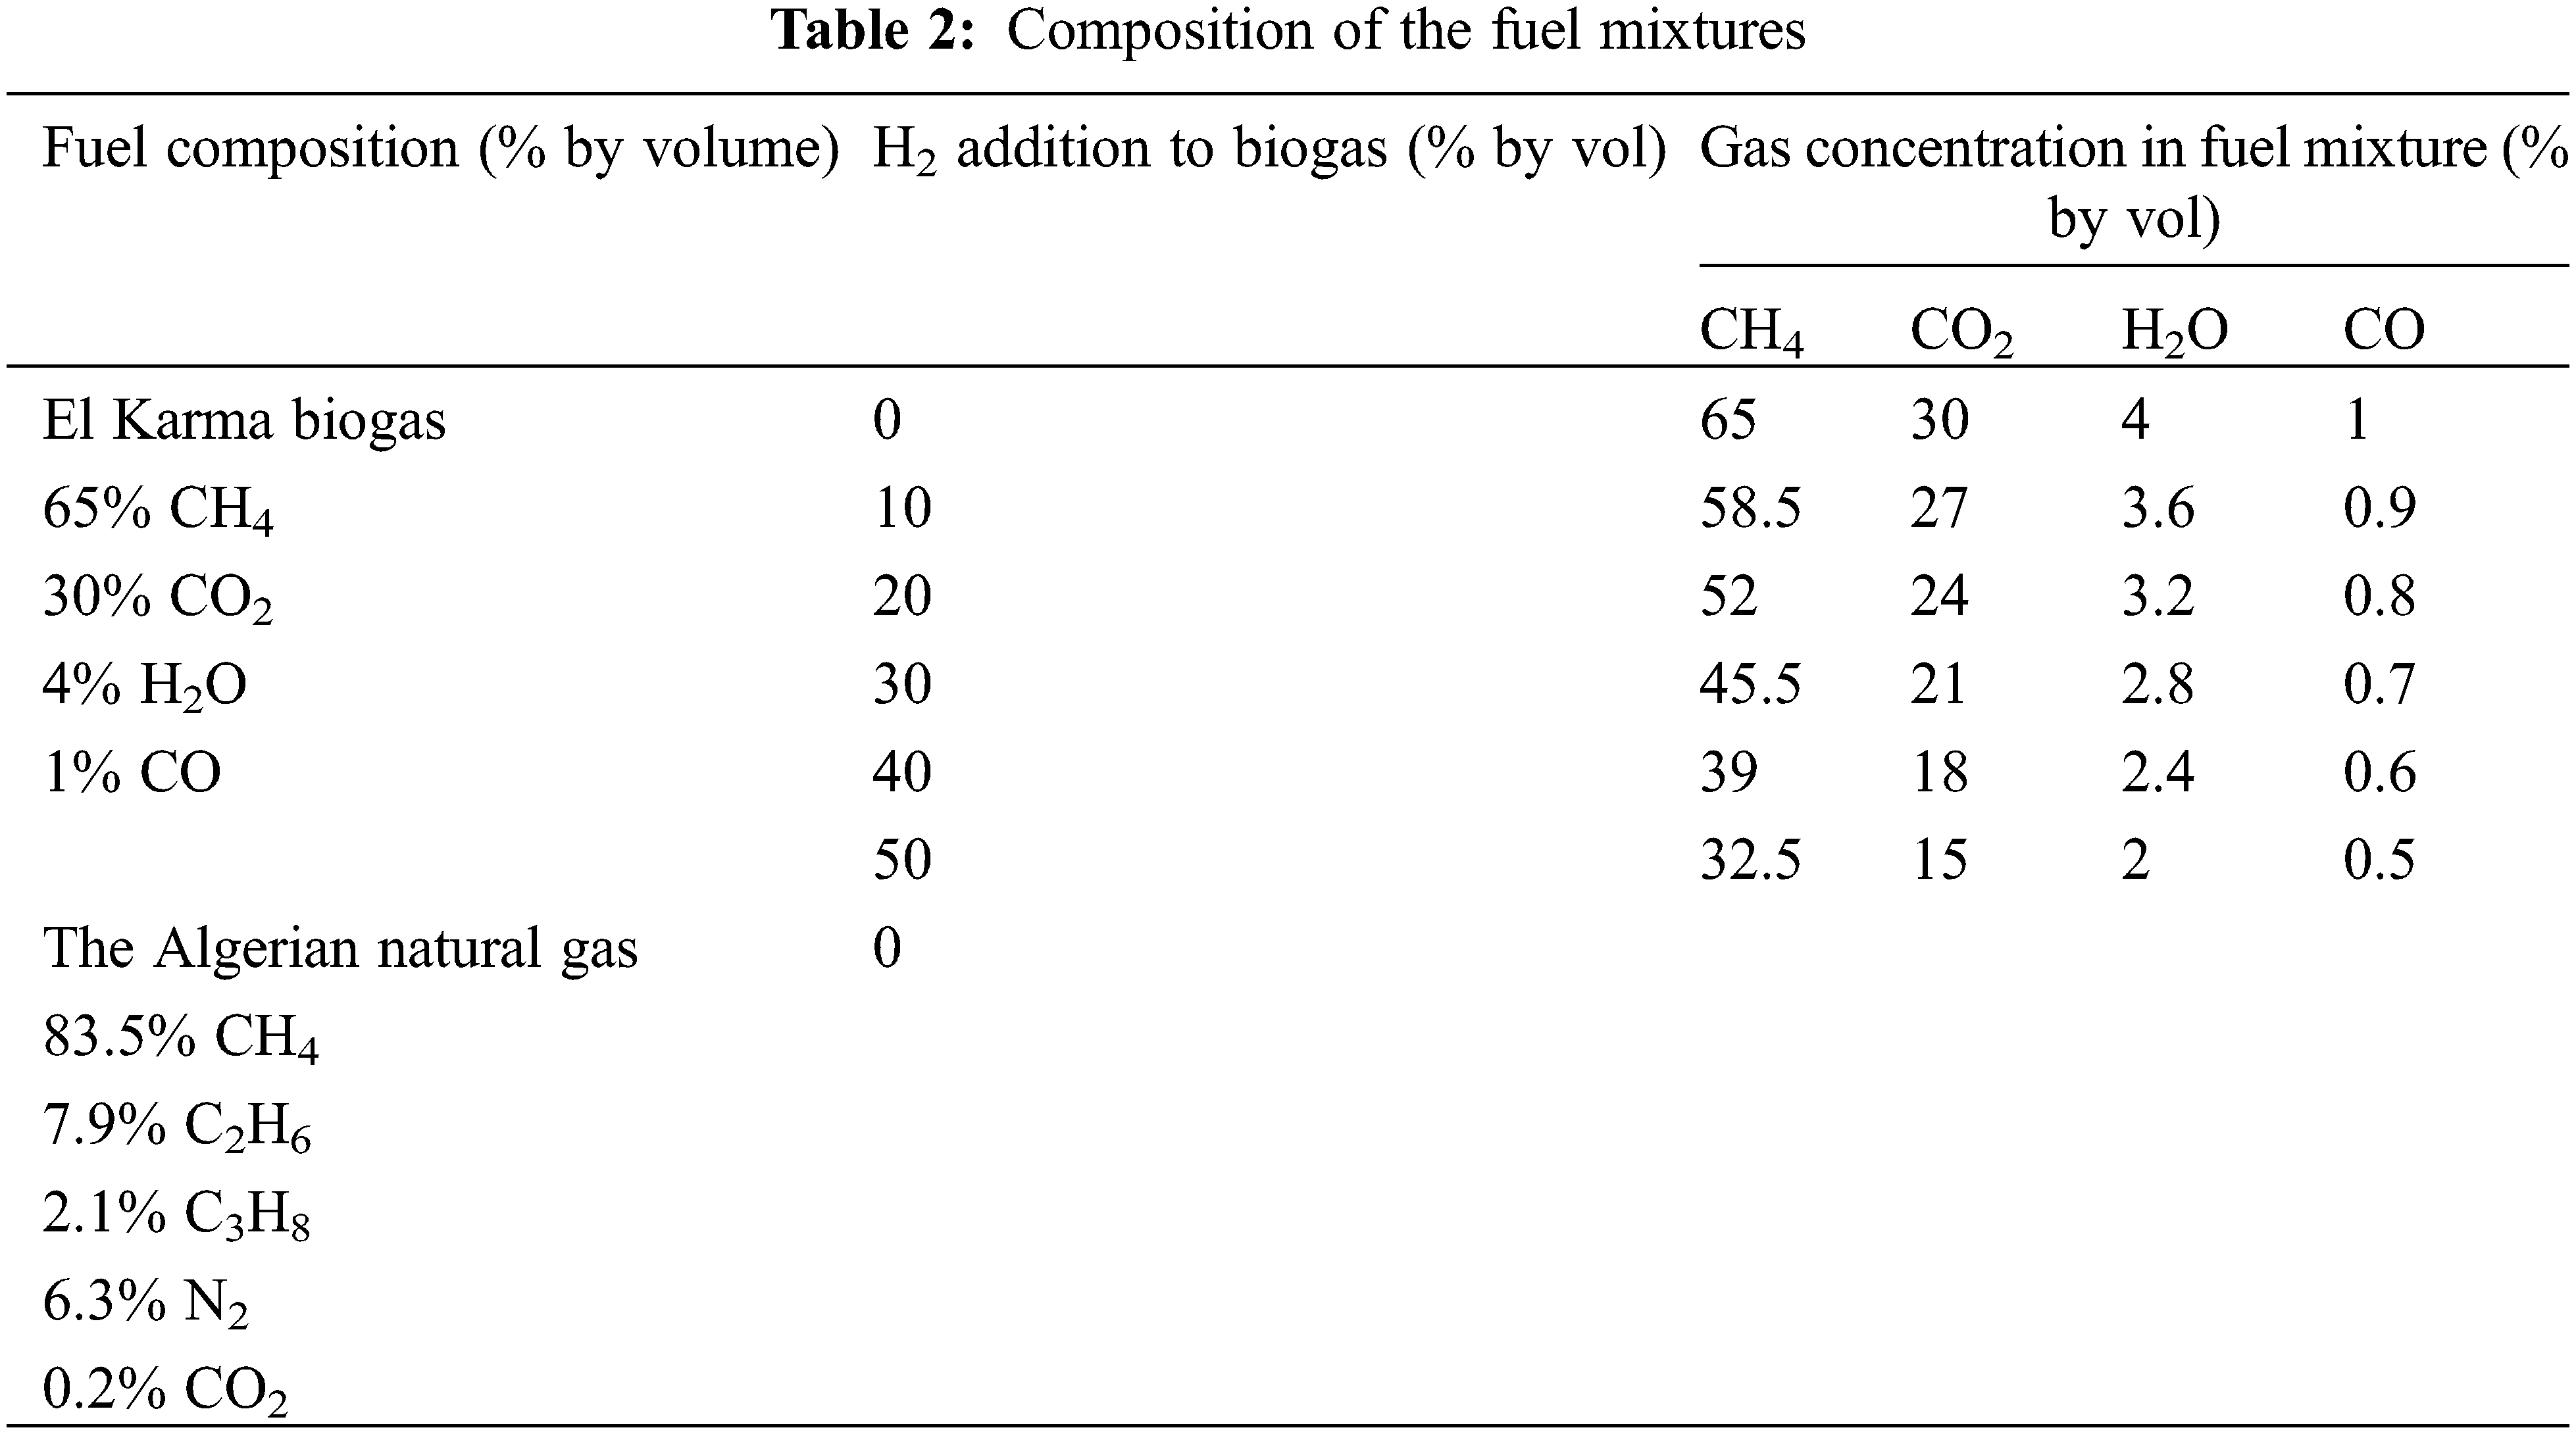
The fuel is the biogas produced in the Algeria, Oran, El Karma wastewater treatment plant [31]. It is enriched with hydrogen at levels from 0% to 50% by volume. The oxidizer is air. The calculations are also performed with the currently available Algerian natural gas to compare its combustion with that of biogas. Table 2 gives the fuel compositions and hydrogen enrichment levels for the present simulation.
The fuel and air mass flows are 10.3 and 708 g/mn and the inlet temperature is 290 K for both flows. The initial turbulence intensity is taken as 10%. The pressure far afield is taken as 1 atm. The pressure effects are also studied by varying pressure from 1 to 10 atm in combination with hydrogen enrichment.
The calculations start with model validation. The numerical simulation results are then presented for different hydrogen levels. Flame structure and pollutant emissions are analyzed.
The laminar flamelet model combined with the GriMech3.0 mechanism was already validated in previous works for different biofuels and its efficiency was already proved [4,11,29,30]. Further validation of this model is achieved in this paper with the Brookes et al. [16] configuration and methane as a fuel. Fig. 2 shows the numerical vs. the Brookes et al. [16] experimental results of centerline and radial temperature and mixture fraction. This comparison shows that the computational and the experimental results are in good agreement since the difference between the two does not exceed 2.2% for the temperature and 1.1% for the mixture fraction.
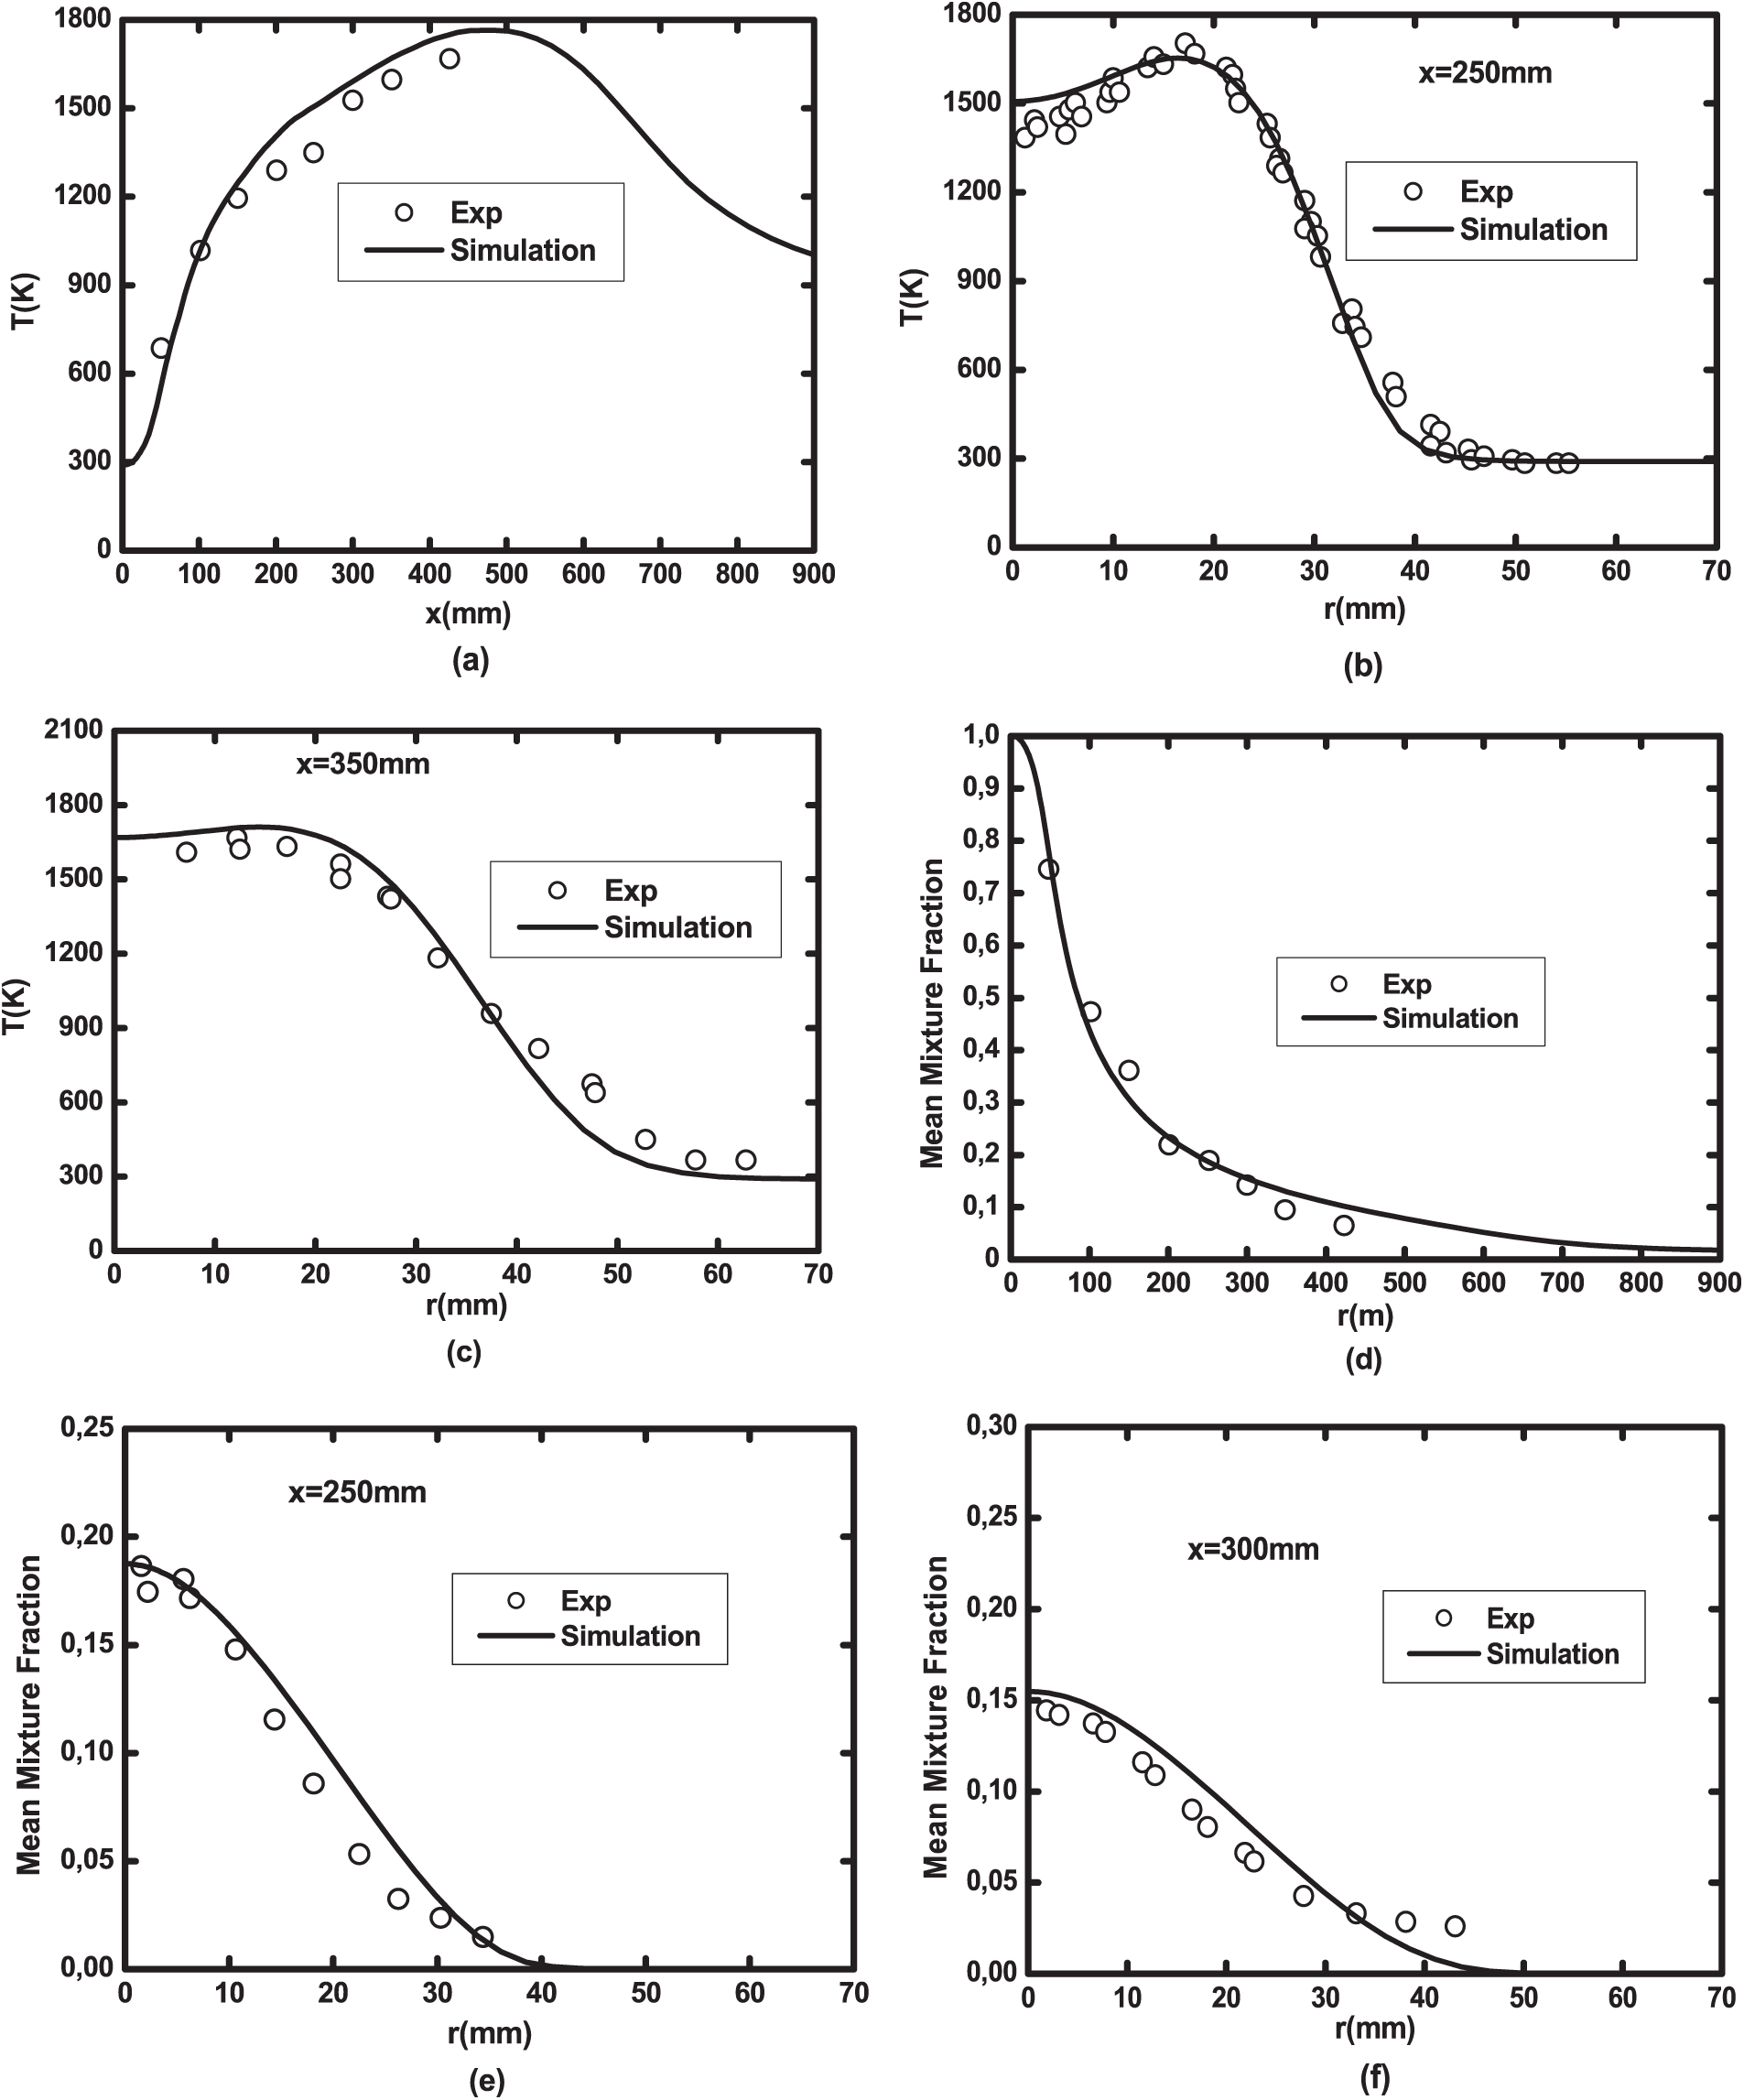
Figure 2: Comparison between the numerical results and the experimental results of the Brookes et al. [16] configuration: (a) axial, (b) x = 250 mm, (c) x = 350 mm temperature profiles and (d) axial, (e) x = 250 mm and (f) x = 300 mm mixture fraction profiles
1. Effects of H2 enrichment on the turbulent flow field
The axial velocity for H2—enriched biogas and natural gas are presented in Fig. 3. All the profiles show the same trend. It is observed that H2—enrichment level does not have a noticeable impact on the velocity decay rate. The jet spread is slightly more important for natural gas since it is lighter than biogas. The dimensionless axial turbulent kinetic energy is depicted in Fig. 4. The profiles exhibit a peak that corresponds to the maximum level of turbulence intensity. Hydrogen enrichment slightly shifts the maximum kinetic energy towards the fuel inlet but does not really have an effect on the peak value.
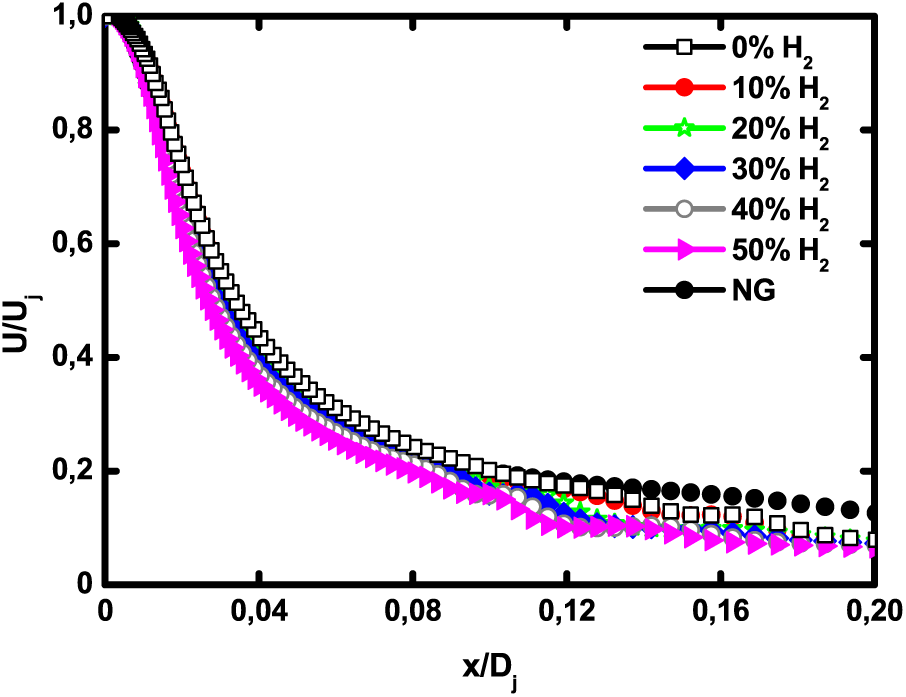
Figure 3: Axial velocity profiles for pure biogas, H2—enriched biogas and natural gas at 1 atm
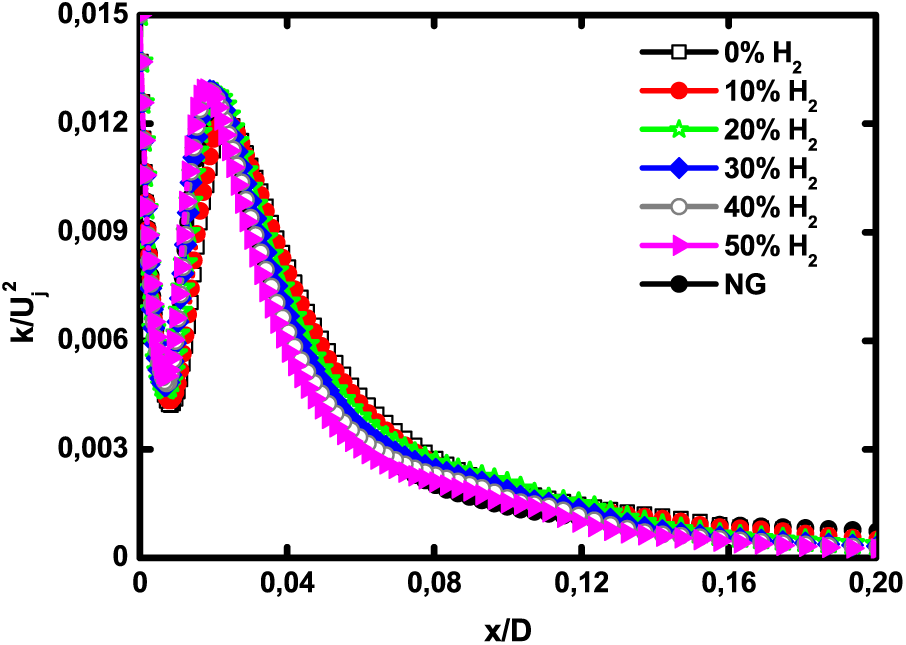
Figure 4: Dimensionless axial turbulent kinetic energy for pure biogas, H2—enriched biogas and natural gas at 1 atm
2. Effects of H2 enrichment on biogas flame structure and species
Hydrogen effects on the biogas flame structure are examined in this section. The axial temperature is presented in Fig. 5. The temperature peak significantly increases with H2 enrichment. The maximum temperatures are 1655.11, 1740.05, 1747.78, 1761.74, 1785.02 and 1807.56 K at 0% H2, 10% H2, 20% H2, 30% H2, 40% H2, and 50% H2, respectively. This trend has also been noticed in hydrogen blended biogas flames by Ilbas et al. [32]. Furthermore, the peak of temperature displaces towards the jet inlet the more the biogas is H2 rich. Fig. 5 also shows that H2 enrichment significantly boosts the biogas temperature. In fact, the pure biogas flame has a temperature slightly less than that of natural gas. After enrichment, the temperature increases until 200 K.
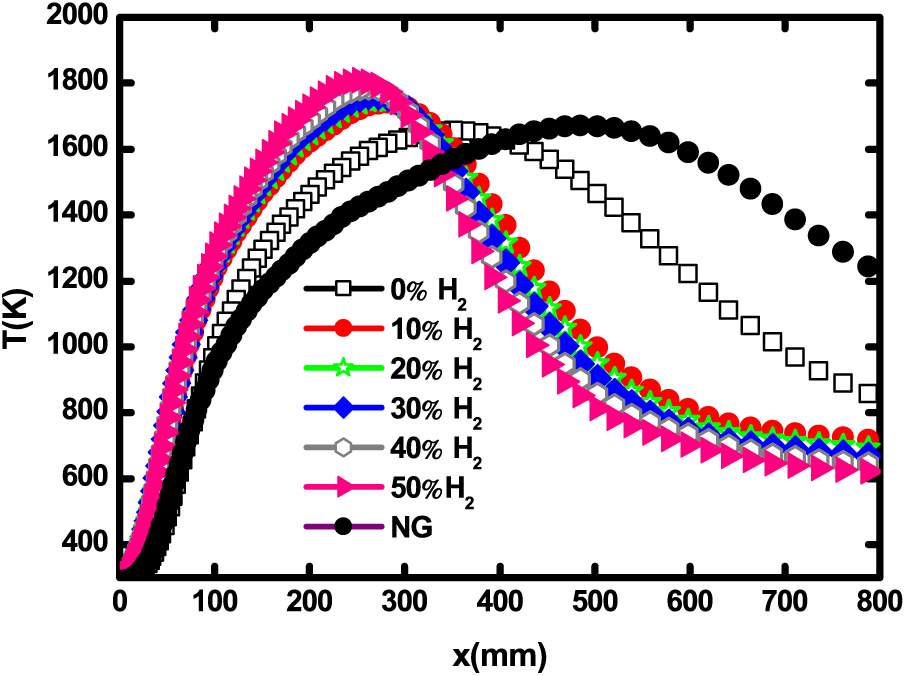
Figure 5: Centerline temperature for different H2 enrichment levels and natural gas at 1 atm
For a more in-depth analysis, the temperature contours are presented in Fig. 6. One can see that the biogas flames are shorter and thinner than the natural gas flame. The latter is longer and more extensive in space. H2 enrichment also shortens the biogas flames. The flames also become thinner the more the H2 level is higher. This property of the H2-enriched flames is important since it prevents the flame from spreading, which improves safety in industrial devices like gas turbines.
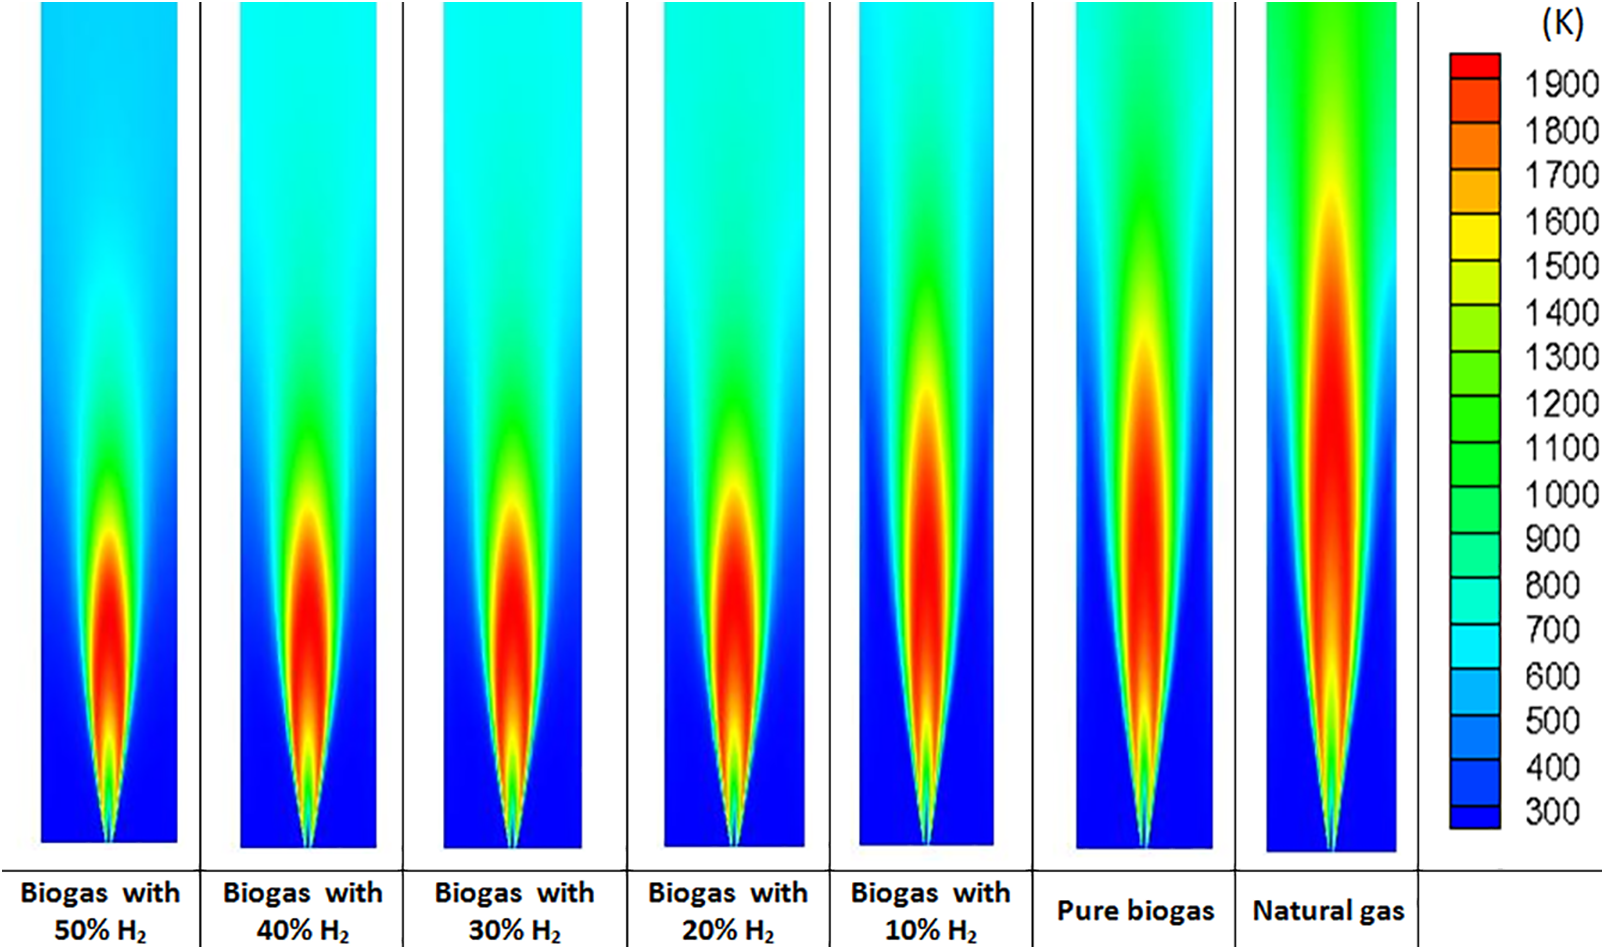
Figure 6: Temperature contours for different H2–enrichment levels and for natural gas at 1 atm
The mixture quality analysis is performed through mixture fraction profiles presented in Fig. 7. The mixture fraction characterizes the mixture state between the fuel jet and the oxidizer, and is also a good indicator of the jet penetration [33]. From Fig. 7, the effect of hydrogen addition is to enhance the mixing between the fuel and the oxidizer. The comparison with natural gas shows that a hydrogen level of 40% gives the same mixing quality as natural gas. The mixing quality is really improved when H2 enrichment level exceeds 50%. The stoichiometric mixture fraction corresponds to the mixture fraction value at the flame front.
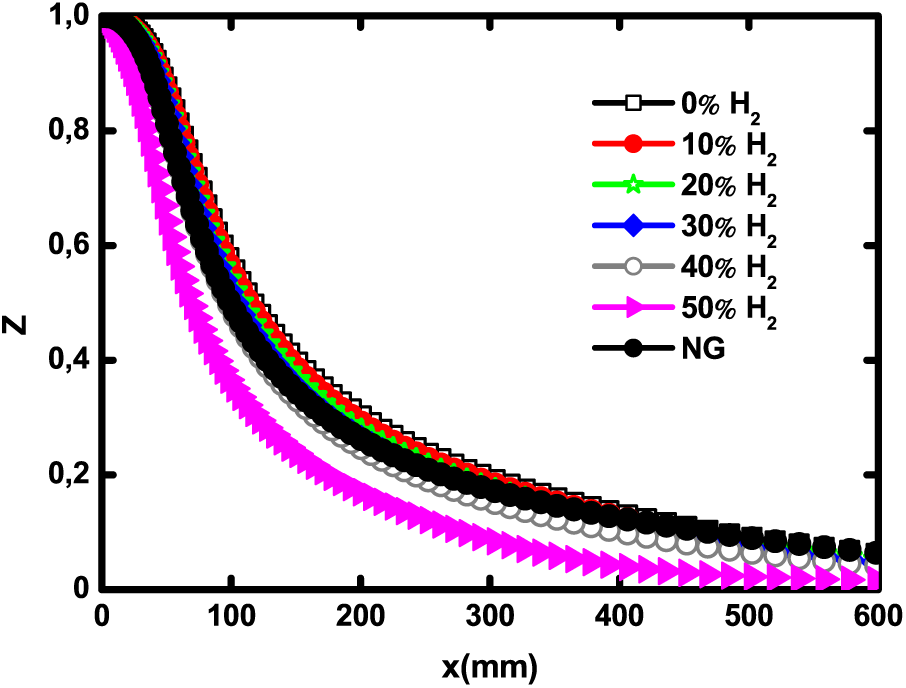
Figure 7: Centerline mixture fraction for different H2 enrichment levels and natural gas at 1 atm
From Fig. 8, Zst decreases with H2 enrichment, which results in a shortening of the flame (as noticed in Fig. 6). This figure also confirms that mixing quality is noticeably improved, especially at 50% H2, which is related to the high diffusivity and lightness of hydrogen [34]. This trend was also noticed by Safer et al. [35].
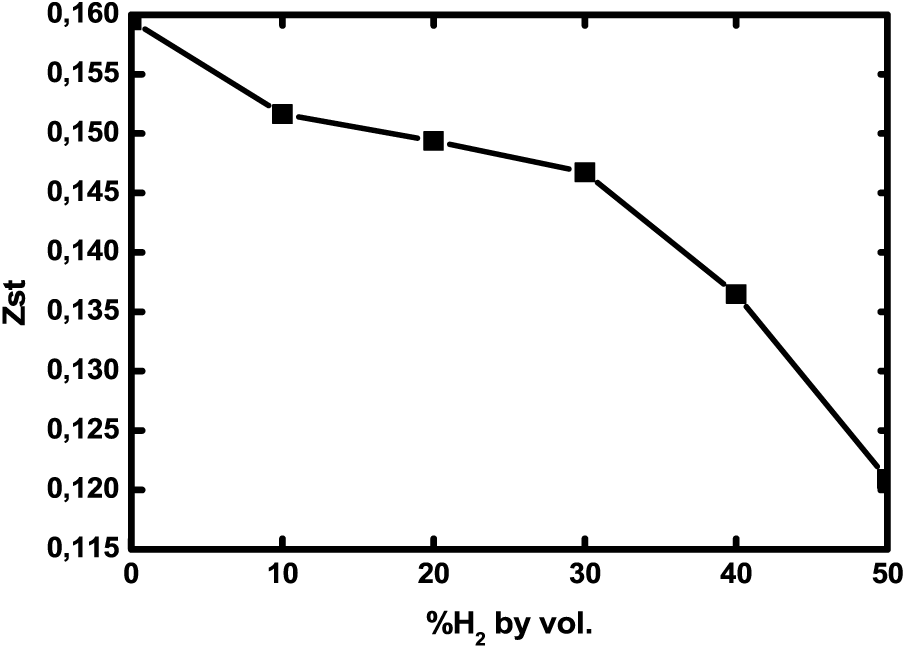
Figure 8: Stoichiometric mixture fraction as a function of H2 enrichment levels at 1 atm
Fig. 9 depicts the axial mass fraction of major and minor species for pure biogas, hydrogen enriched biogas and natural gas. All species’ peaks are displaced towards the fuel inlet as the hydrogen level is increased. Both the H2O and OH mass fractions showed in Figs. 9a and 9b increase with H2 addition. This is explained by the fact that any hydrogen addition involves an increase of H atoms, hence the higher formation of steam and OH. Natural gas flame produces less H2O and less OH than biogas flames. The OH peak coincides with the flame front, that is why the OH tendency is similar to that of axial temperature of Fig. 5. The pollutant species, carbon-monoxide, presented in Fig. 9c increases with H2 addition, while carbon-dioxide decreases. Natural gas produces more carbon-monoxide and less carbon-dioxide than biogas, since this latter is a biogas component.
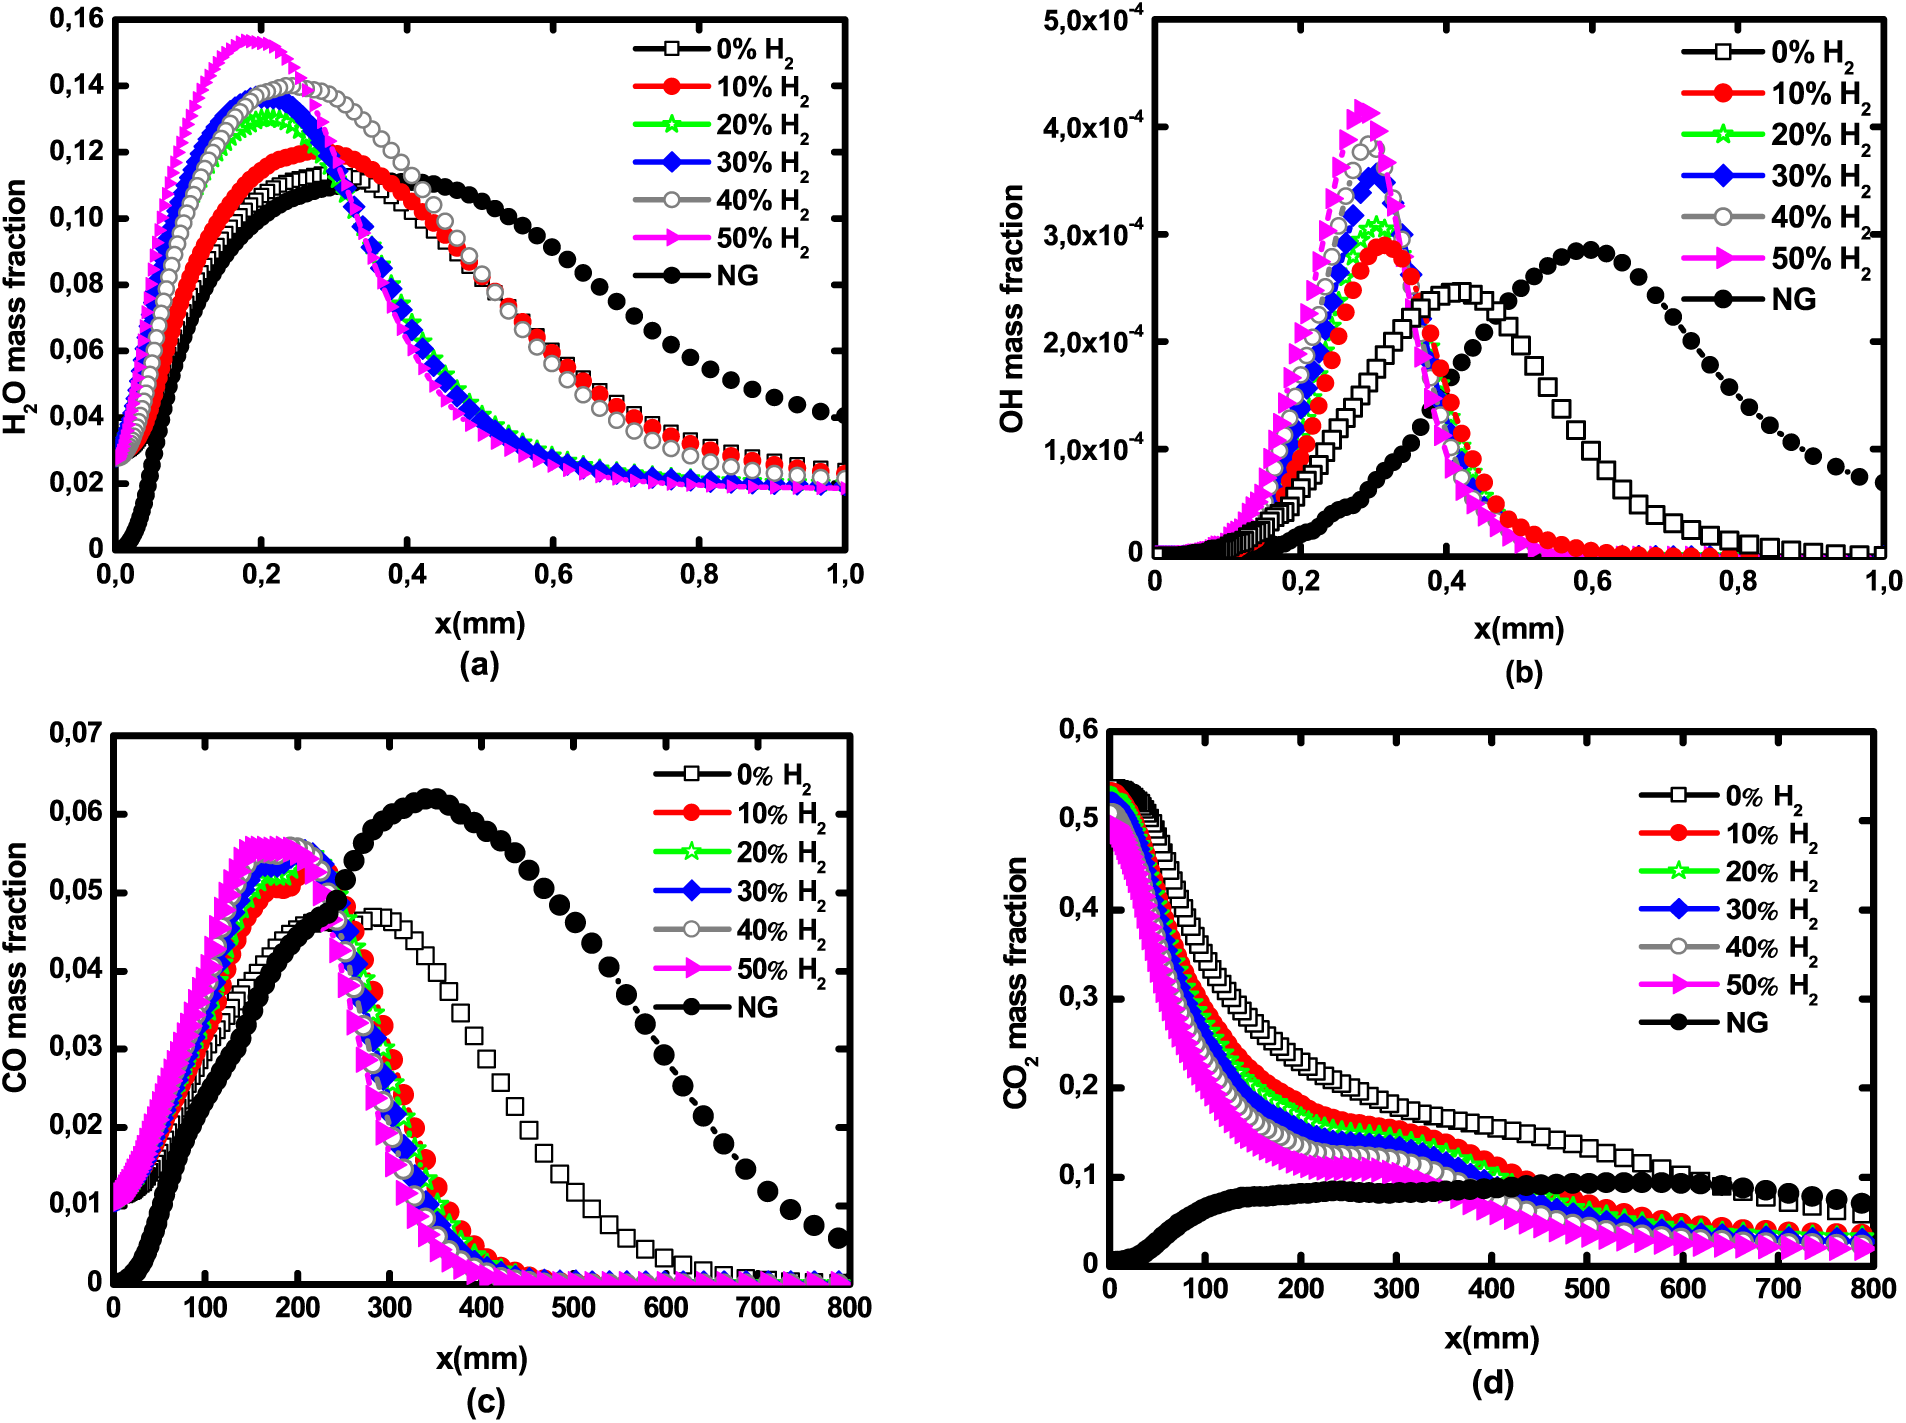
Figure 9: Axial profiles of major and minor species mass fraction for pure biogas, H2—enriched biogas, and natural gas: (a) H2O, (b) OH, (c) CO, and (d) CO2 at 1 atm
3. Effects of H2 enrichment on NOx pollutant emissions
The axial profiles of NO mass fraction for natural gas and biogas with different H2 addition levels are depicted in Fig. 10. In addition to finding that the addition of H2 increases the production of NO, the results show that the natural gas flame produces 3 times more NO than the most hydrogen enriched biogas flame. Similar trends were reported by [29,36,33].
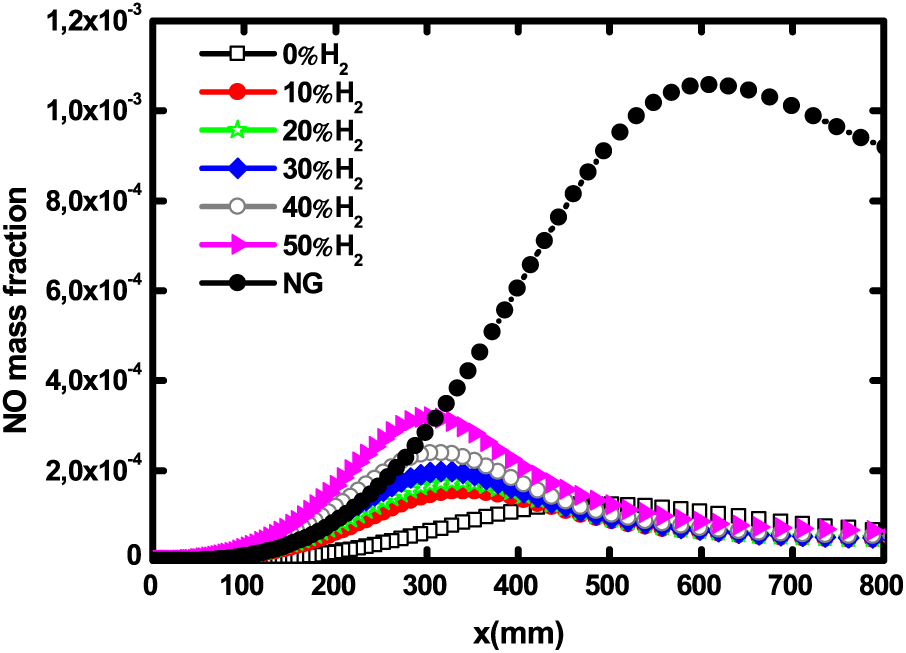
Figure 10: Axial profiles of NO mass fraction for pure biogas, H2—enriched biogas and natural gas at 1 atm
The NO formation routes are analyzed in Fig. 11. NO rate globally rises with H2 addition but experiences a real leap for natural gas. It is obvious that prompt NO is predominant since it represents about 96% of the total NO rate. It is followed by thermal NO. This finding was also reported by Watson et al. [37]. N2O route is however negligible. Prompt NO rate contribution increases with hydrogen addition. The contribution of the N2O route is very small for pure biogas, then it becomes near zero for higher hydrogen enrichment levels as well as for natural gas. This finding was also attested to by Jahangirian et al. [38].
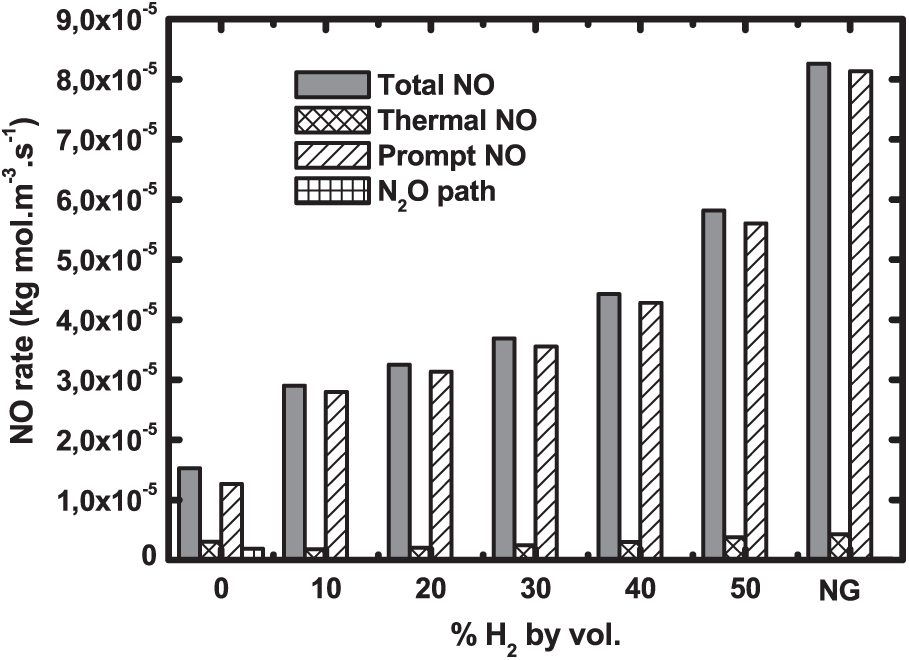
Figure 11: NO formation routes for biogas hydrogen enriched and natural gas at 1 atm
4. Pressure effects on biogas flame structure and emissions
Practical devices like gas turbines are often subject to pressure variations. It is therefore interesting to study the effects of pressure variation on biogas flames. Fig. 12 shows the maximum biogas flame temperature as a function of hydrogen enrichment at different pressures. For each pressure, the temperature increases with hydrogen addition. This increase is more pronounced from pure biogas to 10% H2—enriched biogas, then, it becomes less important. The increase in pressure produces a significant increase of the flame temperature at rates of about 150 K for each hydrogen level. This is consistent with the conclusion of Sahu et al. [39].
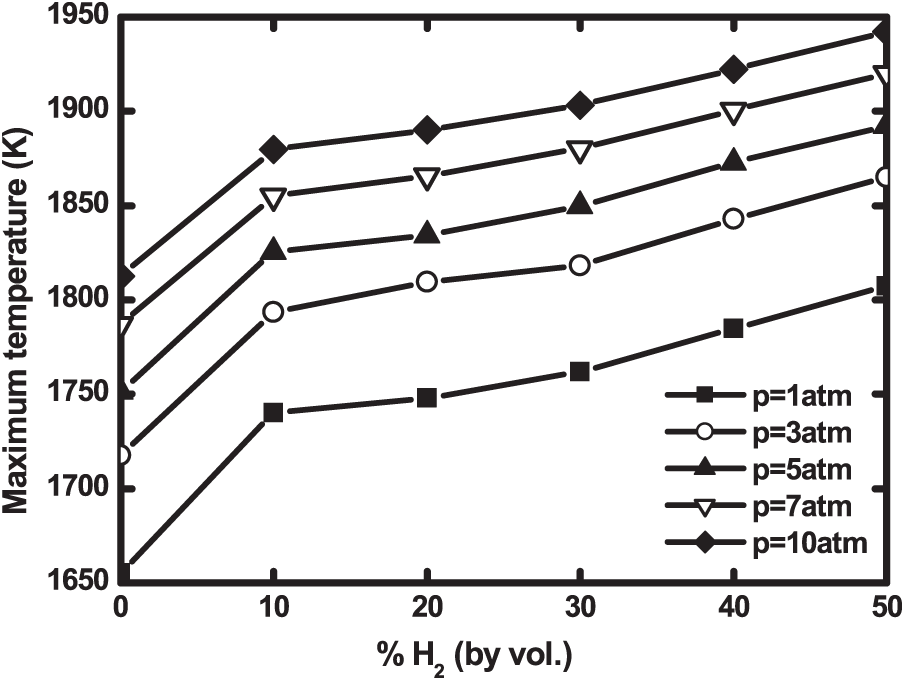
Figure 12: Maximum flame temperature as a function of H2—enrichment at different operating pressures
For the purpose of studying pollutant biogas emissions at pressures higher than 1 atm, the maximum CO and carbon-dioxide mass fractions are shown in Fig. 13 at different operating pressures. CO increases with hydrogen addition, especially between pure biogas and 10% enriched biogas. Then, the rise stabilizes and does not exceed 3.5%. Mameri et al. [12] reported the same tendency. Concerning pressure effects, they are more pronounced from 1 to 5 atm where CO increases by about 34% while it increases by only 5% from 5 to 10 atm. Carbon-dioxide mass fraction drops with H2–—enrichment by 8% from 0% to 50% of hydrogen addition but is slightly affected by pressure rising. The increase is of only 0.7% when the pressure changes from 1 to 10 atm. Hadef et al. [40] found the same trends concerning carbon-dioxide variations with hydrogen enrichment.
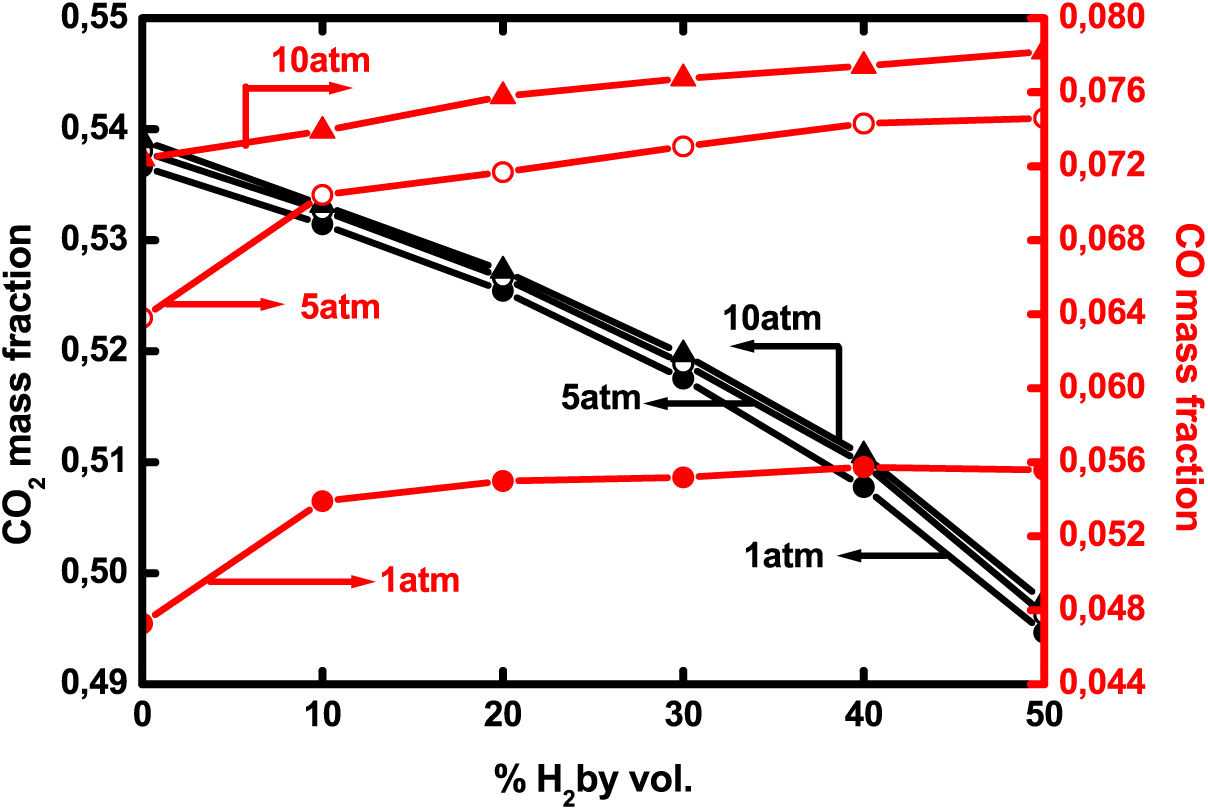
Figure 13: Maximum CO and CO2 mass fractions as a function of H2—enrichment at different operating pressures
The combined effects of H2—enrichment and pressure on the El Karma biogas flames are studied through the maximum NO mass fraction depicted in Fig. 14. NO production is boosted by both hydrogen addition and pressure increase. In fact, the quantity of NO doubles from pure biogas to 50% enriched biogas, while it increases by 79% when pressure varies from 1 to 10 atm. The same effect of H2 addition was also noticed by Tabet et al. [33] and Buyukakin et al. [41] for methane diffusion flames who attested that hydrogen enrichment of pure methane favors the formation of the NOx emissions.
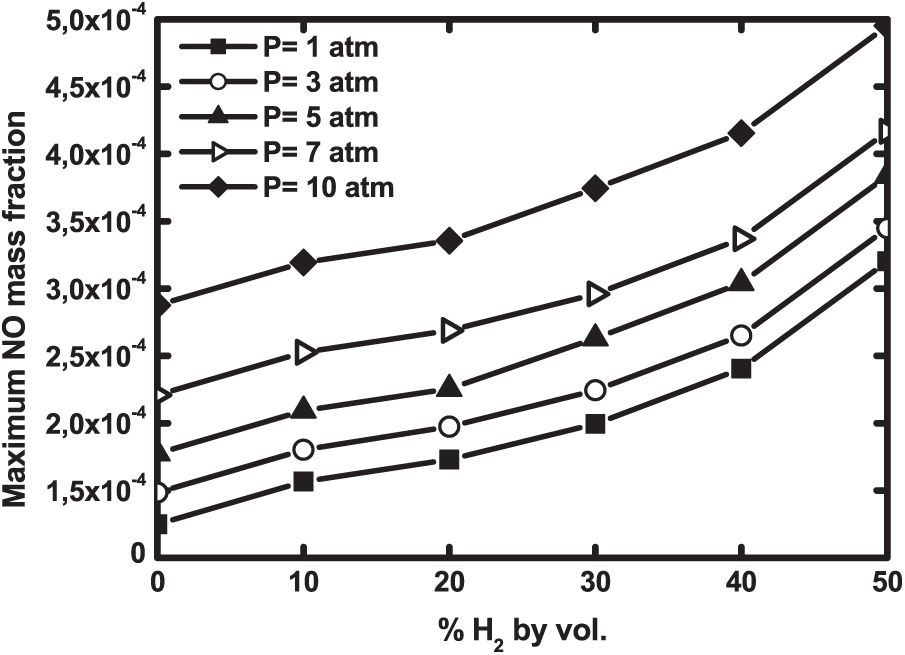
Figure 14: Maximum NO mass fraction as a function of H2—enrichment at different operating pressures
The exploration of NO formation routes at the pressure range of 1 to 10 atm is presented in Fig. 15 for both biogas and natural gas. Increasing pressure significantly boosts NO rate. This increase is amplified by hydrogen addition due to the temperature increase. NO rate value of natural gas is higher than that of hydrogen enriched biogas. It is interesting to notice that the prompt NO is dominant, followed by thermal and N2O formation routes. Unlike under atmospheric pressure, N2O rate contribution increases as pressure increases. It represents about 25% of the total NO at 10 atm.
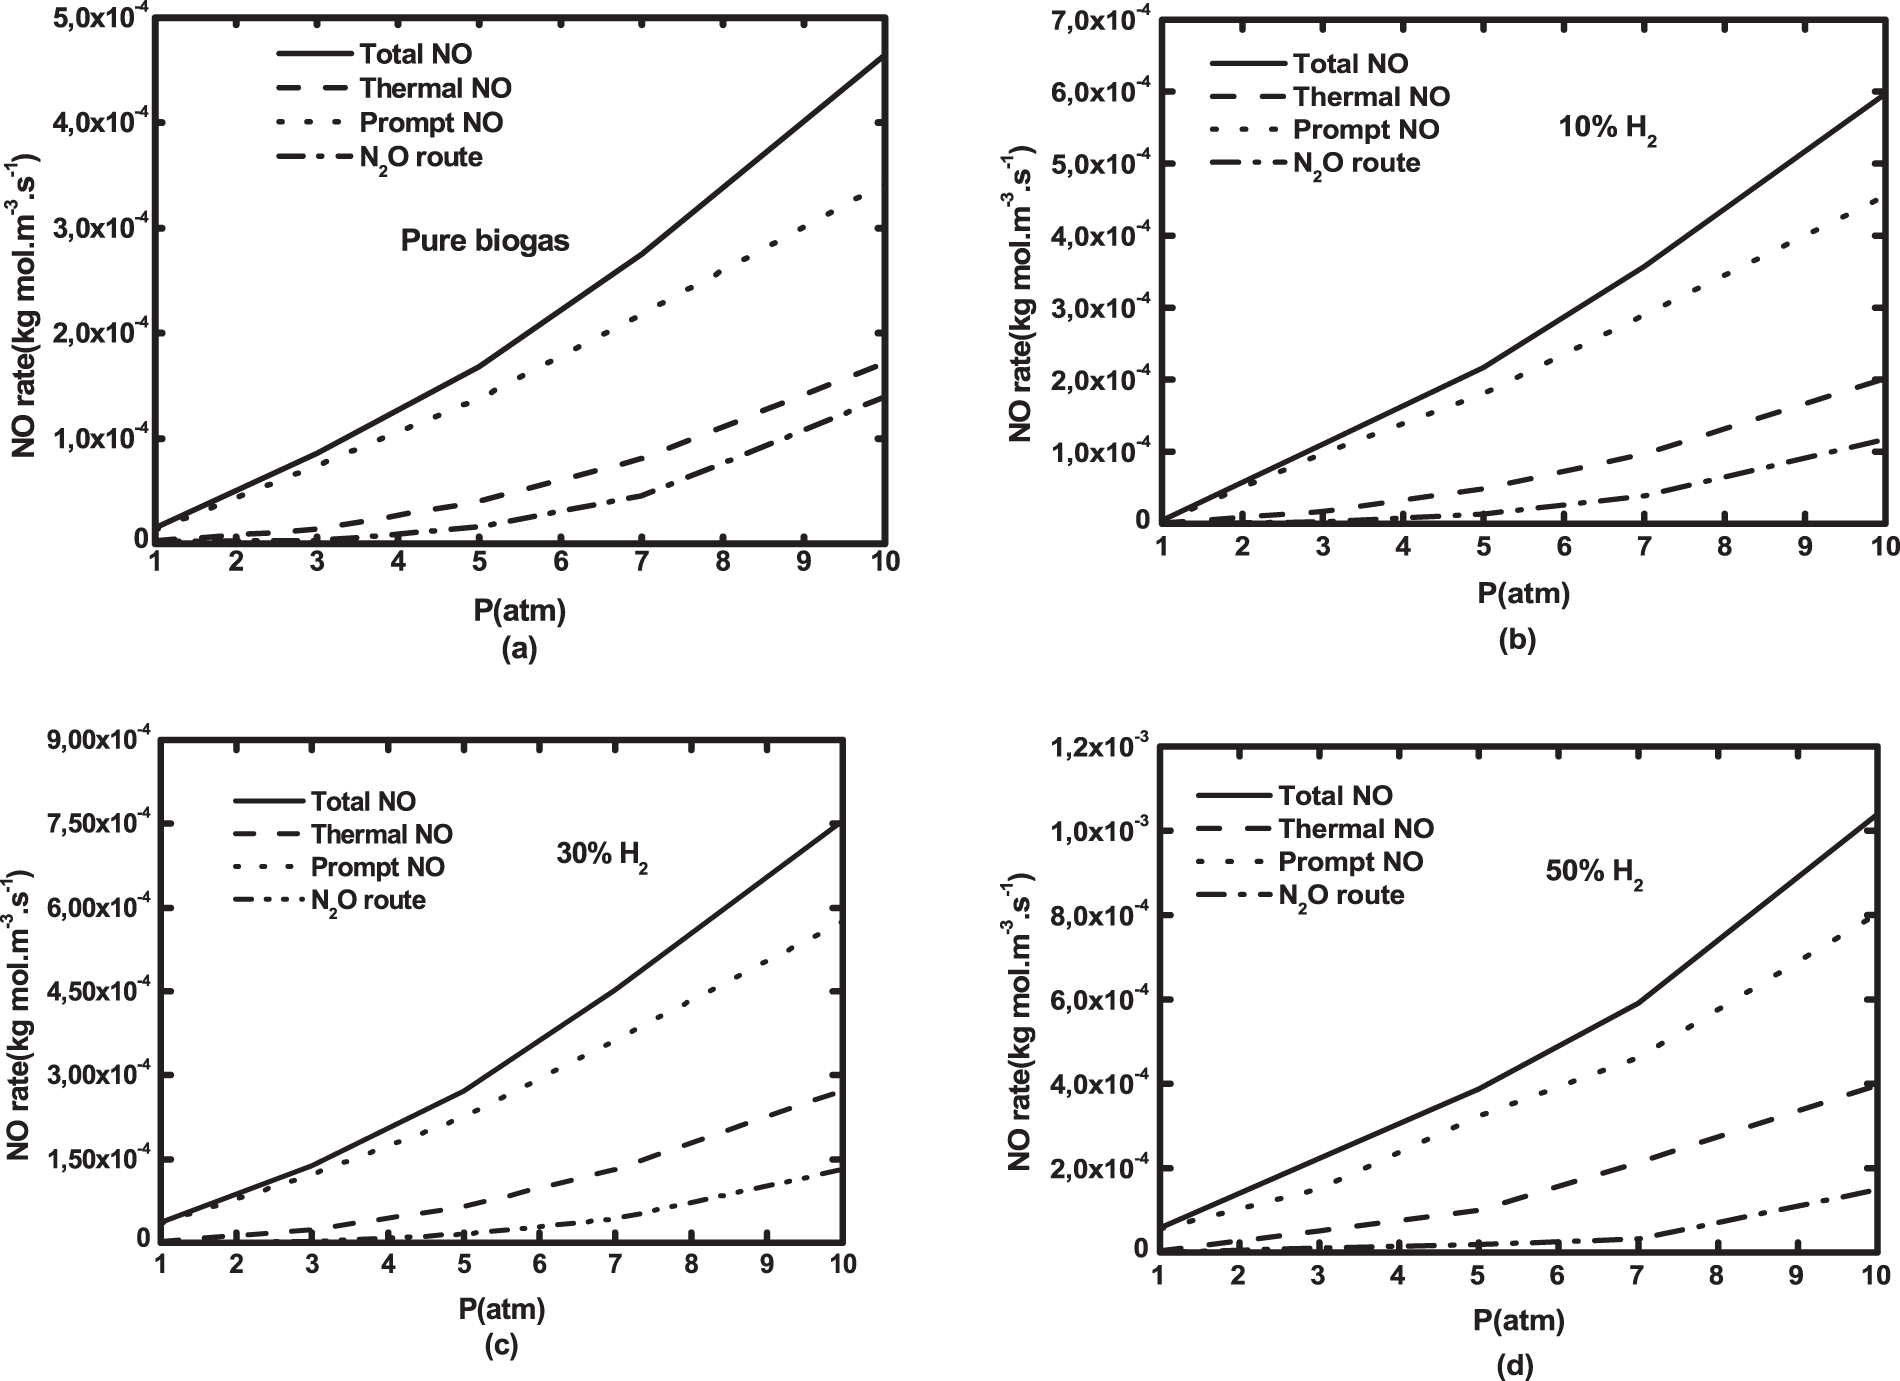
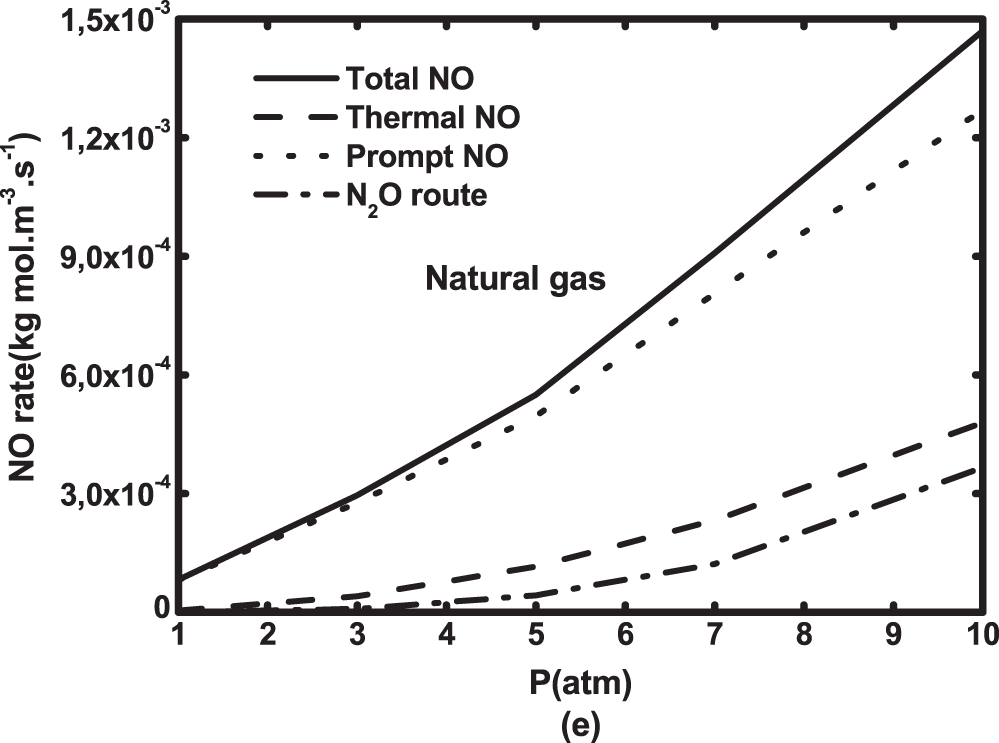
Figure 15: NO formation routes as a function of operating pressure for (a) pure biogas and biogases with H2—enrichment levels of (b) 10%, (c) 30%, (d) 50% by volume and (e) natural gas
Numerical studies of structure and emissions were performed on turbulent confined co-flow diffusion biogas flame enriched with hydrogen. The comparison of the El Karma biogas and Algerian natural gas is also done to favor the replacement of this latter by biogas in industrial systems. The detailed GriMech 3.0 chemical mechanism is incorporated in the flamelet model, this last is coupled with the Reynolds Stress Model for modeling the combustion and turbulence respectively. The hydrogen enrichment raises from 0% to 50% and the ambient pressure is increased from 1 to 10 atm. The following conclusions were made from the numerical simulation:
• H2–—enrichment level does not have a noticeable impact on the velocity and turbulent kinetic energy peaks, they are not sensitive to H2 in the fuel.
• The flame temperature increases with hydrogen addition and becomes higher than that of natural gas flames.
• The effect of hydrogen addition is to enhance the mixing between the fuel and the oxidizer and to make the flame thinner and shorter.
• Carbon-monoxide increases with H2 addition the same trend is noticed when the pressure increases, while carbon-dioxide decreases with hydrogen fraction added.
• Natural gas produces more carbon-monoxide and less carbon-dioxide than biogas.
• The pressure rising produces a significant increase of the flame temperature.
• NO production rate rises with H2 addition and pressure. It is significantly higher for natural gas than hydrogen enriched biogas;
• The prompt NO is dominant with de formation of CH radical, followed by thermal and N2O formation routes.
• Unlike under atmospheric pressure, N2O rate contribution is getting bigger with pressure increasing.
Biogas enriched with hydrogen is recommended as an alternative fuel to natural gas in practical combustion devices, since it improves the combustion temperature and mixing, with pollutant emission levels lower than that produced by conventional natural flames. It was also conducted that the hydrogen enriched biogas flames are shorter than natural gas flames, which improves safety in the burner by preventing too much flame spreading. For operating pressures higher than 5 atm, it is recommended to burn low H2—enriched biogases to strike a compromise between temperature and an acceptable level of NO.
Acknowledgement: None.
Funding Statement: The authors received no specific funding for this study.
Author Contributions: N. Krarraz, K. Safer, A. Ouadha; data collection: N. Krarraz, K. Safer; analysis and interpretation of results: N. Krarraz, K. Safer, A. Sabeur; draft manuscript preparation: N. Krarraz, K. Safer, A. Sabeur, A. Ouadha. All authors reviewed the results and approved the final version of the manuscript.
Availability of Data and Materials: Data associated with this article can be found, in the online version, at 10.32604/fdmp.2023.026238.
Conflicts of Interest: The authors declare that they have no conflicts of interest to report regarding the present study.
References
1. World Bioenergy Association, Global bioenergy statistics 2020. http://www.worldbioenergy.org/global-bioenergy-statistics/2021 [Google Scholar]
2. Chandra, A., Tiwari, G. N., Srivastava, V. K., Yadav, Y. P. (1991). Performance evaluation of biogas burners. Energy Conversion, 32(4), 353–358. [Google Scholar]
3. Sarras, G., Mahmoudi, Y., Arteaga Mendez, L. D., van Veen, E. H., Tummers, M. J. et al. (2014). Modeling of turbulent natural gas and biogas flames of the Delft Jet-in-Hot-Coflow burner: Effects of coflow temperature, fuel temperature and fuel composition on the flame lift-off height. Flow Turbulence Combustion, 93, 607–635. https://doi.org/10.1007/s10494-014-9555-3 [Google Scholar] [CrossRef]
4. Hoerlle, C. A., Zimmer, L., Pereira, F. M. (2017). Numerical study of CO2 effects on laminar non-premixed biogas flames employing a global kinetic mechanism and the flamelet-generated manifold technique. Fuel, 203, 671–685. [Google Scholar]
5. Sahin, M., Ilbas, M. (2019). Analysis of the effect of H2O content on combustion behaviours of a biogas fuel. International Journal of Hydrogen Energy, 45, 3651–3659. [Google Scholar]
6. Yilmaz, I., Cam, Y., Alabas, B. (2022). Effect of N2 dilution on combustion instabilities and emissions in biogas flame. Fuel, 308, 121943. [Google Scholar]
7. Nivethana Kumar, R., Raghavan, V. (2021). Numerical simulations of biogas flames using OpenFOAM. AIP Conference Proceedings, 2403, 030003. [Google Scholar]
8. Leung, T., Wierzba, I. (2008). The effect of hydrogen addition on biogas non-premixed jet flame stability in a co-flowing air stream. International Journal of Hydrogen Energy, 33, 3856–3862. [Google Scholar]
9. Zhen, H. S., Leng, C. W., Cheung, C. S. (2013). Effects of hydrogen addition on the characteristics of a biogas diffusion flame. International Journal of Hydrogen Energy, 38, 6874–6881. [Google Scholar]
10. Zhen, H. S., Leung, C. W., Cheung, C. S. (2014). A comparison of the heat transfer behaviors of biogaseH2 diffusion and premixed flames. International Journal of Hydrogen Energy, 39, 1137–1144. [Google Scholar]
11. Mameri, A., Tabet, F. (2016). Numerical investigation of counter-flow diffusion flame of biogas-hydrogen blends: Effects of biogas composition, hydrogen enrichment and scalar dissipation rate on flame structure and emissions. International Journal of Hydrogen Energy, 41, 2011–2022. [Google Scholar]
12. Mameri, A., Tabet, F., Hadef, F. (2018). MILD combustion of hydrogenated biogas under several operating conditions in an opposed jet configuration. International Journal of Hydrogen Energy, 43, 3566–3576. [Google Scholar]
13. Zhen, H. S., Wei, Z. L., Chen, Z. B., Xiao, M. W., Fu, L. R. et al. (2018). An experimental comparative study of the stabilization mechanism of biogas-hydrogen diffusion flame. International Journal of Hydrogen Energy, 44, 1988–1997. [Google Scholar]
14. Amez, I., Castells, B., Llamas, B., Bolonio, D., García-Martínez, M. J. et al. (2021). Experimental study of biogas-hydrogen mixtures combustion in conventional natural gas systems. Applied Sciences, 11, 6513. [Google Scholar]
15. Amez, I., Castells, B., Ortega, M. F., Llamas, B., Garcia-Torrent, J. (2022). Experimental study of flame zones variations of biogas enriched with hydrogen. International Journal of Hydrogen Energy, 47(57), 24212–24222. [Google Scholar]
16. Brookes, S. J., Moss, J. B. (1999). Measurements of soot production and thermal radiation from confined turbulent jet diffusion flames of methane. Combustion and Flame, 116, 49–61. [Google Scholar]
17. Elwina, E., Sylvia, N., Wusnah, W., Yunardi, Y., Bindar, Y. (2020). Soot formation model performance in turbulent non-premix ethylene flame: A comparison study. IOP Conference Series: Materials Science and Engineering, 854, 012073. [Google Scholar]
18. Khodabandeh, E., Moghadasi, H., Pour, M. S., Ersson, M., Jönsson, P. G. et al. (2020). CFD study of non-premixed swirling burners: Effect of turbulence models. Chinese Journal of Chemical Engineering, 28, 1029–1038. [Google Scholar]
19. Rudra, N., Sreedhara, R. (2016). Modelling of methanol and H2/CO bluff-body flames using RANS based turbulence models with conditional moment closure model. Applied Thermal Engineering, 93, 561–570 [Google Scholar]
20. Pitsch, H., Peters, N. (1998). A consistent flamelet formulation for non-premixed combustion considering differential diffusion effects. Combustion and Flame, 114, 26–40. [Google Scholar]
21. Sivathanu, Y. R., Faeth, G. M. (1990). Generalized state relationships for scalar properties in non-premixed hydrocarbon/air flames. Combustion and Flame, 82, 211–230. [Google Scholar]
22. Jo, H., Kang, K., Park, J., Changkook, R., Ahn, H. et al. (2020). Detailed assessment of mesh sensitivity for CFD simulation of coal combustion in a tangential-firing boiler. Journal of Mechanical Science and Technology, 34(2), 917–930. [Google Scholar]
23. Fluent-ANSYI (2006). FLUENT 6.3.26. 2006. User’s Manual and Tutorial Guide. Fluent Inc. [Google Scholar]
24. Noor, M., Wandel, M., Yusaf, T. (2014). The simulation of biogas combustion in a mild burner. Journal of Mechanical Engineering and Sciences, 6, 995–1013. [Google Scholar]
25. Zhao, T., Chen, C., Ye, H. (2021). CFD Simulation of hydrogen generation and methane combustion inside a water splitting membrane reactor. Energies, 14, 7175. [Google Scholar]
26. Zhang, J., Li, X., Yang, H. L., Jiang, L. Q., Wang, X. H. (2017). Study on the combustion characteristics of non-premixed hydrogen micro-jet flame and the thermal interaction with solid micro tube. International Journal of Hydrogen Energy, 42, 3853–3862. [Google Scholar]
27. Kutkan, H., Amato, A., Campa, G., Ghirardo, G., Tay Wo Chong, L. et al. (2022). Modeling of turbulent premixed CH4/H2/air flames including the influence of stretch and heat losses. Journal of Engineering for Gas Turbines and Power, 144, 011020. [Google Scholar]
28. Smith, G. P., Golden, D. M., Frenklach, M., Moriarty, N. W., Eiteneer, B. et al. (2021). GRI Mech-3.0. http://combustion.berkeley.edu/gri-mech/ [Google Scholar]
29. Safer, K., Tabet, F., Ouadha, A., Safer, M., Gökalp, I. (2013). Combustion characteristics of hydrogen-rich alternative fuels in counter-flow diffusion flame configuration. Energy Conversion and Management, 74, 269–278. [Google Scholar]
30. Safer, K., Tabet, F., Ouadha, A., Safer, M., Gökalp, I. et al. (2014). Simulation of a syngas counter-flow diffusion flame structure and NO emissions in the pressure range 1–10 atm. Fuel Processing Technology, 123, 149–158. [Google Scholar]
31. STEP El-Karma (2017). https://www.seor.dz/metiers-de-leau/assainissement/stations-depuration/ [Google Scholar]
32. Ilbas, M., Sahin, M. (2017). Effects of turbulator angle and hydrogen addition on a biogas turbulent diffusion flame. International Journal of Hydrogen Energy, 42, 25735–25743. [Google Scholar]
33. Tabet, F., Sarh, B., Gökalp, I. (2009). Hydrogen-hydrocarbon turbulent nonpremixed flame structure. International Journal of Hydrogen Energy, 34, 5040–5047. [Google Scholar]
34. Frassoldati, A., Sharma, P., Cuoci, A., Faravelli, T., Ranzi, E. (2010). Kinetic and fluid dynamics modeling of methane/hydrogen jet flames in diluted coflow. Applied Thermal Engineering, 30, 376–383. [Google Scholar]
35. Safer, K., Tabet, F., Safer, M. (2016). A numerical investigation of structure and NO emissions of turbulent syngas diffusion flame in counter-flow configuration. International Journal of Hydrogen Energy, 41, 3208–3221. [Google Scholar]
36. Fischer, M., Jiang, X. (2015). An investigation of the chemical kinetics of biogas combustion. Fuel, 150, 711–720. [Google Scholar]
37. Watson, G. M. G., Munzar, J. D., Bergthorson, J. M. (2014). NO formation in model syngas and biogas blends. Fuel, 124, 113–124. [Google Scholar]
38. Jahangirian, S., Engeda, A., Wichman, I. S. (2009). Thermal and chemical structure of biogas counterflow diffusion flames. Energy Fuels, 23, 5312–5321. [Google Scholar]
39. Sahu, A. B., Ravikrishna, R. V. (2014). A detailed numerical study of NOx kinetics in low calorific value H2/CO syngas flames. International Journal of Hydrogen Energy, 39, 17358–17370. [Google Scholar]
40. Hadef, A., Mameri, A., Tabet, F., Aouachria, Z. (2018). Effect of the addition of H2 and H2O on the polluting species in a counter-flow diffusion flame of biogas in flameless regime. International Journal of Hydrogen Energy, 43, 3475–3481. [Google Scholar]
41. Buyukakin, M. K., Oztuna, S. (2020). Numerical investigation on hydrogen-enriched methane combustion in a domestic back-pressure boiler and non-premixed burner system from flame structure and pollutants aspect. International Journal of Hydrogen Energy, 45, 35246–35352. [Google Scholar]
Cite This Article
 Copyright © 2024 The Author(s). Published by Tech Science Press.
This work is licensed under a Creative Commons Attribution 4.0 International License , which permits unrestricted use, distribution, and reproduction in any medium, provided the original work is properly cited.
 Downloads
 Citation Tools