
 Submit a Paper
 Propose a Special lssue
 Open Access
ARTICLE

An Investigation into the Compressive Strength, Permeability and Microstructure of Quartzite-Rock-Sand Mortar
School of Civil Engineering, Architecture and Environment, Hubei University of Technology, Wuhan, 430068, China
* Corresponding Author: Wei Chen. Email:
(This article belongs to the Special Issue: Advances in Solid Waste Processing and Recycling Technologies for Civil Engineering Materials)
Fluid Dynamics & Materials Processing 2024, 20(4), 859-872. https://doi.org/10.32604/fdmp.2023.029310
Received 12 February 2023; Accepted 05 May 2023; Issue published 28 March 2024
 View Full Text
 Download PDF
Abstract
River sand is an essential component used as a fine aggregate in mortar and concrete. Due to unrestrained exploitation, river sand resources are gradually being exhausted. This requires alternative solutions. This study deals with the properties of cement mortar containing different levels of manufactured sand (MS) based on quartzite, used to replace river sand. The river sand was replaced at 20%, 40%, 60% and 80% with MS (by weight or volume). The mechanical properties, transfer properties, and microstructure were examined and compared to a control group to study the impact of the replacement level. The results indicate that the compressive strength can be improved by increasing such a level. The strength was improved by 35.1% and 45.5% over that of the control mortar at replacement levels of 60% and 80%, respectively. Although there was a weak link between porosity and gas permeability in the mortars with manufactured sand, the gas permeability decreased with growing the replacement level. The microstructure of the MS mortar was denser, and the cement paste had fewer microcracks with increasing the replacement level.Keywords
In civil engineering, cement-based materials are the most often used building materials, and cement mortar is one of the most widely used and least expensive binding materials. More sand is needed for mortar than for concrete, approximately 35% for concrete and more than 60% for mortar (by weight or volume) [1,2]. Due to stringent mining regulations for river sand, high-quality natural river sand is becoming increasingly less accessible, while the construction industry is driving up demand for manufactured sand [3,4]. Studying the effects of manufactured sand on the characteristics of mortar and concrete has become crucial to solve the fundamental technical problem of replacing river sand with manufactured sand [5–9]. The qualities of mortar and concrete are impacted by the characteristics of manufactured sand, such as lithology, surface area, particle size and shape, gradation, density, MB value, and stone powder content [10–13]. Approximately 30%–40% of the volume of concrete is made up of fine particles. Their characteristics have a significant impact on the properties of cement paste, including its hardened properties of compressive strength, tensile strength, and fracture energy, as well as its fresh properties of workability, interfacial transition zone (ITZ), and ability to bond with sands [14–20].
Limestone, basalt, granite, marble, and gneiss are the primary parent rock types employed in the production of manufactured sand [21,22]. SiO2 and CaCO3 are the primary constituents of siliceous and calcareous parent rocks, respectively. It is important to study the various lithological produced sands. The calcium carbonate content of manufactured sand, which is based on limestone, has been extensively studied [23,24]. It has an impact on how hydrated products crystallize and improves cement hydrates to produce calcium carboaluminate hydrates. According to Li et al. [25], concrete with tuff manufactured sand has the highest compressive strength, followed by concrete with quartzite manufactured sand, basalt manufactured sand, granite manufactured sand, and concrete with limestone manufactured sand.
Previous studies have concluded that using MS with a high volume of stone powder can enhance the quality of concrete [6,8,26–30]. Li et al. [8] investigated the compressive strength of manufactured sand concretes with varying quantities of limestone microfines. According to the findings, the compressive strength first increased and subsequently decreased. A microfine content of 10% lowers the strength since there is not enough paste to cover the aggregate. According to Malhotra et al. [26], the compressive strength of concrete with MS containing 7% stone powder was greater than that of RS concrete with the same water-cement ratio. However, Arulmoly et al. [6] showed a higher water absorption of MS mortar than river sand mortar. Based on the test Plastic shrinkage cracking, the crack increased with the microfine aggregate content. The large amount of microfine formed a coating which reduced the formation of bonding with cement paste. Çelik et al. [27] investigated how the surface area of the aggregate affects strength, and the results showed that as the amount of stone powder in the concrete increased, so did the specific surface area of the aggregate. The manufactured sand content influences the properties of mortar and concrete in the fresh and hardened states. In general, there is a threshold value of an approximately 45% manufactured sand content, and the compress solution increased gradually with increasing manufactured sand content. All mortars maintained in HCl solution showed decreased strength with immersion time; however, the highest replacement rate showed a positive impact on strength and durability [30].
The permeability of mortar and concrete represents the fluid passage capacity under a pressure gradient. It is highly dependent on the porosity, cracking and pore structure. It is also a parameter that can directly influence the durability of concrete by controlling the penetration rate of aggressive agents [31–33]. The gas and liquid permeability of concrete incorporating crushed sand and limestone fines was reported by Mendi et al. [34]. The results revealed that concrete without fines had a higher water penetration depth, while concrete with fines had a lower water penetration depth. The transition zone’s pore structure was enhanced and the water permeability was decreased by the presence of up to 15% fines as a substitution for crushed sand. Concrete containing fines exhibited increased gas permeability. The range for concrete without fines is between 5.1 and 9.1 × 10⁻¹⁷ m2. Other researchers have studied chloride penetration using the nondestructive test ‘Rapid chloride permeability’. To evaluate durability, Mane et al. [35] examined the chloride permeability of concrete including pozzolanic ingredients and manufactured sand. The results demonstrated that 60% substitution of manufactured sand for river sand was the threshold; at this level, the lowest values for chloride permeability and water absorption were found. Shen et al. [36] showed that the chloride ion permeability of the reference group was slightly higher than that of concrete containing manufactured sand. The greater powder content was responsible for the difference. The finding that all concretes containing manufactured sand had identical permeabilities showed that the impact of sharp particles on permeability was minimal.
Based on a brief review, the different characteristics between manufactured sand and river sand have been extensively studied, i.e., shape, stone powder and gradation. Many studies have focused on limestone granite and marble. However, research on mortar made of quartzite is quite limited, and no studies have assessed transfer properties, particularly gas permeability. Therefore, this paper presents the findings of an experimental examination into the effects of using quartzite-based manufactured sand in place of river sand on the characteristics of mortar. Compressive strength, gas permeability, porosity, and microstructure are among the considered characteristics.
2.1 Materials and Specimens Preparation
In this study, a Portland Ordinary cement (P.O 42.5) that complies with GB 175-2007 [37] was used; Tables 1 and 2 detail the chemical and physical characteristics of the cement, respectively. In this experimental study, two types of fine aggregates were chosen: manufactured sand (MS) and river sand (RS). Using a sand making machine, quartz stone was finely crushed to a particle size of approximately 150 mm to prepare MS made from quartzite. The finely crushed materials were screened to separate coarse, medium, and fine sand. The quartz sand was finally washed and dried. As shown in Fig. 1, the gradation test for RS was performed in accordance with GB/T 14684-2022 [38]. One of the primary qualities that distinguish MS from river sand is the presence of stone powder. The MS was remixed with the same gradation curve as the RS to avoid the influence of stone powder in the manufactured sand. The manufactured sand and mortar components were analyzed using XRD. The XRD patterns of MS are presented in Fig. 2. The chief chemical constituents of MS were SiO2 and CaO. Other chemical components were Ca(OH)2 and CaCO3. As Fig. 3 shows, the MS sand grains had sharp corners and edges and a rough surface, and the RS grains had a round appearance. MBV of manufactured sand was determined by the methylene blue value test for fine aggregate according to Chinese Standard for Test Method of Aggregate for Highway Engineering (JTG E 4-2005), the MBV is 1.3 g/kg for manufactured sand. There is a critical MBV of about 1.4, below which performance of manufactured sand mortar was not affected.
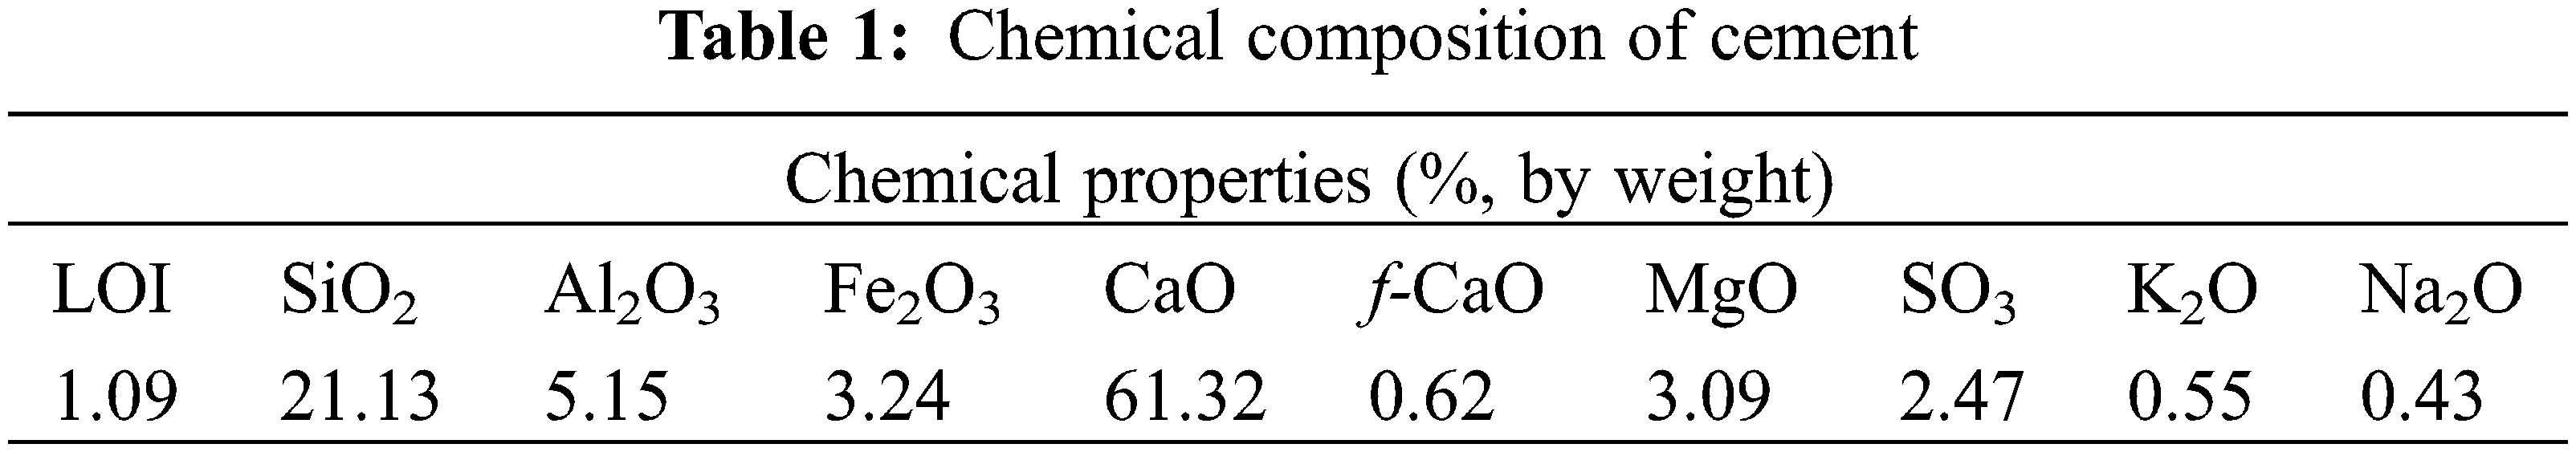
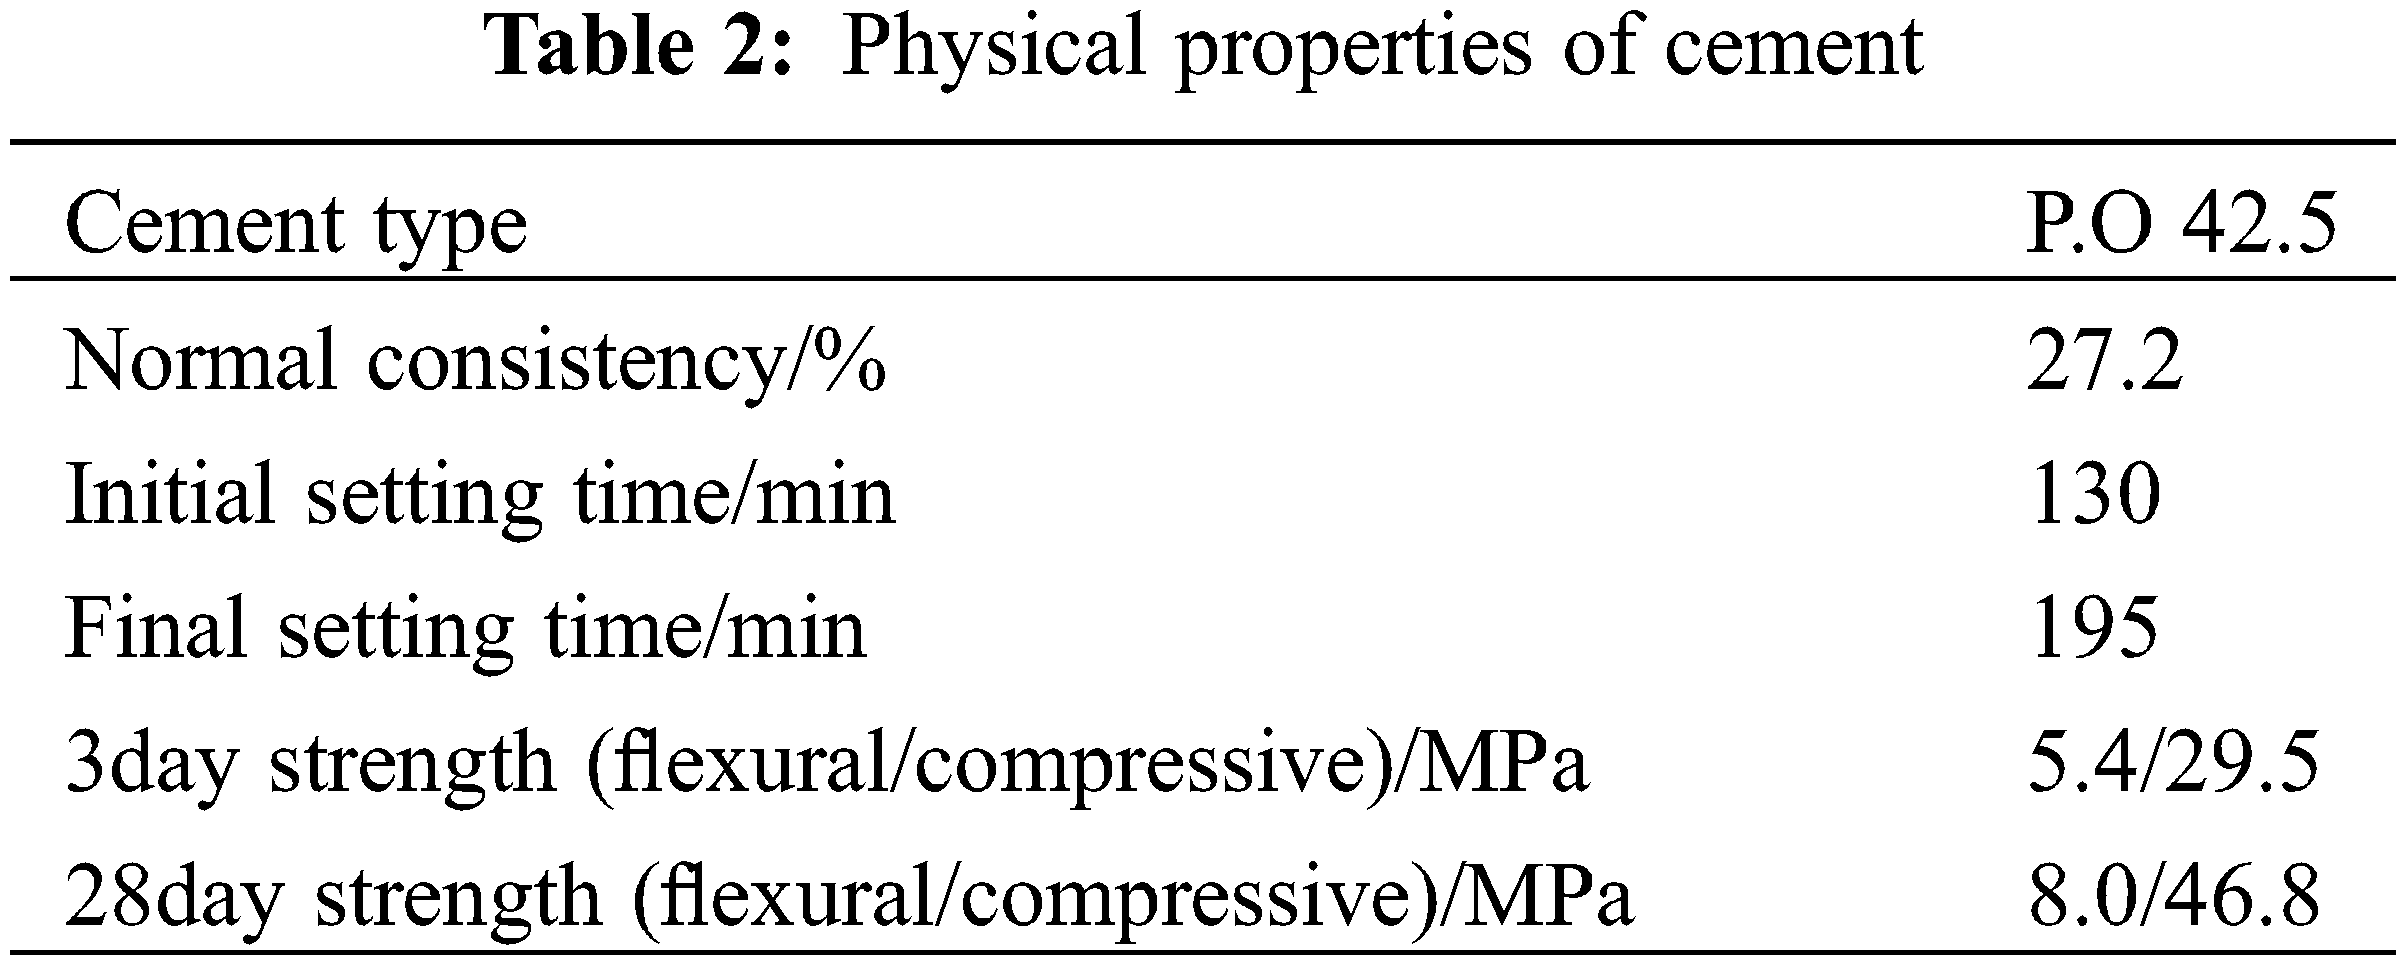
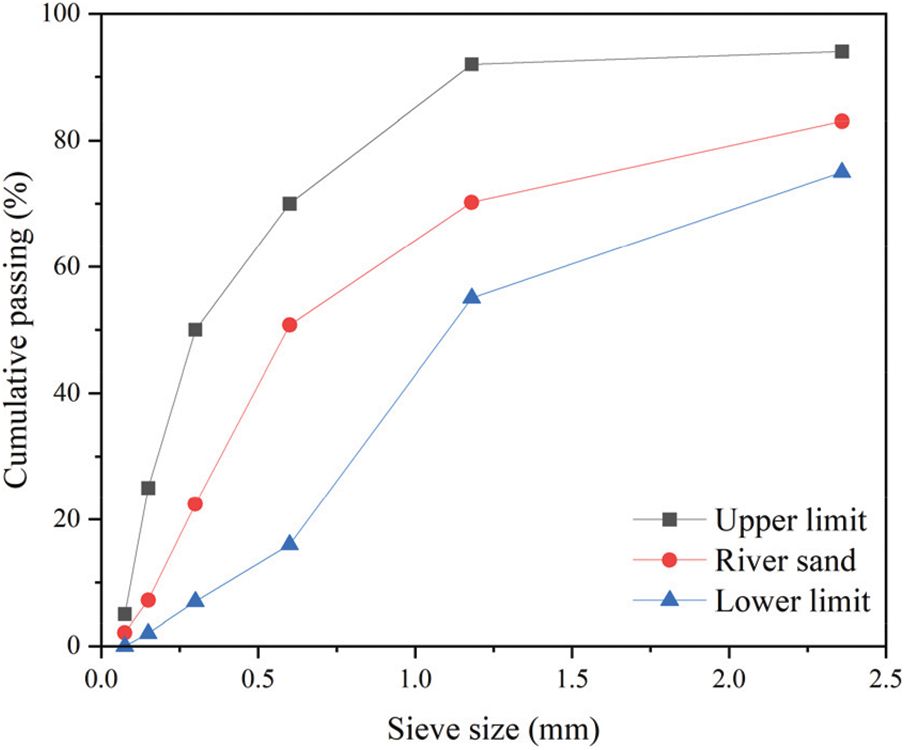
Figure 1: Gradation curve for fine aggregates
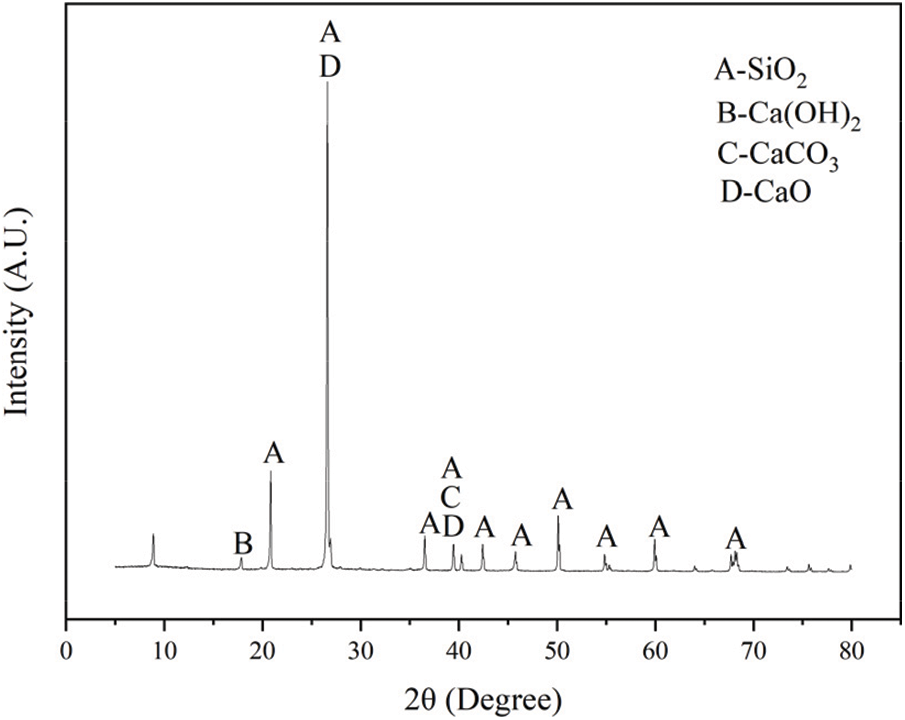
Figure 2: XRD patterns of MS
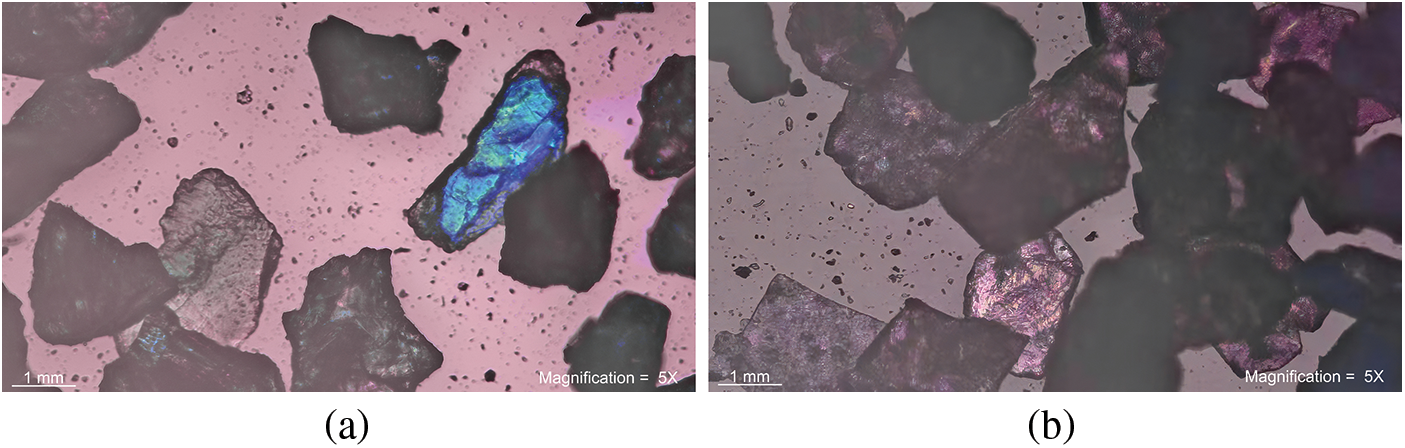
Figure 3: Microscopic photo of MS and RS grain (a) MS; (b) RS
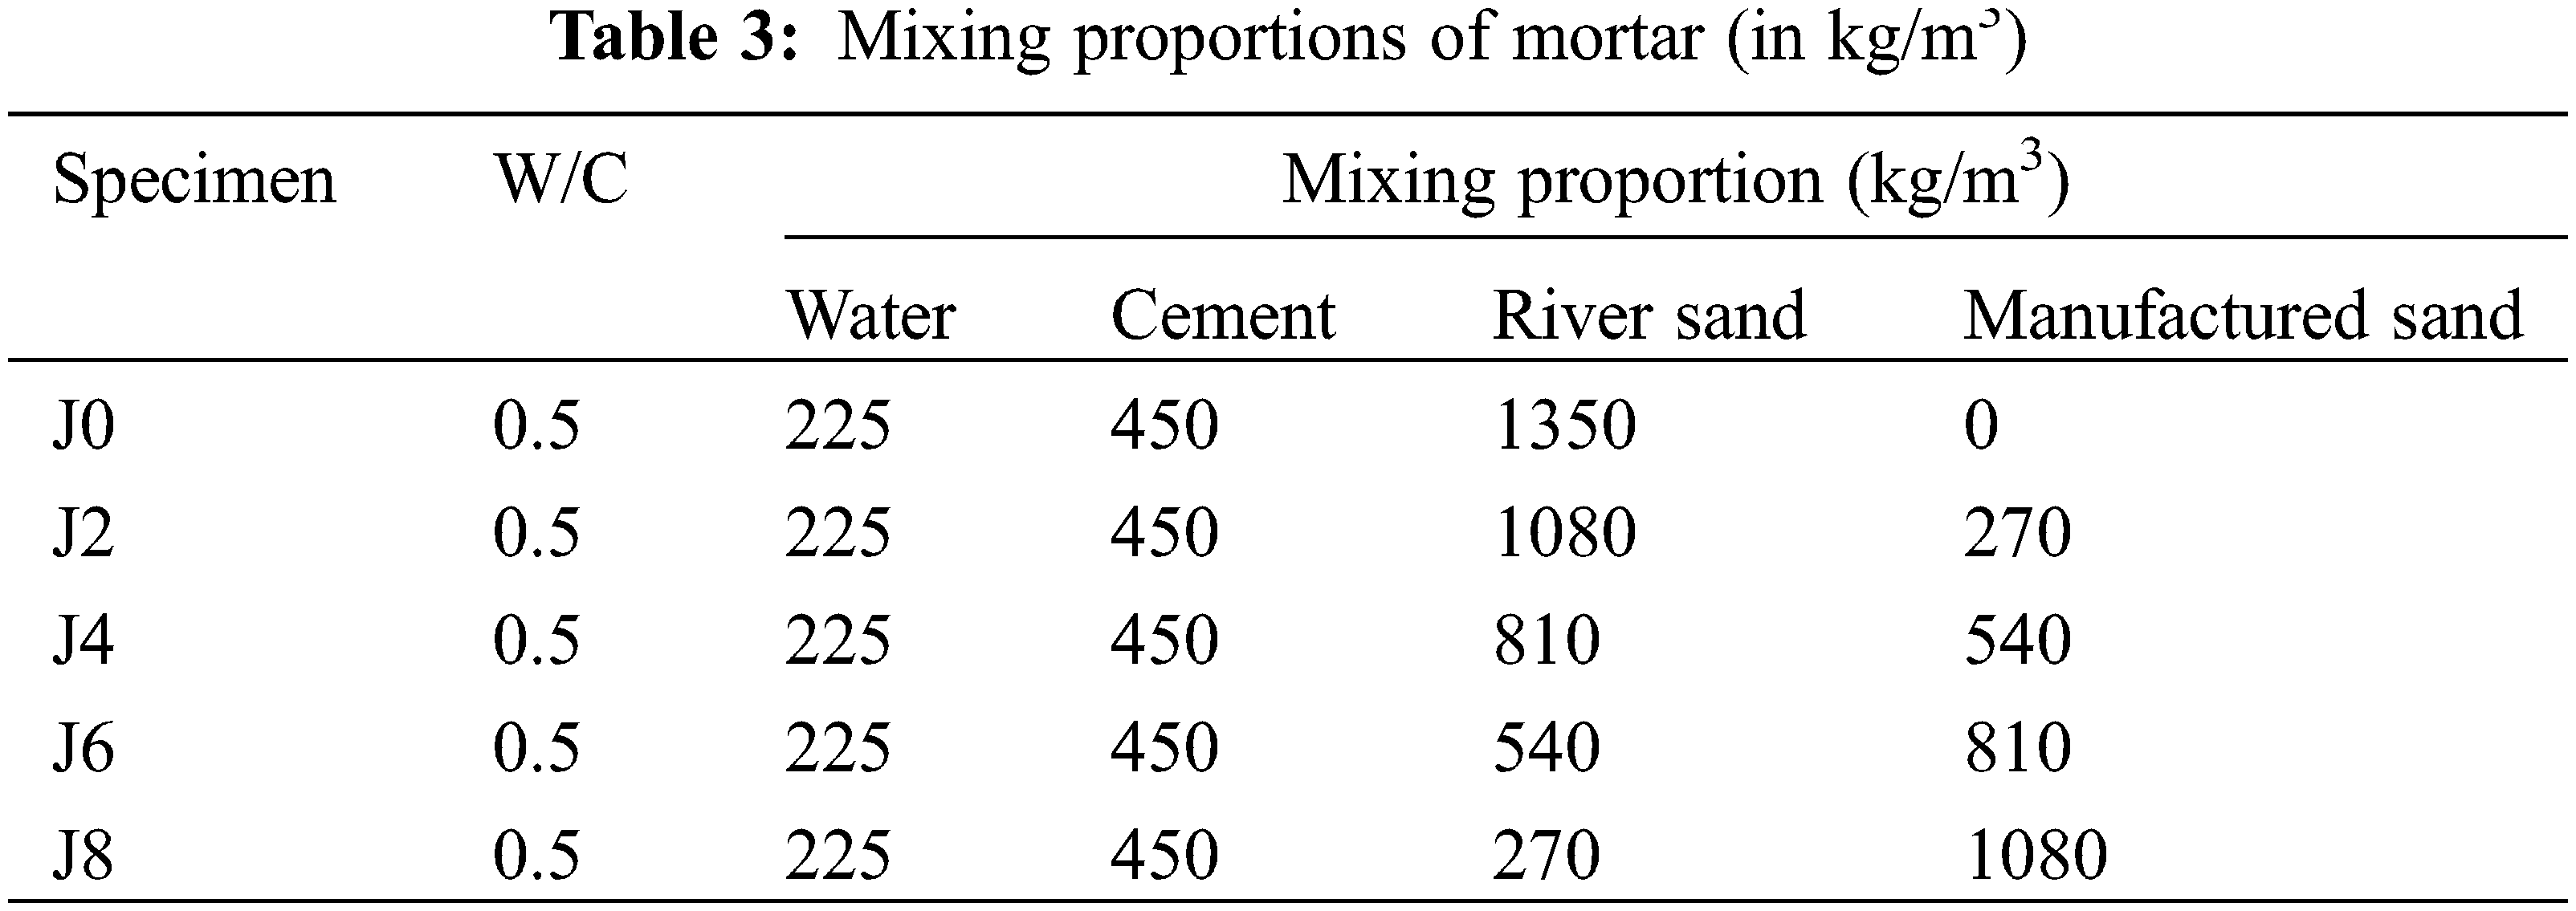
The cement mortar mix proportions are shown in Table 3; cylindrical mortar specimens (ϕ50 mm × 100 mm) were made with a water-cement ratio of 0.5. Approximately 0%, 20%, 40%, 60%, and 80% of the mass of river sand was replaced by MS. The specimens were designated into the groups J0, J2, J4, J6, and J8 according to the replacement rate. Before demolding, the specimens were kept for 24 h at 22°C and 60% RH under tight plastic wrap. The specimens were cured in lime water for 28 days at a temperature of 22 ± 2°C after demolding. The specimens were placed into a vacuum saturation device for resaturation treatment after the two ends were polished with a double-sided grinder. The specimens were dried in an oven at 60°C, and the mass was weighed every other day until its change was less than 0.1%.
2.2.1 Compressive Strength Test
The uniaxial compressive strength test can directly obtain the UCS values, this parameter is very important for design and analysis of structure based on cement-based materials. For the uniaxial compression test, an InstronTM mechanical press with a capacity of 500 kN was used. The uniaxial stress σ1 and deformation were measured on cylindrical specimens. A specially designed ball joint, with the same diameter as the specimen, was placed between the specimen and the upper plate of the mechanical press to reduce the effects of parasitic bending due to parallelism defects in the specimen, despite its grinding. The displacement speed during the test was controlled at 2 μm/s. According to the RILEM recommendations [39], the Young’s modulus was measured after three loading/unloading cycles that were characterized by a rise to 9 MPa and then an unloading to 1 MPa. The elastic modulus was evaluated as the slope of the linear part of the stress–strain curve during the third unloading. The elastic modulus was obtained by linear regression (least squares interpolation).
2.2.2 Gas Permeability Measurement
The authors’ previous publications [40–42] elucidated the method of gas permeability measurement used in this study. The gas permeability test was carried out under steady flow rate injection. Argon was used for the test, which has a dynamic viscosity of 2.2 × 10 − 5 Pa⋅s at 20°C. The inlet pressure was set to 1.5 MPa to ensure accuracy and safety, and the gas permeability was tested during loading and unloading confining pressure cycles (3, 5, 10, and 20 MPa) for each specimen. The gas permeability coefficient K (m2) was calculated according to the following Eq. (1):
where μ is the viscosity of gas (Pa⋅s); L is the specimen height (m); ΔPi is the change in inlet pressure at the upstream side (MPa); A is the cross-sectional area of the specimen (m2); Pm is the average value of the gas pressure over period Δt (MPa); Pa is the atmospheric pressure with a value of 0.1 MPa; and Δt is the time difference (s).
The mass loss method was used to measure the porosity of mortar. The specimens were dried in an oven at 60°C to a constant weight (about 40 days). The porosity was calculated by the saturated mass, dry mass and the apparent volume of specimen. The equation for calculating the porosity was as follows:
where VP: the pore volume of the mortar specimen, MS: saturated mass of mortar, Md: dry mass of mortar, and ρw: density of water (1 g/m3); V: the volume of the mortar specimen in its natural state. The porosity of the mortar specimen can be calculated by combining Eqs. (1) and (2).
A ZEISS Gemini SEM 500 field emission scanning electron microscope was used to characterize the microstructure and morphology of the mortar specimens. For SEM measurements, small plates (5 mm × 5 mm × 2 mm in dimension) were cut from the cement mortar and kept submerged for 72 h in isopropanol. Then, they were further dried in an oven at a temperature of 60°C.
A Newmark NMR analyzer (PQ-001) was used for NMR analysis to obtain the pore structure distributions of all mortars. The specimens were vacuum-saturated before the NMR test began to saturate the mortars’ inside pores with complementary water. A precise balance was used to determine the saturated specimens’ mass. The NMR relaxation time approach is based on the idea that information on the pore structure within the specimen can be obtained by detecting the signal strength of hydrogen atoms in the vacuum-saturated specimen. The transverse relaxation time T2 is more sensitive to pore size than the longitudinal relaxation time T1; the NMR relaxation time is classified into both of these categories, both of which satisfy Eq. (4):
3.1 Mechanical Property Analysis
Fig. 4a shows the variation in compressive strength for all mortars. According to the replacement level from less to more, the compressive strength was 33.96, 39.06, 38.29, 45.89, and 49.4 MPa. Compared to RS mortar, the value increased by 15%, 12.7%, 35.1%, and 45.5%, respectively. The compressive strengths of all of the MS mortars were greater than those of the control group (J0). The effect of powder in the fine aggregates on the mortar, with the exception of particle shape and replacement rate, was eliminated after washing and screening to remove the stone powder in the MS. The gradation of MS and RS remained consistent. High particle interlocking produced by MS in the mortar allowed for improved stress resistance. The compressive strength of the mortar was influenced by the physical characteristics of sand particles. The compressive strength can be improved by increasing the friction between particles due to rough surfaces and sharp edges [6,7]. The compressive strength significantly increased with an increase in replacement level.
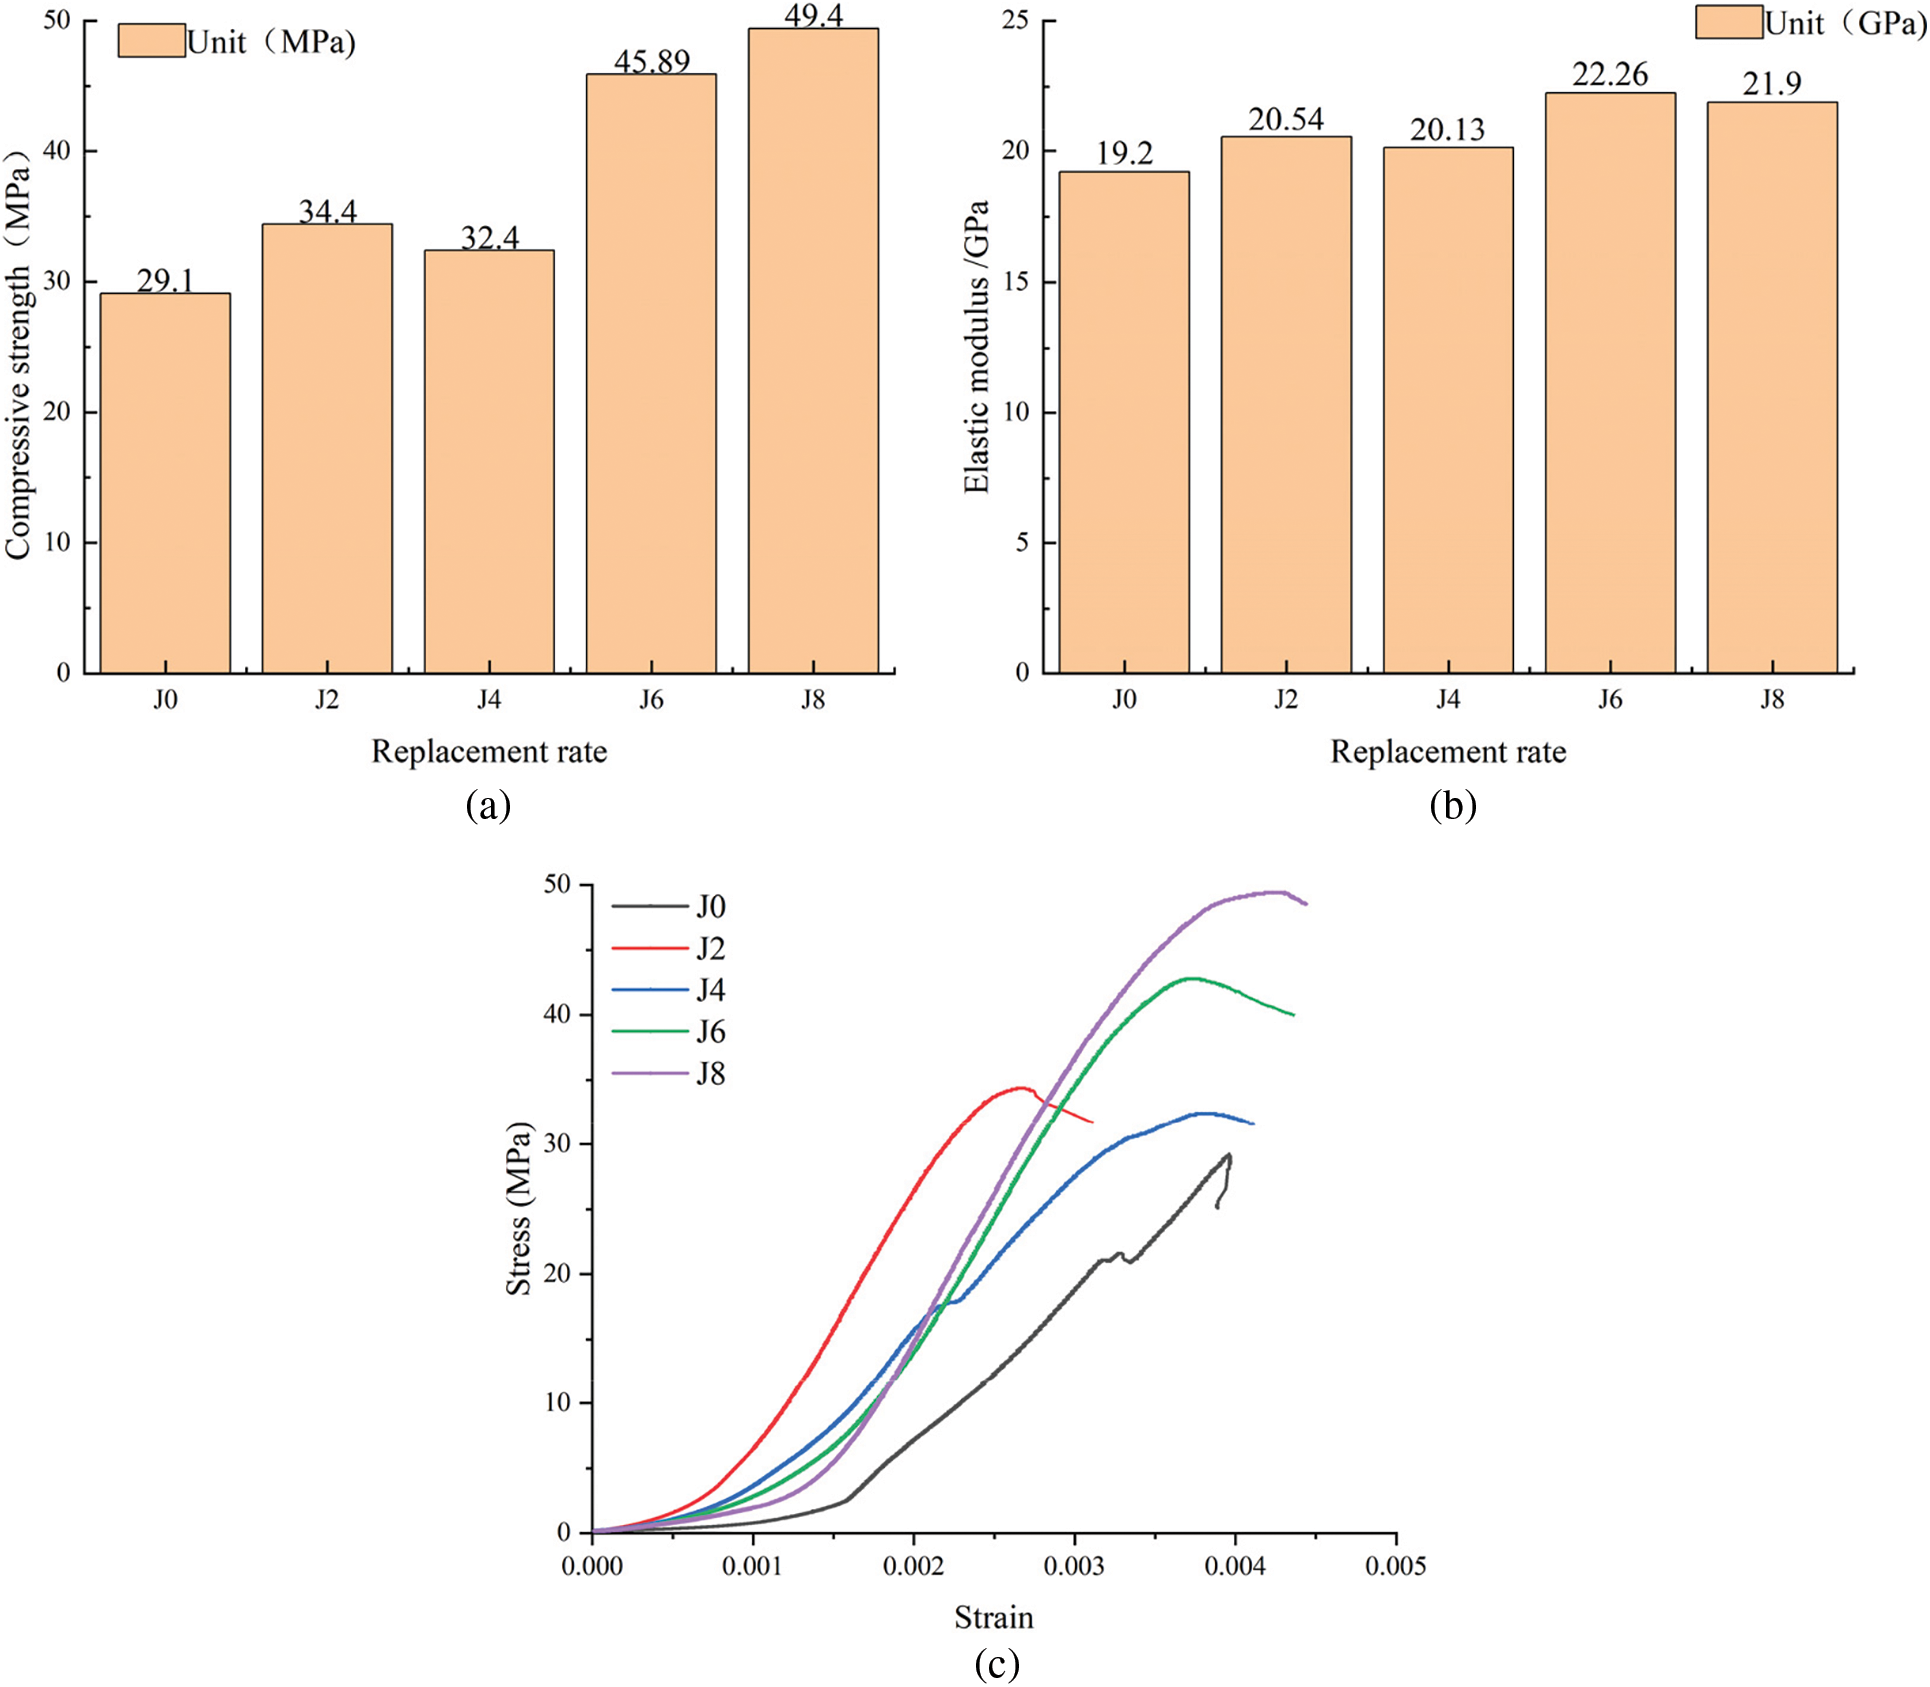
Figure 4: Mechanical properties of mortar for each replacement: (a) Compressive strength; (b) Elastic modulus; (c) Stress-Strain curve
In Fig. 4b, the elastic modulus increased with an increase in MS sand replacement level relative to compressive strength. The elastic modulus was influenced by the mortar’s solidness and the interfacial zone between the cement paste and the aggregate. Because mortar containing MS has a better cement aggregate bond and is denser than RS mortar [28,29], the elastic modulus of MS mortar was higher than that of the control group. However, the variation in porosity with different replacement rates showed a quasi-constant tendency, as shown in Table 4. The stress–strain curves of all mortars were obtained from the experimental data, as shown in Fig. 4c, and were divided into five stages: compression-density, elasticity, plasticity, damage, and post-peak. The mortar with MS sand showed a shorter compression-density stage, and near the peak, the plastic characteristic became increasingly obvious. It can be seen that the control group mortar had significant initial defects and cracks induced by drying in an oven. It can be speculated that the cracks become more sensitive to confining pressure in the hydrostatic experiment.
3.2 Gas Permeability and Porosity
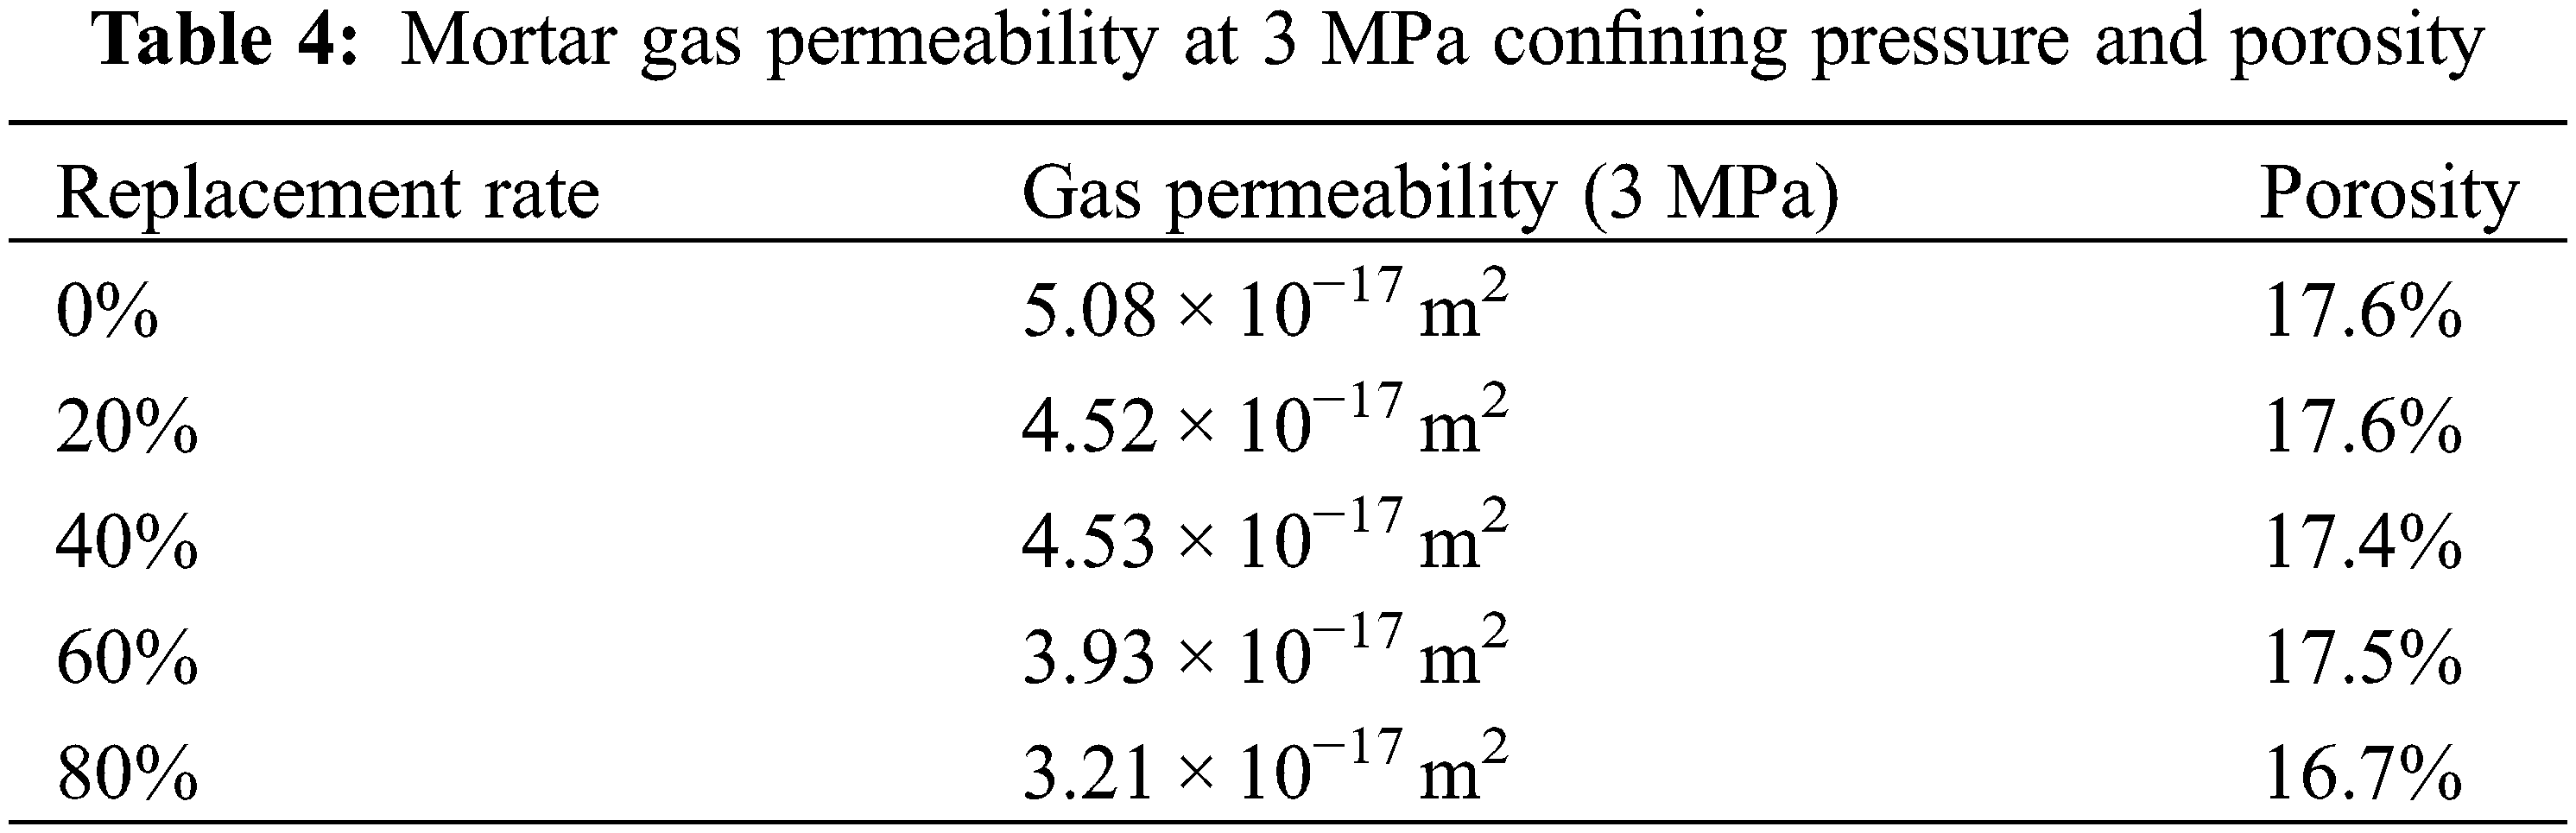
As shown in Table 4 and Fig. 5, mortar initial gas permeability under 3 MPa confining pressure and porosity decreased with an increasing replacement level of MS. Compared with the control group, the initial gas permeability of MS mortar decreased by 11%, 10.8%, 22.6% and 36.8%, respectively. The variation in porosity directly reflect the change in gas permeability; however, the main observation was the homogeneity in porosity at different replacement levels. The correlation between porosity and gas permeability was weak.
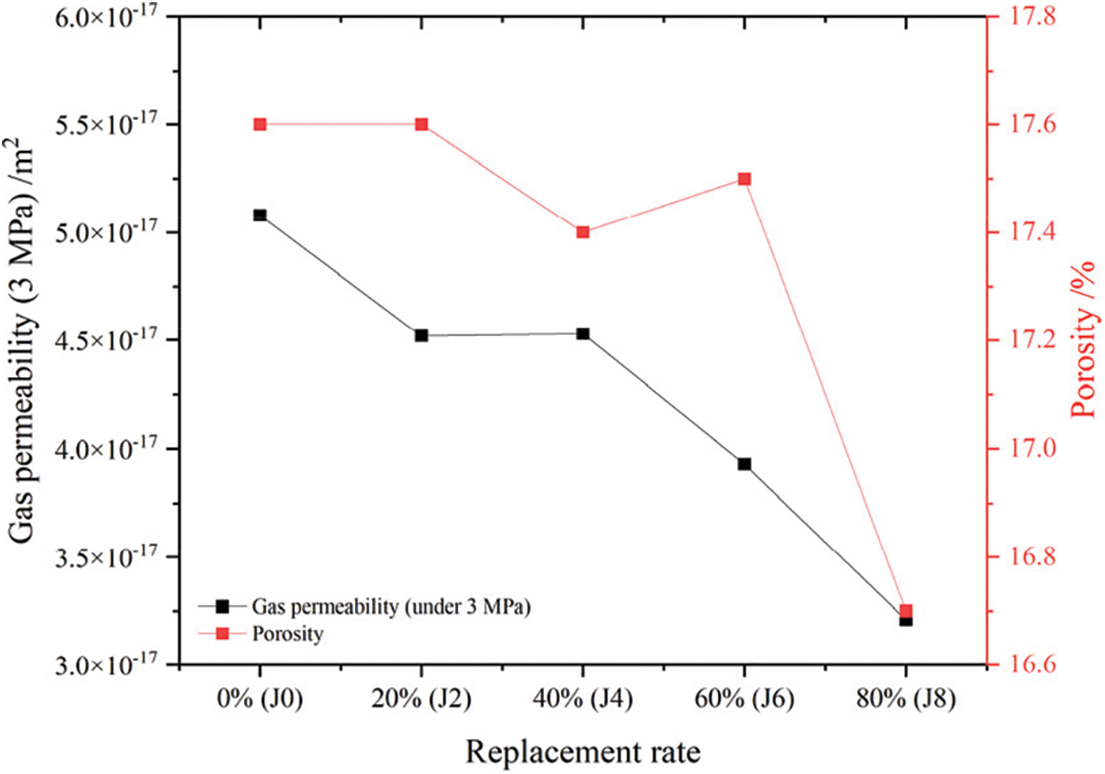
Figure 5: Relationship between porosity and gas permeability
As in the above study on the compressive behavior, a phase of microcrack closure was found under confining pressure loading. In Figs. 6a and 6b, the effect of confining pressure on gas permeability was significant, and gas permeability decreased during confining pressure loading and then increased slightly during unloading regardless of the replacement level of MS. The variation in gas permeability in the range of 3, 5 and 10 MPa (relatively low confining pressure) was more significant than that at higher confining pressures (15 and 20 MPa). Fig. 6a clearly illustrates that the change in gas permeability was very sudden, up to 15 MPa, and it was irreversible. This behavior was confirmed with the results presented in Fig. 4a. The gas permeability was constrained to a relatively narrow band at higher confining pressure and became almost reversible. The threshold confining pressure for effects on gas permeability was approximately 15 MPa. Eq. (3) was used to determine that the relative gas permeability for all mortars at the specified confining pressure showed lower statistical values. Due to its definition, Krg varied between 0 and 1, regardless of the replacement level. In Fig. 6b, the relative gas permeability of the higher replacement level (60% and 80%) mortar was lower than that of the other mortars regardless of the loading or unloading phase. From a confining pressure of 5 to 15 MPa, the high-replacement level mortar showed more confining pressure sensitivity, and the relative gas permeability decreased gradually. As described above, there was an initial microcrack closure phase that should be distinguished from the following confining pressure phase. The complete closure of microcracks was not possible until the threshold was reached, and this incomplete closure of microcracks can explain why the permeability continued to decrease as the confining pressure increased.
where Kc is the gas permeability at all values of confining pressure and K3 is the measured gas permeability at a confining pressure of 3 MPa.
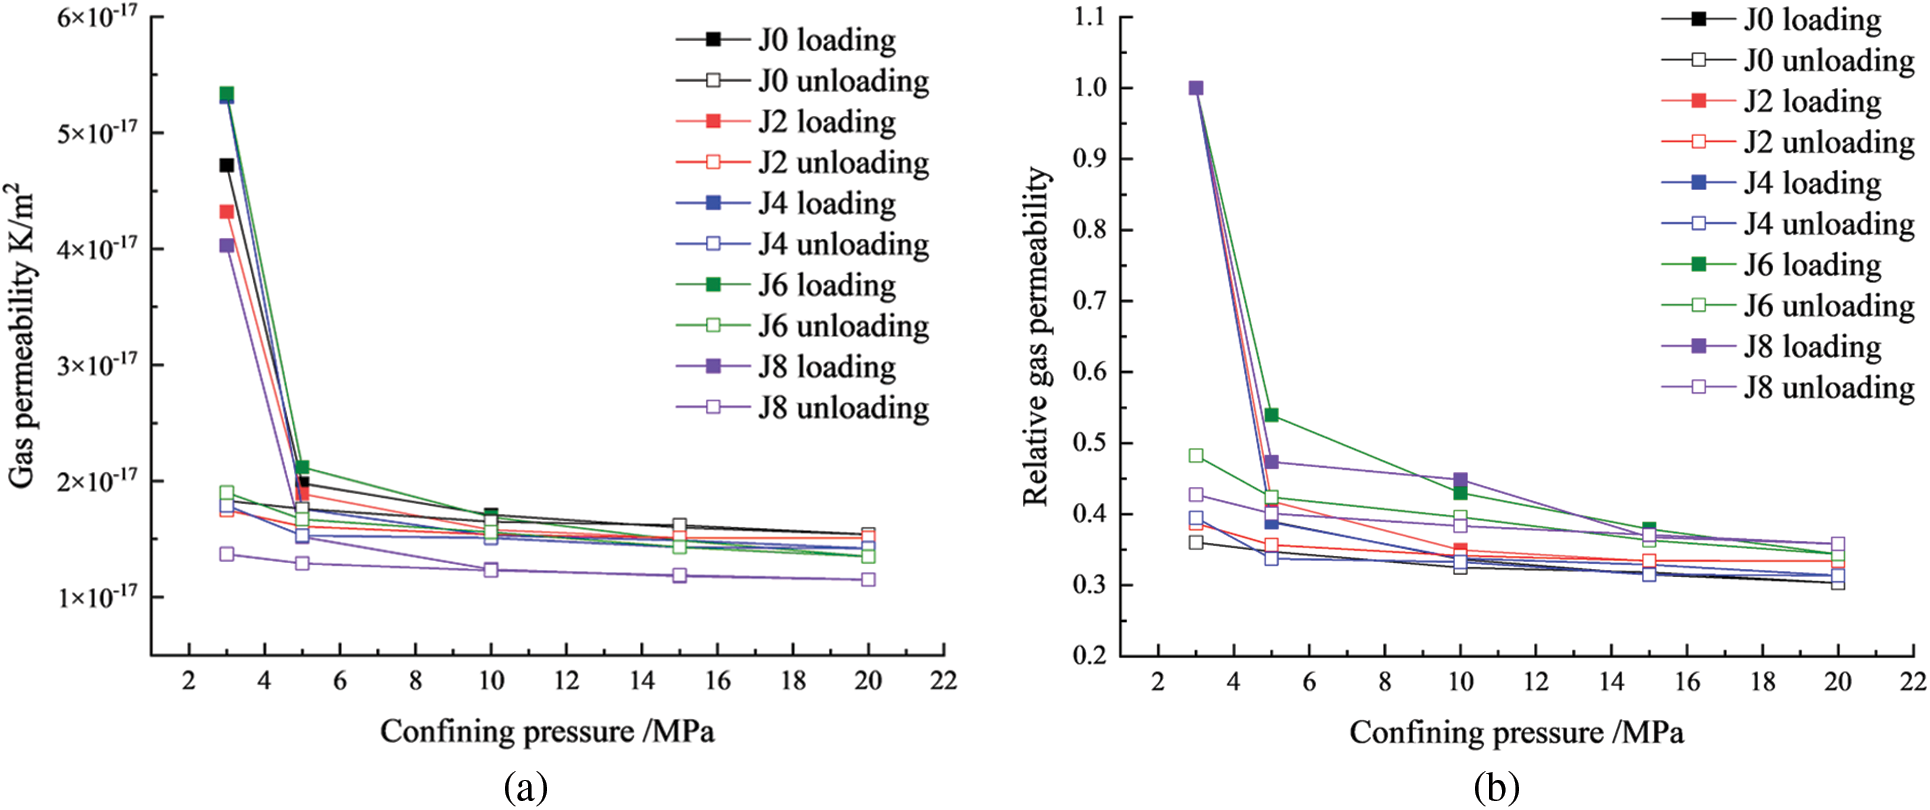
Figure 6: Variation of gas permeability (a) and relative permeability (b) with confining pressure
SEM was used to evaluate the microstructure of the cement mortars with different replacement rates of MS. Fig. 7 shows the microstructure of the MS mortars with different contents (Figs. 7a–7e), manufactured sand (Fig. 7f) and river sand (Fig. 7g). The river sand particles show higher roundness and a smooth surface texture than the manufactured sand (Fig. 7g). In Fig. 7g, the manufactured sand has more angular and rougher surface than river sand. This shape of particles can improve the mechanical properties of mortar. It is obvious that the texture of the manufactured sand was denser than that of the natural river sand and that the larger grains of both materials had broken sand on them. The two sand grains were roughly the same diameter because the glass sand was made in accordance with the grain grade of natural river sand. A porous hydrated cement paste was seen surrounding the fine aggregate due to the mortar’s W/C = 0.5. Cement paste cracks were evident in the SEM images after the mortar had cured in the oven. In Fig. 7, cracks are visible. The small cracks were dispersed throughout the bulk of C-S-H, and they had a very sharp edge.
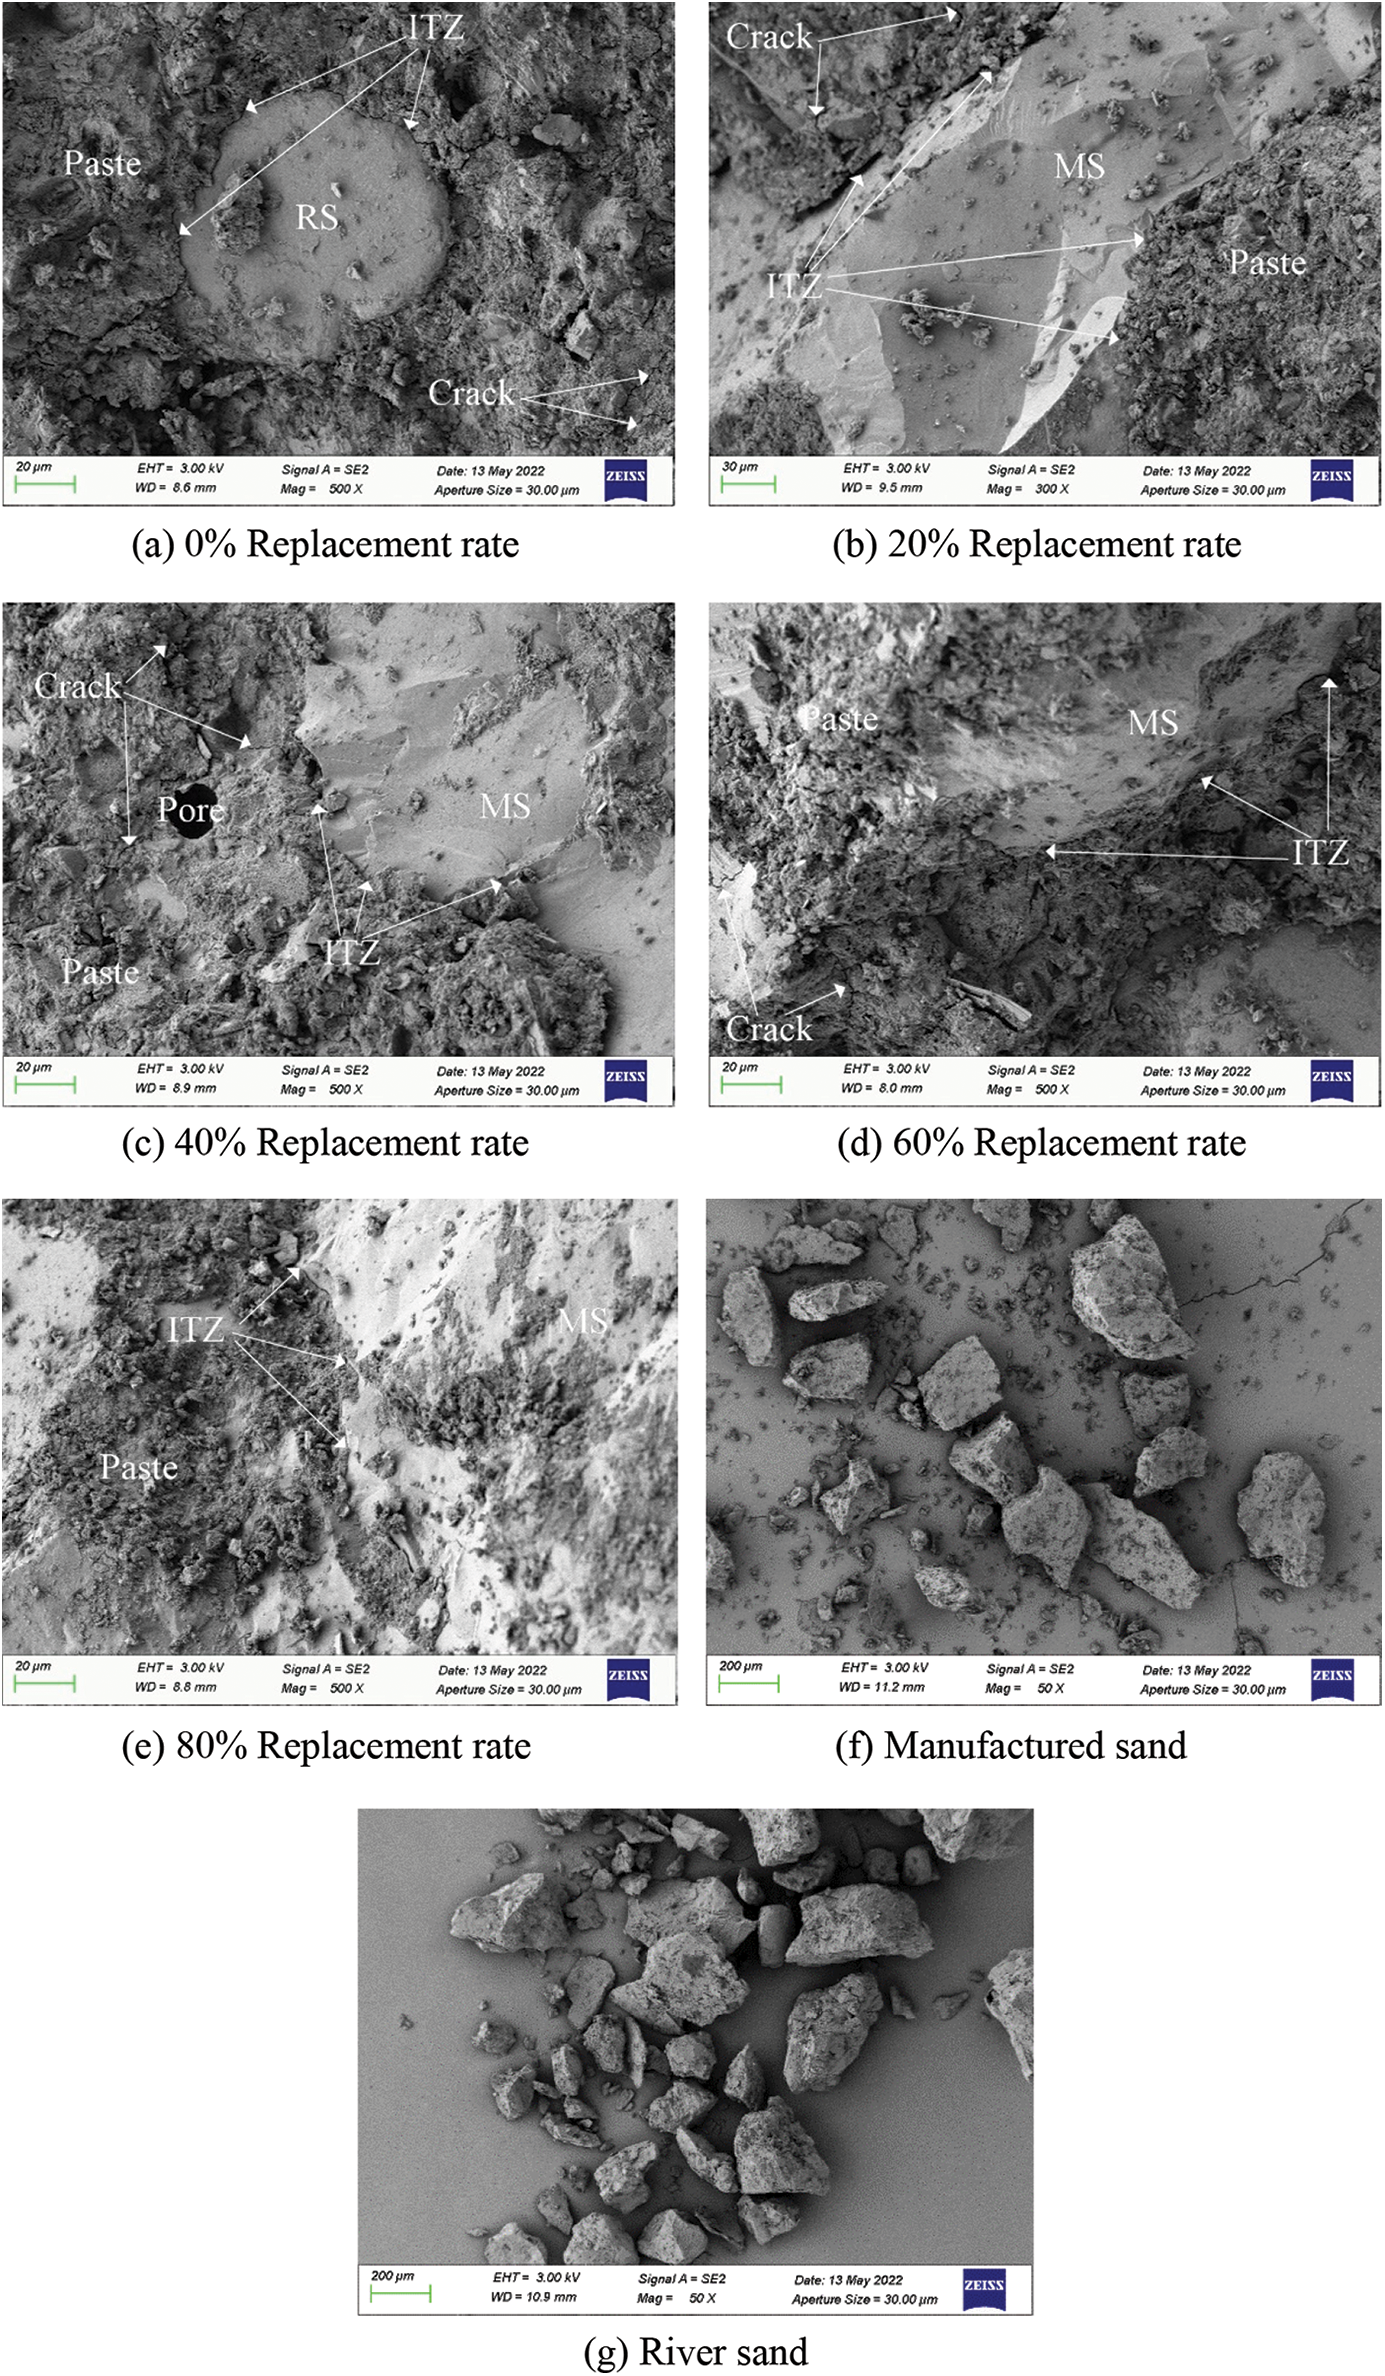
Figure 7: Scanning electron micrograph of all mortars
The morphology of the cracks was similar in all mortars regardless of the replacement rate. Significant cracks in cement paste may lead to the stage of compression-density in the mechanical test. However, with the highest replacement rate (80%) in Fig. 7e, the crack decreased, and the cement paste was very dense. This demonstrated that the mortar’s compressive strength increased with the MS replacement rate. The weakest zone of mortar is the interfacial transition zone (ITZ), and the mechanical properties and durability are significantly influenced by the microstructure of the ITZ. The ITZ is impacted by the cement dose, water-to-cement ratio, curing conditions, and aggregate properties. According to Fig. 7, it was clear that the ITZ of the MS mortar became denser as the replacement level was raised. The ITZ of mortar with replacement levels of 0%, 20%, and 40% showed some noticeable cracks between the aggregate and paste, and the bond was not as strong. However, there was no crack in the ITZ at 60% and 80% replacement levels because the mortar at these levels was significantly denser than that at lower levels. The mortar developed denser and more homogenous interior structures as a result of the increased replacement level, increasing its strength.
Fig. 8 shows the T2 relaxation time distributions for the mortars. The pore size was proportional to the relaxation time, which was represented by the horizontal x-axis in the T2 spectrum distribution. The longer the relaxation time is, the larger the pore size, and vice versa. The pore volume varied with the T2 spectrum area, and vice versa; the higher the area was, the larger the pore volume in the region corresponding to the pore diameter. As seen in Fig. 8, the internal pore structure of the mortars with various replacement levels changed in comparison to the control group.
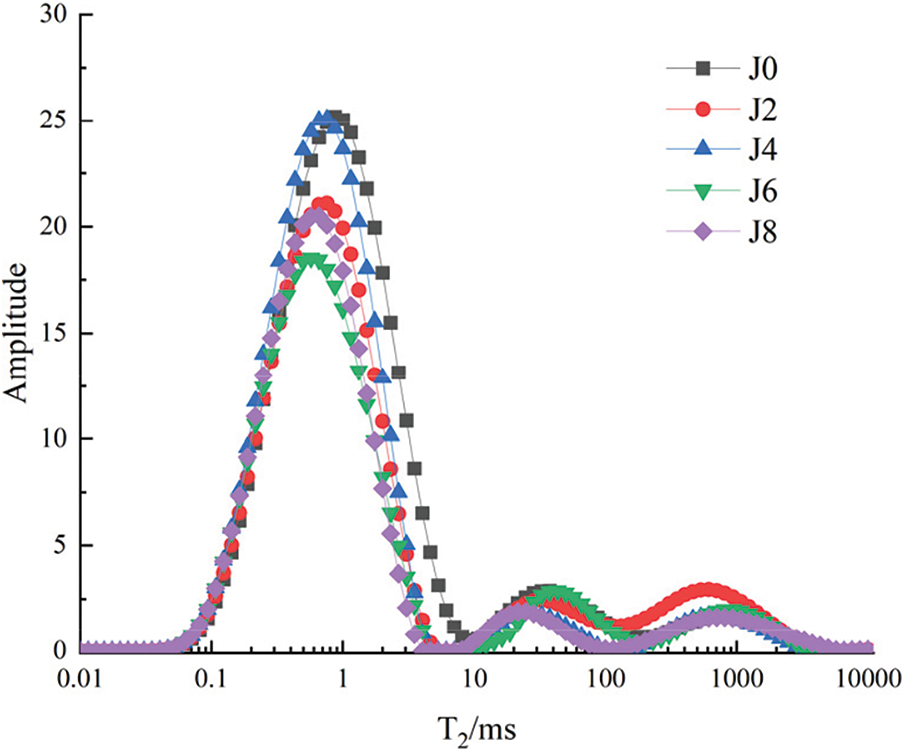
Figure 8: T2 spectrum of all mortars
All mortars had three peaks in their T2 spectra, and the principal peak was always three orders of magnitude greater than the other peaks. The primary peak represented the change in micro and small pores, while the other peaks represented the changes in medium and large pores. The relaxation time range corresponding to the primary peak was shorter, and this peak was significantly larger than the other peaks. The major peaks of J0 and J4 almost overlapped, but the peak of the control group (J0) shifted to the right, and its relaxation time lengthened, showing that J0 had larger micropores than J4. From small to large, the second peaks of various replacement level mortars were ranked as follows: 80%, 40%, 60%, 0%, and 20%. For the third peaks, the rankings were 60%, 40%, 80%, 0%, and 20%. In comparison to the control group, the principal peak of mortar containing 40%, 60%, and 80% MS was 17.65%, 55.3%, and 39.53% lower, respectively. The increasing replacement level can improve the pore structure of mortar. However, the mortar containing 60% manufactured sand has the lowest relaxation time, this finding confirms the result of porosity unusual increasing at this replacement level.
This paper investigates how mortar behaved when manufactured sand was used in place of river sand. The following conclusions can be drawn:
1. The increasing MS replacement levels from 20% to 80% showed an improvement in the compressive strength. The increase of the compressive strength of MS mortar was up to approximately 50% when the replacement level was 80%. All mortars’ peak mechanical strengths were attained at replacement levels of 60% and 80%. The MS mortar’s measured elasticity modulus value was slightly higher than that of the RS mortar. With the increasing of replacement level of MS sand, the higher particle interlocking enabled higher resistance to the applied stress.
2. As the MS replacement level rises, the gas permeability decreases. Porosity is not significantly affected by MS, but it does improve mechanical properties, demonstrating that porosity is not the primary factor affecting gas permeability and compressive strength. The irregular shape of manufactured sand particles can enhance the structure of cement paste and reduce the pore size of MS mortar. It is possible that the MS mortar has smaller pores and a smaller radius.
3. The MS mortar becomes increasingly dense and more homogenous interior structures with increasing replacement level. Based on the NMR results, the T2 spectrum area of the cement mortar decreases, which effectively decreases the pore size of the mortar, consolidates the pore structure, and prevents the formation and connection of large pores in the mortar. With a higher replacement level, the MS is covered by the hydration product with no apparent voids or cracks.
Acknowledgement: None.
Funding Statement: This work is supported by the National Natural Science Foundation of China (No. 51709097).
Author Contributions: The authors confirm contribution to the paper as follows: study conception and design: Wei Chen, Yue Liang; data collection: Wuwen Liu; analysis and interpretation of results: Wei Chen, Wuwen Liu, Yue Liang; draft manuscript preparation: Wei Chen, Wuwen Liu. All authors reviewed the results and approved the final version of the manuscript.
Availability of Data and Materials: The data that support the findings of this study are available from the corresponding author upon reasonable request.
Conflicts of Interest: The authors declare that they have no conflicts of interest to report regarding the present study.
References
1. Liu, G. F., Li, S. C., Chen, Z. F., Qin, Y. L. (2014). Effect of different grain grading of manufactured-sands on properties of dry-mixed mortar. Applied Mechanics and Materials, 507, 429–433. [Google Scholar]
2. De Schutter, G., Poppe, A. M. (2004). Quantification of the water demand of sand in mortar. Construction and Building Materials, 18(7), 517–521. [Google Scholar]
3. Shen, W., Yang, Z., Cao, L., Cao, L., Liu, Y. et al. (2016). Characterization of manufactured sand: Particle shape, surface texture and behavior in concrete. Construction and Building Materials, 114, 595–601. [Google Scholar]
4. Li, H., Huang, F., Cheng, G., Xie, Y., Tan, Y. et al. (2016). Effect of granite dust on mechanical and some durability properties of manufactured sand concrete. Construction and Building Materials, 109, 41–46. [Google Scholar]
5. Li, B., Wang, J., Zhou, M. (2009). Effect of limestone fines content in manufactured sand on durability of low- and high-strength concretes. Construction and Building Materials, 23(8), 2846–2850. [Google Scholar]
6. Arulmoly, B., Konthesingha, C., Nanayakkara, A. (2021). Performance evaluation of cement mortar produced with manufactured sand and offshore sand as alternatives for river sand. Construction and Building Materials, 297, 123784. [Google Scholar]
7. Gonçalves, J. P., Tavares, L. M., Toledo Filho, R. D., Fairbairn, E. M. R., Cunha, E. R. (2007). Comparison of natural and manufactured fine aggregates in cement mortars. Cement and Concrete Research, 37(6), 924–932. [Google Scholar]
8. Li, B., Ke, G., Zhou, M. (2011). Influence of manufactured sand characteristics on strength and abrasion resistance of pavement cement concrete. Construction and Building Materials, 25(10), 3849–3853. [Google Scholar]
9. Nanthagopalan, P., Santhanam, M. (2011). Fresh and hardened properties of self-compacting concrete produced with manufactured sand. Cement and Concrete Composites, 33(3), 353–358. [Google Scholar]
10. Goble, C. F., Cohen, M. D. (1999). Influence of aggregate surface area on mechanical properties of mortar. Materials Journal, 96(6), 657–662. [Google Scholar]
11. Imamoto, K., Arai, M. (2008). Specific surface area of aggregate and its relation to concrete drying shrinkage. Materials and Structures, 41(2), 323–333. [Google Scholar]
12. Cepuritis, R., Wigum, B. J., Garboczi, E. J., Mørtsell, E., Jacobsen, S. (2014). Filler from crushed aggregate for concrete: Pore structure, specific surface, particle shape and size distribution. Cement and Concrete Composites, 54, 2–16. [Google Scholar]
13. Ji, T., Chen, C. Y., Zhuang, Y. Z., Chen, J. F. (2013). A mix proportion design method of manufactured sand concrete based on minimum paste theory. Construction and Building Materials, 44, 422–426. [Google Scholar]
14. Zhang, Y., Gu, L., Zhang, Q. (2022). Durability of manufactured sand concrete in atmospheric acidification environment. Case Studies in Construction Materials, 17, e01613. [Google Scholar]
15. Cortes, D. D., Kim, H. K., Palomino, A. M., Santamarina, J. C. (2008). Rheological and mechanical properties of mortars prepared with natural and manufactured sands. Cement and Concrete Research, 38(10), 1142–1147. [Google Scholar]
16. Li, F. L., Zhu, Q. (2011). Strength development of concrete with proto-machine-made sand. Advanced Materials Research, 152–153, 1479–1482. [Google Scholar]
17. Park, S. (2012). Study on the fluidity and strength properties of high performance concrete utilizing crushed sand. International Journal of Concrete Structures and Materials, 6(4), 231–237. [Google Scholar]
18. Li, F. L., Zeng, Y., Li, C. Y. (2012). Evaluation of relations among basic mechanical properties of concrete with machine-made sand. Advanced Materials Research, 418–420, 441–444. [Google Scholar]
19. Kim, J. K., Lee, C. S., Park, C. K., Eo, S. H. (1997). The fracture characteristics of crushed limestone sand concrete. Cement and Concrete Research, 27(11), 1719–1729. [Google Scholar]
20. Zhao, S. B., Ding, X. X., Li, C. Y. (2012). Bond-slip relation of plain steel bar in concrete with machine-made sand. Applied Mechanics and Materials, 238, 142–146. [Google Scholar]
21. Wang, J., Yang, Z., Liu, Y. (2014). Effects of the lithologic character of manufactured sand on properties of concrete. Journal of Wuhan University of Technology-Materials Science Edition, 29(6), 1213–1218. [Google Scholar]
22. Bentz, D. P., Stutzman, P. E., Zunino, F. (2017). Low-temperature curing strength enhancement in cement-based materials containing limestone powder. Materials and Structures, 50(3), 173. [Google Scholar] [PubMed]
23. Poitevin, P. (1999). Limestone aggregate concrete, usefulness and durability. Cement and Concrete Composites, 21(2), 89–97. [Google Scholar]
24. Moon, G. D., Oh, S., Jung, S. H., Choi, Y. C. (2017). Effects of the fineness of limestone powder and cement on the hydration and strength development of PLC concrete. Construction and Building Materials, 135, 129–136. [Google Scholar]
25. Li, H., Wang, Z., Huang, F., Yi, Z., Xie, Y. et al. (2020). Impact of different lithological manufactured sands on high-speed railway box girder concrete. Construction and Building Materials, 230, 116943. [Google Scholar]
26. Malhotra, V. M., Carette, G. G. (1985). Performance of concrete incorporating limestone dust as partial replacement for sand. Journal Proceedings, 82(3), 363–371. [Google Scholar]
27. Çelik, T., Marar, K. (1996). Effects of crushed stone dust on some properties of concrete. Cement and Concrete Research, 26(7), 1121–1130. [Google Scholar]
28. Khyaliya, R. K., Kabeer, K. I. S. A., Vyas, A. K. (2017). Evaluation of strength and durability of lean mortar mixes containing marble waste. Construction and Building Materials, 147, 598–607. [Google Scholar]
29. Gupta, L. K., Vyas, A. K. (2018). Impact on mechanical properties of cement sand mortar containing waste granite powder. Construction and Building Materials, 191, 155–164. [Google Scholar]
30. Bederina, M., Makhloufi, Z., Bounoua, A., Bouziani, T., Quéneudec, M. (2013). Effect of partial and total replacement of siliceous river sand with limestone crushed sand on the durability of mortars exposed to chemical solutions. Construction and Building Materials, 47, 146–158. [Google Scholar]
31. Hamami, A. A., Turcry, P., Aït-Mokhtar, A. (2012). Influence of mix proportions on microstructure and gas permeability of cement pastes and mortars. Cement and Concrete Research, 42(2), 490–498. [Google Scholar]
32. Gui, Q., Qin, M., Li, K. (2016). Gas permeability and electrical conductivity of structural concretes: Impact of pore structure and pore saturation. Cement and Concrete Research, 89, 109–119. [Google Scholar]
33. Chen, W., Liu, J., Brue, F., Skoczylas, F., Davy, C. A. et al. (2012). Water retention and gas relative permeability of two industrial concretes. Cement and Concrete Research, 42(7), 1001–1013. [Google Scholar]
34. Menadi, B., Kenai, S., Khatib, J., Aït-Mokhtar, A. (2009). Strength and durability of concrete incorporating crushed limestone sand. Construction and Building Materials, 23(2), 625–633. [Google Scholar]
35. Mane, K. M., Kulkarni, D. K., Prakash, K. B. (2021). Near-surface and chloride permeability of concrete using pozzolanic materials and manufactured sand as partial replacement of fine aggregate. Iranian Journal of Science and Technology, Transactions of Civil Engineering, 45(3), 1427–1439. [Google Scholar]
36. Shen, W., Liu, Y., Wang, Z., Cao, L., Wu, D. et al. (2018). Influence of manufactured sand’s characteristics on its concrete performance. Construction and Building Materials, 172, 574–583. [Google Scholar]
37. GB 175-2007 (2007). Common Portland cement. National Standards of People’s Republic of China, Beijing. [Google Scholar]
38. GB/T 14684-2022 (2022). Sand for construction. National Standards of People’s Republic of China, Beijing. [Google Scholar]
39. ASTM C469-02 (2017). Standard test method for static modulus of elasticity and poisson’s ratio of concrete in compression. West Conshohoken, PA, USA. [Google Scholar]
40. Chen, W., Han, Y., Agostini, F., Skoczylas, F., Corbeel, D. (2021). Permeability of a macro-cracked concrete effect of confining pressure and modelling. Materials, 14(4), 862. [Google Scholar] [PubMed]
41. Chen, W., Shan, W., Liang, Y., Skoczylas, F. (2023). Effect of dry-wet cycles on the transport and mechanical properties of cement mortar subjected to sulfate attack. Fluid Dynamics & Materials Processing, 19(3), 679–696. https://doi.org/10.32604/fdmp.2022.021249 [Google Scholar] [CrossRef]
42. Chen, W., Liu, Y., Sheng, M., Zhang, H., Liang, Y. et al. (2022). Heating rate effect on gas permeability and pore structure of mortar under high temperature. Materials, 15(19), 6505. [Google Scholar] [PubMed]
Cite This Article
 Copyright © 2024 The Author(s). Published by Tech Science Press.
This work is licensed under a Creative Commons Attribution 4.0 International License , which permits unrestricted use, distribution, and reproduction in any medium, provided the original work is properly cited.
 Downloads
 Citation Tools