
 Submit a Paper
 Propose a Special lssue
 Open Access
ARTICLE

Integrated Experimental and Numerical Analysis of Particle Migration Effects on Produced Water Reinjection in Offshore Reservoirs
1 School of Petroleum Engineering, Yangtze University, Wuhan, 430100, China
2 China National Offshore Oil Corporation (China) Limited, Zhanjiang Branch, Zhanjiang, 524057, China
* Corresponding Author: Fengshuang Du. Email:
(This article belongs to the Special Issue: Multiphase Fluid Flow Behaviors in Oil, Gas, Water, and Solid Systems during CCUS Processes in Hydrocarbon Reservoirs)
Fluid Dynamics & Materials Processing 2025, 21(10), 2629-2650. https://doi.org/10.32604/fdmp.2025.070344
Received 14 July 2025; Accepted 29 September 2025; Issue published 30 October 2025
 View Full Text
 Download PDF
Abstract
Produced water reinjection is a common strategy in offshore oilfield operations, yet the presence of solid particles in produced water can lead to localized formation pressure buildup, increasing the risk of rock fracturing and leakage. In this study, we present an integrated experimental and numerical investigation to quantify the effects of particle migration on formation pressure and the spatial diffusion of injected water. Dynamic plugging experiments were performed to systematically examine the influence of injection rate and injection volume on core permeability. Results demonstrate that higher injection rates substantially reduce permeability, and the derived relationship between permeability and injection volume enables dynamic assessment of permeability evolution during reinjection. Complementary numerical simulations explored the impacts of injection length, particle concentration, and injection rate on formation pressure and diffusion behavior. Findings indicate that extending the injection section promotes pressure distribution and enlarges the diffusion area, whereas elevated particle concentrations and injection rates accelerate formation plugging, causing rapid pressure rise and constrained diffusion.Keywords
New techniques, technologies, and prospective resources are constantly emerging in the realm of energy exploration and production [1,2,3]. For example, during offshore oil exploration and production, reinjection of produced water into the formation has become a relatively common practice [4,5,6]. Produced water is reinjected back into the formation for two purposes. The first one is that the reinjection of produced water can function as water flooding. It can not only prevent the energy of formation from dropping too fast, but also maintain a high production rate [7,8]. Secondly, reinjection of produced water serves as an effective method for wastewater management on offshore platforms [9]. By injecting produced water back into the formation, it reduces the volume of wastewater that needs to be treated or disposed of at the surface. This not only minimizes the environmental impact but also decreases the operational costs associated with wastewater treatment and transportation. However, produced water typically contains a large amount of solid particles, which can affect formation pressure and the effectiveness of reinjection [10]. Extensive research has explored particle-induced reservoir damage at the core scale. However, the quantitative relationship between migrating solids and macroscopic reservoir pressure evolution under in-situ flow rates and in-situ volume conditions remains poorly constrained. Specifically, the combined effects of injection rate, particle concentration, and injection length on controlling the distribution of pore pressure accumulation and the resulting reinjection water diffusion area have not been systematically investigated. Filling this research gap is critical for predicting the risk of unanticipated fracturing and optimizing long-term water injection management strategies for offshore assets. Despite these challenges, reinjection of produced water into the subsurface has been widely recognized as a critical strategy for minimizing pollution and aligning with important environmental goals [11,12,13].
Particle migration, which encompasses the processes of particle release, transport, and plugging [14], significantly impacts reservoir flow capacity. This is primarily manifested in pore-throat blockage and a reduction in permeability [15]. On one hand, particle deposition in pores and throats reduces pore connectivity, leading to permeability decline [16,17]. On the other hand, particle migration alters pore structure [18,19]. This is particularly evident in the near-wellbore region, where continuous particle migration causes blockages. These blockages further impede hydrocarbon flow. However, some studies have indicated that particle migration can sometimes improve pore connectivity. Thereby, it can have a positive impact on permeability [20].
In recent years, scholars at home and abroad have conducted extensive research on the issue of particle migration. Previous research has integrated experimental and numerical approaches. These studies have delved into the microscale mechanisms of particle migration [21,22,23]. In terms of experimentation, Moghadasi et al. [24] conducted a series of experiments. These studies focused on particle migration and deposition in porous media during water injection. Their findings indicated that the increase in flow resistance primarily stems from upstream blockage. This blockage results from the accumulation of fine particles at the inlet of the porous medium. Agbangla et al. [25] developed a polydimethylsiloxane (PDMS) device during their experiments to directly observe dynamic plugging. Their research found that bridging occurs when the ratio of particle diameter to pore-throat width exceeds 0.1. Furthermore, this ratio increase to above 0.6 leading to pore-throat blockage. Jung et al. [26] conducted experimental studies to directly observe the migration of particles in porous media. Their research showed that fine particles within the porous media migrate with the flowing fluid, causing pore bridging or blockage. Medhi et al. [27] conducted an experiment to obtain the velocity and concentration distribution of particles. In numerical simulations, particle migration is studied using computational fluid dynamics (CFD) and the discrete element method (DEM) [28,29,30]. Elrahmani et al. [31] proposed a modeling method based on coupled CFD-DEM. This method investigates the effects of flow velocity on permeability reduction in porous media. It also examines the impact of fine particle size on this reduction. Simulations indicate that permeability reduction is directly proportional to flow velocity. Su et al. [32] used the ERIGID algorithm to study fluid-particle interactions. The ERIGID algorithm combines Computational Fluid Dynamics (CFD) with the Discrete Element Method (DEM). It helps explore how particles concentrate and block pores. The numerical results revealed two influences on particle migration. One is direct contact between particles. The other involves non-contact particles clogging nearby fluid flow pathways. Particle size significantly impacts macroscopic particle migration. Compared to larger particles, smaller particles are more likely to move along the main flow direction. Feng et al. [33] used a coupled CFD-DEM to study particle migration in porous media. They found that as particle concentration increases, particles gradually occupy pore space and reduce the permeability of the porous media.
Although previous work has documented core-scale permeability loss caused by solids in produced water, the field-scale linkage between migrating particles and the evolution of formation pressure or reinjection sweep efficiency remains unquantified. In this study, we expand upon prior research. We have utilized both experimental and simulation methods. Our focus is on the effects of particle migration. Specifically, we focus on the effect of particle migration on (i) the temporal evolution of near-wellbore permeability, (ii) the resulting build-up of formation pressure, and (iii) the diffusion area of re-injected produced water. Initially, we conducted experiments to obtain the relationship between permeability (K) and injection volume (PV). Subsequently, we incorporated the K-PV relationship into a macroscopic model. This allowed us to explore how injection length, particle concentration, and injection rate affect formation pressure and the diffusion area of produced water. Finally, we analyzed the results to further elucidate the damage caused by particle migration in the formation during produced water reinjection.
In this part, we used core experiments to analyze the effects of produced water injection on permeability. The rock samples used in the experiment were sandstone, sourced directly from the field, as shown in Fig. 1. For the characterization of produced water, we adopt GB/T14848-9 groundwater quality analysis standards to measure its properties, such as salinity, pH, density, and viscosity. The produced water is of the CaCl2 type, with a total salinity of 3.21% and a total concentration of Ca2+ and Mg2+ ions of 973 mg/L. This classifies it as moderate saline water, as detailed in Table 1. The pH of the produced water is 6.5, indicating a slightly acidic nature. Its density is 1.0457 g/cm3, and its viscosity is 0.4 cP at 40°C. The produced water chemistry data were obtained through experimental measurements to ensure accuracy under study-specific conditions. A schematic diagram of the displacement device is shown in Fig. 2. It includes the core holder, ISCO displacement pump, pressure gauge, hand pump, and beaker.
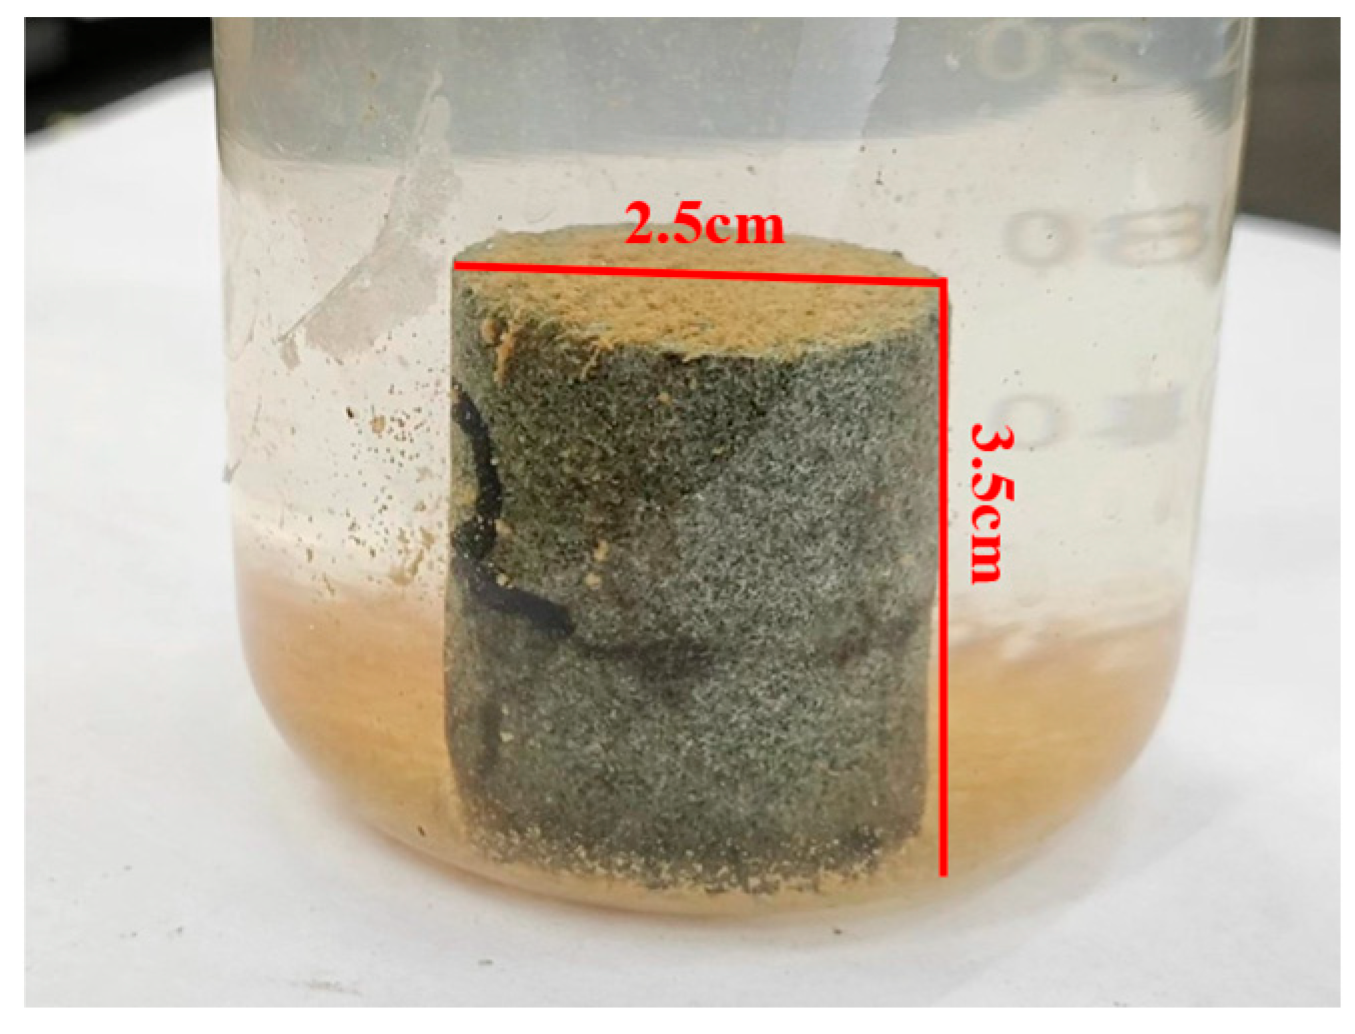
Figure 1: Sandstone sample.
Table 1: Salinity of Produced Water.
| TDS mg/L | Na+ mg/L | K+ mg/L | Ca2+ mg/L | Mg2+ mg/L | Cl− mg/L | HCO3− mg/L | SO42− mg/L |
|---|---|---|---|---|---|---|---|
| 32,131 | 10,605 | 895 | 737 | 233 | 18,258 | 731 | 672 |
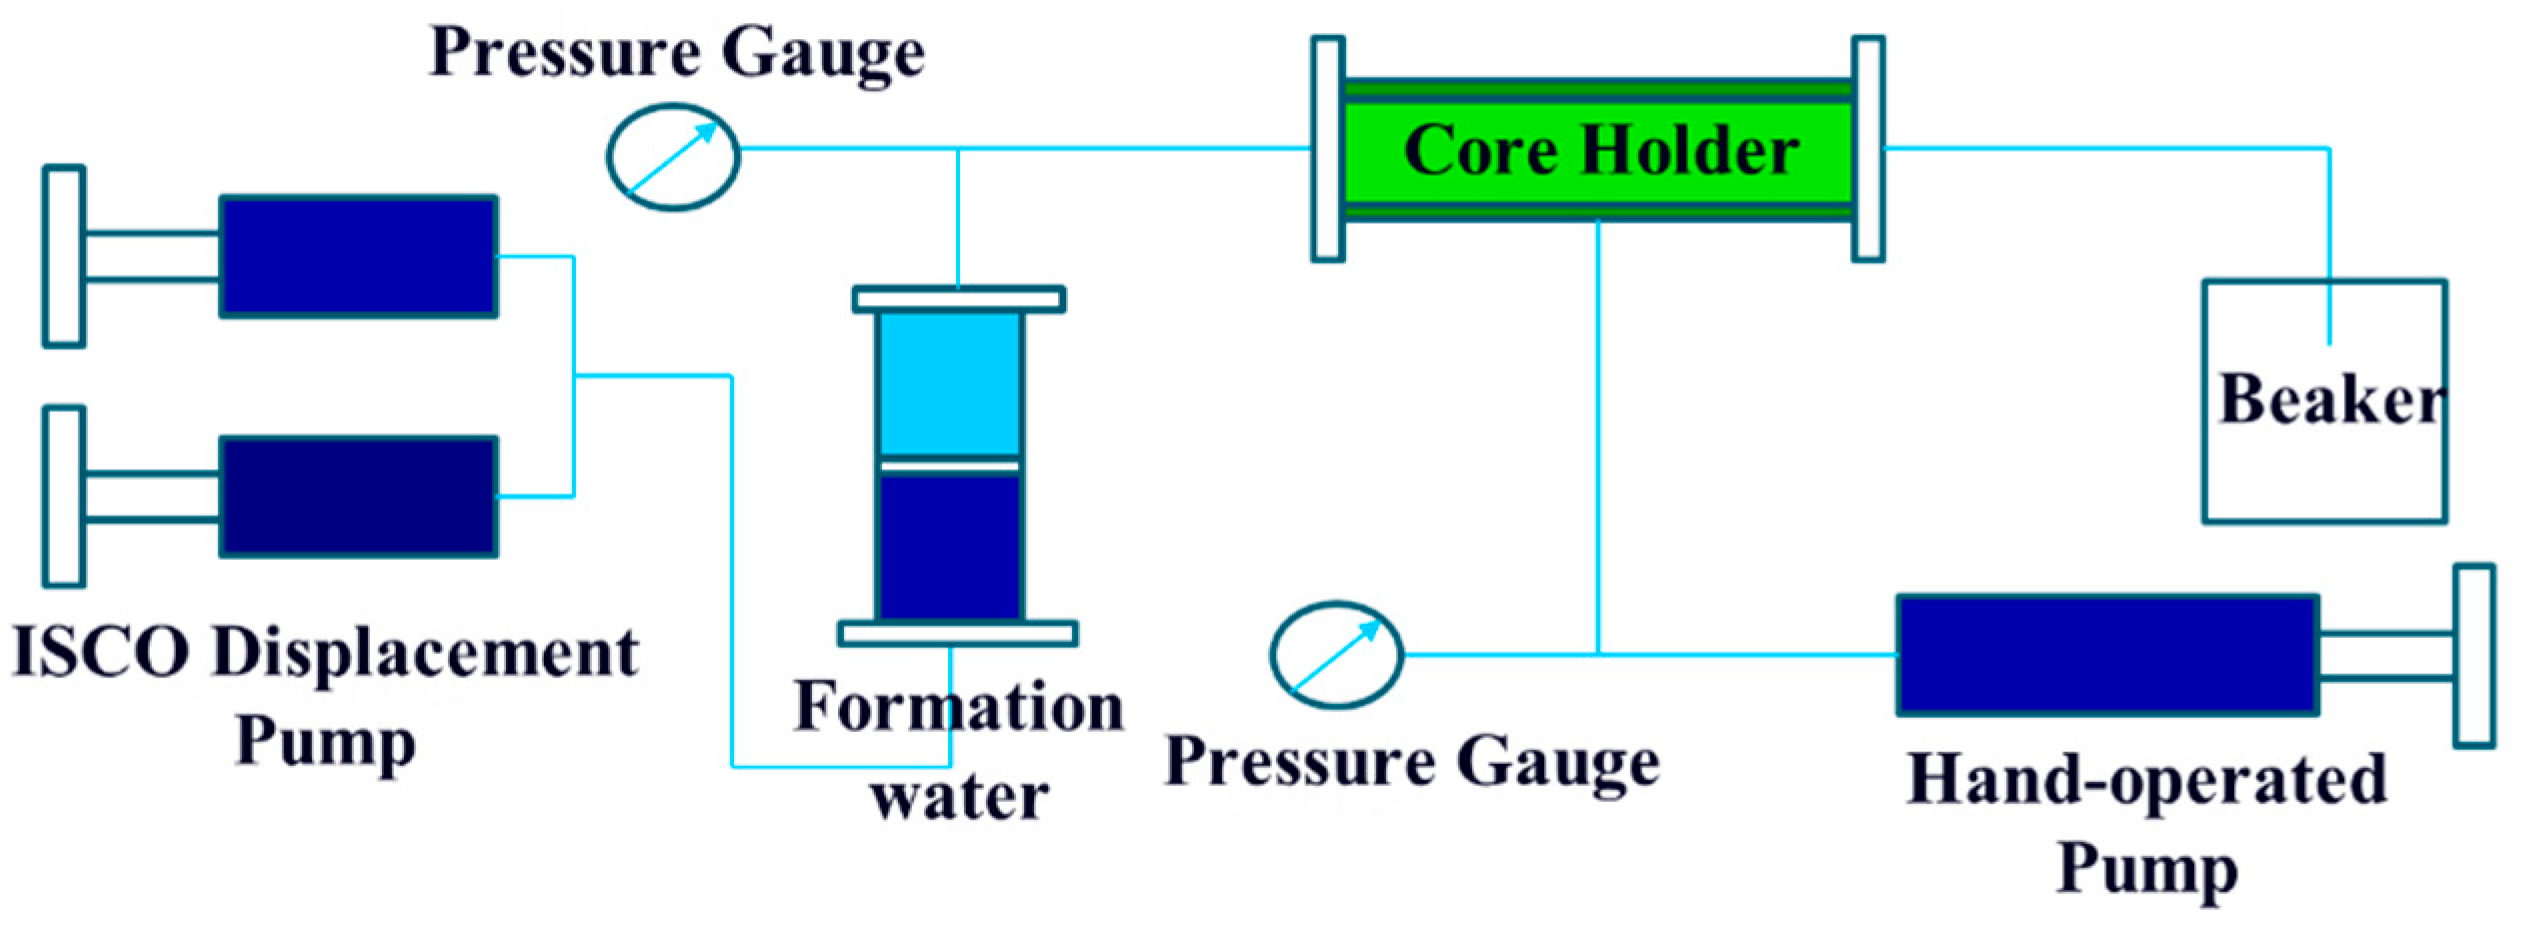
Figure 2: Schematic diagram of the displacement device.
The target core samples were selected for pretreatment to ensure that their initial permeability was consistent. The core was loaded into the core holder and different injection rates (e.g., 0.1 mL/min, 1 mL/min, 2 mL/min) were set. Finally, the injection of produced water was initiated. The clogging process under actual formation conditions is simulated through the control of the flow rate and pressure of the produced water. During the injection process, pressures of inlet and outlet, injection flow rate and other parameters are recorded in time. The experiment is stopped when the core is completely blocked or the preset termination conditions are reached. With recorded pressures and flow rate, the permeability under different injection rates can be obtained.
2.2.1 Effect of Injection Rate on Core Permeability
The experimental results show that core permeability decreases nonlinearly with increasing injection rate. For a constant injection volume, higher injection rates lead to more pronounced dynamic plugging of the core. This, in turn, results in a greater rate of permeability decline. When the injection rate is low (0.1 mL/min), low-rate injection limits permeability damage to <20%. On the contrary, when the injection rate is higher (2 mL/min), the permeability damage rate exceeds 50%. The experimental results are shown in Fig. 3. At low injection rates, fluid-carried particles migrate more slowly, allowing more time for deposition within the pore space. Since particle deposition predominantly occurs near the core entrance or in larger pore spaces, forming localized blockages. These localized blockages have a relatively minor impact on overall permeability. However, the ability of the fluid to carry particles is enhanced during high-rate injection. The particles are easier to be carried deeper into the core. This is more likely to increase the area of clogging and produce particle bridge clogging, resulting in a significant decrease in overall permeability.
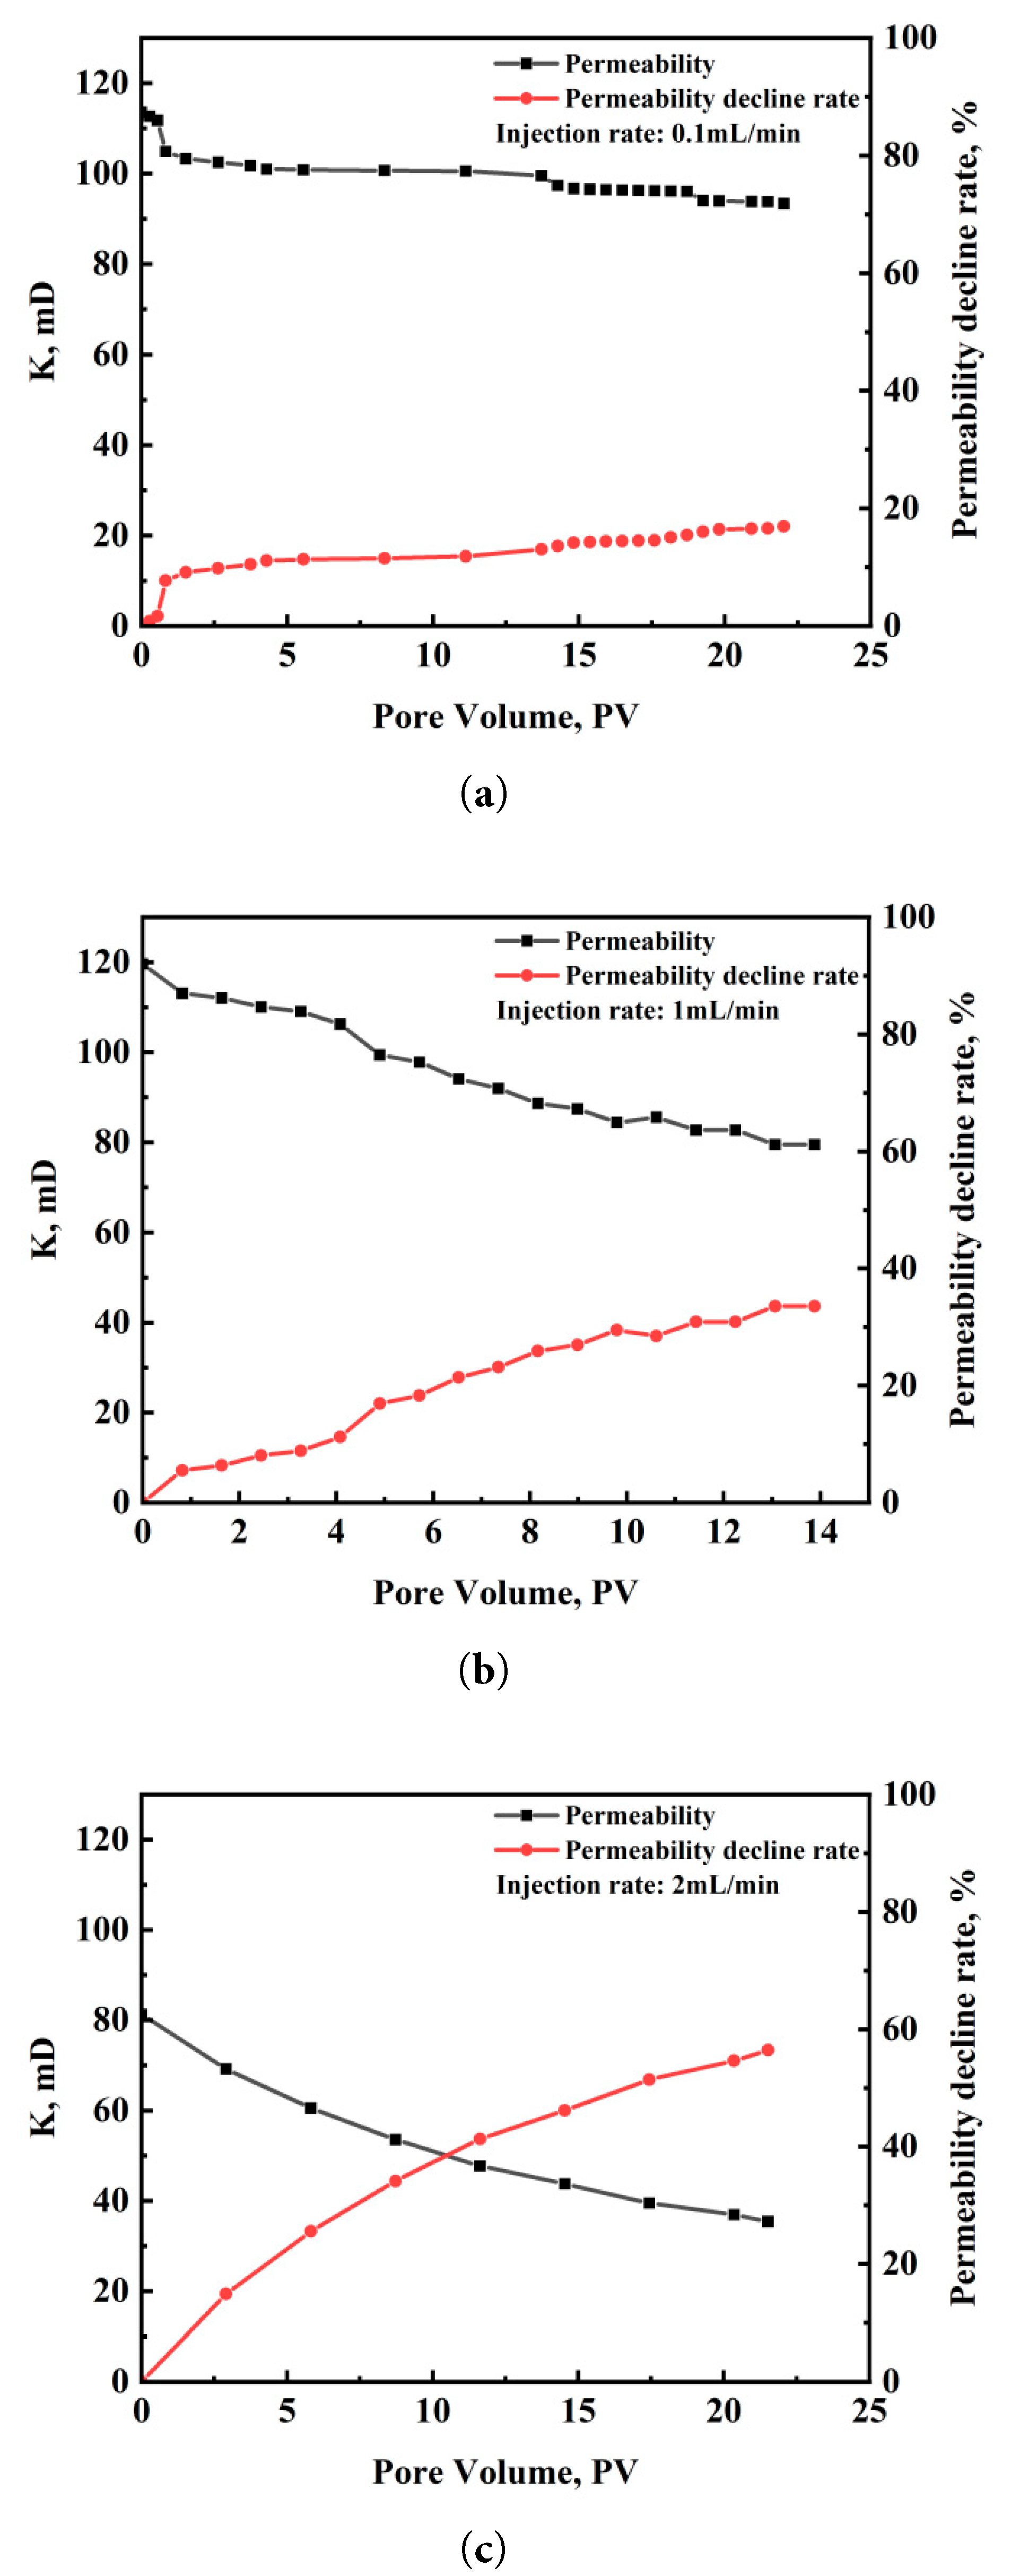
Figure 3: Variation of core permeability with different injection rates: (a) 0.1 mL/min; (b) 1 mL/min; (c) 2 mL/min.
2.2.2 Effect of Injection Volume on Core Permeability
Typical permeability range of sandstone reservoirs (0.1 mD–10 mD) generally falls within the Darcy flow regime. At each flow rate, after the pressure stabilizes, the core permeability is calculated under different injection volumes according to Darcy’s law. The experimental results indicate that core permeability decreases to varying degrees with increasing injection volume. The results are shown in Fig. 4. Core samples with high permeability (
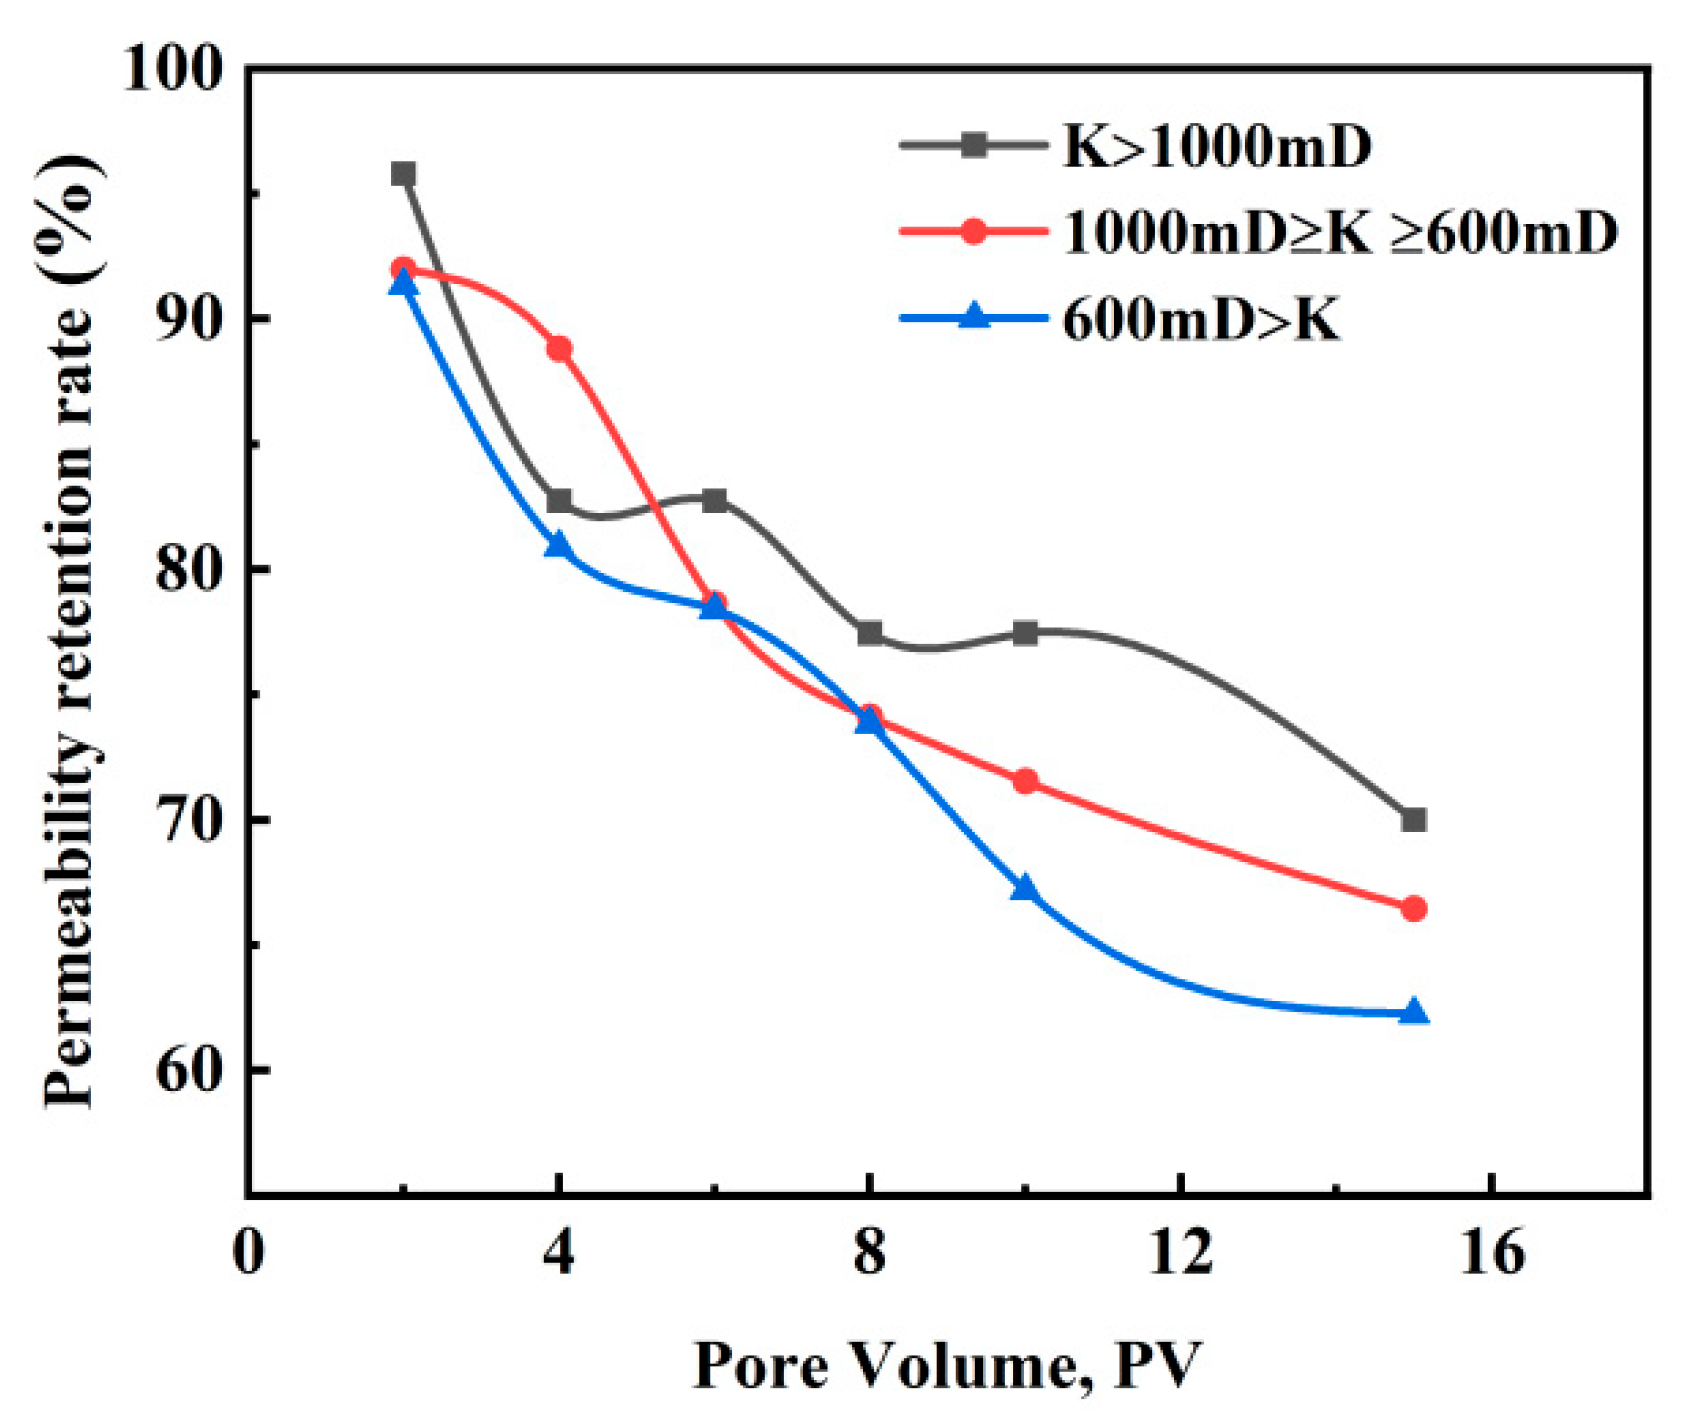
Figure 4: Results of the core flooding experiment.
Analysis of the core flooding experiment reveals that long-term injection of produced water significantly alters core permeability. The decrease in permeability can be attributed to the following factors: Particles in the produced water cause blockages within the formation, which further compress the pore space. Additionally, formation particles are dislodged. These particles cannot be easily carried away by the water because the pore throats are narrow. This leads to blockages in the pore throats. These blockages reduce the connectivity of the pore network, ultimately resulting in a significant decrease in the overall permeability of the formation [16,17].
3 Numerical Simulation of Reinjection of Produced Water Considering Particle Migration
Incorporating the time-varying characteristics of reservoir properties into the mathematical model allows the absolute permeability to dynamically adjust in response to the displacement flux [34]. This implies that there is a functional relationship between the variables and the displacement flux. Therefore, to account for the dynamic changes in reservoir properties during reinjection, this study integrates Darcy’s law with the principle of mass conservation and incorporates source and sink terms while considering the influence of gravity. This approach enables the development of a time-varying mathematical model that accurately represents the injection process and its impact on formation pressure and produced water diffusion.
The mass conservation equation describes the variation of fluid mass over time as it flows through porous media. In this study, the boundary condition for the mass conservation equation is set as a constant pressure condition. The mass conservation equations for the produced water phase (Eq. (1)) and the formation water phase (Eq. (2)) are expressed as follows:
Based on Darcy’s law, the equations of motion for the produced water phase (Eq. (3)) and the formation water phase (Eq. (4)) are derived:
3.2 Implementation of Dynamic Permeability Induced by Particle Migration
The produced water has a high solid phase content, which significantly impacts core permeability. The solid phase content is reported as total suspended solids (TSS, mg/L). This parameter determines the volume fraction of inert particles that can bridge pore throats and reduce absolute permeability. In the experiments TSS was 60 mg/L. At this level, the influence on bulk viscosity, density and mobility of the water itself is negligible. Consequently, the only effect retained in the model is solids—induced pore plugging, implemented through the K-PV correlation, while fluid properties (μ = 0.4 cP, ρ = 1.0457 g/cm3) remain unchanged. Based on the heterogeneous characteristics of formation permeability, three schemes are implemented:
This rate is not the same as the permeability change itself. Instead, it expresses the fraction of permeability retained, allowing us to compare the degree of formation damage across cores with different initial permeabilities. The y values were fitted as quadratic functions of PV (Eqs. (5)–(7)) and then imported into the reservoir simulator to update grid-block permeabilities dynamically during the 10-year reinjection simulations.
The Python pore clogging code is written based on Petrel’s intersect user edit interface. Then import the Python pore clogging code into the model through the intersect interface in the Define case. It can enable dynamic characterization of pore plugging during produced water reinjection. By fitting the relationship between permeability and injected pore volume (PV) from produced water reinjection experiments, the permeability changes in the formation were characterized into three categories: high, medium, and low. Given that the injection rate in the formation significantly exceeds the experimentally determined critical velocity, pore plugging has a pronounced impact on the formation permeability.
In this section, we constructed a model and conducted both solution and result analysis. The model’s properties were parameterized as shown in Table 2. The property field of the model is depicted in Fig. 5. The aquifer is a normal temperature and pressure system. The model predicts a cumulative reinjection volume of 118 million cubic meters over 10 years.
Table 2: Physical property parameter settings.
| Parameter | Value |
|---|---|
| Permeability, mD | 1085 |
| Porosity | 0.2575 |
| Net-to-gross ratio | 0.742 |
| Injection fluid viscosity | 0.5 cP |
| Formation fluid viscosity | 0.4 cP |
| Rock compression factor | 0.000551 MPa−1 |
| When the well injection rate | 15,000 m3/d |
| Pressure coefficient | 1 |
| Fracture pressure coefficient | 1.5 |
| Reinjection layer depth | 716–1160 m |
| Model size | 9704 m × 4900 m × 438 m |
| Volume of water | 9.9 × 10¹¹ m3 |
| Compression factor | 0.145 1/bar |
| Productivity index | 9.9 × 10⁸ m3/(d·bar) |
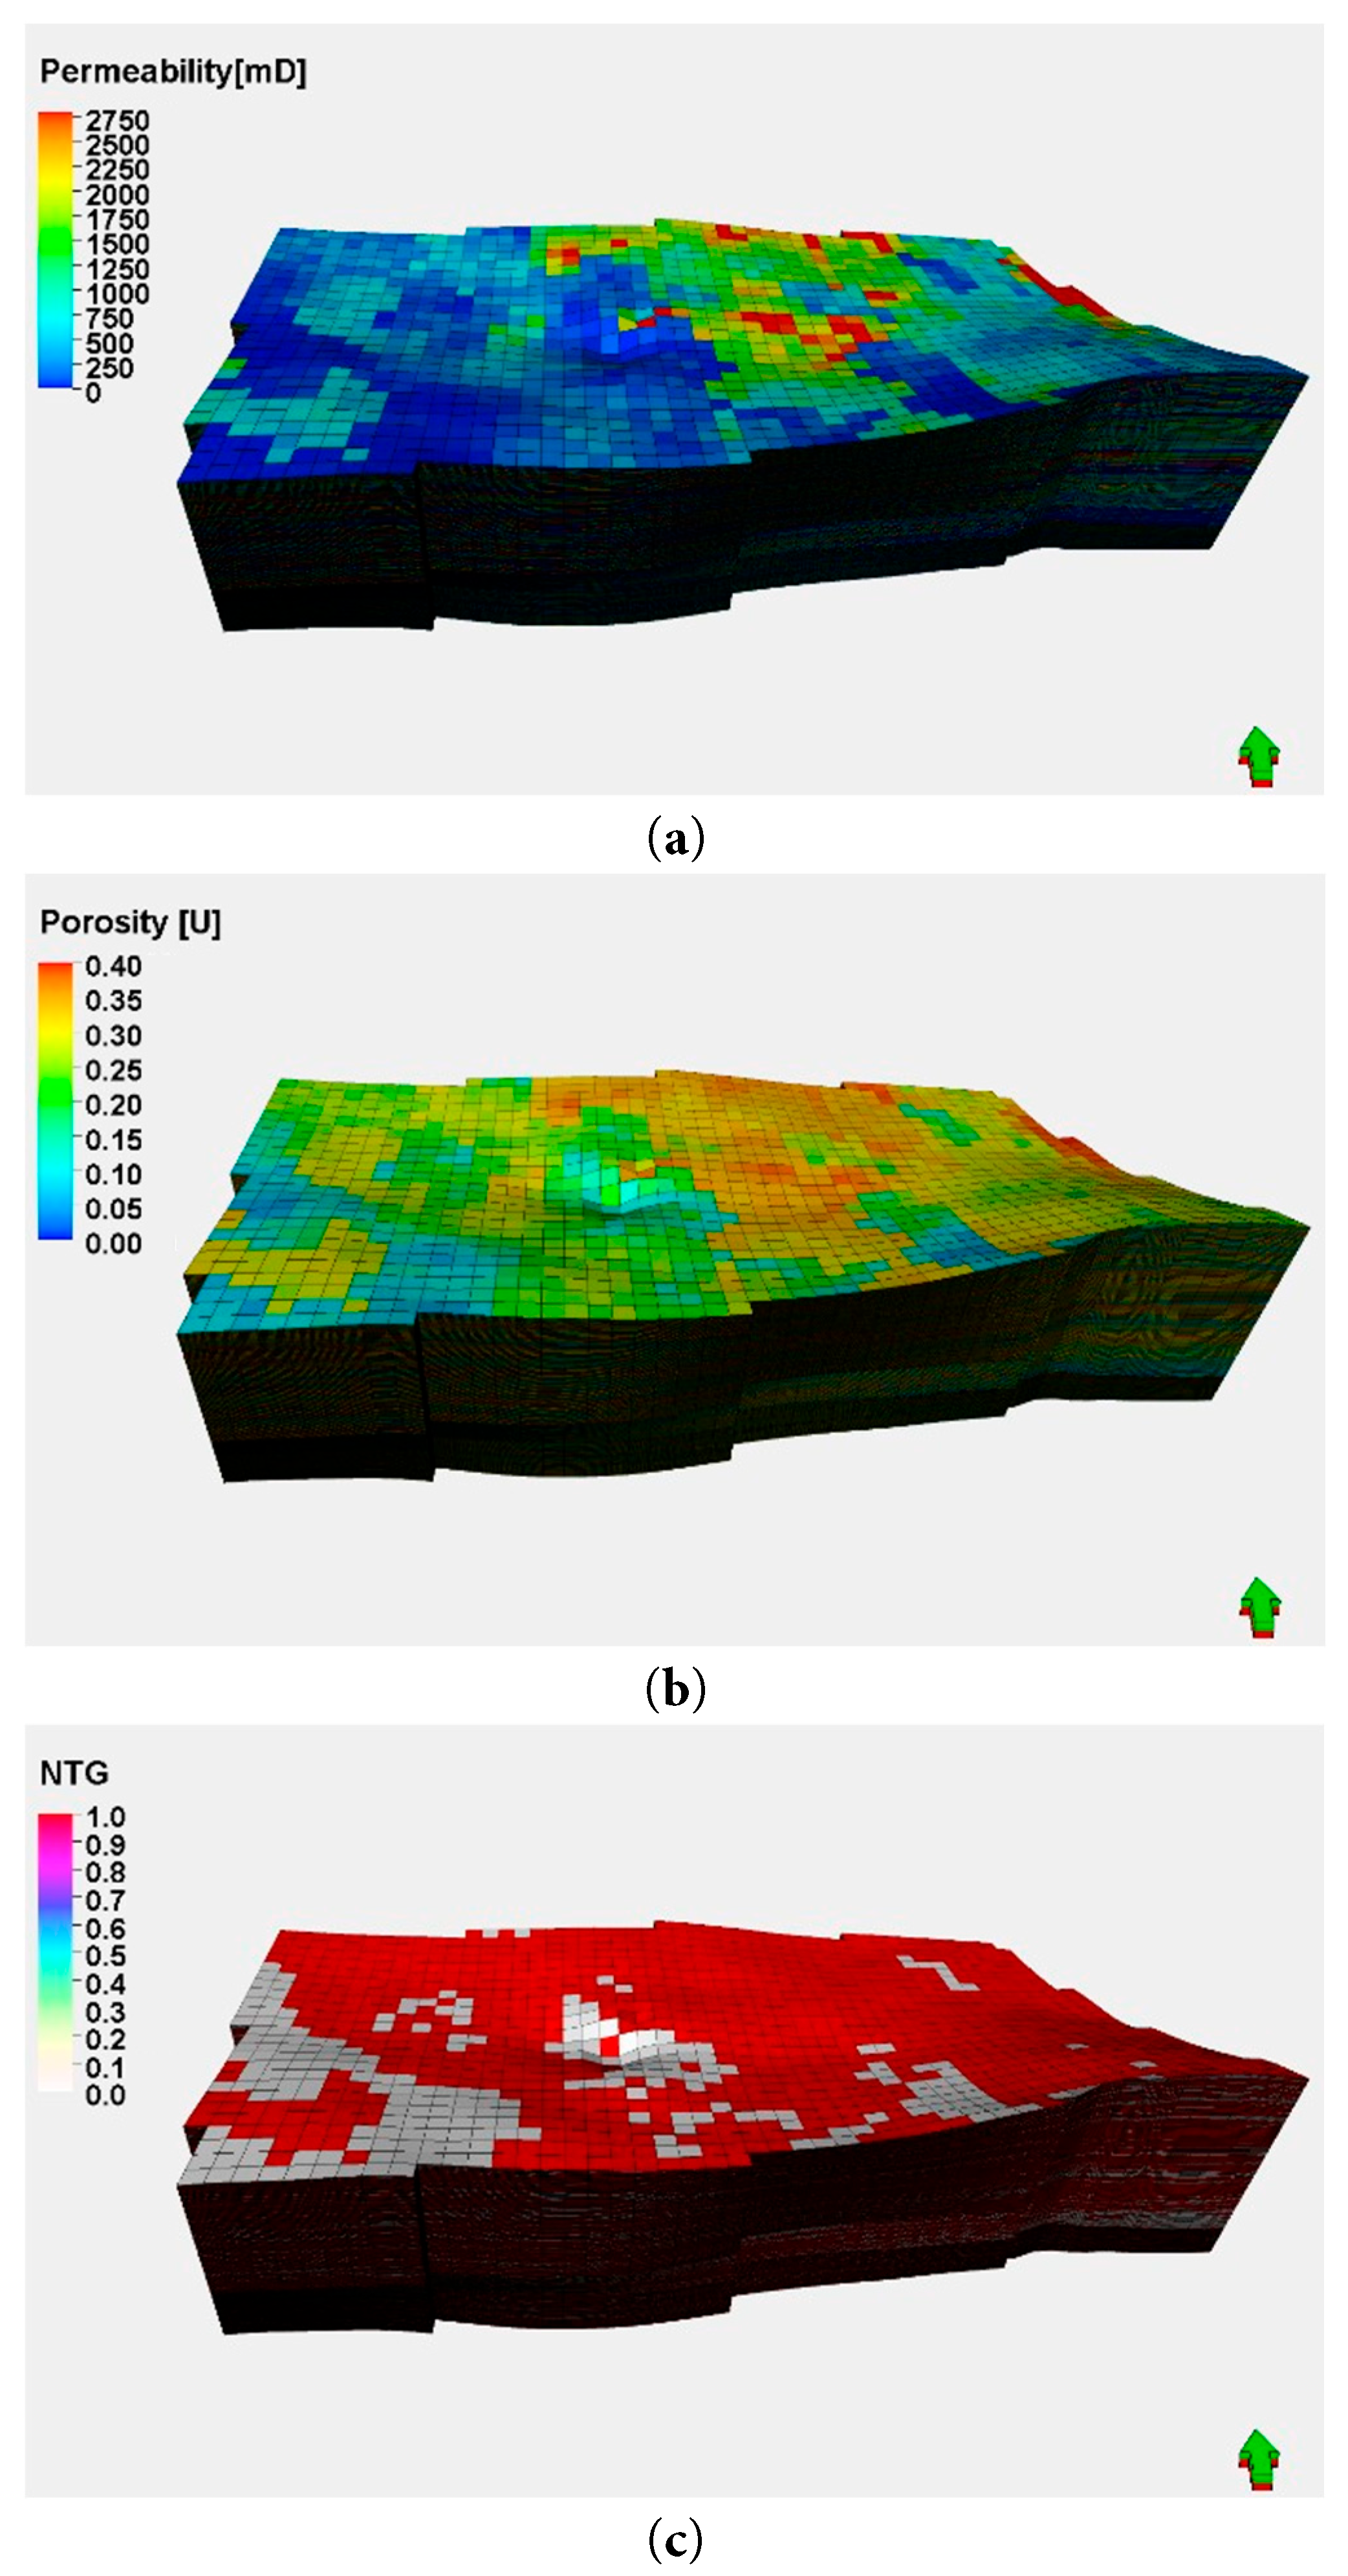
Figure 5: Model property field map: (a) Permeability field; (b) Porosity field; (c) NTG field.
All input parameters in Table 2 are field-measured averages taken from the open-hole logs, core analyses, and PVT reports of the target reservoir. Previous laboratory experiments have shown that the produced solid content is relatively high and significantly impacts permeability. To account for this effect, the permeability was divided into three classes: Class I (
To ensure that the simulation results are independent of grid resolution, a mesh-independence study was conducted. We have rerun the base-case simulation (30,000 m3/d, 60 mg/L TSS, 2600 m horizontal well) on three progressively finer meshes: Mesh-1 with 22,400 cells (Δx ≈ 40 m, Δz ≈ 5 m), Mesh-2 with 89,600 cells (Δx ≈ 20 m, Δz ≈ 2.5 m), and Mesh-3 with 358,400 cells (Δx ≈ 10 m, Δz ≈ 1.25 m). The table below lists the maximum pressure build up (ΔPmax) and the 10-year produced water diffusion area (A10) after 10 years. The percent change is computed relative to Mesh-3 (Table 3).
Table 3: Mesh sensitivity analysis.
| Mesh | Cells | ΔPmax (MPa) | Change vs. Mesh-3 | A10 (km2) | Change vs. Mesh-3 |
|---|---|---|---|---|---|
| Mesh-1 | 22,400 | 6.21 | +7.8% | 9.12 | −6.6% |
| Mesh-2 | 89,600 | 5.82 | +1.1% | 9.73 | −0.3% |
| Mesh-3 | 358,400 | 5.76 | - | 9.76 | - |
A detailed comparison revealed that the simulation results converge as the grid is refined. The differences between Mesh-2 and Mesh-3 are below 1.2% for all target variables, satisfying the mesh-independence criterion. Consequently, Mesh-2 (89,600 cells) was adopted for all production runs, guaranteeing grid-independent results while keeping CPU time manageable.
4.2 The Impact of Particle Plugging on Formation Pressure
Due to the high solid content in produced water, severe pore plugging occurs near the injection wells. This leads to a significant decrease in block permeability as injection time increases. A simulation was conducted over a period of 10 years at the designed injection rate of 30,000 m3/day without considering plugging. The results showed minimal changes in block pressure due to the favorable porosity and permeability of the injection layer, as depicted in Fig. 6a. When particle plugging was taken into account at the same injection rate over the same period, the simulation indicated that abnormally high pressure conditions would develop near the injection wells, as shown in Fig. 6b.
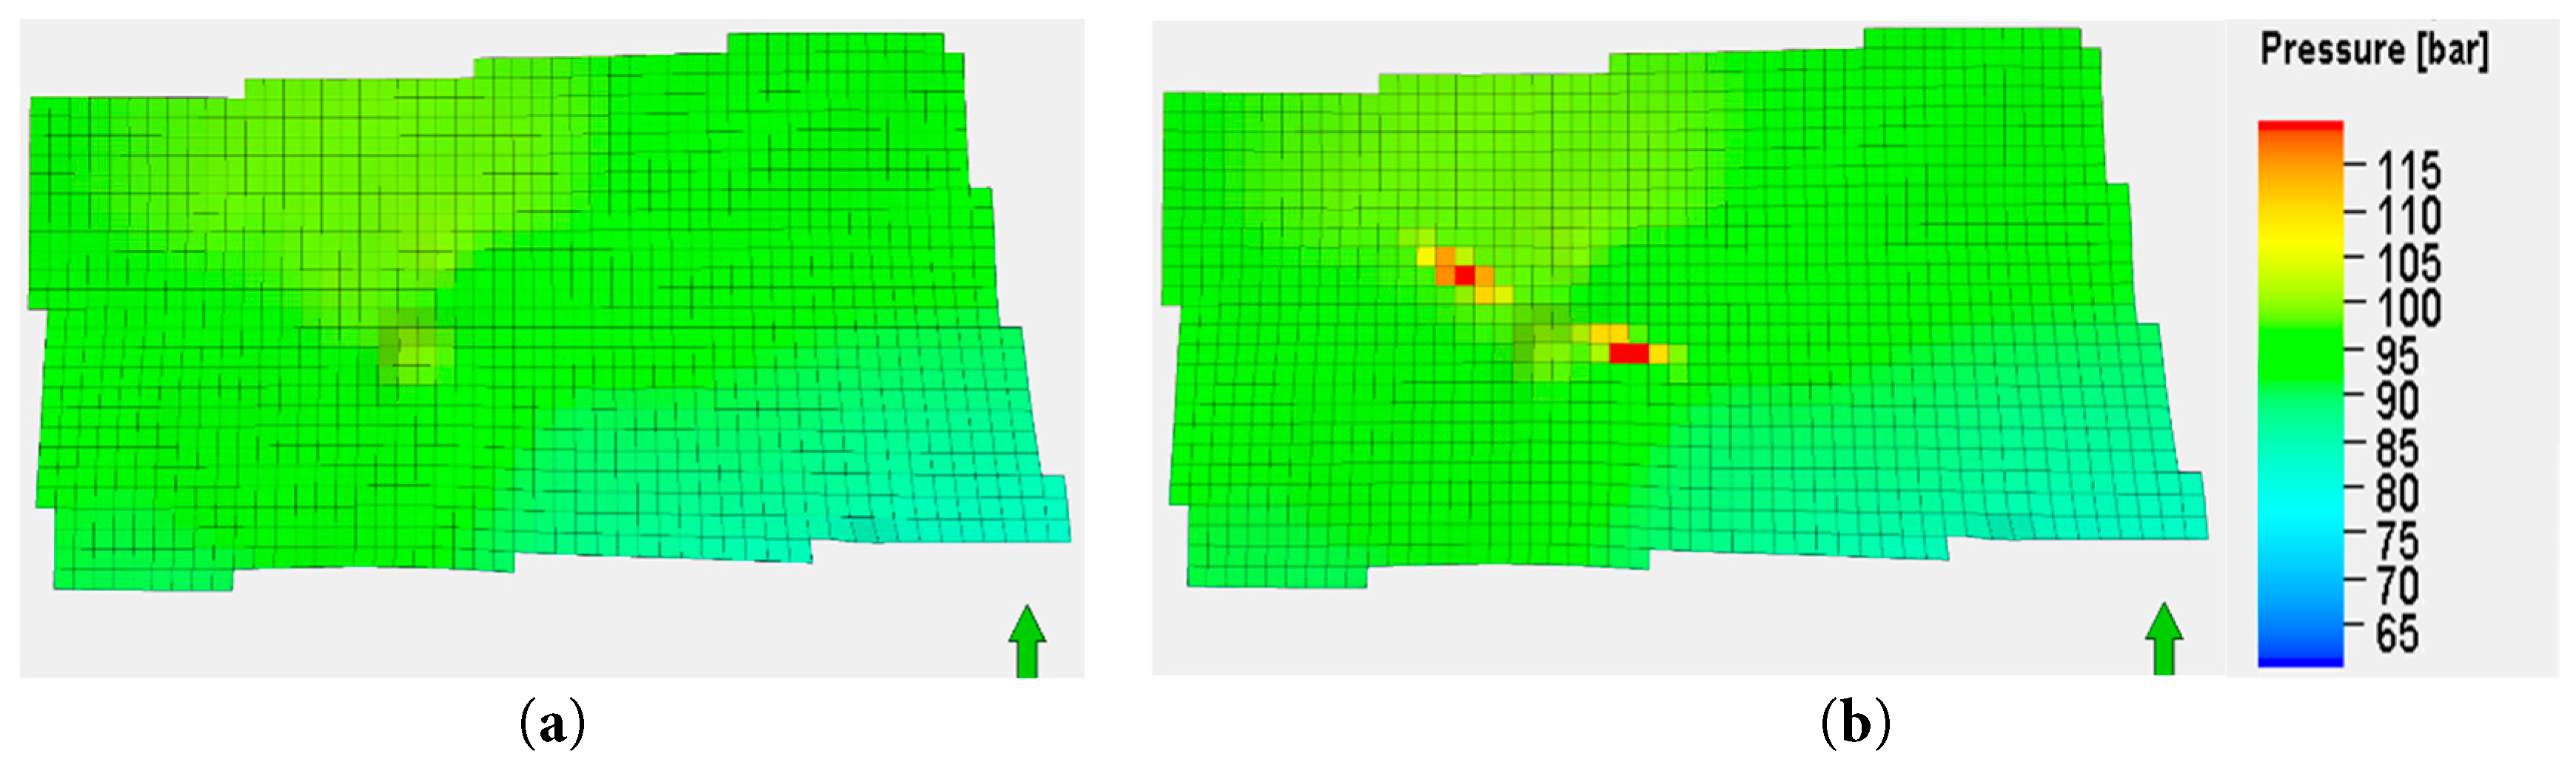
Figure 6: Formation pressure distribution at the end of the 10th year: (a) Without plugging consideration; (b) With plugging consideration.
4.3 The Impact of Injection Length on Formation Pressure
To investigate the impact of injection length, we designed horizontal well lengths at 750 m, 1300 m, and 2600 m for the simulation. An injection rate of 30,000 m3/day was applied for a period of 10 years in each case. The results, which illustrate the effects of particle migration on injection layer pressure, are presented in Fig. 7 and Fig. 8.
The model results show that as the injection length increases, the rise in formation pressure is significantly mitigated. This is based on the changes in permeability and is illustrated in Fig. 7. When the injection length is short, pressure concentrates in a smaller area, leading to a rapid increase in local pressure. Conversely, as the injection lengthens, the pressure distribution area expands, reducing the pressure increment per unit area. After 10 years of injection, the maximum pressure increase in the formation is 5.6 MPa, 3.7 MPa, and 1.6 MPa for the three different injection lengths, respectively. Therefore, a longer injection length more effectively disperses the energy of the injected fluid. This reduces pressure accumulation per unit length and slows the overall pressure rise in the formation.
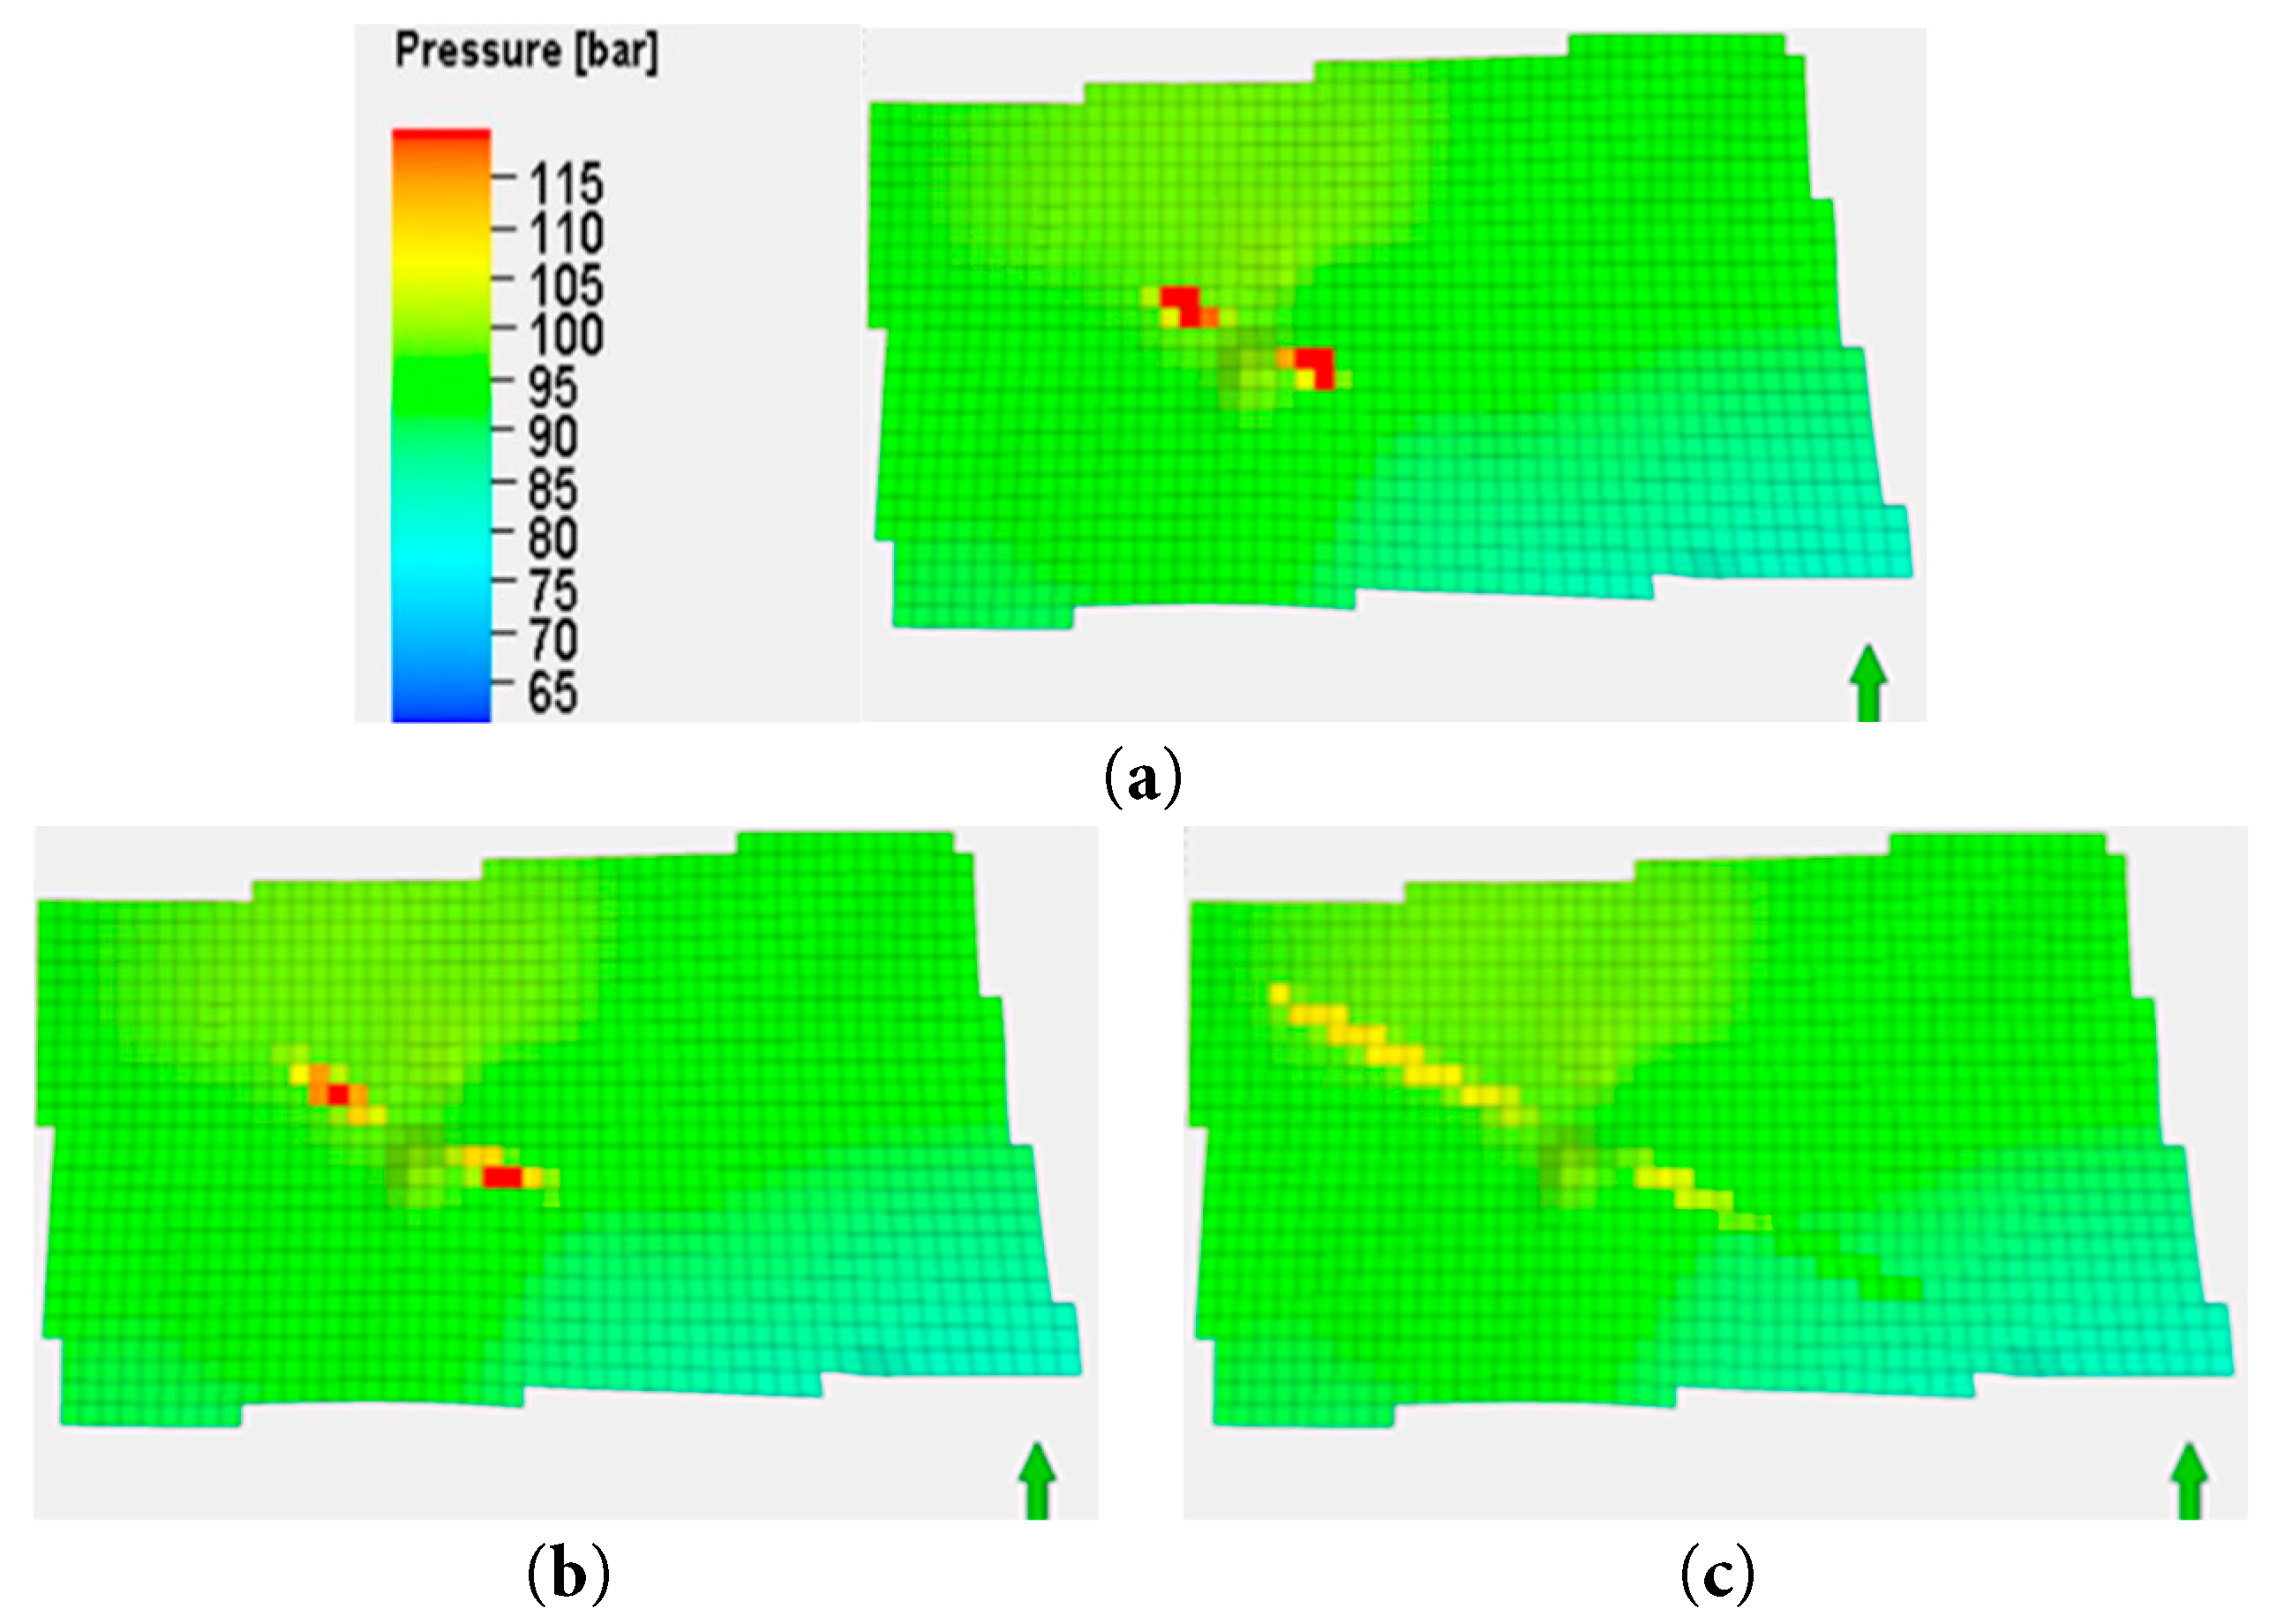
Figure 7: Formation pressure distribution at the end of the 10th year for different injection lengths: (a) L = 750 m; (b) L = 1300 m; (c) L = 2600 m.
As shown in Fig. 8, during the initial stage (0–2 years), the pressure increase in the 750-m injection length is significantly faster than in the other two lengths. This is likely due to the limited sweep area of the injected fluid in the formation. The shorter injection length causes localized pressure buildup. Over time, the pressure in the 750-m length gradually stabilizes at approximately 14 MPa, remaining higher than in the other lengths. In contrast, the pressure increase in the 1300-m and 2600-m injection lengths is more gradual, with minimal difference between them. This suggests that longer injection lengths enhance fluid distribution in the formation, thereby slowing the rate of pressure increase. Over the 10-year period, the pressures in the 1300-m and 2600-m injection lengths stabilized at approximately 12 MPa and 10 MPa, respectively. Shorter injection lengths cause rapid pressure increases and higher-pressure values. In contrast, longer injection lengths lead to more gradual pressure increases and lower stabilization pressures.
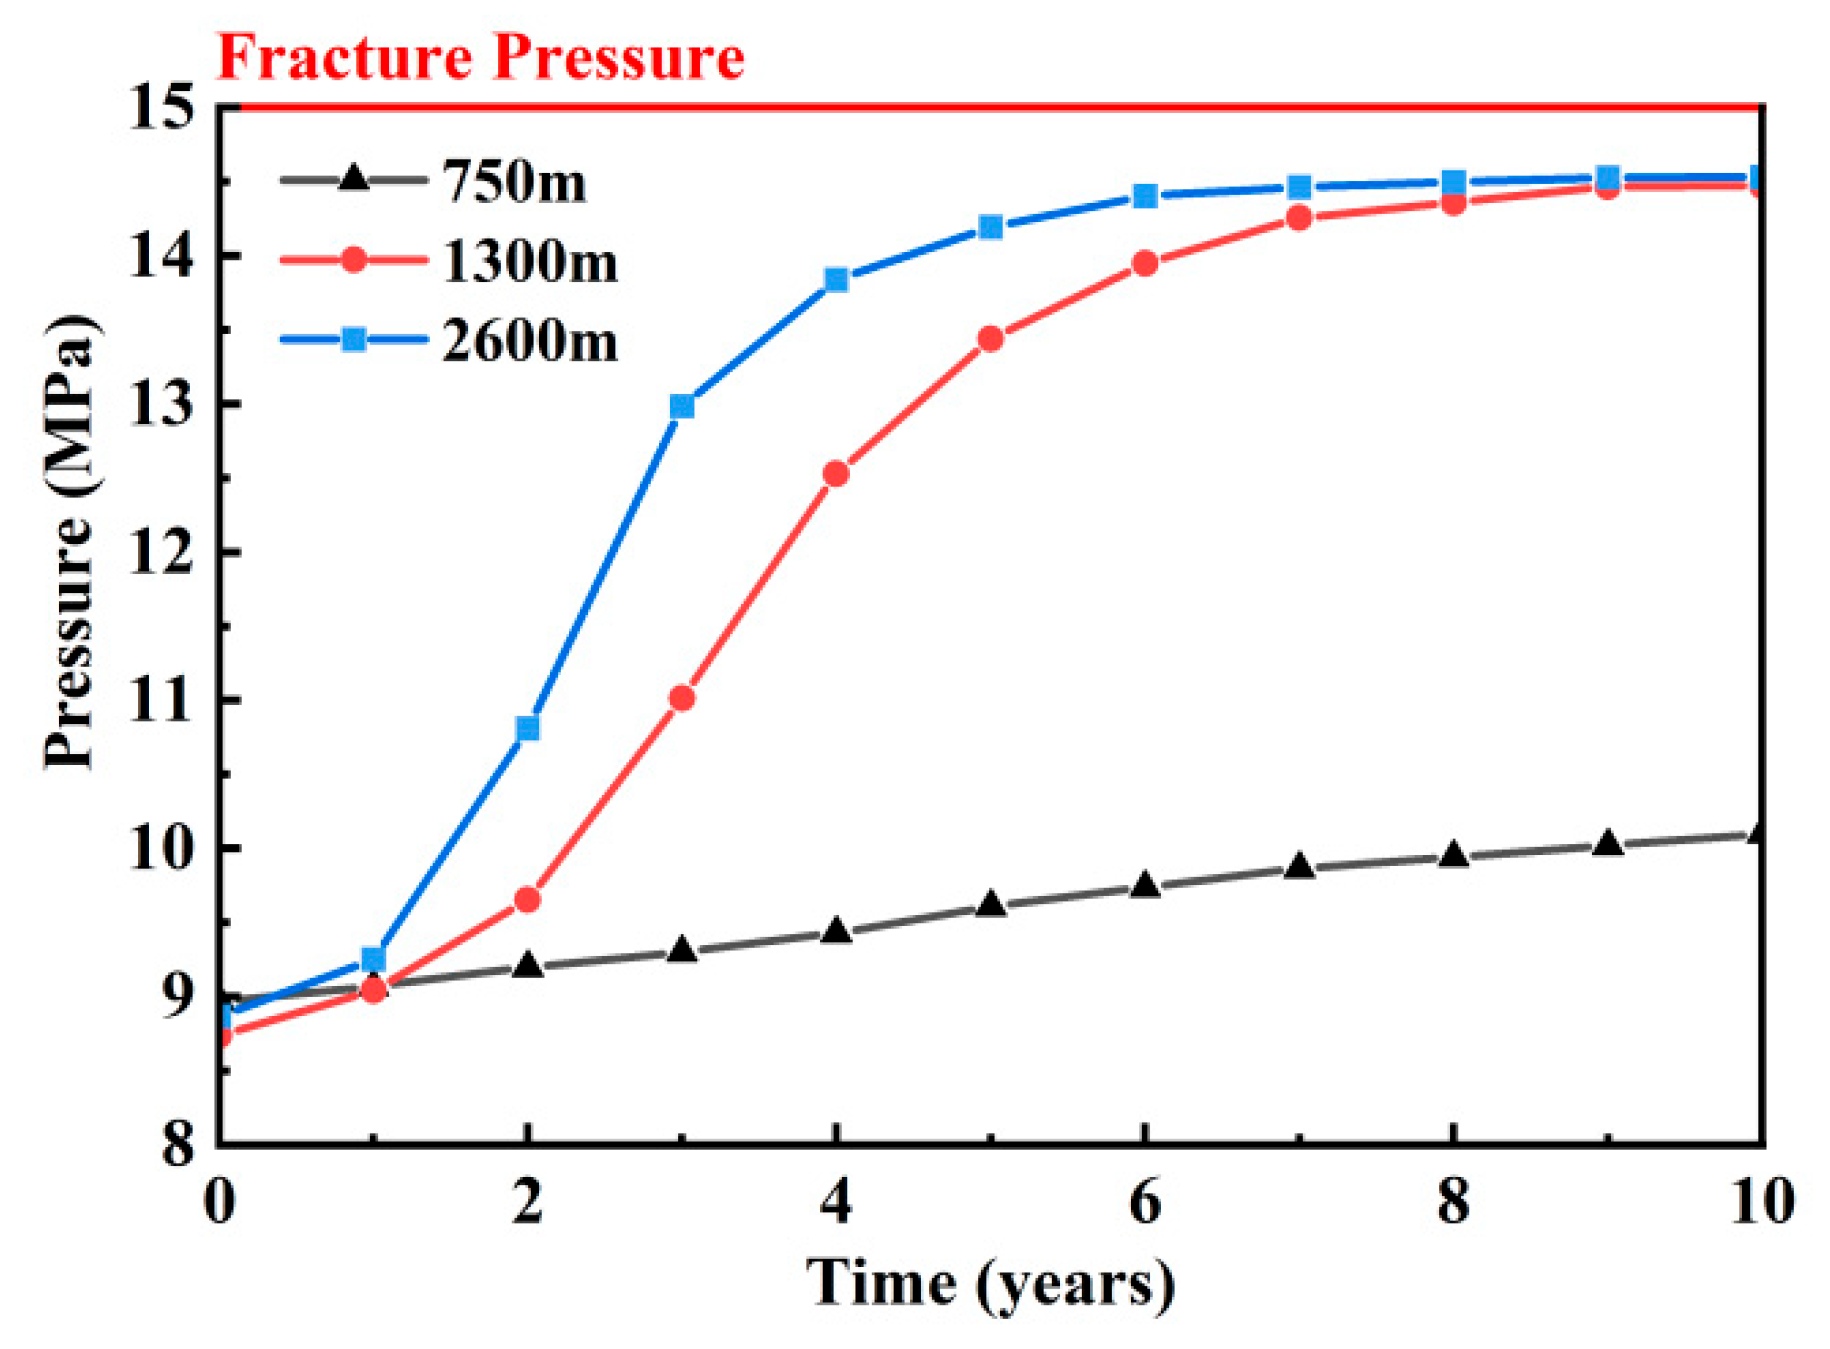
Figure 8: Maximum formation pressure for different injection lengths.
4.4 The Impact of Particle Concentration on Formation Pressure
To investigate the impact of different particle concentrations (2 mg/L, 5 mg/L, 10 mg/L, 30 mg/L, and 60 mg/L) on formation pressure, simulations were conducted at an injection rate of 30,000 m3/day. The results, which show the influence of varying particle concentrations on the formation pressure, are presented in Fig. 9 and Fig. 10.
As shown in Fig. 9, the formation pressure exhibits distinct characteristics with increasing injected particle concentration. Specifically, as particle concentration increases, high-pressure zones (indicated by yellow and red regions) become more pronounced. This suggests that formation plugging is exacerbated, leading to more severe pressure accumulation. Increased particle deposition within the formation reduces porosity and permeability. This, in turn, increases fluid flow resistance and promotes plugging. Consequently, pressure accumulates near the plugged regions, forming high-pressure areas. After 10 years of injection, the maximum pressure changes in the reservoir for different suspended particle concentrations (2 mg/L, 5 mg/L, 10 mg/L, 30 mg/L, and 60 mg/L) were 2.3 MPa, 4.2 MPa, 6.1 MPa, 8.9 MPa, and 15.4 MPa, respectively. These results indicate that the quality of produced water significantly affects injection capacity and formation pressure.
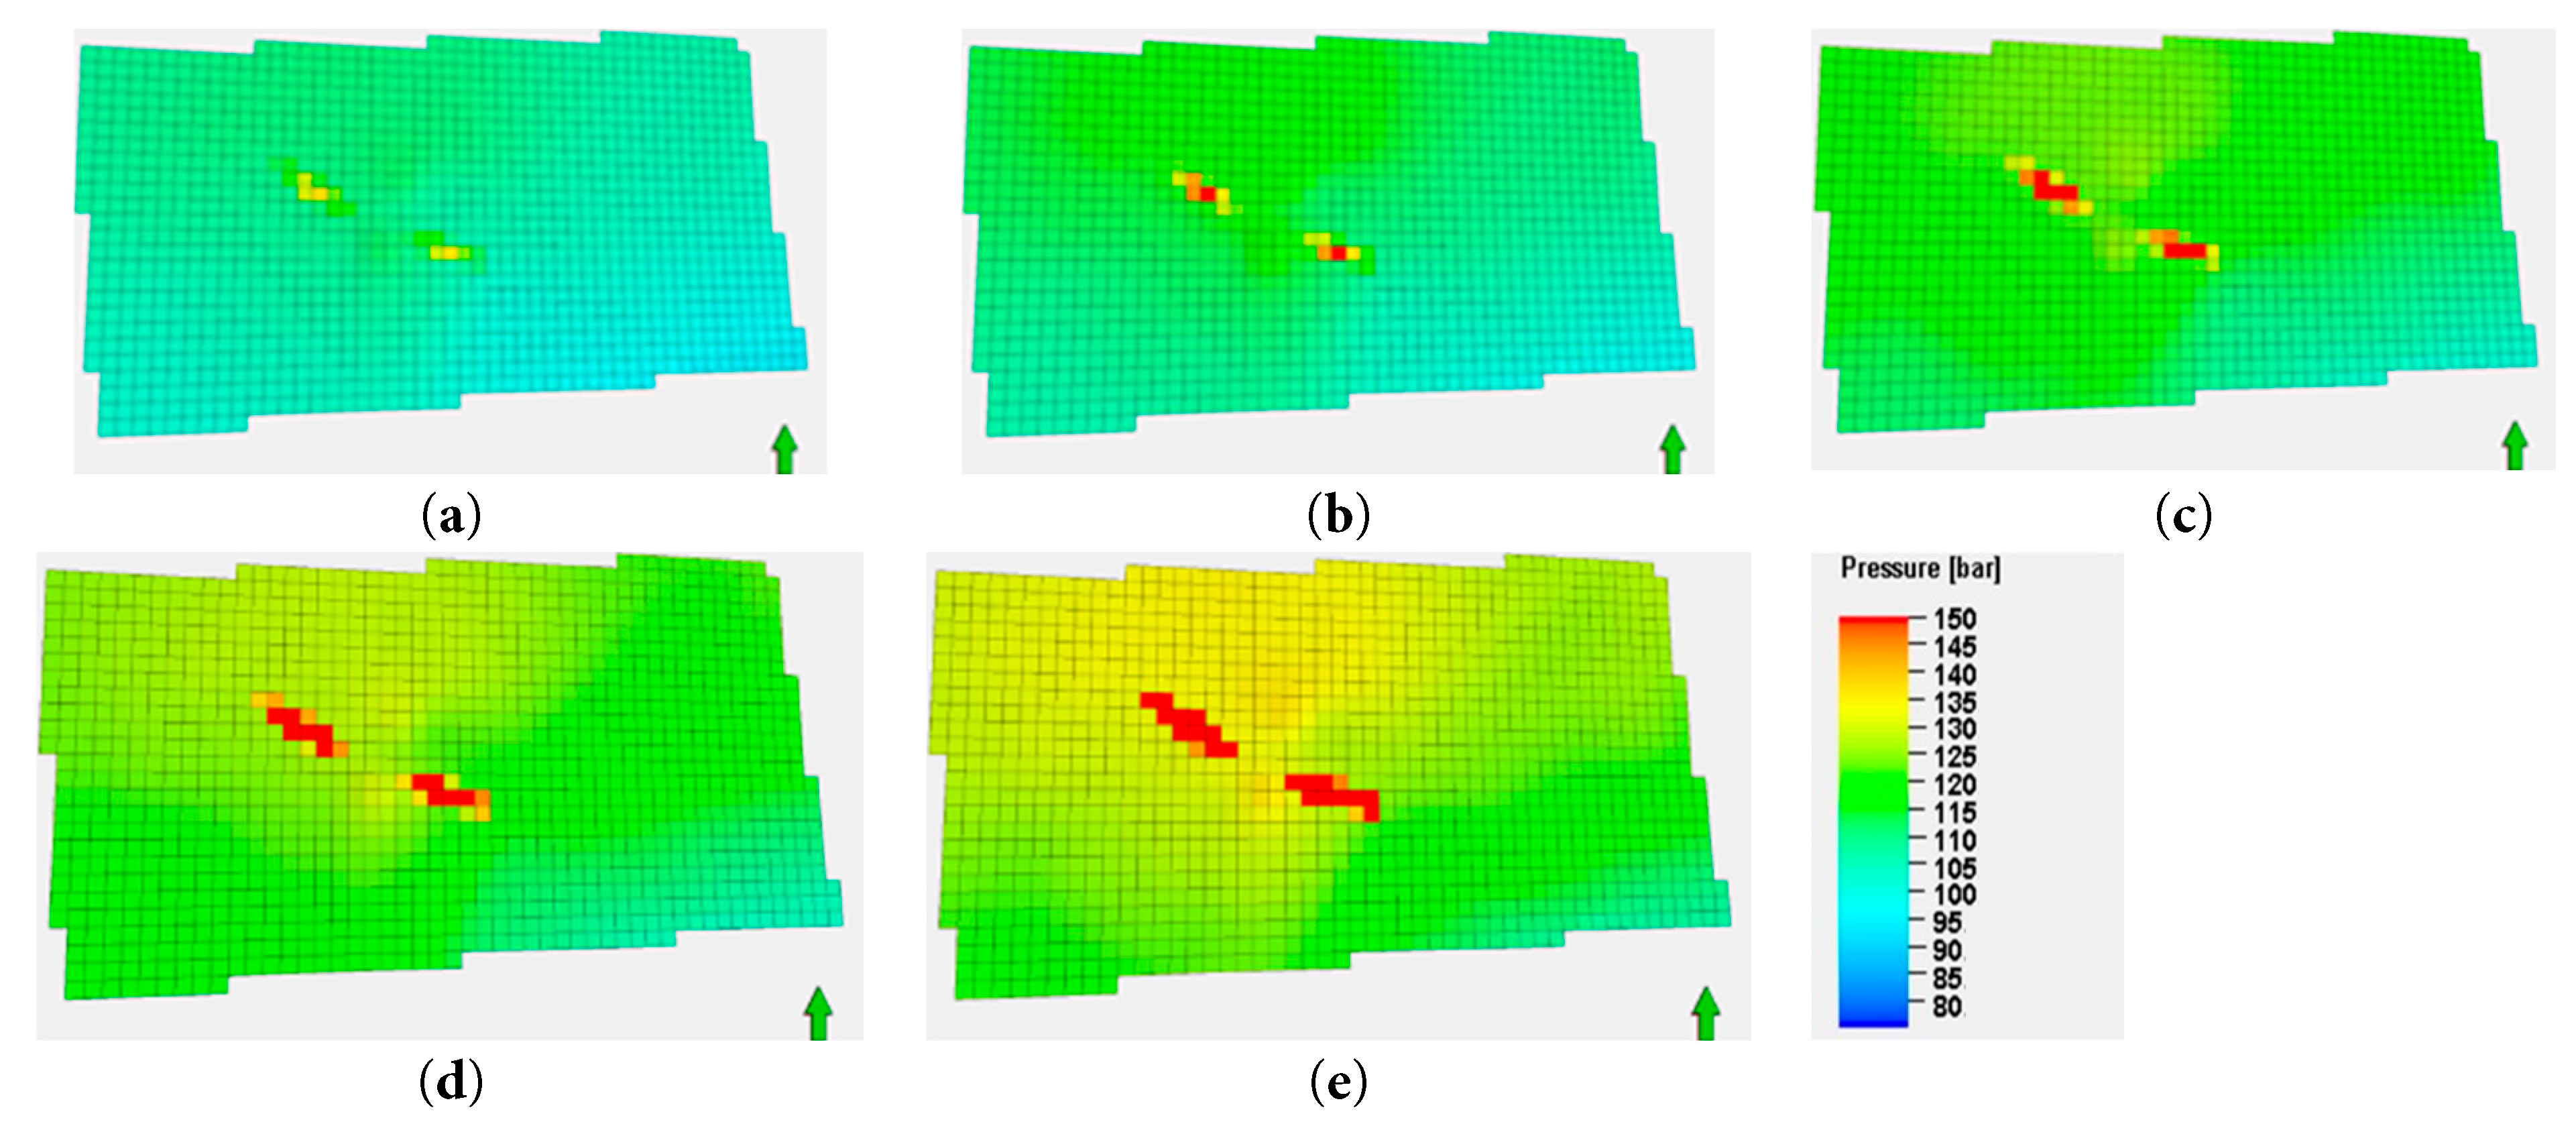
Figure 9: Formation pressure at the end of the 10th year for different particle concentrations: (a) 2 mg/L; (b) 5 mg/L; (c) 10 mg/L; (d) 30 mg/L; (e) 60 mg/L.
As shown in Fig. 10, the pressure around the injection well increases with the particle concentration of the produced water (2 mg/L, 5 mg/L, 10 mg/L, 30 mg/L and 60 mg/L) to 2.63 MPa, 3.19 MPa, 4.25 MPa, 6.23 MPa, and 12.10 MPa, respectively. For lower concentrations (2 mg/L to 10 mg/L), the pressure buildup at the wellbore is gradual, with relatively lower pressure values over extended periods. At higher concentrations (30 mg/L and 60 mg/L), the rate of pressure increase accelerates. This results in higher final pressure values compared to lower concentrations. This phenomenon is likely related to the plugging effect in the formation. At higher particle concentrations (30 mg/L and 60 mg/L), more particles are deposited in the formation, reducing its permeability and increasing fluid flow resistance. This plugging effect accumulates over time, leading to rapid increases in bottomhole pressure. Additionally, higher particle concentrations may accelerate formation damage. When particle concentrations exceed 60 mg/L, the injection well is projected to reach the fracture pressure by Year 4.5. This poses a threat to the long-term stability of the formation.
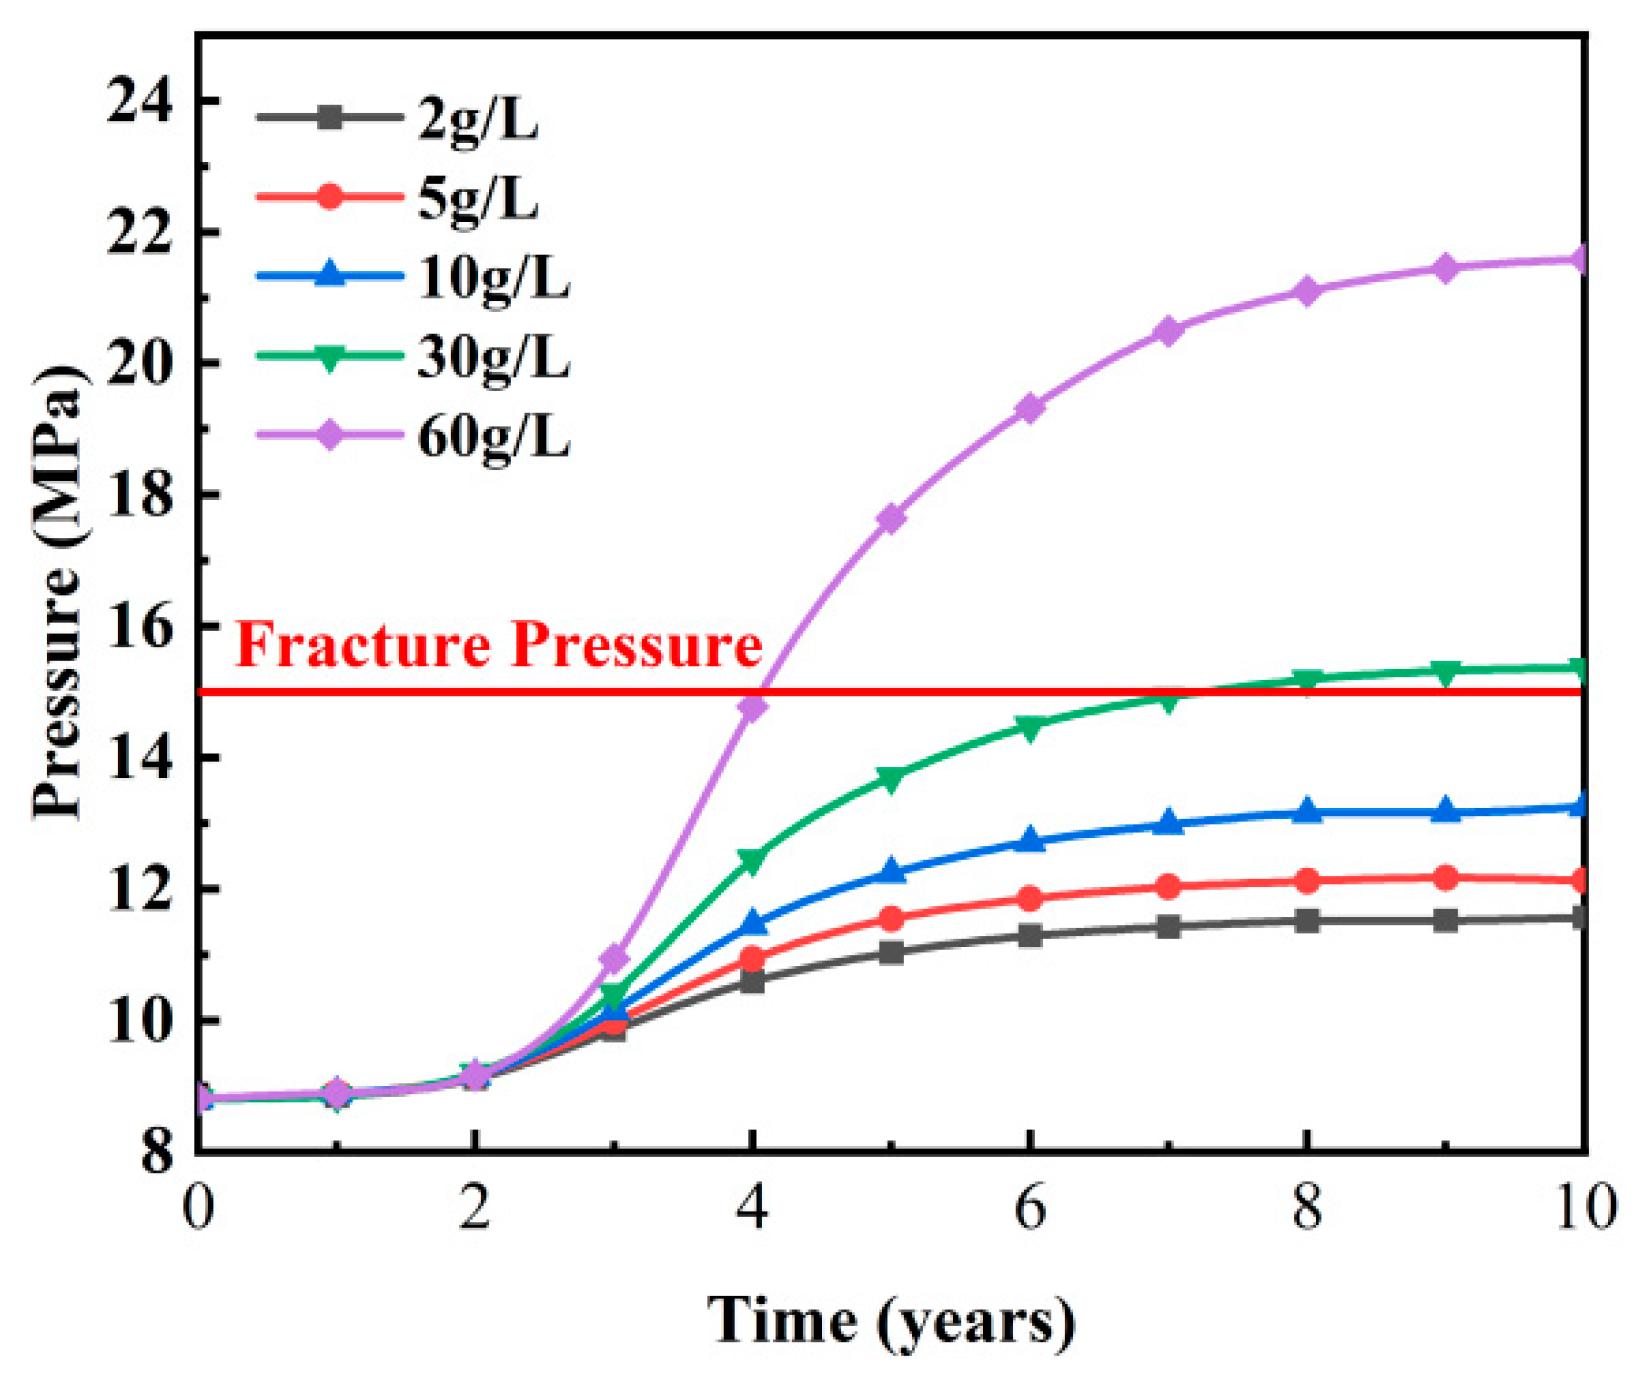
Figure 10: Maximum formation pressure for different particle concentrations.
4.5 The Impact of Injection Rate on Formation Pressure
To investigate the impact of different injection rates on formation pressure, simulations were conducted at low particle concentrations with injection rates of 30,000, 40,000, 50,000, 60,000, and 70,000 m3/day. The results, which show the changes in formation pressure, are presented in Fig. 11 and Fig. 12.
The area of pressure distribution varies with different injection rates. As shown in Fig. 11, the area of high-pressure zones (indicated by yellow and red) expands with increasing injection rates. This suggests that higher injection rates lead to more extensive pressure increases in the formation. After 10 years of injection, the maximum pressure changes in the formation are 2.3 MPa, 3.1 MPa, 3.9 MPa, 4.8 MPa, and 5.7 MPa, respectively. These results indicate a positive correlation between injection rate and formation pressure increase. High injection rates may cause rapid increases in pore pressure, which can affect formation stability.
The simulation results show that during the initial injection period (0–2 years), the formation rapidly adapts to the injected fluid, causing a swift increase in pressure. As the injection time progresses, the rate of pressure increase gradually slows down. Eventually, the pressure stabilizes under all injection rates, suggesting that the formation has reached a dynamic equilibrium. Higher injection rates, such as 7 × 10⁴ m3/day, lead to higher stable pressures more quickly due to rapid pore pressure accumulation. Conversely, lower injection rates result in slower pressure increases and lower stable pressures. For instance, when the particle concentration in produced water is low, an injection rate of 30,000 m3/day over 10 years keeps the formation stable. However, if the injection rate exceeds 70,000 m3/day, the injection well reaches the fracture pressure by Year 4, as illustrated in Fig. 12.
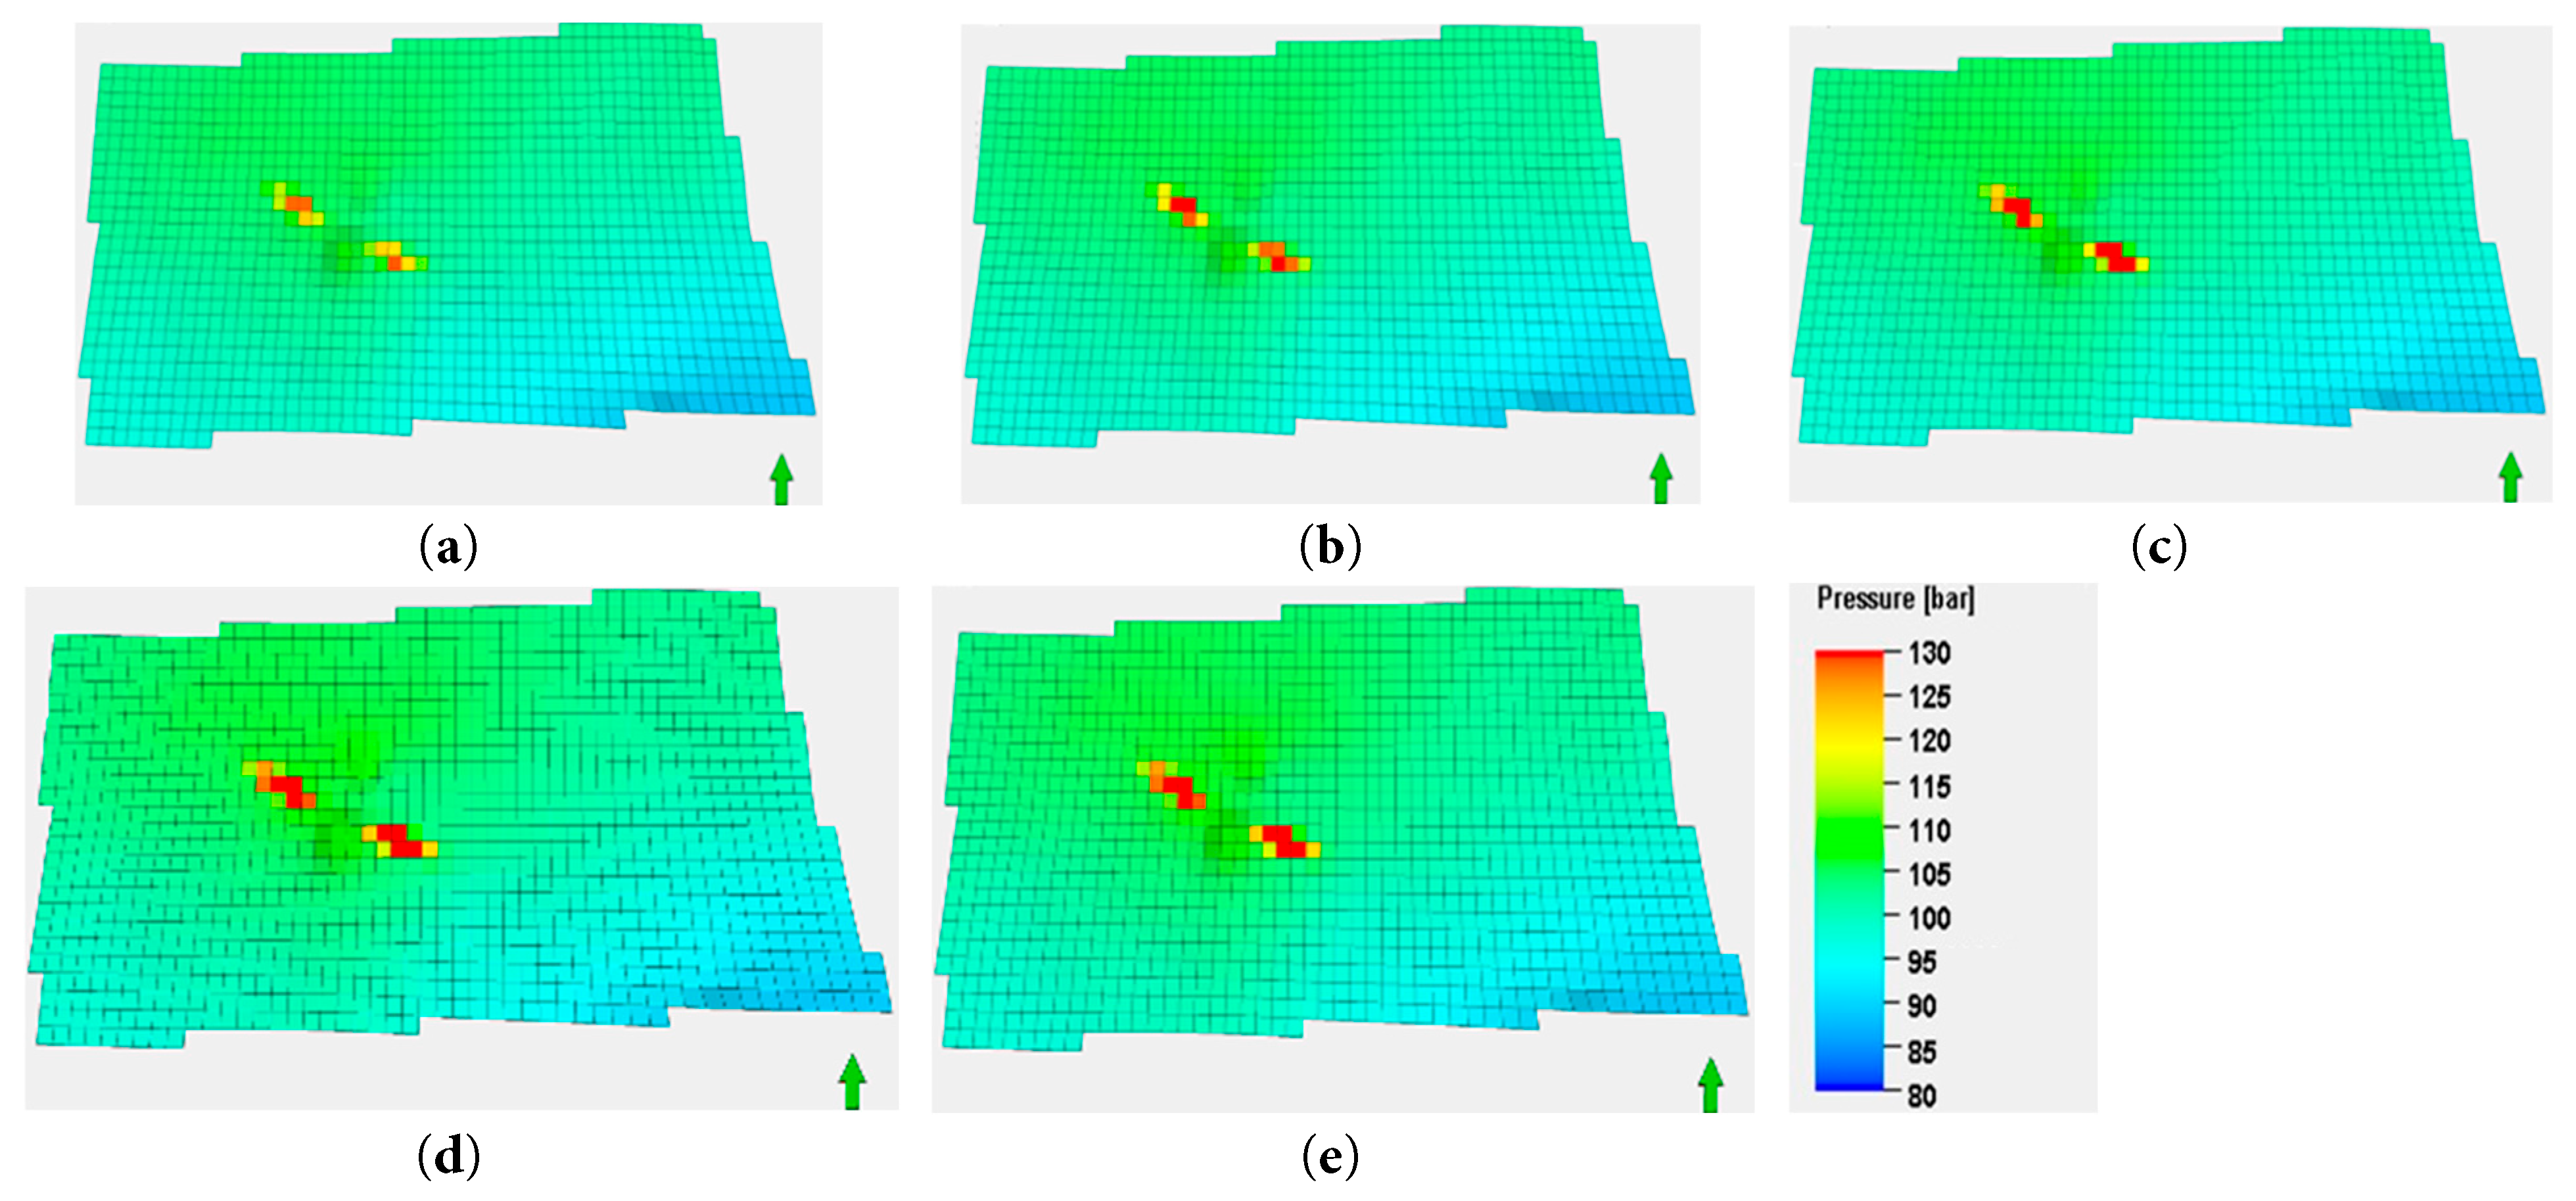
Figure 11: Formation pressure at the end of the 10th year for different injection rates: (a) 3 × 10⁴ m3/d; (b) 4 × 10⁴ m3/d; (c) 5 × 10⁴ m3/d; (d) 6 × 10⁴ m3/d; (e) 7 × 10⁴ m3/d.
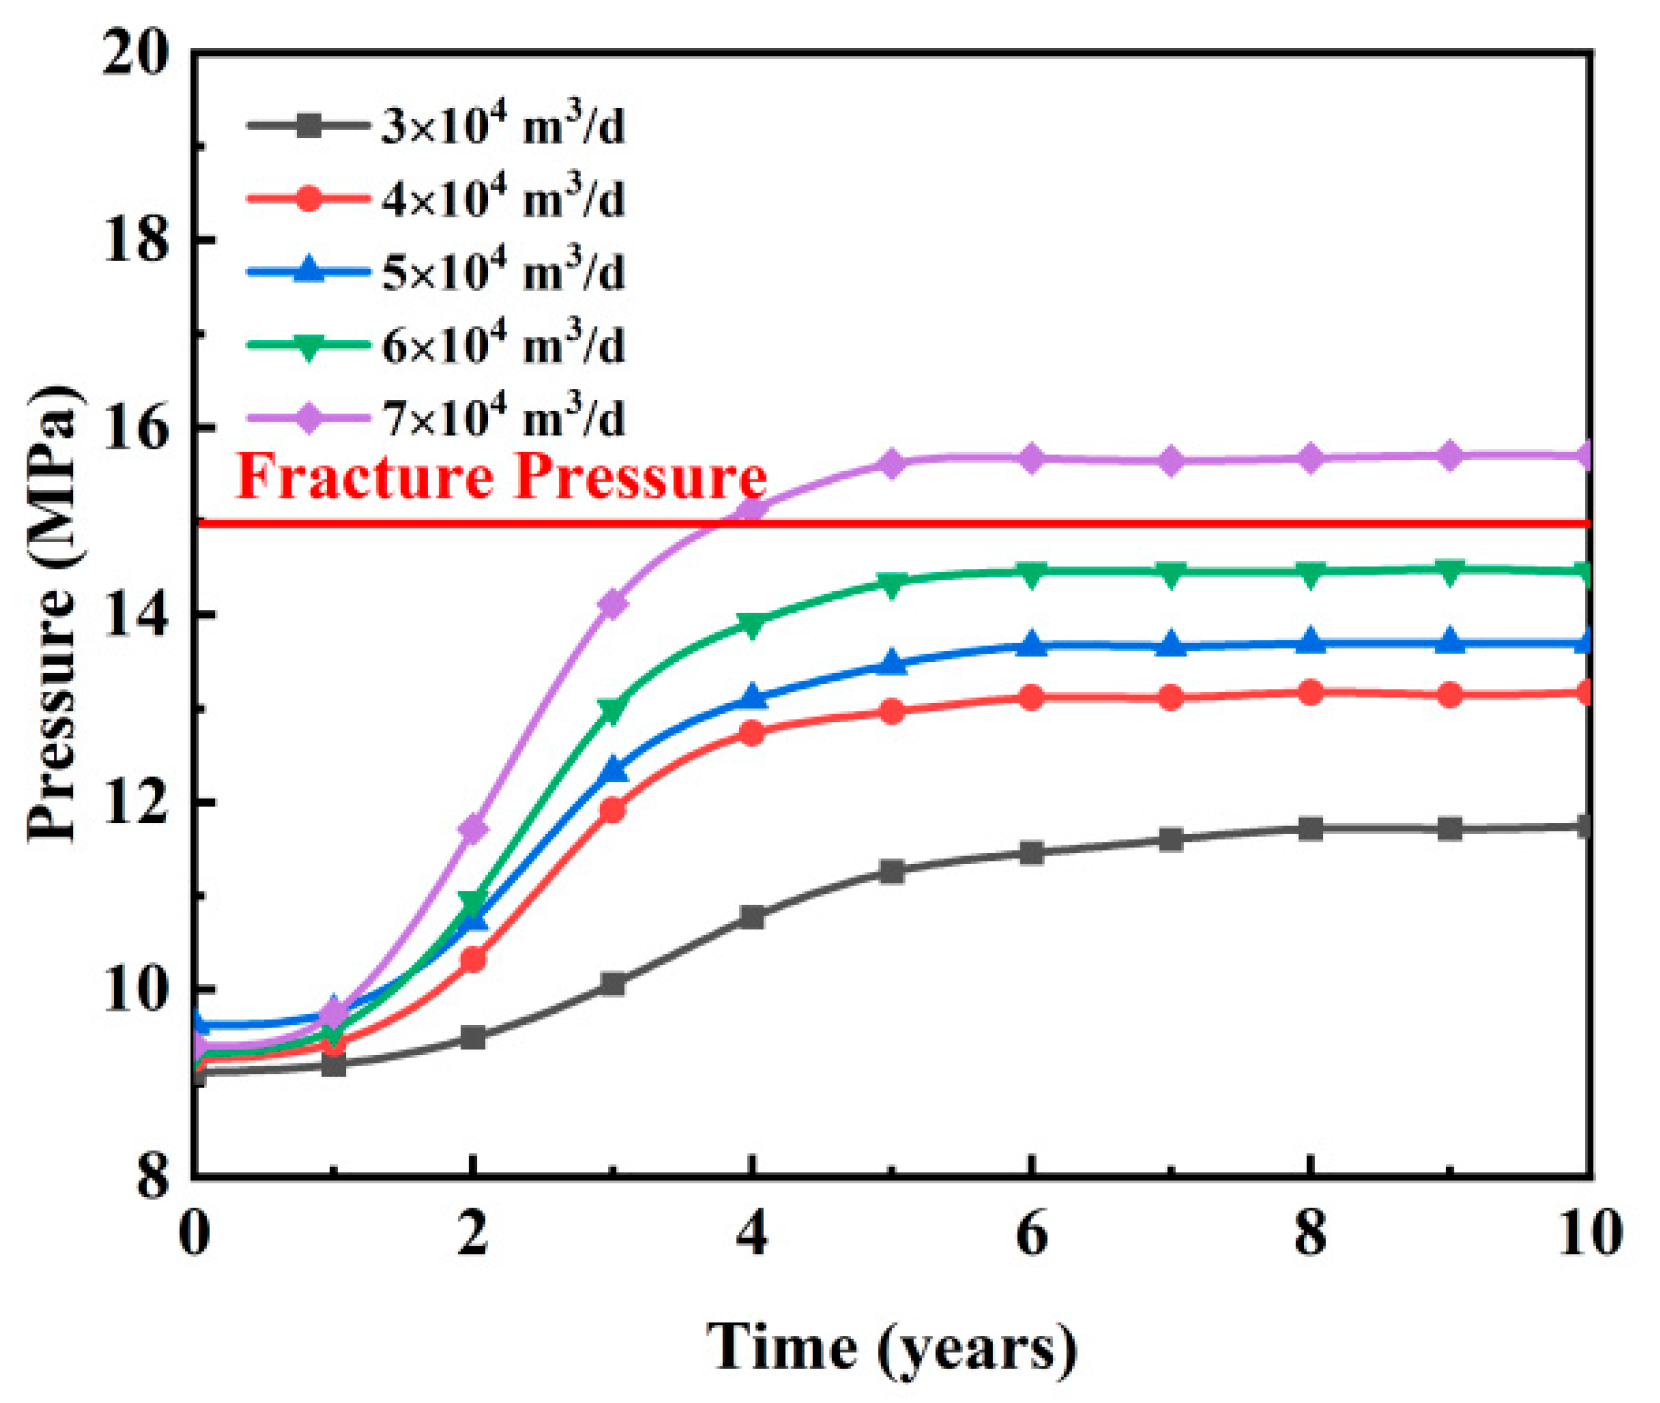
Figure 12: Maximum formation pressure for different injection rates.
The results show that as injection time increases, both the maximum and average formation pressures rise. Higher particle concentrations and injection rates significantly increase pressure, raising the risk of formation fracturing.
4.6 The Impact of Particle Plugging on the Diffusion Area of Produced Water
To investigate the influence of plugging effects on the diffusion area, a numerical simulation was conducted over a period of 10 years with an injection rate of 3 × 10⁴ m3/d. The simulation results, as shown in Fig. 13, compare the diffusion areas of produced water at year 10 under conditions without and with particle plugging considered. The findings reveal that without plugging, the diffusion area is limited due to interference between wells, resulting in a total diffusion area of 6.13 km2 after 10 years. In contrast, when plugging is taken into account, the diffusion area significantly increases due to reduced well interference, expanding to 6.4 km2 by the end of the decade.
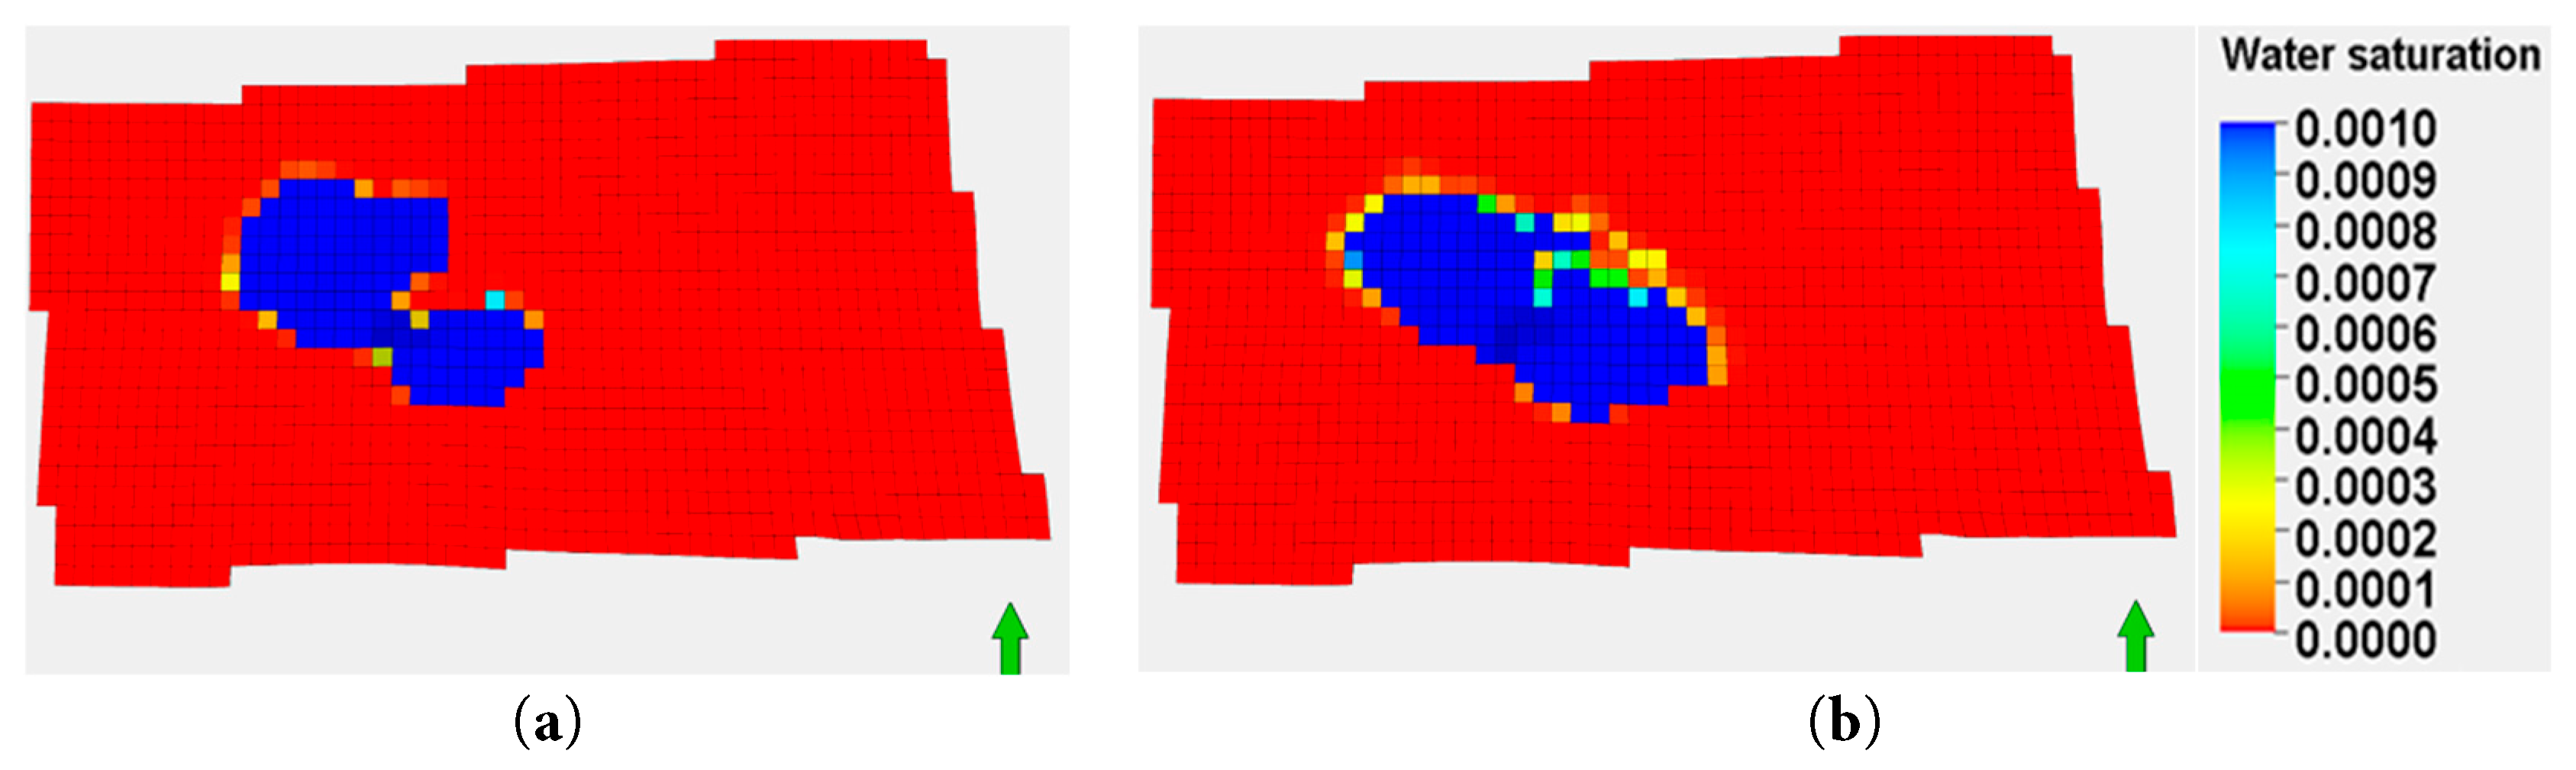
Figure 13: Produced water diffusion area at the end of the 10th year: (a) Without plugging consideration; (b) With plugging consideration.
4.7 The Impact of Injection Length on the Diffusion Area of Produced Water
Similar to Section 4.2, the model was designed with injection lengths of 750 m, 1300 m, and 2600 m. This setup aims to investigate the impact of injection length on the diffusion area of produced water. Injection was simulated at a rate of 3 × 10⁴ m3/d for 10 years. The results are shown in Fig. 14 and Fig. 15.
The analysis found that increasing injection length expanded the diffusion area. The diffusion shape also becomes more dispersed, as shown in Fig. 14. The diffusion distances in the length direction were 3455 m, 4135 m, and 7635 m, while those in the width direction decreased to 2024 m, 1548 m, and 1279 m, respectively. The diffusion areas of produced water were 6.99 km2, 6.4 km2, and 9.76 km2, as illustrated in Fig. 15. For the 750-m injection length, the diffusion area was relatively small and concentrated around the injection point. When the injection length increased to 1300 m, the diffusion area of produced water increased slightly, and the diffusion area began to disperse. Under the condition of a 2600-m injection length, the diffusion area significantly increased and exhibited a more dispersed distribution within the model area. These results indicate that injection length affects the diffusion area of produced water. Longer lengths facilitate more extensive diffusion.
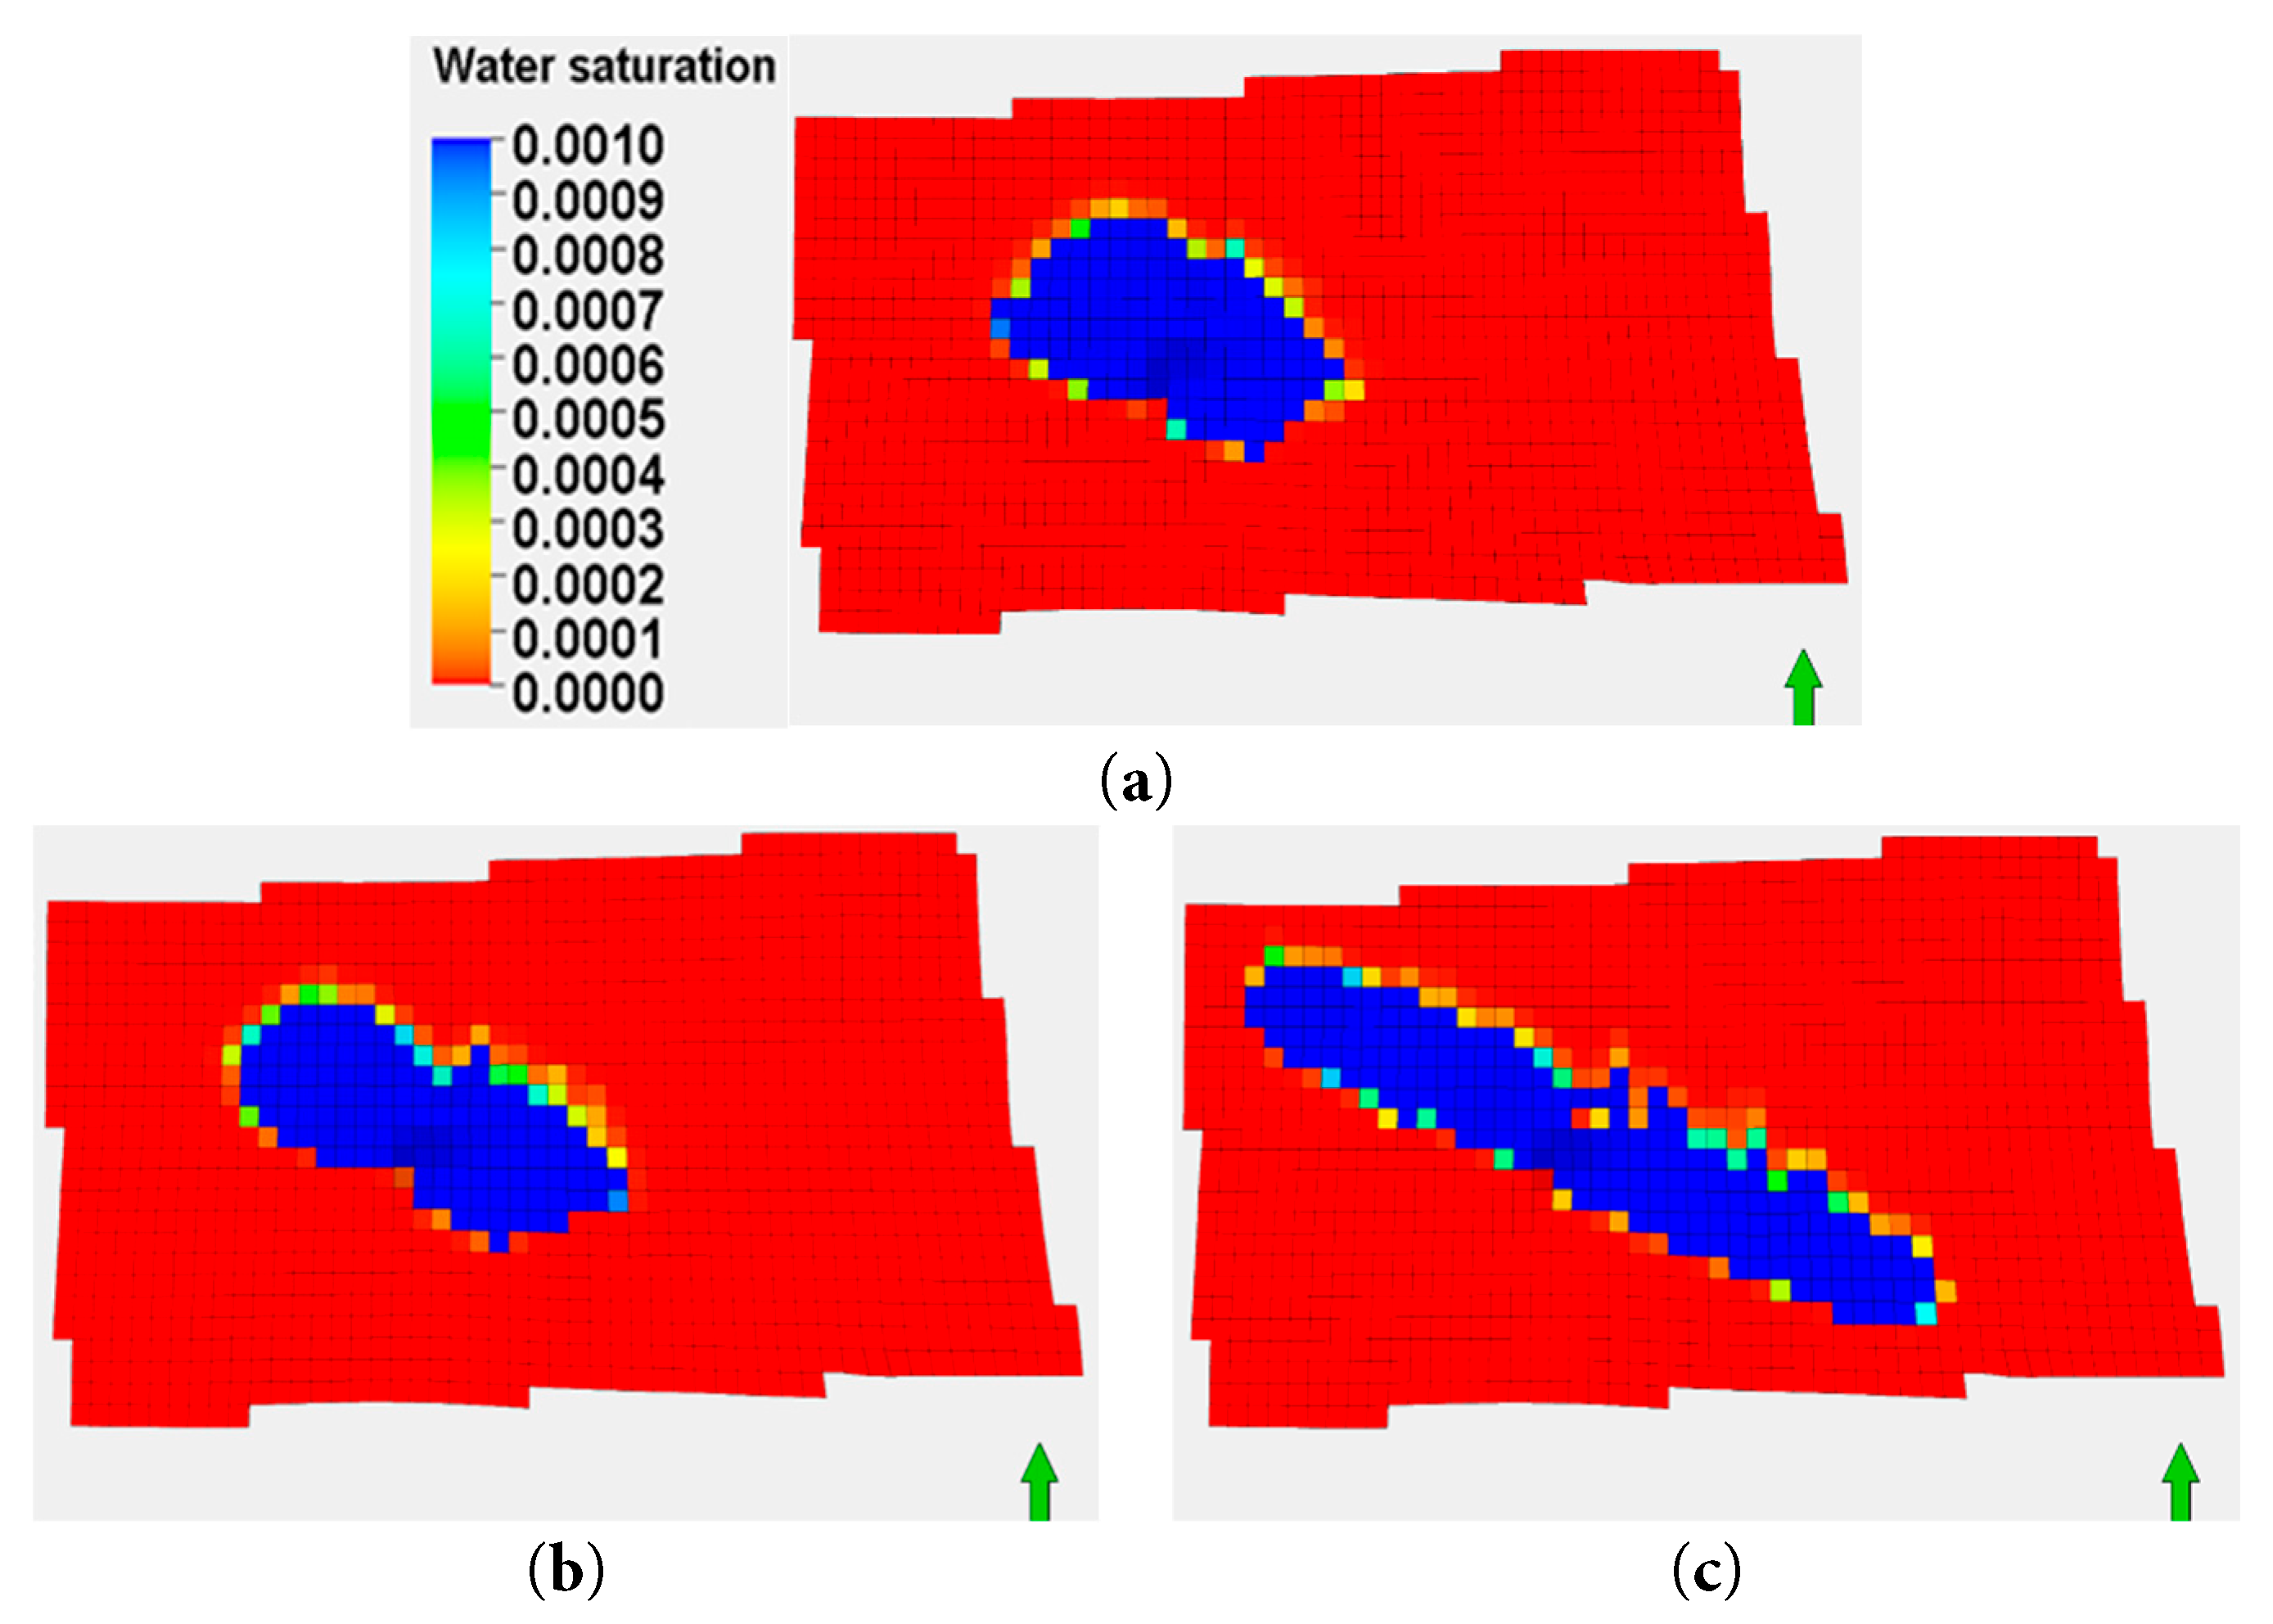
Figure 14: Produced water diffusion area at the end of the 10th year for different injection lengths: (a) L = 750 m; (b) L = 1300 m; (c) L = 2600 m.
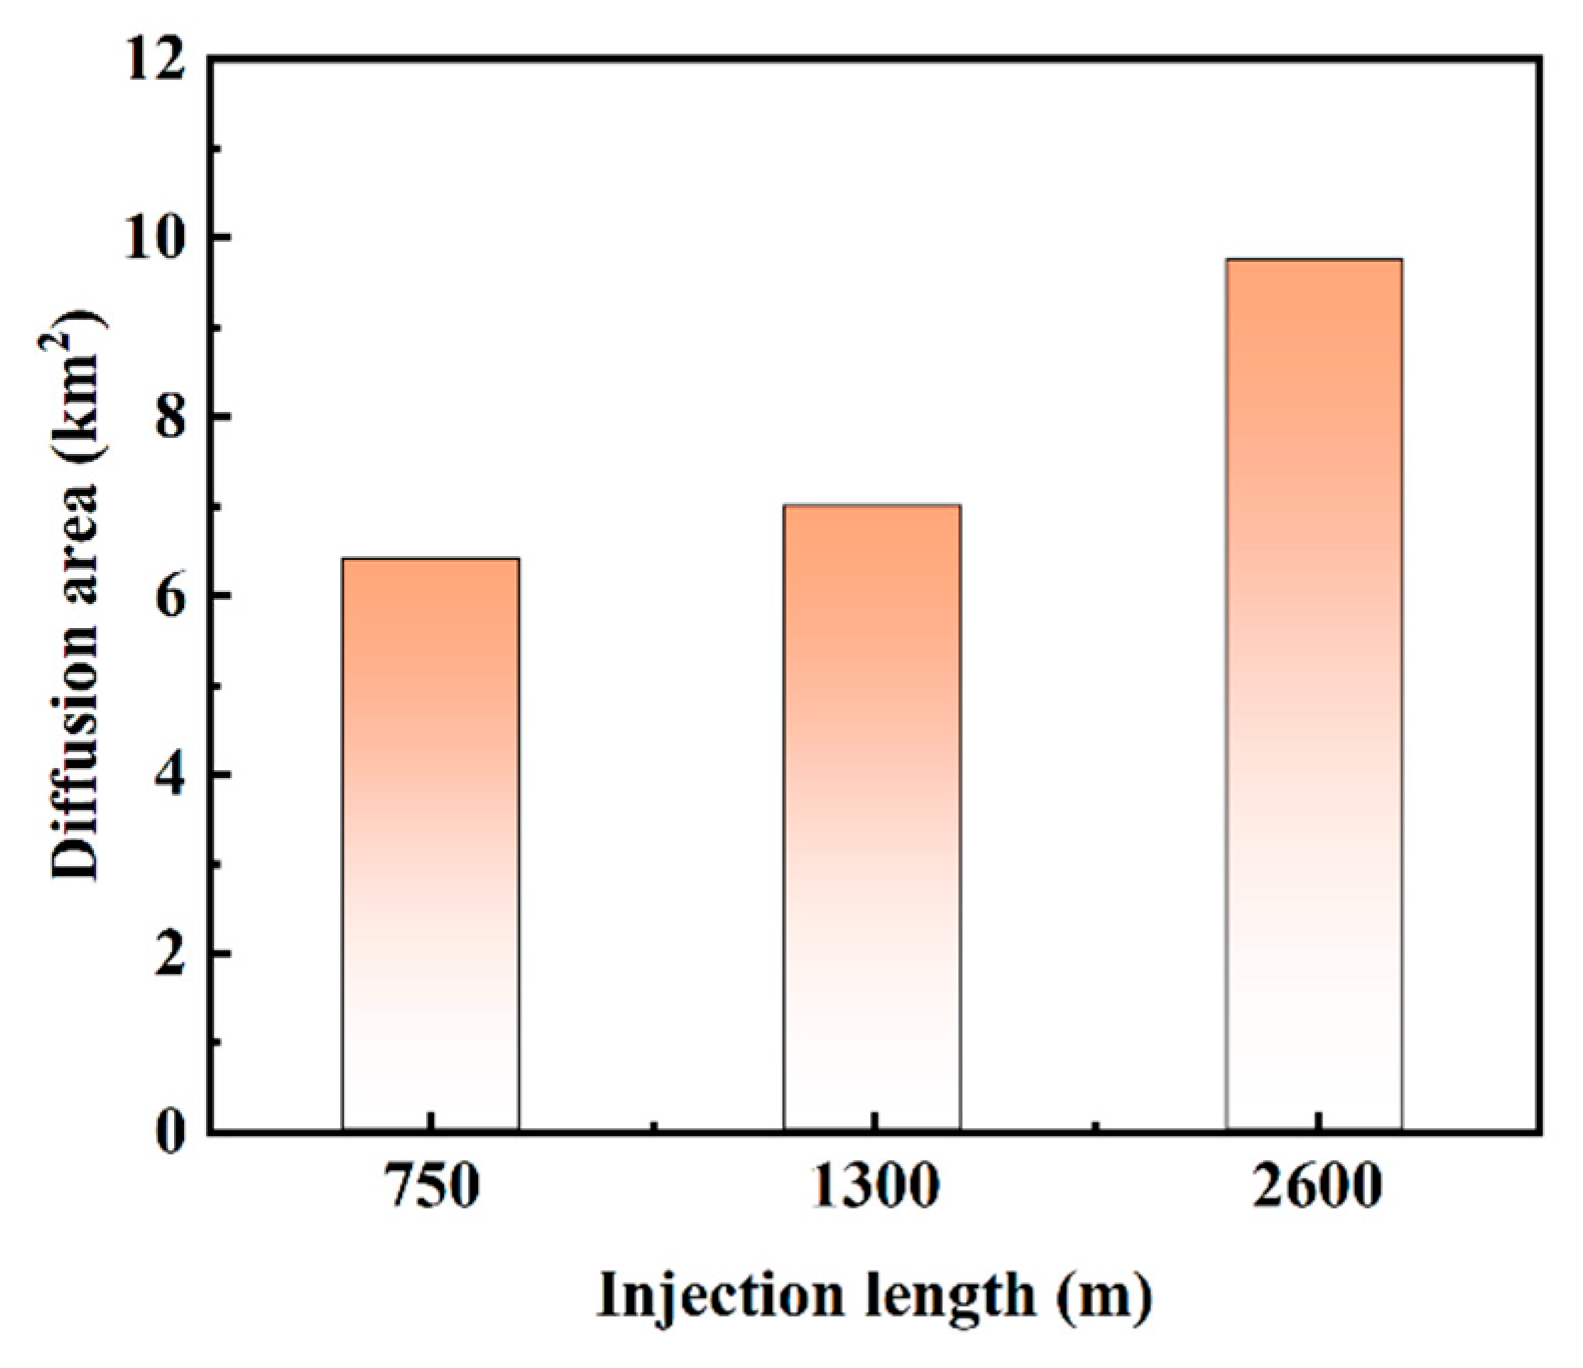
Figure 15: Diffusion area for different injection lengths.
4.8 The Impact of Particle Concentration on the Diffusion Area of Produced Water
Like Section 4.2, simulations were conducted at an injection rate of 30,000 m3/day. These explored the impact of different particle concentrations (2 mg/L, 5 mg/L, 10 mg/L, 30 mg/L, and 60 mg/L) on the diffusion area of produced water. The results are shown in Fig. 16 and Fig. 17.
As shown in Fig. 16, the diffusion area of produced water increases with higher particle concentrations. At lower particle concentrations (e.g., 2 mg/L and 5 mg/L), the diffusion area is smaller and more concentrated (indicated by blue regions). Conversely, higher concentrations (e.g., 30 mg/L and 60 mg/L) result in larger diffusion areas. As shown in Fig. 17, after 10 years of injection, the diffusion areas are 6.4 km2, 6.58 km2, 6.87 km2, 7.25 km2, and 7.85 km2, respectively. The diffusion area increases in both length and width directions, though the impact of particle concentration on diffusion area is relatively minor.
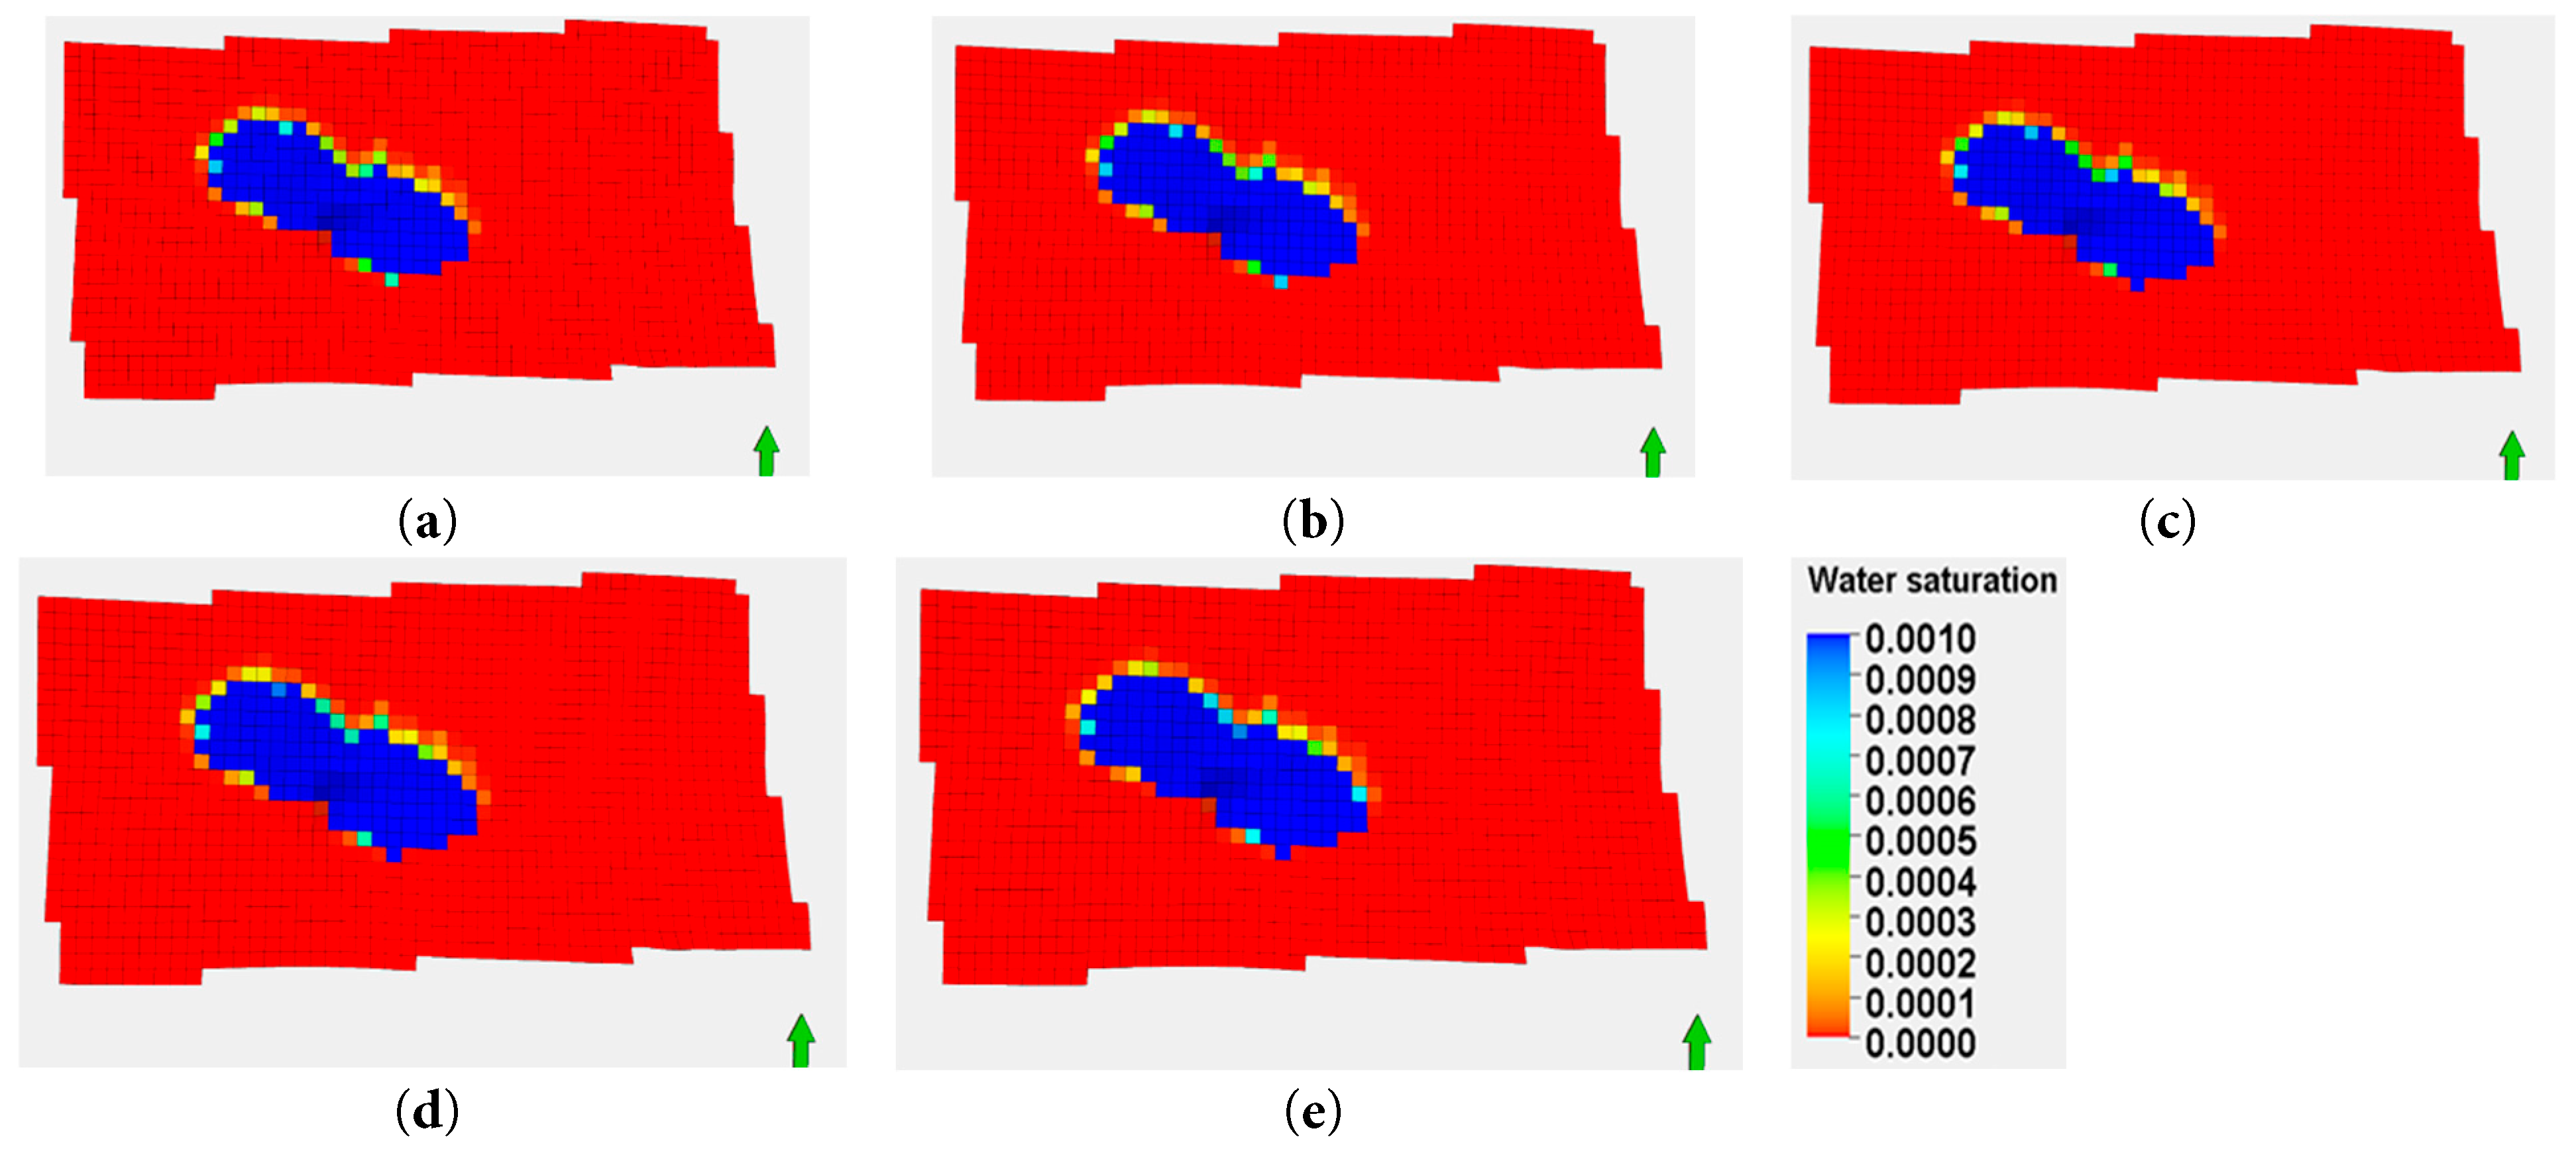
Figure 16: Produced water diffusion area at the end of the 10th year for different particle concentrations: (a) 2 mg/L; (b) 5 mg/L; (c) 10 mg/L; (d) 30 mg/L; (e) 60 mg/L.
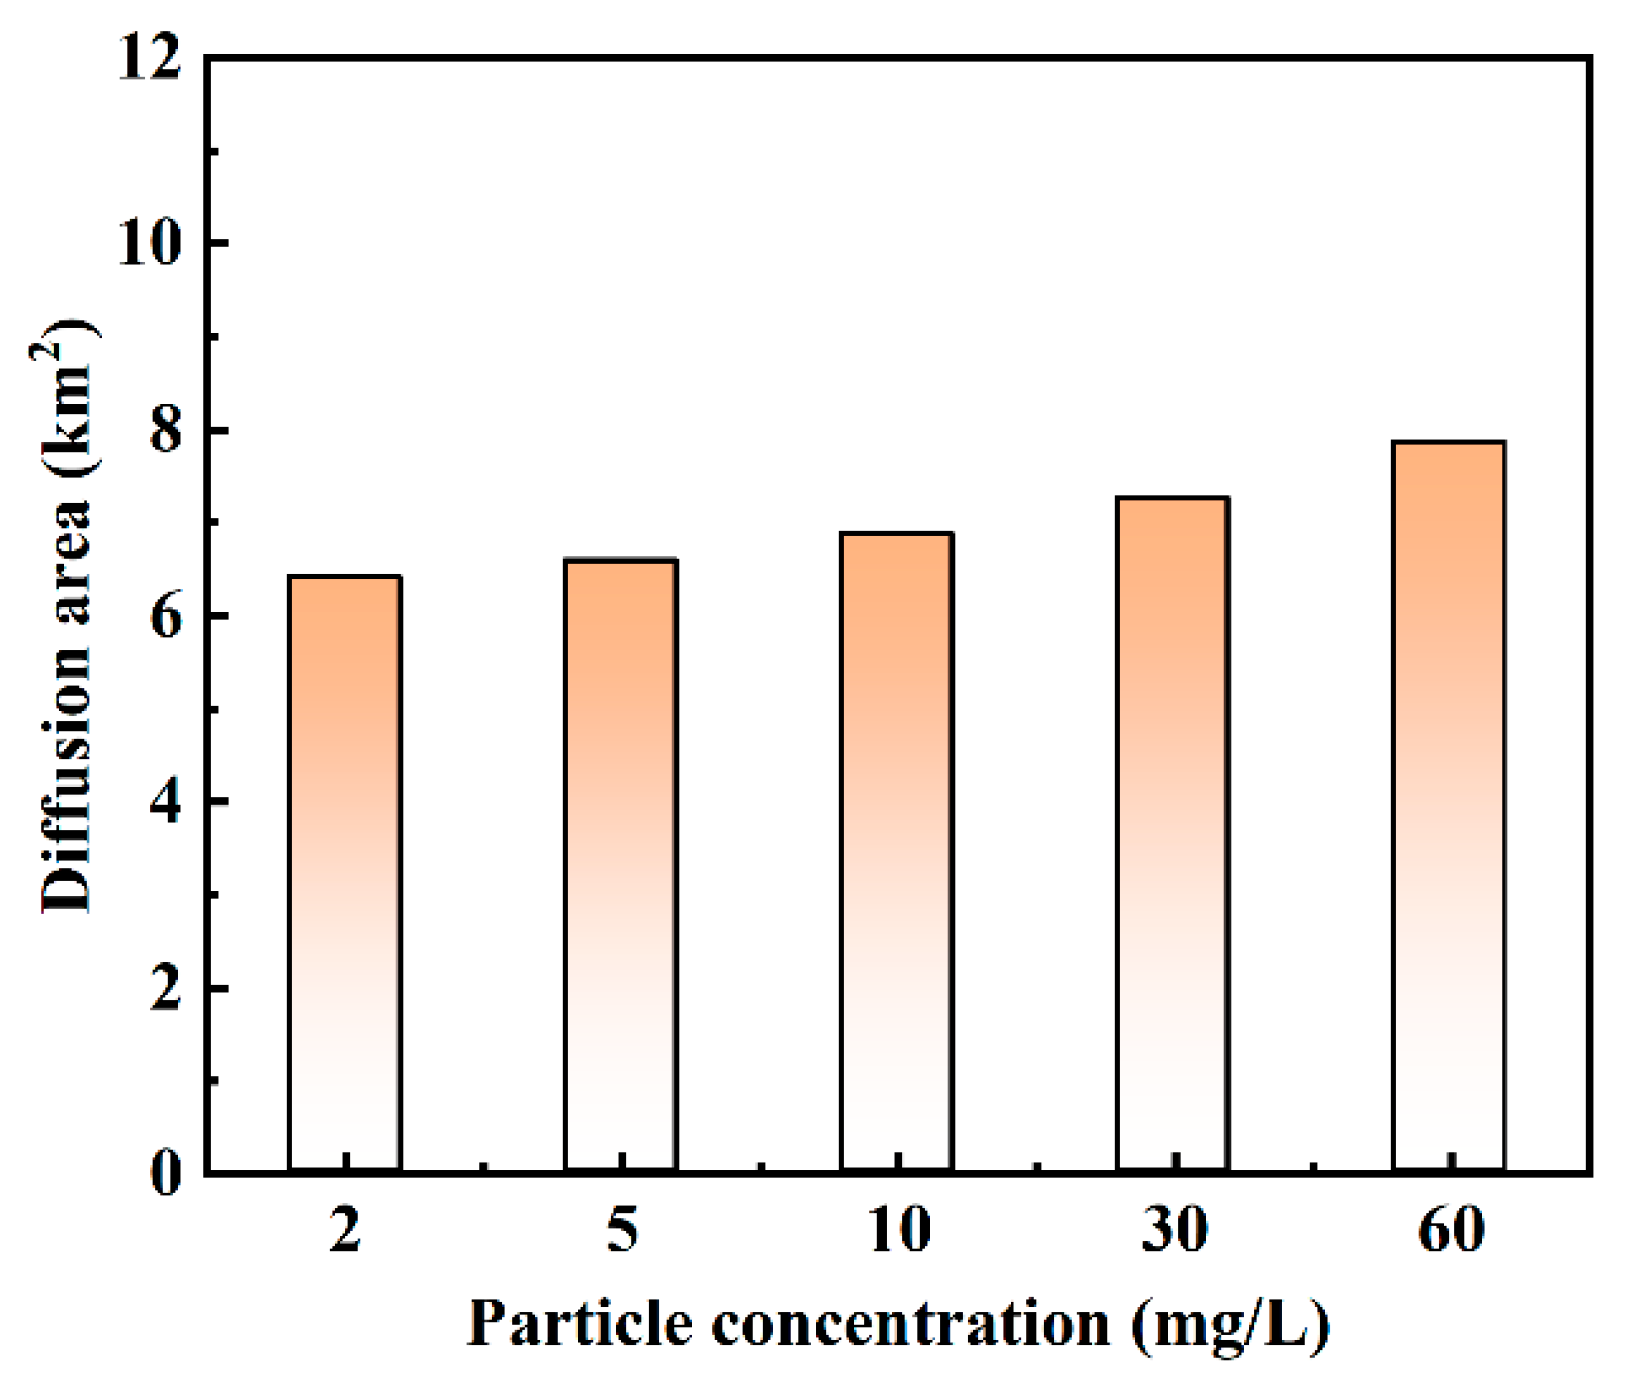
Figure 17: Diffusion area for different particle concentrations.
4.9 The Impact of Injection Rate on the Diffusion Area of Produced Water
Like Section 4.2, the impact of different injection rates on the diffusion area of produced water was investigated. The model was designed with a low particle concentration (2 mg/L) and injection rates of 30,000, 40,000, 50,000, 60,000, and 70,000 m3/day. The simulation results are shown in Fig. 18 and Fig. 19.
Fig. 18. show that higher injection rates lead to larger overlapping diffusion areas of produced water. Higher injection rates increase pressure and flow velocity. This enhances the diffusion of produced water in the formation. Additionally, the increase in injection rate may affect the permeability of the formation. As the injection rate rises, pores within the formation may become further compacted. They may also undergo minor structural changes. This allows produced water to flow more smoothly through the formation’s pores, thereby expanding its diffusion area. When the injection rate exceeds 50,000 m3/day, this phenomenon becomes particularly evident. As shown in Fig. 19, after 10 years of injection, the diffusion areas are 6.4 km2, 7.26 km2, 8.31 km2, 9.21 km2, and 9.85 km2, respectively. As shown in the figure, the diffusion area of produced water increases significantly with increasing injection rate. The diffusion area expands in both length and width directions. The injection rate has a substantial impact on the diffusion area.
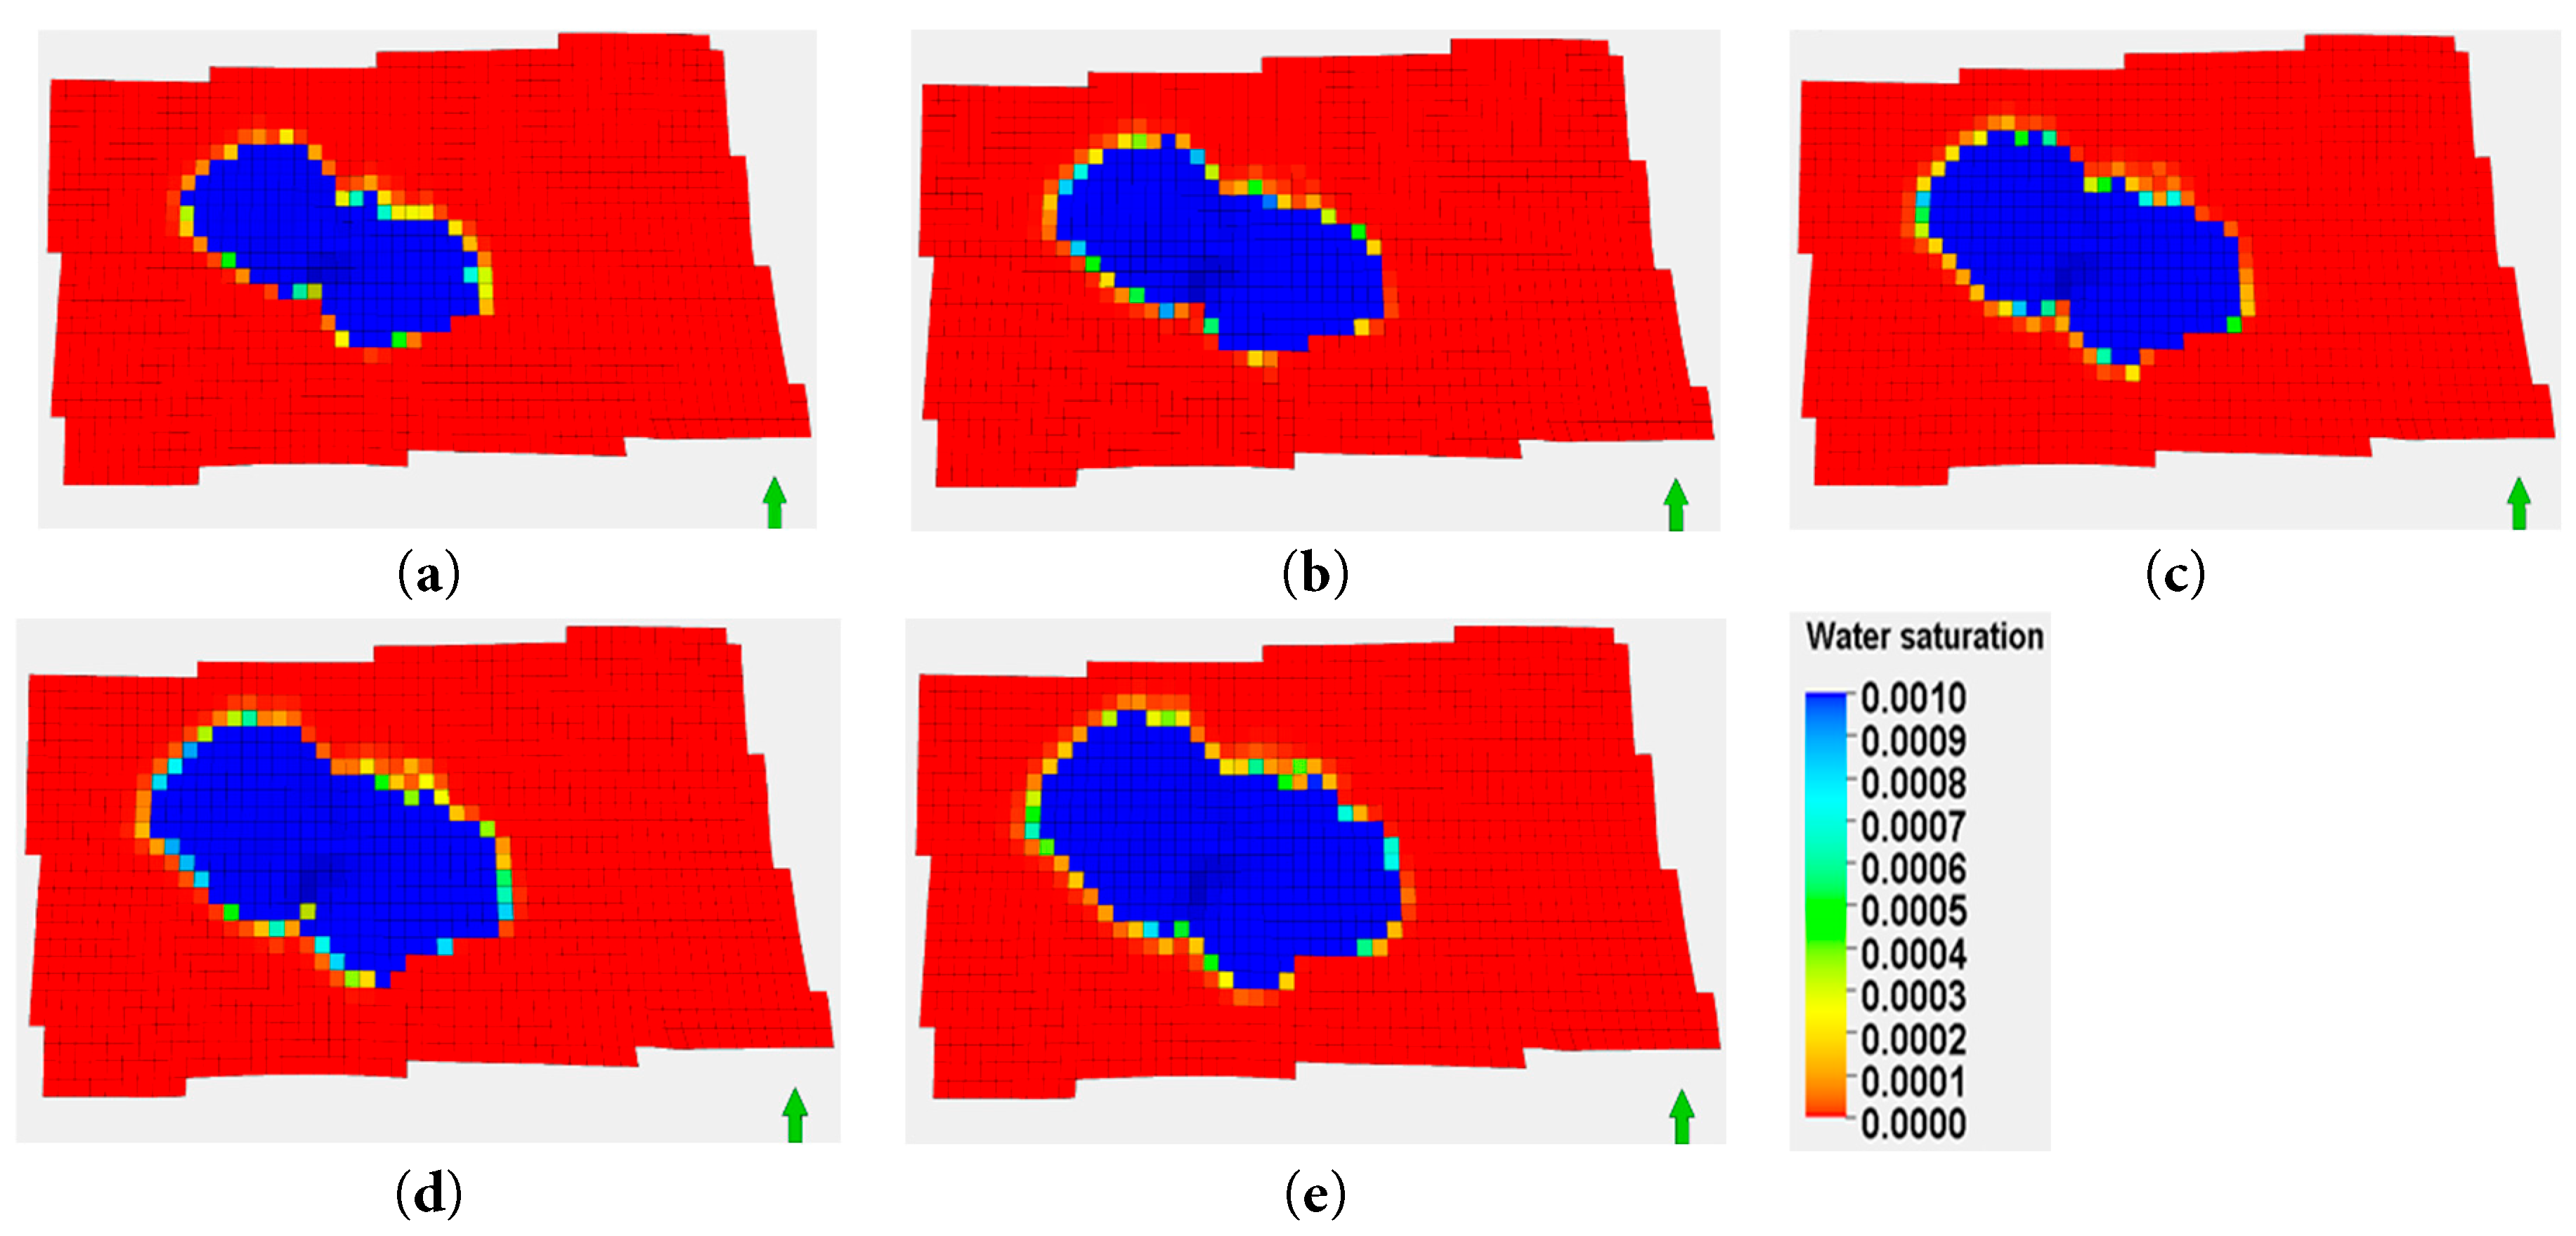
Figure 18: Produced water diffusion area at the end of the 10th year for different injection rates: (a) 3 × 10⁴ m3/d; (b) 4 × 10⁴ m3/d; (c) 5 × 10⁴ m3/d; (d) 6 × 10⁴ m3/d; (e) 7 × 10⁴ m3/d.
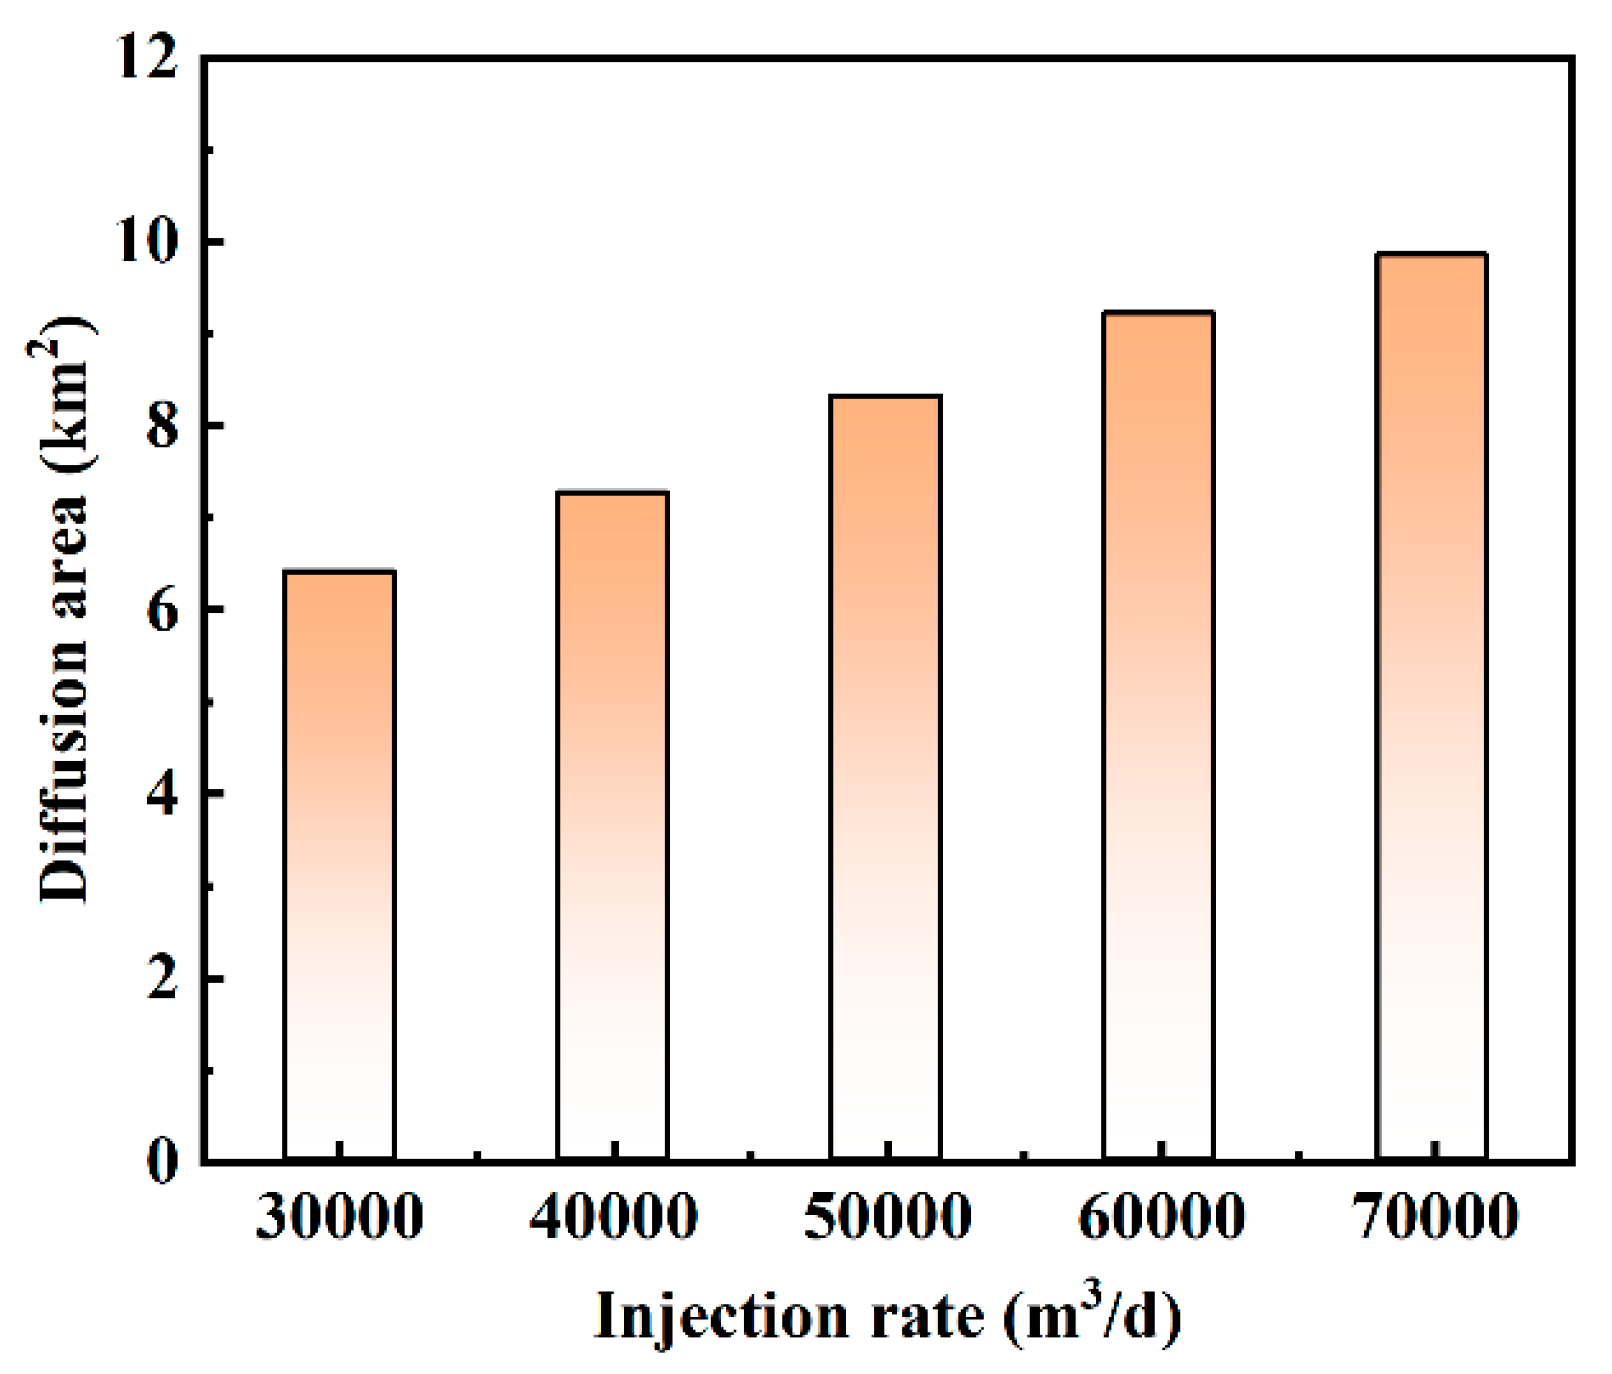
Figure 19: Diffusion area for different injection rates.
The novelty lies in deriving core-scale K-PV functions with real offshore produced water and embedding them in the first field-scale simulations. That quantifies how injection length, particle concentration and injection rate control 10-year pressure build-up and diffusion area. Operators can therefore import the correlations to predict injectivity loss without extra lab work, adopt the defined safe envelopes to avoid fracturing. Limitations are the single fixed solids concentration used here. Future studies will test variable concentrations/particle sizes, add heterogeneity and fractures, and couple geochemistry-geomechanics to capture salt precipitation and stress-dependent permeability.
Our study demonstrates that injection rate significantly impacts core permeability, with higher rates causing more substantial damage. Simulation results highlight that longer injection lengths mitigate pressure buildup and expand the diffusion area, reducing the risk of formation fracturing. Conversely, shorter lengths lead to rapid pressure increases. Higher particle concentrations in produced water exacerbate formation plugging and pressure accumulation, while lower concentrations minimize these issues. Elevated injection rates also increase formation pressure and shorten the time to reach fracture pressure. Based on our findings, we recommend maintaining lower injection rates, extending injection lengths, and limiting particle concentrations to optimize reinjection operations and minimize formation damage. These insights are crucial for enhancing the efficiency and sustainability of produced water reinjection in offshore oil fields.
Acknowledgement:
Funding Statement: This research is supported by the National Natural Science Foundation of China (No. 52204026).
Author Contributions: The authors confirm contribution to the paper as follows: Conceptualization, Fengshuang Du; data curation, Feng Cao; formal analysis, Feng Cao; investigation, Hao Guo; methodology, Mengna Cheng; project administration, Mengna Cheng; resources, Hao Guo and Feng Cao; software, Mengna Cheng, Hao Guo and Jie Gong; supervision, Fengshuang Du; validation, Mengna Cheng, Hao Guo and Jie Gong; visualization, Jie Gong; writing—original draft, Mengna Cheng; writing—review & editing, Fengshuang Du. All authors reviewed the results and approved the final version of the manuscript.
Availability of Data and Materials: The data that support the findings of this study are available from the corresponding author upon reasonable request.
Ethics Approval: Not applicable.
Conflicts of Interest: The authors declare no conflicts of interest to report regarding the present study.
References
1. Samylovskaya E , Makhovikov AB , Lutonin A , Medvedev D . Digital technologies in arctic oil and gas resources extraction: global trends and russian experience. Resources. 2022; 11( 3): 29. doi:10.3390/resources11030029. [Google Scholar] [CrossRef]
2. Burton ZF , Dafov LN . Salt diapir-driven recycling of gas hydrate. Geochem Geophys Geosyst. 2023; 24( 5): e2022GC010704. doi:10.1029/2022GC010704. [Google Scholar] [CrossRef]
3. Li X , Li J , Zhao P , Feng G , Zhao L . Overview of the progress in practice and experimental research in petroleum and natural gas engineering. Energies. 2025; 18( 11): 2738. doi:10.3390/en18112738. [Google Scholar] [CrossRef]
4. Rajbongshi A , Gogoi SB . A review on oilfield produced water and its treatment technologies. Pet Res. 2024; 9( 4): 640– 56. doi:10.1016/j.ptlrs.2024.06.003. [Google Scholar] [CrossRef]
5. Wu B , Lou M , Chen Z , Xu Y , Zhang L , Zhang L . Innovation and application of intelligent injection & production and remote monitoring technology in offshore oilfields. In: Proceedings of the International Field Exploration and Development Conference 2023; 2023 Sep 20–22; Wuhan, China. p. 280– 9. doi:10.1007/978-981-97-0260-2_24. [Google Scholar] [CrossRef]
6. Burton ZF , Kroeger KF , Hosford Scheirer A , Seol Y , Burgreen-Chan B , Graham SA . Tectonic uplift destabilizes subsea gas hydrate: a model example from Hikurangi margin, New Zealand. Geophys Res Lett. 2020; 47( 7): e2020GL087150. doi:10.1029/2020GL087150. [Google Scholar] [CrossRef]
7. Yang C , Chen Y , Li Y , Chen P . A data-driven approach for oil production prediction and water injection recommendation in well groups. Geoenergy Sci Eng. 2025; 247: 213682. doi:10.1016/j.geoen.2025.213682. [Google Scholar] [CrossRef]
8. Chen J , Wang W , Sun W , Chen J , Wang Q , Li T . Oilfield sustainable development: An operation optimization study for the water-flooding pipeline network system based on data fusion. J Clean Prod. 2025; 518: 145866. doi:10.1016/j.jclepro.2025.145866. [Google Scholar] [CrossRef]
9. Abbasi P , Madani M , Abbasi S . Treatment of water disposal injection process by oilfield chemicals: maintaining injectivity and environmental effects. Pet Res. 2025; 1– 8. doi:10.1016/j.ptlrs.2025.04.007. [Google Scholar] [CrossRef]
10. Gao X , Peng J , Han H , Zhou Y , Li L , Feng Y . Experimental study and application of particulate transport injury in the reservoir of Xiangguosi Gas Storage Reservoir. Drill Prod Technol. 2020; 43( 03): 46– 59. (In Chinese). [Google Scholar]
11. Nwonodi RI , Dosunmu A , Okoro EE . A novel method for preventing technical challenge during drilled cuttings/produced water reinjection: an injection rate management tool. Geoenergy Sci Eng. 2023; 229: 212149. doi:10.1016/j.geoen.2023.212149. [Google Scholar] [CrossRef]
12. Nwonodi RI , Dosunmu A , Okoro EE . The radial distribution of natural fracture Density around the wellbore during drilled cuttings/produced water reinjection and wellbore construction. Geoenergy Sci Eng. 2024; 234: 212613. doi:10.1016/j.geoen.2023.212613. [Google Scholar] [CrossRef]
13. Xing H , Zheng P , Yue P , Mu Y . Reinjection of produced water into formations in unconventional gas reservoirs. Energies. 2025; 18( 12): 3149. doi:10.3390/en18123149. [Google Scholar] [CrossRef]
14. Feng Q , Xu S , Wang S . Apparent permeability model for shale oil with multiple mechanisms. J Pet Sci Eng. 2019; 175: 814– 27. doi:10.1016/j.petrol.2019.01.038. [Google Scholar] [CrossRef]
15. Liu C , Shen C , Liu J , Liu S , Pang W . Controlling factors of particle migration in loose sandstone and performance characteristics in oilfield. Xinjiang Oil Gas. 2023; 19( 01): 16– 22. (In Chinese). [Google Scholar]
16. Byrne MT , Waggoner SM . Fines migration in a high temperature gas reservoir-laboratory simulation and implications for completion design. In: Proceedings of the 8th European Formation Damage Conference; 2009 May 27–29; Scheveningen, The Netherlands. doi:10.2118/121897-MS. [Google Scholar] [CrossRef]
17. Kalantariasl A , Farajzadeh R , You Z , Bedrikovetsky P . Nonuniform external filter cake in long injection wells. Ind Eng Chem Res. 2015; 54( 11): 3051– 61. doi:10.1021/ie504936q. [Google Scholar] [CrossRef]
18. Jiale F , Yawei H , Hui C . Study on the mechanism of particle migration in loose sandstone reservoirs. J Chongqing Inst Sci Technol. 2023; 25( 05): 33– 9. (In Chinese). [Google Scholar]
19. Oliveira MA , Vaz AS , Siqueira FD , Yang Y , You Z , Bedrikovetsky P . Slow migration of mobilised fines during flow in reservoir rocks: laboratory study. J Pet Sci Eng. 2014; 122: 534– 41. doi:10.1016/j.petrol.2014.08.019. [Google Scholar] [CrossRef]
20. He Z , Li B , Zhang G , Wang H , Chen Y , Sun Y . Influencing factors of reservoir properties during shallow gas exploitation in Baiyun depression, South China Sea. Sci Technol Eng. 2024; 24( 18): 7630– 8. (In Chinese). [Google Scholar]
21. Goniva C , Kloss C , Deen NG , Kuipers JA , Pirker S . Influence of rolling friction on single spout fluidized bed simulation. Particuology. 2012; 10( 5): 582– 91. doi:10.1016/j.partic.2012.05.002. [Google Scholar] [CrossRef]
22. Chu K , Wang B , Xu D , Chen Y , Yu A . CFD-DEM simulation of the gas-solid flow in a cyclone separator. Powder Technol. 2016; 304: 229– 40. (In Chinese). [Google Scholar]
23. Cihan A , Petrusak R , Bhuvankar P , Alumbaugh D , Trautz R , Birkholzer JT . Permeability decline by clay fines migration around a low salinity fluid injection well. Groundwater. 2022; 60( 1): 87– 98. doi:10.1111/gwat.13127. [Google Scholar] [CrossRef]
24. Moghadasi J , Müller-Steinhagen H , Jamialahmadi M , Sharif A . Theoretical and experimental study of particle movement and deposition in porous media during water injection. J Pet Sci Eng. 2004; 43( 3–4): 163– 81. doi:10.1016/j.petrol.2004.01.005. [Google Scholar] [CrossRef]
25. Agbangla GC , Climent E , Bacchin P . Experimental investigation of pore clogging by microparticles: Evidence for a critical flux density of particle yielding arches and deposits. Sep Purif Technol. 2012; 101: 42– 8. doi:10.1016/j.seppur.2012.09.011. [Google Scholar] [CrossRef]
26. Jung J , Cao SC , Shin YH , Al-Raoush RI , Alshibli K , Choi JW . A microfluidic pore model to study the migration of fine particles in single-phase and multi-phase flows in porous media. Microsyst Technol. 2018; 24( 2): 1071– 80. doi:10.1007/s00542-017-3462-1. [Google Scholar] [CrossRef]
27. Medhi BJ , Agrawal V , Singh A . Experimental investigation of particle migration in suspension flow through bifurcating microchannels. AIChE J. 2018; 64( 6): 2293– 307. doi:10.1002/aic.16084. [Google Scholar] [CrossRef]
28. Boccardo G , Marchisio DL , Sethi R . Microscale simulation of particle deposition in porous media. Colloid Interface Sci. 2014; 417: 227– 37. doi:10.1016/j.jcis.2013.11.007. [Google Scholar] [CrossRef]
29. Li Q , Prigiobbe V . Numerical simulations of the migration of fine particles through porous media. Transp Porous Media. 2018; 122( 3): 745– 59. doi:10.1007/s11242-018-1024-3. [Google Scholar] [CrossRef]
30. Zhou K , Hou J , Sun Q , Guo L , Bing S , Du Q , et al. A study on particle suspension flow and permeability impairment in porous media using LBM–DEM–IMB simulation method. Transp Porous Media. 2018; 124( 3): 681– 98. doi:10.1007/s11242-018-1089-z. [Google Scholar] [CrossRef]
31. Elrahmani A , Al-Raoush RI , Abugazia H , Seers T . Pore-scale simulation of fine particles migration in porous media using coupled CFD-DEM. Powder Technol. 2022; 398: 117130. doi:10.1016/j.powtec.2022.117130. [Google Scholar] [CrossRef]
32. Su J , Chai G , Wang L , Cao W , Gu Z , Chen C , et al. Pore-scale direct numerical simulation of particle transport in porous media. Chem Eng Sci. 2019; 74: 613– 27. doi:10.1016/j.ces.2019.01.033. [Google Scholar] [CrossRef]
33. Feng Q , Cha L , Dai C , Zhao G , Wang S . Effect of particle size and concentration on the migration behavior in porous media by coupling computational fluid dynamics and discrete element method. Powder Technol. 2020; 360: 704– 14. doi:10.1016/j.powtec.2019.10.011. [Google Scholar] [CrossRef]
34. Wang S , Zhang N , Tang Z , Zou X , Sun Q , Liu W . Time-dependent model for two-phase flow in ultra-high water-cut reservoirs: time-varying permeability and relative permeability. Pet Sci. 2024; 21( 4): 2536– 53. doi:10.1016/j.petsci.2024.03.025. [Google Scholar] [CrossRef]
35. Davies A , Cowliff L , Simmons MD . A method for fine-scale vertical heterogeneity quantification from well data and its application to siliciclastic reservoirs of the UKCS. Mar Pet Geol. 2023; 149: 106077. doi:10.1016/j.marpetgeo.2022.106077. [Google Scholar] [CrossRef]
36. Burton ZF , McHargue TR , Graham SA . Global Eocene-Oligocene unconformity in clastic sedimentary basins. Earth-Sci Rev. 2024; 258: 104912. doi:10.1016/j.earscirev.2024.104912. [Google Scholar] [CrossRef]
Cite This Article
 Copyright © 2025 The Author(s). Published by Tech Science Press.
This work is licensed under a Creative Commons Attribution 4.0 International License , which permits unrestricted use, distribution, and reproduction in any medium, provided the original work is properly cited.
 Downloads
 Citation Tools