
 Submit a Paper
 Propose a Special lssue
 Open Access
ARTICLE

Numerical Investigation of Carbon Capture, Utilization, and Storage–Enhanced Gas Recovery
1 Petro China Southwest Oil and Gas Field Exploration and Development Research Institute, Chengdu, 610041, China
2 College of Energy, Chengdu University of Technology, Chengdu, 610059, China
* Corresponding Author: Shaofeng Ning. Email:
(This article belongs to the Special Issue: Multiphase Fluid Flow Behaviors in Oil, Gas, Water, and Solid Systems during CCUS Processes in Hydrocarbon Reservoirs)
Fluid Dynamics & Materials Processing 2025, 21(12), 2997-3009. https://doi.org/10.32604/fdmp.2025.074456
Received 11 October 2025; Accepted 16 December 2025; Issue published 31 December 2025
 View Full Text
 Download PDF
Abstract
Balancing CO2 emission reduction with enhanced gas recovery in carbonate reservoirs remains a key challenge in subsurface energy engineering. This study focuses on the Maokou Formation gas reservoir in the Wolonghe Gas Field, Sichuan Basin, and employs a mechanistic model integrated with numerical simulations that couple CO2–water–rock geochemical interactions to systematically explore the principal engineering and chemical factors governing Carbon Capture, Utilization, and Storage–Enhanced Gas Recovery (CCUS–EGR). The analysis reveals that both the injection–production ratio and gas injection rate exhibit optimal ranges. Maximum gas output under single-parameter variation occurs at an injection–production ratio of 0.7 and an injection rate of 130,000 m3/d, while coordinated optimization of both parameters is essential to achieve the highest production enhancement. Excessively high injection–production ratios, however, may induce gas channeling and reduce the ultimate recovery factor. Chemical composition of the injected gas also strongly influences recovery. In the heterogeneous carbonate reservoir considered, a CO2–N2 mixed gas mitigates gravity segregation due to its lower density, expanding sweep efficiency and improving overall gas recovery compared to pure CO2 injection. CO2–water–rock reactions further modify reservoir properties. Near the injection well, acidic dissolution enhances porosity, whereas near the production well, a dynamic interplay of ion migration, pressure–temperature variations, and secondary mineral precipitation produces complex porosity evolution. Initial precipitation reduces porosity, while subsequent acidic dissolution partially restores it, creating a heterogeneous and time-dependent porosity profile.Keywords
Against the backdrop of global climate change and carbon reduction, CCUS has become one of the core technologies for controlling greenhouse gas emissions [1,2,3]. The CCUS-EGR technology, which combines CCUS with Enhanced Gas Recovery (EGR), involves injecting CO2 into a gas reservoir. This not only enables long-term geological storage but also effectively displaces residual natural gas, thereby increasing the gas reservoir’s recovery factor, possessing both significant environmental and economic value [4,5]. Carbonate gas reservoirs, due to their vast reserves and wide distribution, are ideal target reservoirs for implementing CCUS-EGR [6,7]. However, these reservoirs typically have high heterogeneity, with well-developed pores and fractures, which can easily form preferential flow paths. These geological features pose significant challenges to the sweep efficiency and displacement effect of CO2, potentially leading to premature CO2 breakthrough, gas channeling, and other issues that directly impact storage safety and production enhancement [8,9].
Furthermore, when CO2 is injected into a carbonate reservoir, it undergoes a series of complex physical and chemical interactions (such as dissolution-precipitation) with formation water and rock minerals [10,11,12]. These geochemical reactions will alter the reservoir’s pore structure and fluid flow characteristics, which in turn have a profound impact on the migration, storage, and displacement effects of CO2 [13,14]. Therefore, an in-depth study of the coupled mechanism of multiphase fluid flow and geochemical reactions during the CCUS-EGR process in carbonate gas reservoirs and identifying the key factors affecting its performance are crucial for optimizing injection schemes, enhancing CO2 storage efficiency, and increasing natural gas recovery [15].
The Sichuan Basin is an important natural gas production area in China, with particularly abundant carbonate gas reservoir resources [16]. Among them, the Maokou Formation gas reservoir in the Wolonghe Gas Field has entered the middle to late stages of development, facing issues such as declining production and low reserve utilization [6,17]. It has great potential for implementing CCUS-EGR. Although domestic and international scholars have conducted extensive research on CO2 displacement mechanisms, reservoir heterogeneity, and geochemical reactions [18,19,20], for low-permeability carbonate gas reservoirs like the Wolonghe Gas Field, how to synergistically optimize well network deployment and production/injection parameters while considering the long-term coupled effect of CO2–water–rock to maximize EGR effect and CO2 storage remains a critical scientific and engineering problem to be solved. To solve this synergistic optimization problem, traditional sensitivity analysis is useful for revealing key mechanisms, while more advanced optimization techniques, such as Response Surface Methodology (RSM) and Artificial Neural Networks (ANN), are also being explored to find a global optimum for such complex, multi-parameter problems [21].
Given this, this study establishes a detailed three-dimensional numerical model coupled with CO2–water–rock geochemical reactions based on the actual geological data of the Maokou Formation gas reservoir in the Wolonghe Gas Field. The aim is to systematically evaluate the influence of injection and production parameters (injection-production ratio, injection rate, CO2 purity, etc.) on the CCUS-EGR effect through a multi-scenario numerical simulation comparative analysis, to reveal the intrinsic influence mechanisms of reservoir property evolution and geochemical reactions on CO2 migration and displacement efficiency, and to clarify the sensitivity ranking of each influencing factor. The research results can provide a theoretical guide for the optimized design and efficient implementation of CCUS-EGR projects in similar carbonate gas reservoirs.
The Wolonghe Gas Field is geographically located at the junction of Dianjiang County and Changshou District in Chongqing City, and tectonically, it is situated in the central part of the ancient gentle uplift and steep fault-fold belt of the eastern Sichuan Basin. The formation is a gentle anticline structure, with a steep west and a gentle east, and is sandwiched between the Mingyue Gorge and Goujiachang high-steep anticline belts. The geological structure of the eastern Sichuan area is mainly modified by the Caledonian and Indosinian-Yanshanian movements. The reservoir is deeply buried, and local faults are well-developed, forming complex oil and gas accumulation and migration channels, which provide favorable geological conditions for natural gas accumulation. Fig. 1 shows the geographical location of the gas field.
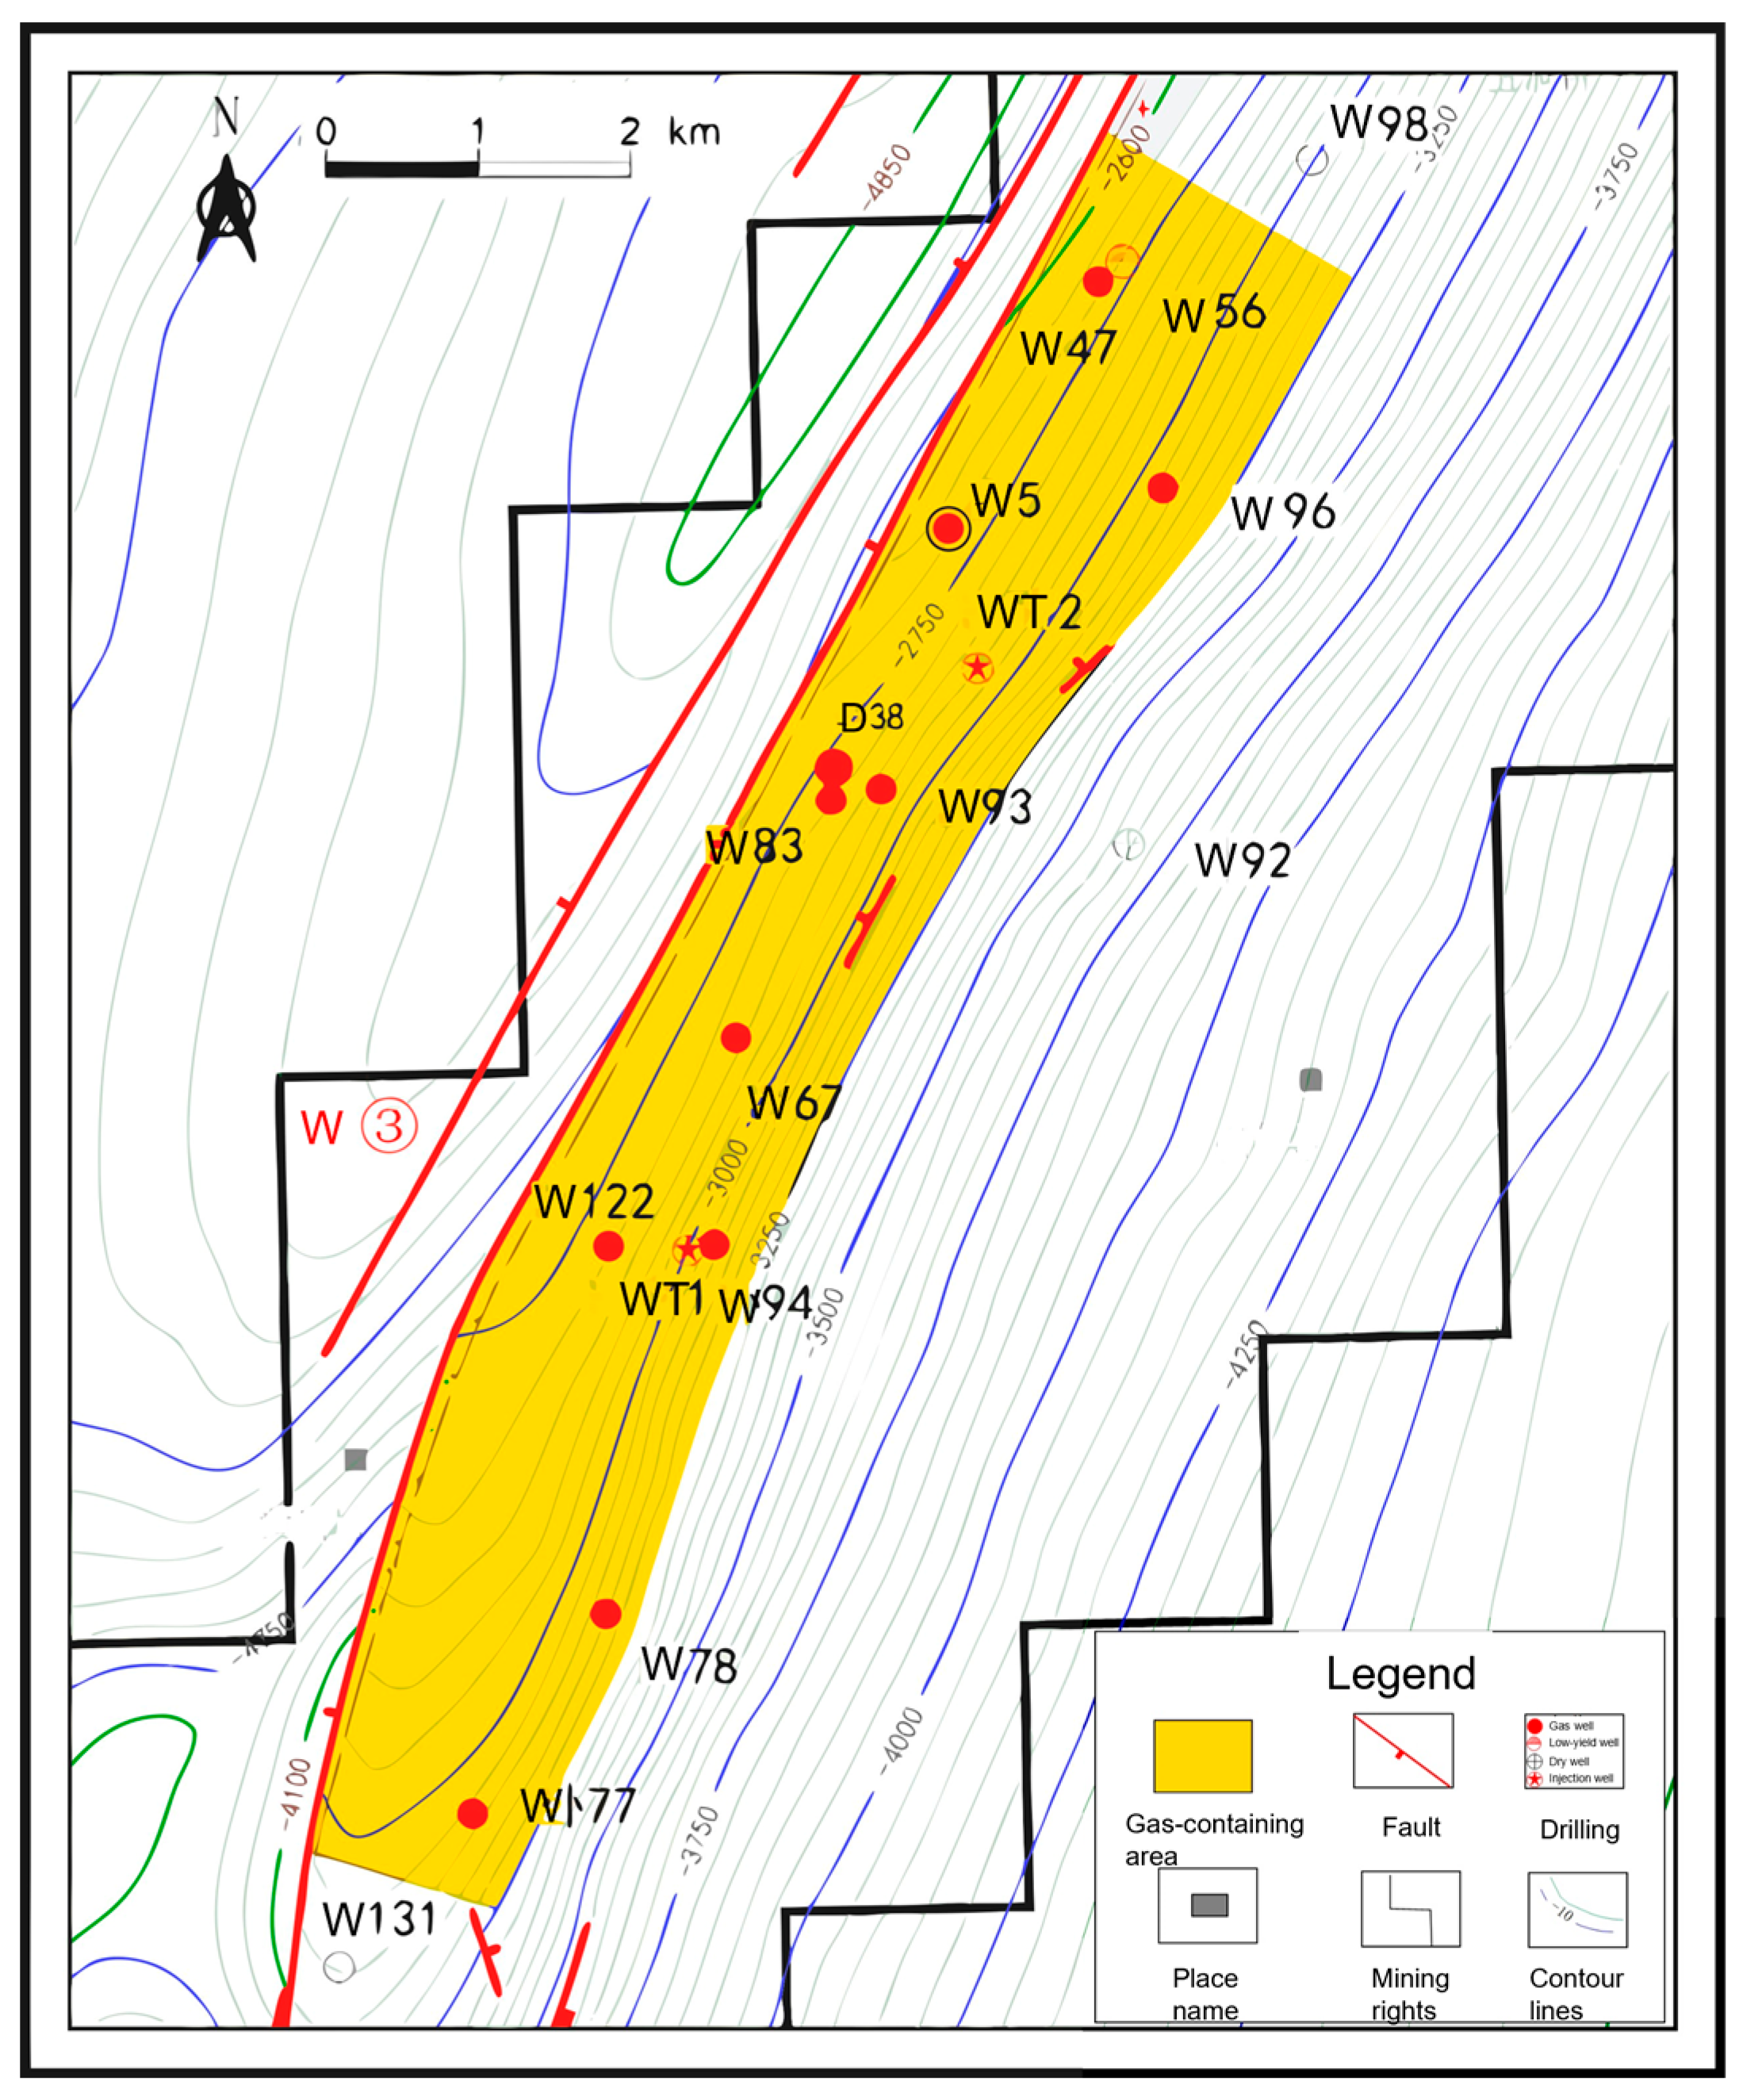
Figure 1: Schematic diagram of the Wolonghe Gas Field block.
The main formation of this study, the Lower Permian Maokou Formation, is a set of carbonate reservoirs. In the Wolonghe area, the Maosiduan is absent, and part of the Maosanduan remains. The lithology is mainly gray to dark gray argillaceous limestone, with local interbeds of dolomite. The Maokou Formation’s reservoir type is fracture-vuggy, belonging to an autogenous-autostored gas system, and is one of the main reservoirs of the Lower Permian. The gas reservoir is characterized by abundant hydrocarbon source rocks, well-developed reservoirs, good cap rocks, and preservation conditions. The vertical configuration of source, reservoir, and cap is good, and all accumulation elements are well-matched, providing excellent conditions for gas accumulation.
The average reservoir porosity is mainly concentrated in the range of 4%~9%, and the permeability is often less than 1.0 mD, consistent with the low-porosity and low-permeability characteristics of a tight gas reservoir. The methane content is 94.18%~97.88%, carbon dioxide content is 1.13%~4.03%, nitrogen content is 0.18%~0.38%, and hydrogen sulfide content is 0.11%~1.34%, with an average of 0.41%. It is a dry gas with low to medium H2S and CO2 content.
2.2 CO2–Water–Rock Reaction System
During the simulation of CO2 geological storage, the injected CO2 can undergo a series of water-rock reactions with formation water under high-pressure conditions, affecting mineral dissolution/precipitation behavior and ion migration characteristics, thereby having a potential impact on the reservoir pore structure and storage stability. To convert porosity variation into permeability distribution, a power-law relationship is used to estimate permeability as a function of porosity [22]:
To more realistically reflect the geochemical environment of the wellbore area and the reaction path after CO2 injection, the model introduced typical water chemical ion compositions and the dissolution reactions of representative carbonate minerals. To maintain focus on the main CO2–water–rock interactions and ensure computational efficiency, we omitted the reactions related to H2S. The water type of the formation water is CaCl2 type, and the specific ion composition is shown in Table 1.
Table 1: Formation Water Ion Composition.
| Ion Type | Content (mg/L) |
|---|---|
| Sodium ion | 9848 |
| Potassium ion | 131 |
| Calcium ion | 286 |
| Magnesium ion | 23 |
| Chloride | 15,599 |
| Sulfate | 157 |
| Carbonate | 0 |
| Bicarbonate | 575 |
| TDS | 26,619 |
To simulate the acidification and carbonate dissolution process caused by CO2 injection, the reaction pathways are shown in Table 2:
Table 2: Water-rock reactions.
| No. | Reaction Equation | Activation Energy (J/mol) | Reaction Rate (1/s) | Secondary Minerals |
|---|---|---|---|---|
| 1 | CO2 (g) + H2O (l) ↔ H2CO3 (aq) | / | / | / |
| 2 | H2CO3 (aq) ↔ H+ (aq) + HCO3− (aq) | / | / | / |
| 3 | HCO3− ↔ H+ (aq) + CO32− (aq) | / | / | / |
| 4 | CaCO3 (s) + H+ (aq) → Ca2+ (aq) + HCO3− (aq) | 23,500 | −5.81 | completely dissolved |
| 5 | CaMg(CO3)2 (s) + 2H+ (aq) → Ca2+ (aq) + Mg2+ (aq) + 2HCO3− (aq) | 52,200 | −7.53 | completely dissolved |
3.1 Numerical Simulation Model Establishment
Based on logging, geological, and other data, a three-dimensional gas reservoir numerical model was established. To accurately characterize the CCUS-EGR process, the simulation employs a generalized compositional formulation that couples multiphase fluid flow with geochemical reactions. Following the fully coupled geochemical EOS formulation described by Nghiem et al. [23], the component mass conservation equation incorporating the reaction rate is expressed as:
The total grid size is 100 × 30 × 10, with a total of 30,000 effective grid cells.
The horizontal grid size is set to 50 m × 50 m, and the vertical direction is divided into 10 layers, with a single layer thickness of about 9 m and a total thickness of about 90 m. The overall model size is 5000 m × 1500 m × 90 m.
To eliminate the influence of grid size on the simulation results, a quantitative mesh sensitivity analysis was conducted. Three grid systems with varying densities were established: Coarse (50 × 15 × 10), Current (100 × 30 × 10), and Fine (200 × 60 × 10). The cumulative gas production was selected as the representative physical variable for comparison. As summarized in Table 3, the results show that the relative deviation in gas production between the Current scheme and the Fine scheme is only 0.2%. However, the computation time for the Fine scheme increases drastically to 3966.9 s, compared to 355.8 s for the Current scheme. Therefore, considering both computational accuracy and efficiency, the Current grid dimension (100 × 30 × 10) was determined to be the optimal choice for this study.
Table 3: Mesh sensitivity analysis.
| Grid Scheme | Grid Dimension (X × Y × Z) | Total Grid Cells | Cumulative Gas Production (108 m³) | Relative Deviation (%) | Computation Time (s) |
|---|---|---|---|---|---|
| Coarse | 50 × 15 × 10 | 7500 | 3.39 | 2.3 | 113.6 |
| Current | 100 × 30 × 10 | 30,000 | 3.47 | / | 355.8 |
| Fine | 200 × 60 × 10 | 120,000 | 3.48 | 0.2 | 3966.9 |
The initial depth of the reservoir model is 3447 m, and the formation temperature is set to 85.0°C. The natural gas is mainly methane, with a content as high as 96.57%. Other components include nitrogen (0.23%), carbon dioxide (2.11%), ethane (0.65%), propane (0.28%), and trace amounts of hydrogen sulfide. The overall gas composition is stable. These parameters are derived from the logging and fluid analysis results of the Wolonghe Gas Field. The average reservoir porosity is 5%, the horizontal permeability is 1.5 mD, and the vertical permeability is 0.15 mD. These data are representative average values of logging and core data for analyzing the target reservoir section.
The model is set with three production wells (P-1, P-2, P-3), two injection Wells (I-1, I-2), the production rate of P-1 and P-2 at 40,000 m3/d, and the production rate of P-3 at 60,000 m3/d. The distribution of well locations is shown in Fig. 2. The simulation time is from 1985 to 2025 for depressurization production. The period from 2025 to 2045 is the predictive simulation stage, during which the initial gas injection rate of the injection well is 50,000 m3/d. The original gas in place is about 3.54 × 10⁹ m3, the cumulative gas production accounts for 59.93% of the original gas in place, and the final remaining reserves are about 1.43 × 10⁹ m3. The relative permeability of gas and water is set as shown in Fig. 3.
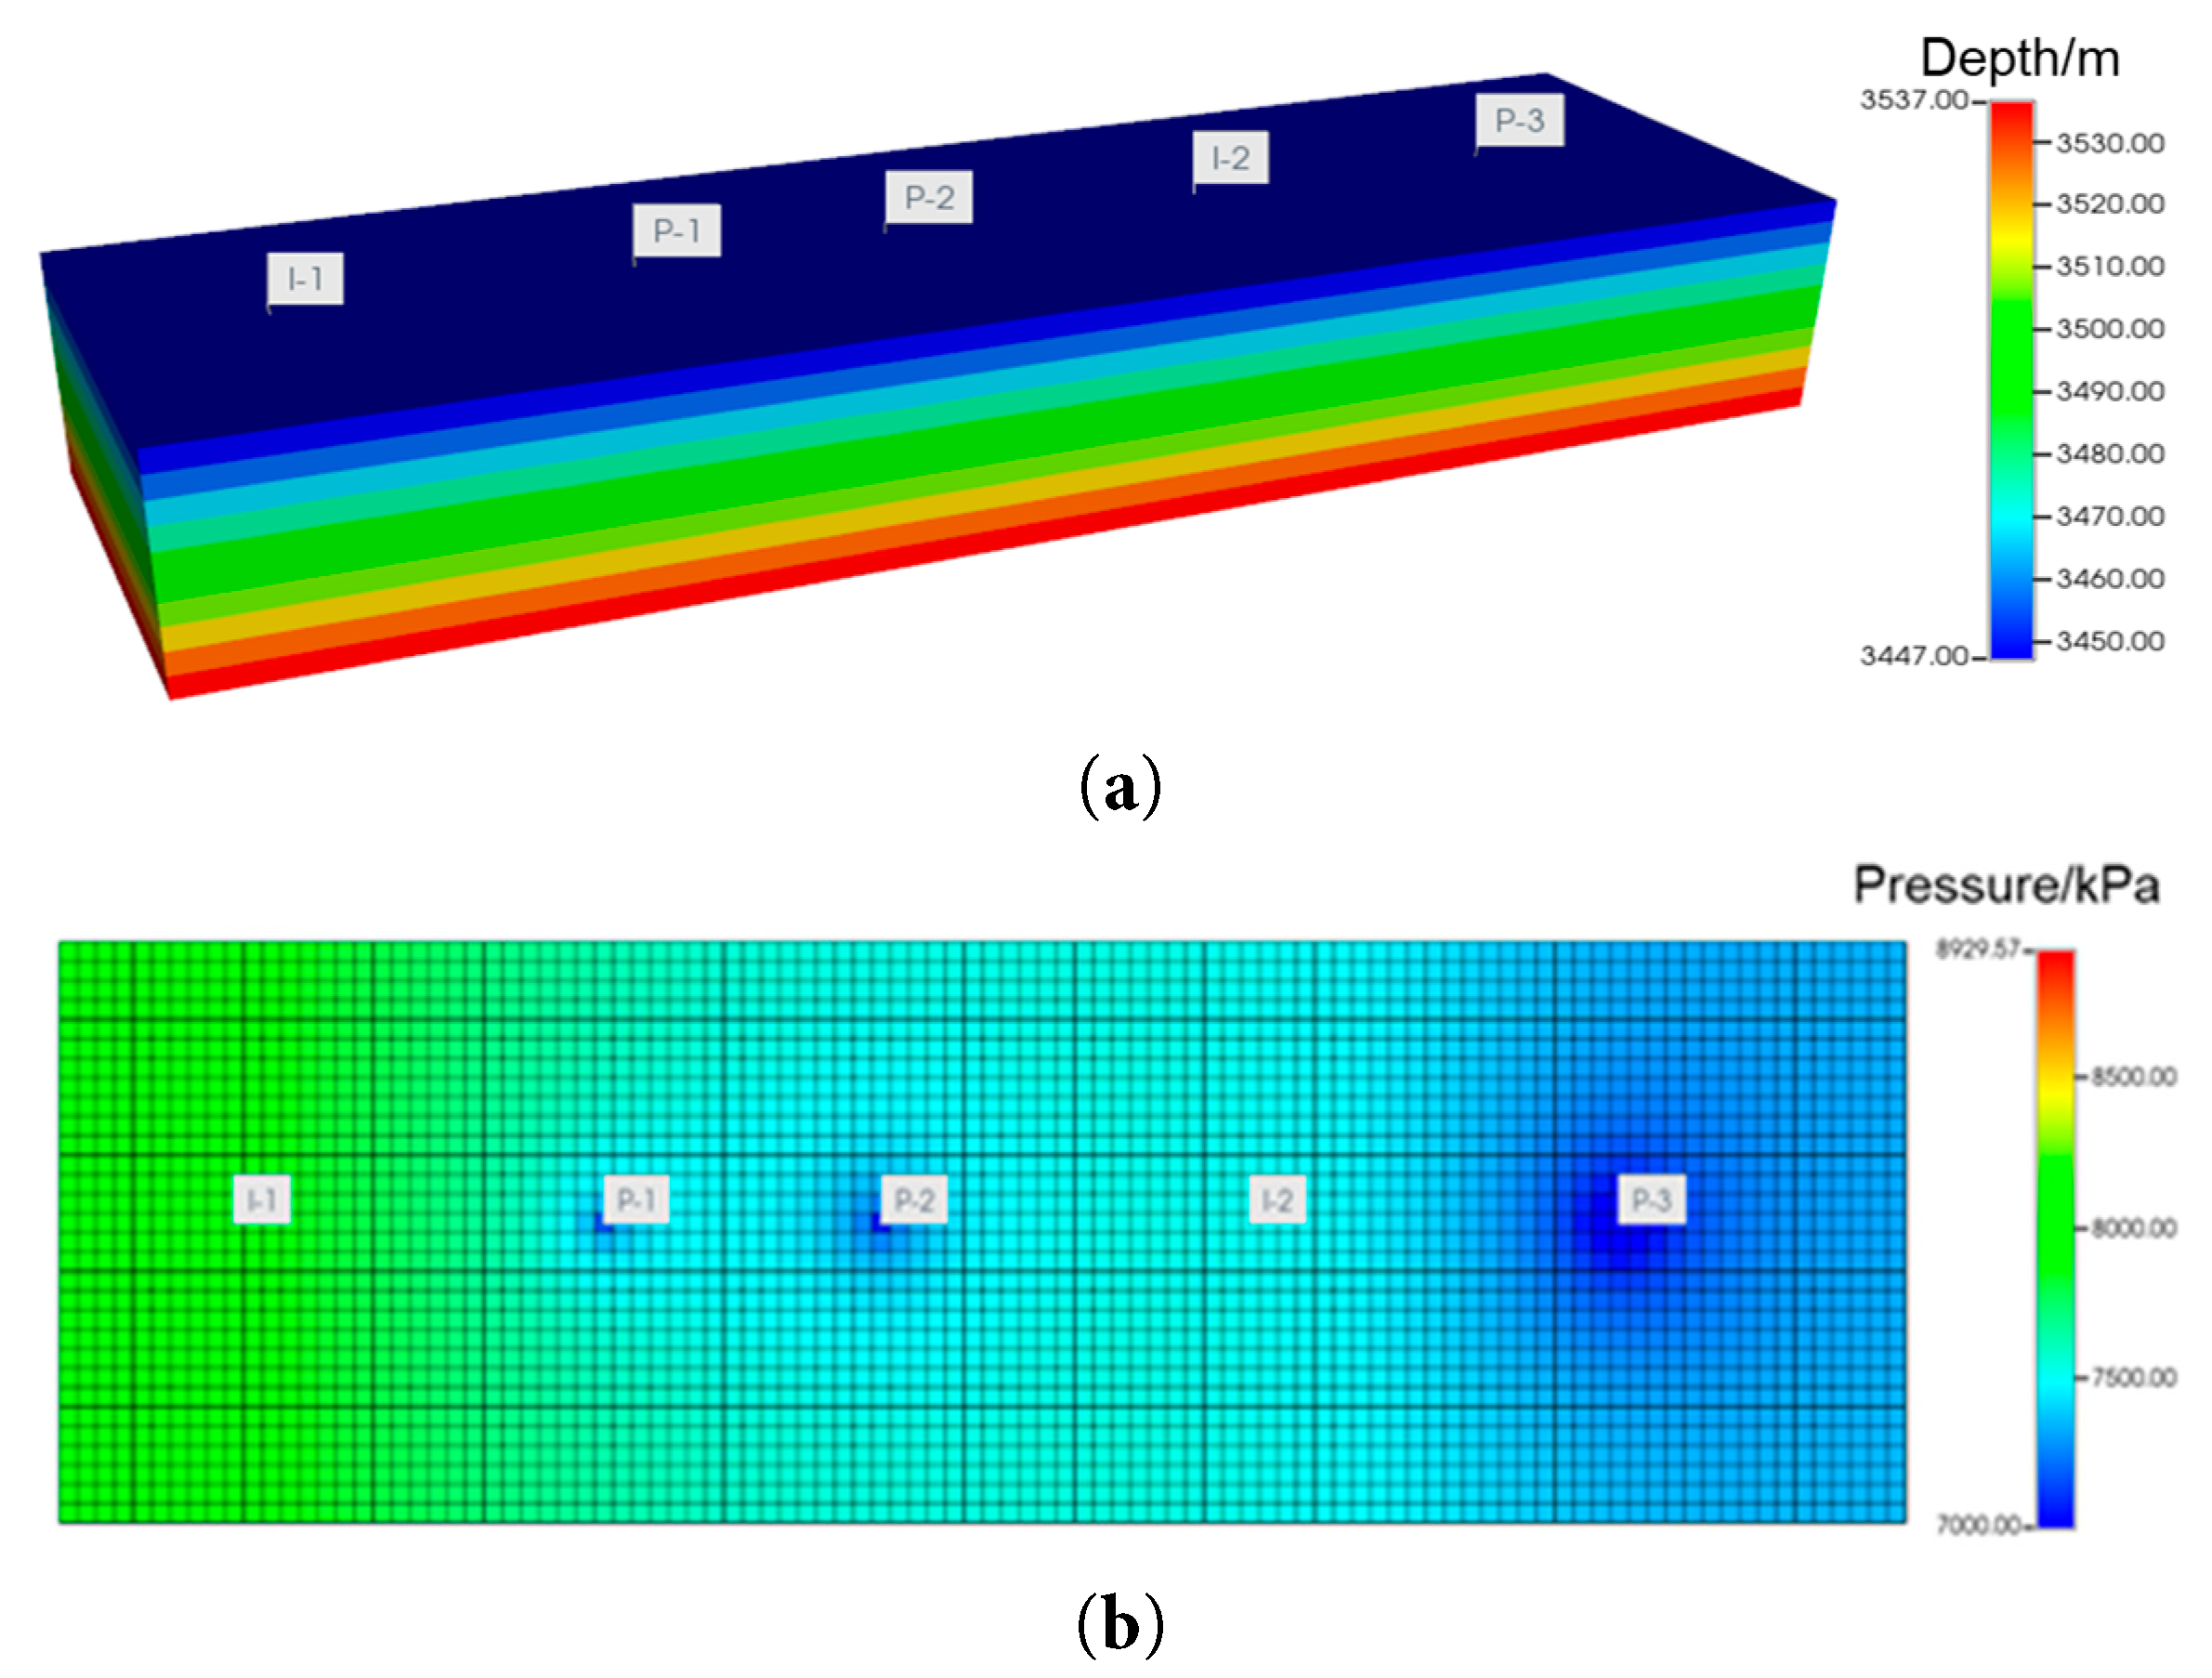
Figure 2: (a) 3D grid model of the gas reservoir; (b) Reservoir pressure distribution after 40 years of depressurization production.
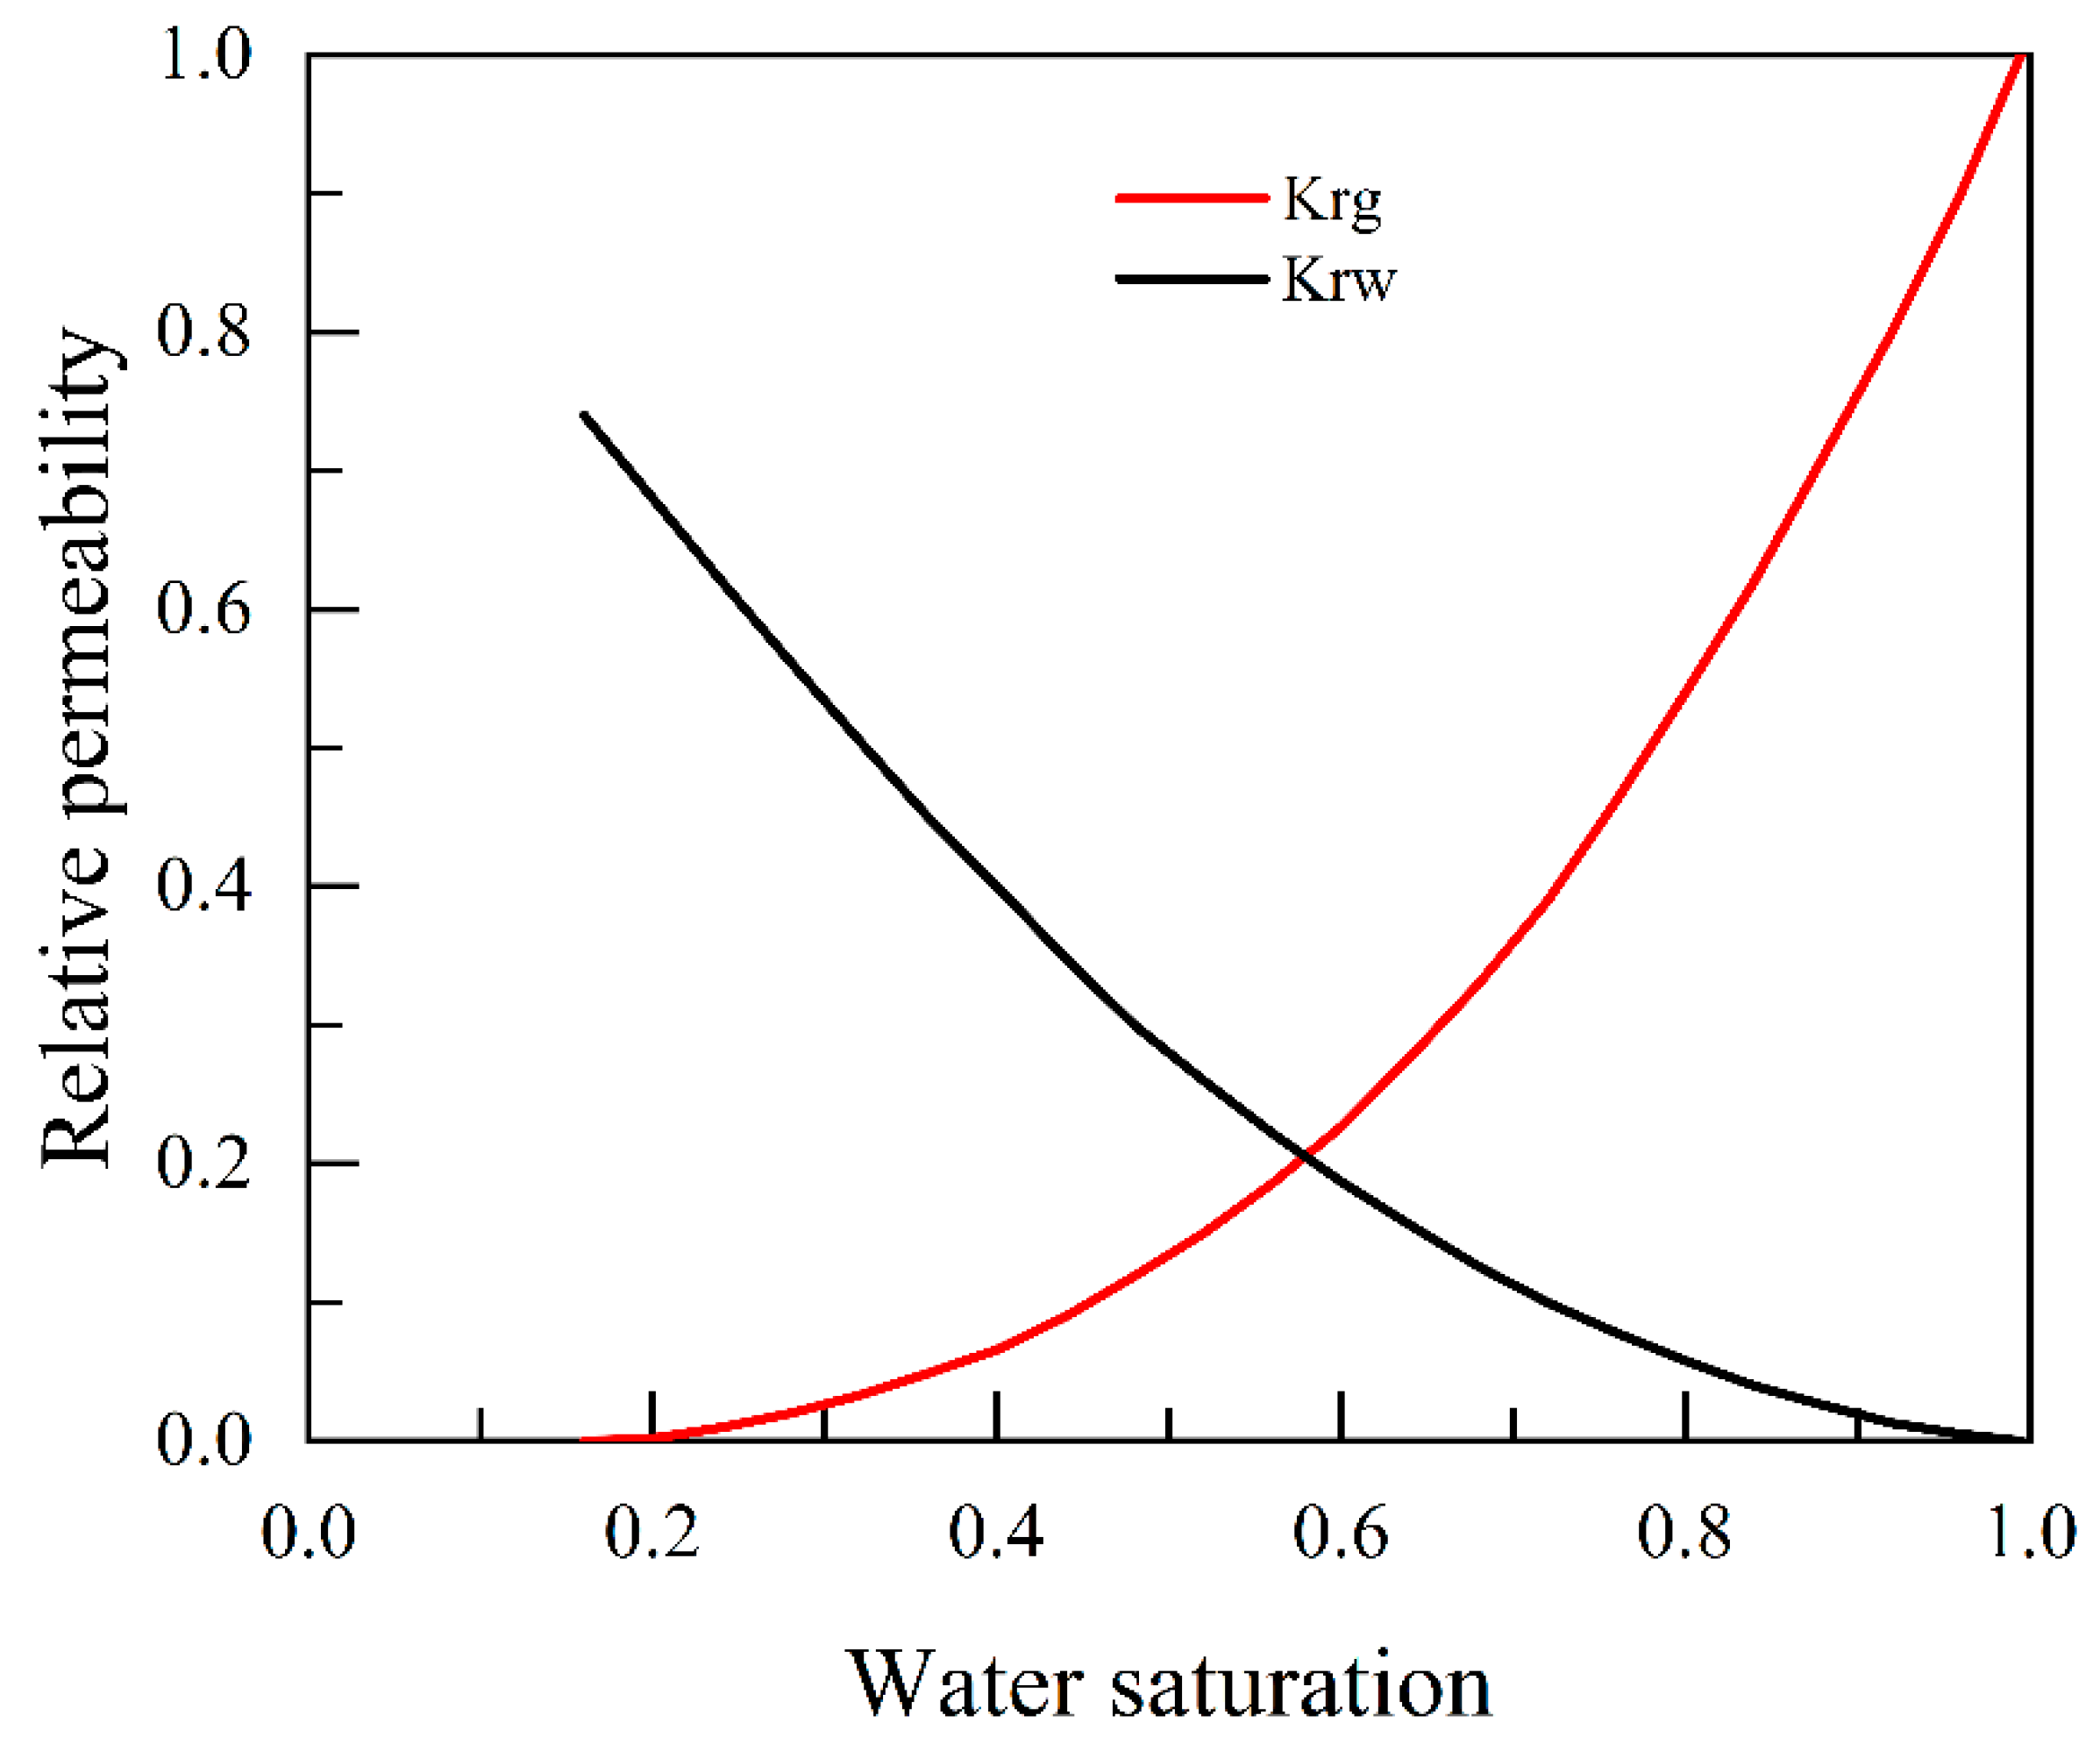
Figure 3: Gas-water two-phase relative permeability curves.
3.2 Analysis of Influencing Factors and Scheme Selection for CCUS-EGR
Based on the numerical model initialized with 40 years of simulated production history, this study designed multiple simulation scenarios to analyze the impact of different geological and engineering parameters on the CCUS-EGR effect of the Maokou Formation gas reservoir in Wolonghe. The investigated ranges for the injection-production ratio and injection rate were selected based on practical operational constraints. The main evaluation indicators include CO2 breakthrough time, cumulative natural gas production, and enhanced recovery factor. And in these simulations, breakthrough time is defined as the time (in days) when the mole fraction of CO2 in the produced gas stream from the three production wells (P-1, P-2, or P-3) first exceeded 1.0%. The simulation injection time is set to 20 years.
3.2.1 Injection-Production Ratio
The injection-production ratio (the volume ratio of injected gas to produced gas) is a key parameter for maintaining formation energy. As shown in Fig. 4, the cumulative gas production shows a trend of first rising and then falling as the injection-production ratio increases, reaching a peak at an injection-production ratio of 0.7. This indicates that an appropriate injection-production ratio (<1.0) can effectively supplement formation energy, slow down the pressure decline rate, and thus increase natural gas production. However, when the injection-production ratio is too high (e.g., ≥0.9), a large amount of injected CO2 may flow too quickly to the production well, causing gas channeling and consequently reducing the sweep efficiency and total gas production. Therefore, there is an optimal injection-production ratio range, and an excessively high ratio does not lead to economically efficient production enhancement.
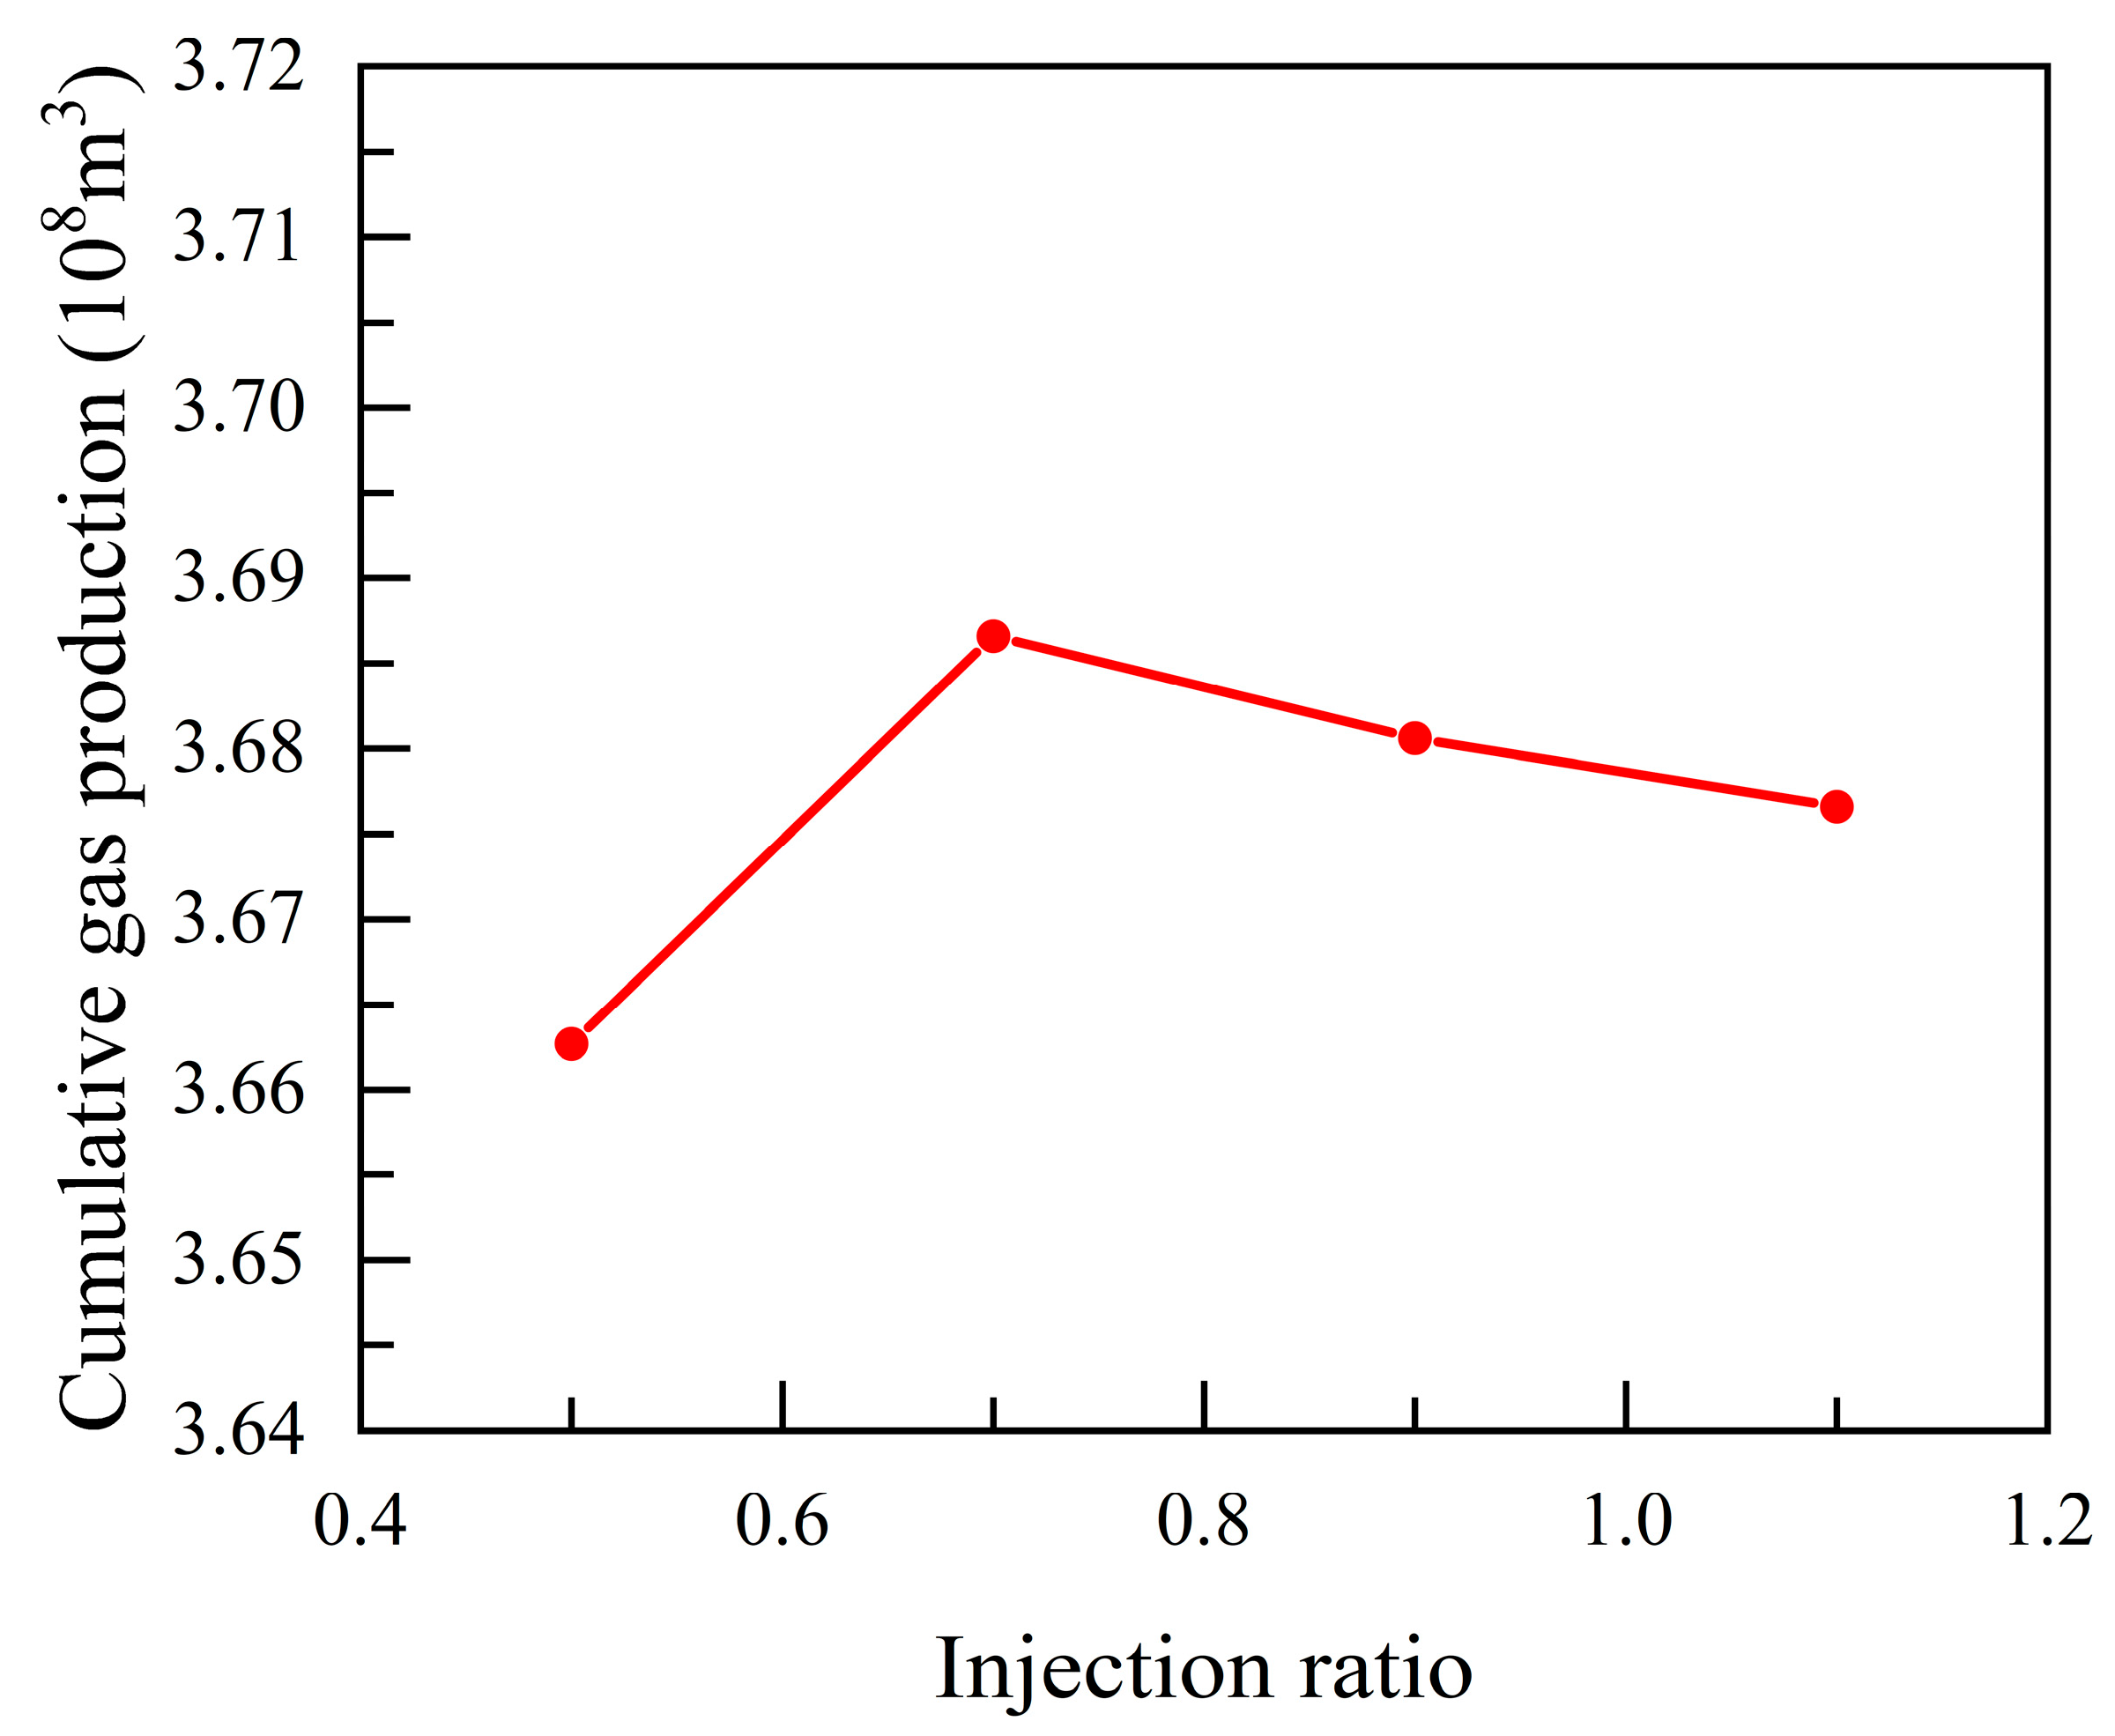
Figure 4: Effect of injection-production ratio on cumulative gas production.
The injection rate directly affects the CO2 displacement front and sweep range. As can be seen from Fig. 5, the cumulative gas production increases significantly with the increase of the injection rate, reaching its maximum value at a rate of 130,000 m3/d, after which it starts to decline. The higher the injection rate, the higher the cumulative capacity of storage CO2. This indicates that increasing the injection rate can more quickly establish an effective displacement pressure system and expand the CO2 sweep volume, thereby enhancing the displacement effect This phenomenon can be explained by fluid dynamics: a higher injection rate increases the pressure gradient between the injector and the producers. According to Darcy’s Law, this higher pressure gradient leads to a higher fluid velocity. This has two primary benefits: first, it more quickly builds up reservoir pressure in the vicinity of the injector, establishing the “effective displacement pressure system” that provides the driving force. Second, the higher velocity allows the CO2 front to travel further into the reservoir per unit time, expanding the CO2 sweep volume before gravity segregation or other bypassing effects can dominate, thereby enhancing the displacement effect. However, when the injection rate is too high, it may cause viscous fingering, leading to CO2 breakthrough along high-permeability channels, reducing sweep efficiency, and ultimately decreasing the final recovery factor. Therefore, selecting an optimal injection rate that balances displacement speed and sweep efficiency is key to achieving the best production enhancement.
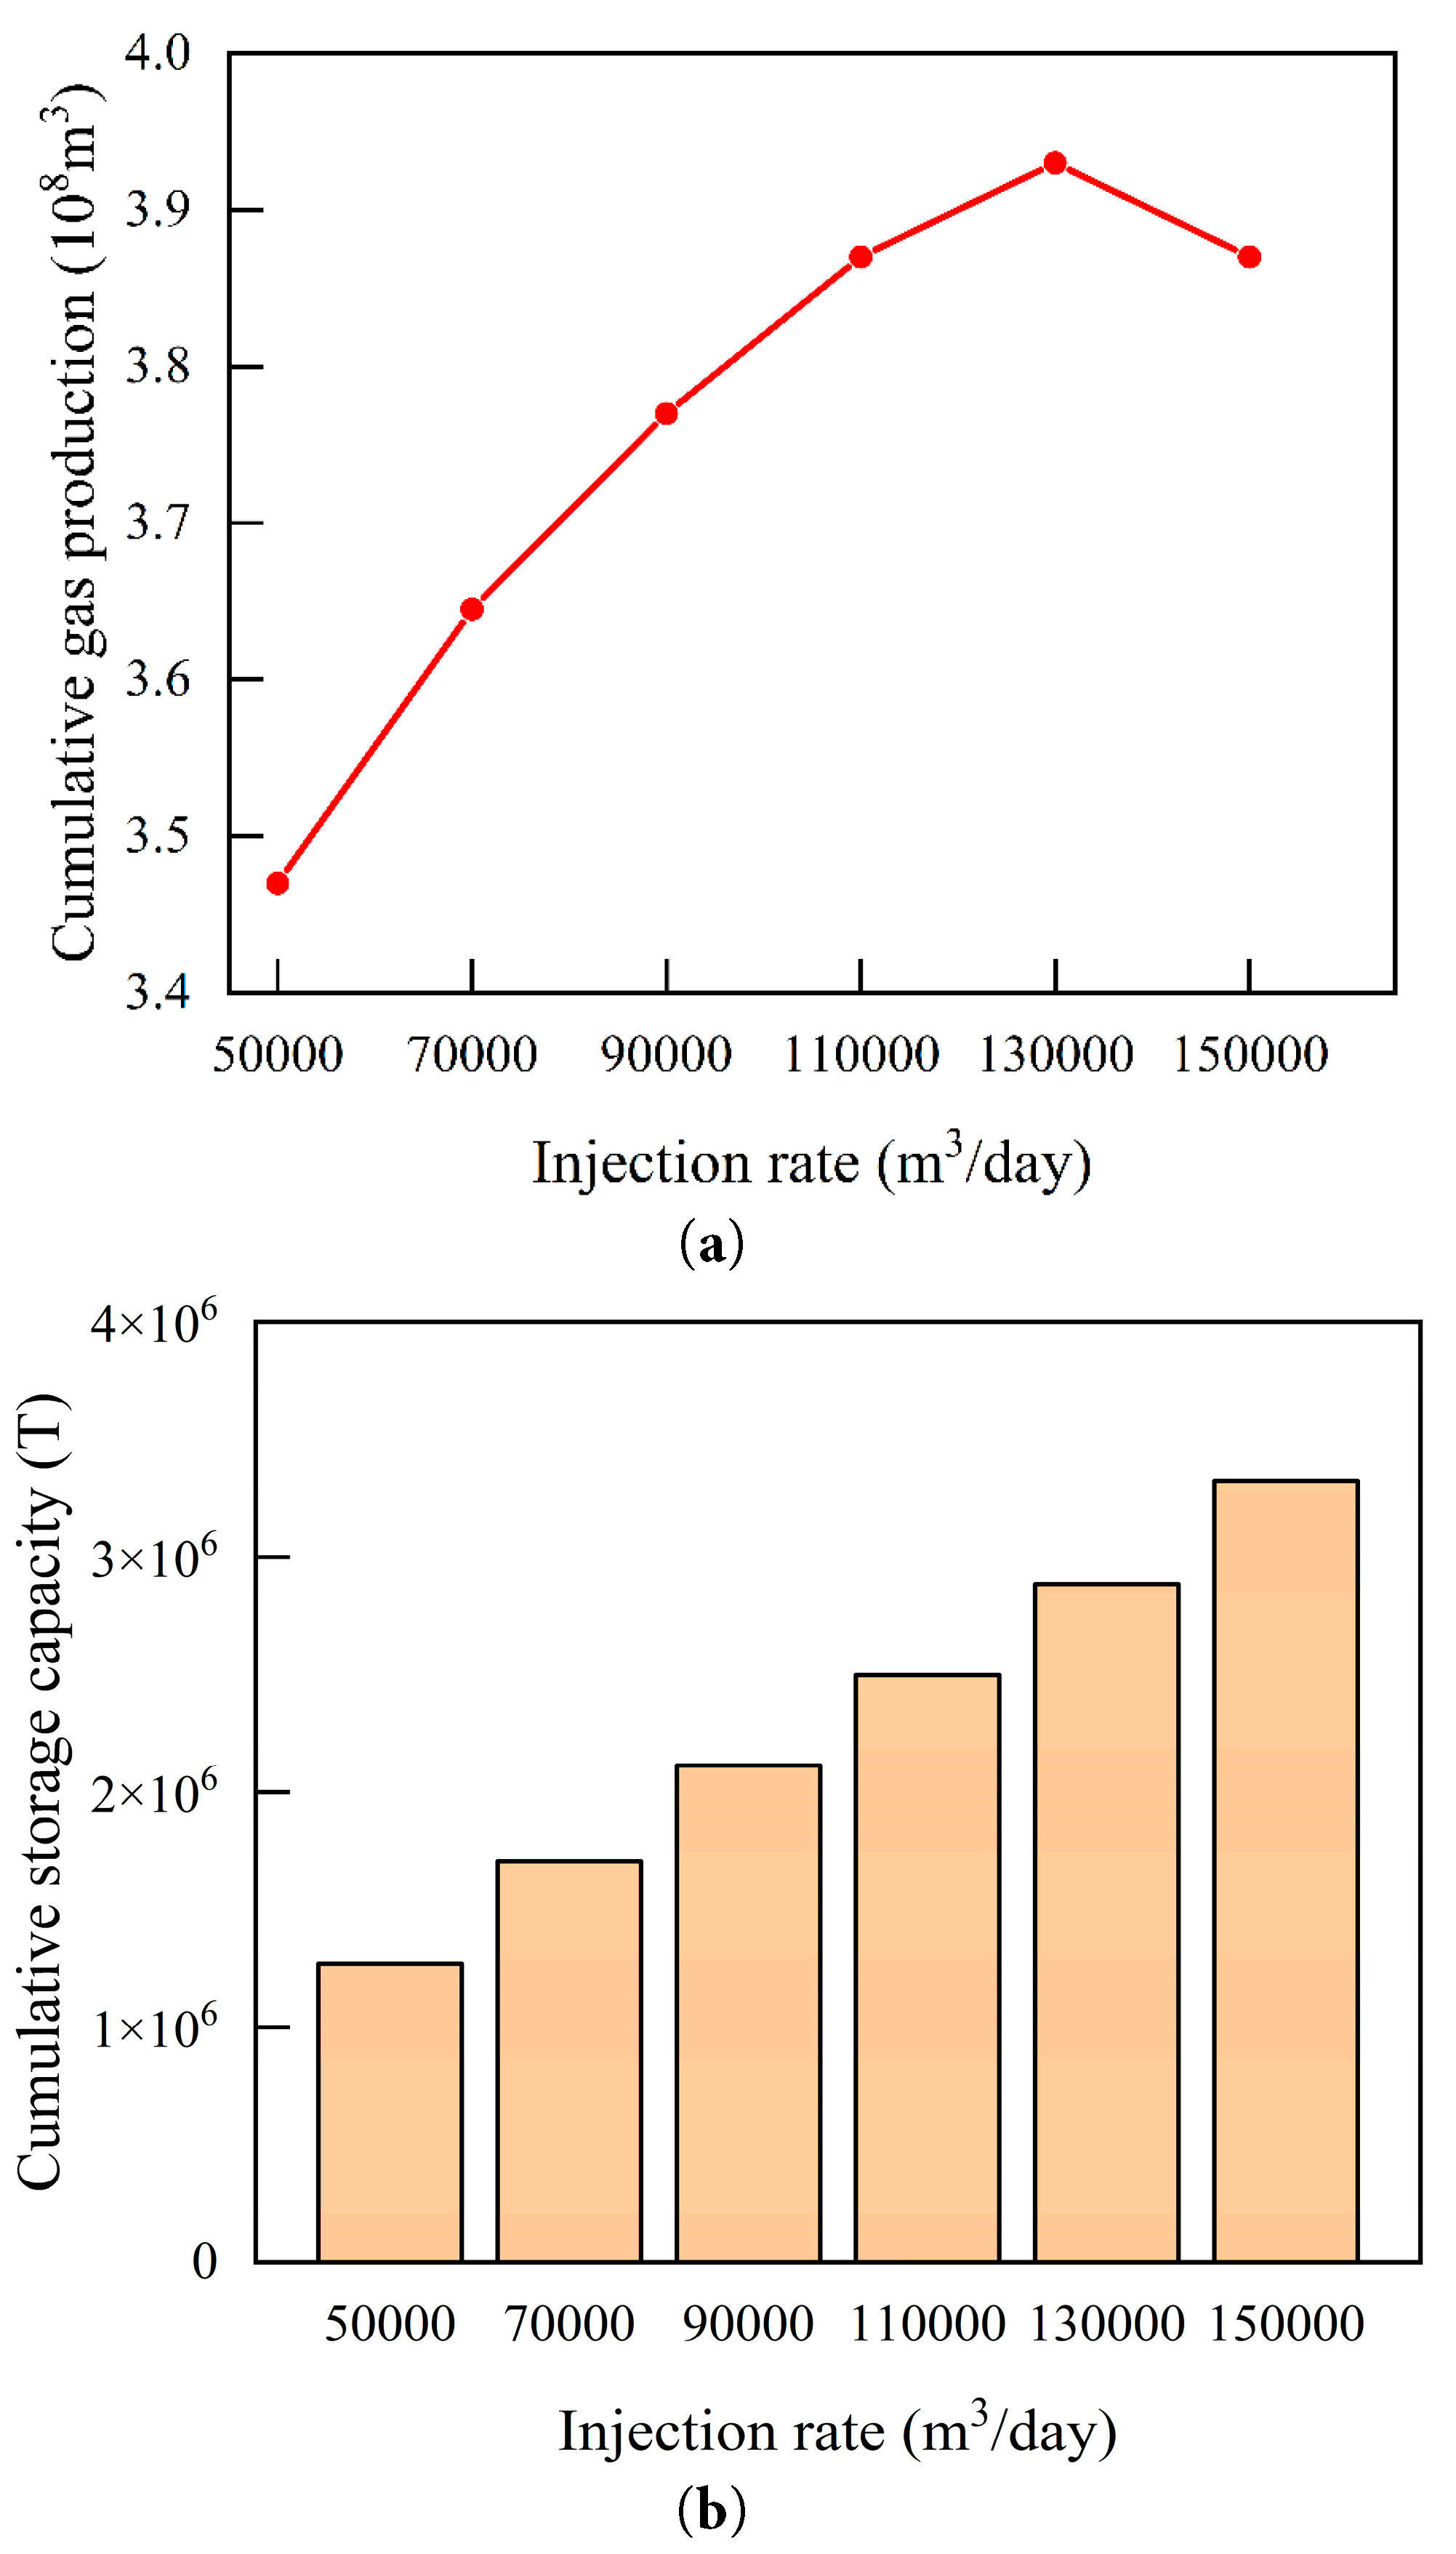
Figure 5: (a) The influence of gas injection rate on cumulative gas production; (b) Cumulative CO2 storage capacity at different injection rates.
Beyond this macroscopic impact on displacement dynamics and final production, the injection rate also directly influences the intensity and extent of CO2–water–rock geochemical reactions by modulating the flux of reactive fluids, leading to subsequent changes in reservoir properties. This change shows different characteristics in the near-wellbore areas of the injector and production wells. As shown in Fig. 6, during the initial injection period, the porosity continued to increase. When the injection lasted for approximately 500 days, the porosity presented different changes. When the injection rate is below 90,000 m3/day, porosity decreases with the increase in time. When the injection rate is above 90,000 m3/day, the porosity increases with time. The main reason for this is that this area has the highest CO2 concentration, and the injected CO2 rapidly dissolves in the formation water to form carbonic acid, leading to a significant decrease in local pH. This strongly acidic environment greatly promotes the dissolution of carbonate minerals (such as calcite and dolomite), thereby effectively increasing the pore space and improving reservoir properties. At the same time, the increase in porosity is positively correlated with the injection rate; the higher the rate, the more CO2 enters the formation per unit time, the stronger the dissolution, and the more significant the porosity increase.
Unlike the area near the injection well, the porosity change in the near-wellbore area of the producer is more complex, showing a dynamic competition between dissolution and precipitation, as shown in Fig. 7. In the early stage of injection, the porosity in all scenarios showed a slight decrease, followed by a slow recovery or stabilization. The highest injection rate leads to the smallest decline in porosity, while the lowest rate results in the largest decline in porosity. When the injection rate exceeds 90,000 m3/day, porosity begins to rise in the later stage of injection. However, when the injection rate is even lower, the rate of porosity reduction will also decrease. This phenomenon can be explained by a complex geochemical mechanism: on the one hand, Ca2+, Mg2+, and other ions dissolved from the injection well area and transported with the fluid, upon reaching the vicinity of the production well, their solubility decreases due to changes in pressure and temperature conditions, causing secondary precipitation, which can plug some pores and lead to a slight decrease in porosity; on the other hand, as the displacement process continues, the CO2–rich fluid front gradually advances to this area, and the acidic dissolution effect begins to appear and counteract the precipitation effect, causing the porosity to slowly recover. Therefore, the change in porosity in the production well area is the result of the combined action of ion migration, phase equilibrium changes, and acidification reactions. Its net effect is not as significant as the porosity increase near the injection well, and it may even cause slight damage to the reservoir in the early stages of the project.
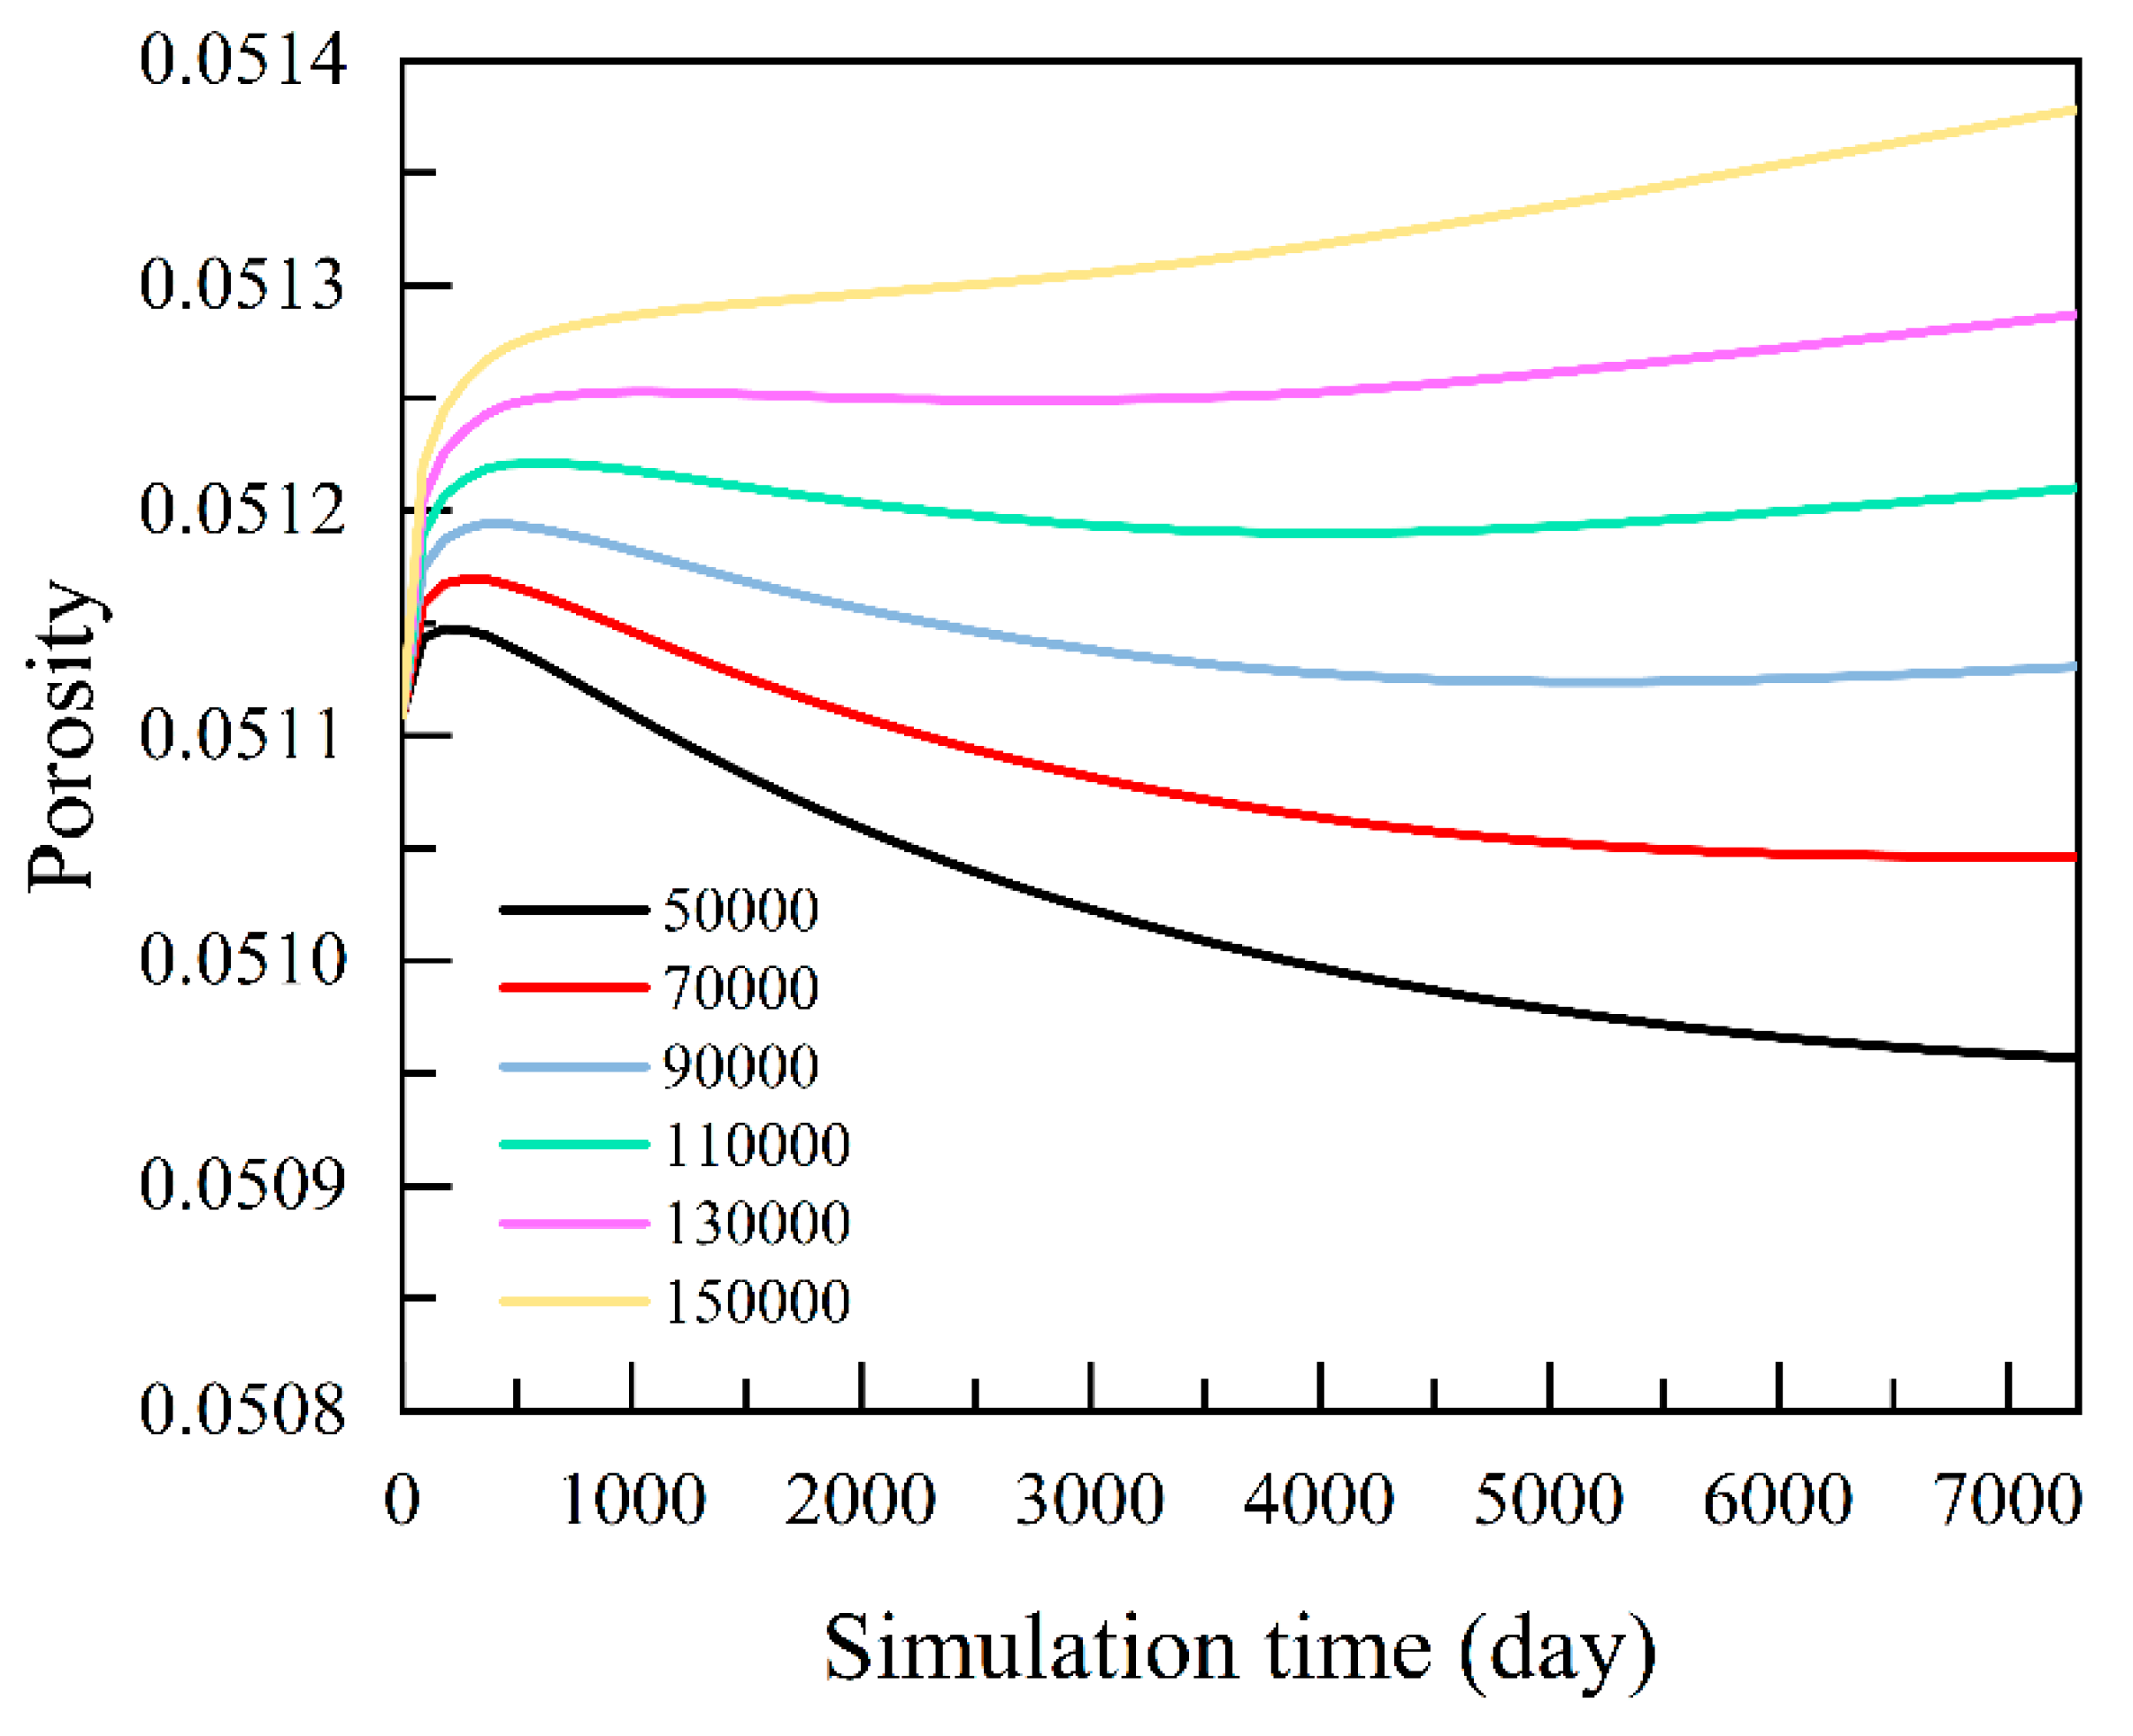
Figure 6: Change of porosity with time in the near-wellbore area of the injection well (I-1).
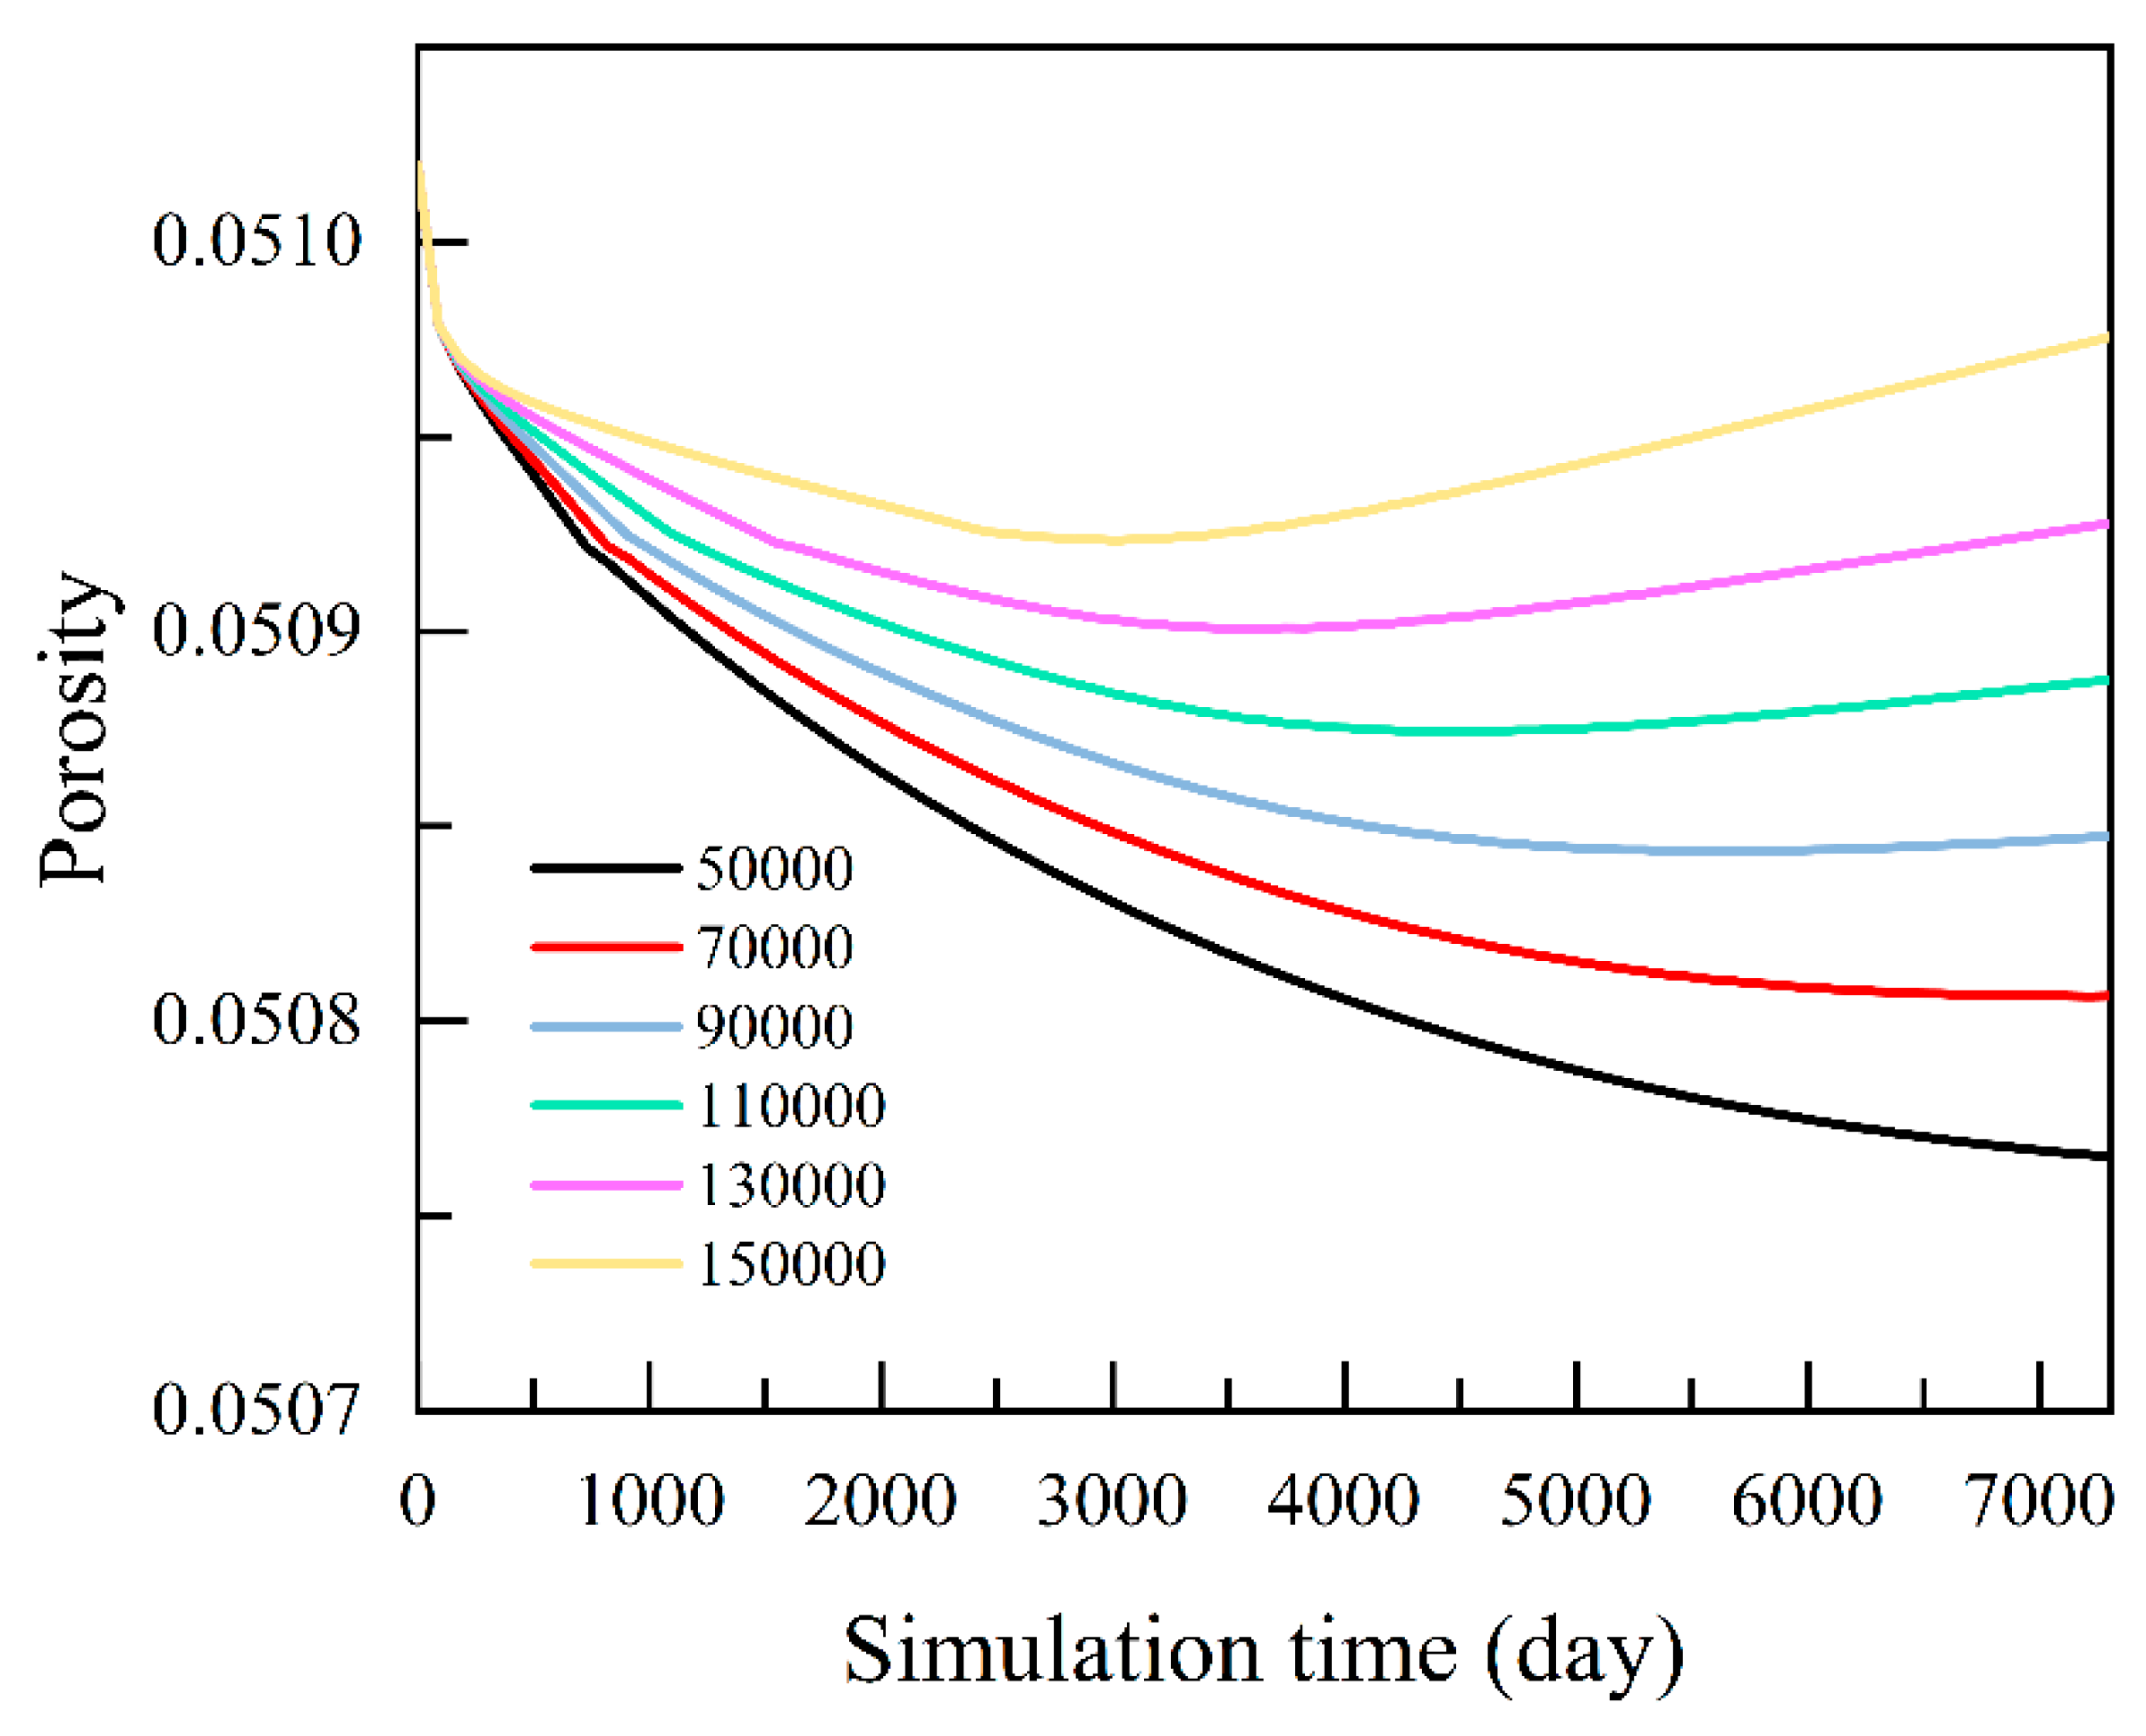
Figure 7: Change of porosity with time in the near-wellbore area of the production well (P-2).
The composition of the injected gas is another key factor affecting displacement efficiency. Different CO2 injection ratios were set, and N2 was used as an impurity gas. This is because the main source of gas for geological storage is industrial flue gas, which contains a large amount of CO2 and N2 [24,25]. Directly injecting the mixed gas will effectively reduce the separation cost [26]. The simulation results (Fig. 8) show an interesting phenomenon: the cumulative natural gas production is negatively correlated with the purity (mole fraction) of CO2 in the injected gas, meaning that with an increase in the content of the impurity gas N2, the final gas production actually increases.
The main reason for this result can be attributed to the weakening of the gravity segregation effect. Under reservoir conditions (3447 m depth, 85.0°C), the density of pure CO2 (about 600–700 kg/m3) is much greater than that of natural gas (CH4, about 100–150 kg/m3). This density difference will cause the injected CO2 to rapidly migrate downwards under the action of gravity, forming “gravity override”, thereby bypassing the natural gas in the upper and middle parts of the reservoir, leading to lower sweep efficiency and recovery factor. The density of N2 is close to that of CH4. When mixed with CO2, the overall density of the mixed gas decreases, and the density difference with the formation’s natural gas is reduced. This effectively suppresses the gravity segregation phenomenon, makes the displacement front more stable, and allows it to sweep a wider reservoir space, especially improving the vertical sweep efficiency, thus achieving a higher natural gas recovery factor. This finding has important practical significance for directly using industrial flue gas containing N2 for EGR.
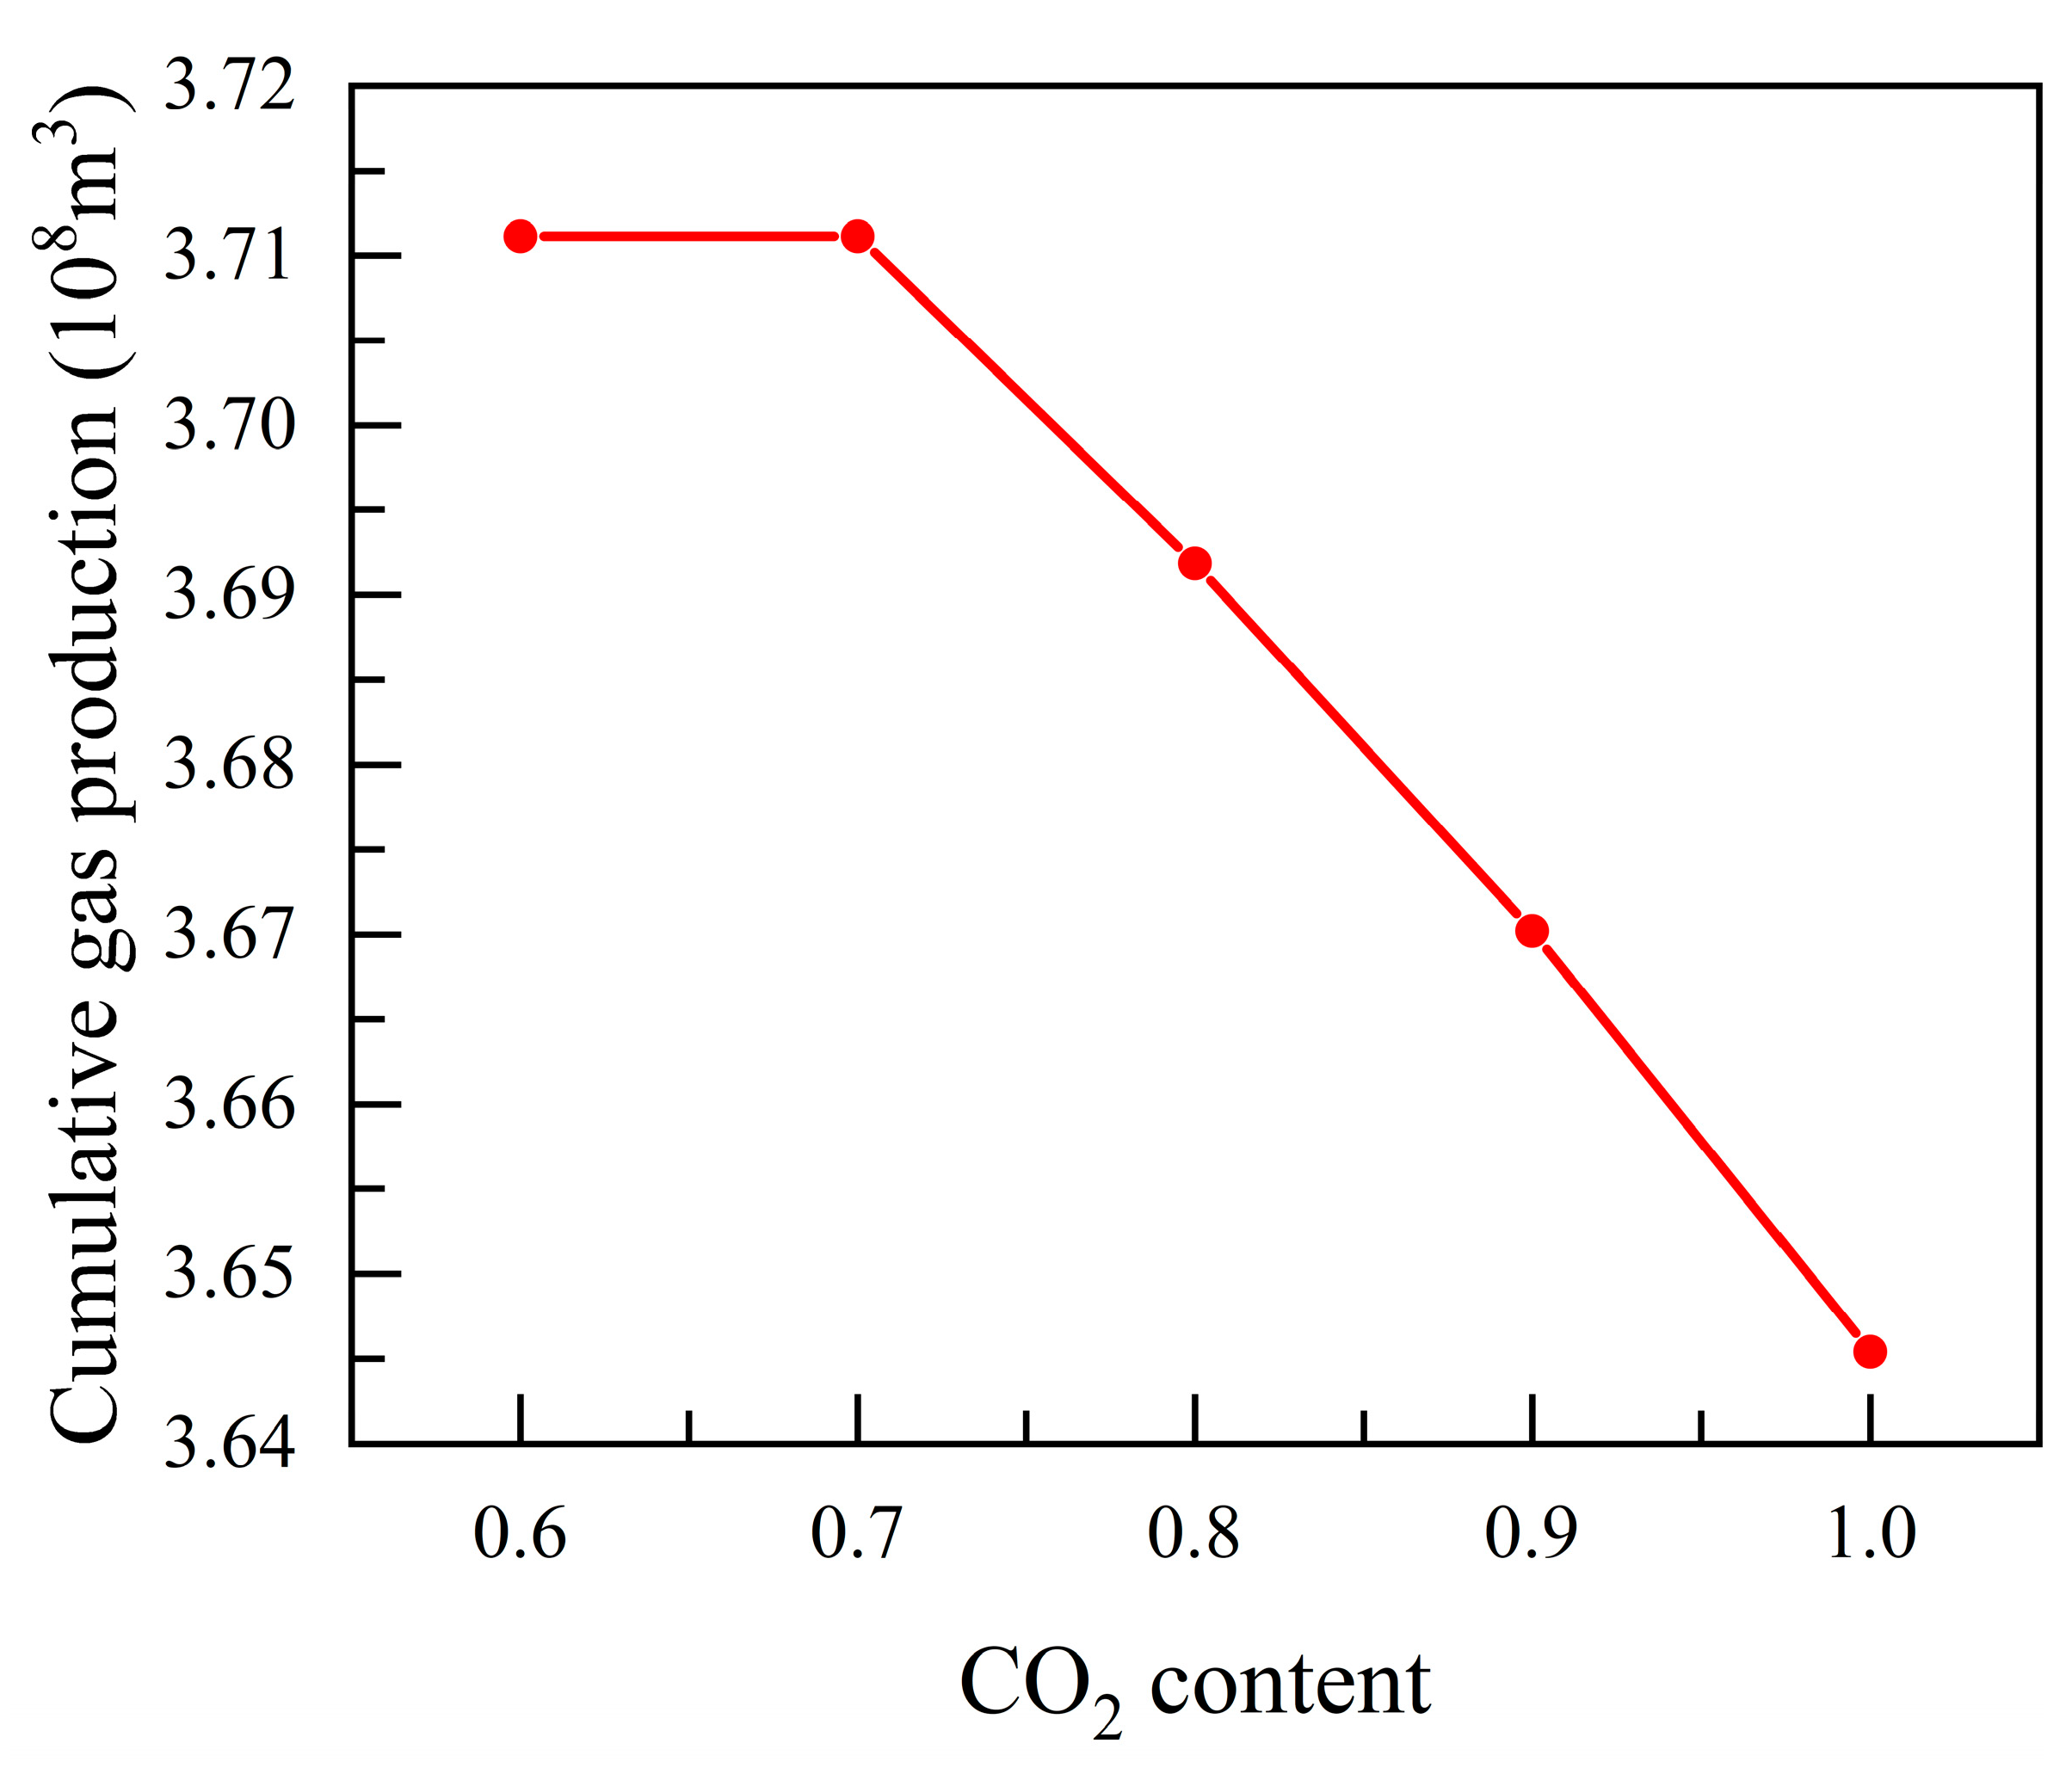
Figure 8: Effect of injected CO2 purity on cumulative gas production.
Based on a numerical model of the Wolonghe Gas Field’s Maokou Formation, this study investigated key factors for optimizing CCUS-EGR and reached the following conclusions:
- (1)Synergistic optimization of engineering parameters is critical. The highest gas recovery was achieved with an optimal injection-production ratio of 0.7 and an injection rate of 130,000 m3/d. Injecting above these values reduced the final recovery factor, confirming that higher injection does not always yield better results due to accelerated breakthrough.
- (2)Injecting a N2/CO2 mixed gas (e.g., 70% CO2/30% N2) quantitatively outperformed pure CO2 injection. This is attributed to the lower density of the mixed gas, which successfully mitigates gravity segregation and improves vertical sweep efficiency.
- (3)CO2–water–rock reactions have a dual, time-dependent impact on porosity. Near the injection well, continuous acidic dissolution of calcite and dolomite led to a significant porosity enhancement. Conversely, near the production well, porosity first declined due to the precipitation of secondary minerals, followed by a slow recovery as the acidic front advanced, revealing a complex competition between formation damage and stimulation.
In summary, a successful CCUS-EGR strategy for similar carbonate gas reservoirs requires a synergistic optimization of injection parameters, gas composition, and a thorough assessment of long-term geochemical impacts to maximize both CO2 storage and natural gas recovery.
Acknowledgement:
Funding Statement: This research was funded by the National Science Foundation of China (52204033), the Science & Technology Department of Sichuan Province (2024NSFSC0201), Scientific research Project of Petro China Southwest Oil & Gas Field Company (No. 2024D112-01-01).
Author Contributions: The authors confirm contribution to the paper as follows: Conceptualization, Nan Qin and Shaofeng Ning; methodology, Nan Qin; software, Shaofeng Ning; validation, Zihan Zhao, Yu Luo and Bo Chen; formal analysis, Xiaoxu Liu; investigation, Nan Qin; resources, Nan Qin and Yongming He; data curation, Nan Qin and Shaofeng Ning; writing—original draft preparation, Nan Qin and Shaofeng Ning; writing—review and editing, Zihan Zhao and Yu Luo; visualization, Shaofeng Ning; supervision, Zihan Zhao; project administration, Zihan Zhao; funding acquisition, Nan Qin. All authors reviewed the results and approved the final version of the manuscript.
Availability of Data and Materials: The data that support the findings of this study are available from the Corresponding Author, Shaofeng Ning, upon reasonable request.
Ethics Approval: Not applicable.
Conflicts of Interest: The authors declare no conflicts of interest to report regarding the present study.
References
1. Jiang K , Ashworth P , Zhang S , Liang X , Sun Y , Angus D . China’s carbon capture, utilization and storage (CCUS) policy: a critical review. Renew Sustain Energy Rev. 2020; 119: 109601. doi:10.1016/j.rser.2019.109601. [Google Scholar] [CrossRef]
2. Zhang C , Wang Y , Kou Z , Zhang L . Recent research advances in enhanced CO2 mineralization and geologic CO2 storage. Adv Geo-Energy Res. 2023; 10( 3): 141– 5. doi:10.46690/ager.2023.12.01. [Google Scholar] [CrossRef]
3. Tapia JFD , Lee JY , Ooi REH , Foo DCY , Tan RR . A review of optimization and decision-making models for the planning of CO2 capture, utilization and storage (CCUS) systems. Sustain Prod Consum. 2018; 13: 1– 15. doi:10.1016/j.spc.2017.10.001. [Google Scholar] [CrossRef]
4. Bashir A , Ali M , Patil S , Aljawad MS , Mahmoud M , Al-Shehri D , et al. Comprehensive review of CO2 geological storage: exploring principles, mechanisms, and prospects. Earth Sci Rev. 2024; 249: 104672. doi:10.1016/j.earscirev.2023.104672. [Google Scholar] [CrossRef]
5. Wang Z , Wang P , Li S , Cheng H , Zhang K . CO2 foam to enhance geological storage capacity in hydrocarbon reservoirs. Renew Sustain Energy Rev. 2024; 199: 114504. doi:10.1016/j.rser.2024.114504. [Google Scholar] [CrossRef]
6. Xiao J , Wei C , Lin D , Wu X , Zhang Z , Liu D . Dynamic CO2 leakage risk assessment of the first Chinese CCUS-EGR pilot project in the Maokou carbonate gas reservoir in the wolonghe gas field. Energies. 2025; 18( 17): 4478. doi:10.3390/en18174478. [Google Scholar] [CrossRef]
7. Hu J , Yang S , Zuo H , Liu Y , Shen B , Gao X , et al. Numerical simulation of CO2 storage with enhanced gas recovery in depleted highly heterogeneous carbonate gas reservoir. Phys Fluids. 2025; 37( 7): 073112. doi:10.1063/5.0276145. [Google Scholar] [CrossRef]
8. Skurtveit E , Aker E , Soldal M , Angeli M , Wang Z . Experimental investigation of CO2 breakthrough and flow mechanisms in shale. Petrol Geosci. 2012; 18( 1): 3– 15. doi:10.1144/1354-079311-016. [Google Scholar] [CrossRef]
9. Hildenbrand A , Schlömer S , Krooss BM , Littke R . Gas breakthrough experiments on pelitic rocks: comparative study with N2, CO2 and CH4. Geofluids. 2004; 4( 1): 61– 80. doi:10.1111/j.1468-8123.2004.00073.x. [Google Scholar] [CrossRef]
10. Eliebid M , Mahmoud M , Shawabkeh R , Elkatatny S , Hussein IA . Effect of CO2 adsorption on enhanced natural gas recovery and sequestration in carbonate reservoirs. J Nat Gas Sci Eng. 2018; 55: 575– 84. doi:10.1016/j.jngse.2017.04.019. [Google Scholar] [CrossRef]
11. Hellevang H , Pham VTH , Aagaard P . Kinetic modelling of CO2–water–rock interactions. Int J Greenh Gas Control. 2013; 15: 3– 15. doi:10.1016/j.ijggc.2013.01.027. [Google Scholar] [CrossRef]
12. Farquhar SM , Pearce JK , Dawson GKW , Golab A , Sommacal S , Kirste D , et al. A fresh approach to investigating CO2 storage: experimental CO2–water–rock interactions in a low-salinity reservoir system. Chem Geol. 2015; 399: 98– 122. doi:10.1016/j.chemgeo.2014.10.006. [Google Scholar] [CrossRef]
13. Tang J , Zhang Z , Xie J , Meng S , Xu J , Ehlig-Economides C , et al. Re-evaluation of CO2 storage capacity of depleted fractured-vuggy carbonate reservoir. Innov Energy. 2024; 1( 2): 100019. doi:10.59717/j.xinn-energy.2024.100019. [Google Scholar] [CrossRef]
14. El-Hajj H , Odi U , Gupta A . Carbonate reservoir interaction with supercritical carbon dioxide. In: International Petroleum Technology Conference; 2013 Mar 26–28; Beijing, China. doi:10.2523/iptc-16561-abstract. [Google Scholar] [CrossRef]
15. Guo X , Feng J , Wang P , Kong B , Wang L , Dong X , et al. Review on the mechanism of CO2 storage and enhanced gas recovery in carbonate sour gas reservoir. Processes. 2023; 11( 1): 164. doi:10.3390/pr11010164. [Google Scholar] [CrossRef]
16. Hu Y , Peng X , Li Q , Li L , Hu D . Progress and development direction of technologies for deep marine carbonate gas reservoirs in the Sichuan Basin. Nat Gas Ind B. 2020; 7( 2): 149– 59. doi:10.1016/j.ngib.2019.09.004. [Google Scholar] [CrossRef]
17. Xie Z , Cao C , Zhao Y , Wen S , Wang Y , Zhang T , et al. CO2 storage performance influenced by CO2-brine-carbonate reactions: a case from China’s first CCUS project in carbonate gas reservoir. Energy. 2025; 337: 138418. doi:10.1016/j.energy.2025.138418. [Google Scholar] [CrossRef]
18. Perera M , Gamage R , Rathnaweera T , Ranathunga A , Koay A , Choi X . A review of CO2-enhanced oil recovery with a simulated sensitivity analysis. Energies. 2016; 9( 7): 481. doi:10.3390/en9070481. [Google Scholar] [CrossRef]
19. Abedini A , Torabi F . On the CO2 storage potential of cyclic CO2 injection process for enhanced oil recovery. Fuel. 2014; 124: 14– 27. doi:10.1016/j.fuel.2014.01.084. [Google Scholar] [CrossRef]
20. Kalra S , Wu X . CO2 injection for enhanced gas recovery. In: Proceedings of the SPE Western North American and Rocky Mountain Joint Meeting; 2014 Apr 17–18; Denver, CO, USA. doi:10.2118/169578-MS. [Google Scholar] [CrossRef]
21. Khormali A , Ahmadi S , Aleksandrov AN . Analysis of reservoir rock permeability changes due to solid precipitation during waterflooding using artificial neural network. J Petrol Explor Prod Technol. 2025; 15( 1): 17. doi:10.1007/s13202-024-01898-1. [Google Scholar] [CrossRef]
22. Rezk MG , Ibrahim AF . Numerical investigation of CO2 plume migration and trapping mechanisms in the Sleipner field: does the aquifer heterogeneity matter? Fuel. 2025; 394: 135054. doi:10.1016/j.fuel.2025.135054. [Google Scholar] [CrossRef]
23. Nghiem L , Sammon P , Grabenstetter J , Ohkuma H . Modeling CO2 storage in aquifers with a fully-coupled geochemical EOS compositional simulator. In: Proceedings of the SPE/DOE Symposium on Improved Oil Recovery; 2004 Apr 17–21; Tulsa, OK, USA. doi:10.2118/89474-ms. [Google Scholar] [CrossRef]
24. Bachu S . CO2 storage in geological media: role, means, status and barriers to deployment. Prog Energy Combust Sci. 2008; 34( 2): 254– 73. doi:10.1016/j.pecs.2007.10.001. [Google Scholar] [CrossRef]
25. Sam H . Carbon dioxide capture and geological storage. Phil Trans R Soc A. 2007; 365( 1853): 1095– 107. doi:10.1098/rsta.2006.1953. [Google Scholar] [CrossRef]
26. Powell CE , Qiao GG . Polymeric CO2/N2 gas separation membranes for the capture of carbon dioxide from power plant flue gases. J Membr Sci. 2006; 279( 1–2): 1– 49. doi:10.1016/j.memsci.2005.12.062. [Google Scholar] [CrossRef]
Cite This Article
 Copyright © 2025 The Author(s). Published by Tech Science Press.
This work is licensed under a Creative Commons Attribution 4.0 International License , which permits unrestricted use, distribution, and reproduction in any medium, provided the original work is properly cited.
 Downloads
 Citation Tools