
 Submit a Paper
 Propose a Special lssue
 Open Access
ARTICLE

Rising Bubbles and Ensuing Wake Effects in Bottom-Blown Copper Smelters
1 State Key Laboratory of Complex Nonferrous Metal Resources Clean Utilization, Kunming University of Science and Technology, Kunming, 650093, China
2 Faculty of Metallurgical and Energy Engineering, Kunming University of Science and Technology, Kunming, 650093, China
3 Yimen COPPER Corp. Ltd., Yuxi, 651100, China
4 Daye Nonferrous Metallurgical Ltd., Huangshi, 435000, China
* Corresponding Author: Xiaohui Zhang. Email:
Fluid Dynamics & Materials Processing 2025, 21(5), 1133-1150. https://doi.org/10.32604/fdmp.2025.061737
Received 02 December 2024; Accepted 11 February 2025; Issue published 30 May 2025
 View Full Text
 Download PDF
Abstract
In bottom-blown copper smelting processes, oxygen-enriched air is typically injected into the melt through a lance, generating bubbles that ascend and agitate the melt, enhancing mass, momentum, and heat transfer within the furnace. The melt’s viscosity, which varies across reaction stages, and the operating conditions influence bubble size and dynamics. This study investigates the interplay between melt viscosity and bubble diameter on bubble motion using numerical simulations and experiments. In particular, the volume of fluid (VOF) method and Ω-identification technique were employed to analyze bubble velocity, deformation, trajectories, and wake characteristics. The results showed that bubble ascent velocity increases with bubble size and decreases in viscosity, though viscosity variations minimally affect the maximum velocity. Larger bubbles or those in less viscous melts exhibit greater deformation. Bubbles ascend primarily in straight trajectories with minor lateral oscillations regardless of viscosity. In terms of wake dynamics, vortex sizes grow as viscosity decreases, with bottom-formed vortices expanding significantly with increasing bubble size, while lateral vortices are less influenced.Keywords
Oxygen-enriched air is typically introduced into a melt, through a lance to form bubbles in the bottom-blown copper smelting process. These bubbles entrain the surrounding fluid, enhancing the fluid dynamics within the pool. This process not only expands the area of active flow but also improves heat and mass transfer efficiency between the gas and liquid phases, thus intensifying the smelting reactions [1]. The study of gas-liquid two-phase flow within these melting pools is critical, as it not only elucidates the flow field characteristics but also increases production efficiency. Moreover, it provides a vital theoretical foundation for the design and enhancement of production equipment [2].
A considerable body of research has investigated the dynamics of bubble motion, yielding significant findings concerning path instability, bubble deformation and velocity [3,4]. Notably, the trajectory of bubble ascent has been extensively studied, revealing three primary patterns of movement: linear, zigzag, and spiral. The formation of these distinct paths is chiefly influenced by the viscosity of the liquid and the size of the bubbles. Zenit et al. [5] explored these varied ascent paths through simulations of bubbles in silicone oil solutions with differing viscosities. Similarly, Li et al. [6] employed the volume of fluid (VOF) method to numerically investigate the trajectories of bubbles rising in fluids of various viscosities. Their research demonstrated that bubbles in more viscous fluids tend to ascend in a linear trajectory, whereas those in media with intermediate viscosity exhibit an initial linear ascent followed by progressive oscillations, creating a zigzag pattern. In contrast, bubbles in low-viscosity fluids show more intense oscillations, resulting in a spiral trajectory. Furthermore, the initial size of the bubbles also affects their rising paths. Liu et al. [7] investigated the trajectories of bubbles with various diameters in an aqueous glycerol solution. Liu et al. [8] applied particle image velocimetry (PIV) to document the varied trajectories of different-sized bubbles. Their findings indicated that smaller bubbles typically rise linearly, whereas larger bubbles gradually transition to zigzag or spiral trajectories as their diameter increases.
In addition to influencing the rising trajectory, both fluid viscosity and bubble diameter significantly affect the shape and deformation rate of bubbles during their ascent. With variations in either fluid viscosity or bubble diameter, bubbles often exhibit different shapes and undergo distinct rates of deformation. Premlata et al. [9] utilized Gerris software to simulate bubbles of varying sizes in a fluid that experiences a linear increase in vertical viscosity, observing the formation of elongated skirts on both sides of the bubbles as the viscosity increased. Sharaf et al. [10] conducted comprehensive experiments using glycerol solutions of varying concentrations along with corresponding numerical simulations. The findings revealed that a reduced viscosity in the solution prompts a more rapid transition of bubbles from circular to elliptical shapes. Otha et al. [11] numerically investigated the effect of the gas-liquid viscosity ratio on the thickness of the skirt formed around bubbles, and reported that the skirt thickness increases with the viscosity ratio. Moreover, Tripathi et al. [12] employed numerical simulations to study bubble shapes in fluids with varying viscosities. Their analyses tracked bubble ascent and identified five distinct regions in the Ga-Eo phase diagram, each depicting different bubble shape transformations dictated by the fluid viscosity.
The transformation in bubble shape can be quantitatively assessed via the bubble aspect ratio, denoted as E. Xu et al. [13] examined the influence of bubble diameter on the terminal aspect ratio in immiscible fluid systems. Their findings indicated a decrease in the terminal aspect ratios of both layers, with the lower layer ratio being consistently lower than the upper layer ratio as the bubble diameter increased. Gao et al. [14] conducted experimental investigations into how the mean aspect ratio of bubble populations varies in fluids of different viscosities. They discovered that smaller bubbles are more likely to coalesce into larger bubbles as the fluid viscosity increases and that the fluctuations in the mean aspect ratio of these bubbles intensify with increasing bubble sizes. On the basis of these observations, they proposed a new Eo-Re correlation equation to predict bubble shapes via experimental data.
The variation in bubble rise speed due to changes in bubble diameter and fluid viscosity has been a key focus of research. When either the melt viscosity or bubble diameter varies, bubbles frequently exhibit differences in their maximum rise speed and trends in speed changes. Celata et al. [15] used a high-speed video camera to measure the rise velocity of bubbles in fluids of varying viscosities, identifying three distinct phases on the basis of dominant forces: viscous, surface tension, and inertial. Liu et al. [16] investigated the terminal velocities of different-sized bubbles in glycerol water, and reported that larger bubbles tended to reach higher terminal velocities. They also evaluated models for predicting these velocities. Tomiyama et al. [17] conducted experiments to investigate the terminal velocities of varying-sized bubbles in soap-enriched distilled water, and developed a theoretical model that predicts these velocities by accounting for size-related velocity variations at identical elevations. Zhang et al. [18] found that in diethyl phthalate solutions, the rise velocity of bubbles did not increase linearly with their diameter. Finally, Tian et al. [19] demonstrated experimentally that the bubble ascent rate in silicone oil increases significantly as the viscosity of the medium decreases.
Differences in the wake flow during bubble ascent often lead to different trajectories, and the wake evolution characteristics are closely related to the melt viscosity and bubble diameter. Yu et al. [20] conducted numerical investigations into vortex sheet formation within bubbles in silicone oil solutions at varying concentrations, and discovered that these formations are intricately linked to internal pressure gradients and external velocity fields. Cano-Lozano et al. [21,22] employed Gerris simulations to elucidate the relationships between bubble ascension paths and vortices, noting that deviations from linear to jagged trajectories can be attributed to asymmetric vortices on either side of the bubble. Furthermore, Biswas et al. [23] conducted experimental investigations into the effects of vortex rings on bubbles of varying sizes, and discovered that in less viscous solutions, the distance from the center of the vortex ring to the bubbles increases with bubble size. Similarly, Zhang et al. [24] numerically explored how a bubble’s rise path transitions from a zigzag to a spiral, demonstrating that this shift is driven by uneven vorticity accumulation on the bubble’s surface. Furthermore, they reported that larger bubbles exhibit a more pronounced disparity in vorticity accumulation, thereby increasing the likelihood of this zigzag-to-spiral path transition. Mirsandi et al. [25] numerically investigated how fluid viscosity influences the bubble tail vortex, revealing that a reduction in fluid viscosity strengthens the tail vortex, causing the bubble’s upward trajectory to deviate from a straight line. Finally, Yan et al. [26] used VOF simulations to assess the vortex dynamics of bubbles near a wall across varying viscosities and reported that a decrease in fluid viscosity exacerbates the periodic detachment of the bubble tail vortex, a phenomenon that is especially pronounced near the wall.
Previous studies have focused predominantly on the individual effects of bubble size or fluid viscosity on bubble motion characteristics, neglecting the synergistic impacts of these factors. This study aims to fill this gap by investigating the motion of bubbles of varying initial diameters within melts of different viscosities, offering a comprehensive analysis of how these combined factors influence the velocity, deformation, trajectory, and wake of the bubbles. To achieve this goal, we developed a mathematical-physical model to simulate the ascent dynamics of bubbles. Rigorous tests for mesh independence ensure the model’s reliability, and a thorough validation process confirms its accuracy. Our investigation focuses on several key aspects: we analyze how velocity changes, examine deformation patterns, and describe the trajectories and wake characteristics of rising bubbles across a spectrum of viscosities and bubble sizes.
2 Model Establishment and Validation
To eliminate wall effects during bubble ascent, the initial bubble position is set more than six diameters away from the sidewalls. The experimental model measures 500 mm in height and 200 mm in diameter, with a static melt height of 450 mm, with the geometric center of the bubble located 10 mm high and 100 mm from the sidewall, as shown in Fig. 1a. For enhanced precision in capturing the bubble’s rise, localized mesh refinement is employed within a rectangular zone extending 20 mm from the bubble’s central axis, covering its rising trajectory; this detailed mesh area is presented in Fig. 1b.
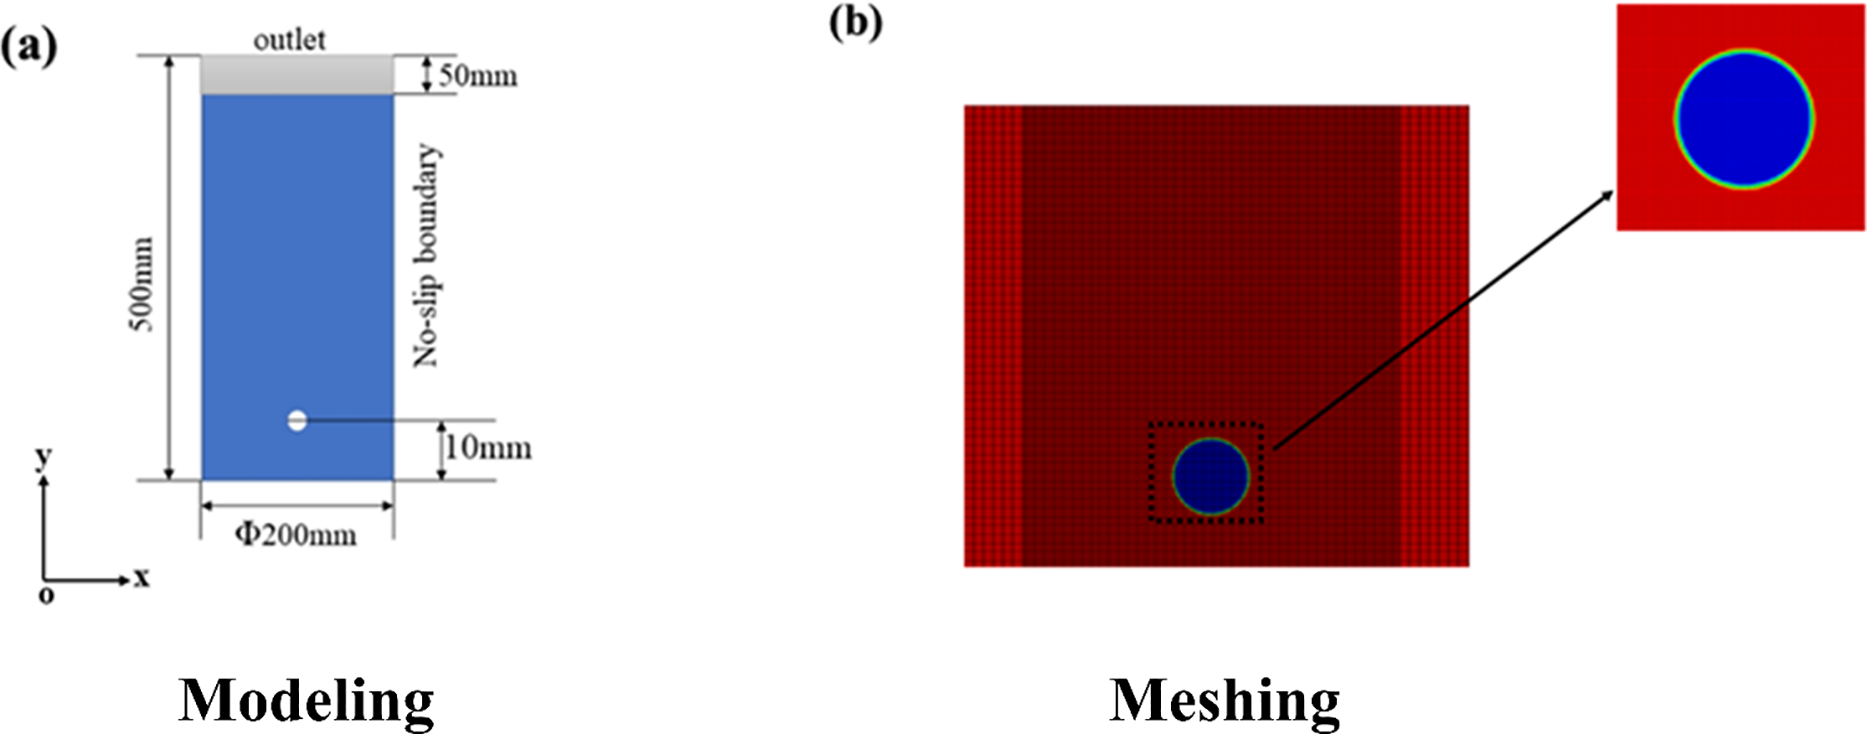
Figure 1: Modeling and meshing
The volume of fluid (VOF) method is adopted to simulate fluid dynamics involving two or more distinct phases. This technique enhances precision by solving shared momentum equations and meticulously tracking each phase’s volume fraction throughout the computational domain. Its efficacy is particularly notable in accurately and speedily capturing gas-liquid interfaces. In this model, the momentum equations are unified for all fluids, while the volume fraction of each fluid is continuously monitored within each mesh cell. The gas and liquid phases are governed by the conservation laws of continuity and momentum, as detailed in Eqs. (1) and (2) [27–31]:
where
2.2.2 Vortex Identification Method
In this study, we utilize the
where
The range of
2.3 Computational Setup and Mesh Independence Validation
In this study, the computational fluid dynamics (CFD) software Fluent is employed to simulate the rising process of bubbles. The turbulence model used in this study is the standard k-ε model. For the coupled pressure-velocity calculations, the PISO algorithm is used, and the pressure solution is performed via the PRESTIO! algorithm. The outlet is set as a pressure outlet, the wall is a no-slip solid boundary, and the time step is 1 × 10⁻⁵ s.
To ensure that the mesh count does not influence the computational results while optimizing the calculation time, six different mesh configurations were generated via ICEM mesh software. Identical operating conditions were applied across these configurations to simulate the bubble movement process. The simulations tracked velocity changes and shape transformations to verify mesh independence. The specific computational conditions used for verifying grid independence include the following: the initial diameter of the bubble is 4 mm, the viscosity of the melt is 0.001 Pa/s, the density of the melt is 998.2 kg/m3, the surface tension coefficient is 0.073, and the independence validation is carried out for the six different sets of meshes, as shown in Table 1.
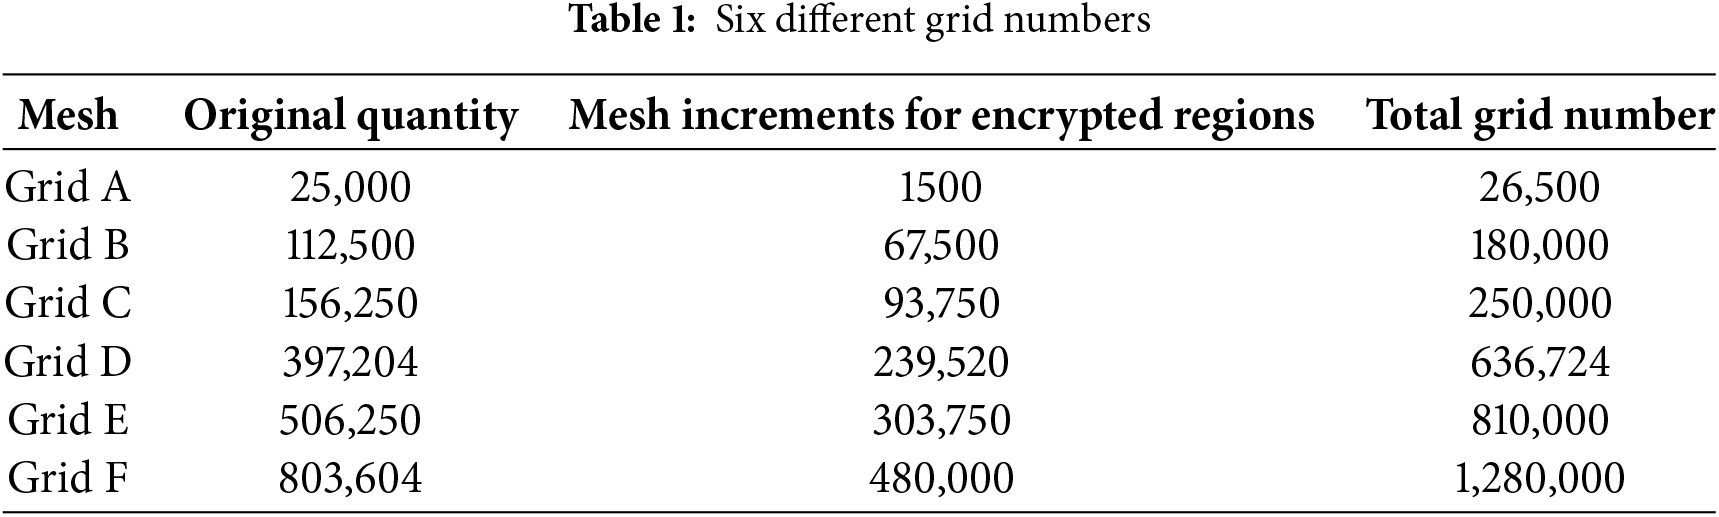
Fig. 2 illustrates the velocity and aspect ratio variations of the rising bubble across six grid densities (refer to Section 3.1.2 for the aspect ratio calculation formula). Here, the trends in both the bubble velocity and the aspect ratio under grids C, D, E, and F are notably similar, particularly for the bubbles near the liquid surface. Given this consistency, grid D is selected for subsequent calculations in this study.
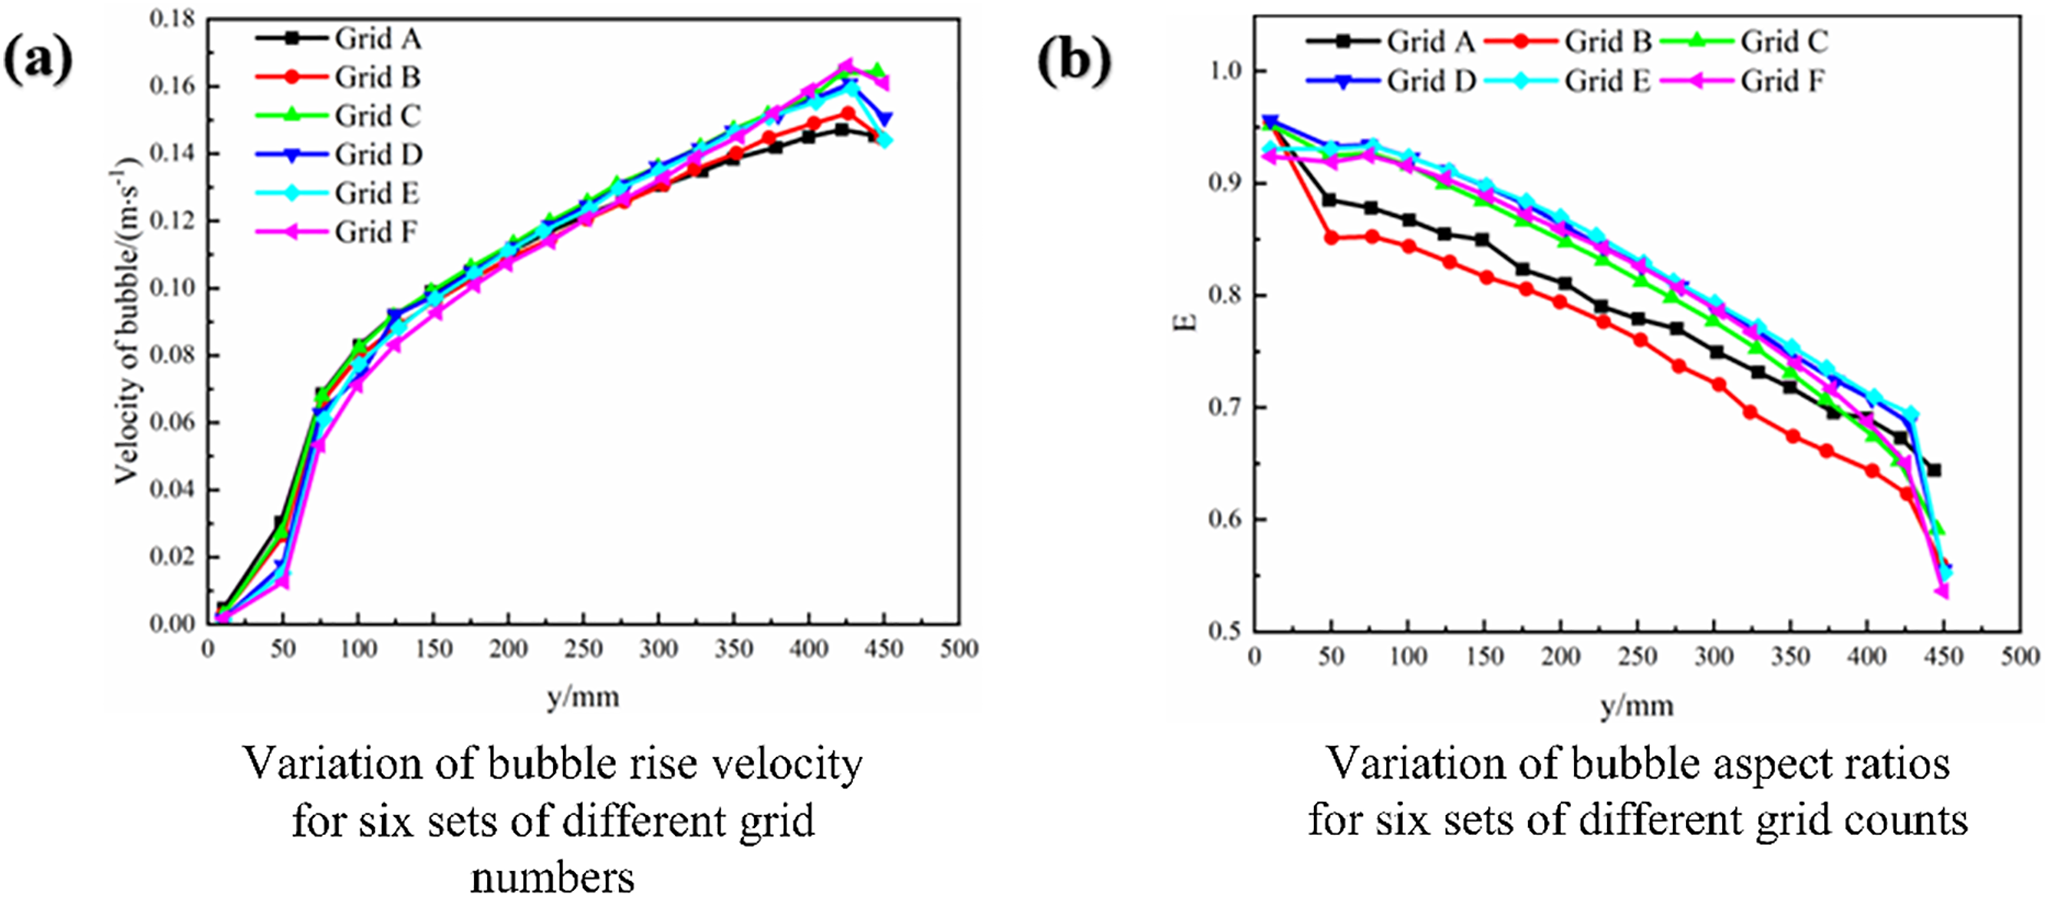
Figure 2: The velocity and aspect ratio of bubbles under different grid numbers
2.4 Computational Model Validation
To ensure the reliability of the computational model, we adopted the experimental setup and parameter settings detailed by Kong et al. [33] for our numerical simulations. We constructed a corresponding water model test rig, as depicted in Fig. 3. This setup comprises an air pump, an air flowmeter, a bottom-blown molten pool experimental bench, a nozzle, a supplemental light source, a high-speed video camera, and a data acquisition and image analysis system.
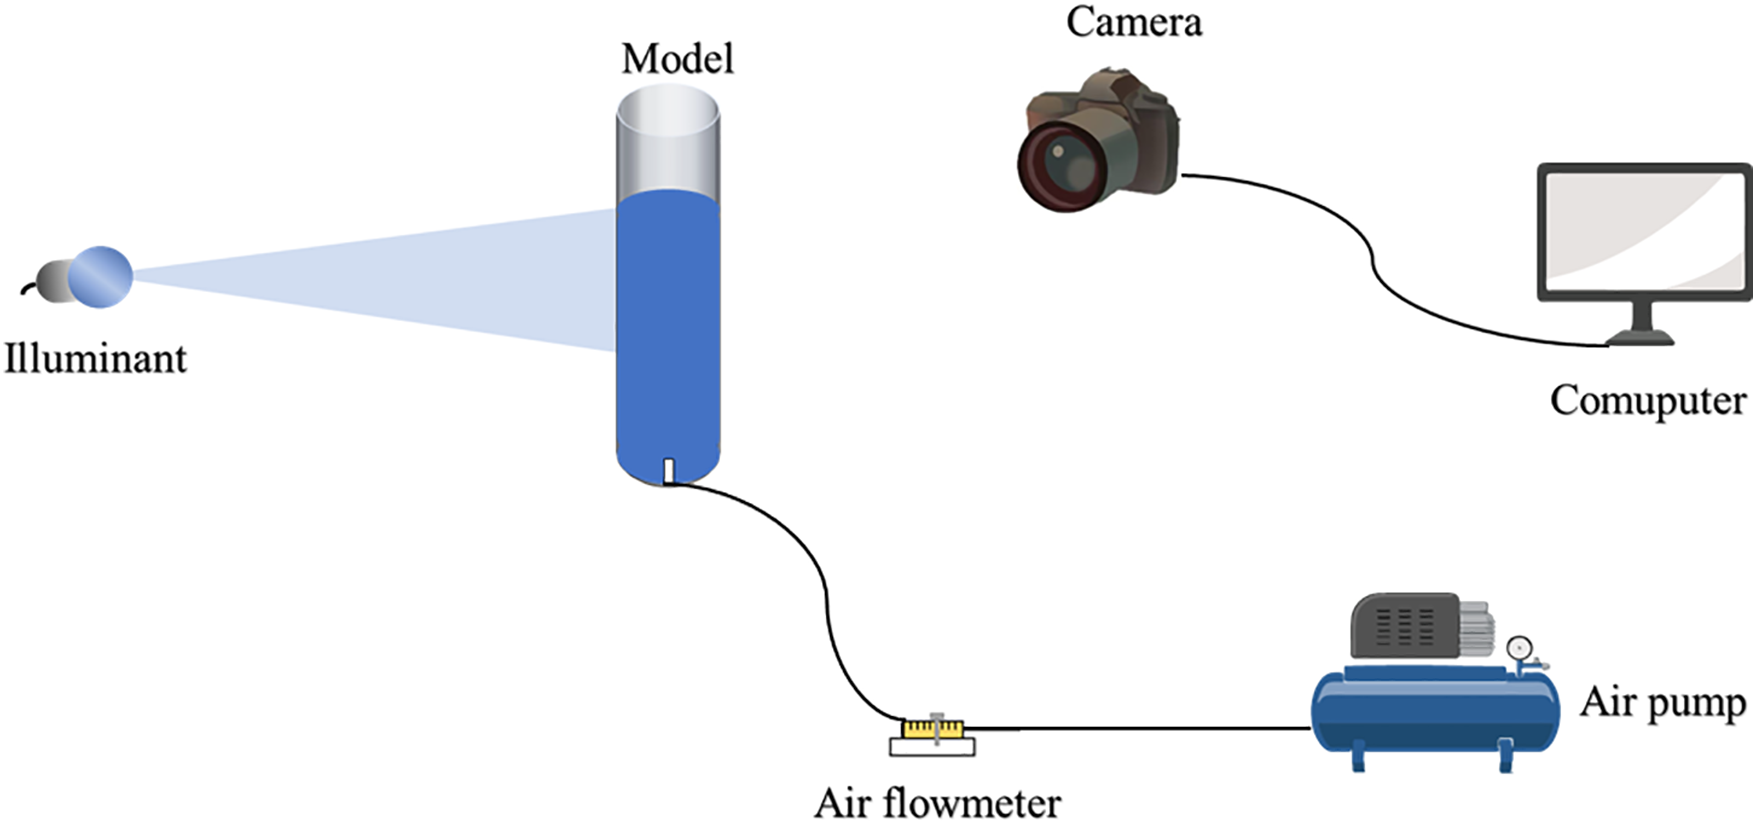
Figure 3: The experiment process diagram
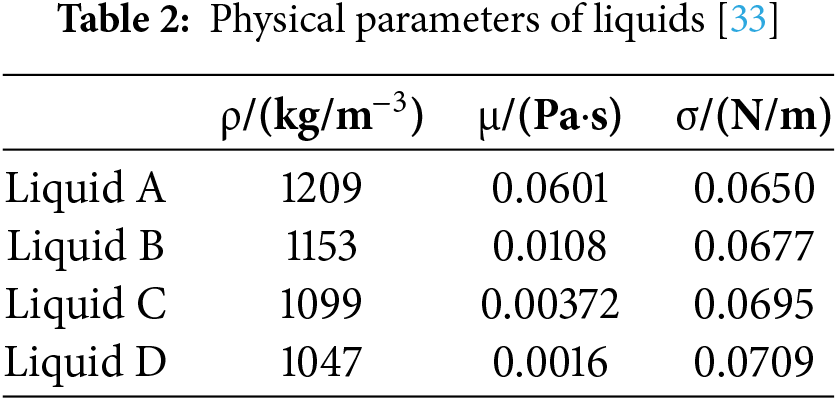
Glycerol–water solutions at concentrations of 80%, 60%, 40%, and 20% were prepared as per protocols outlined in the literature [33]. Table 2 presents the essential physical parameters of these four solutions. The ascent time for a 6 mm bubble to reach the surface in each of the solutions was meticulously recorded. Additionally, the shapes of the bubbles at heights of 100, 200, and 300 mm within Liquid A were captured and compared between experimental observations and numerical simulations to evaluate consistency and model accuracy.
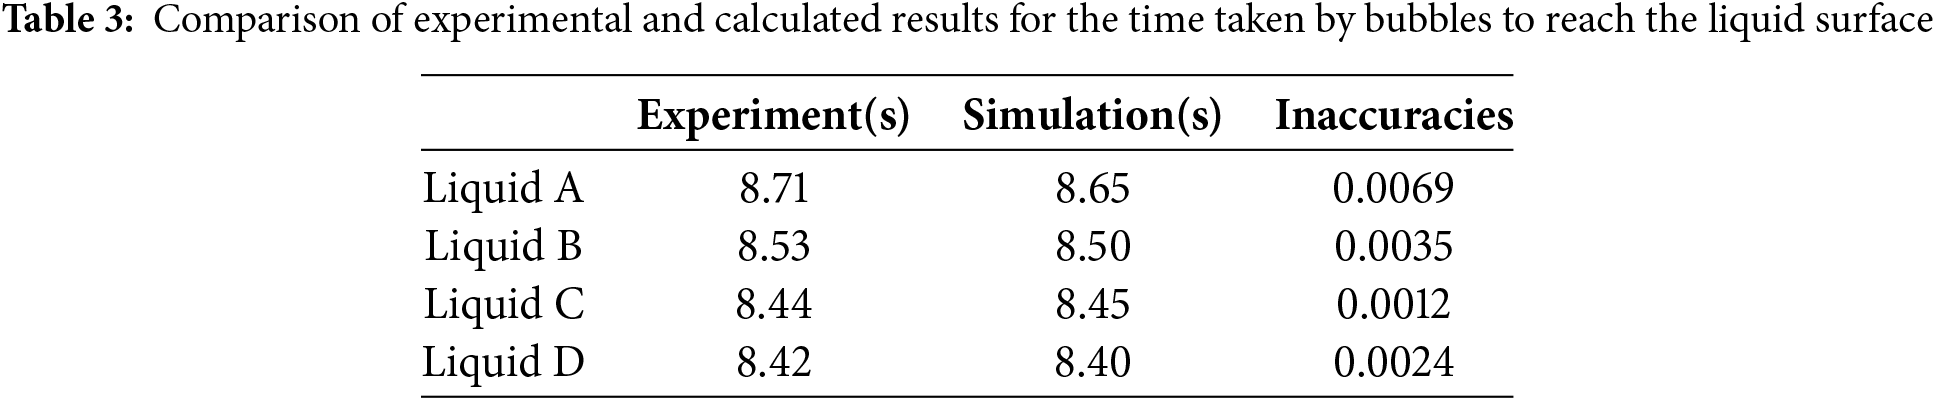
The ascent times of the bubbles through four different concentrations of glycerol–water solutions are detailed in Table 3. Analysis of these data reveals that the discrepancy between the experimental and simulated times for the bubbles to reach the liquid surface is within a marginal error of 1%. This demonstrates the high accuracy and reliability of both the experimental approach and the simulation model.
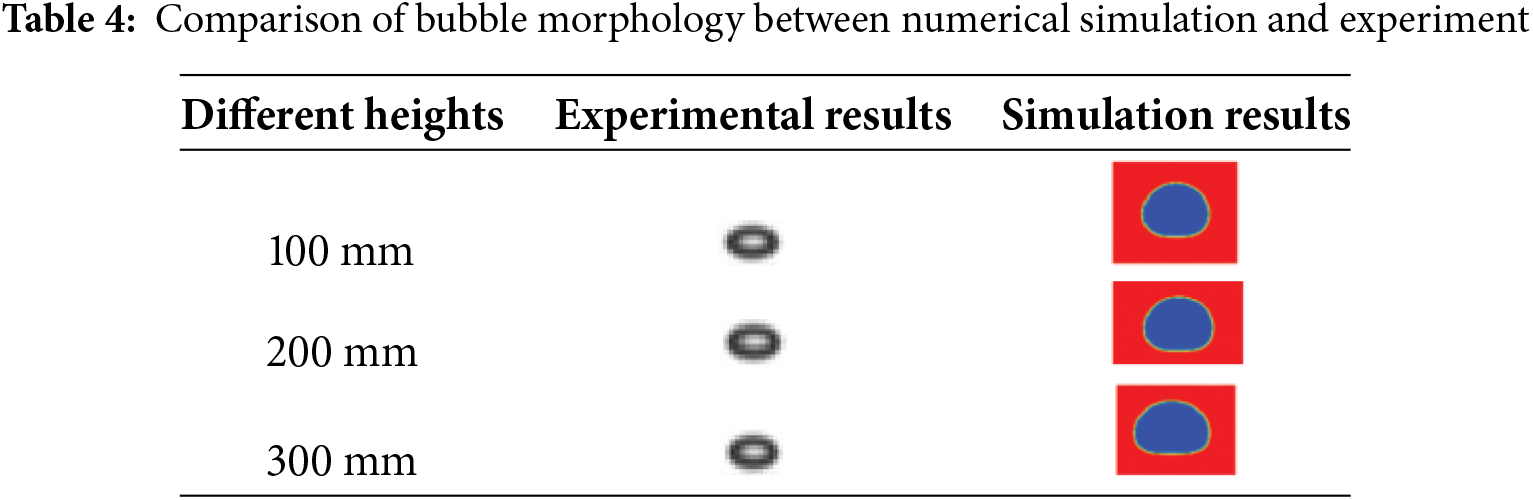
As shown in Table 4, the phase diagrams of bubbles from numerical simulations at three distinct heights closely correspond with the experimental observations made at equivalent heights. Furthermore, the bubble morphology changes observed in the simulations follow the same pattern as those documented experimentally. The consistency between the simulated and experimental times for the bubbles to reach the liquid surface, along with the minimal error margin, indicates a high degree of reliability in the computational model used in this study.
In this section, we comprehensively analyze how variations in fluid properties and bubble diameters impact multiple facets of the bubble rise process, including changes in velocity, alterations in shape, trajectory patterns, and wake characteristics.
3.1 Velocity Change Characteristics
3.1.1 Change in the Rate of Ascent
This study examines the ascent of bubbles with varying diameters in diverse fluid environments. The specifications of the fluid physical properties are detailed in Table 2, and the initial bubble diameters considered are 4, 6, and 8 mm, which are consistent with the parameters in reference [33].
Fig. 4 shows the velocity profiles of bubbles as they ascend through four different fluids. The velocity trends for bubbles of varying diameters remain consistent across all four fluids. Throughout their ascent, the bubbles initially show an increasing velocity as they move from the starting point toward the gas-liquid interface. However, the acceleration rate decreases in the early stages of ascent. The velocity of the bubbles near the gas-liquid interface sharply increases, reaching a maximum when the bubble upper surface approaches close to the interface. Subsequently, there is a rapid deceleration in bubble velocity as the ascent continues, culminating in bubble breakage.
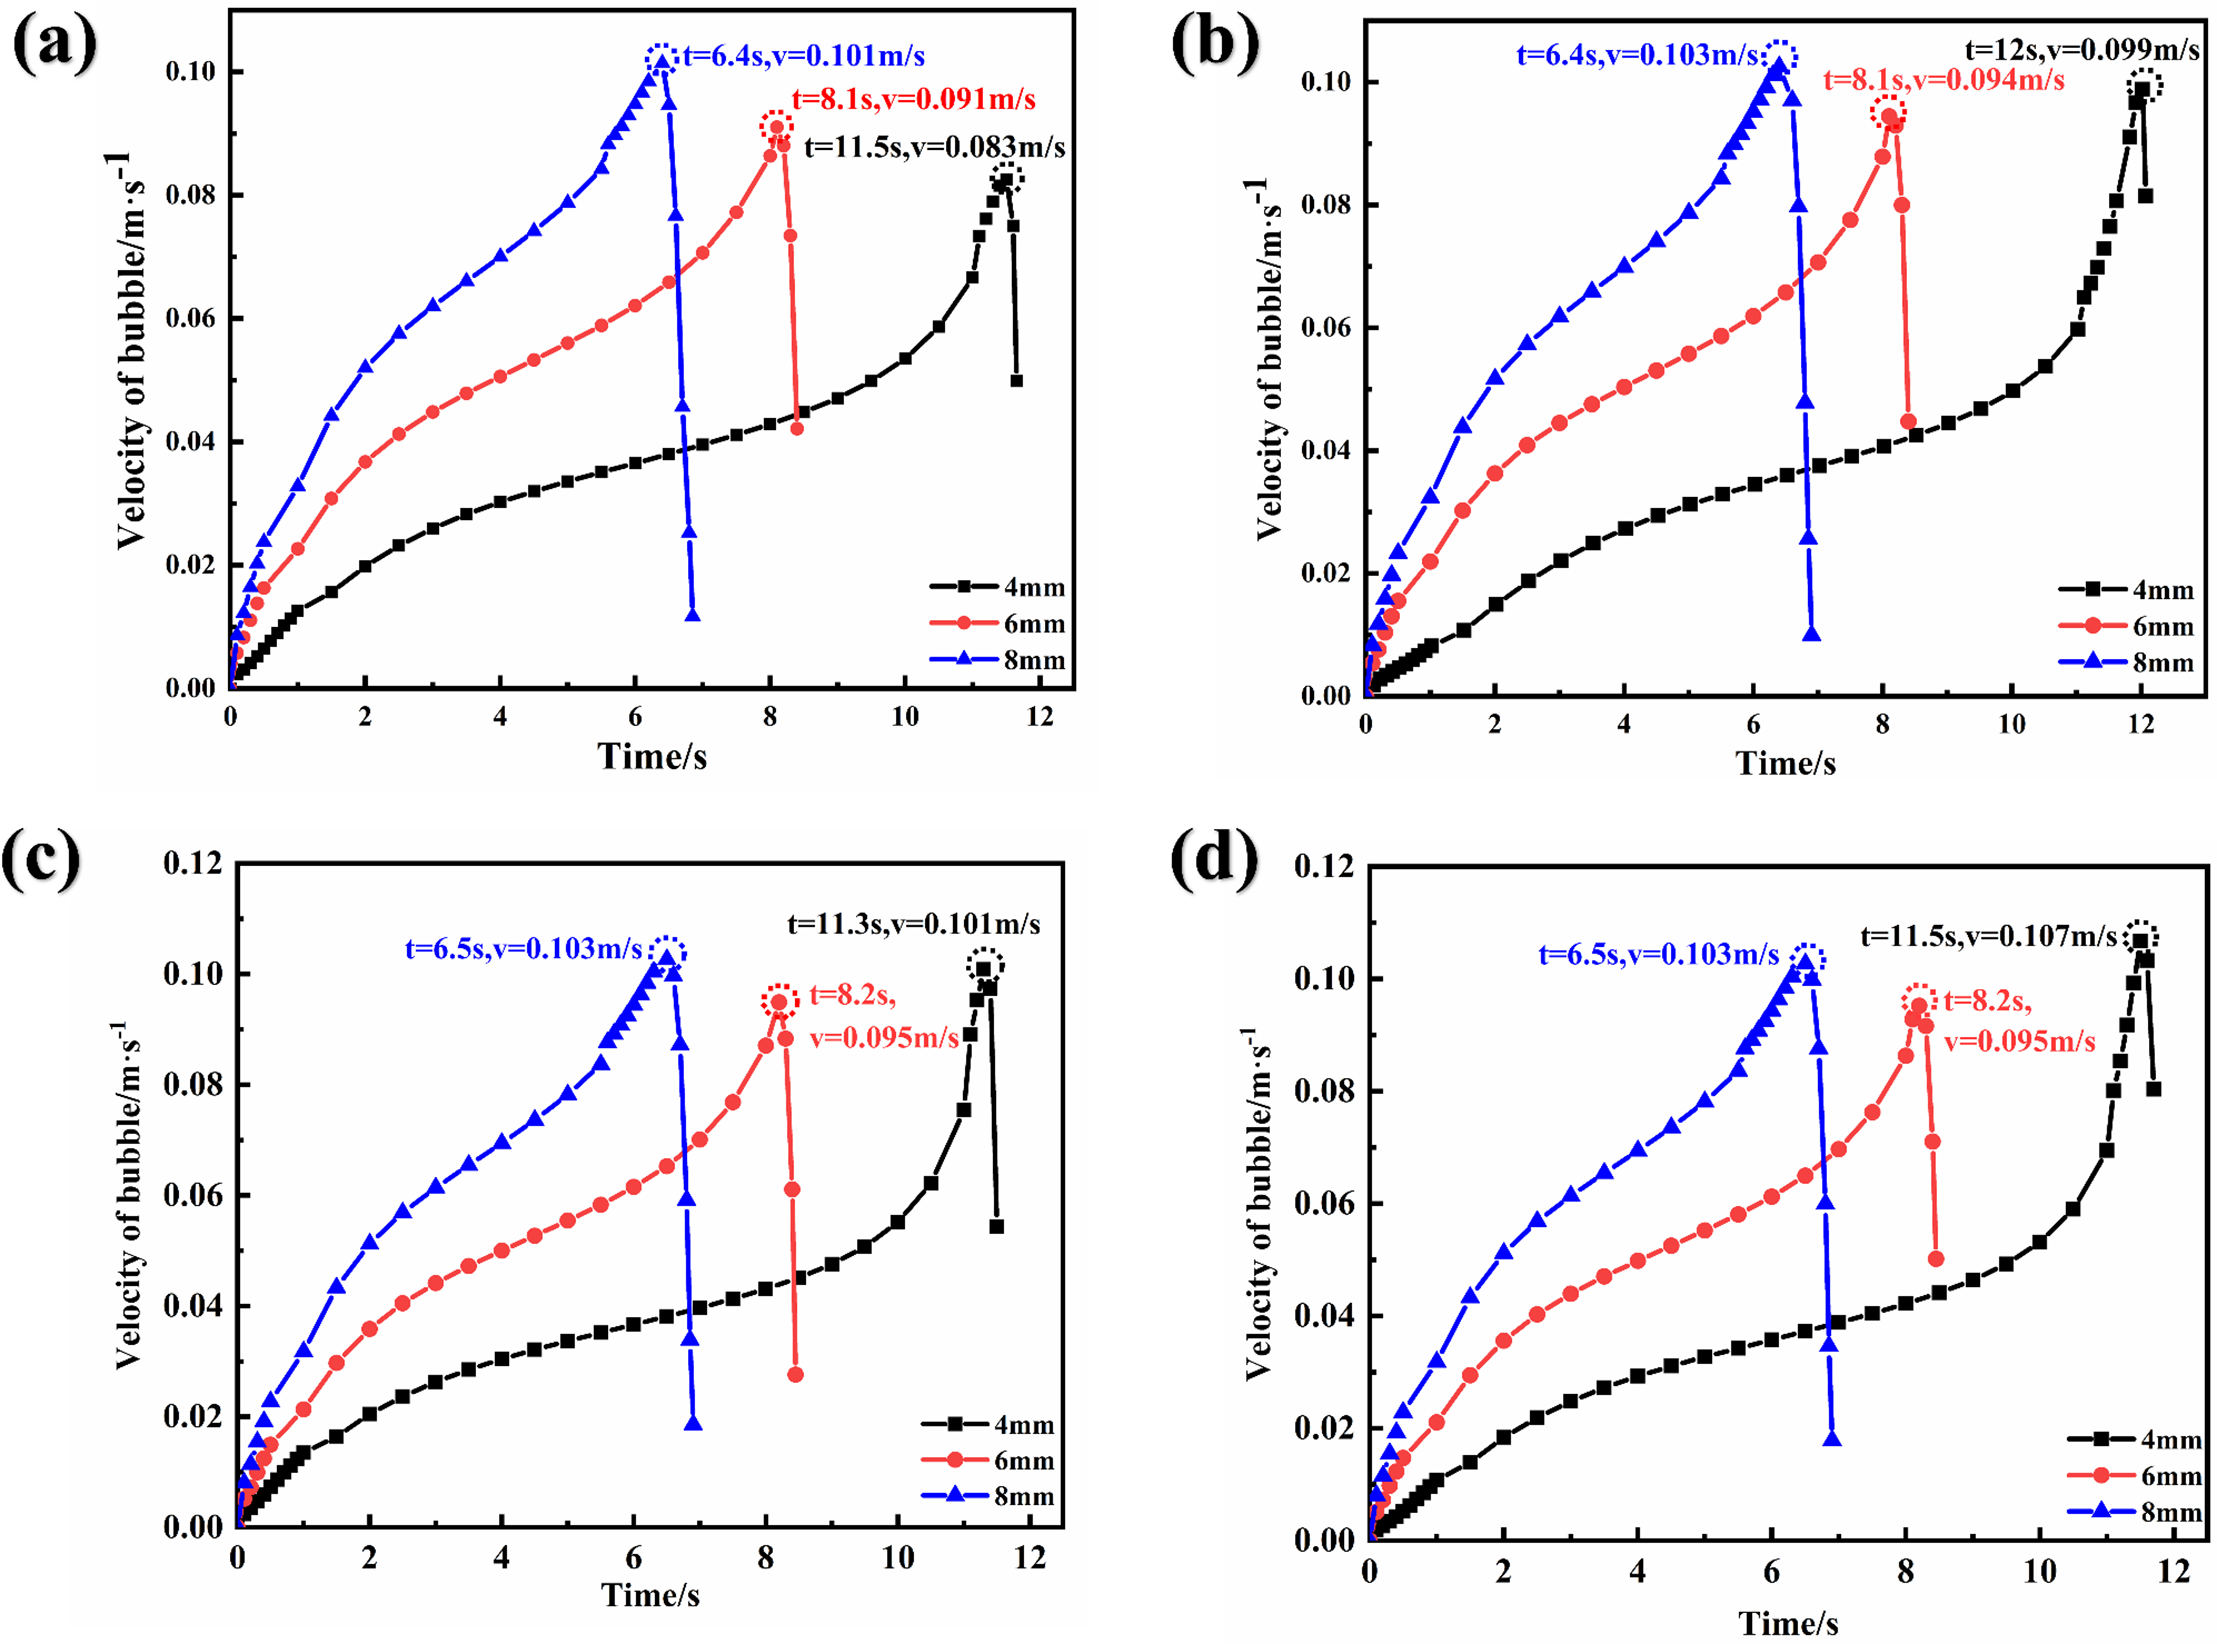
Figure 4: The velocity of bubbles with different initial diameters in different liquids. (a), (b), (c) and (d) represent single bubbles in Liquids A, B, C, D
Fig. 4 shows that within the same fluid, bubbles with larger diameters reach higher maximum velocities more quickly than smaller bubbles do. Specifically, in Fluid A (presented in Fig. 4a), bubbles with diameters of 4, 6, and 8 mm achieve maximum velocities of 0.083, 0.091, and 0.101 m/s, respectively, with the times to reach these velocities being 11.5, 8.1, and 6.4 s, respectively.
The aspect ratio E [34] is introduced to accurately quantify the deformation of the bubble, and the aspect ratio E is expressed as:
where
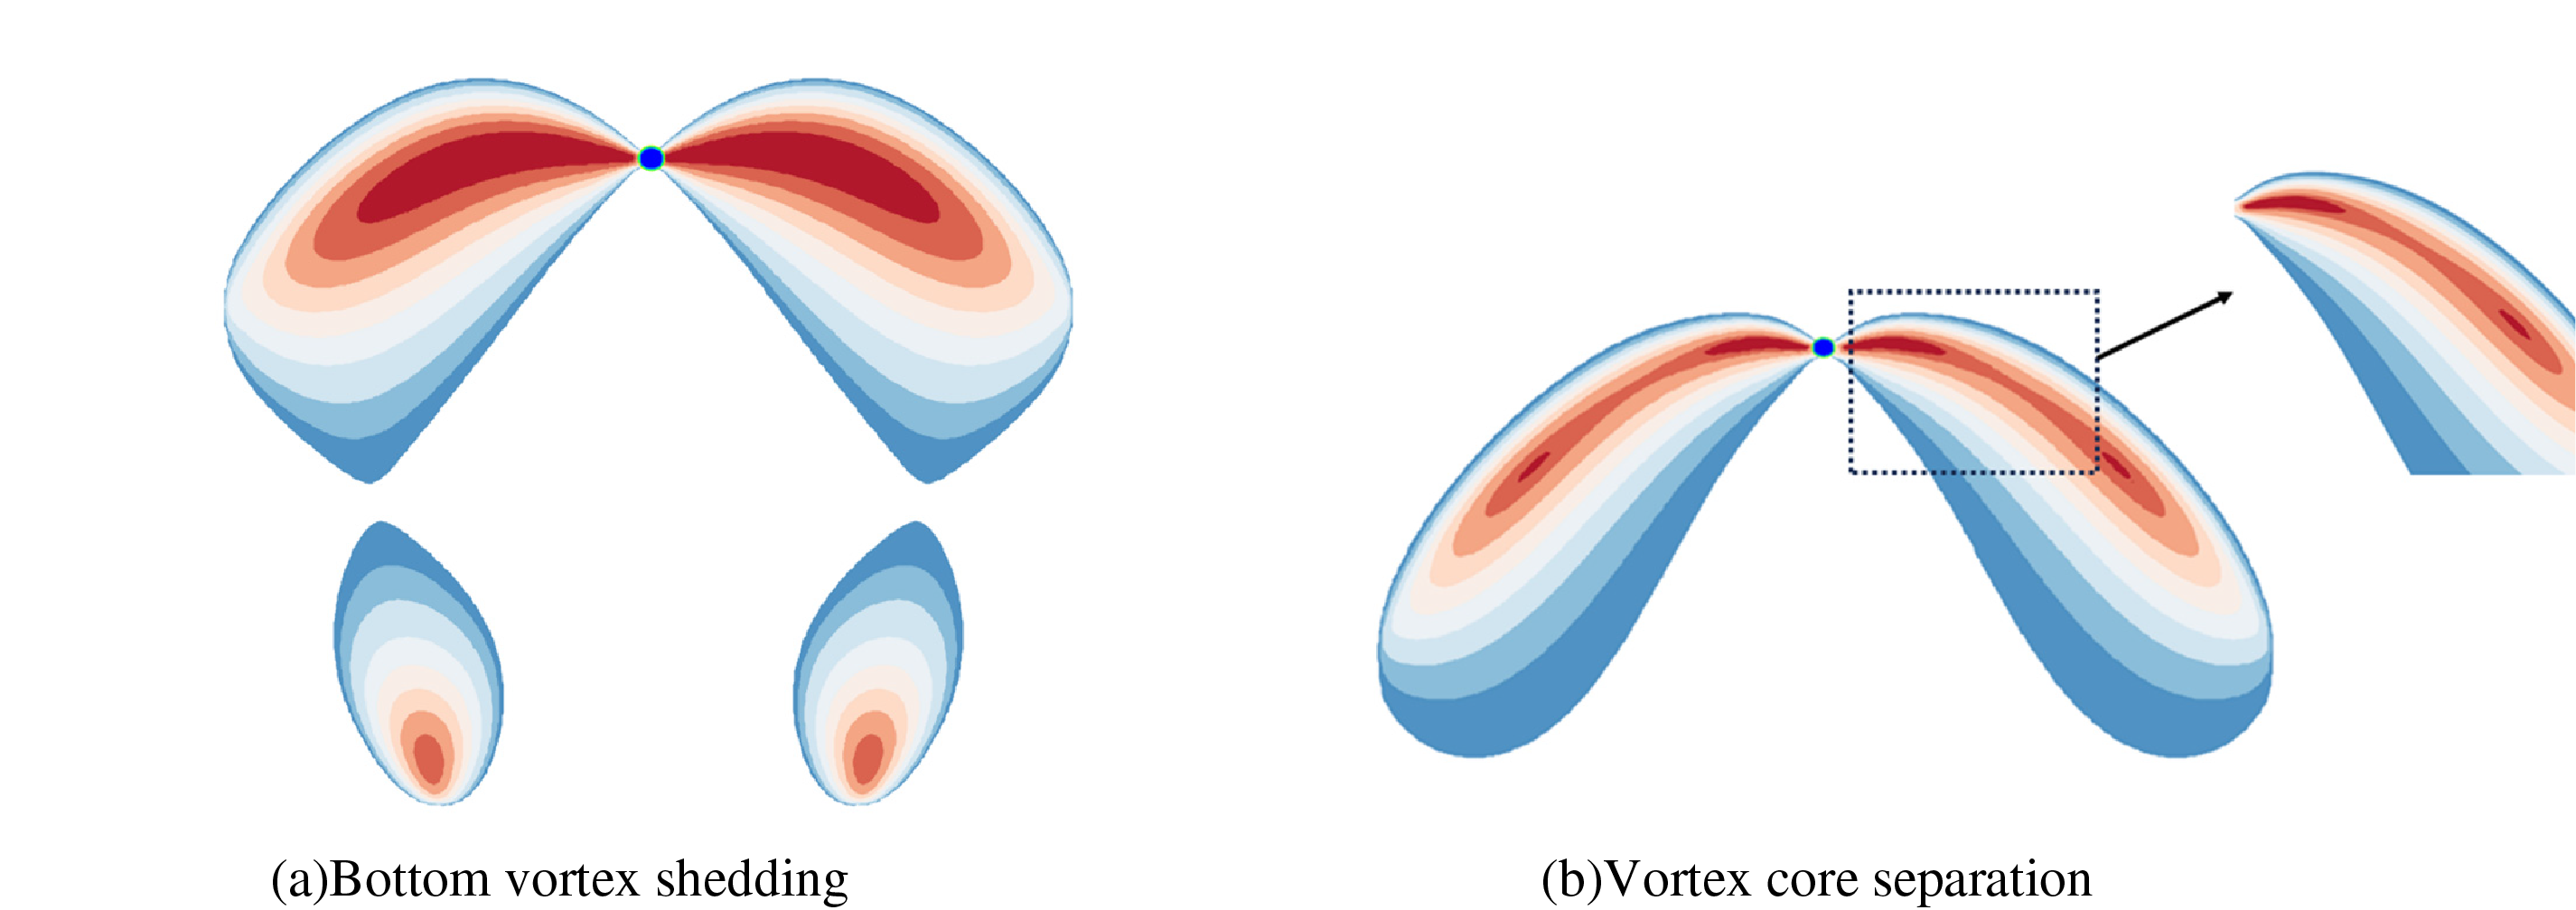
Figure 5: Schematic diagram of the values of the longitudinal and transverse lengths of the bubbles
Fig. 6 delineates the changes in E for bubbles across four different melts during their ascent. The figure highlights a consistent pattern across all the scenarios: initially, the aspect ratio rapidly decreases, hitting a very small value at approximately 0.5 s; thereafter, it slightly increases and maintains stability for an extended period before finally diminishing swiftly as the bubbles approach the surface of the melt.
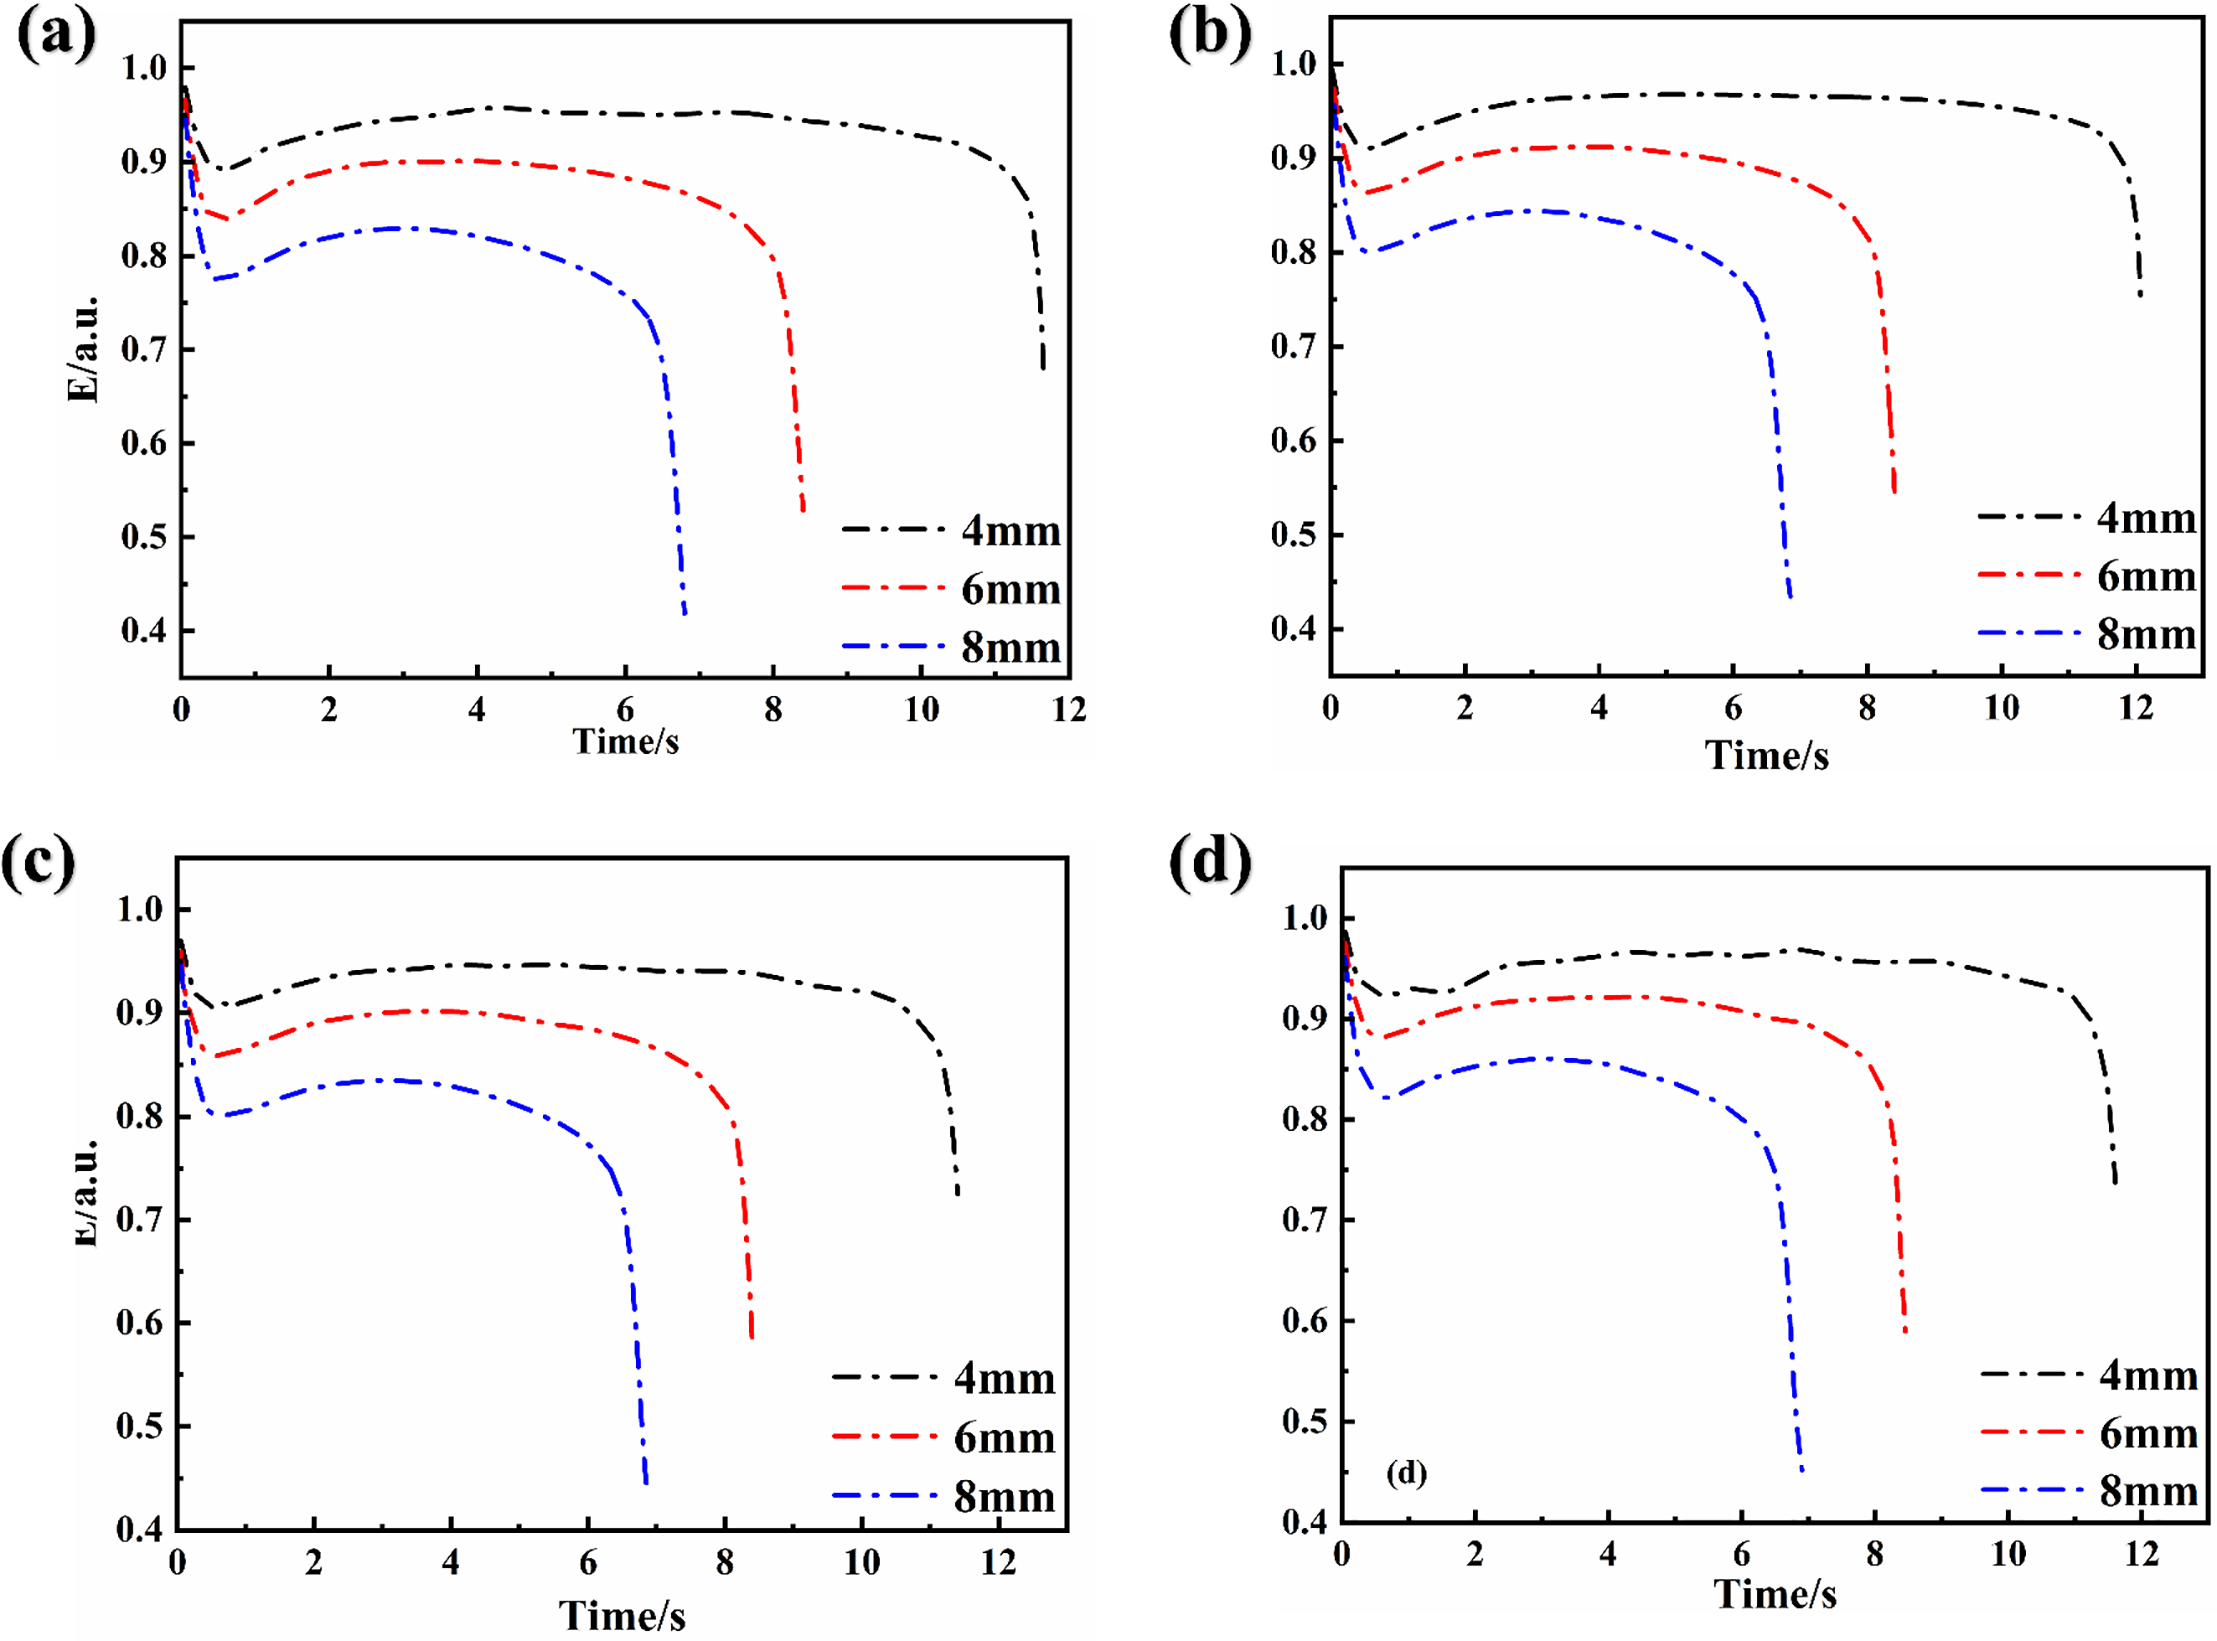
Figure 6: The aspect ratio with different initial diameters in different liquids. (a), (b), (c) and (d) represent single bubbles in Liquids A, B, C, and D, respectively
This dynamic in E is driven primarily by variations in bubble forces. In the initial phase, as the bubble starts to ascend, an inertial force strives to maintain it in a static state, whereas buoyancy propels it upward. The interplay between these forces creates a pressure differential between the upper and lower surfaces of the bubble, causing it to compress and resulting in a sharp decrease in the aspect ratio. As the forces achieve dynamic equilibrium, the aspect ratio stabilizes. Near the melt surface, however, the bubble’s upper surface encounters constraints due to surface tension, whereas the lower part continues to be driven upward by buoyancy. This imbalance forces the bubble into an elliptical shape and leads to a rapid reduction in the aspect ratio, culminating in the bubble’s collapse.
In the same melt, the larger the diameter of the bubble is, the more drastic the change in the aspect ratio during the rise, and the more it deviates from 1. Taking Fig. 6a as an example, the aspect ratios of bubbles with diameters of 4, 6, and 8 mm were 0.8998, 0.8410, and 0.7790, respectively, at 0.5 s. As the bubble size increased, buoyancy also increased, increasing the upward momentum during bubble ascent. This increase in buoyancy increases the impact on the rising bubble, whereas the influence of surface tension diminishes, consequently increasing the susceptibility of the bubble to deformation. Simultaneously, a larger bubble encounters greater resistance and shear forces during its rise, resulting in more pronounced changes in the aspect ratio throughout the ascent.
Fig. 7 illustrates how the aspect ratio of a 6 mm diameter bubble varies in different fluids. At the 0.5-s mark, the aspect ratios are 0.8410 for Liquid A, 0.8619 for Liquid B, 0.8727 for Liquid C, and 0.8832 for Liquid D. Throughout the subsequent ascent, these bubbles largely maintain these ratios. Notably, fluids with lower viscosities correspond to smaller aspect ratios.
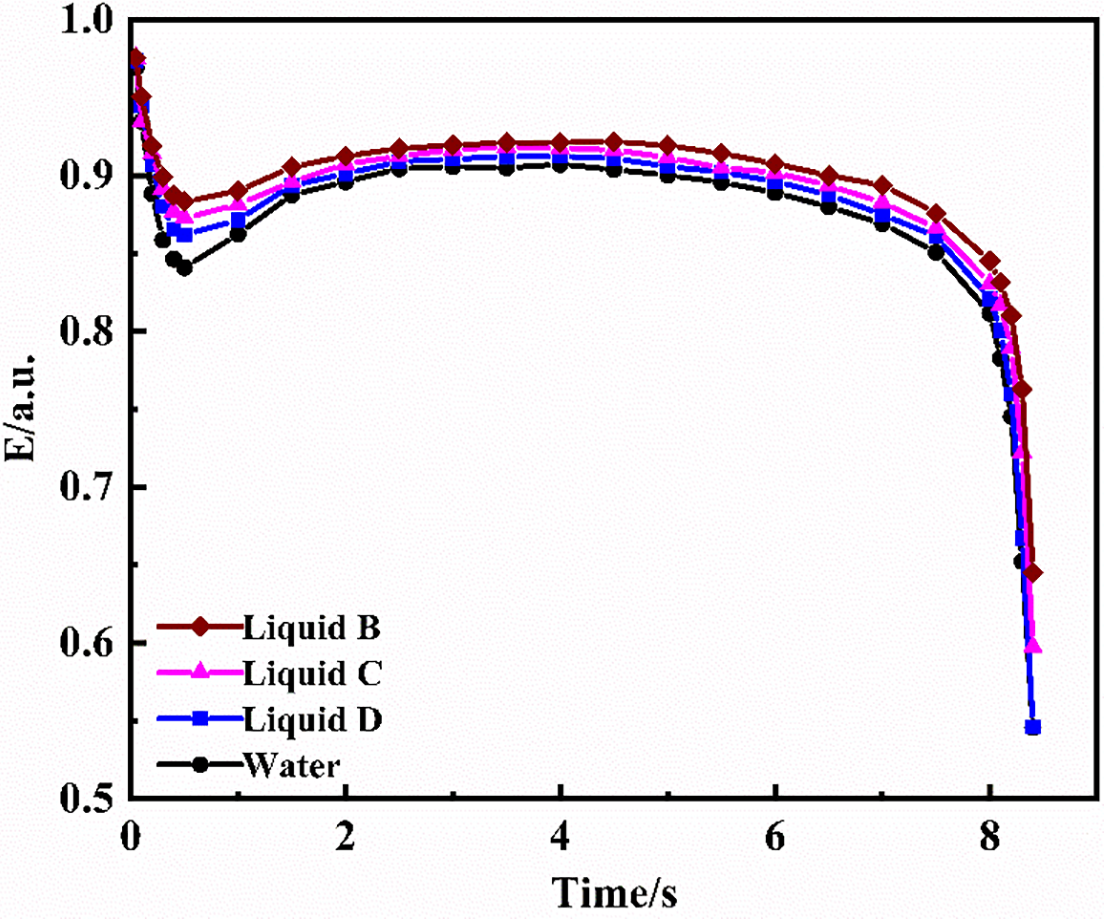
Figure 7: Variation of aspect ratio of 6 mm bubbles in different fluids
Fig. 8 presents the transformation in shape contours of bubbles at different ascent heights, illustrating that the bubbles morph from circular to elliptical and ultimately adopt a cap-shaped configuration. The depiction clarifies that larger bubbles demonstrate more pronounced deformations during ascent. This trend underscores a key dynamic: smaller-diameter bubbles are less prone to deformation, and exhibit greater stability throughout the rise.
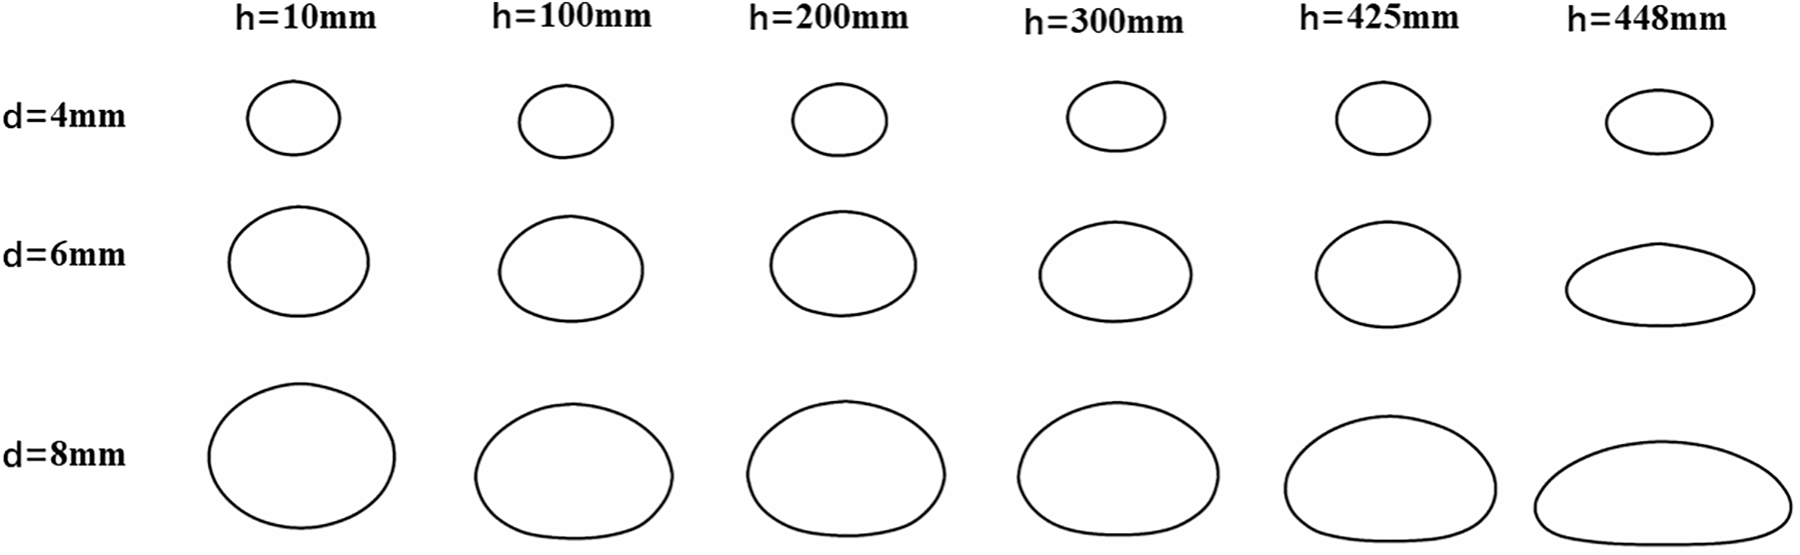
Figure 8: The shape changes of single bubbles with different diameters
3.1.3 Trajectory Characteristics
Bubbles frequently exhibit pulsations in the horizontal direction as they ascend, playing a crucial role in enhancing the homogeneity of the melt components and the temperature distribution within the melt pool. This section delves into the trajectory characteristics of bubbles during their ascent, focusing on the horizontal velocity Vx and horizontal displacement change x.
Fig. 9 shows the variations in the horizontal velocity Vx and the x-coordinates of the center of a 6 mm diameter bubble during its ascent in Liquids A, B, C, and D (corresponding to Fig. 9a–d, respectively). The trajectory of the bubble’s center (blue line) and the changes in the radial-phase velocity (black line) are depicted. Analysis of these plots reveals that the movement of the bubble from the center relative to the central axis resembles a sinusoidal pattern characterized by alternating peaks and valleys.
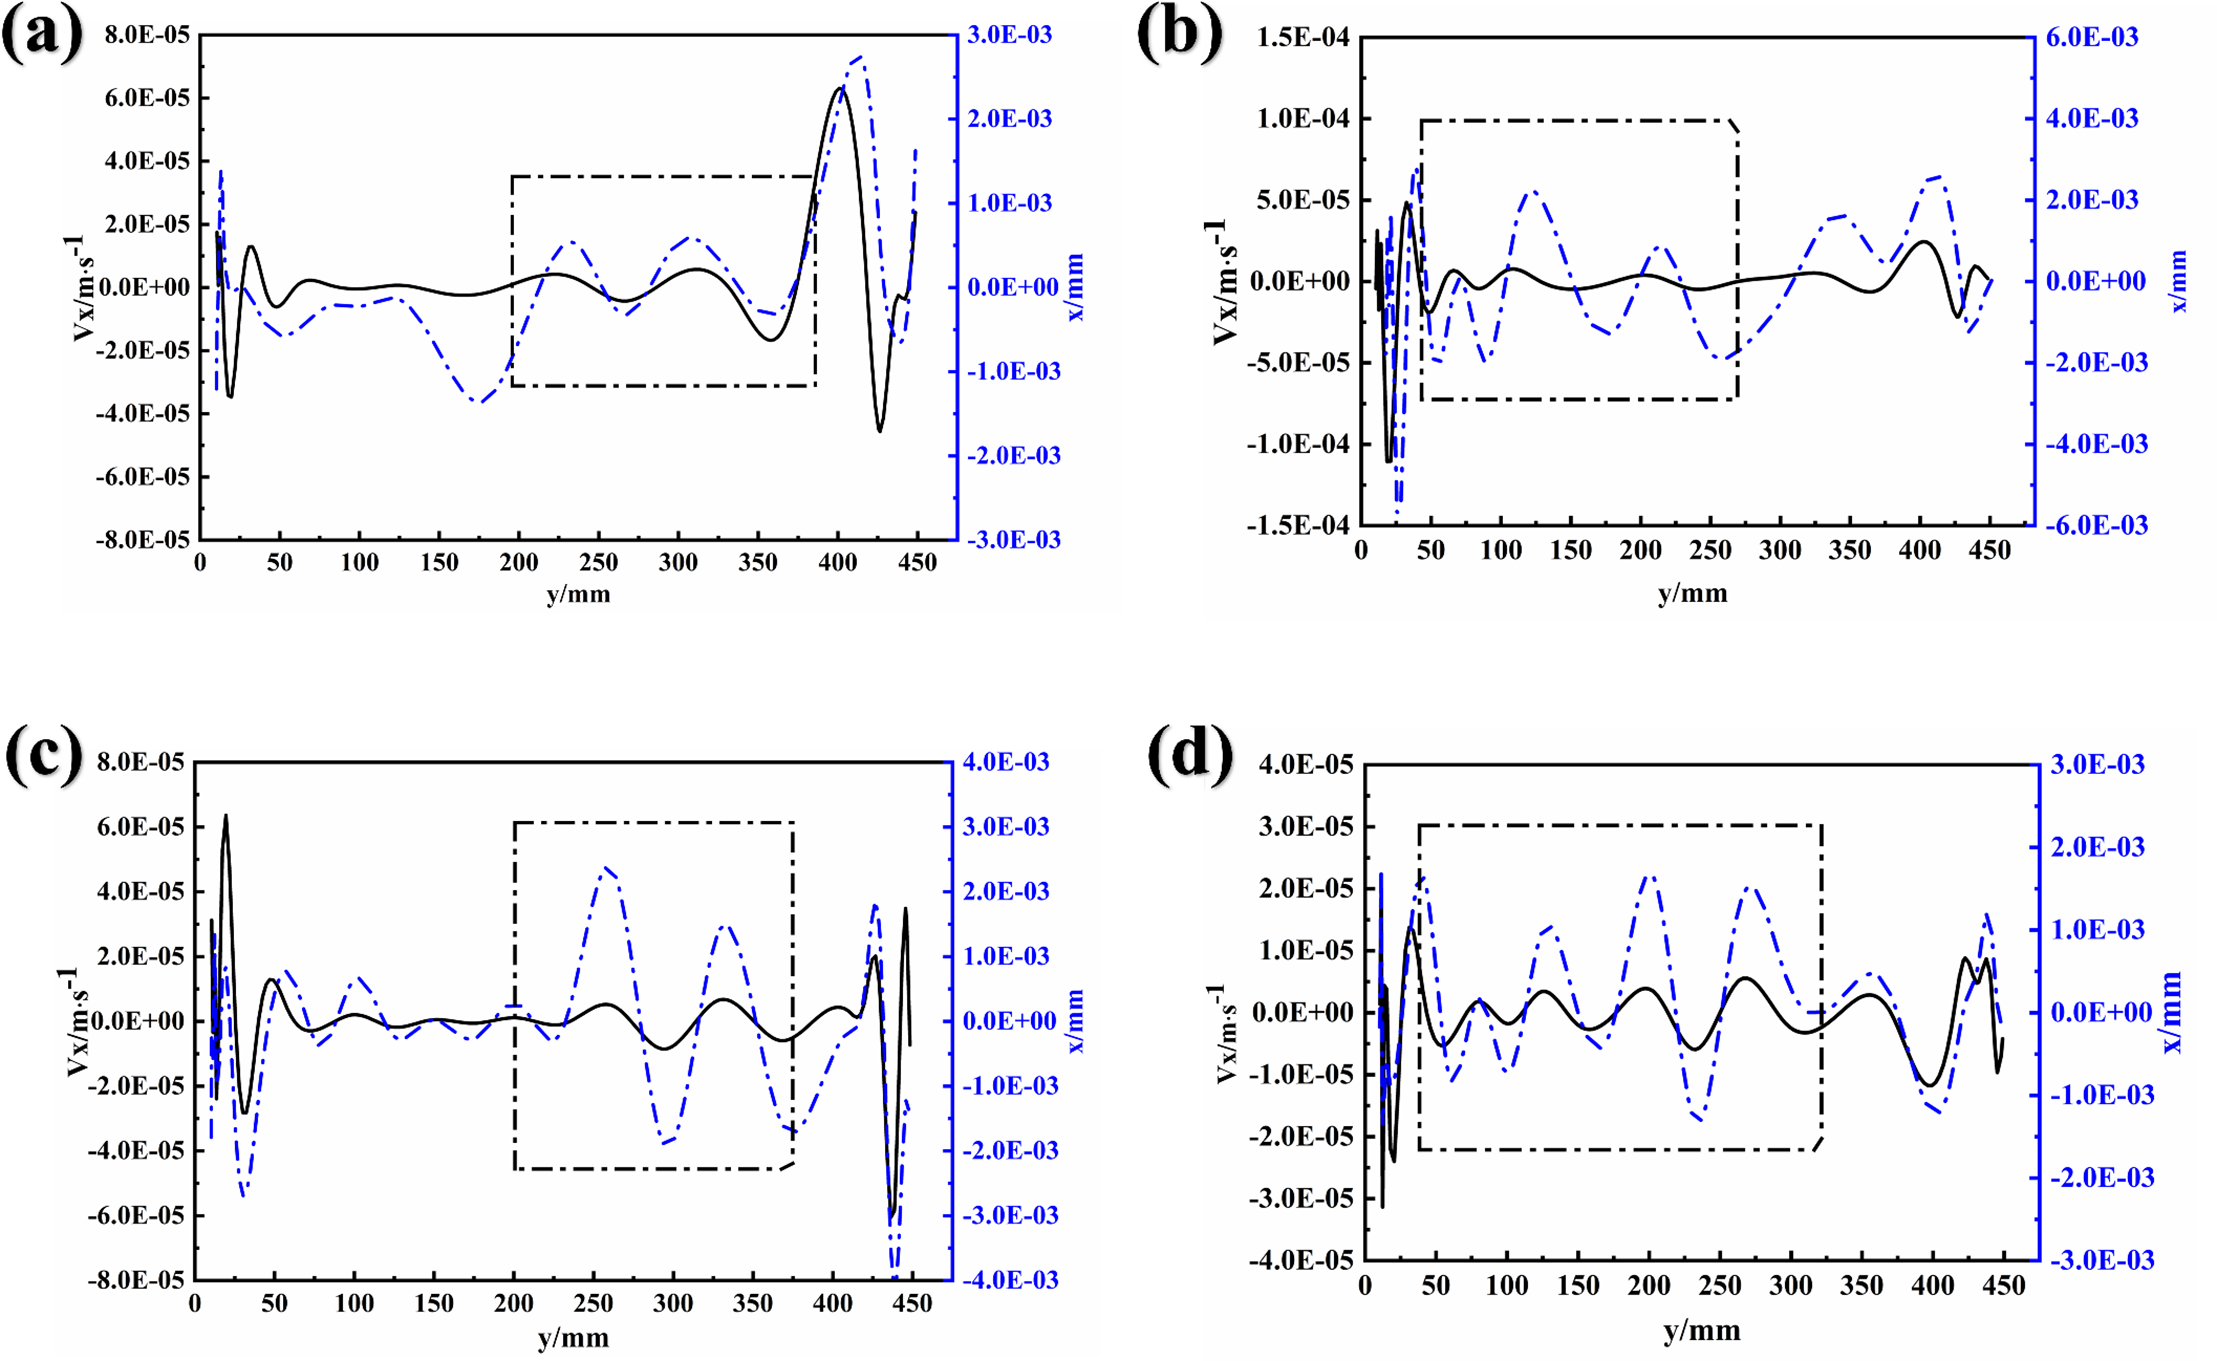
Figure 9: The horizontal movement speed (Vx) of a bubble and its horizontal displacement change with the rising height. In the figure, (a), (b), (c) and (d) represent single bubble in Liquids A, B, C and D, respectively.
As the fluid viscosity decreases, the fluctuation frequency of the bubble’s radial velocity clearly increases during ascent. This trend suggests that lower viscosity fluids facilitate more pronounced horizontal pulsations in the rising bubble. Despite these fluctuations, the overall horizontal displacement and velocity remain minor, on the order of 10−5 to 10−3. Consequently, these deviations are considered negligible, so the trajectory of the 6-mm diameter bubble in various fluids appears essentially straight.
The maximum horizontal offsets observed for the 4 mm diameter bubbles in Liquids A, B, C, and D are 0.0021, 0.0035, 0.0043, and 0.0051 mm, respectively. Similarly, for bubbles with an 8 mm diameter, the offsets are 0.0035, 0.0044, 0.0051, and 0.0061 mm in Liquids A, B, C, and D, respectively. Given these minimal deviations, it is reasonable to conclude that the rising trajectories of bubbles of all three diameters in all four liquids are straight lines.
During the ascent of a bubble, a tail vortex is formed, which enhances the fluid mixing uniformity. This paper examines tail vortices via the prevalent Q and Ω methods, with a case study of a 6 mm diameter bubble rising to 250 mm in Liquid D. Fig. 10 displays the vortices identified via both methods. Although the vortex shapes are consistent between the two methods, the Ω method reveals more detailed information. Unlike the Q criterion, which is highly sensitive to threshold values without a standardized selection methodology, the Ω method is less sensitive to these values. Specifically, variations in the Ω threshold from 0.52 to 0.65 do not significantly alter the identified vortex structures.
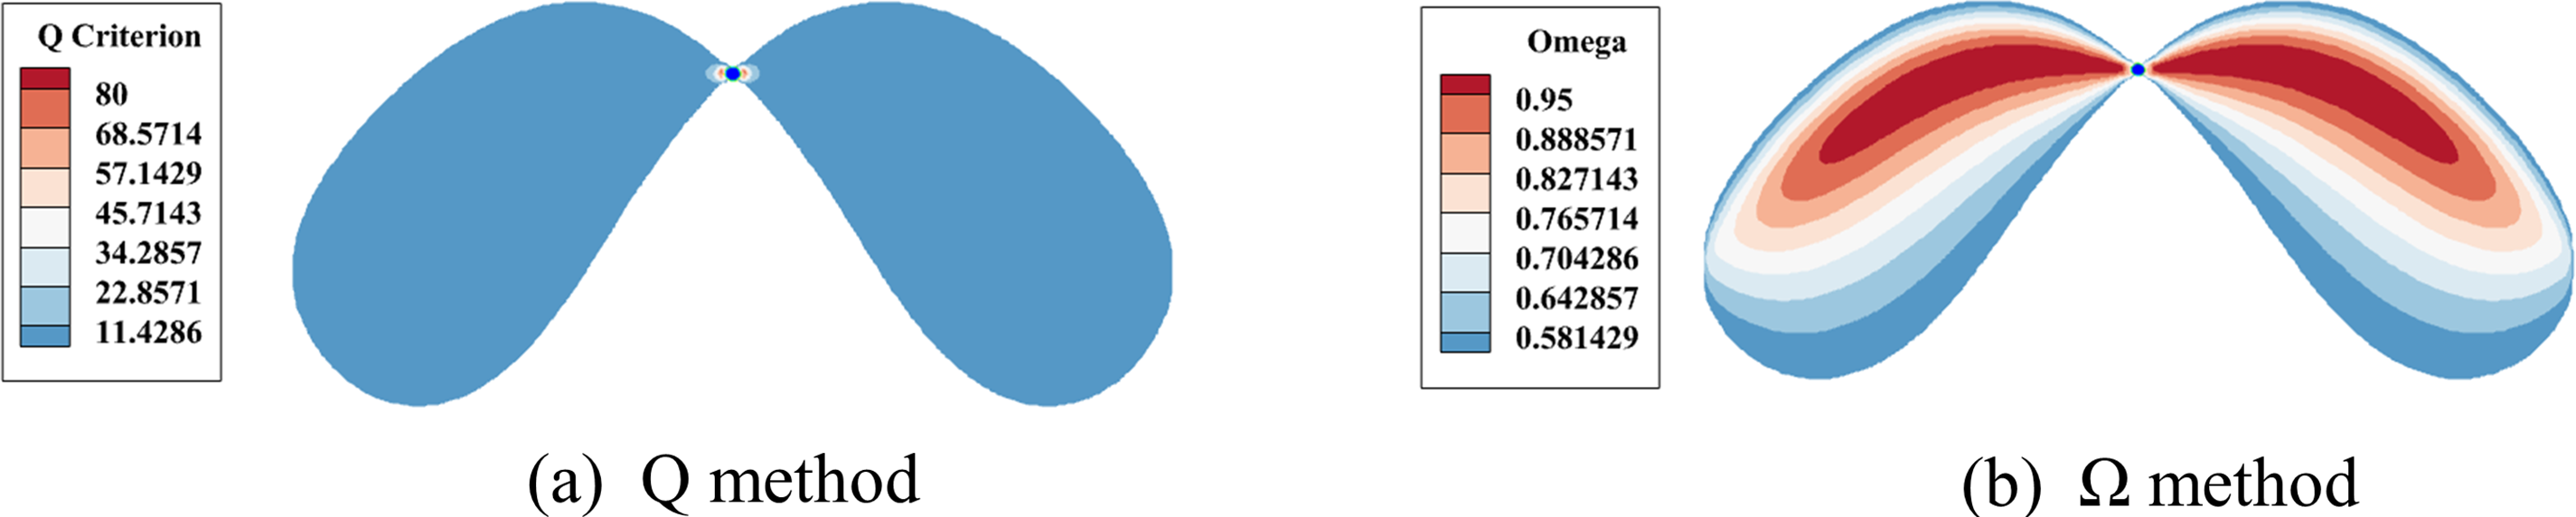
Figure 10: The vortex identification methods reconstruct the single bubble wake
In this study, the Ω identification method is employed to analyze the tail vortices of bubbles. Following Liu’s guidelines [32], we choose a threshold of Ω = 0.52 to define the presence of a vortex.
Fig. 11 shows the vortex patterns of a 6 mm-diameter bubble as it rises to a height of 110 mm in the four fluids. The diagram reveals that the tail flow generated in fluids emanates laterally from the sides of the bubble and extends rearward, forming a left-right symmetric structure resembling a “thin slice.” The intensities of the tail flows are identical on both sides. Notably, as the fluid viscosity decreases, the intensity of the vortex at the bottom increases.
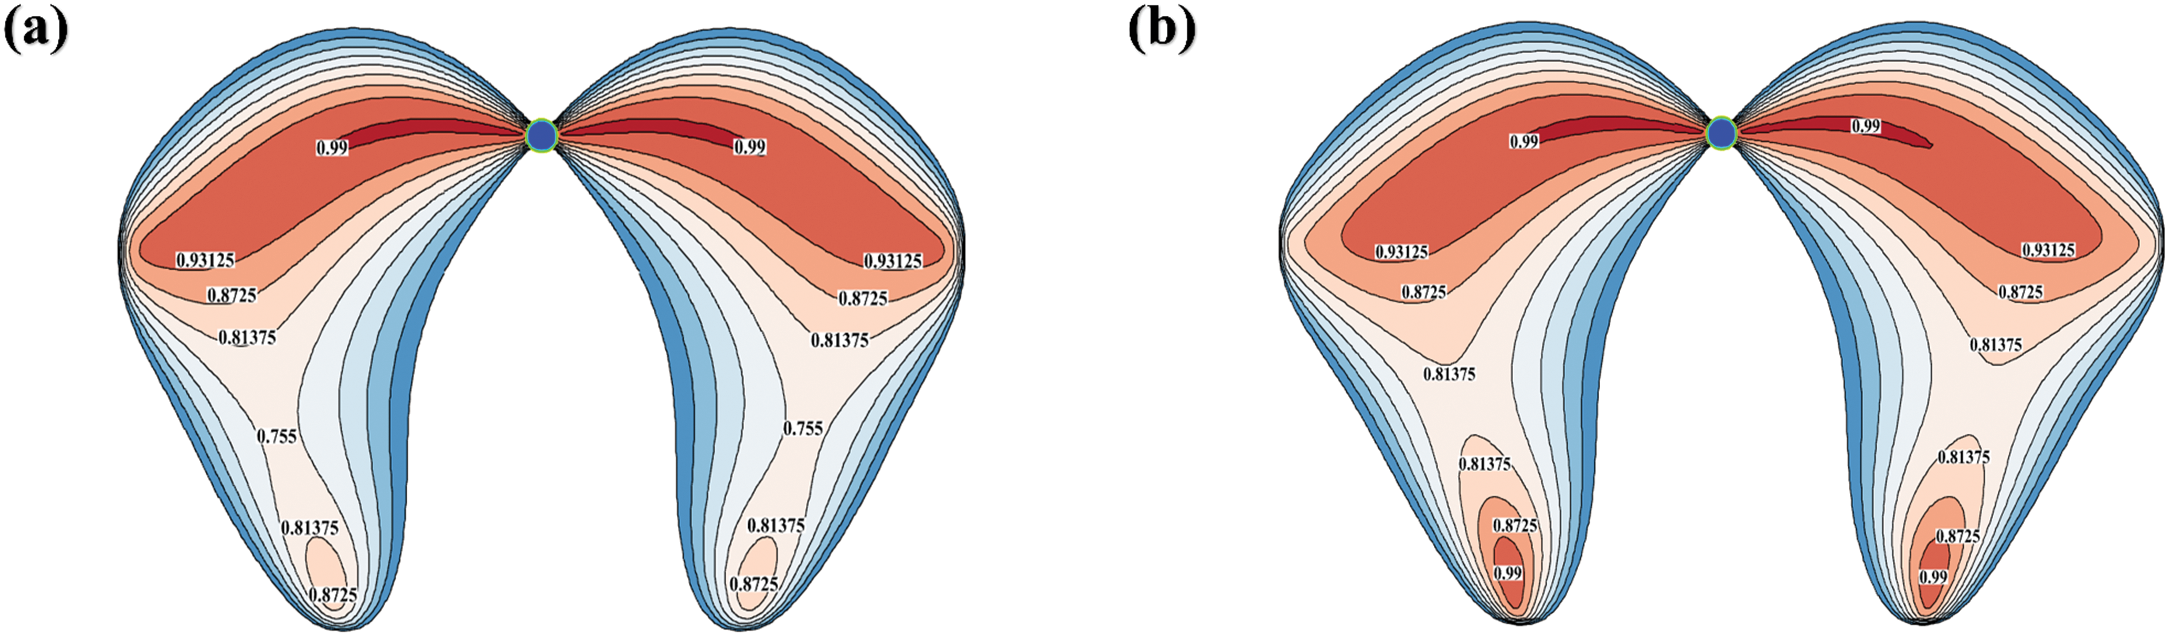
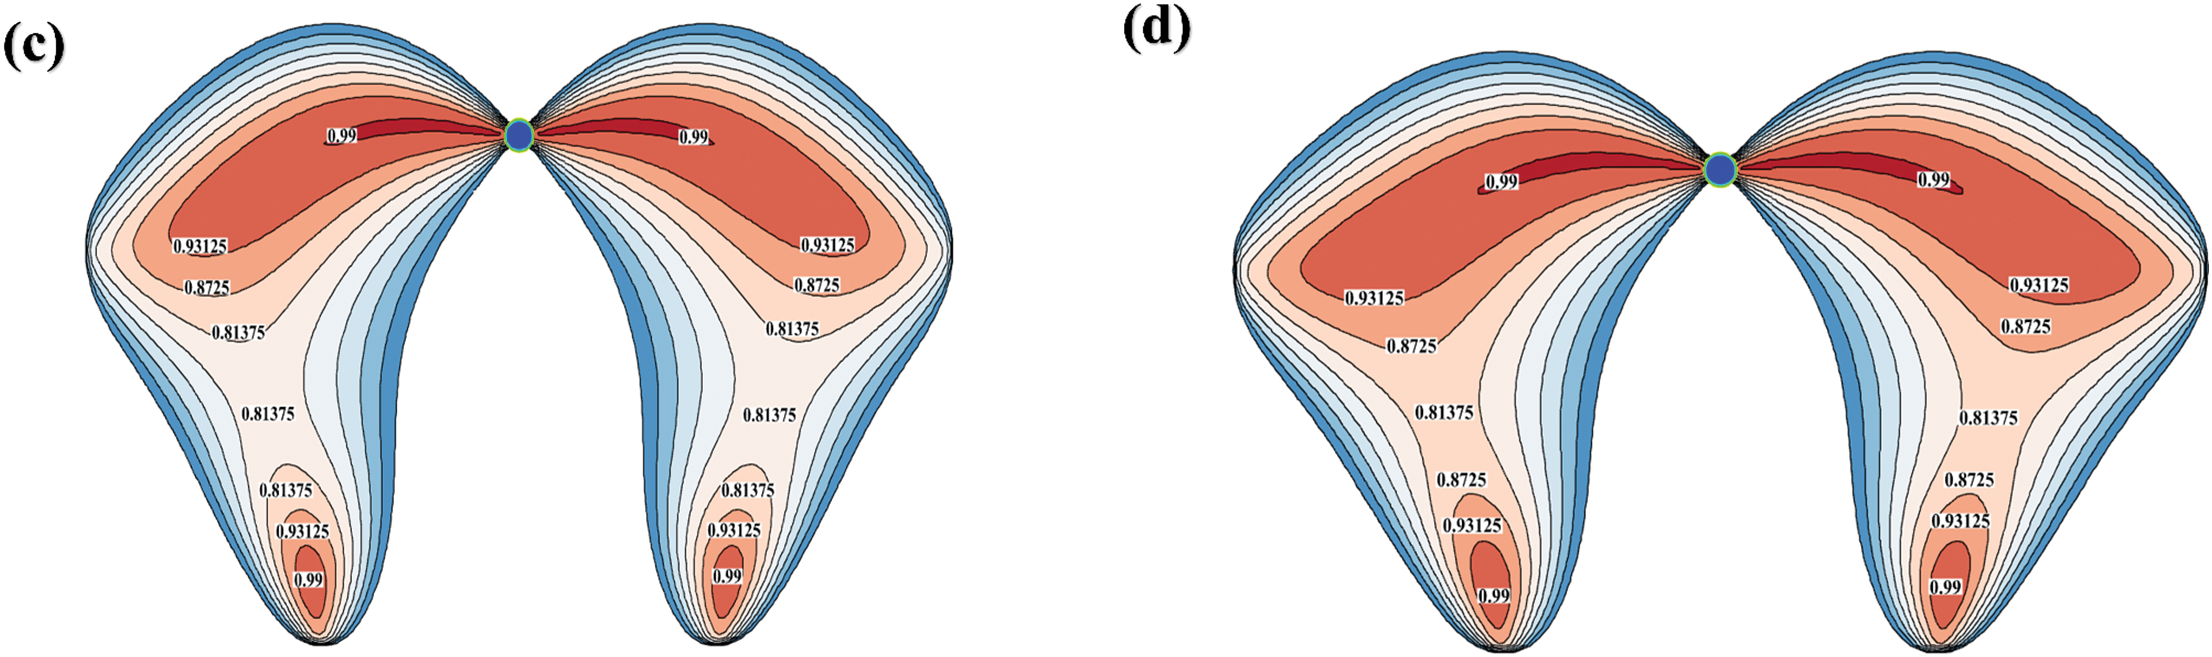
Figure 11: Vortex diagram formed by 6 mm bubble in fluids. The (a), (b), (c) and (d) represent Liquids A, B, C, D
3.2.1 Shedding and Separation of the Tail Vortex
Throughout the ascent of a bubble, numerous vortices of small strength are generated in its wake. These weak vortices gradually descend and coalesce, forming new, more substantial vortices. These emergent vortices are of similar strength and are symmetrically distributed on either side of the bubble’s trajectory. During this process, two distinct phenomena are observed [12]:
(1) Bottom vortex shedding. This involves the separation of the initial, weaker vortices at the bottom of the bubble’s wake from the newly formed, stronger vortices, as shown in Fig. 12a.
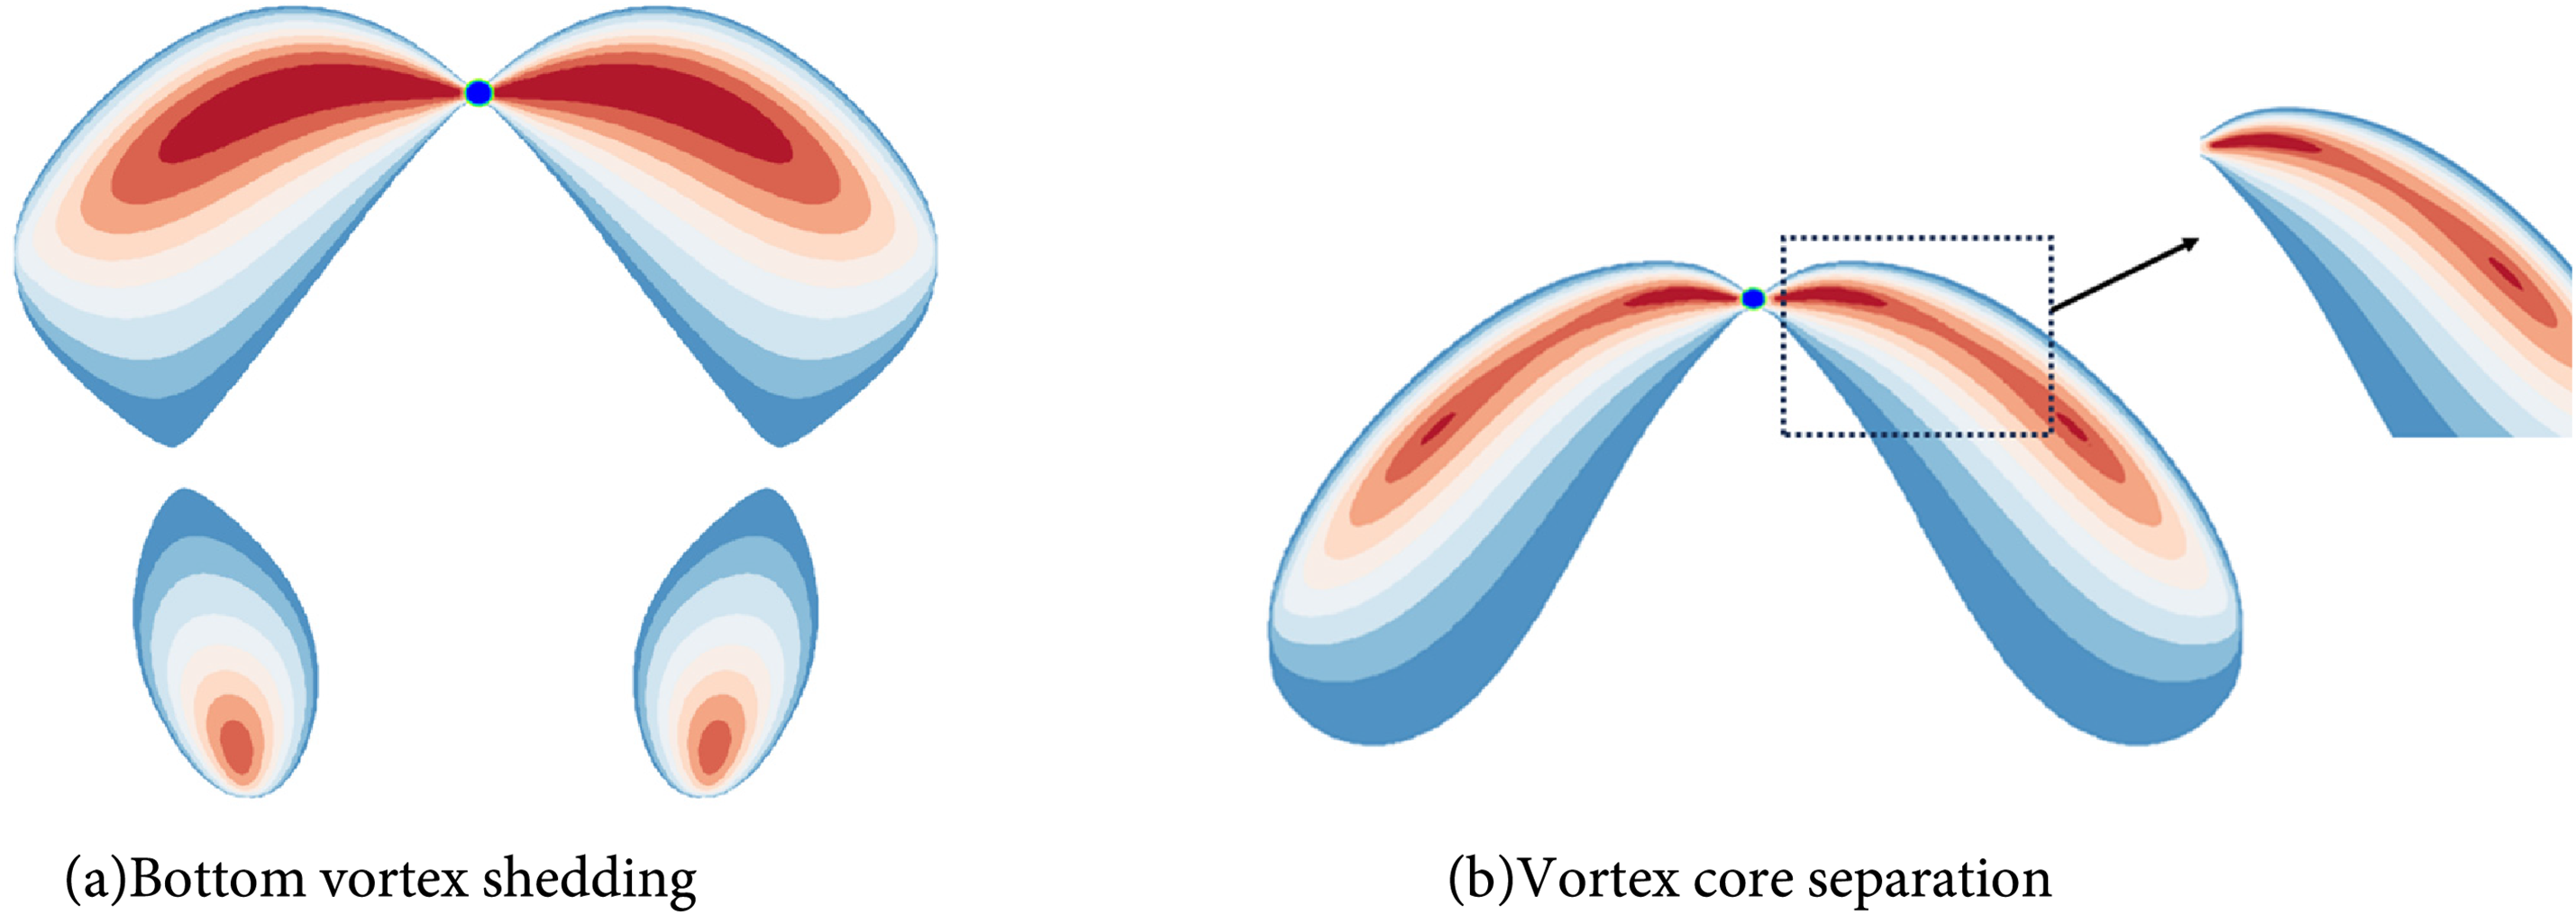
Figure 12: The vortex identification method reconstructs the single bubble wake
(2) Vortex core separation. As the bubble rises, the centers of the vortices on either side tend to diverge, as shown in Fig. 12b.
These phenomena play pivotal roles in enhancing the fluid’s stirring and mixing capabilities. The continual generation and redistribution of vortices not only facilitate efficient mixing but also significantly impact the thermal and compositional homogeneity of the fluid.
Figs. 13 and 14 present the statistical analyses of the timing of bottom vortex shedding and vortex core separation. Fig. 13 shows that the larger the bubble diameter is, the earlier the bottom vortex shedding occurs. Specifically, for bubbles with diameters of 4, 6, and 8 mm in Liquid A, the times for bottom vortex shedding are recorded at 5.84, 4.04, and 3.16 s, respectively. In contrast, the shedding time increases with decreasing viscosity. In Liquids A, B, C, and D, the times for the 4 mm bubble for vortex core separation are 5.84, 5.98, 6.04, and 6.12 s, respectively.
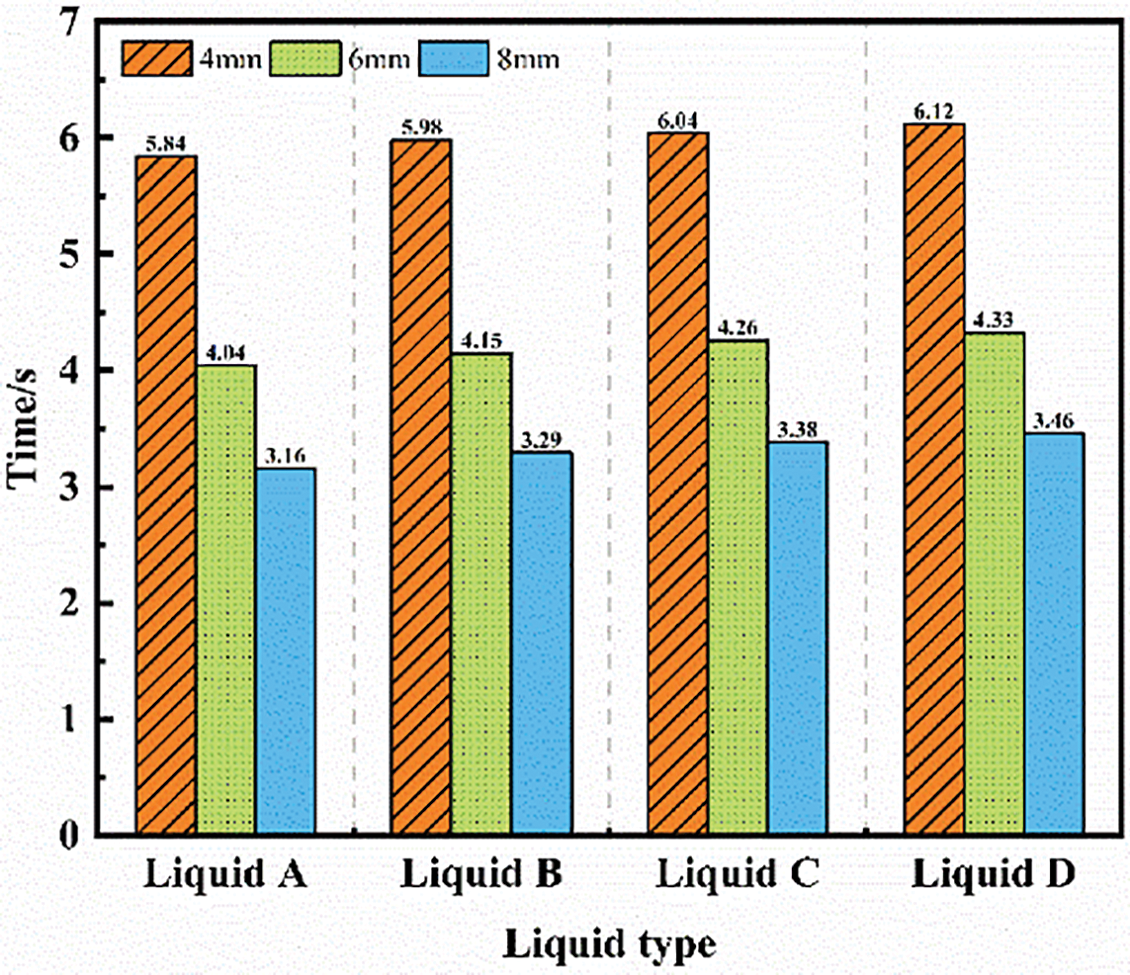
Figure 13: The time at which the vortex sheds appeared
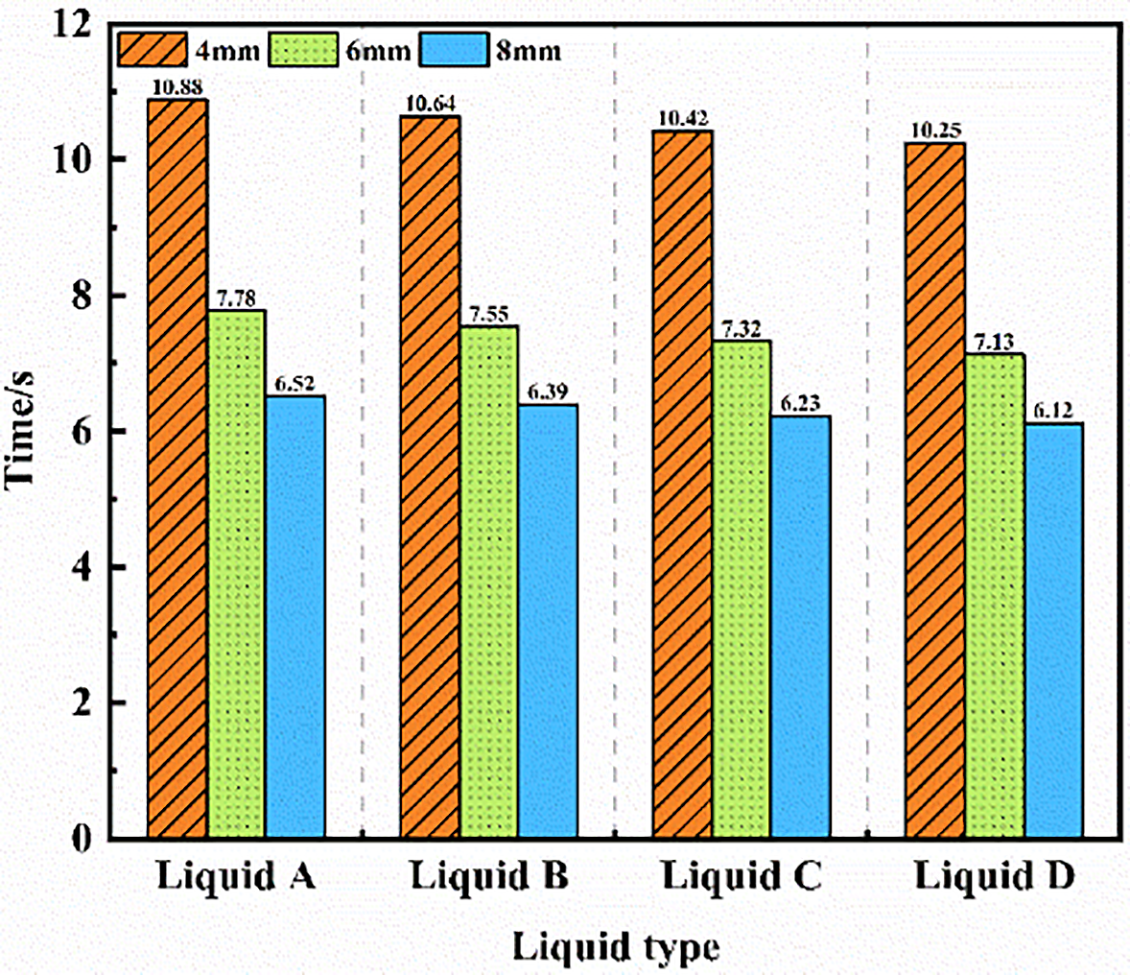
Figure 14: The time at which the vortex nuclei separated occurred
Fig. 14 clearly shows that larger bubbles separate from the vortex nucleus earlier. Specifically, in Liquid A, the separation times for bubbles with diameters of 4, 6, and 8 mm are 10.88, 7.78, and 6.52 s, respectively. Additionally, as the liquid viscosity decreases, the vortex core separates sooner. The 4 mm bubbles in Liquids A, B, C, and D separate at times of 10.88, 10.64, 10.42, and 10.25 s, respectively. Hence, a larger bubble diameter not only accelerates the time for vortex nucleus separation and bottom vortex shedding but also makes the detachment of the bubble wake more likely. Furthermore, for bubbles of the same diameter, a decrease in fluid viscosity results in a delay in bottom vortex shedding while advancing the timing of vortex nucleus separation. Throughout the rising process, bottom vortex shedding and core separation occur synchronously and symmetrically on both sides of the bubble.
3.2.2 Structural Changes in the Tail Vortex
During bubble ascent, the tail vortex plays a crucial role in enhancing the dynamics of the surrounding liquid. This mechanism not only accelerates the liquid’s flow and mixing but also broadens the area of influence. In this study, we utilize the methodology outlined in Fig. 15a to analyze the structure of tail vortices on both sides of the bubble at a height of 250 mm, where bubble dynamics such as shape and velocity have been previously determined to be more stable.
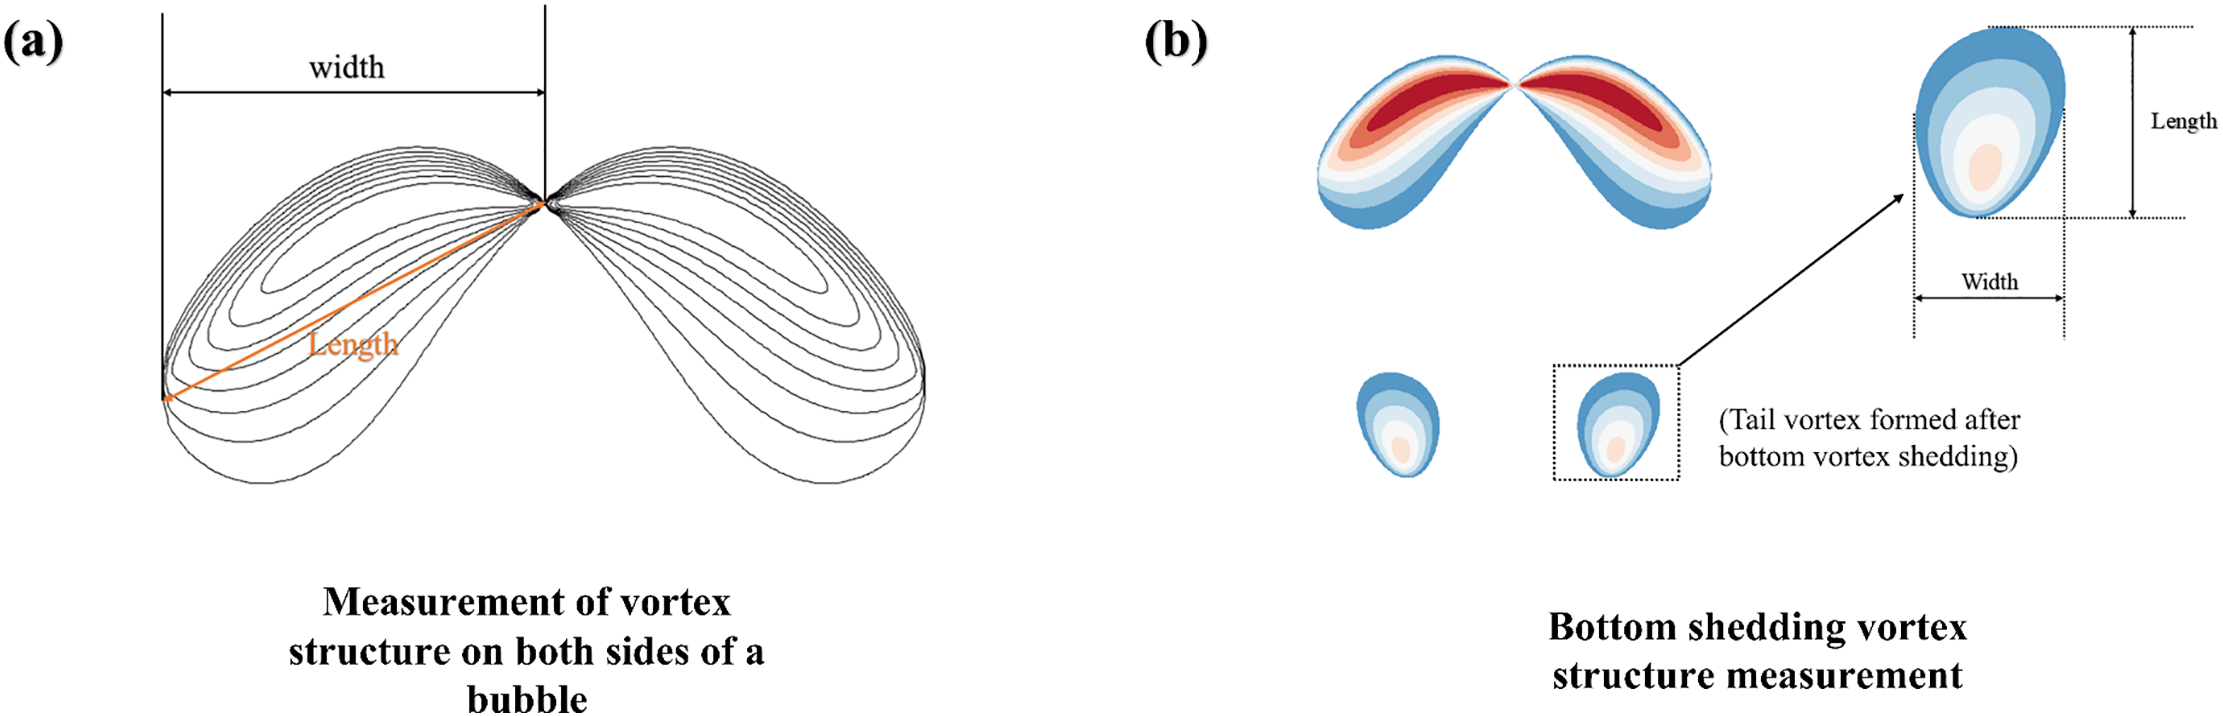
Figure 15: Vortex structure on the sides and bottom of the bubble at 250 mm height
Additionally, weaker vortices shed from the bubble coalesce into smaller vortices at the base, the size of which is largely dependent on the accumulation of these shed vortices. When the bubble reaches a height of 250 mm, there is notable stabilization in the size of the vortices formed at the base. Therefore, the size of the tail vortex formed by the bubble at this point is determined as shown in Fig. 15b.
Fig. 16 illustrates how the length and width of the tail vortex change for bubbles with various initial diameters at a height of 250 mm in different liquids. The data shown in these figures reveal a clear trend: both the length and width of the tail vortex increase as the liquid viscosity decreases. It is also evident in the figures that within the same liquid medium, the variations in the size of the tail vortex for bubbles of different initial diameters are minimal. This observation indicates that the size of the bubble’s tail vortex is predominantly influenced by the liquid viscosity rather than the bubble diameter.
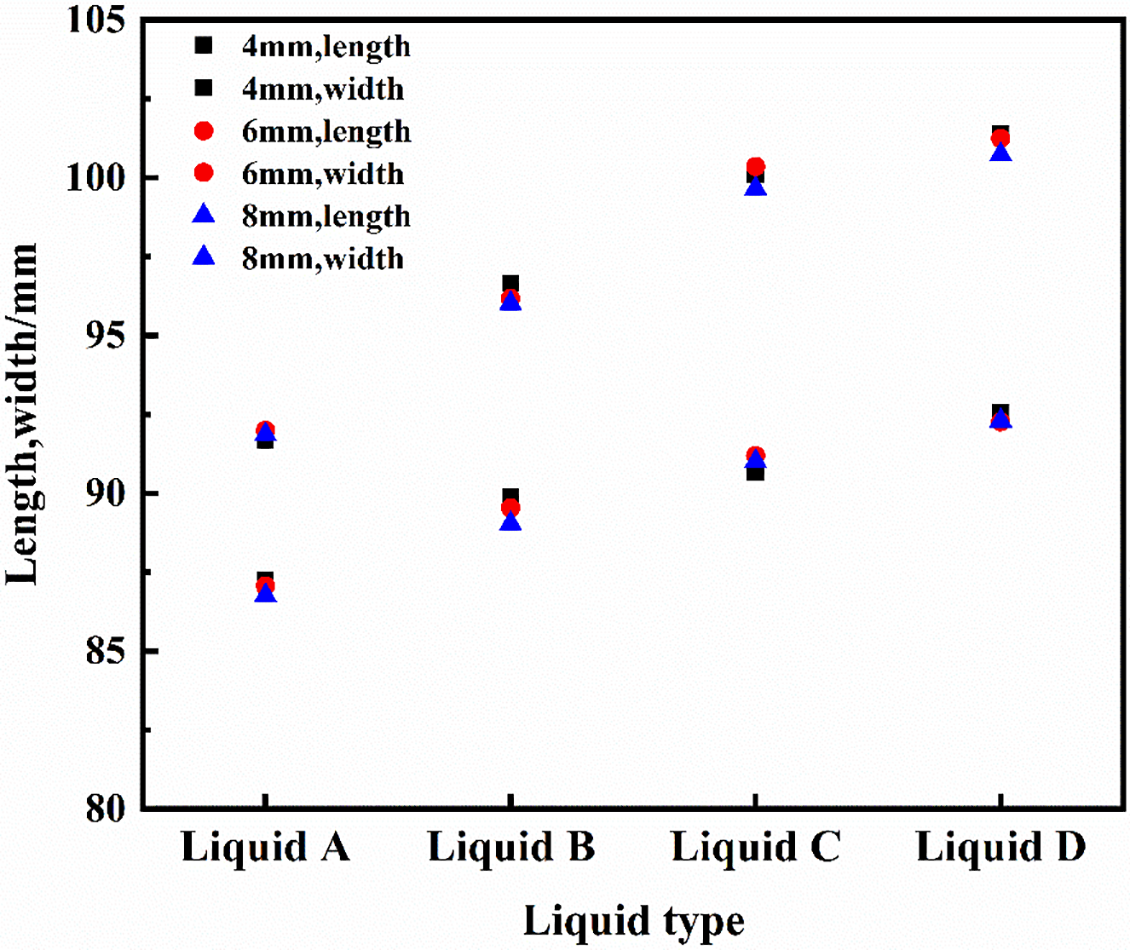
Figure 16: Vortex size on both sides of the bubble at 250 mm
Fig. 17 displays statistical data on the length and width of the bottom vortices formed as bubbles ascended to a height of 250 mm within the four fluids. The illustration clearly shows that the dimensions of the vortices at the bottom increase as the fluid viscosity decreases. Additionally, there is an observable increase in the size of the smaller vortices at the bottom as the initial diameter of the bubble increases.
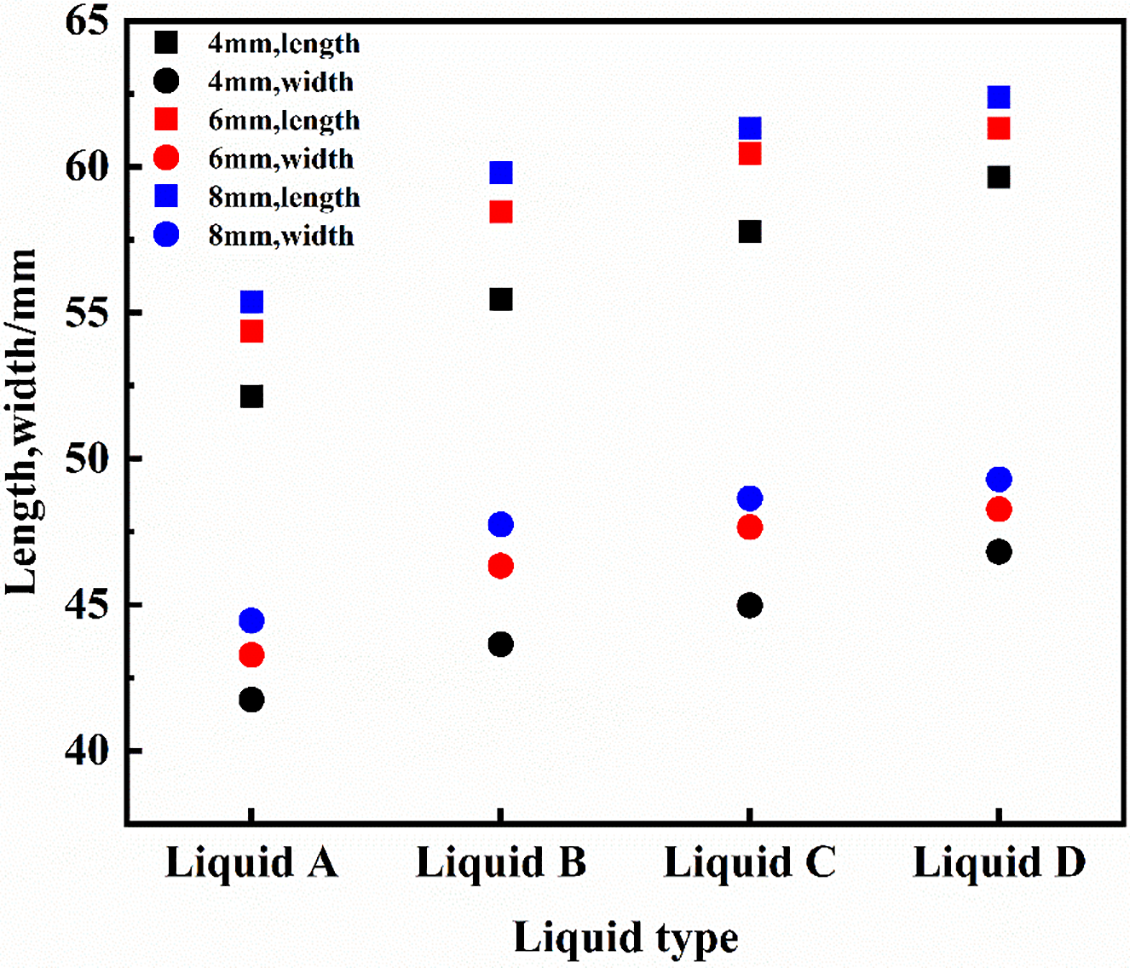
Figure 17: Vortex size at the bottom of the bubble at 250 mm
To explore how melt viscosity and initial bubble diameter affect bubble motion and wake characteristics within a melt pool, this study conducts numerical simulations of bubbles with three distinct initial diameters rising through melts of four different viscosities. This research focuses on changes in bubble velocity and morphology during ascent, as well as their trajectories and wake features. The principal findings are summarized below:
1. The velocity dynamics of bubbles in four different fluids demonstrate consistent patterns characterized by rapid initial acceleration, followed by a deceleration in velocity increase, and culminating in a peak velocity as they are near the liquid surface. Larger initial bubble diameters correlate with higher maximum velocities and shorter times to achieve these peaks in the same liquid.
2. In the four fluids, bubbles of various diameters display consistent trends in terms of the aspect ratio. Each initially undergoes a rapid decrease to reach a nadir at approximately 0.5 s, stabilizes for an extended period, and then sharply contracts as it approaches the liquid surface. For bubbles in identical fluids, larger diameters result in more pronounced aspect ratio variations. Additionally, for bubbles with equivalent initial diameters, the aspect ratio changes more dramatically in less viscous fluids.
3. Bubbles with three different diameters in the four liquids all ascended vertically, exhibiting minimal horizontal velocity and displacement.
4. The Ω identification method was used to analyze the wake characteristics associated with bubble ascent. The key findings include that an increase in the bubble diameter results in earlier occurrence of both bottom vortex shedding and vortex core separation. Decreasing the viscosity of the liquid delays bottom vortex shedding while accelerating vortex core separation. The size of the tail vortex increases as the liquid viscosity decreases, with minimal influence from bubble diameter changes; conversely, the small bottom vortex increases with both a decrease in viscosity and an increase in bubble diameter.
Acknowledgement: The authors express their gratitude toward the State Key Laboratory for the Clean Utilization of Complex Non-Ferrous Metal Resources for their support. Special thanks are extended to Prof. Xiaohui Zhang from Kunming University of Science and Technology for his invaluable assistance.
Funding Statement: Supported by Yunnan Fundamental Research Projects (Nos. 202301AT070469, 202301AT070275); supported by Yunnan Major Scientific and Technological Projects (No. 202202AG050002).
Author Contributions: The authors confirm contribution to the paper as follows: Study conception and design, data collection, analysis and interpretation of results, draft manuscript preparation: Zhi Yang. Conceptualization, resources, writing—review & editing, funding acquisition: Xiaohui Zhang. Supervision: Xinting Tong, Yutang Zhao, Teng Xia, Hua Wang. All authors reviewed the results and approved the final version of the manuscript.
Availability of Data and Materials: The data that support the findings of this study are available from the corresponding author upon reasonable request.
Ethics Approval: Not applicable.
Conflicts of Interest: The authors declare no conflicts of interest to report regarding the present study.
References
1. Kapusta JPT. Submerged gas jet penetration: a study of bubbling versus jetting and side versus bottom blowing in copper bath smelting. JOM. 2017;69(6):970–9. doi:10.1007/s11837-017-2336-4. [Google Scholar] [CrossRef]
2. Obiso D, Schwitalla DH, Korobeinikov I, Meyer B, Reuter M, Richter A. Dynamics of rising bubbles in a quiescent slag bath with varying thermo-physical properties. Metall Mater Trans B. 2020;51(6):2843–61. doi:10.1007/s11663-020-01947-0. [Google Scholar] [CrossRef]
3. Balla M, Tripathi MK, Sahu KC, Karapetsas G, Matar OK. Non-isothermal bubble rise dynamics in a self-rewetting fluid: three-dimensional effects. J Fluid Mech. 2019;858:689–713. doi:10.1017/jfm.2018.774. [Google Scholar] [CrossRef]
4. Aoyama S, Hayashi K, Hosokawa S, Tomiyama A. Shapes of ellipsoidal bubbles in infinite stagnant liquids. Int J Multiph Flow. 2016;79:23–30. doi:10.1016/j.ijmultiphaseflow.2015.10.003. [Google Scholar] [CrossRef]
5. Zenit R, Magnaudet J. Path instability of rising spheroidal air bubbles: a shape-controlled process. Phys Fluids. 2008;20(6):061702. doi:10.1063/1.2940368. [Google Scholar] [CrossRef]
6. Li Y, Yang N, Xiao X, Jiang B, Sun Y, Zhang L. Numerical study of the geometric characteristics and kinetic behavior of single bubble rise processes in different liquids. Phys Fluids. 2023;35(7):073310. doi:10.1063/5.0150547. [Google Scholar] [CrossRef]
7. Liu L, Yan H, Zhao G. Experimental studies on the shape and motion of air bubbles in viscous liquids. Exp Therm Fluid Sci. 2015;62(3):109–21. doi:10.1016/j.expthermflusci.2014.11.018. [Google Scholar] [CrossRef]
8. Liu Z, Zheng Y, Jia L, Zhang Q. Study of bubble induced flow structure using PIV. Chem Eng Sci. 2005;60(13):3537–52. doi:10.1016/j.ces.2004.03.049. [Google Scholar] [CrossRef]
9. Premlata AR, Tripathi MK, Sahu KC. Dynamics of rising bubble inside a viscosity-stratified medium. Phys Fluids. 2015;27(7):072105. doi:10.1063/1.4927521. [Google Scholar] [CrossRef]
10. Sharaf DM, Premlata AR, Tripathi MK, Karri B, Sahu KC. Shapes and paths of an air bubble rising in quiescent liquids. Phys Fluids. 2017;29(12):122104. doi:10.1063/1.5006726. [Google Scholar] [CrossRef]
11. Ohta M, Sussman M. The buoyancy-driven motion of a single skirted bubble or drop rising through a viscous liquid. Phys Fluids. 2012;24(11):112101. doi:10.1063/1.4765669. [Google Scholar] [CrossRef]
12. Tripathi MK, Sahu KC, Govindarajan R. Dynamics of an initially spherical bubble rising in quiescent liquid. Nat Commun. 2015;6(1):6268. doi:10.1038/ncomms7268. [Google Scholar] [PubMed] [CrossRef]
13. Xu JR, Zhang XH, Qing S, Zhang H, Wang H. Instantaneous deformation characteristics of a single bubble in immiscible fluids. J Iron Steel Res Int. 2022;29(10):1601–12. doi:10.1007/s42243-022-00772-w. [Google Scholar] [CrossRef]
14. Gao D, Li X, Hou B, Lu F, Ye M, Wang A, et al. Study of bubble behavior in high-viscosity liquid in a pseudo-2D column using high-speed imaging. Chem Eng Sci. 2022;252(4):117532. doi:10.1016/j.ces.2022.117532. [Google Scholar] [CrossRef]
15. Celata GP, D’Annibale F, Di Marco P, Memoli G, Tomiyama A. Measurements of rising velocity of a small bubble in a stagnant fluid in one- and two-component systems. Exp Therm Fluid Sci. 2007;31(6):609–23. doi:10.1016/j.expthermflusci.2006.06.006. [Google Scholar] [CrossRef]
16. Liu L, Yan H, Zhao G, Zhuang J. Experimental studies on the terminal velocity of air bubbles in water and glycerol aqueous solution. Exp Therm Fluid Sci. 2016;78:254–65. doi:10.1016/j.expthermflusci.2016.06.011. [Google Scholar] [CrossRef]
17. Tomiyama A, Celata GP, Hosokawa S, Yoshida S. Terminal velocity of single bubbles in surface tension force dominant regime. Int J Multiph Flow. 2002;28(9):1497–519. doi:10.1016/S0301-9322(02)00032-0. [Google Scholar] [CrossRef]
18. Zhang Y, Wang W, Xu X, Yang Q. Effect of bubble size on bubble rising velocity and stagnation in a granular bed. Chem Eng J Adv. 2022;12(3):100425. doi:10.1016/j.ceja.2022.100425. [Google Scholar] [CrossRef]
19. Tian Z, Cheng Y, Li X, Wang L. Bubble shape and rising velocity in viscous liquids at high temperature and pressure. Exp Therm Fluid Sci. 2019;102(10):528–38. doi:10.1016/j.expthermflusci.2018.12.018. [Google Scholar] [CrossRef]
20. Yu Y, Cui J, Smith WR, Wang Q, Leighton TG. The mechanisms of jetting, vortex sheet, and vortex ring development in asymmetric bubble dynamics. Phys Fluids. 2023;35(12):123320. doi:10.1063/5.0177283. [Google Scholar] [CrossRef]
21. Cano-Lozano JC, Bohorquez P, Martínez-Bazán C. Wake instability of a fixed axisymmetric bubble of realistic shape. Int J Multiph Flow. 2013;51:11–21. doi:10.1016/j.ijmultiphaseflow.2012.11.005. [Google Scholar] [CrossRef]
22. Cano-Lozano JC, Martínez-Bazán C, Magnaudet J, Tchoufag J. Paths and wakes of deformable nearly spheroidal rising bubbles close to the transition to path instability. Phys Rev Fluids. 2016;1(5):053604. doi:10.1103/physrevfluids.1.053604. [Google Scholar] [CrossRef]
23. Biswas S, Govardhan RN. Vortex ring and bubble interaction: effects of bubble size on vorticity dynamics and bubble dynamics. Phys Fluids. 2023;35(8):083328. doi:10.1063/5.0159766. [Google Scholar] [CrossRef]
24. Zhang J, Ni MJ. What happens to the vortex structures when the rising bubble transits from zigzag to spiral? J Fluid Mech. 2017;828:353–73. doi:10.1017/jfm.2017.514. [Google Scholar] [CrossRef]
25. Mirsandi H, Kong G, Buist KA, Baltussen MW, Peters EAJF, Kuipers JAM. Numerical study on the interaction of two bubbles rising side-by-side in viscous liquids. Chem Eng J. 2021;410(16):128257. doi:10.1016/j.cej.2020.128257. [Google Scholar] [CrossRef]
26. Yan H, Zhang H, Liao Y, Zhang H, Zhou P, Liu L. A single bubble rising in the vicinity of a vertical wall: a numerical study based on volume of fluid method. Ocean Eng. 2022;263:112379. doi:10.1016/j.oceaneng.2022.112379. [Google Scholar] [CrossRef]
27. Garoosi F, Kantzas A, Irani M. Numerical simulation of wave interaction with porous structure using the coupled Volume-Of-Fluid (VOF) and Darcy-Brinkman-Forchheimer model. Eng Anal Bound Elem. 2024;166:105866. doi:10.1016/j.enganabound.2024.105866. [Google Scholar] [CrossRef]
28. Dani A, Cockx A, Guiraud P. Direct numerical simulation of mass transfer from spherical bubbles: the effect of interface contamination at low Reynolds numbers. Int J Chem React Eng. 2006;4(1):A2. doi:10.2202/1542-6580.1304. [Google Scholar] [CrossRef]
29. Kishore N, Nalajala VS. Heat transfer from confined contaminated bubbles to power-law liquids at low to moderate Reynolds and Prandtl numbers. Heat Transf Asian Res. 2016;46(7):681–702. doi:10.1002/htj.21237. [Google Scholar] [CrossRef]
30. Bothe D, Kröger M, Warnecke HJ. A VOF-based conservative method for the simulation of reactive mass transfer from rising bubbles. Fluid Dyn Mater Process. 2011;7(3):303–16. doi:10.3970/fdmp.2011.007.303. [Google Scholar] [CrossRef]
31. Lyubimova T, Garicheva Y, Ivantsov A. The behavior of a gas bubble in a square cavity filled with a viscous liquid undergoing vibrations. Fluid Dyn Mater Process. 2024;20(11):2417–29. doi:10.32604/fdmp.2024.052391. [Google Scholar] [CrossRef]
32. Liu C, Wang Y, Yang Y, Duan Z. New omega vortex identification method. Sci China Phys Mech Astron. 2016;59(8):684711. doi:10.1007/s11433-016-0022-6. [Google Scholar] [CrossRef]
33. Kong G, Mirsandi H, Buist KA, Peters EAJF, Baltussen MW, Kuipers JAM. Hydrodynamic interaction of bubbles rising side-by-side in viscous liquids. Exp Fluids. 2019;60(10):155. doi:10.1007/s00348-019-2798-y. [Google Scholar] [CrossRef]
34. Hu B, Pang M. Numerical study on the influence of liquid viscosity ratio on the hydrodynamics of a single bubble in shear-thinning liquid. Appl Math Model. 2022;103(8):122–40. doi:10.1016/j.apm.2021.10.009. [Google Scholar] [CrossRef]
Cite This Article
 Copyright © 2025 The Author(s). Published by Tech Science Press.
This work is licensed under a Creative Commons Attribution 4.0 International License , which permits unrestricted use, distribution, and reproduction in any medium, provided the original work is properly cited.
 Downloads
 Citation Tools