
 Submit a Paper
 Propose a Special lssue
 Open Access
ARTICLE

Numerical Simulation of Gas-Water Two-Phase Flow in a Proppant-Filled Layer
1 Southwest Oil and Gas Field Branch of China National Petroleum Corporation, Chengdu, 610017, China
2 School of Petroleum and Natural Gas Engineering, Southwest Petroleum University, Chengdu, 610500, China
* Corresponding Author: Tao Zhang. Email:
Fluid Dynamics & Materials Processing 2025, 21(8), 1935-1954. https://doi.org/10.32604/fdmp.2025.066730
Received 16 April 2025; Accepted 03 July 2025; Issue published 12 September 2025
 View Full Text
 Download PDF
Abstract
Shale gas production involves complex gas-water two-phase flow, with flow patterns in proppant-filled fractures playing a critical role in determining production efficiency. In this study, 3D geometric models of 40/70 mesh ceramic particles and quartz sand proppant clusters were elaborated using computed tomography (CT) scanning. These models were used to develop a numerical simulation framework based on the lattice Boltzmann method (LBM), enabling the investigation of gas-water flow behavior within proppant-filled fractures under varying driving forces and surface tensions. Simulation results at a closure pressure of 15 MPa have revealed that ceramic particles exhibit a simpler and more porous internal structure than quartz sand of the same size. Under identical flow conditions, ceramic proppants demonstrate higher fluid replacement efficiency. Replacement efficiency increases with higher porosity, greater driving force, and lower surface tension. Furthermore, fluid displacement is strongly influenced by pore geometry: flow is faster in straighter and wider channels, with preferential movement through larger pores forming dominant flow paths. The replacement velocity exhibits a characteristic time evolution, initially rapid, then gradually decreasing, correlating positively with the development of these dominant channels.Keywords
With the increasing development of unconventional oil and gas resources, hydraulic fracturing technology has become crucial for enhancing reservoir conductivity [1]. The formation of proppant packs and their internal multiphase flow characteristics directly determine long-term fracture conductivity and well productivity [2]. While significant progress has been made in numerical simulation of gas-liquid two-phase flow in recent years, most existing research focuses on macroscopic pipelines or homogeneous porous media. There remains a lack of targeted research on the highly porous and strongly heterogeneous proppant-filled layer. Moreover, the microscopic mechanisms and macroscopic behavior governing gas-water two-phase flow within proppant packs are not yet fully understood.
The lattice Boltzmann method (LBM) is a mesoscopic approach, bridging molecular and macroscopic scales. It is a primary tool for simulating phase transitions, two-phase flows, and chemical reactions at the pore scale. LBM simulates system behavior by tracking the evolution of particle distribution functions on a discrete lattice. In 2014, Gong et al. [3] used a four-parameter-based LBM model to simulate gas-liquid coexistence in multi-component systems (methane, ethane, propane), verifying its accuracy against traditional theoretical models. In 2017, Shamsi et al. [4] combined the discrete element method (DEM) and LBM to simulate proppant-filled fracture evolution and evaluate conductivity under stress. In 2019, Li et al. [5] integrated LBM with finite difference techniques to develop an innovative method for simulating upscaled shale gas seepage, maintaining high accuracy while improving computational speed. In 2020, Fan et al. [6] developed a technique combining continuum mechanics, DEM, and LBM to quantify the effects of proppant quantity, size, distribution, and crushing on embedment. In 2021, Zhao et al. [7] established a conceptual model of the mudstone-sandstone interface in shale reservoirs based on pore structure characteristics, developing multiphase multicomponent LBM models (e.g., color models, pseudopotential models). These models have significantly contributed to understanding gas generation, oil-gas flow, imbibition, and seepage in shale. In 2022, Feng et al. [8] systematically reviewed advances in shale gas flow modeling, evaluating capillary bundle models, LBM, and pore network modeling (PNM) for heterogeneous matrices and discussing scale effects, pore structure impacts, and well performance. Also in 2022, Wang et al. [9] proposed a nanoscale multiple-relaxation-time multicomponent multiphase lattice Boltzmann method (MRT-MCMP-LBM) based on pseudopotential formulation to simulate pore-scale oil/water two-phase flow. Nanoscale effects of liquid/solid slip, liquid/liquid slip, and non-homogeneous phase viscosity due to liquid/solid and liquid/liquid molecular interactions are fully considered. The desired interfacial tension (IFT) and wettability are calibrated by using Laplace tests, contact angles and phase separation. The proposed model is then validated by comparison with molecular simulations and theoretical results. Improvements in computer hardware and numerical algorithms have enhanced LBM for two-phase flow research, reflected in improved experimental data accuracy, refined theoretical models, and increased computational efficiency [10–19]. LBM integrates mesoscopic characteristics of continuum models with microscopic molecular dynamics, offering advantages such as ease of parallelization, simple boundary condition handling, high efficiency and accuracy, capability for complex two-phase flows, and straightforward computer implementation, providing vital support for research and engineering applications [20–27].
Common proppants in shale gas fracturing are 40/70 mesh ceramic particles and quartz sand. This study focuses on the proppant-filled layer. Three-dimensional geometric models of 40/70 mesh ceramic and quartz sand proppant packs under 15 MPa closure pressure were constructed using CT scanning. Based on the experimentally obtained 3D proppant pack geometry, an LBM-based numerical model for gas-water two-phase flow was established. Numerical simulations were then performed to study gas-water flow within these packs under varying driving forces and surface tensions, elucidating the flow behavior using LBM.
2 Multiphase Flow Lattice Boltzmann Method
2.1 Lattice Boltzmann Equation
The Boltzmann equation describes the evolution of gaseous particle distribution functions. It enables problem-solving by extracting distribution function information at each time point and utilizing statistical correlations with macroscopic parameters:
where:
Simplified collision models have been developed, notably the Bhatnagar-Gross-Krook (BGK) model:
where:
Substituting Eq. (2) into Eq. (1) yields the Boltzmann-BGK equation, reducing computational complexity:
where:
Given the three-dimensional nature of gas-water flow within proppant packs, the D3Q19 model was selected. In this model, each lattice node has 19 discrete velocity vectors, as shown in Fig. 1. Particles move along these paths, with velocity directions given by Eq. (4).

Figure 1: D3Q19 discrete velocity model
The cube model shown in Fig. 1 has its center at point (0, 0, 0), with half the edge length representing a unit’s length. In the equilibrium distribution function, the weighting coefficients of the D3Q19 model can be elaborated in detail:
where:
The approximation method of the BGK collision model, also called the Single Relaxation Time collision model (SRT), is a simplified collision formula proposed by Bhatnagar, Gross, and Krook [28]. The collision term should exhibit the following characteristics:
Boltzmann H-theorem:
where:
Further assuming a proportional relationship between the rate of change and its value, the approximate form of the collision term can be expressed as:
where:
In Fig. 2, considering the simulation of Couette fluid flow between two infinite parallel plates. The two parallel surfaces serve as physical boundaries with periodic boundary settings on both sides. When particles from the right inlet/outlet complete their collision and movement processes, they re-enter the flow field and continue motion at the left inlet. The relationship between particle distribution functions at both inlets can be expressed as:
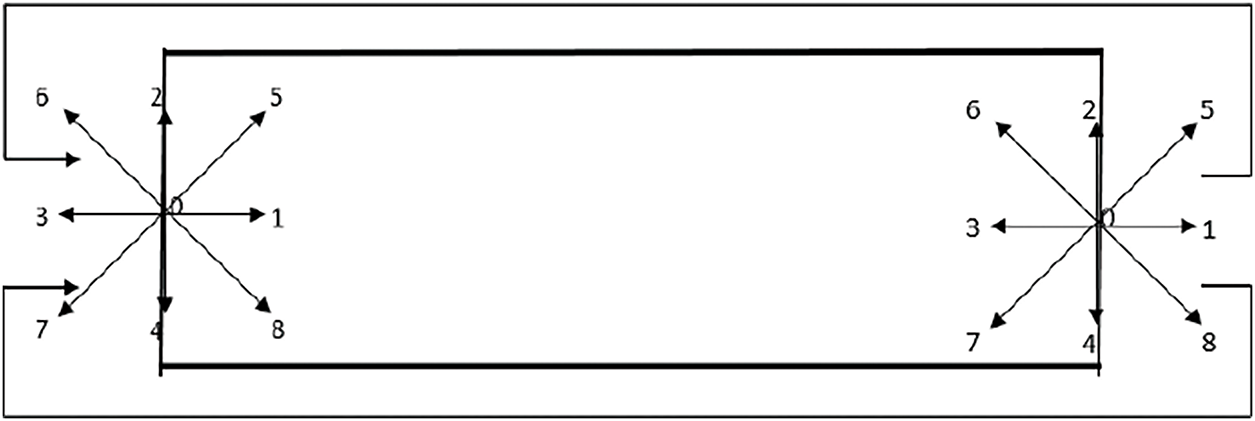
Figure 2: Periodic boundary conditions
In the color gradient model, fluid movement involves four stages: single-species collision, binary species interaction, recoloring, and migration. Fluids are identified by color (e.g., red for liquid, blue for gas), with density functions fr and fb, and total distribution f:
A two-phase flow model was established within the geometric model, assigning red to water and blue to gas [29]. As shown in Fig. 3, a 150 × 150 × 150 lattice 3D model employed a velocity inlet boundary (left) and an outflow boundary (right), with periodic boundaries elsewhere.
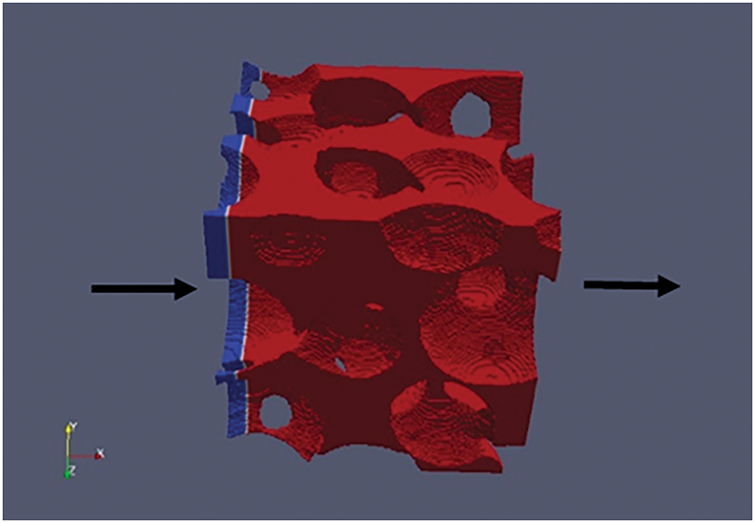
Figure 3: Inlet and outlet settings of 3D model (red for liquid, blue for gas)
2.3 Proppant Cluster Geometric Model
CT scanning experiments on 40/70 mesh ceramic particles and quartz sand proppant packs under 15 MPa closure pressure were conducted using a CT5000-H250 instrument, yielding 2D grayscale images.
Scanned images were processed using Image J. A central sub-volume was extracted for simulation. Image segmentation and binarization produced the required binary porous medium images [30,31]. The domain was discretized into a 150 × 150 × 150 grid. Processed CT images underwent 3D volume reconstruction to build a true pore structure model (Fig. 4).

Figure 4: 3D models of proppant packs under 15 MPa closure pressure. (a) 40/70 mesh quartz sand; (b) 40/70 mesh ceramic particles
2.4 Two-Phase Flow Simulation Parameter Settings
2.4.1 Unit Conversion Based on Dimensionless Method
To study two-phase flow problems using the LBM, various physical parameters need to be converted into corresponding dimensionless lattice units, such as velocity, surface tension, and pressure. As shown in Table 1, this paper adopts dimensionless methods for unit conversion, transforming physical units in actual flow fields into lattice units for simulation calculations, which can significantly reduce computational load while simplifying calculation procedures [32,33].
As a crucial factor influencing gas-water two-phase flow in propped fractures, surface tension at ambient temperature can be converted into corresponding dimensionless surface tension [34] using length scales:
where:
2.4.2 Simulation Parameter Settings
To achieve stable displacement, the simulation condition parameters were set as follows, with a surface tension coefficient of 0.005, initial gas-liquid ratio of 1:10, driving force of 4.0 × 10⁻⁵ MPa, closure pressure of 15 MPa, and 40/70 mesh quartz sand as baseline conditions [35], as shown in Table 2.

3 Analysis of Gas-Water Two-Phase Flow Patterns in Proppant Packs
3.1 Influence of Driving Force on Displacement Efficiency
Driving force is the primary driver of flow in porous media. Its magnitude significantly influences flow patterns. By altering the magnitude and direction of driving force, immiscible two-phase flow behavior under different external conditions can be simulated. Simulations used a surface tension coefficient of 0.005, closure pressure of 15 MPa, and initial driving force of 4.0 × 10⁻⁵ MPa (40 Pa), increased in two 3.0 × 10⁻⁵ MPa (30 Pa) increments. Parameters are shown in Table 3.

3.1.1 Flow Field Analysis of Displacement Process
Using the visualization function in the post-processing module, visualization diagrams of gas-liquid two-phase displacement process at different times were plotted. Visualizations of the gas-liquid displacement process (blue: gas, red: water) are shown in Fig. 5 (ceramic) and Fig. 6 (quartz sand) for iteration steps 10 and 30 under different driving forces at 15 MPa. By iteration 30, displacement is advanced but incomplete. Fluid preferentially displaces through larger pores before narrower ones. At 10.0 × 10⁻⁵ MPa, displacement efficiency is significantly higher than at lower driving forces, indicating that larger driving forces enhance displacement effectiveness. In structures with higher sphericity, fluid tends to flow around particle surfaces, forming bypass flow.
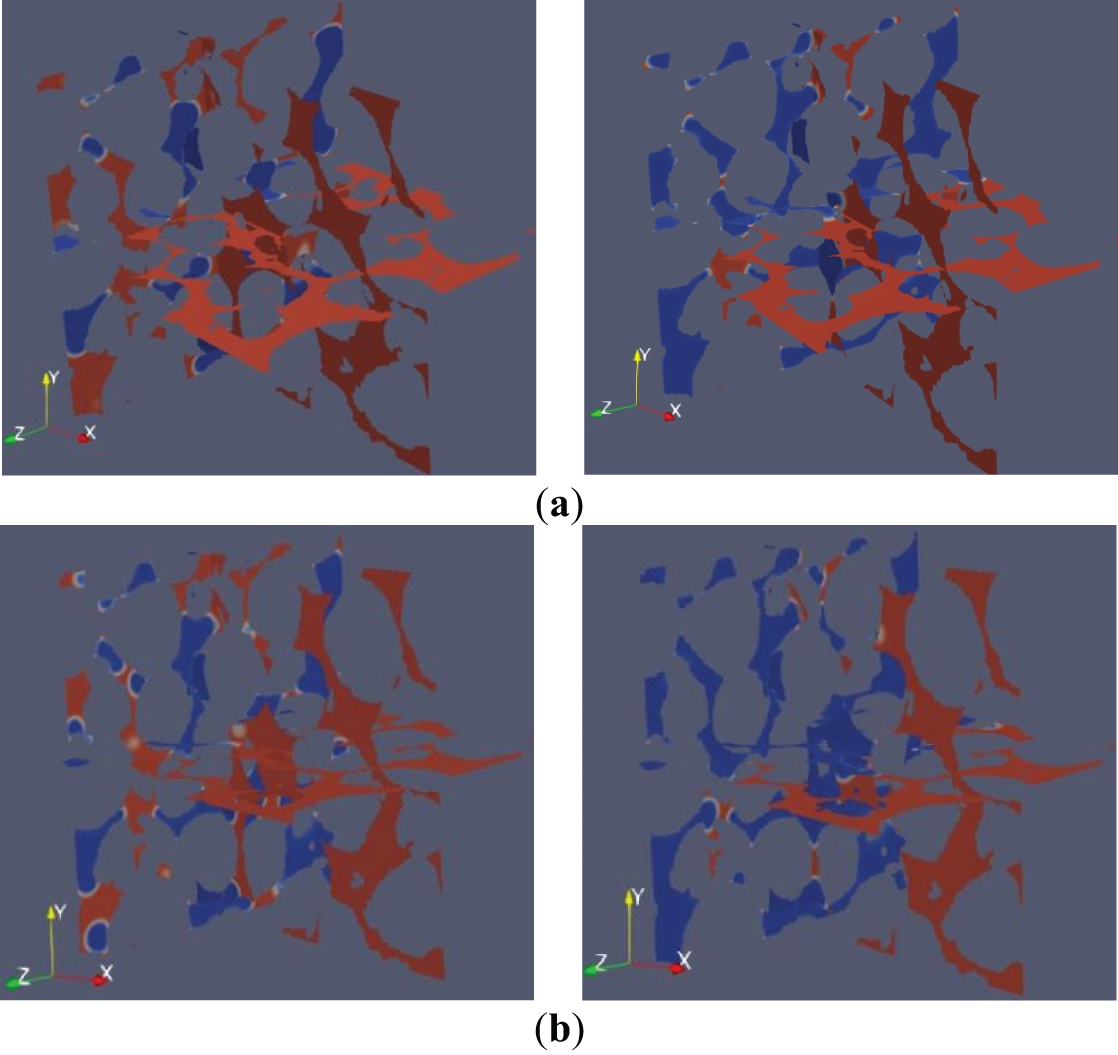
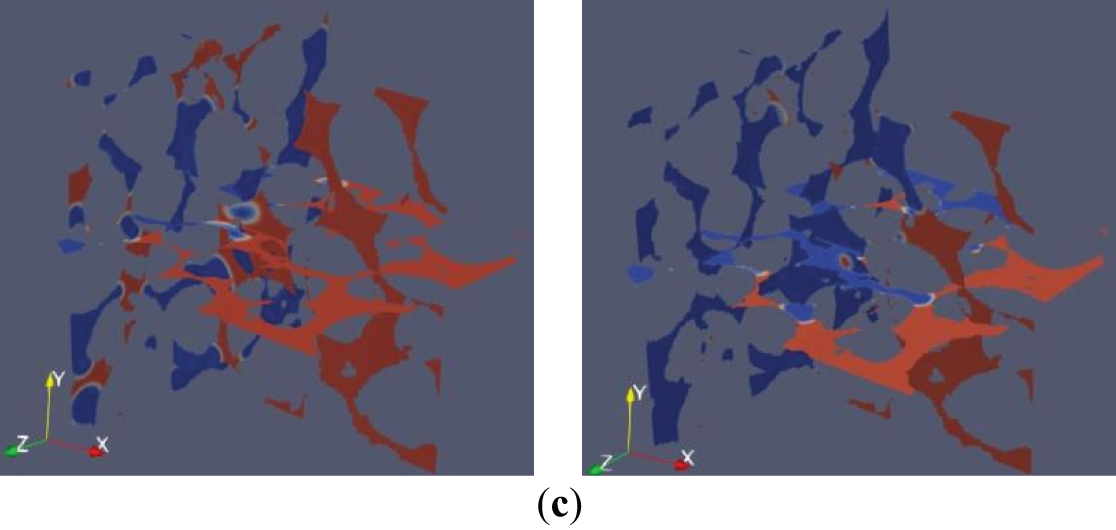
Figure 5: Fluid phase distribution in 40/70 mesh ceramic particles. (a) Driving force = 4.0 × 10⁻⁵ MPa; (b) Driving force = 7.0 × 10⁻⁵ MPa; (c) Driving force = 10.0 × 10⁻⁵ MPa
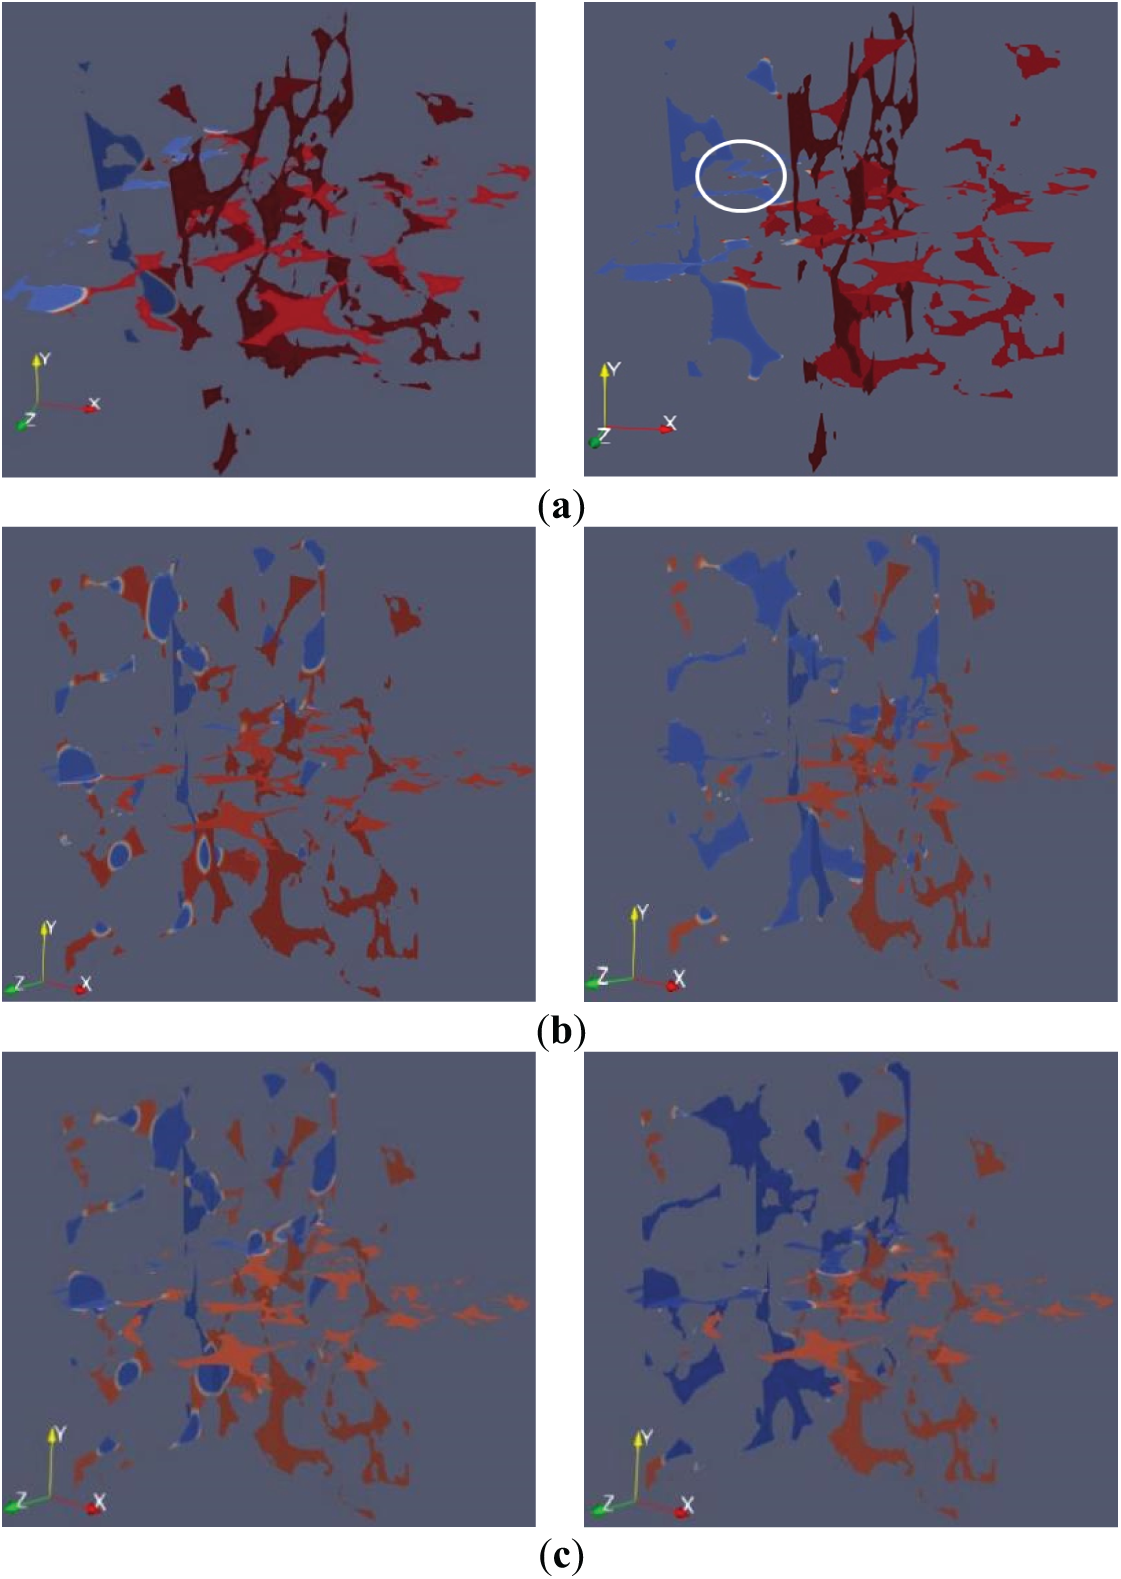
Figure 6: Fluid phase distribution in 40/70 mesh quartz sand. (a) Driving force = 4.0 × 10⁻⁵ MPa; (b) Driving force = 7.0 × 10⁻⁵ MPa; (c) Driving force = 10.0 × 10⁻⁵ MPa
3.1.2 Velocity Analysis of Displacement Process
Using the velocity visualization function in the post-processing module, velocity visualization diagrams of gas-liquid two-phase displacement at the 10th and 30th iterations were plotted. Figs. 7 and 8 show velocity cloud diagrams of 40/70 mesh ceramic particles and 40/70 mesh quartz sand under 15 MPa closure pressure at different driving forces. Velocity visualizations show non-uniform color distribution (significant velocity changes) early in displacement (iteration 10), becoming more uniform (smaller velocity changes, stabilized flow) later (iteration 30). Displacement velocities were notably higher at 7.0 × 10⁻⁵ MPa than at 4.0 × 10⁻⁵ MPa, indicating stronger driving forces enable faster displacement in porous media.

Figure 7: Fluid velocity distribution in 40/70 mesh ceramic particles. (a) Driving force = 4.0 × 10⁻⁵ MPa; (b) Driving force = 7.0 × 10⁻⁵ MPa; (c) Driving force = 10.0 × 10⁻⁵ MPa
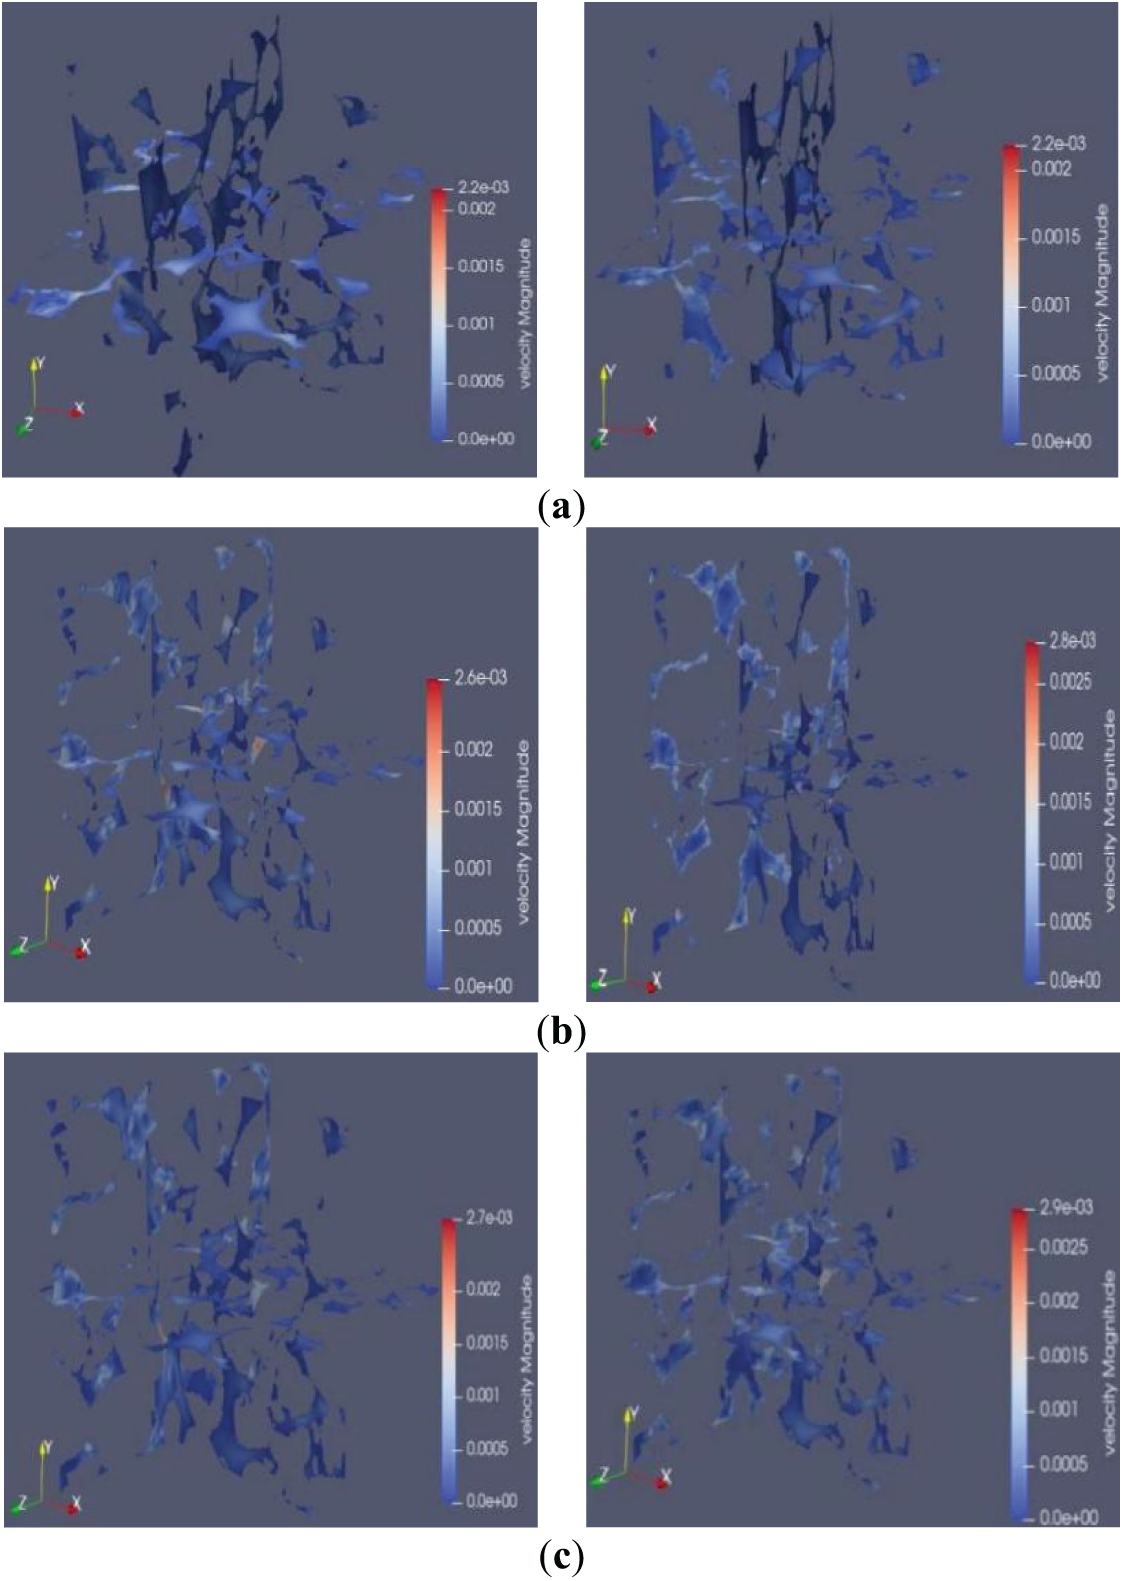
Figure 8: Fluid velocity distribution in 40/70 mesh quartz sand. (a) Driving force = 4.0 × 10⁻⁵ MPa; (b) Driving force = 7.0 × 10⁻⁵ MPa; (c) Driving force = 10.0 × 10⁻⁵ MPa
As shown in Figs. 9 and 10, these are average velocity diagrams of fluid data points at cross-sections from one-tenth of the inlet in three-dimensional geometric models of different proppant clusters. The horizontal coordinate is the number of data points obtained during the expulsion process and the vertical coordinate is the average velocity of the fluid. From the pre-gas displacement until the water was completely displaced, the displacement velocity increased with driving force for both proppants. The average velocity in quartz sand was consistently lower than in ceramic particles under identical conditions. Velocity at 10.0 × 10⁻⁵ MPa was significantly higher than at 4.0 × 10⁻⁵ MPa. This result is consistent with the conclusion obtained through the velocity visualization analysis, which further verifies that larger driving forces increase displacement velocity and efficiency, reducing the time for complete water displacement. Greater driving forces enable fluids to occupy pore spaces faster, demonstrating more pronounced advantages during permeation and displacement processes.

Figure 9: Fluid velocity statistics in internal sections of 40/70 mesh ceramic particles. (a) Driving force = 4.0 × 10⁻⁵ MPa; (b) Driving force = 7.0 × 10⁻⁵ MPa; (c) Driving force = 10.0 × 10⁻⁵ MPa


Figure 10: Fluid velocity statistics in internal sections of 40/70 mesh quartz sand. (a) Driving force = 4.0 × 10⁻⁵; (b) Driving force = 7.0 × 10⁻⁵; (c) Driving force = 10.0 × 10⁻⁵
The displacement velocity of both proppants increases with driving force. Velocity variation in ceramic particles was more pronounced than in quartz sand. However, under identical conditions, the average fluid velocity in 40/70 mesh quartz sand is consistently lower than in 40/70 mesh ceramic particles. During gas displacement, displacement was rapid initially, gradually slowing until complete.
3.2 Effect of Surface Tension on Displacement Efficiency
Surface tension, a property of liquid surface films, influences gas distribution and dispersion in liquids by regulating gas-liquid interface stability and activity. The surface tension coefficient directly determines interaction forces between liquid and gas. By modifying this coefficient, gas-liquid interface behaviors under different wettability conditions can be simulated to investigate their impact on immiscible two-phase flow. Using 40/70 mesh ceramic particles and quartz sand under 4.0 × 10⁻⁵ MPa driving force and 15 MPa closure pressure, displacement was analyzed at surface tension coefficients of 0.007, 0.005, and 0.003 (Table 4).

3.2.1 Flow Field Analysis of Displacement Process
Figs. 11 and 12 show the flow field diagrams at the 10th and 30th iterations under closure pressure of 15 MPa for 40/70 mesh ceramic particles and 40/70 mesh quartz sand with different surface tension coefficients. Visualizations show fluid preferentially displacing through large pores before smaller ones, as large pores provide more accessible channels for fluid movement and thus receive more displacement opportunities. Due to the incompressibility and immiscibility of the two fluids, some dead-end pores remained inaccessible, creating sealed water-filled spaces. Lower surface tension resulted in higher displacement efficiency for both proppants. Displacement velocity increased relatively faster in straight, wide pore channels.
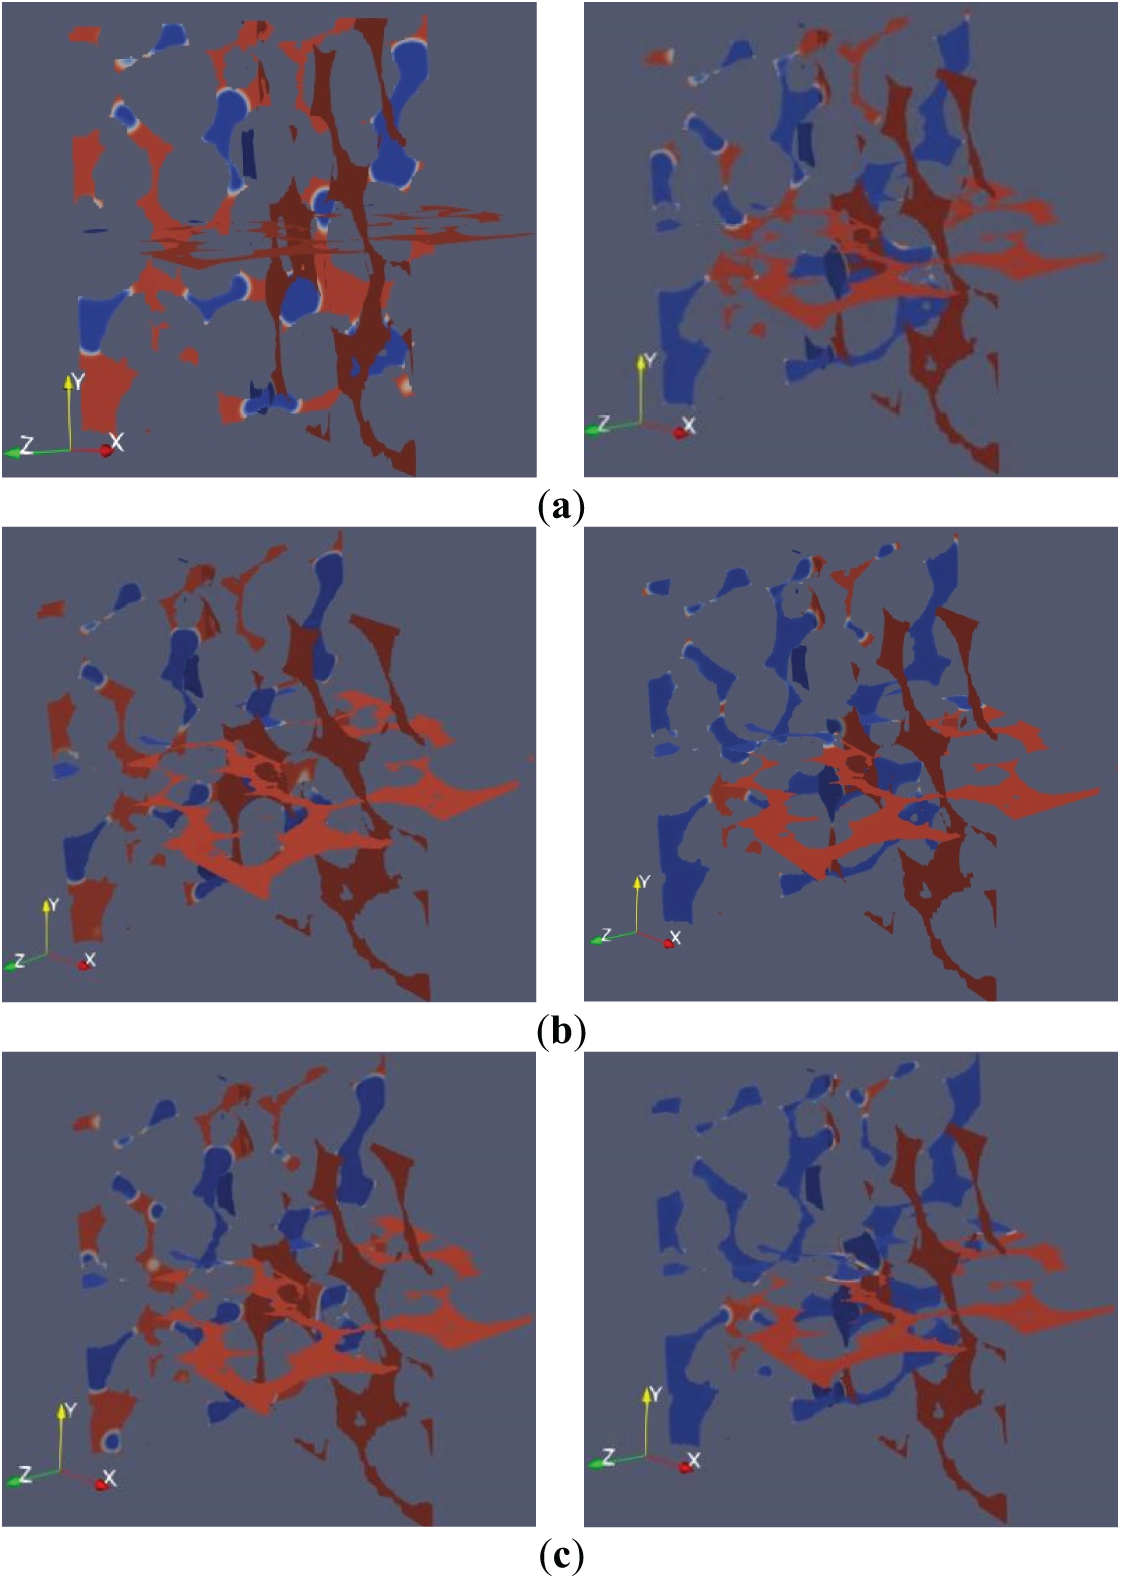
Figure 11: Fluid phase distribution in 40/70 mesh ceramic particles. (a) Surface tension coefficient = 0.007; (b) Surface tension coefficient = 0.005; (c) Surface tension coefficient = 0.003

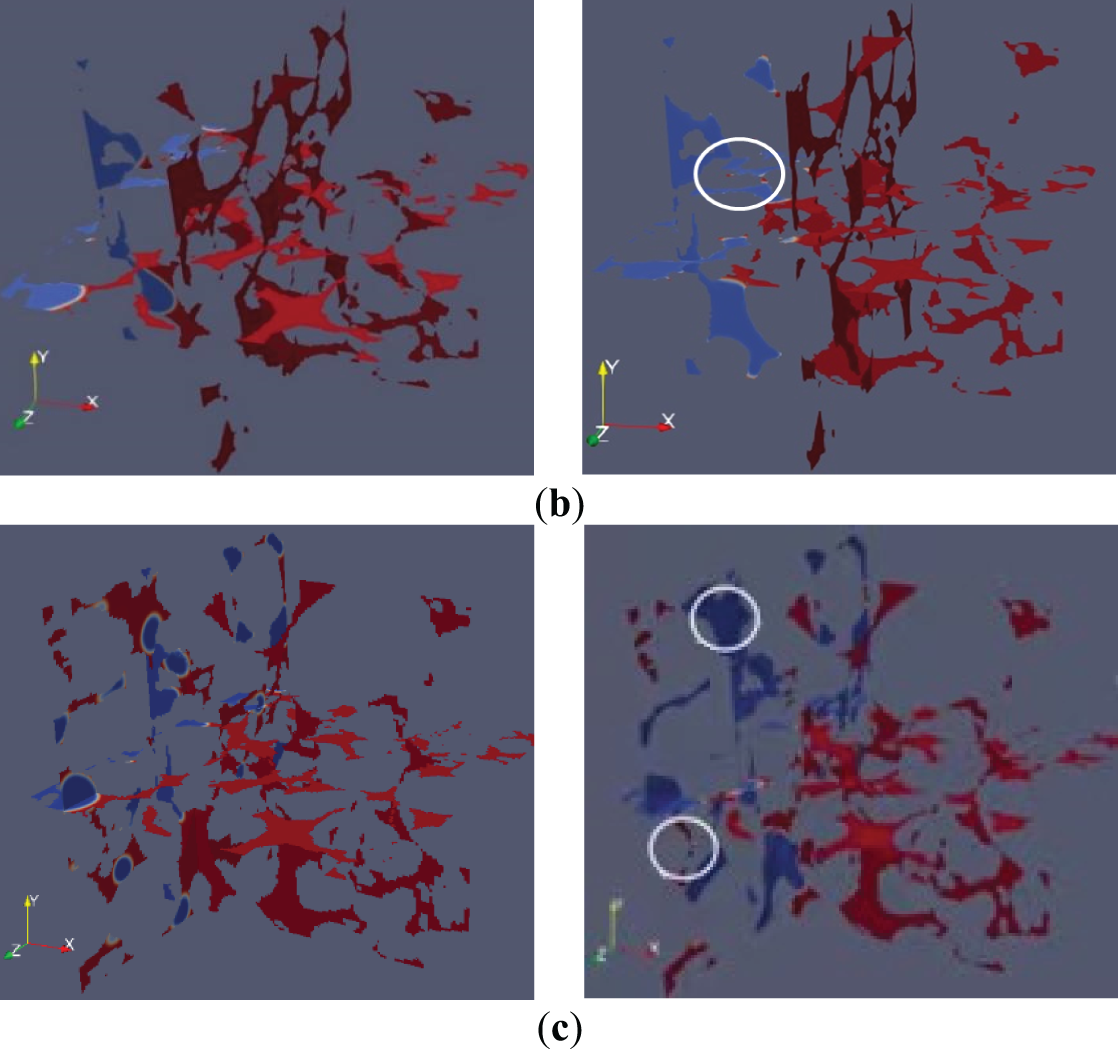
Figure 12: Fluid phase distribution in 40/70 mesh quartz sand. (a) Surface tension coefficient is 0.007; (b) Surface tension coefficient = 0.005; (c) Surface tension coefficient = 0.003
3.2.2 Velocity Analysis of Displacement Process
Using the velocity visualization function in the post-processing module, velocity visualization diagrams of gas-liquid two-phase displacement at the 10th and 30th iterations were plotted. Figs. 13 and 14 show the velocity cloud diagrams of 40/70 mesh ceramic particles and 40/70 mesh quartz sand under 15 MPa closure pressure at different surface tension coefficients. During fluid flow, there are specific channels with significantly higher permeability than other regions, which notably influence the entire displacement process. These are called “advantageous channels”, where the fluid preferentially flows. Early displacement velocity was greater at lower surface tension; later, the influence was smaller.
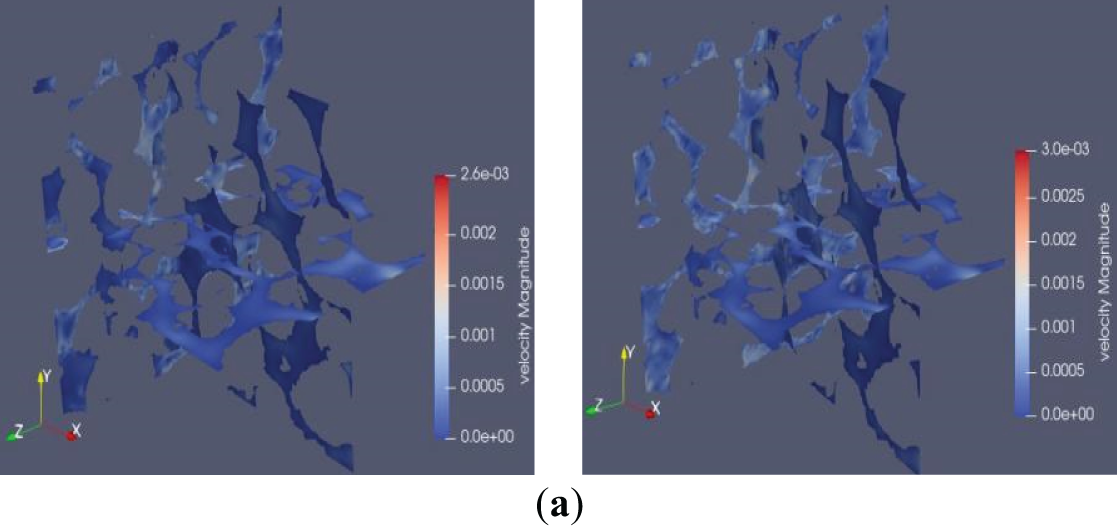

Figure 13: Fluid velocity in 40/70 mesh ceramic particles. (a) Surface tension coefficient = 0.007; (b) Surface tension coefficient = 0.005; (c) Surface tension coefficient = 0.003
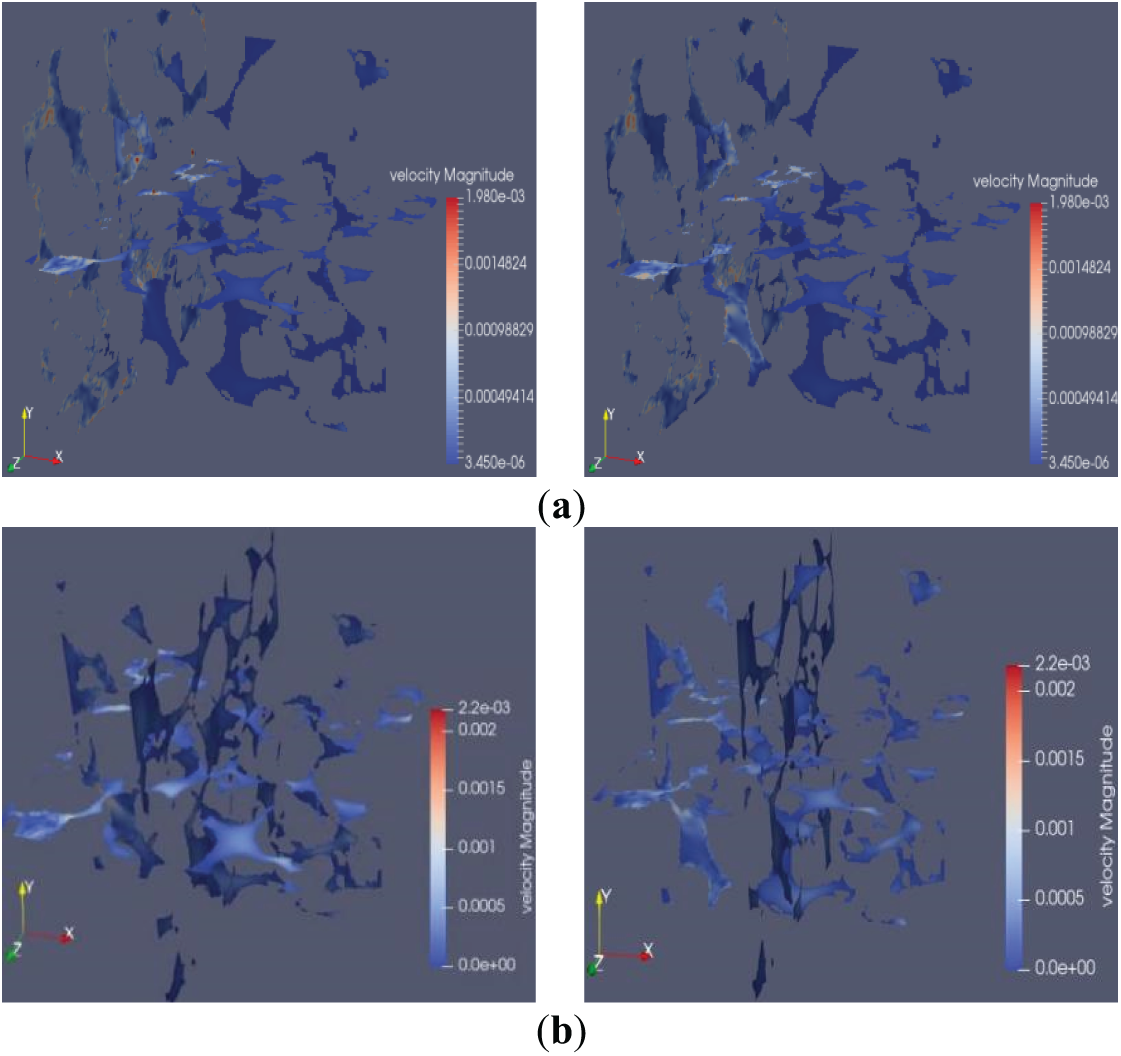

Figure 14: Fluid velocity in 40/70 mesh quartz sand. (a) Surface tension coefficient = 0.007; (b) Surface tension coefficient = 0.005; (c) Surface tension coefficient = 0.003
Figs. 15 and 16 show smoother velocity changes in ceramic particles, indicating more uniform pore distribution. Quartz sand exhibited significant velocity variations and multiple peaks due to numerous small, unevenly distributed pores.
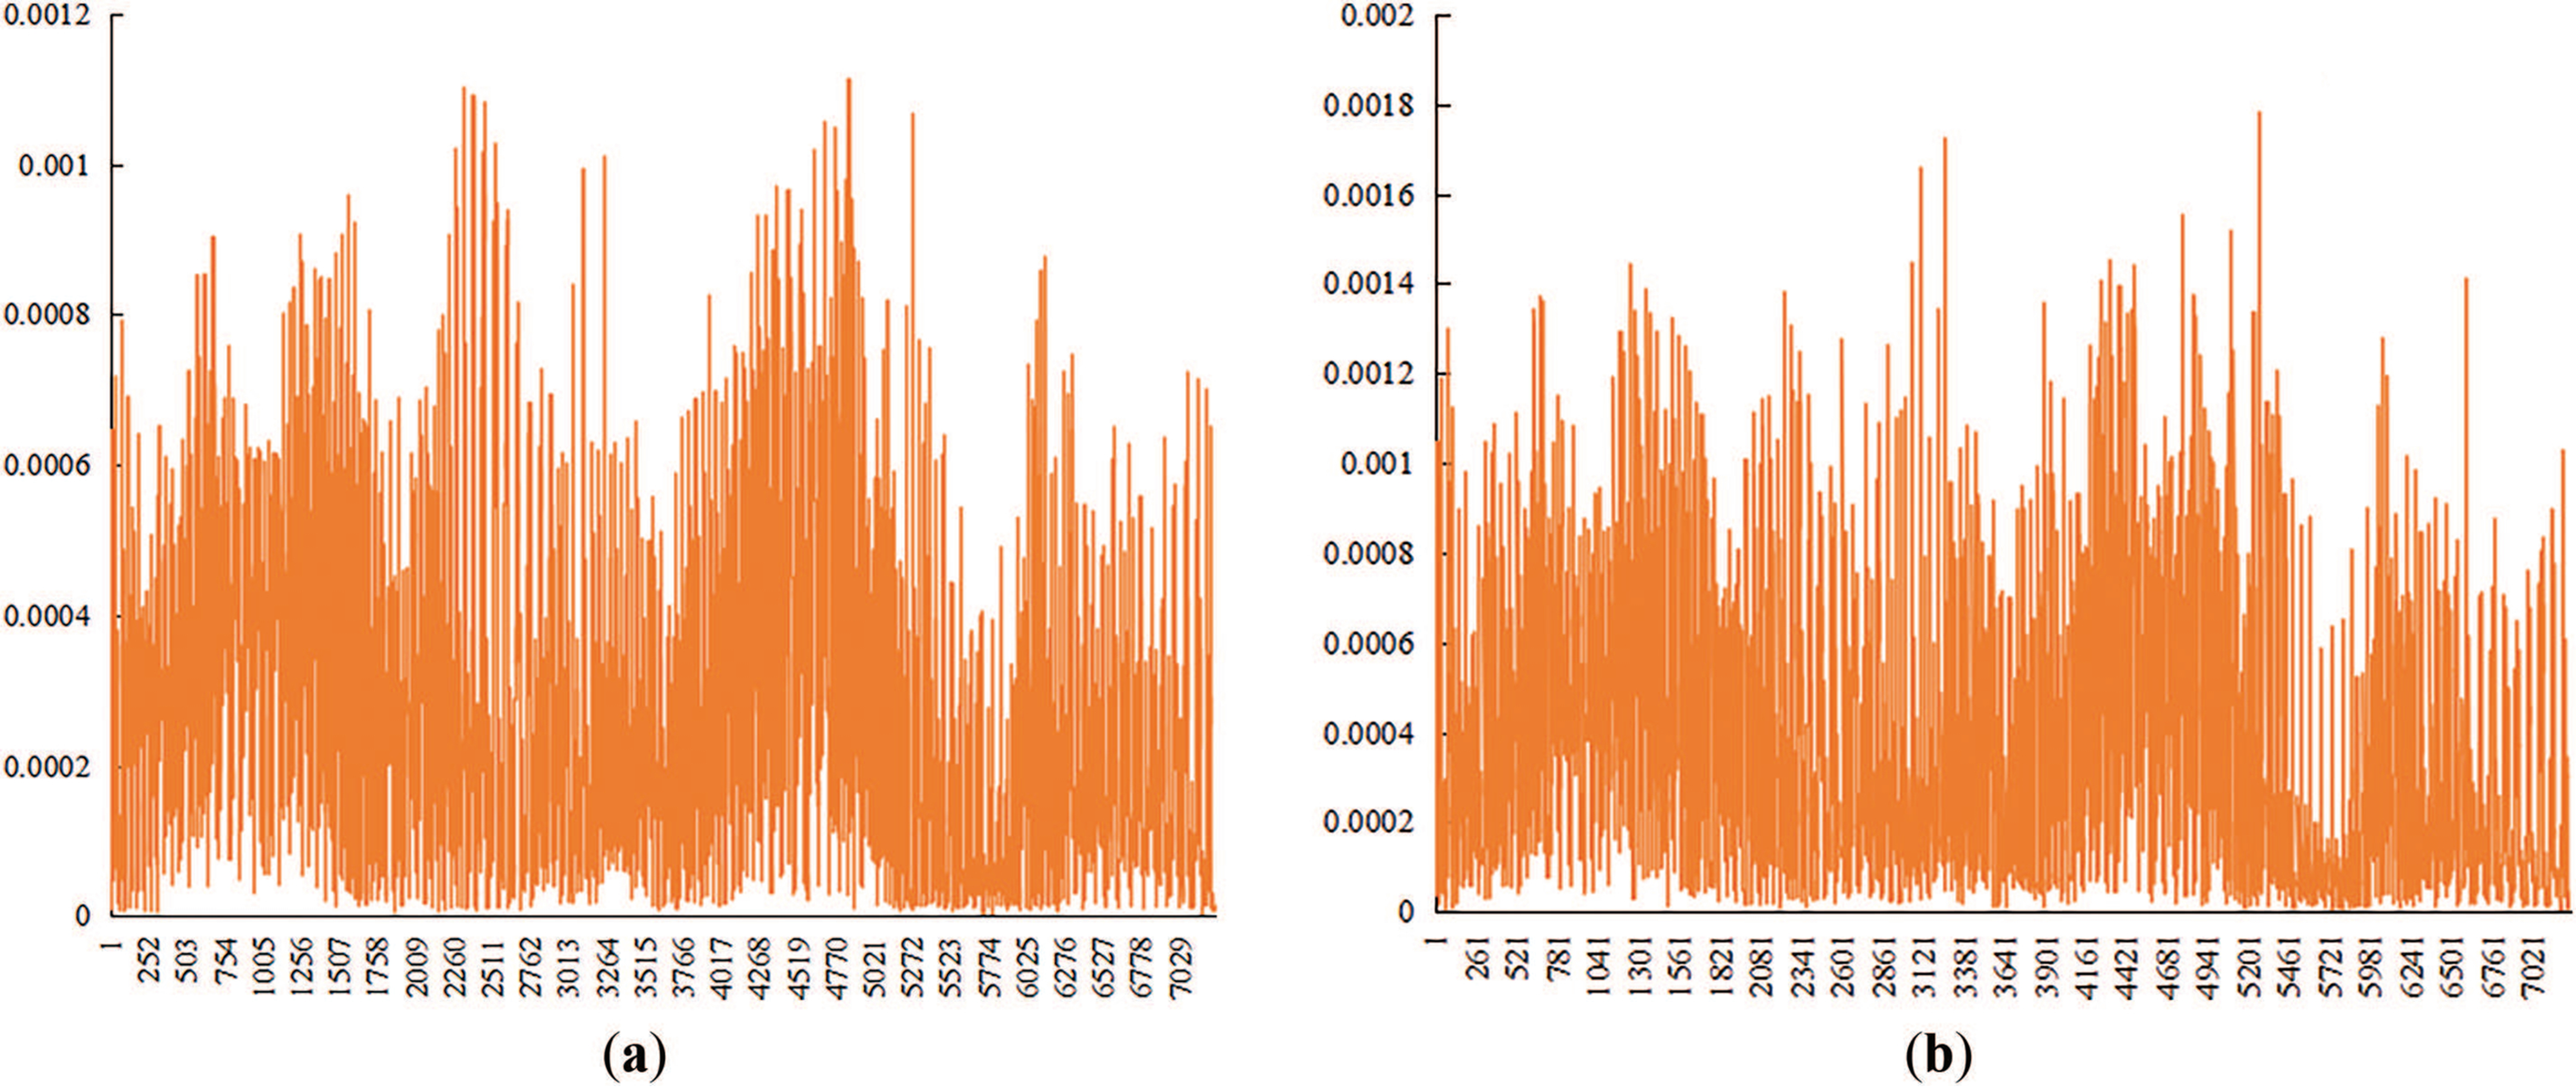
Figure 15: Fluid velocity statistics in cross-section of 40/70 mesh ceramic particles. (a) Surface tension coefficient = 0.007; (b) Surface tension coefficient = 0.005; (c) Surface tension coefficient = 0.003
Figure 16: Fluid velocity statistics in cross-section of 40/70 mesh quartz sand. (a) Surface tension coefficient = 0.007; (b) Surface tension coefficient = 0.005; (c) Surface tension coefficient = 0.003
The displacement velocities of both proppants increase with the decrease of surface tension coefficient, and the average fluid velocity in 40/70 mesh quartz sand is always lower than that in 40/70 mesh ceramic proppant. Displacement was rapid initially, slowing gradually later as gas displaced readily accessible water first. As gas advances and water content in pores decreases, later-stage displacement becomes slower until complete water displacement is achieved.
This study employed an LBM multiphase flow model to simulate gas-water two-phase flow within propped fractures, yielding insights into phase distribution and flow velocity behavior. The main conclusions are:
(1) Under 15 MPa closure pressure, the pore structure of 40/70 mesh ceramic particles is simpler and exhibits higher porosity compared to quartz sand of equivalent size. Increased closure pressure generally leads to more complex pore structures and reduced porosity in proppant packs. Higher porosity provides larger flow channels, enabling higher fluid displacement velocities.
(2) Displacement velocity for both proppants increased with driving force. The average fluid velocity within 40/70 mesh quartz sand was consistently lower than within ceramic particles under identical conditions. Displacement was rapid initially, gradually slowing until complete water displacement. The displacement process exhibited preferential flow through larger pores. “Bypass flow” around particle surfaces was common in structures with high sphericity.
(3) Displacement velocity for both proppants increased as surface tension decreased. The average fluid velocity in 40/70 mesh quartz sand remained lower than in 40/70 mesh ceramic particles. Velocity was primarily controlled by the degree of pore meandering: displacement was relatively high in straight, wide pores, forming distinct “dominant channels”. And it is positively correlated with the characteristic of being fast first and then slow in terms of time.
(4) Displacement efficiency is affected by various factors such as porosity, driving force and surface tension. Efficiency increased with higher porosity, larger driving force, and lower surface tension.
Acknowledgement: Not applicable.
Funding Statement: The authors received no specific funding for this study.
Author Contributions: Study conception and design, Jian Yang; writing—original draff preparation, Xinghao Gou, Jiayi Sun; writing—review and editing, Fei Liu, Xiaojin Zhou; funding acquisition and supervision, Xu Liu; investigation, Tao Zhang. All authors reviewed the results and approved the final version of the manuscript.
Availability of Data and Materials: The data that support the findings of this study are available from the corresponding author upon reasonable request.
Ethics Approval: Not applicable.
Conflicts of Interest: The authors declare no conflicts of interest to report regarding the present study.
References
1. Wu Q, Xu Y, Zhang S, Wang T, Guan B, Wu G, et al. Core theories and key optimization designs of volume stimulation technology for unconventional oil/gas reservoirs. Acta Pet Sin. 2014;35(4):704–14. doi:10.7623/syxb201404011. [Google Scholar] [CrossRef]
2. Wu Q, Xu Y, Wang X, Wang T, Zhang S. Volume fracturing technology of unconventional reservoirs: connotation, design optimization and implementation. Pet Explor Dev. 2012;39(3):377–84. doi:10.1016/s1876-3804(12)60054-8. [Google Scholar] [CrossRef]
3. Gong B, Liu X, Qin G. Lattice Boltzmann model for gas-liquid two-phase flow of multi-component hydrocarbon mixtures. Pet Explor Dev. 2014;41(5):633–40. doi:10.1016/s1876-3804(14)60083-5. [Google Scholar] [CrossRef]
4. Shamsi MMM, Nia SF, Jessen K. Dynamic conductivity of proppant-filled fractures. J Pet Sci Eng. 2017;151(4):183–93. doi:10.1016/j.petrol.2016.12.030. [Google Scholar] [CrossRef]
5. Li J, Wang Z, Wei J, Zhao Y. Shale gas upscaling seepage simulation based on lattice Boltzmann and finite difference methods. Daqing Pet Geol Dev. 2019;38(3):144–51. doi:10.19597/J.ISSN.1000-3754.201903022. [Google Scholar] [CrossRef]
6. Fan M, Li Z, Han Y, Teng Y, Chen C. Experimental and numerical investigations of the role of proppant embedment on fracture conductivity in narrow fractures (includes associated errata). SPE J. 2021;26(1):324–41. doi:10.2118/204222-pa. [Google Scholar] [CrossRef]
7. Zhao X, Sang Q, Dong M. NMR characterization and lattice Boltzmann simulation of oil-water distribution in shale reservoirs. In: Proceedings of 2021 International Field Exploration and Development Conference; 2021 Oct 20–22; Qingdao, China. (In Chinese). doi:10.26914/c.cnkihy.2021.052274. [Google Scholar] [CrossRef]
8. Feng D, Chen Z, Wu K, Li J, Dong X, Peng Y, et al. A comprehensive review on the flow behaviour in shale gas reservoirs: multi-scale, multi-phase, and multi-physics. Can J Chem Eng. 2022;100(11):3084–122. doi:10.1002/cjce.24439. [Google Scholar] [CrossRef]
9. Wang H, Wang W, Su Y, Jin Z. Lattice Boltzmann model for oil/water two-phase flow in nanoporous media considering heterogeneous viscosity, liquid/solid, and liquid/liquid slip. SPE J. 2022;27(6):3508–24. doi:10.2118/210564-pa. [Google Scholar] [CrossRef]
10. Shabro V, Torres-Verdin C, Javadpour F. Numerical simulation of shale-gas production: from pore-scale modeling of slip-flow, Knudsen diffusion, and Langmuir desorption to reservoir modeling of compressible fluid. In: North American Unconventional Gas Conference and Exhibition; 2011 Jun 14–16; The Woodlands, TX, USA. doi:10.2118/144355-ms. [Google Scholar] [CrossRef]
11. Sun H, Chawathé A, Hoteit H, Shi X, Li L. Understanding shale gas flow behavior using numerical simulation. SPE J. 2015;20(1):142–54. doi:10.2118/167753-pa. [Google Scholar] [CrossRef]
12. Liu D, Pu H, Xue K, Ni H. Numerical simulation of gas-water two-phase flow patterns in fracture: implication for enhancing natural gas production. Water. 2024;16(19):2860. doi:10.3390/w16192860. [Google Scholar] [CrossRef]
13. Tang H, Luo S, Liang H, Zeng B, Zhang L, Zhao Y, et al. Integrated numerical simulation of hydraulic fracturing and production in shale gas well considering gas-water two-phase flow. Pet Explor Dev. 2024;51(3):684–96. doi:10.1016/S1876-3804(24)60497-0. [Google Scholar] [CrossRef]
14. Kamani N, Zeraatgar H, Ketabdari MJ. Numerical simulation of fluid-granular interactions (FGI) using improved two-phase incompressible smooth particle hydrodynamics. Ocean Eng. 2025;324(12):120662. doi:10.1016/j.oceaneng.2025.120662. [Google Scholar] [CrossRef]
15. Ghedira A, Lataoui Z, Benselama AM, Bertin Y, Jemni A. Numerical simulation of incompressible two-phase flows with phase change process in porous media. Results Eng. 2025;25(3):103706. doi:10.1016/j.rineng.2024.103706. [Google Scholar] [CrossRef]
16. Uzyanbaev RM, Bobreneva YO, Poveshchenko YA, Podryga VO, Polyakov SV, Rahimly PI, et al. Numerical modeling of two-phase fluid filtration for carbonate reservoir in two-dimensional formulation. Mathematics. 2024;12(21):3412. doi:10.3390/math12213412. [Google Scholar] [CrossRef]
17. Kükrer E, Eskin N. Air-water two-phase flow dynamics analysis in complex U-bend systems through numerical modeling. Computation. 2024;12(4):81. doi:10.3390/computation12040081. [Google Scholar] [CrossRef]
18. Nishio J, Kurose R. Numerical simulation of gas-liquid two-phase flow in a horizontal manifold with downward branches. J Fluid Sci Technol. 2024;19(1):JFST0002. doi:10.1299/jfst.2024jfst0002. [Google Scholar] [CrossRef]
19. Latifiyan N, Rahimian MH, Haghani-Hassan-Abadi R, Ashna M, Jafari A. Numerical simulation of droplet evaporation in three-component multiphase flows using lattice Boltzmann method. Acta Mech. 2022;233(11):4817–49. doi:10.1007/s00707-022-03307-2. [Google Scholar] [CrossRef]
20. Rossi D, Di Giorgio S, Pirozzoli S. Comparative analysis of volume of fluid and phase-field methods for numerical simulations of two-phase flows. Int J Multiph Flow. 2025;189(3):105245. doi:10.1016/j.ijmultiphaseflow.2025.105245. [Google Scholar] [CrossRef]
21. Creux P. The experimental and numerical modeling challenges related to multiphase flows in subsurface resource exploitation. Energies. 2025;18(4):826. doi:10.3390/en18040826. [Google Scholar] [CrossRef]
22. Peters S, Heider Y, Markert B. Numerical simulation of miscible multiphase flow and fluid-fluid interaction in deformable porous media. PAMM. 2023;23(2):e202300209. doi:10.1002/pamm.202300209. [Google Scholar] [CrossRef]
23. Giudici LM, Raeini AQ, Akai T, Blunt MJ, Bijeljic B. Pore-scale modeling of two-phase flow: a comparison of the generalized network model to direct numerical simulation. Phys Rev E. 2023;107(3):035107. doi:10.1103/PhysRevE.107.035107. [Google Scholar] [PubMed] [CrossRef]
24. Varaksin AY, Ryzhkov SV. Mathematical modeling of gas-solid two-phase flows: problems, achievements and perspectives (a review). Mathematics. 2023;11(15):3290. doi:10.3390/math11153290. [Google Scholar] [CrossRef]
25. Golparvar A, Zhou Y, Wu K, Ma J, Yu Z. A comprehensive review of pore scale modeling methodologies for multiphase flow in porous media. Adv Geo-Energy Res. 2018;2(4):418–40. doi:10.26804/ager.2018.04.07. [Google Scholar] [CrossRef]
26. De Santis A, Colombo M, Hanson BC, Fairweather M. A generalized multiphase modelling approach for multiscale flows. J Comput Phys. 2021;436(1):110321. doi:10.1016/j.jcp.2021.110321. [Google Scholar] [CrossRef]
27. Duran O, Devloo PRB, Gomes SM, Villegas J. A multiscale mixed finite element method applied to the simulation of two-phase flows. Comput Methods Appl Mech Eng. 2021;383(3):113870. doi:10.1016/j.cma.2021.113870. [Google Scholar] [CrossRef]
28. Qian YH, D’Humières D, Lallemand P. Lattice BGK models for navier-stokes equation. Europhys Lett. 1992;17(6):479–84. doi:10.1209/0295-5075/17/6/001. [Google Scholar] [CrossRef]
29. Yang J, Xu Y, Yang L. Taichi-LBM3D: a single-phase and multiphase lattice Boltzmann solver on cross-platform multicore CPU/GPUs. Fluids. 2022;7(8):270. doi:10.3390/fluids7080270. [Google Scholar] [CrossRef]
30. Du F, Wang K, Dong X, Wei J. Numerical simulation study on damage and failure of coal-rock combination based on CT three-dimensional reconstruction. J China Coal Soc. 2021;46(201):253–62. doi:10.13225/j.cnki.jccs.2020.1079. [Google Scholar] [CrossRef]
31. Wang F, Wu X, Duan C, Han X, Zhang Y. Quantitative characterization of shale fractures and fracability evaluation based on three-dimensional CT reconstruction. Prog Geophys. 2023;38(5):2147–59. doi:10.6038/pg2023GG0625. [Google Scholar] [CrossRef]
32. Deng P. Research on two-dimensional porous media seepage based on lattice Boltzmann method [dissertation]. Dalian, China: Dalian University of Technology; 2014. (In Chinese). [Google Scholar]
33. Shan X, Chen H. Lattice Boltzmann model for simulating flows with multiple phases and components. Phys Rev E. 1993;47(3):1815–9. doi:10.1103/physreve.47.1815. [Google Scholar] [PubMed] [CrossRef]
34. Cai P, Que Y, Li X. Numerical simulation of water-gas two-phase displacement process in unsaturated granite residual soil. Hydrogeol Eng Geol. 2021;48(6):54–63. doi:10.16030/j.cnki.issn.1000-3665.202010017. [Google Scholar] [CrossRef]
35. Lamei Ramandi H, Pirzada MA, Saydam S, Arns C, Roshan H. Digital and experimental rock analysis of proppant injection into naturally fractured coal. Fuel. 2021;286(22):119368. doi:10.1016/j.fuel.2020.119368. [Google Scholar] [CrossRef]
Cite This Article
 Copyright © 2025 The Author(s). Published by Tech Science Press.
This work is licensed under a Creative Commons Attribution 4.0 International License , which permits unrestricted use, distribution, and reproduction in any medium, provided the original work is properly cited.
 Downloads
 Citation Tools