
 Submit a Paper
 Propose a Special lssue
 Open Access
ARTICLE

Multiphysics Simulation of Flow and Heat Transfer in Titanium Slag Smelting within an Electric Arc Furnace
1 Faculty of Metallurgy and Energy Engineering, Kunming University of Science and Technology, Kunming, 650093, China
2 National Local Joint Engineering Research Center of Energy Saving and Environment Protection Technology in Metallurgy and Chemical Engineering Industry, Kunming University of Science and Technology, Kunmin, 650093, China
3 Yunnan Key Laboratory of Clean Energy and Energy Storage Technology, Kunming University of Science and Technology, Kunming, 650093, China
4 Kunming Cigarette Factory, HongyunHonghe Tobacco (Group) Co., Ltd., Kunming, 650000, China
* Corresponding Authors: Shan Qing. Email: ; Jifan Li. Email:
Fluid Dynamics & Materials Processing 2025, 21(9), 2253-2272. https://doi.org/10.32604/fdmp.2025.067429
Received 03 May 2025; Accepted 05 August 2025; Issue published 30 September 2025
 View Full Text
 Download PDF
Abstract
Heat and mass transfer within an electric arc furnace are strongly influenced by extreme temperatures and complex electromagnetic fields. Variations in temperature distribution play a crucial role in determining melt flow patterns and in the formation of stagnant regions, commonly referred to as dead zones. To better understand the internal flow dynamics and thermal behavior of the furnace, this study develops a multiphysics coupled model that integrates fluid heat transfer with Maxwell’s electromagnetic field equations. Numerical simulations are conducted to systematically examine how key operational parameters, such as electric current and arc characteristics, affect the heat transfer performance inside the furnace. The analysis reveals that arc length is the dominant factor governing both current density and heat distribution in the molten bath. Specifically, increasing the arc length from 200 mm to 400 mm results in a 16.1% rise in maximum current density within the titanium slag layer, from 7128 A/m2 to 8270 A/m2. However, a longer arc also introduces higher interfacial thermal resistance, which impedes heat transfer efficiency and leads to a significant drop in the peak temperature of the titanium slag, from 2618 K to 2125 K. These findings underscore the dual impact of arc length on both electrical and thermal behavior, highlighting the need for careful optimization.Keywords
Titanium, known as the “space metal” due to its lightweight and high-strength properties, has found extensive applications in fields such as aerospace [1], biomedical [2], and petrochemicals [3]. Currently, the global titanium industry is transitioning from a single-mode market primarily focused on aerospace to a diversified model emphasizing new areas such as metallurgical energy [4] and carbon cycle utilization [5]. The electric arc furnace melting process is a critical step in the production of high-titanium slag, directly impacting the quality and yield of the product. However, the harsh environmental conditions within the high-temperature reaction zone of the furnace pose significant challenges to comprehensive industrial testing, making experimental progress difficult. Therefore, to better study the detailed interactions between the electric arc and the melt, numerical simulation, with its unique advantages, has gradually become an effective tool for researchers.
The shape of the electric arc furnace, arc characteristics, and current density distribution are crucial factors influencing the magnetohydrodynamic heat transfer properties and the uniformity of melt mixing, making them persistent research topics in electric arc furnace metallurgy [6,7,8,9]. As early as 2001, Ramírez et al. [10] developed a coupled flow-heat transfer-electromagnetic model for the melt zone in a direct current arc furnace, investigating the phenomena of melt flow and heat transfer under the influence of different process parameters. Subsequently, Wang et al. [11] developed a mathematical model incorporating mass, energy, and momentum balance equations along with Maxwell’s equations to describe the heat transfer phenomena in the arc and melt pool regions of the arc furnace. Wu et al. [12] combined experimental and numerical methods to study the changes in arc morphology, electrostatic characteristics, arc voltage, and arc length, revealing the arc phenomena under pressure. Karalis et al. [13] established a three-dimensional mathematical model for fluid flow, heat transfer, and electromagnetic phenomena in the arc furnace, their study interpreted the interaction between slag properties and heat flow within the furnace. Ren et al. [14] developed a three-dimensional magneto-thermal-fluid simulation program to simulate the movement of arcs under magnetic field effects. Cui et al. [15] described the influence of the magnetic field on the velocity-temperature distribution within the furnace based on a transient three-dimensional model, and verified the accuracy of their custom function program using existing literature data. Their simulation results indicated that the Lorentz force is the primary factor affecting the velocity and temperature distributions.
To further investigate arc characteristics and analyze the internal flow and heat transfer patterns in electric arc furnaces, Dietz et al. [16] developed a power balance-based electric arc furnace model using Monte Carlo and genetic algorithms [17]. Cui et al. [18] established magnetohydrodynamic (MHD) equations for plasma arcs, and integrated the models of fluid flow and heat transfer with those for arc-slag interactions. They tracked the interface properties of the molten material using the VOF model and explored the effects of slag viscosity and arc length on interfacial motion behavior. Yan et al. [19] employed the Euler-Lagrange method to study particle flow behavior in plasma smelting furnaces.
Furthermore, to better couple the flow and heat transfer characteristics between the arc and the molten pool, methods such as the equivalent heat source method [20] and the channel arc model (CAM) [21] have been employed to simulate the heat transfer phenomena between the arc and the molten pool. Yao et al. [22] studied the flow and heat transfer process in an electric arc furnace using the “local thermodynamic equilibrium diffusion approximation” method, based on a unified two-dimensional axisymmetric model of the arc coupled with the molten pool. Qian et al. [23] combined the energy equation with Maxwell’s equations to calculate the heat transfer from the arc to the rigid anode surface. Alexis et al. [24] studied the heat transfer between the arc and the molten pool, considering the arc distribution and temperature field as boundary conditions.
The aforementioned research has, to some extent, revealed the characteristics of magnetohydrodynamics and the regularity of temperature distribution within electric arc furnaces. However, due to the complexity of the internal environment of the arc furnace, the phenomena of flow and heat transfer during the smelting process remain difficult to fully depict. This study aims to further explore the influence of current on the arc and temperature distribution, as well as to reveal the mechanism by which process parameters affect arc characteristics, by constructing a numerical simulation model of a titanium slag electric arc furnace.
2 Methodology and Simulation Details
In this study, due to the position of the graphite electrode being above the melt at the center of the furnace body, and the simulation process focusing primarily on the electric arc and molten zone within the furnace, the entire model was simplified into an axisymmetric model. The computational domain was set with a height of 1000 mm and a width of 500 mm. Specific local mesh refinement was applied to the arc region, resulting in a total of 124,964 meshes for the two-dimensional model, with an average mesh growth rate of 1.1. The model and mesh division are shown in Fig. 1a, where the yellow region represents the gas phase, the blue region represents the titanium slag layer (with a liquid level height ranging from 230 mm to 280 mm), and the red region represents the iron (molten) layer (with a liquid level height ranging from 180 mm to 230 mm).
The physical and chemical phenomena occurring inside a direct current arc furnace are highly complex, involving the interaction of electromagnetic forces with fluid dynamics, as well as heat transfer induced by arc discharge and chemical reactions. This study simplifies these phenomena and defines them under specific boundary conditions. According to the volt-ampere characteristic curve of a 30 MW arc furnace (as shown in Fig. 1b), the full-power current range is 43.3 kA to 61.2 kA, the design voltage is 490 V to 693 V, the overall resistance range is 8 to 16 mΩ, and the arc length is 200 to 400 mm. The initial conditions inside the furnace are set as follows: the initial temperature of the titanium slag and electrodes is 1850 K, the initial temperature of the molten iron is 1450 K, the initial temperature of the furnace bottom boundary is 1400 K and the furnace wall boundary is 306.2 K. Titanium slag and molten iron are simplified as incompressible fluids with constant physical parameters such as viscosity and density. The physical properties of the iron (molten) and titanium slag are shown in Table 1.
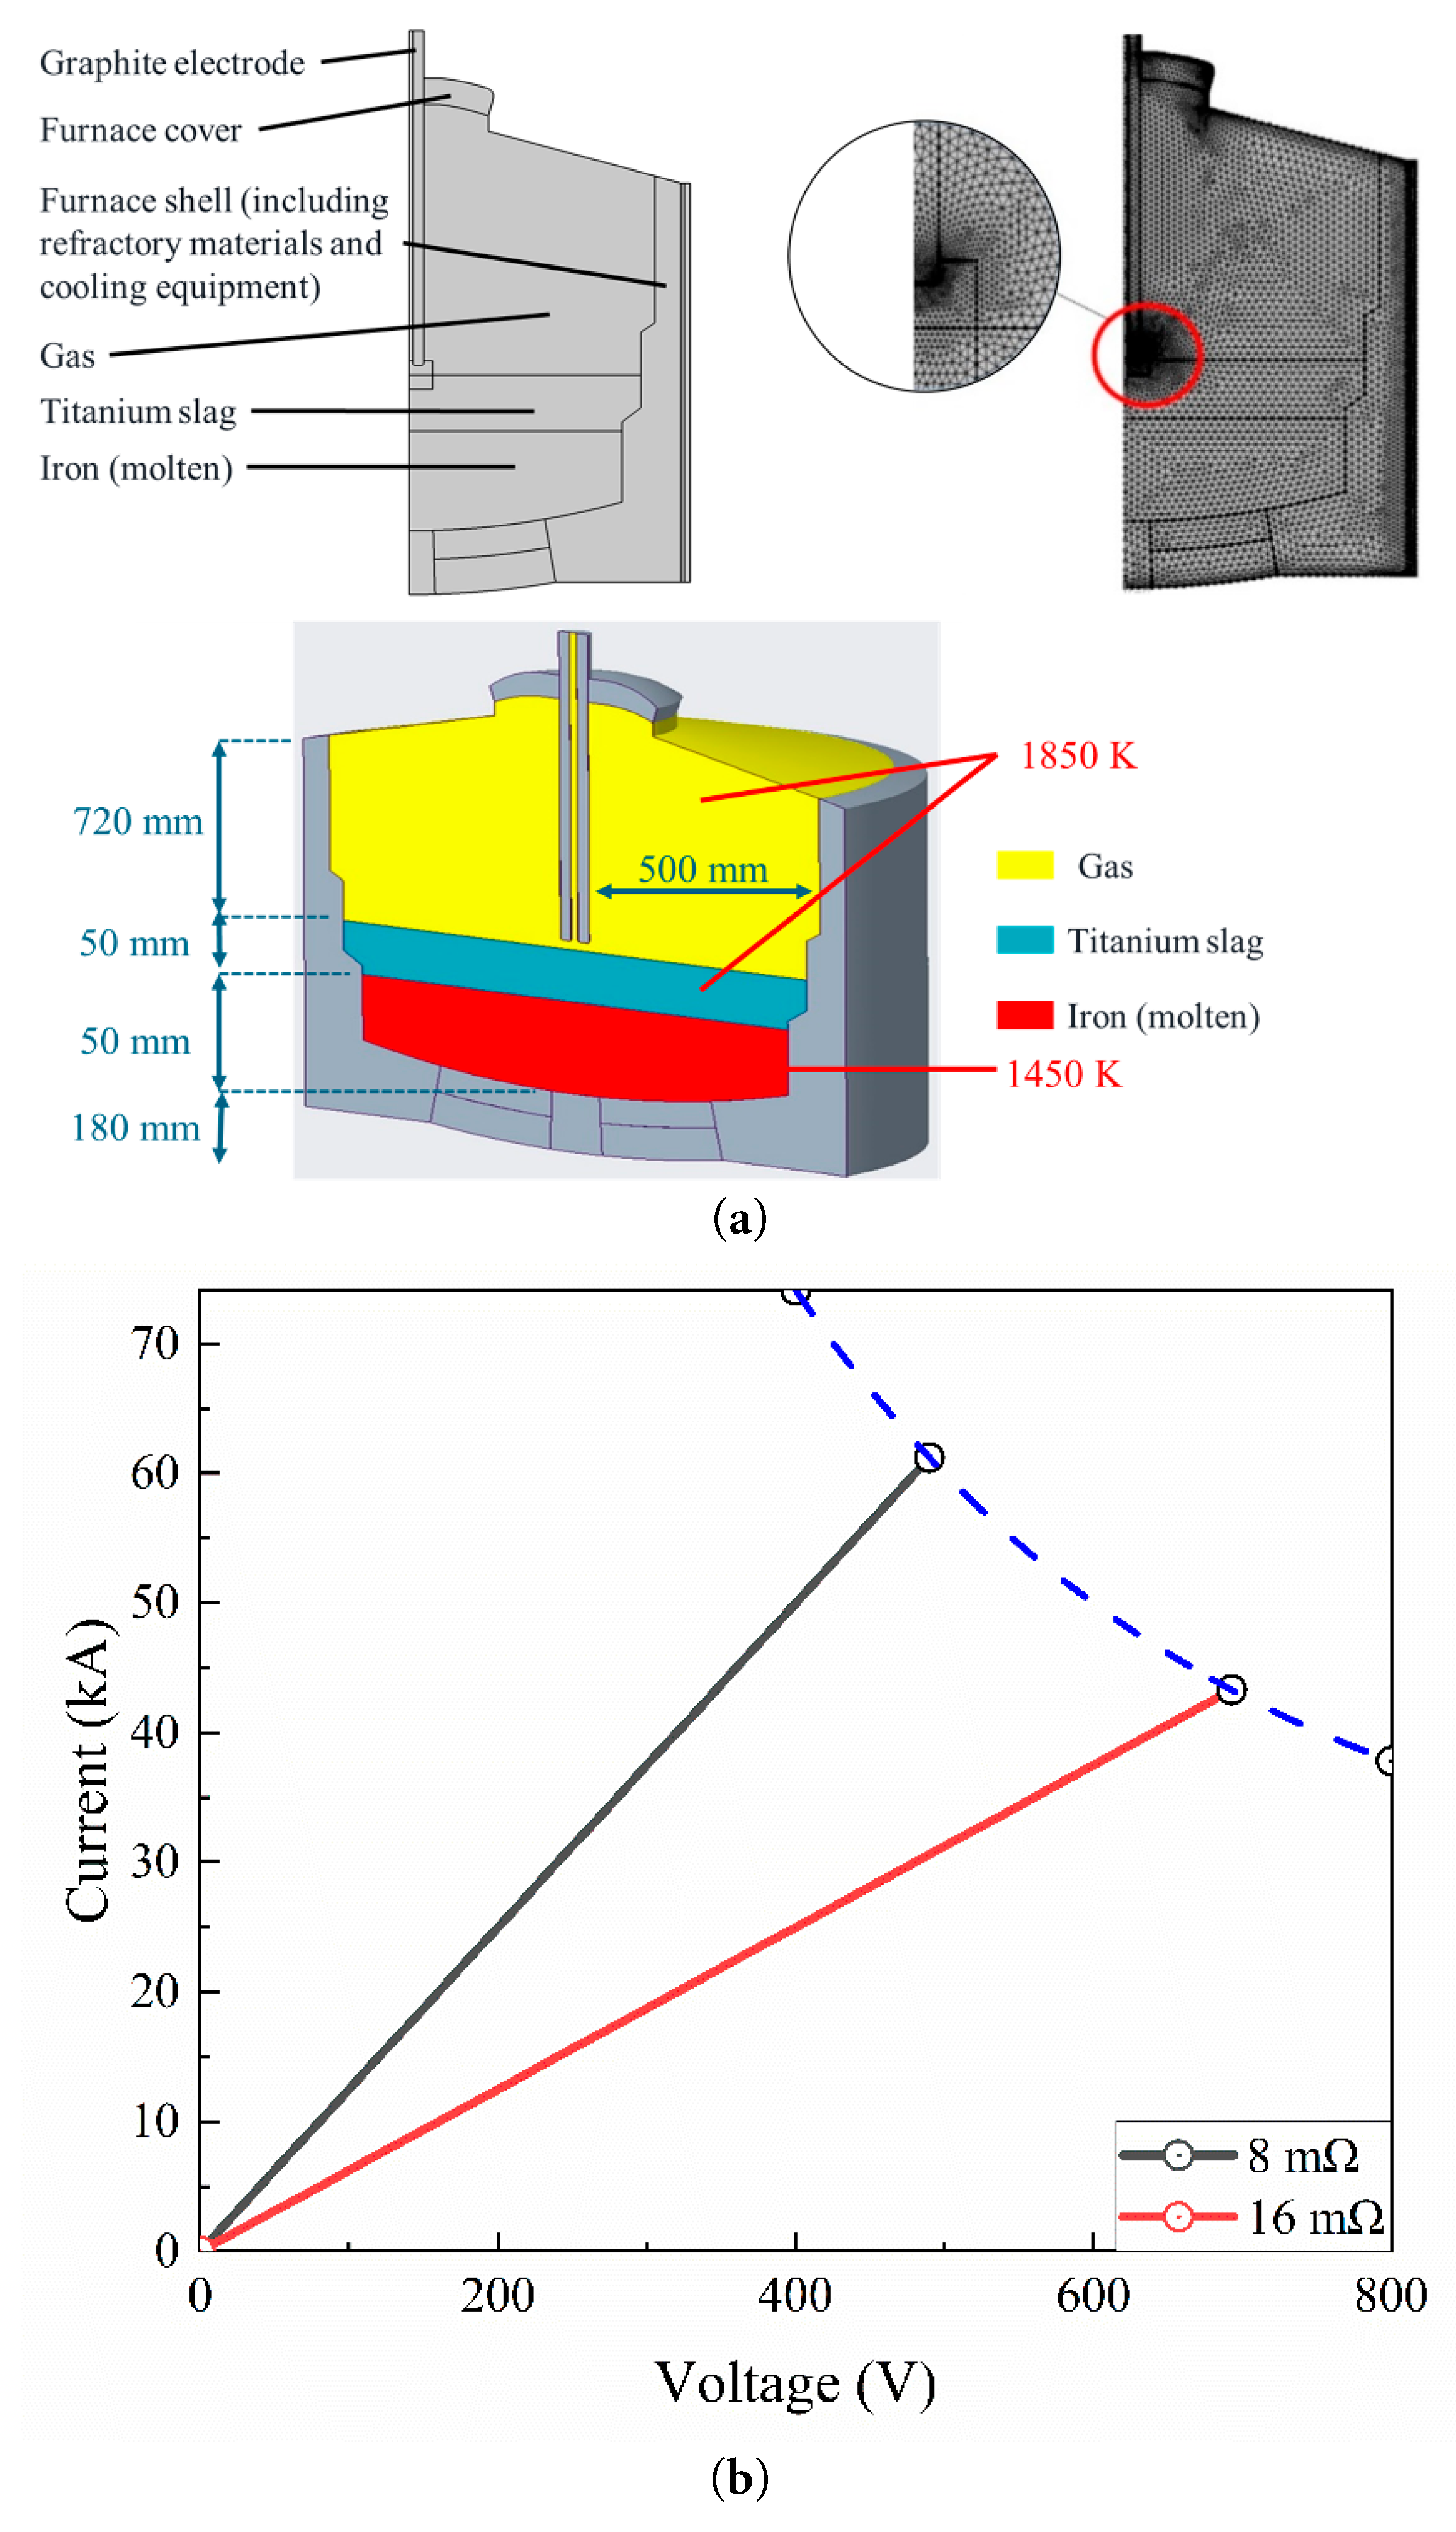
Figure 1: Arc furnace settings: (a) model and mesh, (b) The voltage-current characteristic curve.
Table 1: The physical properties.
| Parameters | Viscosity Pa·s | Thermal Conductivity W/(m·K) | Density kg/m3 | Heat Capacity J/(kg·K) | Electrical Conductivity S/m |
|---|---|---|---|---|---|
| Gas | 4.16 × 10⁻⁵ | 0.0555 | 0.353 | 1050 | - |
| Titanium slag | 0.349 (interpolation estimation) | 3.78 (interpolation estimation) | 6845.2 | 824. | 1.04 × 10⁷ |
| Iron (molten) | 0.005 (interpolation estimation) | 41.163 (interpolation estimation) | 3796.7 | 1257.2 | 8888.9 |
The high-temperature arc jet causes the gas inside the furnace to be in a turbulent state [25]. Gas, titanium slag, and iron (molten) inside the electric arc furnace are treated as incompressible fluids, with the effect of molecular viscosity considered negligible. ln this study, the Realizable k-ε equation is employed as the fundamental governing equations for the fluid, which builds upon the Reynolds-Averaged Navier-Stokes (RANS) equations by incorporating equations for turbulent kinetic energy and turbulence dissipation rate [26]. The turbulence model is employed to characterize the flow features within the electric arc furnace, and it has been validated and applied in previous research [27,28]. The entire flow process is characterized by the balances of mass, momentum, and energy, which are described by the continuity equation, the Navier-Stokes equation, and the total energy equation. In order to account for the properties of the furnace gas, a mixture thermodynamic model (Peng-Robinson equation of state) is employed to describe its state [29]. As an an Euler-Euler (VOF) method is employed to analyze the gas-liquid two-phase flow inside the furnace, the continuity equation reads.
The momentum equation under the Boussinesq approximation reads.
The turbulent kinetic energy equation, and turbulent dissipation rate equation are presented as Eqs. (3) and (4).
The energy equation and the expression of the electromagnetic force are reported in the next two sections, respectively.
The heat generated in the electric arc furnace is primarily composed of the Joule heat from the arc, the heat from the reduction reaction of ilmenite and the combustion reaction of coal powder. Correspondingly, the heat losses mainly arise from the carried away by exhaust gases, slag, and external cooling processes. This study simplifies these heat sources and treats them as heat inputs, which include conduction, convection, and radiation. The equations are shown in Eqs. (5) and (6).
The energy equation is shown as Eq. (7).
The graphite electrodes inside the electric arc furnace discharge to generate arcs, which interact with the fluid. In addition, the Lorentz force acts on the conducting fluid, causing disturbances, thus necessitating the consideration of electromagnetic forces. The electromagnetic induction equations include Gauss’s law for magnetism, Faraday’s law of electromagnetic induction, and Maxwell-Ampère’s law. These act as external forces on the fluid inside the furnace, as shown in Eqs. (8)–(12) [30].
2.3 Grid Independence and Model Validation
2.3.1 Grid Independence Validation
The number of grids and the grid resolution in numerical simulations significantly affect the accuracy of the computed results. To ensure computational accuracy, 50,732, 75,432, 87,456, 101,789, 124,964, and 149,036 grid numbers were set, respectively. Under simulation conditions where the input power of the arc furnace is maintained at 30 MW, the average temperature of the molten bath is calculated across different grid resolutions to eliminate the effects of variations in grid number on the results. Fig. 2 shows the variation curve of the temperature deviation rate, and Table 2 presents a detailed comparison between the computed temperatures and the theoretical values. When using a relatively coarse mesh, there is a significant error between the simulated temperature and the theoretical temperature. At a minimum mesh count of 50,732, the maximum deviation reaches 11.7% (in absolute terms). As the number of meshes increases, the deviation gradually decreases, reducing to 8.3% when the mesh count is 75,432. When the number of grids is more than 120,000, the temperature deviation is less than 2%, indicating that the grid resolution meets the computational requirements.
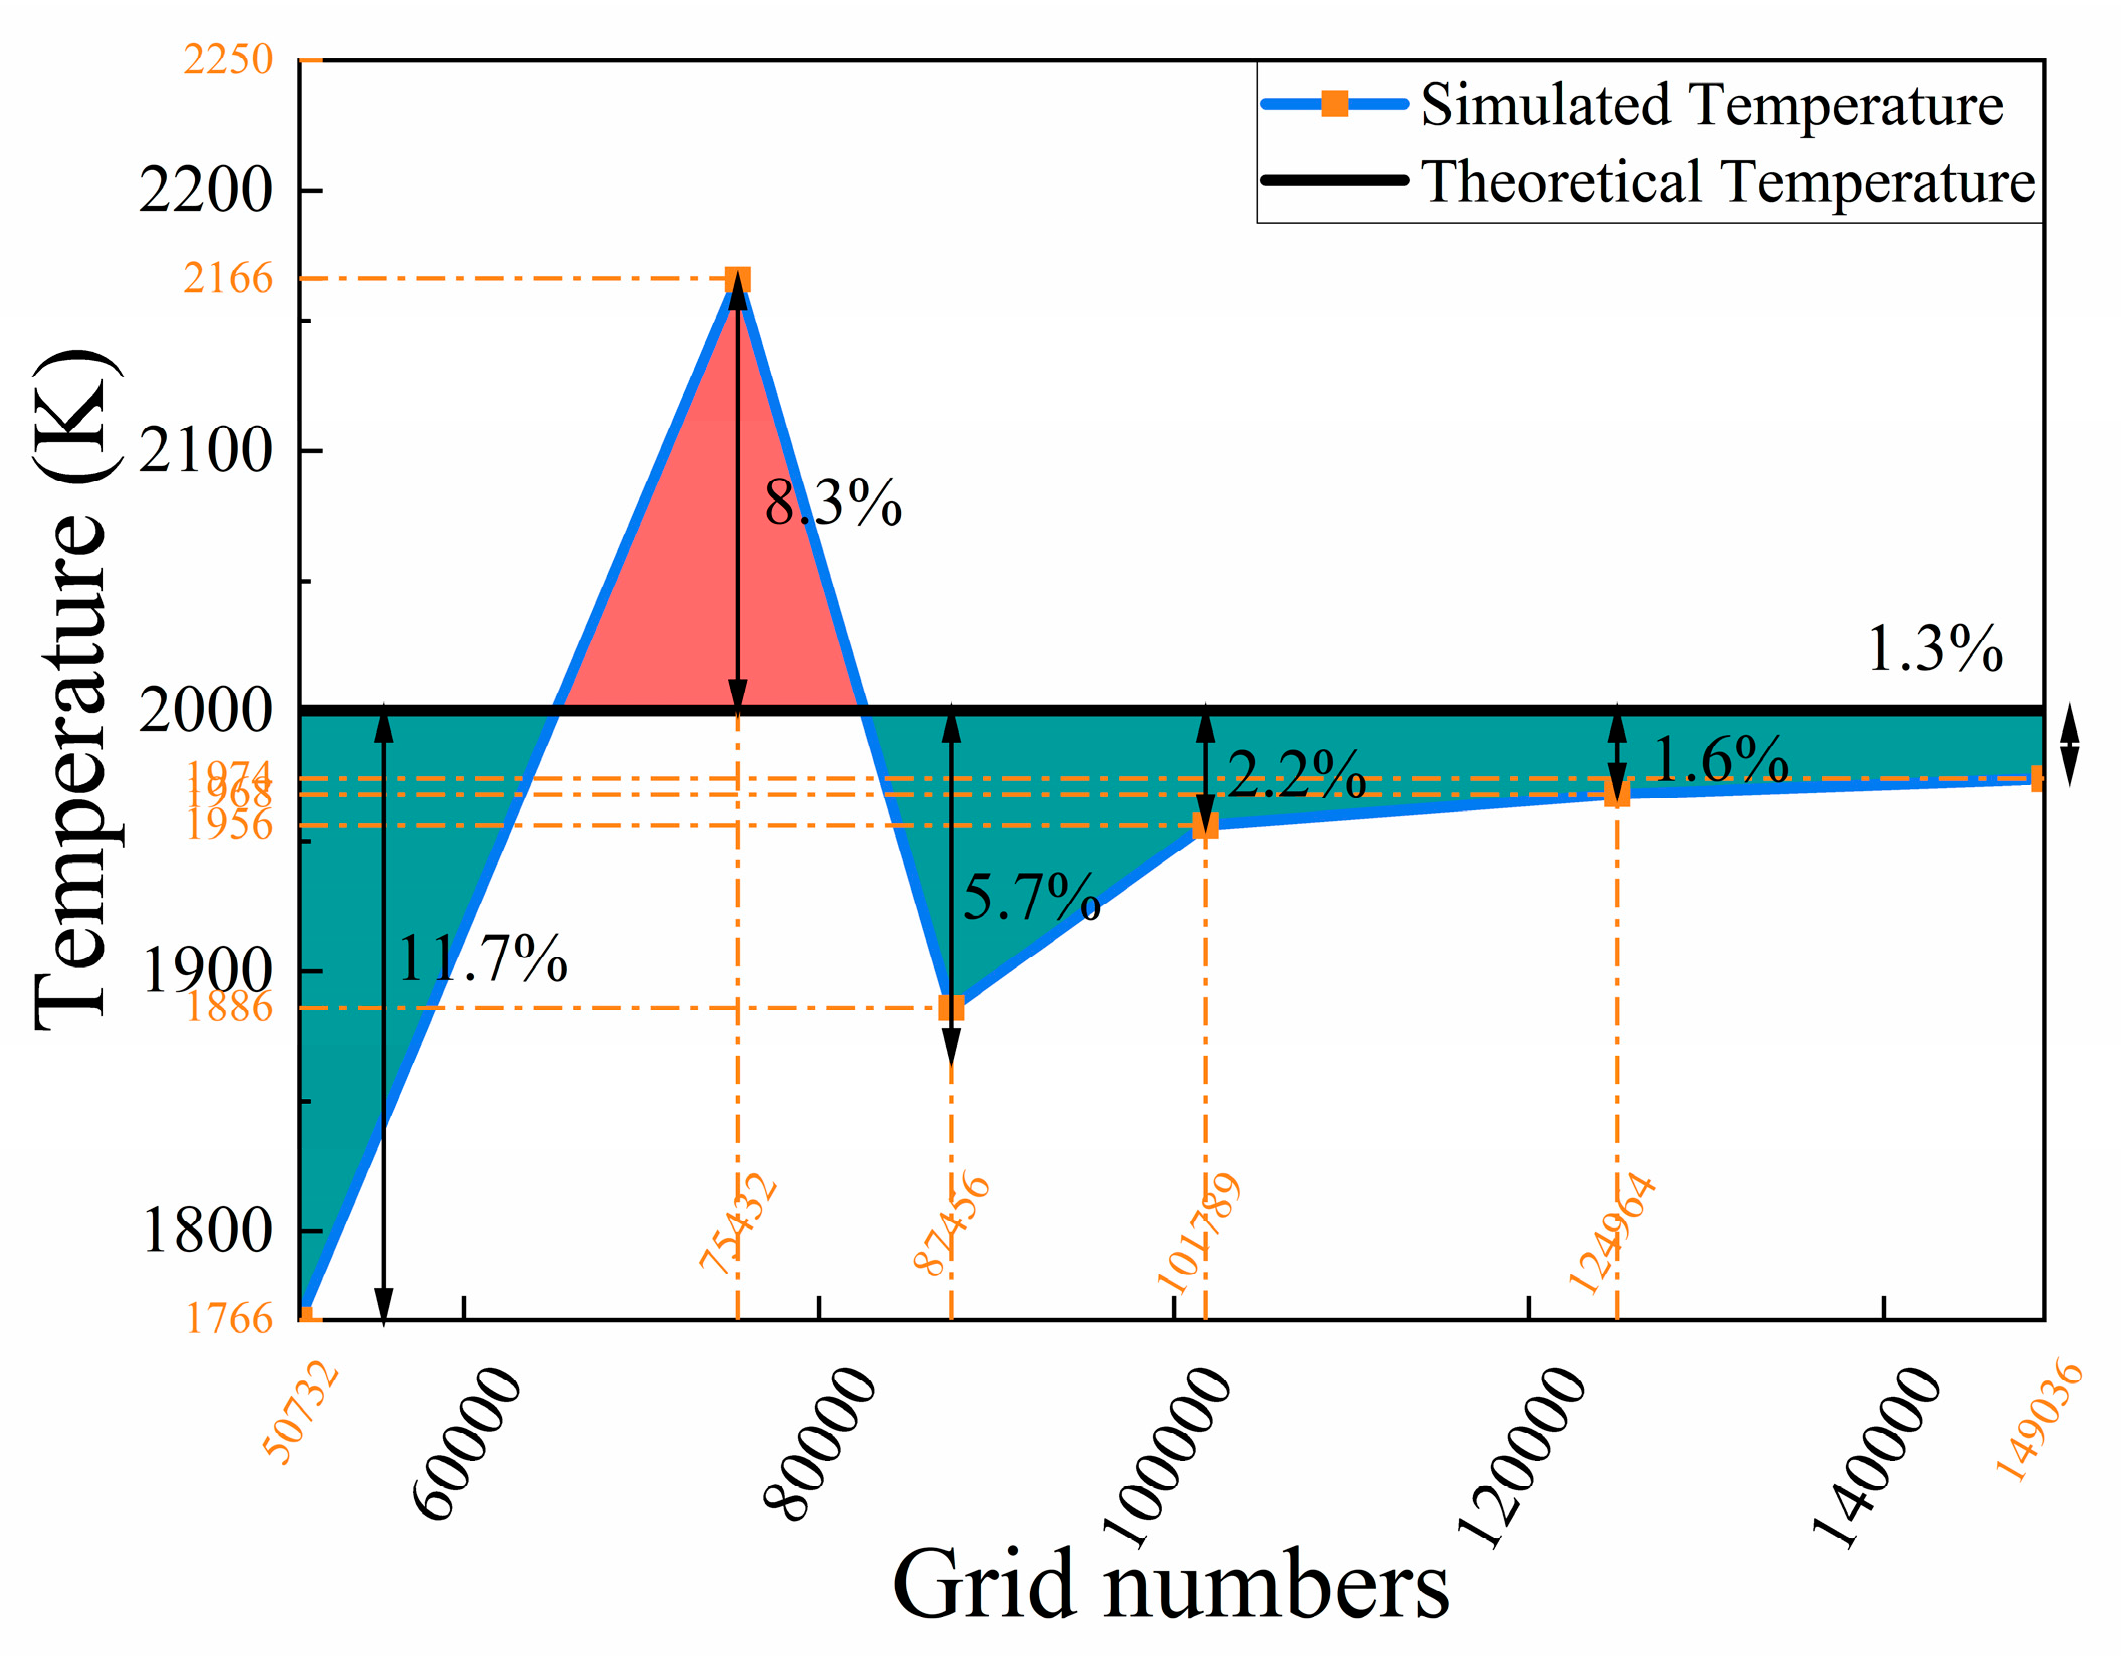
Figure 2: Temperature deviation rate in the furnace.
Table 2: Verification of grid independence.
| The Number of Grids | Simulated Temperature K | Theoretical Temperature K | Deviation Rate (Absolute Value) % |
|---|---|---|---|
| 50,732 | 1766 | 2000 | 11.7 |
| 75,432 | 2166 | 2000 | 8.3 |
| 87,456 | 1886 | 2000 | 5.7 |
| 101,789 | 1956 | 2000 | 2.2 |
| 124,964 | 1956 | 2000 | 1.6 |
| 149,036 | 1974 | 2000 | 1.3 |
The model validation was performed by comparing the computed temperatures in various sections of the furnace with field test temperatures from a certain enterprise. The experimental process flowchart is shown in Fig. 3a. Temperature measurements of the electric arc furnace’s outer wall are conducted using an infrared thermometer. Based on heat transfer theory and the properties of the furnace shell material, the melt temperature on the inner wall is estimated. Simultaneously, the temperatures of the flue gases and furnace slag are measured, with the acquired data being collected and recorded via computer. The measured flue gas temperature was approximately 2023 K, the titanium slag discharge temperature was around 2023 K, and the molten iron discharge temperature was about 1773 K. Additionally, by simulating the wall temperatures in different regions of the electric arc furnace, the flue gas and slag discharge temperatures were approximated. The simulated temperatures are consistent with the results reported by Elkoumy et al. [31]. As shown in Fig. 3b, the comparison between the experimental and simulation results indicates that the numerical calculations are in close agreement with the experimental measurements, meeting the requirements for subsequent research.
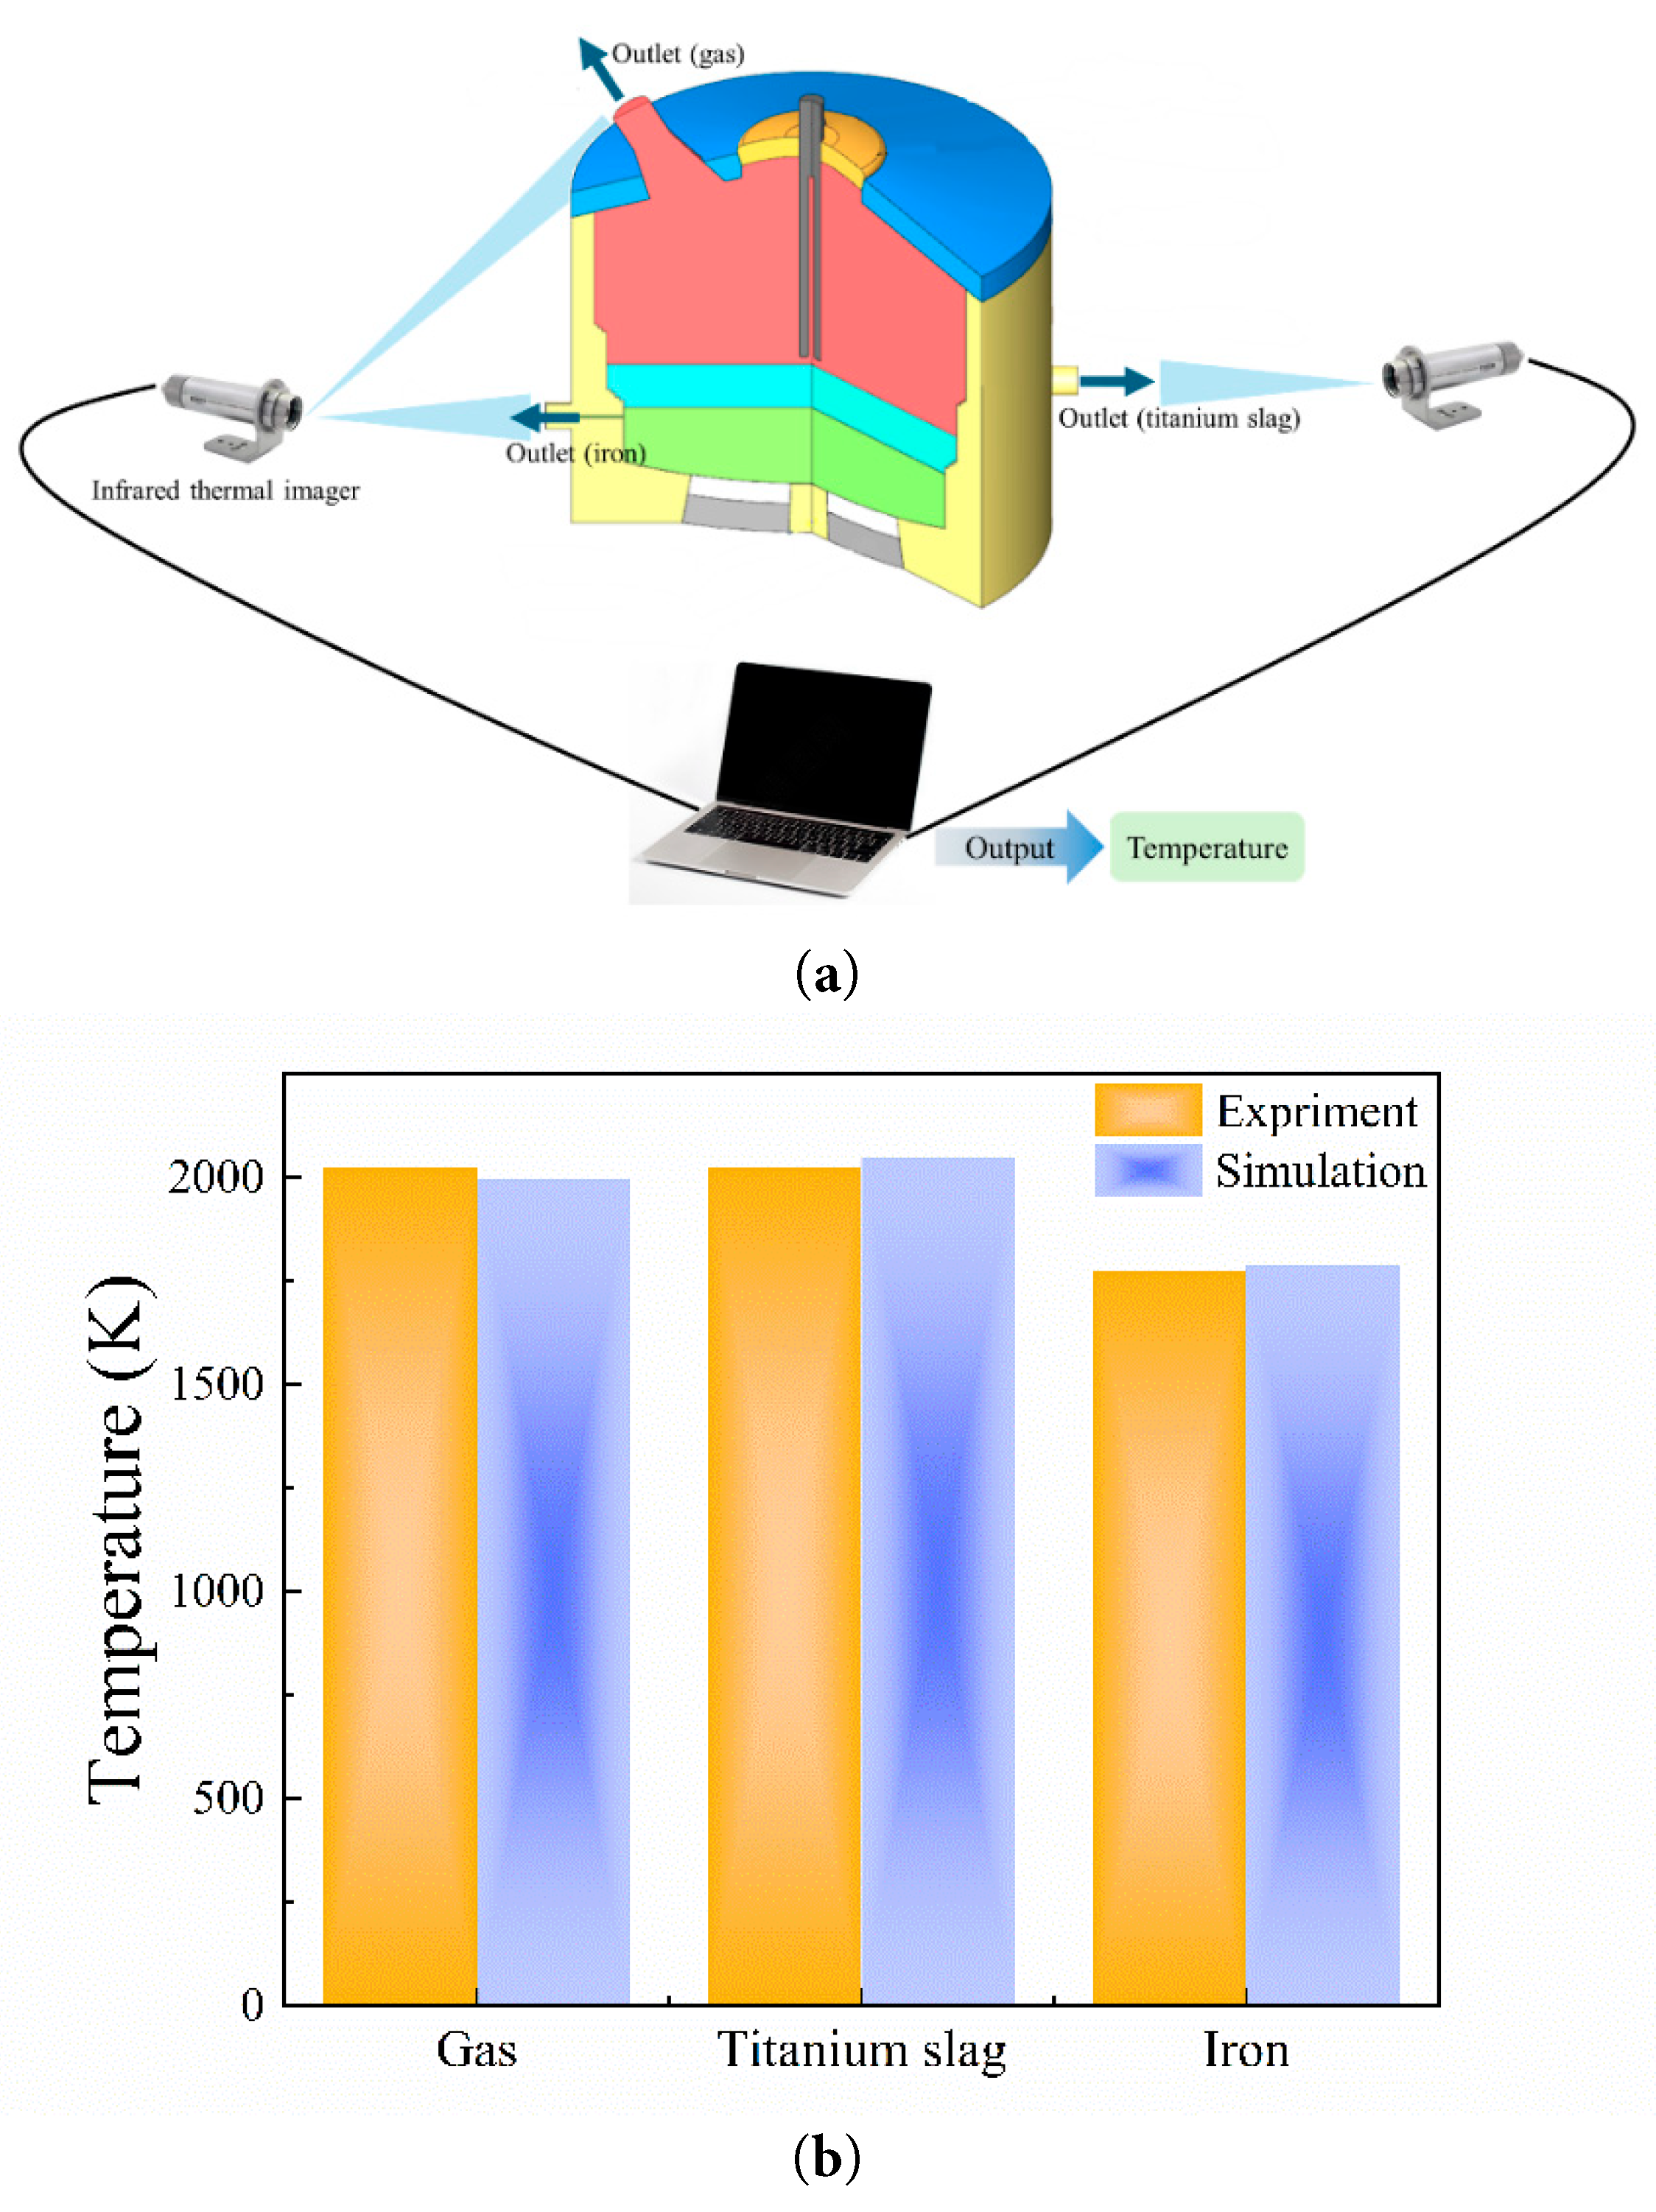
Figure 3: Model validation: (a) Schematic of temperature acquisition, (b) Comparison between experimental and simulated temperatures.
In the simulation, the electric arc furnace is simplified to a two-dimensional model, with the bottom of the solid graphite electrode positioned 20 mm away from the molten bath surface. The furnace gas above the melt is simplified as air, and from top to bottom, the first layer of the melt is titanium slag with a depth of 50 mm, followed by a second layer consisting of iron (molten) with a depth of 50 mm. The furnace gas, titanium slag, and molten iron are treated as incompressible fluids, and for simplification, the variations of the physical properties of the melt with temperature are not considered.
Before the initiation of the simulation, the following assumptions are made regarding the model: (1) the melt level is stable, with no fluctuations accounted for due to tapping operations; (2) to analyze the distribution of physical fields such as temperature and electric potential in the titanium slag and molten iron layers, they are assumed to be two immiscible fluids. The initial temperatures of the titanium slag and the furnace gas are set at 1850 K, while that of the molten iron is set at 1450 K, and the furnace wall is modeled as a magnesium-chromium brick material, with a constant thermal conductivity boundary condition set to a value of 13 W/(m·K).
This study employs a multiphysics-coupled transient analysis, using a time-stepping method based on the generalized-α method as the solver. The solution method utilized is the “segregated” approach, with a computational residual set to 1 × 10⁻⁴ and a time step of 0.1 s. In the simulation, the flow and heat transfer problems, among others, are solved jointly through the “multiphysics coupling” interface in the simulation settings. By coupling the electromagnetic, heat transfer, and fluid flow models, the “segregated” approach is employed, where one physical field is solved, and its solution serves as the basis for subsequently solving the next field, ultimately resulting in the outcomes for all fields. The computational method employs the finite elment-discontinuous galerkin Method (FEM-DG), utilizing a streamline upwind scheme for the spatial discretization and a semi-implicit discretization form for the temporal integration [32,33].
3.1 Distribution of Multi-Physical Field
3.1.1 Distribution of the Electric Potential
The arc length is defined as the distance between the bottom of the graphite electrode and the surface of the titanium slag. To simplify the simulation conditions, different arc lengths are simulated by adjusting the insertion depth of the graphite electrode. Current and potential magnitudes are crucial factors influencing the movement of molten material within the furnace. Fig. 4 illustrates the overall potential distribution inside the furnace when the arc length is 200 mm. From the distribution, it is observed that the potential decreases gradually from the bottom to the top. The highest potential point is located at the bottom wall of the furnace, measuring 509.7 V, while the lowest point is at the top electrode, where the potential is 0 V (indicating a grounded state). The high-potential region is primarily distributed below the titanium slag layer, whereas the potential in the carbon monoxide region above the titanium slag layer is relatively low. Under these conditions, the furnace current is 61.2 kA, the maximum potential is 509.7 V, and the overall resistance is 8 mΩ.
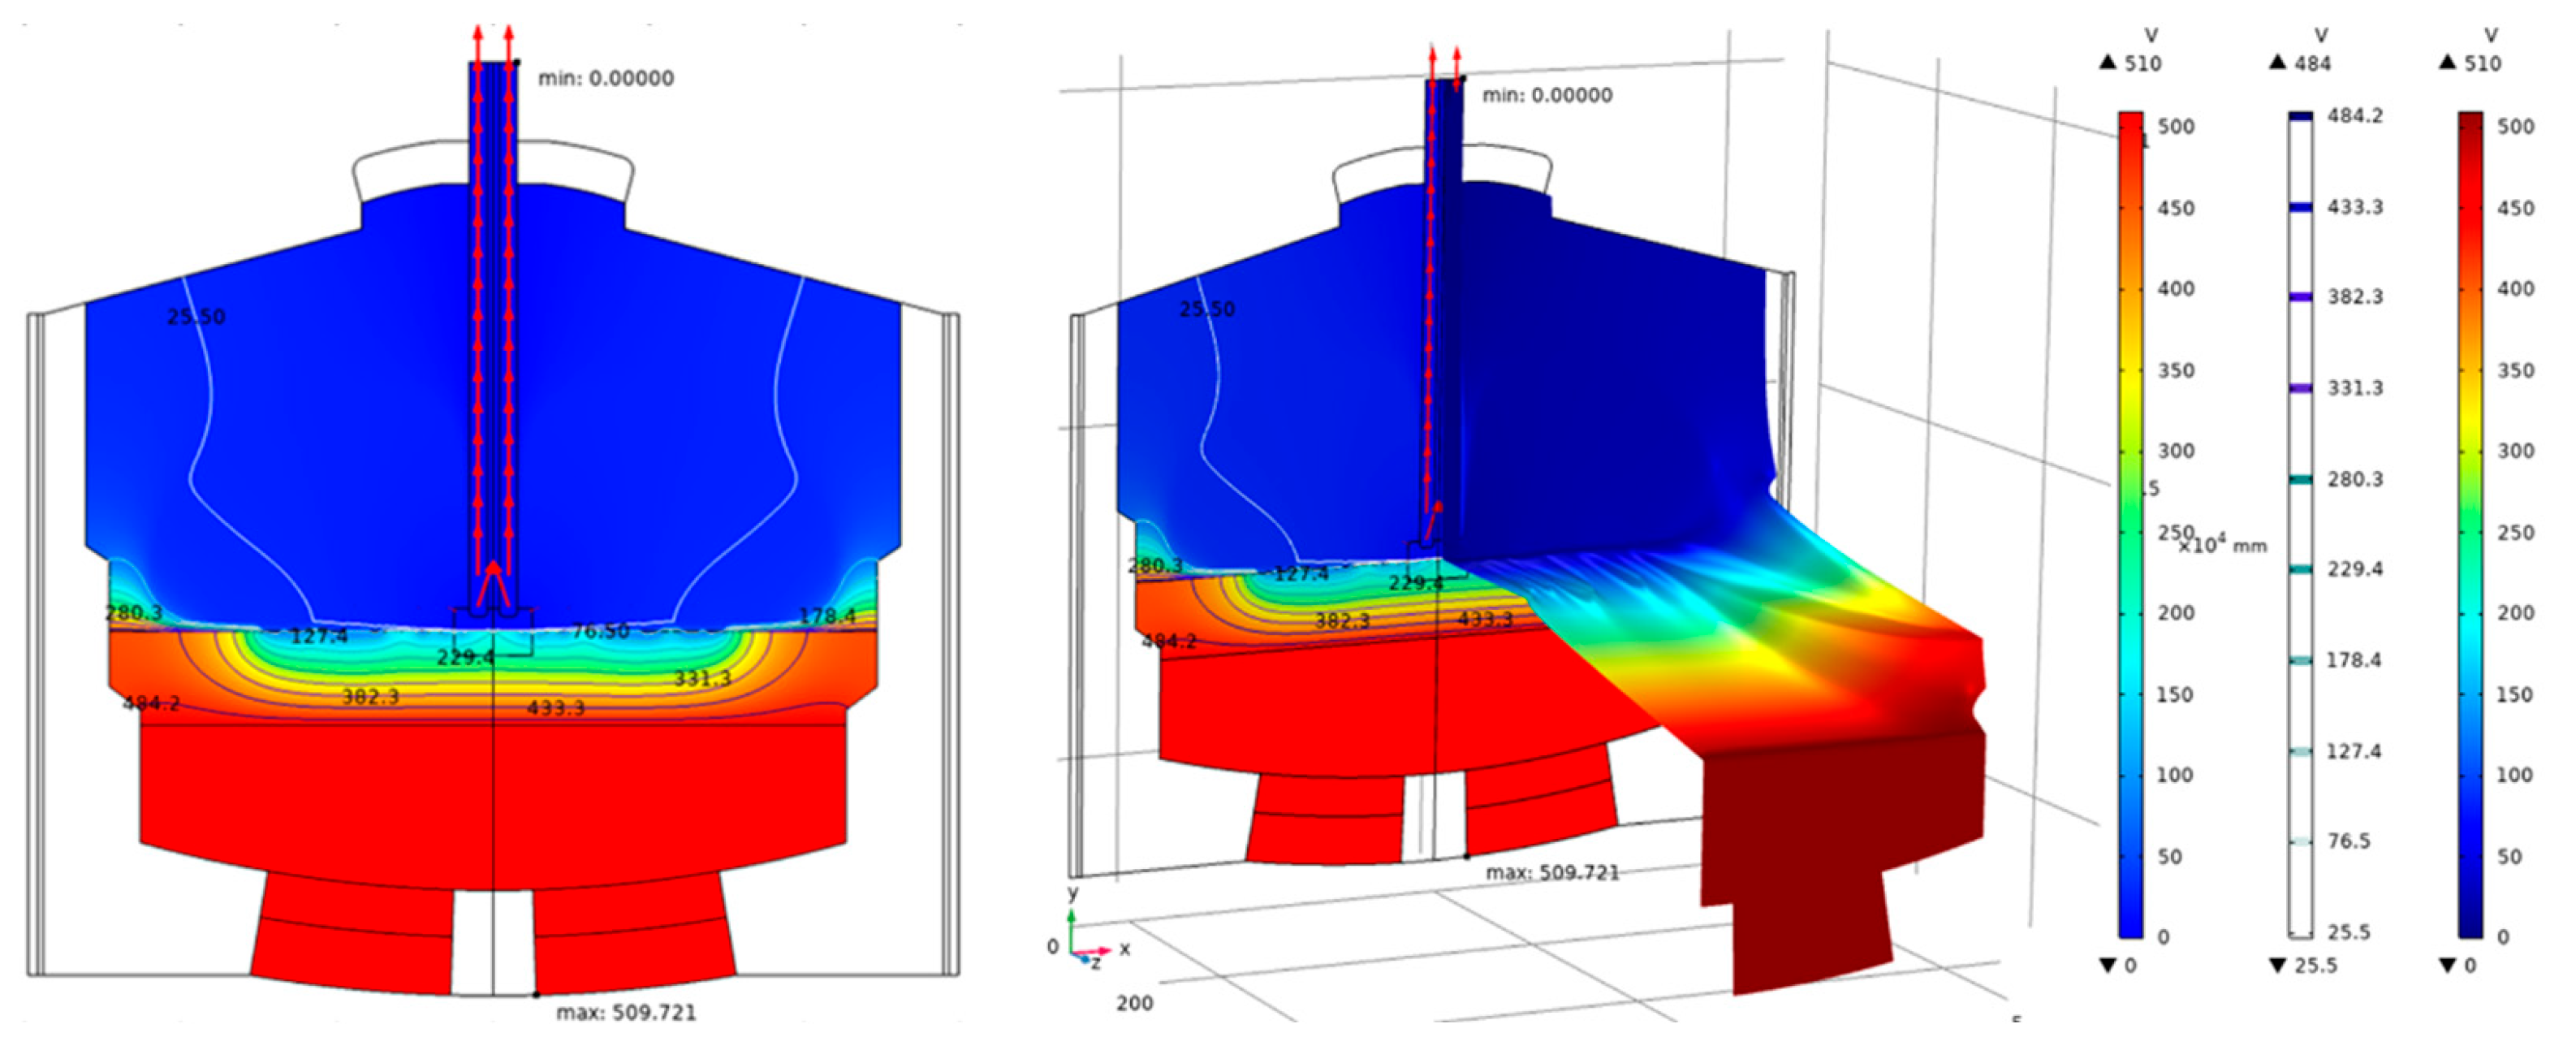
Figure 4: Potential distribution in the furnace with an arc length of 200 mm.
From the perspective of the distribution characteristics, high potential regions are primarily concentrated in the titanium slag layer, the iron (molten) layer, and the lower part of the electric arc furnace, with the titanium slag layer exhibiting the highest potential gradient. Near the furnace wall, the electric potential of the titanium slag is relatively high, maintaining an average value above 450 V. As one moves from the furnace wall toward the center of the furnace, the electric potential gradually decreases. Near the arc discharge region, the electric potential of the titanium slag drops below 150 V, and near the electrodes, the electric potential of the furnace gas further decreases to below 100 V. The electric potential distribution in the furnace gas region is relatively uniform, with both the electric potential and the potential gradient being the lowest across the entire region.
Upon separate analysis of the electrical potential of titanium slag and molten iron, it is evident that the electrical potential distribution of the melt is generally high, with a significant potential gradient. Fig. 5a illustrates the electrical potential distribution within the titanium slag layer. As depicted, the electrical potential of the titanium slag exhibits a downward trend from the bottom to the top and from the furnace wall to the center, with a substantial gradient. The maximum potential of the titanium slag is observed near the furnace wall, reaching 509.7 V, while the minimum potential is found beneath the arc, at 124.6 V. The high-potential regions of the titanium slag are primarily in the lower layer and the outer side of the slag layer, where the potential generally exceeds 400 V. In contrast, the low-potential regions of the titanium slag are mainly located where it contacts the furnace gas, with potentials below 200 V. The molten iron region, as shown in Fig. 5b, exhibits virtually no potential gradient and maintains a high-potential state overall, with potentials exceeding 500 V.
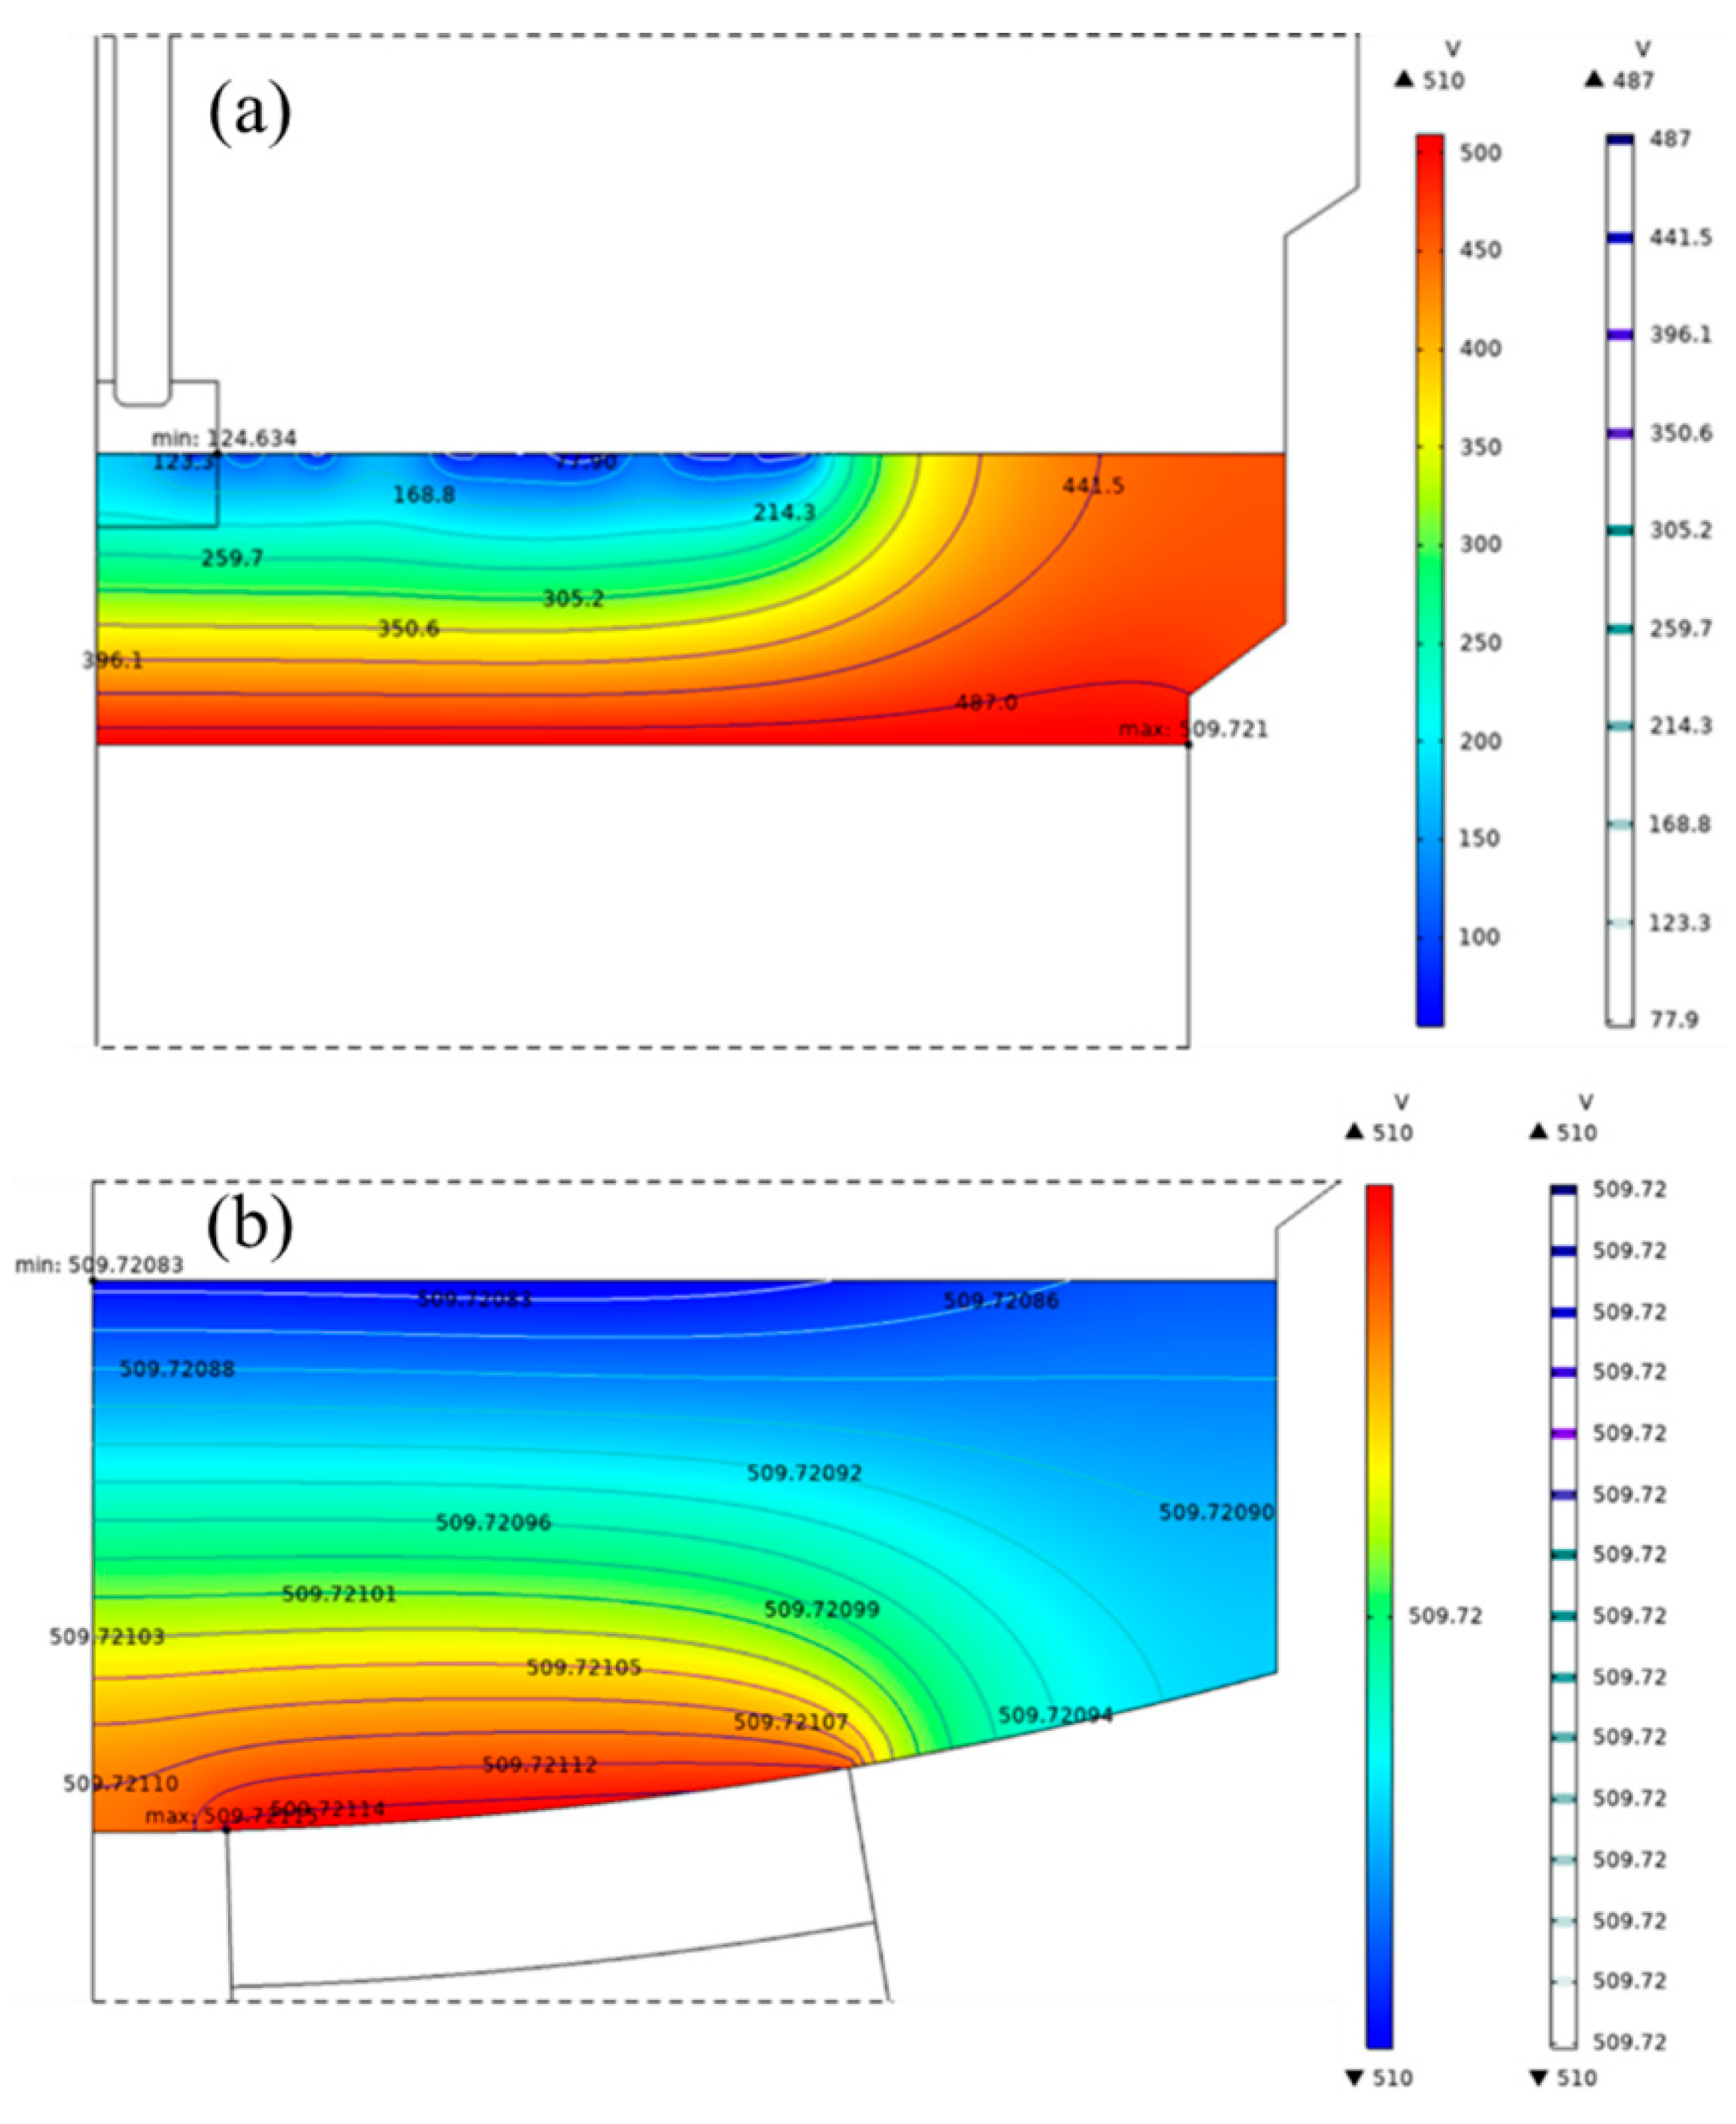
Figure 5: Electric potential distribution: (a) titanium slag layer, (b) iron (molten) layer.
3.1.2 Distribution of the Electric Potential
The current path within the electric arc furnace initiates at the magnesia-carbon bricks at the bottom of the furnace, then enters the interior of the arc furnace, subsequently passing through the magnesia bricks, the iron (molten) layer, the titanium slag layer, forming an arc at the center of the furnace, and finally exiting the arc furnace through the electrodes. The density distribution is illustrated in Fig. 6. The current density distribution reveals that at the graphite electrodes, the current is relatively concentrated and primarily distributed in the surrounding areas of the electrodes, with the maximum current density occurring in the arc region below the electrodes. This phenomenon arises because the current flow direction in the arc furnace is from the bottom of the furnace to the graphite electrodes, and the graphite electrodes are relatively small in volume compared to the entire furnace body.
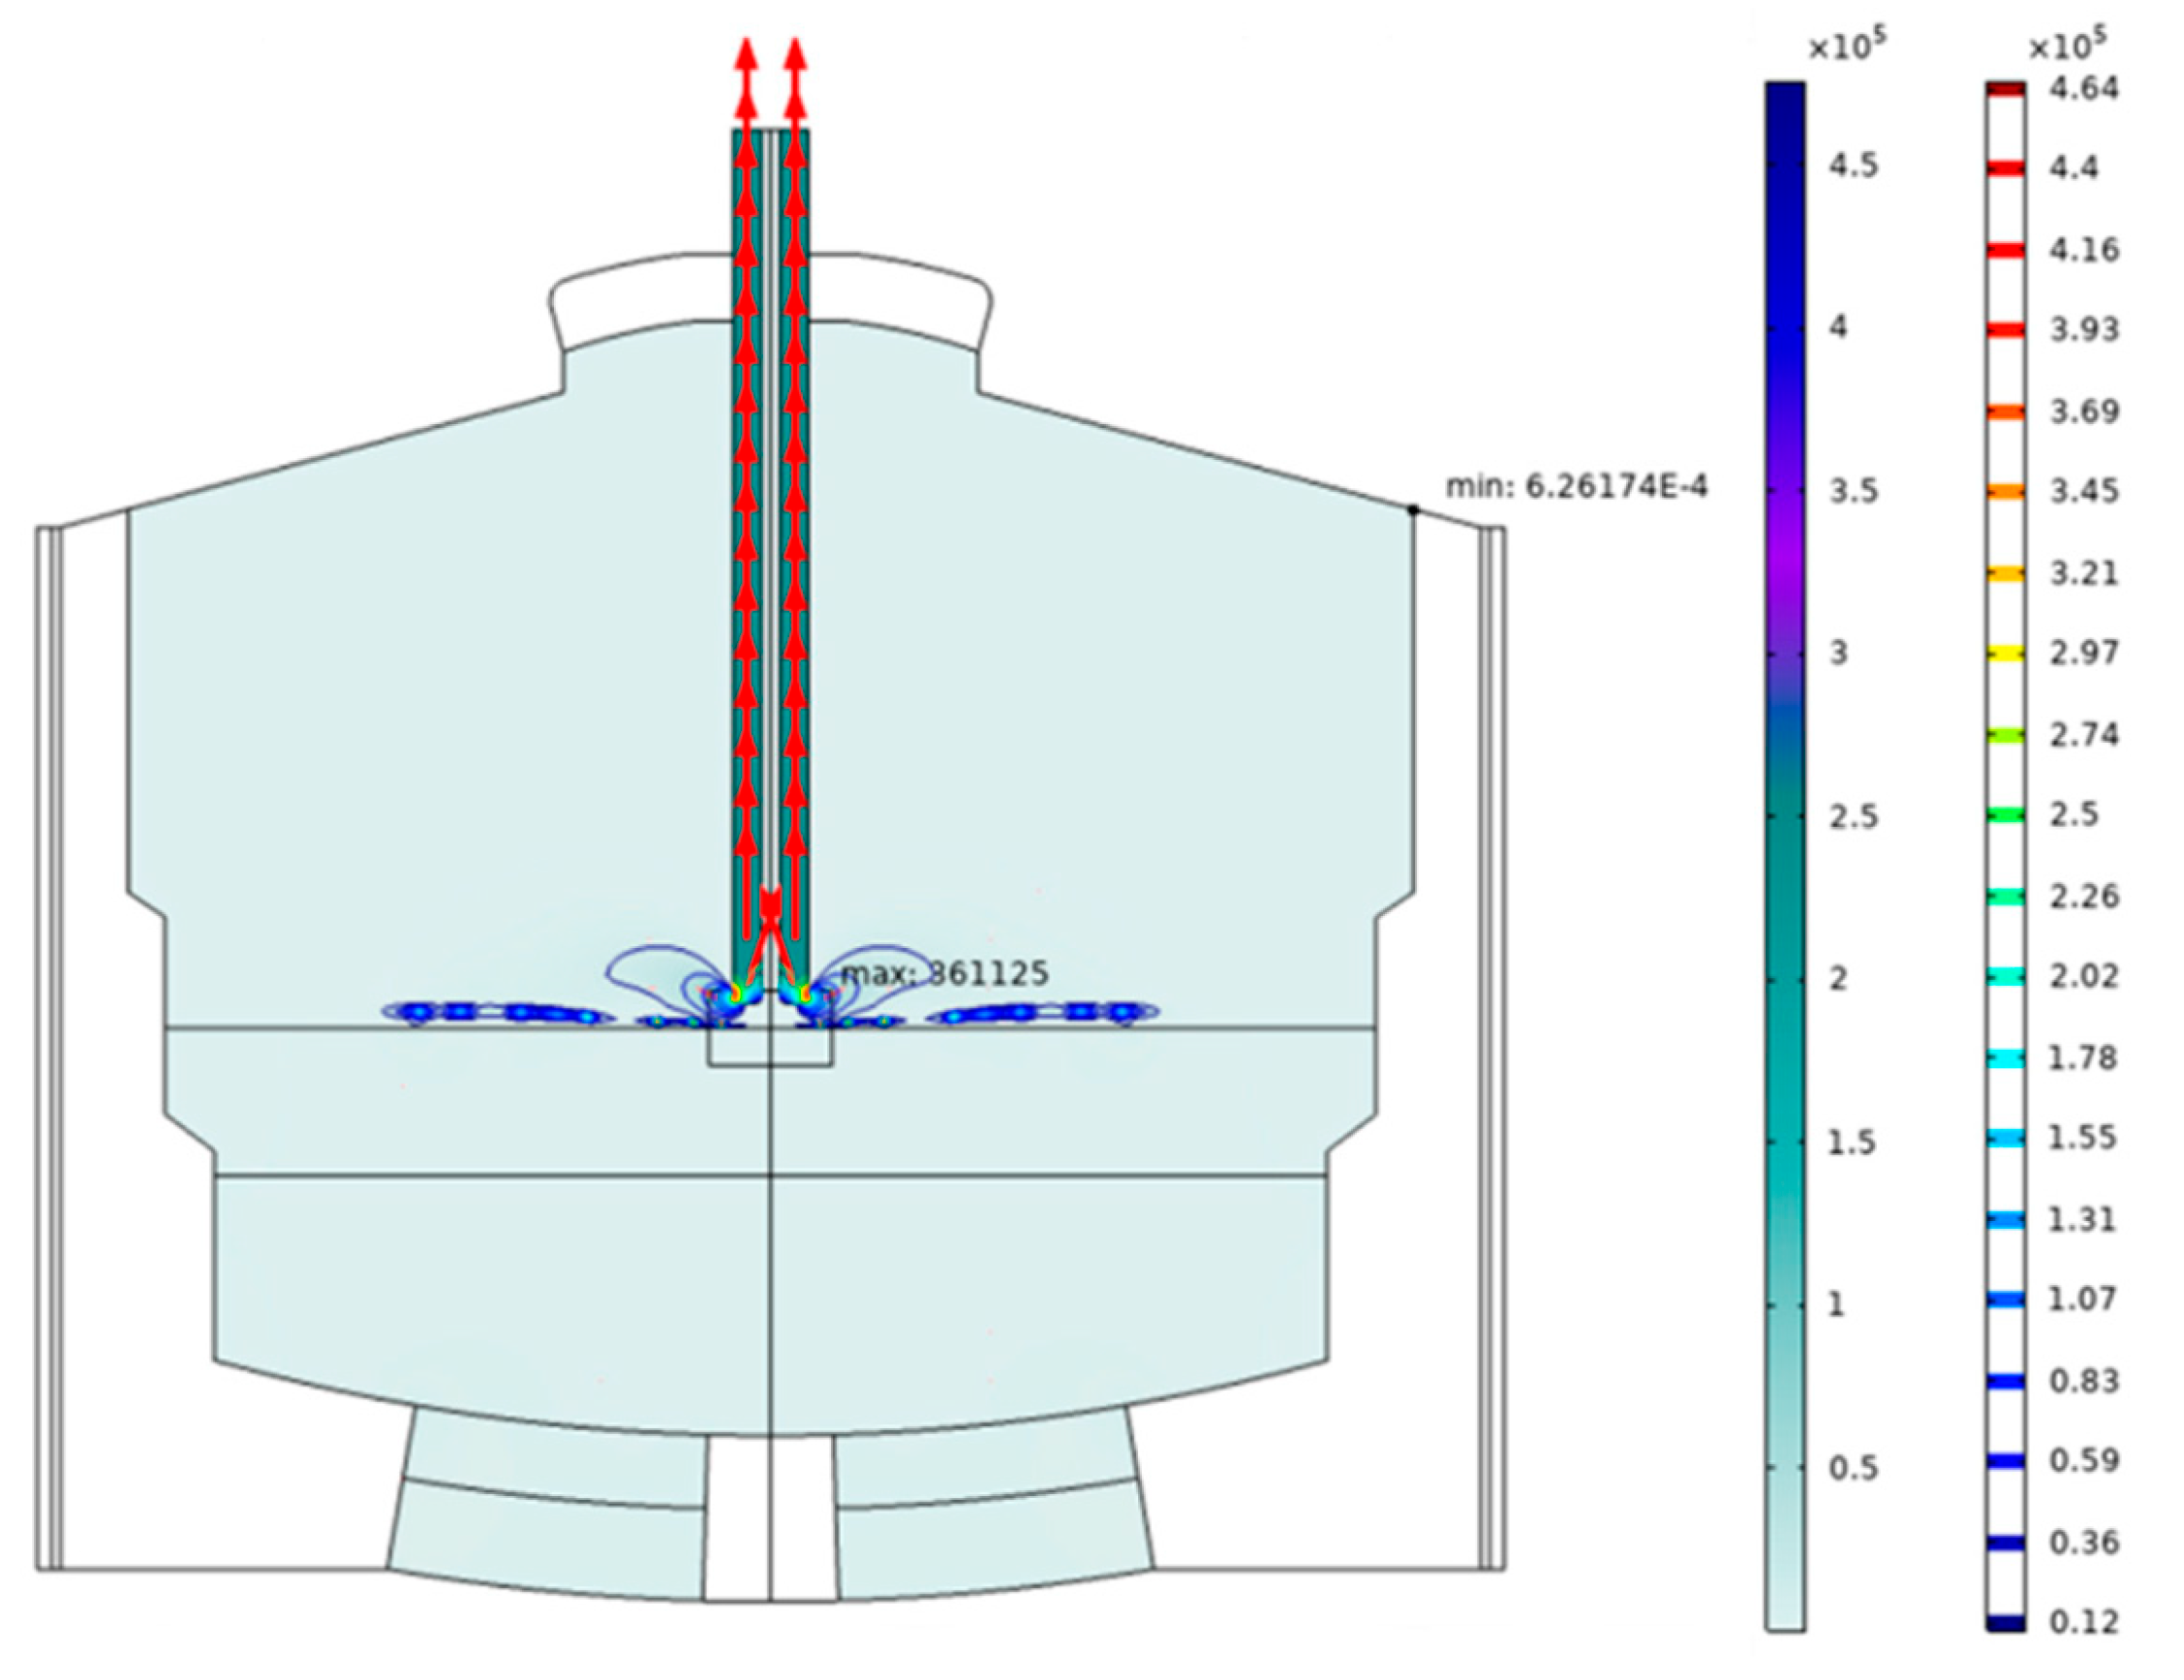
Figure 6: The current density distribution of the arc furnace.
Fig. 7 illustrates the current density distribution across different regions. The current density is influenced by variations in conductivity, which results in significant differences in distribution ranges. The graphite electrode serves as the primary channel for current flow, concentrating almost all the current. At a power level of 30 MW, the maximum current density in the electrode region reaches 361,125 A/m2. However, beneath the electrode, the maximum current density in the titanium slag layer and the iron (molten) layer sharply decreases due to the obstruction of the furnace gas. Nevertheless, since both titanium slag and iron (molten) remain good electrical conductors, the melt domain still exhibits areas with a current density of 6000 A/m2. Throughout the melt domain, the current density distribution shows a decreasing trend from the center of the furnace to the walls, with a significant gradient. The current density near the furnace walls is 402 A/m2 in the titanium slag layer and 249 A/m2 in the iron (molten) layer.
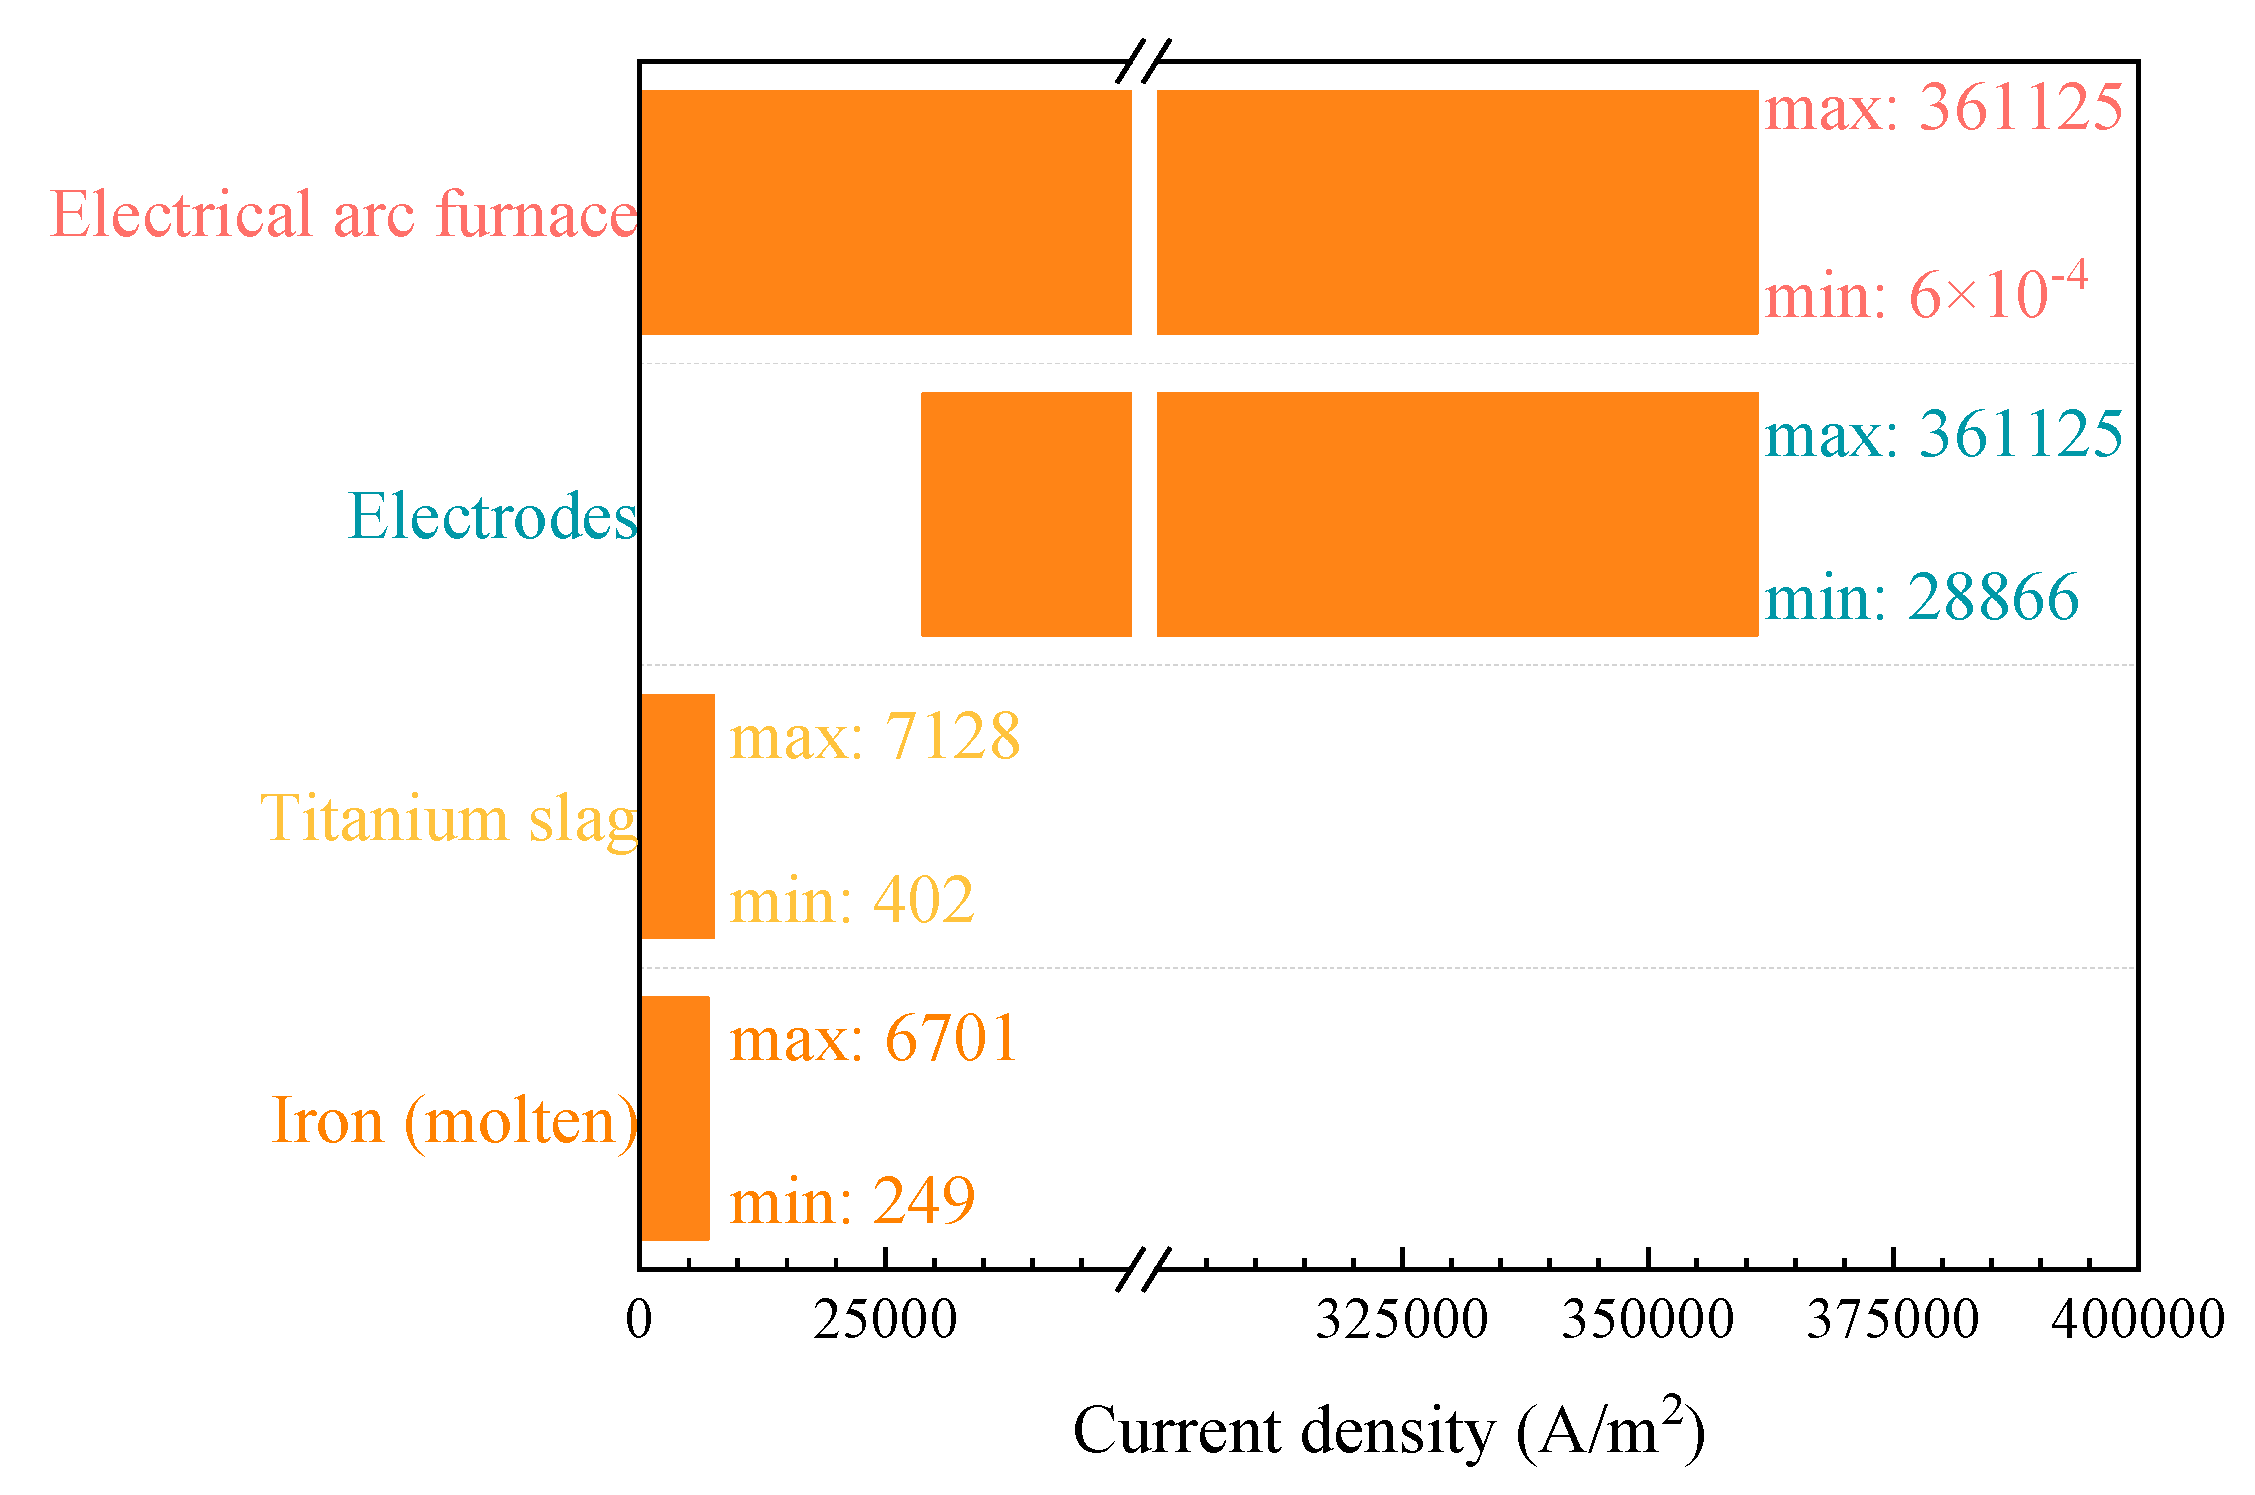
Figure 7: The current density distribution of the arc furnace.
3.1.3 Distribution of Temperature
The primary heat sources inside of electric arc furnace are primarily composed of the heat released by the arc and the reaction heat generated by various chemical reactions, with the heat produced by the arc occupying a dominant position. The distribution of the temperature field inside the furnace is illustrated in Fig. 8. The high-temperature region is mainly concentrated below the arc, where the temperature peak can exceed 3000 K. During the continuous discharge of the arc, a large amount of thermal energy is released, especially in the region near the electrode tip, where the accumulation of thermal energy causes the temperature to rise rapidly. Compared to the arc region, the temperature of the furnace gas drops rapidly in areas farther from the arc, indicating that the temperature in other regions of the arc furnace is significantly lower than in the arc region.
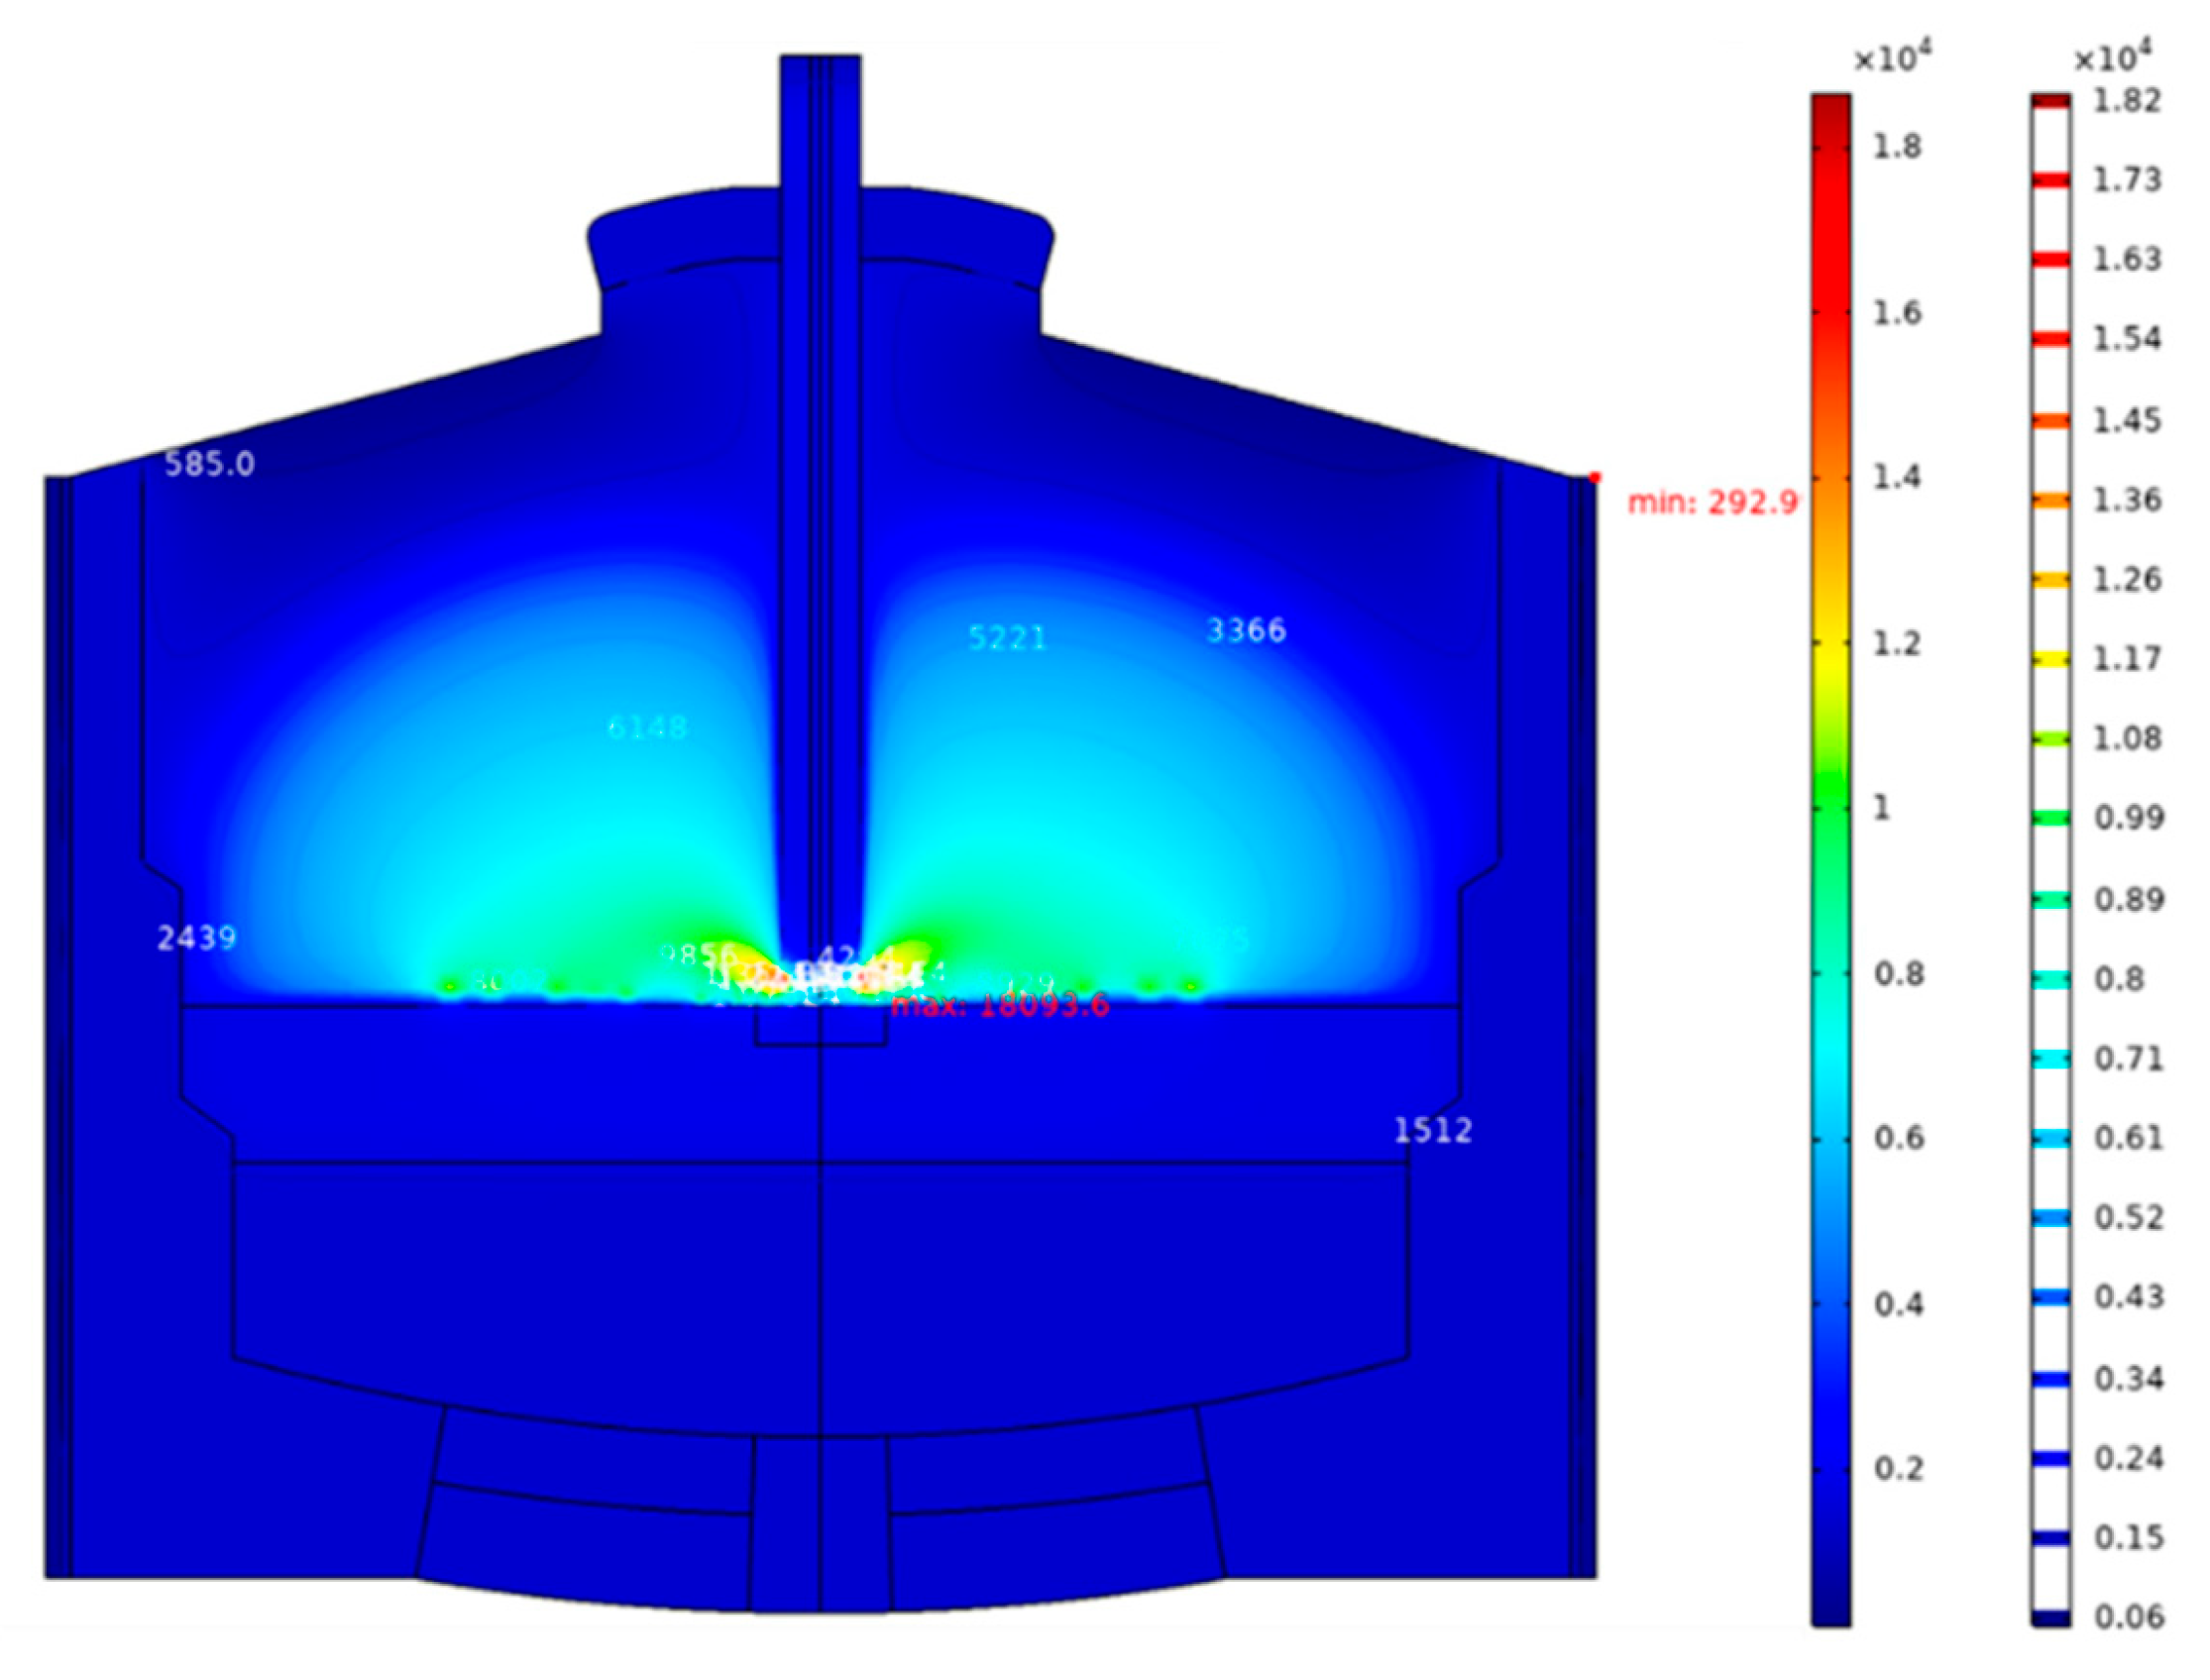
Figure 8: Distribution of temperature in 30 MW arc furnace.
In contrast, the thermal conductivity of the melt is significantly higher than that of the furnace gas, resulting in a relatively moderate temperature gradient between the titanium slag layer and the iron (molten) layer. As shown in Fig. 9, the distribution characteristics of the temperature field indicate that the average temperature of the titanium slag layer is approximately 2000 K. The highest temperature of 2618.3 K is recorded in the region below the electric arc, while the lowest temperature of 1565.4 K is observed at the furnace bottom wall. The temperature field decreases from the center of the furnace toward the walls, exhibiting a trend of high temperature at the center transitioning to low temperature at the edges, although the rate of temperature decline is not significant. Slagging phenomena are observed in the regions near the furnace walls.
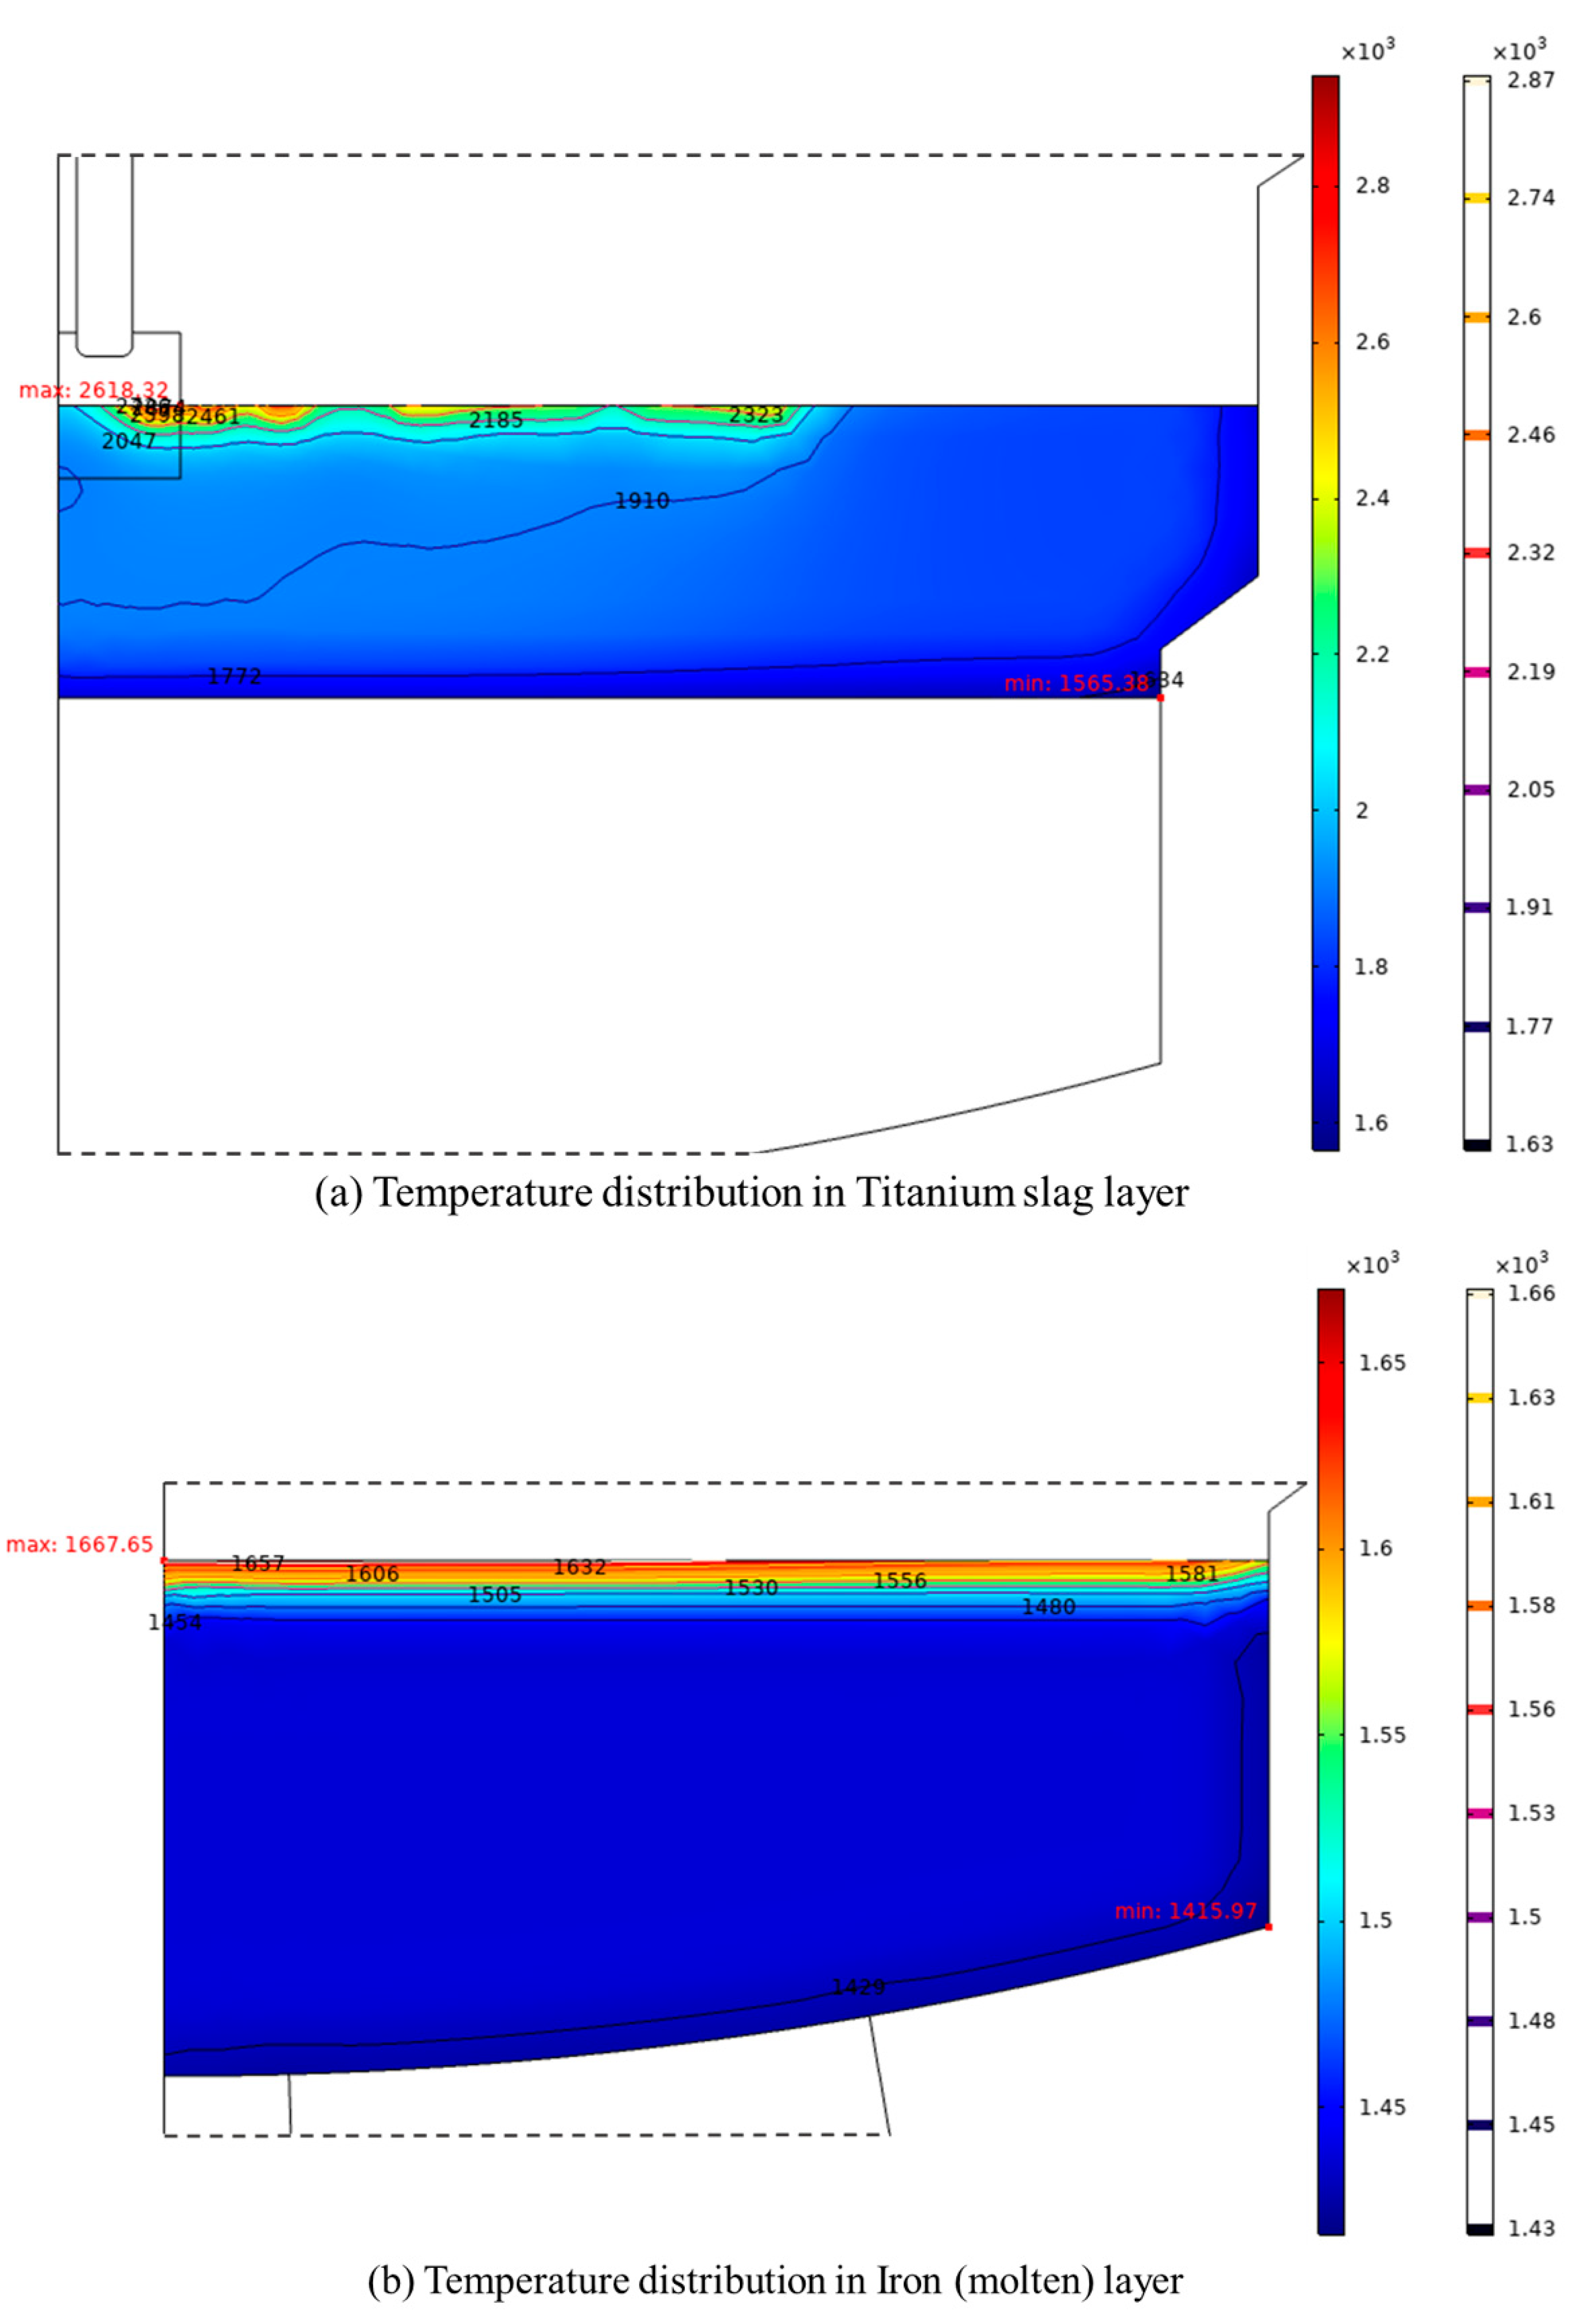
Figure 9: Temperature distribution in melt: (a) titanium slag layer, (b) iron (molten) layer.
The temperature of the iron (molten) layer is lower than titanium slag layer, as shown in Fig. 9b. The interface between the iron (molten) layer and the titanium slag layer exhibits a significant temperature gradient, with the highest temperature at the interface being 1667.6 K, which is approximately 200 K higher than that in the bottom of the iron (molten). This heat is carried away in an extremely short time, making it difficult to penetrate the bottom. At the walls and the furnace bottom, the temperature of the iron (molten) drops below 1450 K, resulting in lower temperature and fluidity, which easily leads to the formation of dead zones.
3.2.1 Distribution of Temperature
When the arc length extends to 400 mm, compared to the 200 mm arc length, the distribution pattern of the electric potential field within the furnace does not significantly change. It still exhibits a trend of gradual decrease from the bottom to the top, with high electric potential primarily distributed in the titanium slag and the iron (molten) layer. Fig. 10 illustrates the electric potential distribution in different regions under the two conditions. Regarding the titanium slag layer, the electric potential in this region remains at a high level, with the highest electric potential value occurring at the bottom of the titanium slag, measuring 504.2 V; the lowest electric potential value appears at the top of the titanium slag, at 201.6 V. Compared to the 200 mm arc length, the highest electric potential value slightly decreases, while the lowest electric potential value slightly increases, but the magnitude of these changes is relatively small. The electric potential distribution in the titanium slag layer still shows a pattern of gradual weakening from the bottom to the top. However, considering the difference between the maximum and minimum electric potential values, the trend of electric potential decrease in the titanium slag layer correspondingly diminishes as the arc length increases.
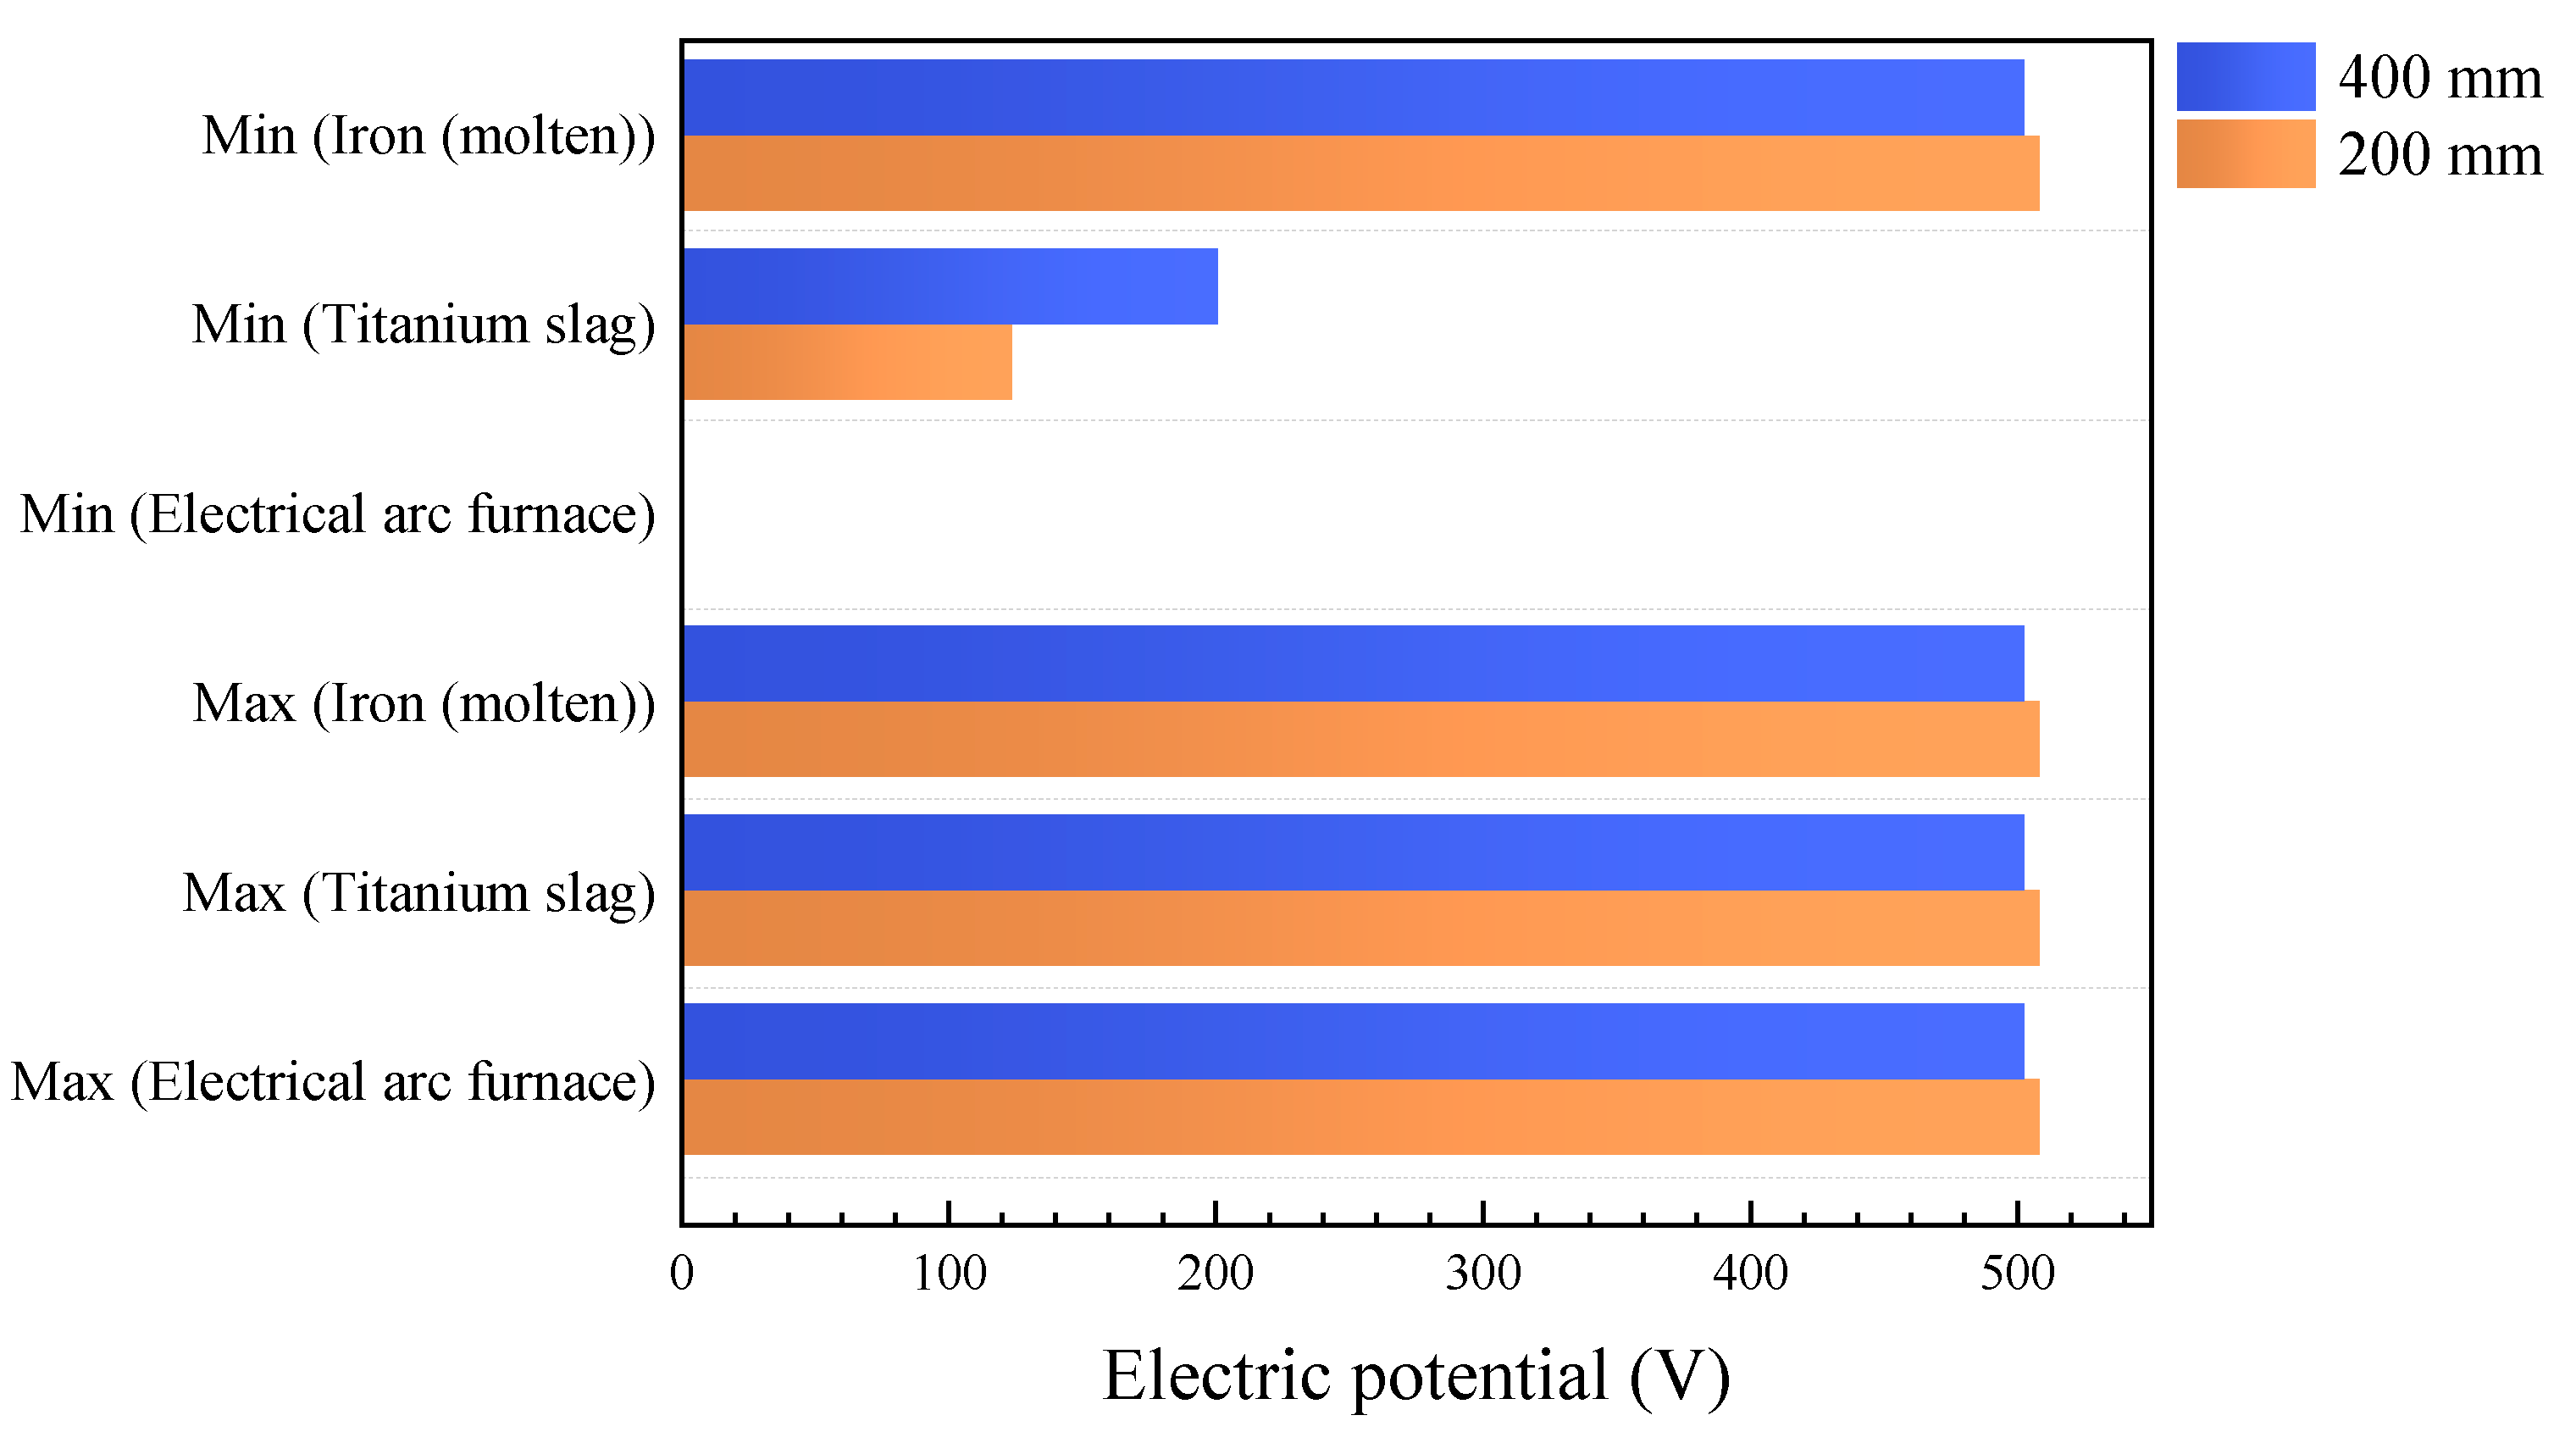
Figure 10: Potential distribution in different regions under two arc lengths.
When the arc length increases, the potential distribution of iron (molten) remains essentially unchanged, indicating that it does not experience a significant drop and maintains a high potential level throughout the electric arc furnace. Compared to the potential level when the arc length is 200 mm, the potential of the molten iron does decrease as the arc length increases, but the magnitude of this decrease is relatively limited, only dropping by 5 V.
3.2.2 The Impact on Current Density
The increase in arc length significantly enhances the peak current density, as shown in Fig. 11, which illustrates the peak current density under different arc lengths. When the arc length increases from 200 mm to 400 mm, the maximum current density within the furnace rises from 361,125 A/m2 to 480,604 A/m2, while the minimum current density also increases from 28,865.8 A/m2 to 29,478.6 A/m2. However, in terms of the distribution range of current density, despite the increase in arc length, the current remains predominantly concentrated in the arc region and near the electrodes. Outside these two areas, the current density does not significantly increase.
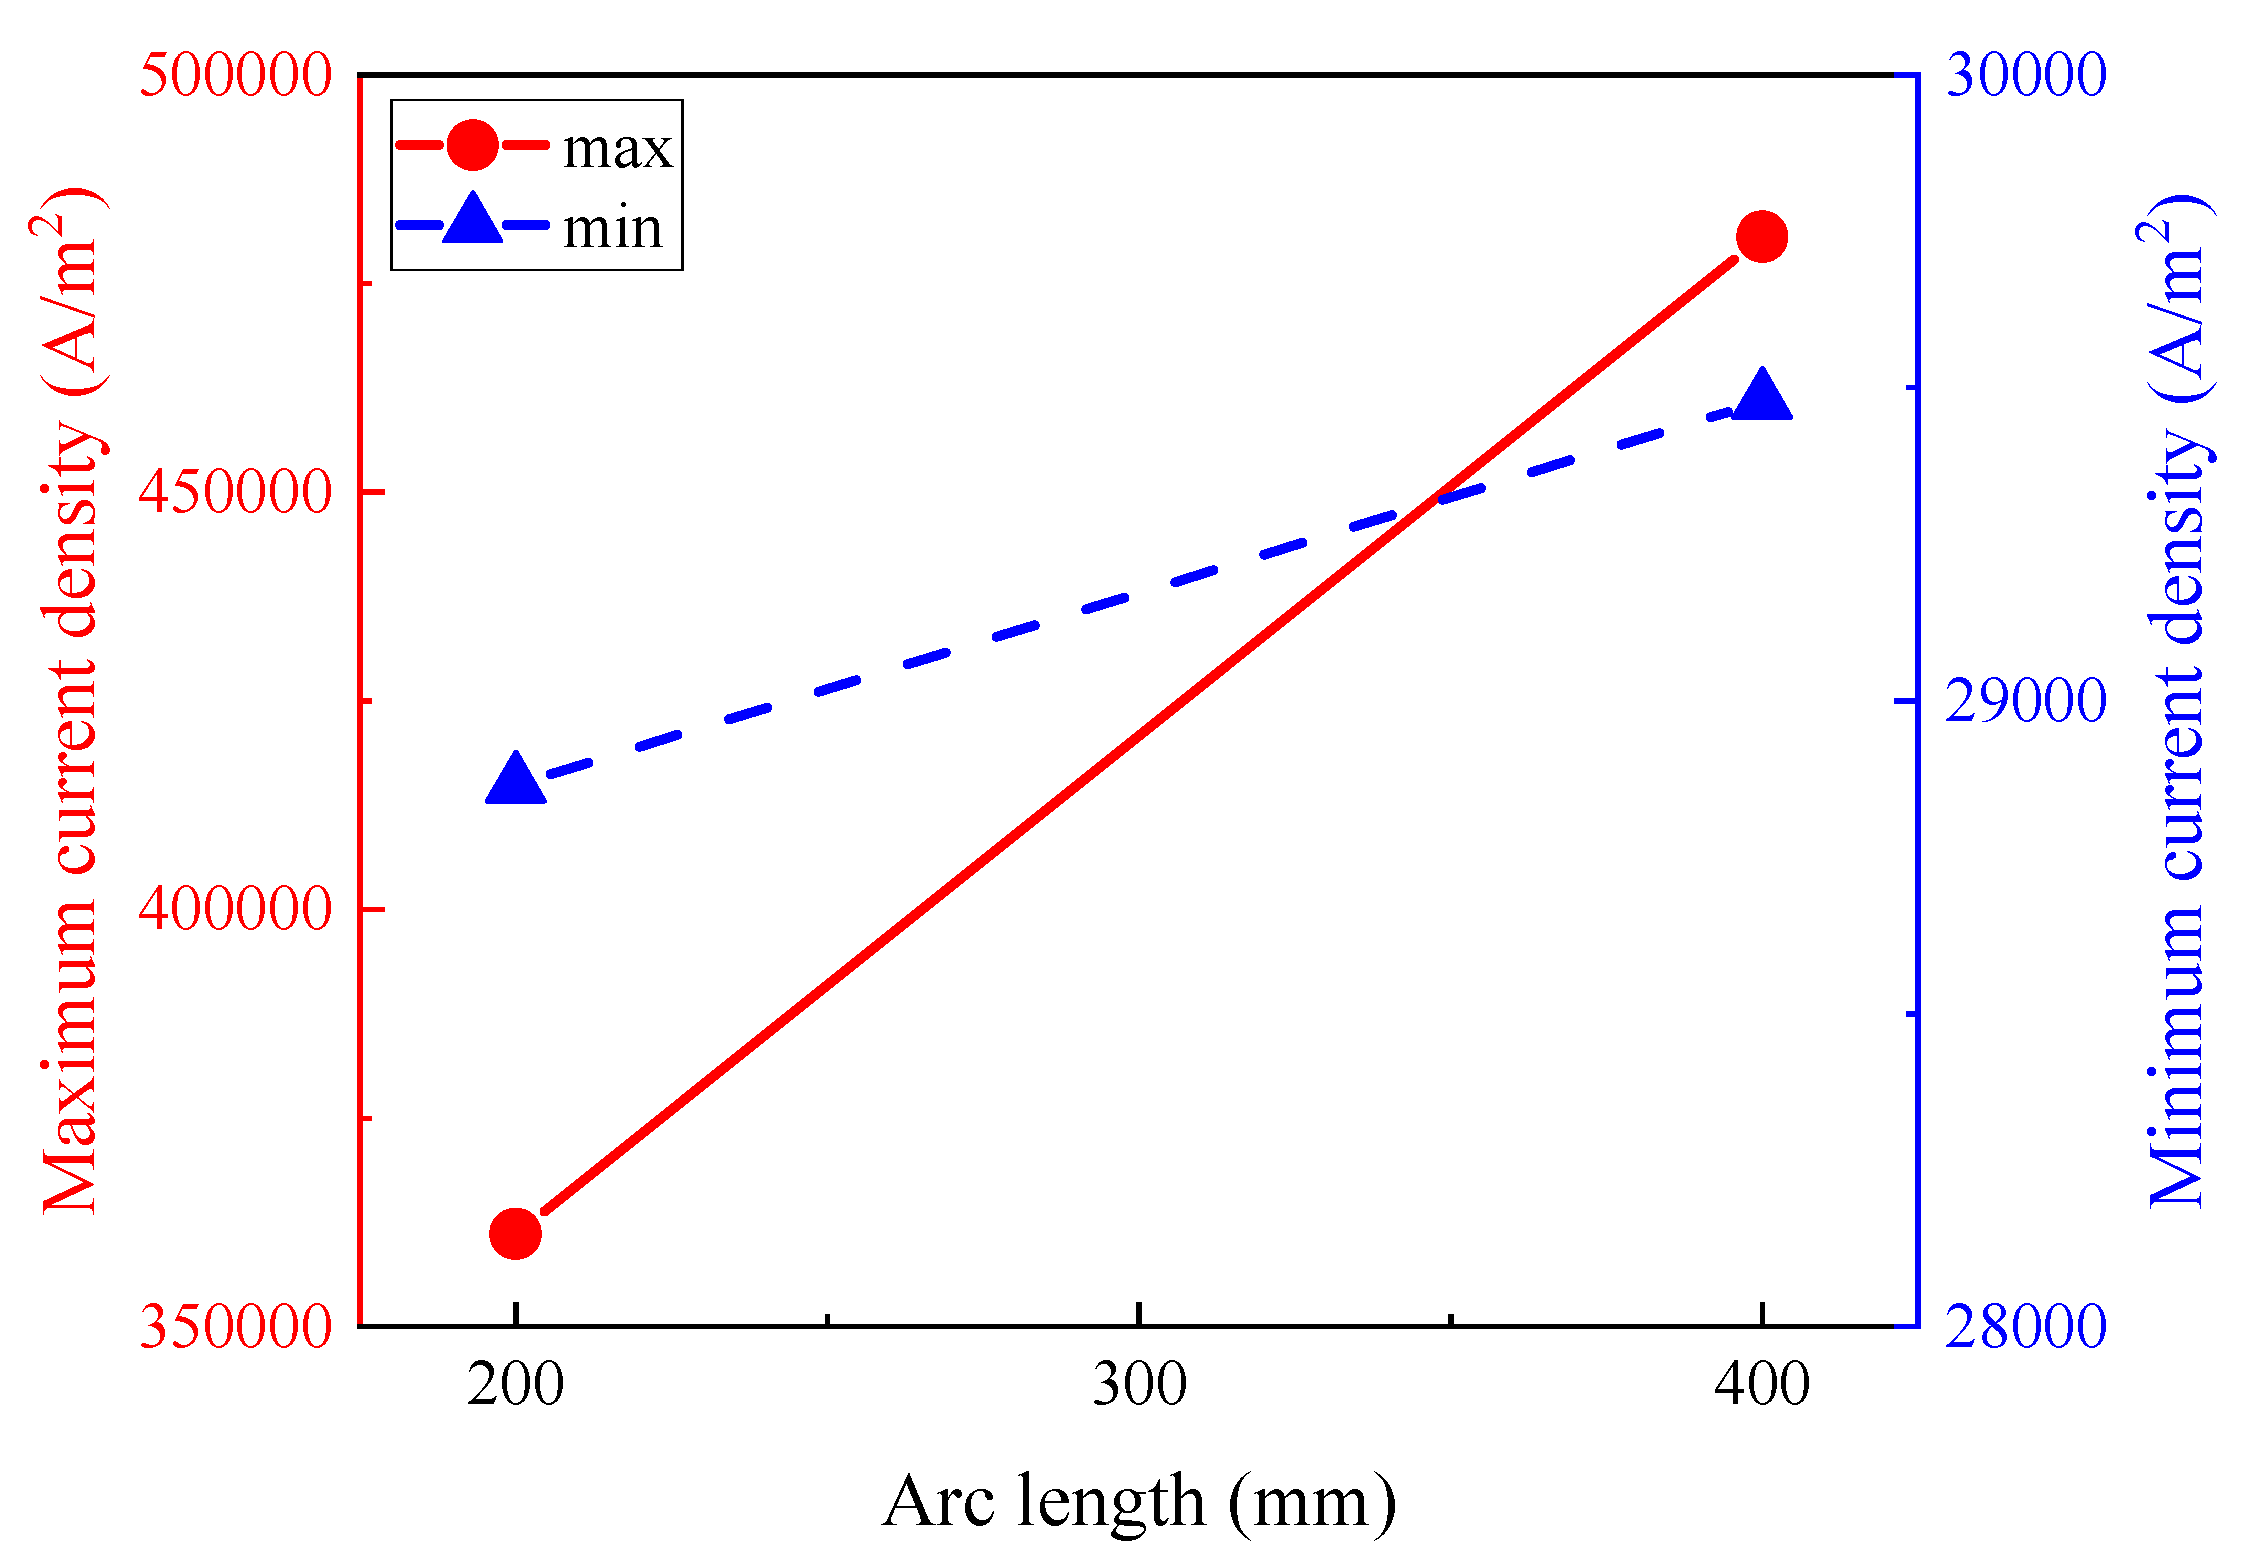
Figure 11: Influence of arc length on the peak current density.
Overall, the current density exhibits a positive correlation with arc length, and the distribution of current density across different regions is illustrated in Fig. 12. When the arc length increases, both the maximum and minimum values of the electrode current density increase. As the arc length increases from 200 mm to 400 mm, the maximum value of the electrode current density increases from 361,125 A/m2 to 480,604 A/m2, and the minimum value increases from 28,865.8 A/m2 to 29,478.6 A/m2. The maximum current density in the titanium slag layer is 8270 A/m2, representing a 16.1% increase relative to the arc length of 200 mm, while the minimum current density is 560 A/m2, showing a relative increase of 39.3%. The maximum and minimum current densities in the iron (molten) layer are 4270 A/m2 and 450 A/m2, respectively, with relative increases of −36.3% and 80.7%. The reason for this phenomenon is that the conductivity of molten iron is superior to that of titanium slag, resulting in a relatively lower potential, which allows current to pass more rapidly through the iron (molten) layer into the titanium slag layer, thereby increasing the current density in the titanium slag layer. On the other hand, the increase in arc length enhances the minimum current density. The current field distributions in both the titanium slag layer and the iron (molten) layer are similar, showing a trend of decreasing from the furnace core towards the furnace wall. The density gradient in the titanium slag layer is steeper, whereas the distribution in the iron (molten) layer is more uniform. The iron (molten) layer exhibits dense contour lines only near the furnace wall, while the contour lines in the molten region are relatively sparse.
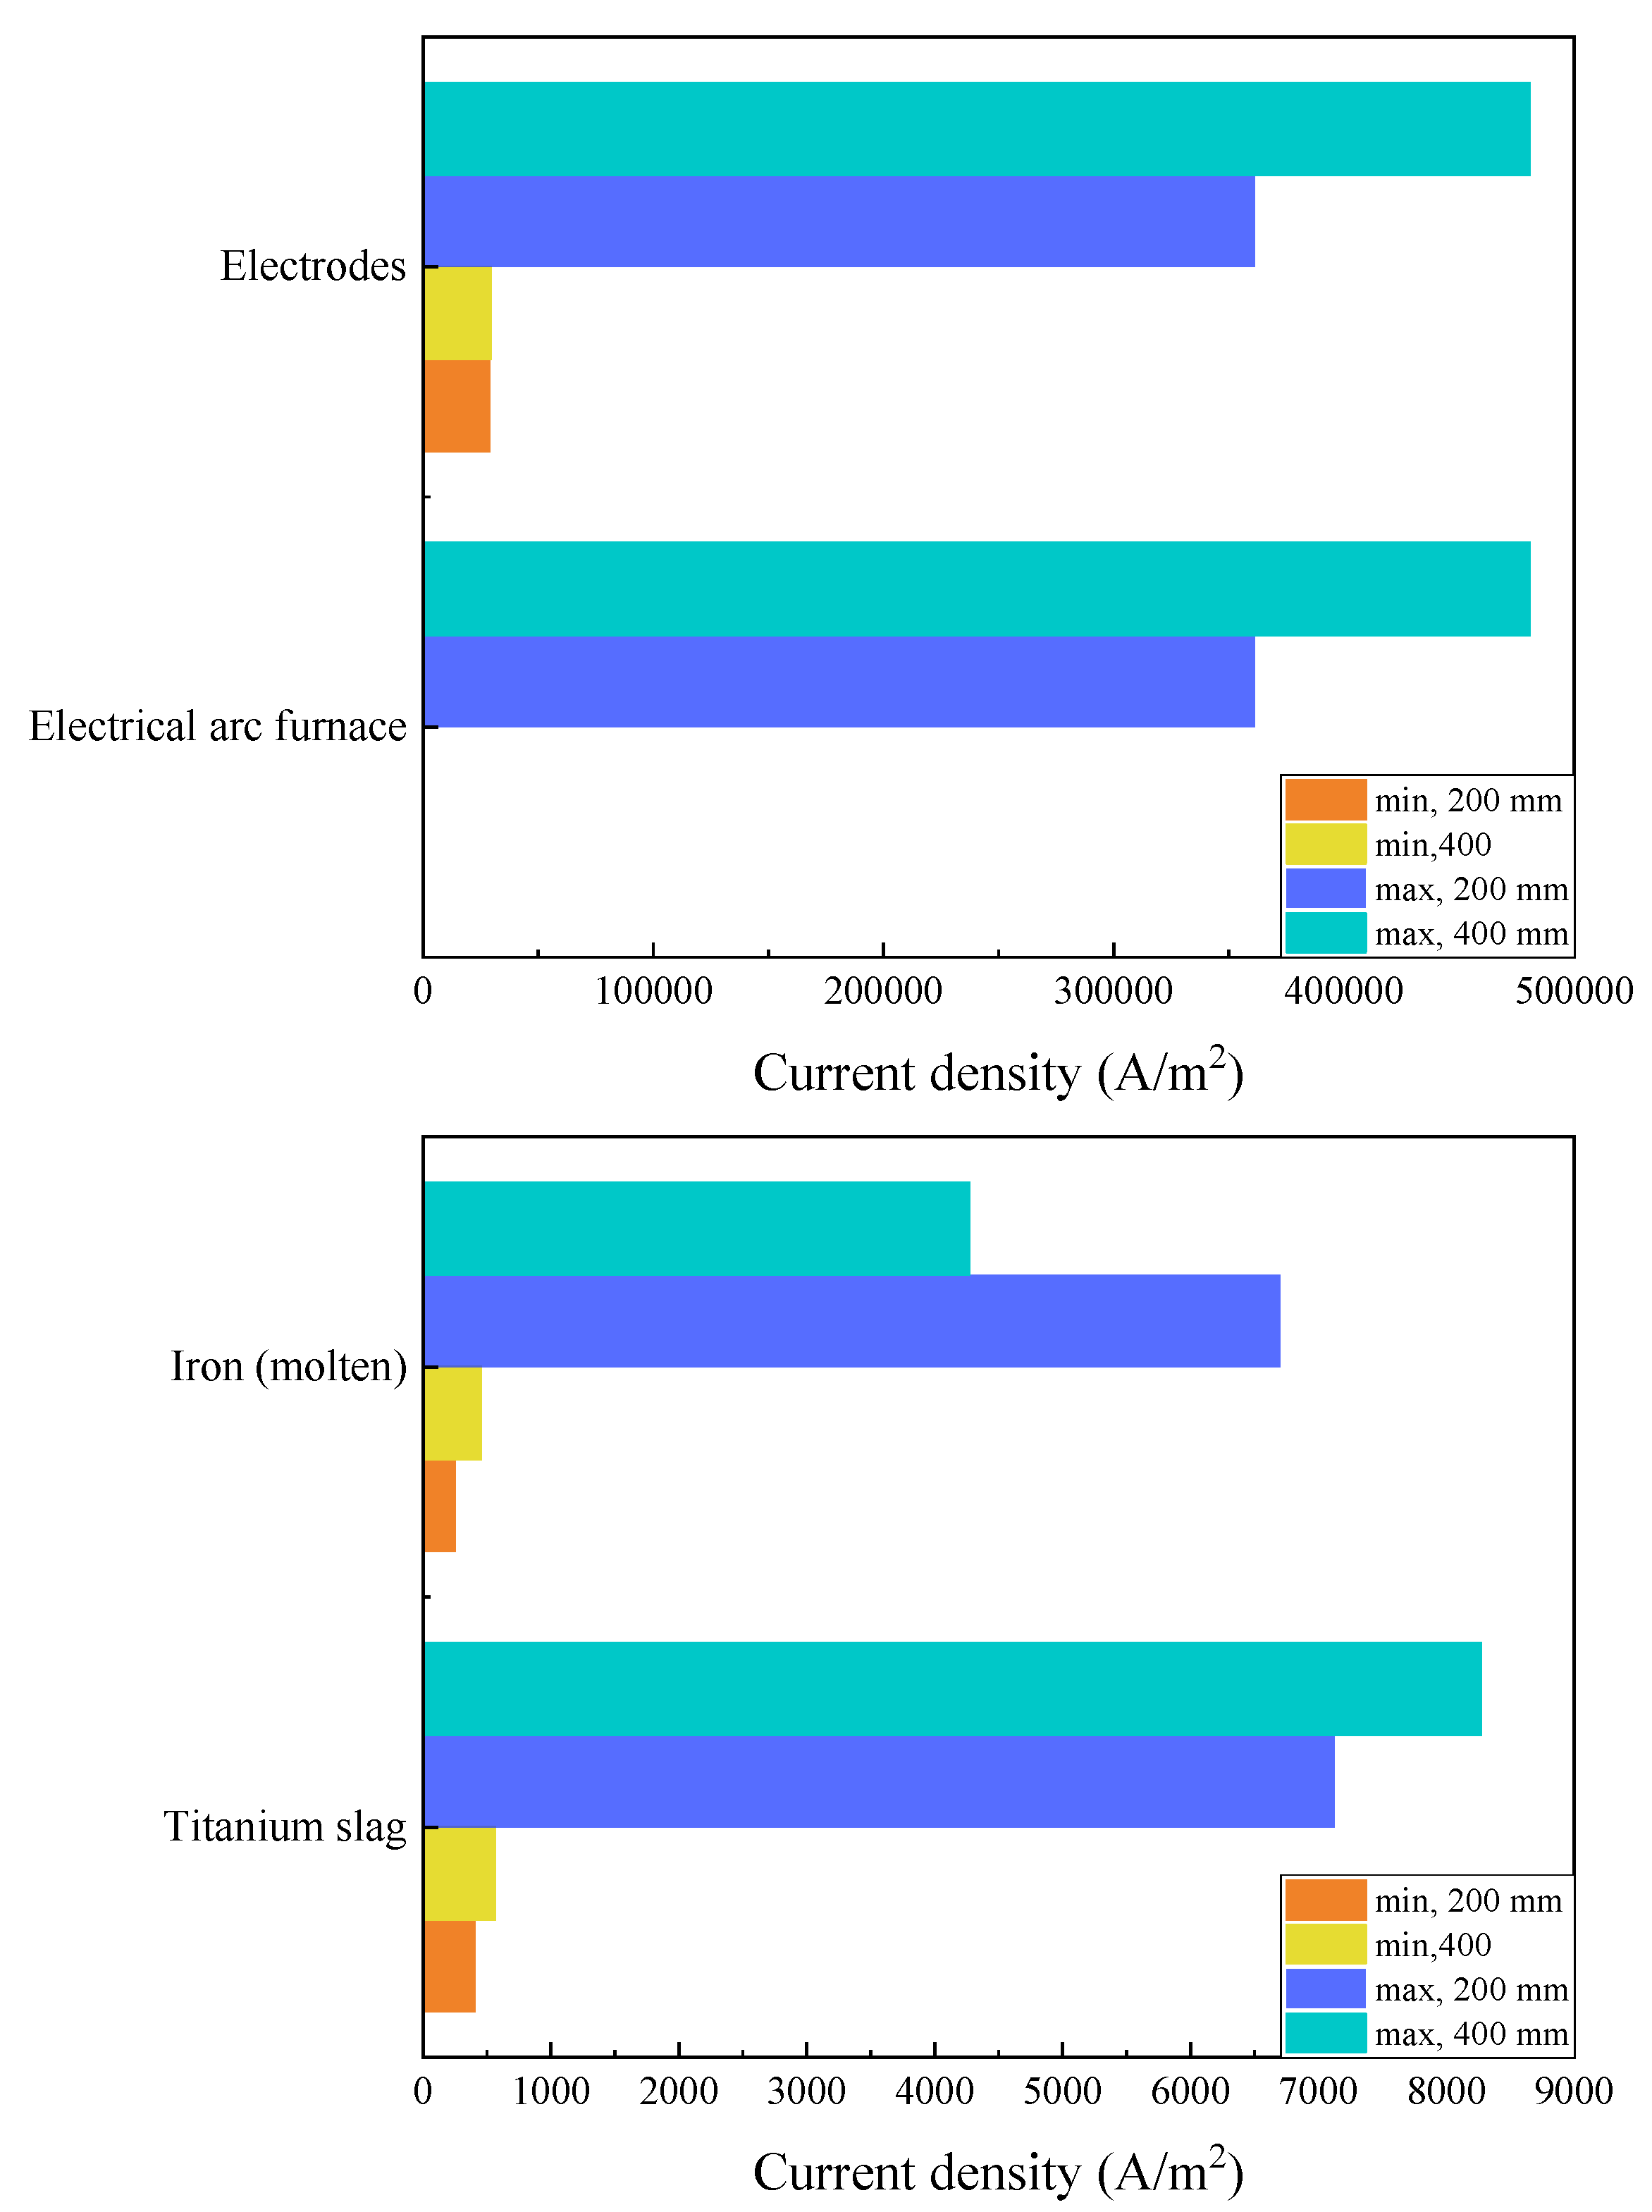
Figure 12: Current density distribution in different regions under arc length.
3.2.3 The Impact on Temperature Distribution
Fig. 13a illustrates the temperature distribution within the furnace at an arc length of 400 mm. When the arc length is 400 mm, the temperature field inside the furnace exhibits a semicircular distribution pattern centered symmetrically around the electrode. Under the influence of arc discharge, a high-temperature zone is formed in the region adjacent to the electrode, where the temperature can reach 8000 K or higher. However, the area of this high-temperature zone is quite limited. As the temperature field spreads toward the furnace wall, the temperature drops rapidly, falling below 3000 K near the wall. With an increase in arc length, the temperature in the furnace gas region and near the electrode significantly rises. The increase in arc length results in a larger contact area between the arc and the furnace gas, allowing more heat to be transferred to the furnace gas, effectively raising the maximum temperature of the furnace gas while also reducing the maximum temperature of the arc.
The furnace gas region exhibits the most significant temperature gradient. Additionally, the range of the high-temperature region expands noticeably as the arc length extends, with the temperature at the arc initiation point decreasing from approximately 15,000 K to about 11,000 K. The increase in the area of the high-temperature region under the influence of a long arc is evident. However, this change is constrained by the interfacial flow characteristics, and an increase in arc length may weaken heat transfer efficiency [18]. As depicted in Fig. 13d,e, the overall temperature of the titanium slag shows a decreasing trend as the arc length increases. With the arc length increasing from 200 mm to 400 mm, the maximum temperature of the titanium slag drops from 2618 K to 2125 K. In contrast, the minimum temperature changes little due to the slagging phenomenon already occurring at the wall, while the area (range) of the slagging region increases to some extent. The temperature variation in the deeper iron (molten) layer is even smaller, with its maximum temperature decreasing from 1667.7 K (200 mm) to 1657.5 K (400 mm). Near the interface between the titanium slag and the iron (molten), the temperature gradient drops rapidly. The heat in the iron (molten) layer originates from the titanium slag layer. However, once the bottom titanium slag begins to slag, the heat released by the arc is difficult to transfer to the bottommost iron (molten) layer, resulting in minimal temperature changes at this depth.
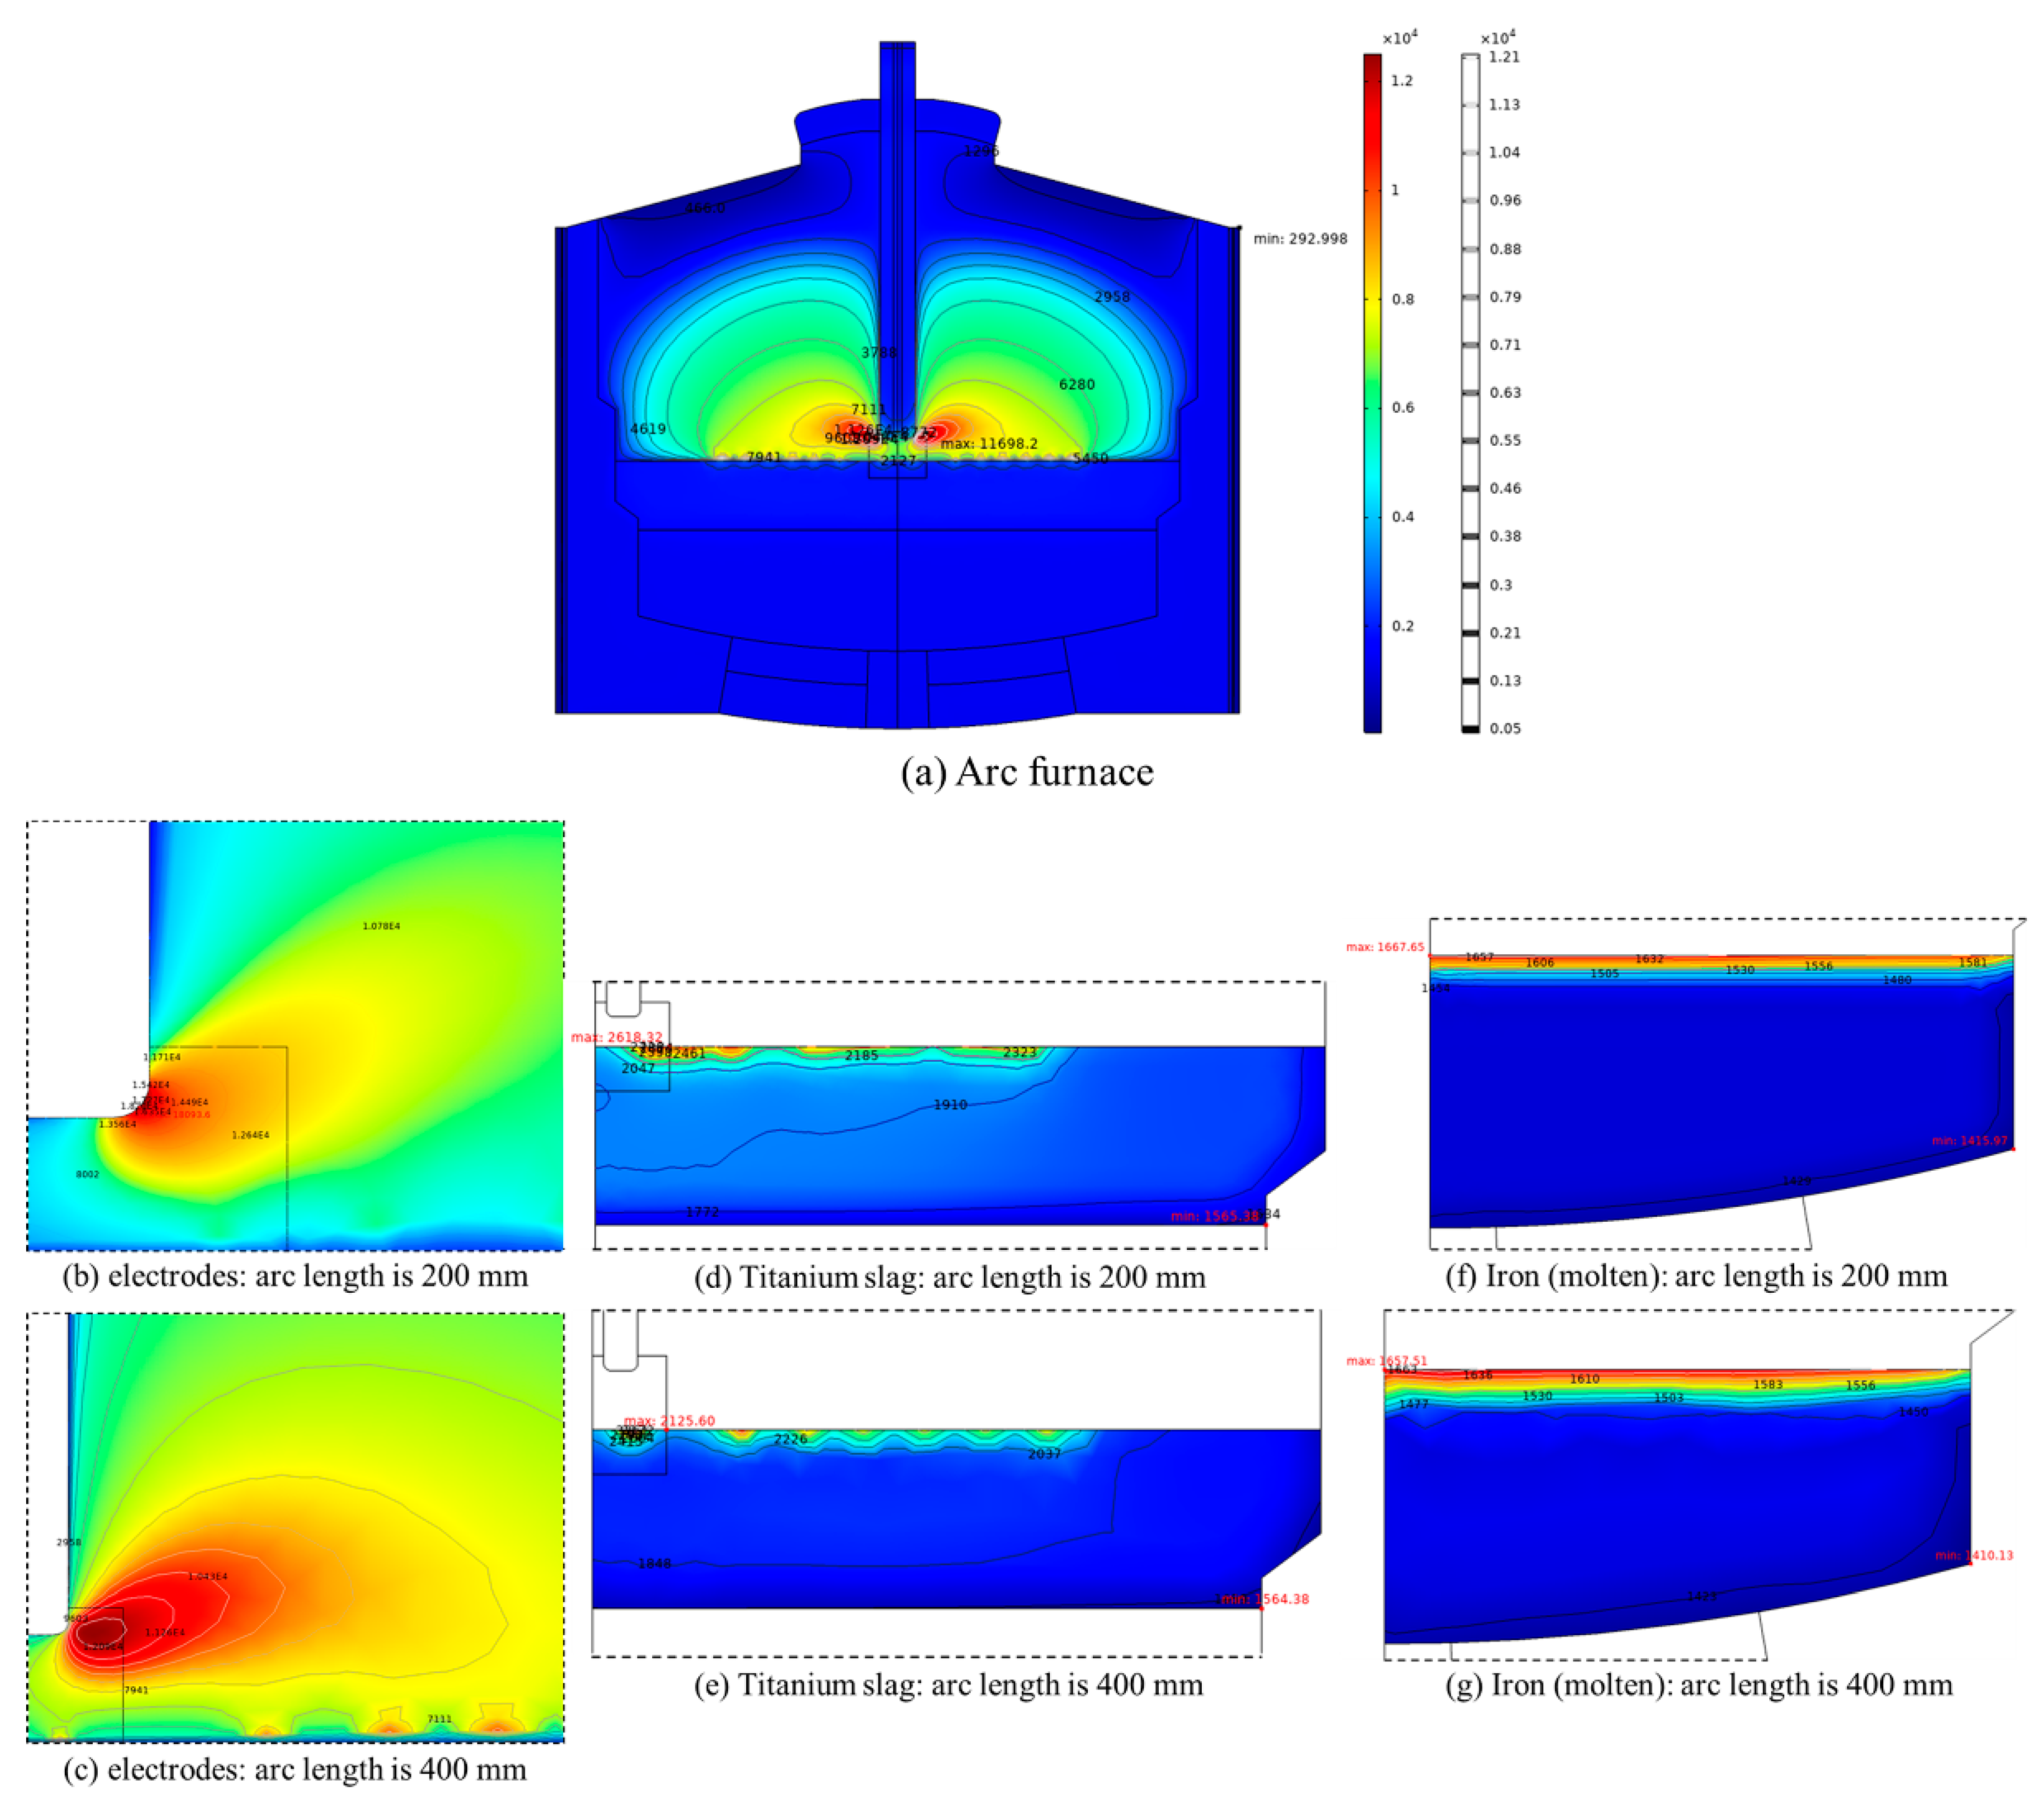
Figure 13: Temperature distribution of arc length impact in different regions: (a) arc furnace (400 mm), (b) electrodes (200 mm), (c) electrodes (400 mm), (d) titanium slag (200 mm), (e) titanium slag (400 mm), (f) iron (molten) (200 mm) and (g) iron (molten) (400 mm).
In this manuscript, a numerical model was established for the smelting of high-titanium slag in a 30 MW electric arc furnace. Numerical simulations were employed to investigate the distribution of multiple physical fields under the influence of the electric arc, thereby elucidating the heat transfer process resulting from the coupling of these fields within the furnace, as well as the mechanisms by which different arc lengths affect arc morphology, convective heat transfer, and the temperature distribution of the molten material.
Influenced by the composition of the melt, the potential and current density distributions inside the arc furnace exhibit noticeable variations. The highest potential is observed at the bottom wall of the furnace at 509.721 V, and a significant potential gradient is evident in the titanium slag layer adjacent to the graphite electrode. Across the entire melt domain, the current density shows a decreasing trend from the furnace center toward the wall; however, because both the titanium slag and molten iron remain good conductors, the current density still reaches a maximum value of approximately 6000 A/m2.
The arc length primarily affects the magnitude of the current density and the heat transfer within the furnace. When the arc length is increased from 200 mm to 400 mm, the maximum electrode current density rises from 361,125 A/m2 to 480,604 A/m2, while the minimum increases from 28,865.8 A/m2 to 29,478.6 A/m2. Although the extended arc length expands the high-temperature zone within the furnace, it also impedes the interfacial flow behavior, thereby reducing the heat transfer efficiency to a certain extent. Consequently, as the arc length increases from 200 mm to 400 mm, the maximum temperature of the titanium slag decreases from 2618 K to 2125 K, and the maximum temperature of the molten iron layer drops from 1667.65 K to 1657.51 K.
This study investigates the temperature field distribution during the processing of high-titanium slag in electric arc furnace smelting using multiphysics-coupled numerical simulations. Future research may further reinforce the examination of molten flow and heat transfer, thereby providing a quantitative basis for process parameter optimization and offering insights into enhancing molten heating and reducing the extent of dead zones.
Acknowledgement:
Funding Statement: This work was support from National Natural Science Foundation of China under Contract (NO. 51966005); Yunnan Fundamental Research Projects (NO. 202301AT070469). Yunnan Major Scientific and Technological Projects (NO. 202202AG050002).
Author Contributions: The authors confirm contribution to the paper as follows: Conceptualization, Software, Validation, Writing—Original Draft: Yifan Wang. Project administration, Funding acquisition: Shan Qing. Writing—Review & Editing, Visualization: Jifan Li. Project administration, Funding acquisition: Xiaohui Zhang. Resources: Junxiao Wang. All authors reviewed the results and approved the final version of the manuscript.
Availability of Data and Materials: The data that support the findings of this study are available from the corresponding author upon reasonable request.
Ethics Approval: Not applicable.
Conflicts of Interest: The authors declare no conflicts of interest to report regarding the present study.
Nomenclature
| Density, kg/m3. | |
| Viscosity, Pa·s. | |
| Body force, N. | |
| Turbulent kinetic energy, m2/s2. | |
| The diffusion term. | |
| The turbulent kinetic energy generated by the mean velocity gradient, m2/s2. | |
| The dissipation rate of turbulent kinetic, J/(kg·s). | |
| The heat flow, W. | |
| The thermal conductivity, W/(m·K). | |
| Heat transfer coefficient, W/(m2·K). | |
| Velocity vector, m/s. | |
| The molar volume, L/mol. | |
| The partial molecular volume. | |
| The partial molar volume. | |
| The electric field intensity vector, V/m. | |
| The volume charge density, C/m3. | |
| The permittivity of free space, 8.85 × 10⁻¹² F/m. | |
| The magnetic flux density vector, T. | |
| The magnetic permeability, H/m. | |
| The current density vector, A/m2. | |
| The electromagnetic force, N. | |
| The particle charge, C. | |
| The specific heat, J/(kg·K). |
References
1. Leyens C, Peters M, Kaysser A. Oxidation-resistant coatings for application on high-temperature titanium alloys in aeroengines. Adv Eng Mater. 2000;2(5):265–9. doi:10.1002/(SICI)1527-2648(200005)2:5265::AID-ADEM265>3.0.CO;2-U. [Google Scholar] [CrossRef]
2. Heinrich G, Grögler T, Rosiwal SM, Singer RF. CVD diamond coated titanium alloys for biomedical and aerospace applications. Surf Coat Technol. 1997;94:514–20. doi:10.1016/S0257-8972(97)00459-3. [Google Scholar] [CrossRef]
3. Pushkarev OI, Umanskii AP. Abrasion-resistant composite material based on titanium carbide for petrochemical engineering. Refract Ind Ceram. 1999;40(9):399–400. doi:10.1007/BF02764185. [Google Scholar] [CrossRef]
4. Zheng A, Su Y, Lin S, Wang Y, Li Z, Zhang Z, et al. Thermal reconstruction engineered titanium-based gas diffusion electrodes for robust and energy-saving hydrogen hydrometallurgy. J Mater Chem A. 2023;11(40):21655–63. doi:10.1039/D3TA04263D. [Google Scholar] [CrossRef]
5. Song H, Zhang J, Cheng G, Gao Z, Xue X. Novel CO2 recycling and reuse strategy: reinjection of hot metallurgical off-gas into a vanadiferous titanomagnetite ore blast furnace. J Sustain Metall. 2021;7(3):1128–42. doi:10.1007/s40831-021-00405-8. [Google Scholar] [CrossRef]
6. Li L, Li B, Liu L, Motoyama Y. Numerical modeling of fluid flow, heat transfer and arc–melt interaction in tungsten inert gas welding. High Temp Mater Process. 2017;36(4):427–39. doi:10.1515/htmp-2016-0120. [Google Scholar] [CrossRef]
7. Wang X, Huang J, Huang Y, Fan D, Guo Y. Investigation of heat transfer and fluid flow in activating TIG welding by numerical modeling. Appl Therm Eng. 2017;113:27–35. doi:10.1016/j.applthermaleng.2016.11.008. [Google Scholar] [CrossRef]
8. Kukharev A, Bilousov V, Bilousov E, Bondarenko V. The peculiarities of convective heat transfer in melt of a multiple-electrode arc furnace. Metals. 2019;9(11):1174. doi:10.3390/met9111174. [Google Scholar] [CrossRef]
9. Hay T, Echterhof T, Visuri VV. Development of an electric arc furnace simulator based on a comprehensive dynamic process model. Processes. 2019;7(11):852. doi:10.3390/pr7110852. [Google Scholar] [CrossRef]
10. Ramírez M, Alexis J, Trapaga G, Jönsson P, Mckelliget J. Modeling of a DC electric arc furnace—mixing in the bath. ISIJ Int. 2001;41(10):1146–55. doi:10.2355/isijinternational.41.1146. [Google Scholar] [CrossRef]
11. Wang F, Jin Z, Zhu Z. Numerical study of DC arc plasma and molten bath in DC electric arc furnace. Ironmak Steelmak. 2006;33(1):39–44. doi:10.1179/174328105x71326. [Google Scholar] [CrossRef]
12. Wu S, Gong S, Gao H. Arc characteristics of GTAW under high pressure. Sādhanā. 2019;44(3):70. doi:10.1007/s12046-019-1053-9. [Google Scholar] [CrossRef]
13. Karalis K, Karalis N, Karkalos N, Ntallis N, Antipas GSE, Xenidis A. Three-dimensional computational fluid dynamics analysis of an electric submerged arc furnace. Sci Rep. 2021;11(1):17637. doi:10.1038/s41598-021-96085-1. [Google Scholar] [CrossRef]
14. Ren Z, Nemoto Y, Suzuki Y, Yamamoto S, Asanuma G, Onchi T, et al. Analysis of adverse influence of metal vapor to arc movement between electrodes with external magnetic field applied by numerical simulation. IEEJ Trans Electr Electron Eng. 2022;17(2):183–93. doi:10.1002/tee.23498. [Google Scholar] [CrossRef]
15. Cui HN, Li T, Bai CG, Tan M, Zhu YL. Numerical simulation of coupling multi-physical field in electrical arc furnace for smelting titanium slag. J Iron Steel Res Int. 2023;30(11):2194–209. doi:10.1007/s42243-023-00949-x. [Google Scholar] [CrossRef]
16. Dietz M, Grabowski D, Klimas M, Starkloff HJ. Estimation and analysis of the electric arc furnace model coefficients. IEEE Trans Power Deliv. 2022;37(6):4956–67. doi:10.1109/TPWRD.2022.3163815. [Google Scholar] [CrossRef]
17. Klimas M, Grabowski D. Identification of nonstationary parameters of electric arc furnace model using Monte Carlo approach. In: 2020 Progress in Applied Electrical Engineering (PAEE); 2020 Jun 21–26; Koscielisko, Poland. doi:10.1109/PAEE50669.2020.9158732. [Google Scholar] [CrossRef]
18. Cui H, Li T, Bai C, Jiang Z, Tan M, Gao X, et al. Numerical simulation of the interaction between arc plasma and molten slag in electric arc furnace for high-titania slag smelting. Metall Mater Trans B. 2023;54(4):1687–704. doi:10.1007/s11663-023-02775-8. [Google Scholar] [CrossRef]
19. Yan H, Huang Z, Hu M, Qi J, Liu L. Numerical modeling of gas-solid two-phase flow in a plasma melting furnace. Powder Technol. 2022;412:117967. doi:10.1016/j.powtec.2022.117967. [Google Scholar] [CrossRef]
20. Yigit C, Coskun G, Buyukkaya E, Durmaz U, Güven HR. CFD modeling of carbon combustion and electrode radiation in an electric arc furnace. Appl Therm Eng. 2015;90:831–7. doi:10.1016/j.applthermaleng.2015.07.066. [Google Scholar] [CrossRef]
21. Sanchez JLG, Ramírez-Argaez MA, Conejo AN. Power delivery from the arc in AC electric arc furnaces with different gas atmospheres. Steel Res Int. 2009;80(2):113–20. doi:10.2374/SRI08SP079. [Google Scholar] [CrossRef]
22. Yao CL, Zhu HC, Jiang ZH, Pan T. Numerical analysis of fluid flow and heat transfer by means of a unified model in a direct current electric arc furnace. Steel Res Int. 2021;92(6):2000664. doi:10.1002/srin.202000664. [Google Scholar] [CrossRef]
23. Qian F, Farouk B, Mutharasan R. Modeling of fluid flow and heat transfer in the plasma region of the DC electric arc furnace. Metall Mater Trans B. 1995;26(5):1057–67. doi:10.1007/BF02654108. [Google Scholar] [CrossRef]
24. Alexis J, Ramirez M, Trapaga G, Jönsson P. Modeling of a DC electric arc furnace—heat transfer from the arc. ISIJ Int. 2000;40(11):1089–97. doi:10.2355/isijinternational.40.1089. [Google Scholar] [CrossRef]
25. Odenthal HJ, Kemminger A, Krause F, Sankowski L, Uebber N, Vogl N. Review on modeling and simulation of the electric arc furnace (EAF). Steel Res Int. 2018;89(1):1700098. doi:10.1002/srin.201700098. [Google Scholar] [CrossRef]
26. Shaheed R, Mohammadian A, Kheirkhah Gildeh H. A comparison of standard k–ε and realizable k–ε turbulence models in curved and confluent channels. Environ Fluid Mech. 2019;19(2):543–68. doi:10.1007/s10652-018-9637-1. [Google Scholar] [CrossRef]
27. Wang Z, Fu Y, Wang N, Feng L. 3D numerical simulation of electrical arc furnaces for the MgO production. J Mater Process Technol. 2014;214(11):2284–91. doi:10.1016/j.jmatprotec.2014.04.033. [Google Scholar] [CrossRef]
28. Wang Z, Wang NH, Li T. Computational analysis of a twin-electrode DC submerged arc furnace for MgO crystal production. J Mater Process Technol. 2011;211(3):388–95. doi:10.1016/j.jmatprotec.2010.10.013. [Google Scholar] [CrossRef]
29. Lopez-Echeverry JS, Reif-Acherman S, Araujo-Lopez E. Peng-Robinson equation of state: 40 years through cubics. Fluid Phase Equilib. 2017;447:39–71. doi:10.1016/j.fluid.2017.05.007. [Google Scholar] [CrossRef]
30. Traidia A, Roger F, Chidley A, Schroeder J, Marlaud T. Effect of helium-argon mixtures on the heat transfer and fluid flow in gas tungsten arc welding. J Chem Chem Eng. 2011;5(9):854–61. [Google Scholar]
31. Elkoumy MM, El-Anwar M, Fathy AM, Megahed GM, El-Mahallawi I, Ahmed H. Simulation of EAF refining stage. Ain Shams Eng J. 2018;9(4):2781–93. doi:10.1016/j.asej.2017.10.002. [Google Scholar] [CrossRef]
32. Yuan B, Fang W, Li J, Cai Y, Qu Z, Wang Z. A coupled finite element-element-free Galerkin method for simulating viscous pressure forming. Eng Anal Bound Elem. 2016;68:86–102. doi:10.1016/j.enganabound.2016.04.003. [Google Scholar] [CrossRef]
33. Peng D, Zhao L, Zhou C, Mao J. Finite element numerical simulation of local scour of a three-dimensional cylinder under steady flow. Int J Comput Fluid Dyn. 2022;36(10):892–907. doi:10.1080/10618562.2023.2221645. [Google Scholar] [CrossRef]
Cite This Article
 Copyright © 2025 The Author(s). Published by Tech Science Press.
This work is licensed under a Creative Commons Attribution 4.0 International License , which permits unrestricted use, distribution, and reproduction in any medium, provided the original work is properly cited.
 Downloads
 Citation Tools