
 Submit a Paper
 Propose a Special lssue
 Open Access
ARTICLE
Tesla-Valve-Based Wind Barriers for Energy Dissipation and Aerodynamic Load Reduction on Trains
1 Faculty of Civil Engineering and Mechanics, Jiangsu University, Zhenjiang, China
2 School of Mechanical Engineering, Jiangsu University, Zhenjiang, China
3 School of Civil Engineering, Southeast University, Nanjing, China
4 School of Highway, Chang’an University, Xi’an, China
5 School of Robotics and Advanced Manufacturing, Harbin Institute of Technology (Shenzhen), Shenzhen, China
* Corresponding Author: Md. Mahbub Alam. Email:
Fluid Dynamics & Materials Processing 2026, 22(1), 1 https://doi.org/10.32604/fdmp.2026.076681
Received 25 November 2025; Accepted 26 January 2026; Issue published 06 February 2026
 View Full Text
 Download PDF
Abstract
Predicting the precise impacts of climate change on extreme winds remains challenging, yet strong storms are widely expected to occur more frequently in a warming climate. Wind barriers are commonly used on bridges to reduce aerodynamic loads on trains through blocking effects. This study develops a novel wind barrier based on Tesla valves, which not only blocks incoming flow but also dissipates mechanical energy through fluid collision. To demonstrate this energy-dissipation capability, a Tesla plate is placed in a circular duct to examine its influence on pressure drop. Experimental tests and numerical simulations comparing a Tesla channel and a straight channel of equal porosity show that the Tesla configuration produces a substantially higher pressure drop. Validated simulations are then used to conduct a parametric study to optimize the design. By varying the channel ratio, diversion angle, number of dissipation units, and porosity, velocity–pressure-drop relationships for different Tesla plates are obtained. The results show that larger channel ratios, larger diversion angles, and more dissipation units, combined with lower porosity, all increase pressure drop and thus enhance energy dissipation. Finally, the aerodynamic coefficients of a high-speed train on a bridge deck equipped with a Tesla-type barrier are evaluated and compared with those for a traditional straight-channel barrier. The Tesla-type barrier reduces the train’s lateral force coefficient to only 15%–25% of that produced by the traditional barrier, and it generates an additional stabilizing force that further improves running safety.Keywords
With the growing demand for inter-island transportation, numerous cross-sea bridges have been constructed, reflecting a global trend toward long-span bridge engineering. These structures are, however, frequently exposed to strong, high-speed crosswinds due to maritime climatic conditions. Moreover, accumulating evidence indicates that human-induced climate change may further increase the frequency of intense windstorms [1,2,3,4,5]. Such strong winds pose serious risks to traffic safety on bridge decks. In particular, trains may deviate from their designated tracks and, in extreme cases, even overturn.
Wind barriers are an effective means of enhancing train running safety by altering the flow field around the bridge deck. In addition to wind tunnel experiments, numerical simulations have also been widely used to investigate the influence of wind barriers on downstream flow patterns [6,7,8,9]. It is well established that a deep wake, consisting of three main regions (separated region, mixing region, and recovery region), forms behind windbreaks or wind barriers [10]. presented a more refined flow divisions by identifying two upwind flow regions (A1 and A2) [11], one bleed flow region (C) passing through the pores, and one quiet region (D) and two wake regions (E1 and E2), as shown in Fig. 1 [12,13]. The barrier’s blocking effect generates high wind pressure on the windward side, induces flow separation around the structure, and creates a low-velocity region in the lee. As a result, aerodynamic loads on downstream structures are substantially reduced [14,15,16].
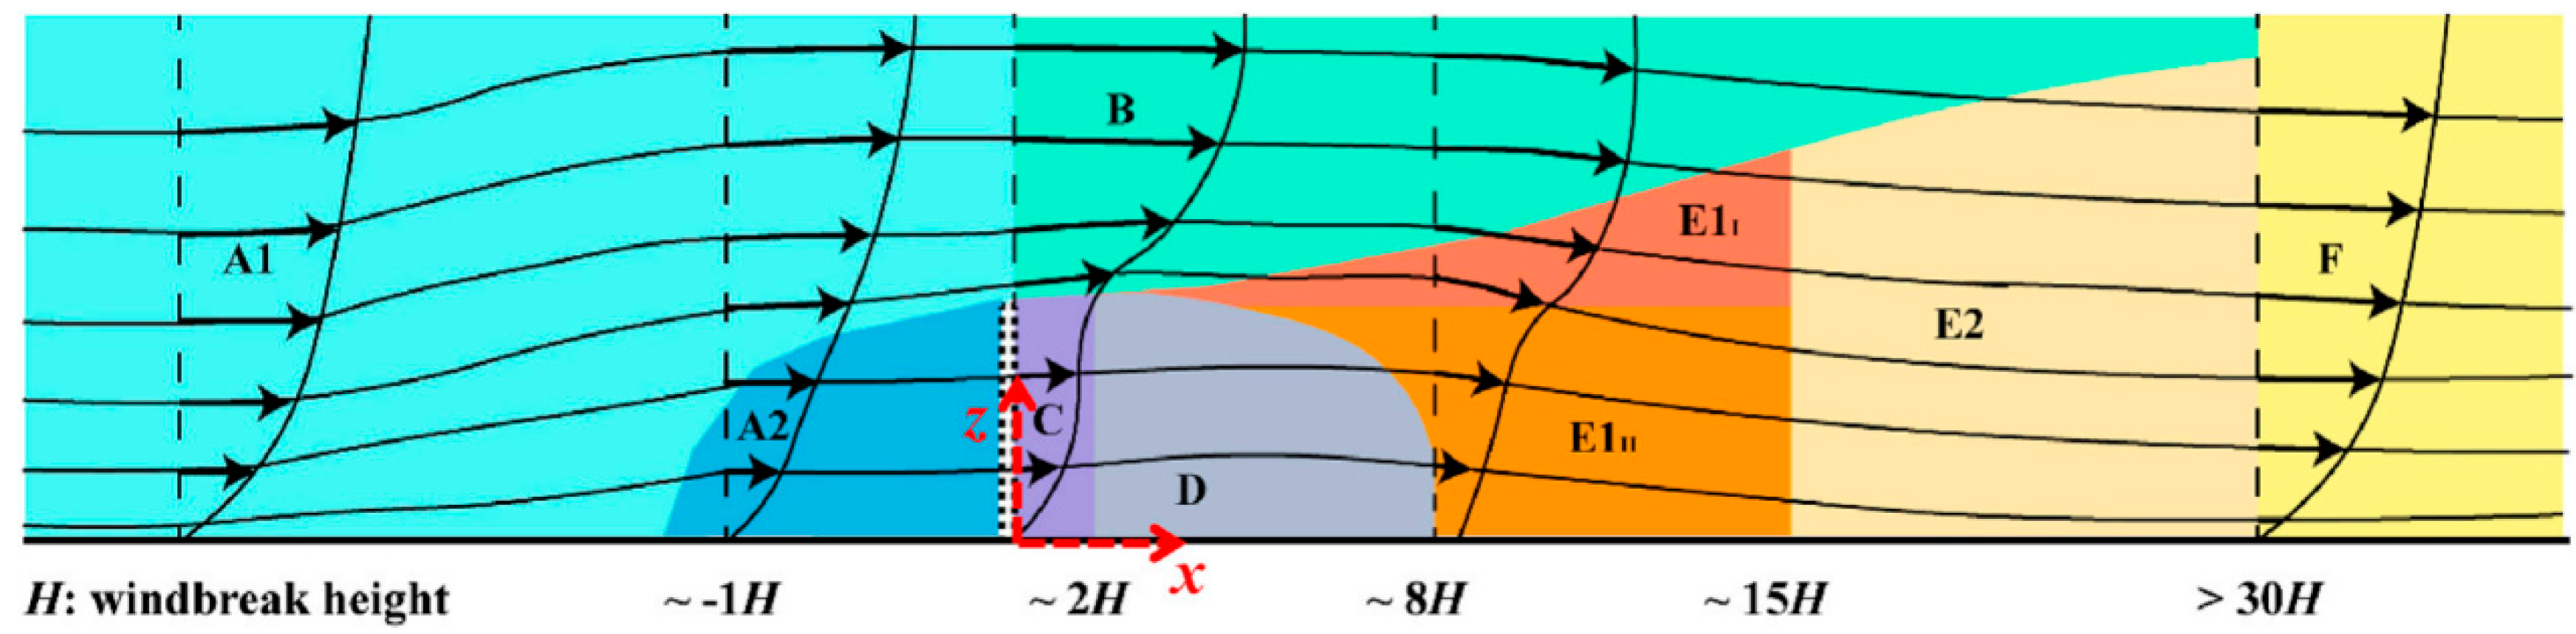
Figure 1: Flow divisions around a windbreak.
Concurrently, numerous studies have examined the aerodynamic performance of trains subjected to crosswinds, focusing on various wind barrier types and their optimal design parameters, such as barrier geometry, porosity, and height, using both static and moving models [17,18,19,20,21]. These studies consistently show that barrier geometry substantially alters the surrounding flow field and, consequently, improves the aerodynamic stability of vehicles. At present, the majority of research on wind barrier protection centers on strip-type, circular-hole-plate-type, and mesh-type barriers, all of which employ straight channels. Given the increasing demand for enhanced safety in train–bridge systems, there is an urgent need to develop new high-performance wind barrier designs.
The one-way valve structure designed by Nikola Tesla in 1920 is usually referred to as a valvular conduit or Tesla valve in the literature [22]. This design allows fluid to pass smoothly in the forward direction while strongly impeding reverse flow, resulting in substantial energy dissipation. Owing to this unique capability, the Tesla valve has been widely explored and applied across various engineering and scientific fields. For example, Ref. [23] integrated the Tesla control mechanism into the oscillation-based flat heat channel to promote and maintain the required circulating flow for improving the overall thermal performance. Ref. [24] investigated the flow and mixing characteristics of a three-dimensional Tesla micromixer using computational fluid dynamics (CFD) simulations and experimental tests, demonstrating its effectiveness in detecting antibody binding reactions on lung cancer cell surface antigens. Ref. [25] designed a water flow circuit using the Tesla valve as a diode to examine the influence of early turbulence and pulsating flow on the pressure of the two-chamber system. Ref. [26] proposed a multi-stage Tesla valve and demonstrated that flow bifurcation and mixing in the reverse direction enhance heat transfer while increasing pressure drop. Although Tesla-type structures have been adopted in various industrial applications, their use in wind disaster prevention and mitigation has not yet been reported in the literature.
This study proposes a Tesla-type wind barrier that dissipates energy through fluid collision within its channels. Unlike traditional wind barriers, which rely primarily on blocking effects to redistribute flow and create protective wake regions, the Tesla-type barrier introduces an additional mechanism: it reduces the kinetic energy of the incoming wind by inducing flow collision and mixing inside the Tesla channels. To clarify this working principle, numerical simulations of the flow dynamics in a Tesla valve are first validated against experimental measurements, demonstrating the effectiveness of the Tesla plate in generating a substantial pressure drop. The influence of key structural parameters, including channel ratio, diversion angle, number of energy dissipation units, and porosity, is then investigated to identify an optimal Tesla plate configuration. Finally, the aerodynamic performance of the optimized Tesla-type wind barrier for mitigating crosswind effects on a train–bridge system is evaluated. Comparative analyses with a conventional strip-type wind barrier show that the Tesla-type barrier offers superior wind mitigation capability.
2 Basis of a Tesla-Type Wind Barrier
The basic flow loop consists of the forward flow and reverse flow in the Tesla valve channel, as illustrated in Fig. 2. While the flow can smoothly travel in a forward direction through the Tesla valve, significant energy dissipation occurs due to flow in the reverse direction.
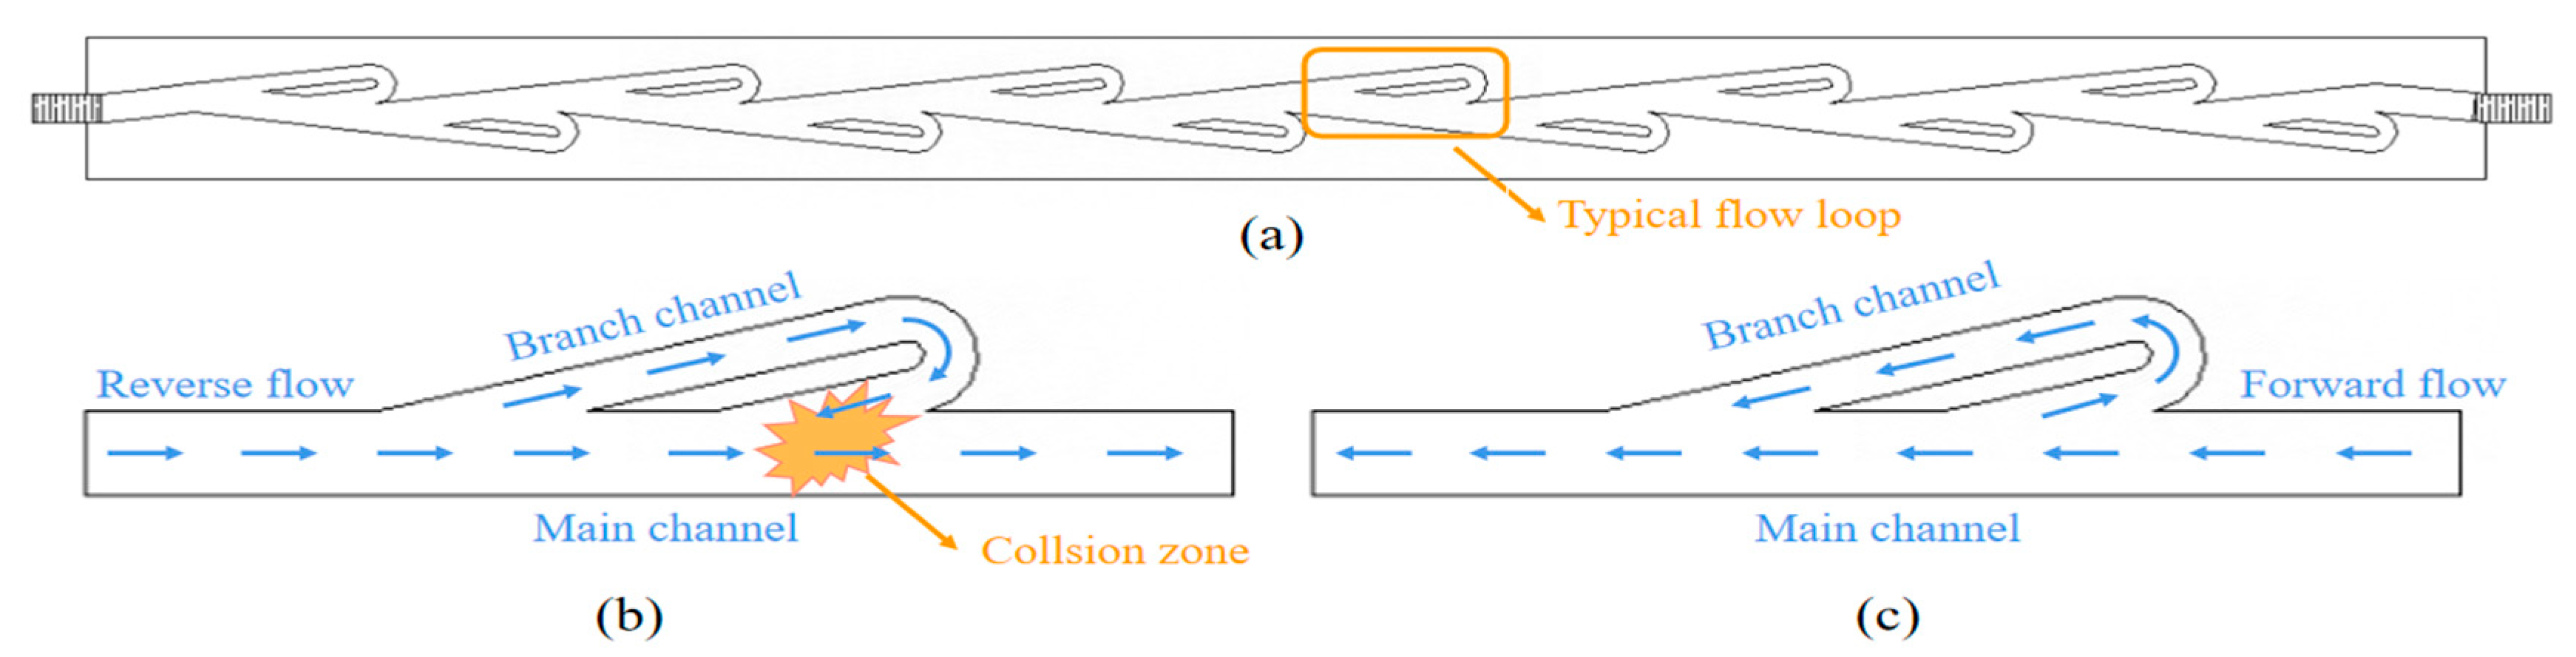
Figure 2: Working mechanism of Tesla valve: (a) Tesla valve and flow loop; (b) Reverse flow loop; (c) Forward flow loop.
To investigate the energy dissipation characteristics of a wind barrier composed of multiple Tesla valves, a Tesla plate is constructed as illustrated in Fig. 3 [27]. Specifically, the channel-group structural unit is formed by transversely connecting several basic flow-loop units in series. These channel-group units are then arranged longitudinally to create a planar structural assembly. This planar assembly is subsequently stretched in three dimensions to form a compact three-dimensional structural module, which constitutes a segment of the Tesla plate. Through repeated energy-dissipation processes within each basic flow-loop unit, the Tesla plate is expected to generate a substantial pressure drop, making it a promising candidate for use as a high-performance wind barrier.
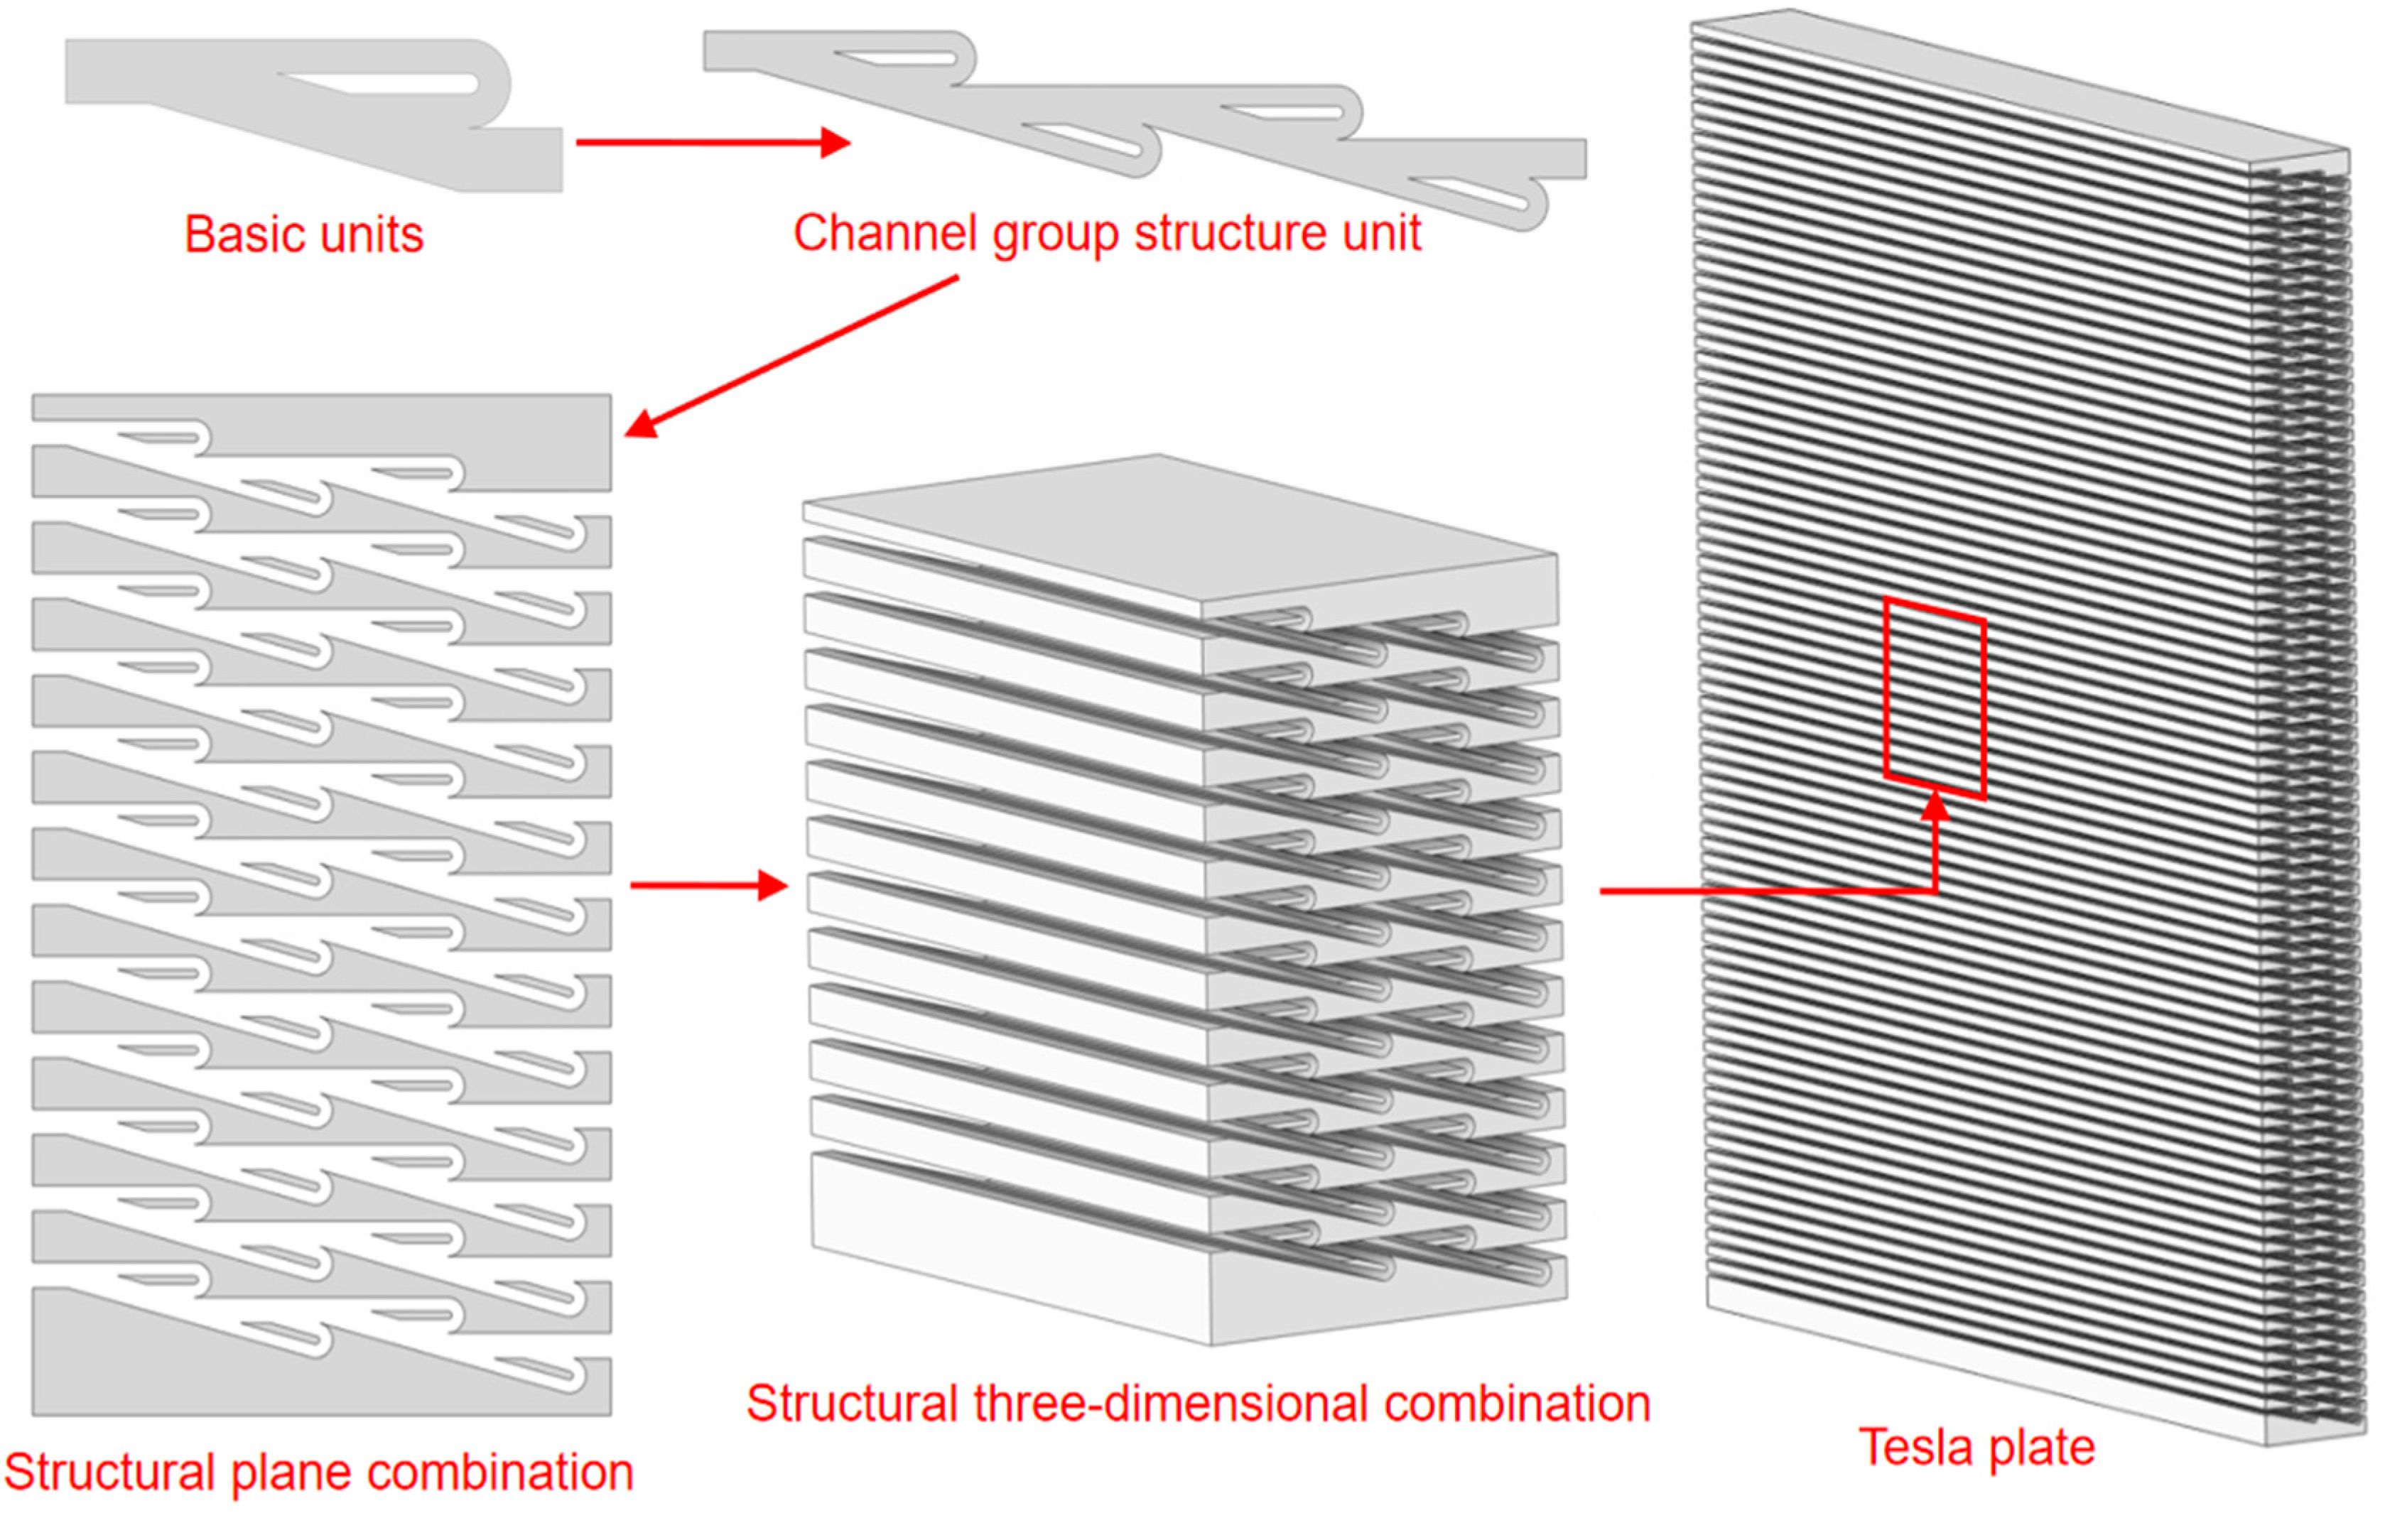
Figure 3: The combination of channel structures.
3 Simulation and Its Experimental Validation
Pressure drop
For traditional wind barriers, pressure drop can be expressed as follows (2) [28,29]:
The Tesla plate test model is drawn in Fig. 4a, which has a cylindrical outer contour with a diameter of 200 mm, and the detailed dimensions of its typical flow loop are also provided. A corresponding straight channel with the same porosity is also established for comparison, as shown in Fig. 4b. The width of the Tesla plate is approximately three times greater than that of the straight-channel model due to its internal turning geometry and specially designed collision chambers of the Tesla structure.
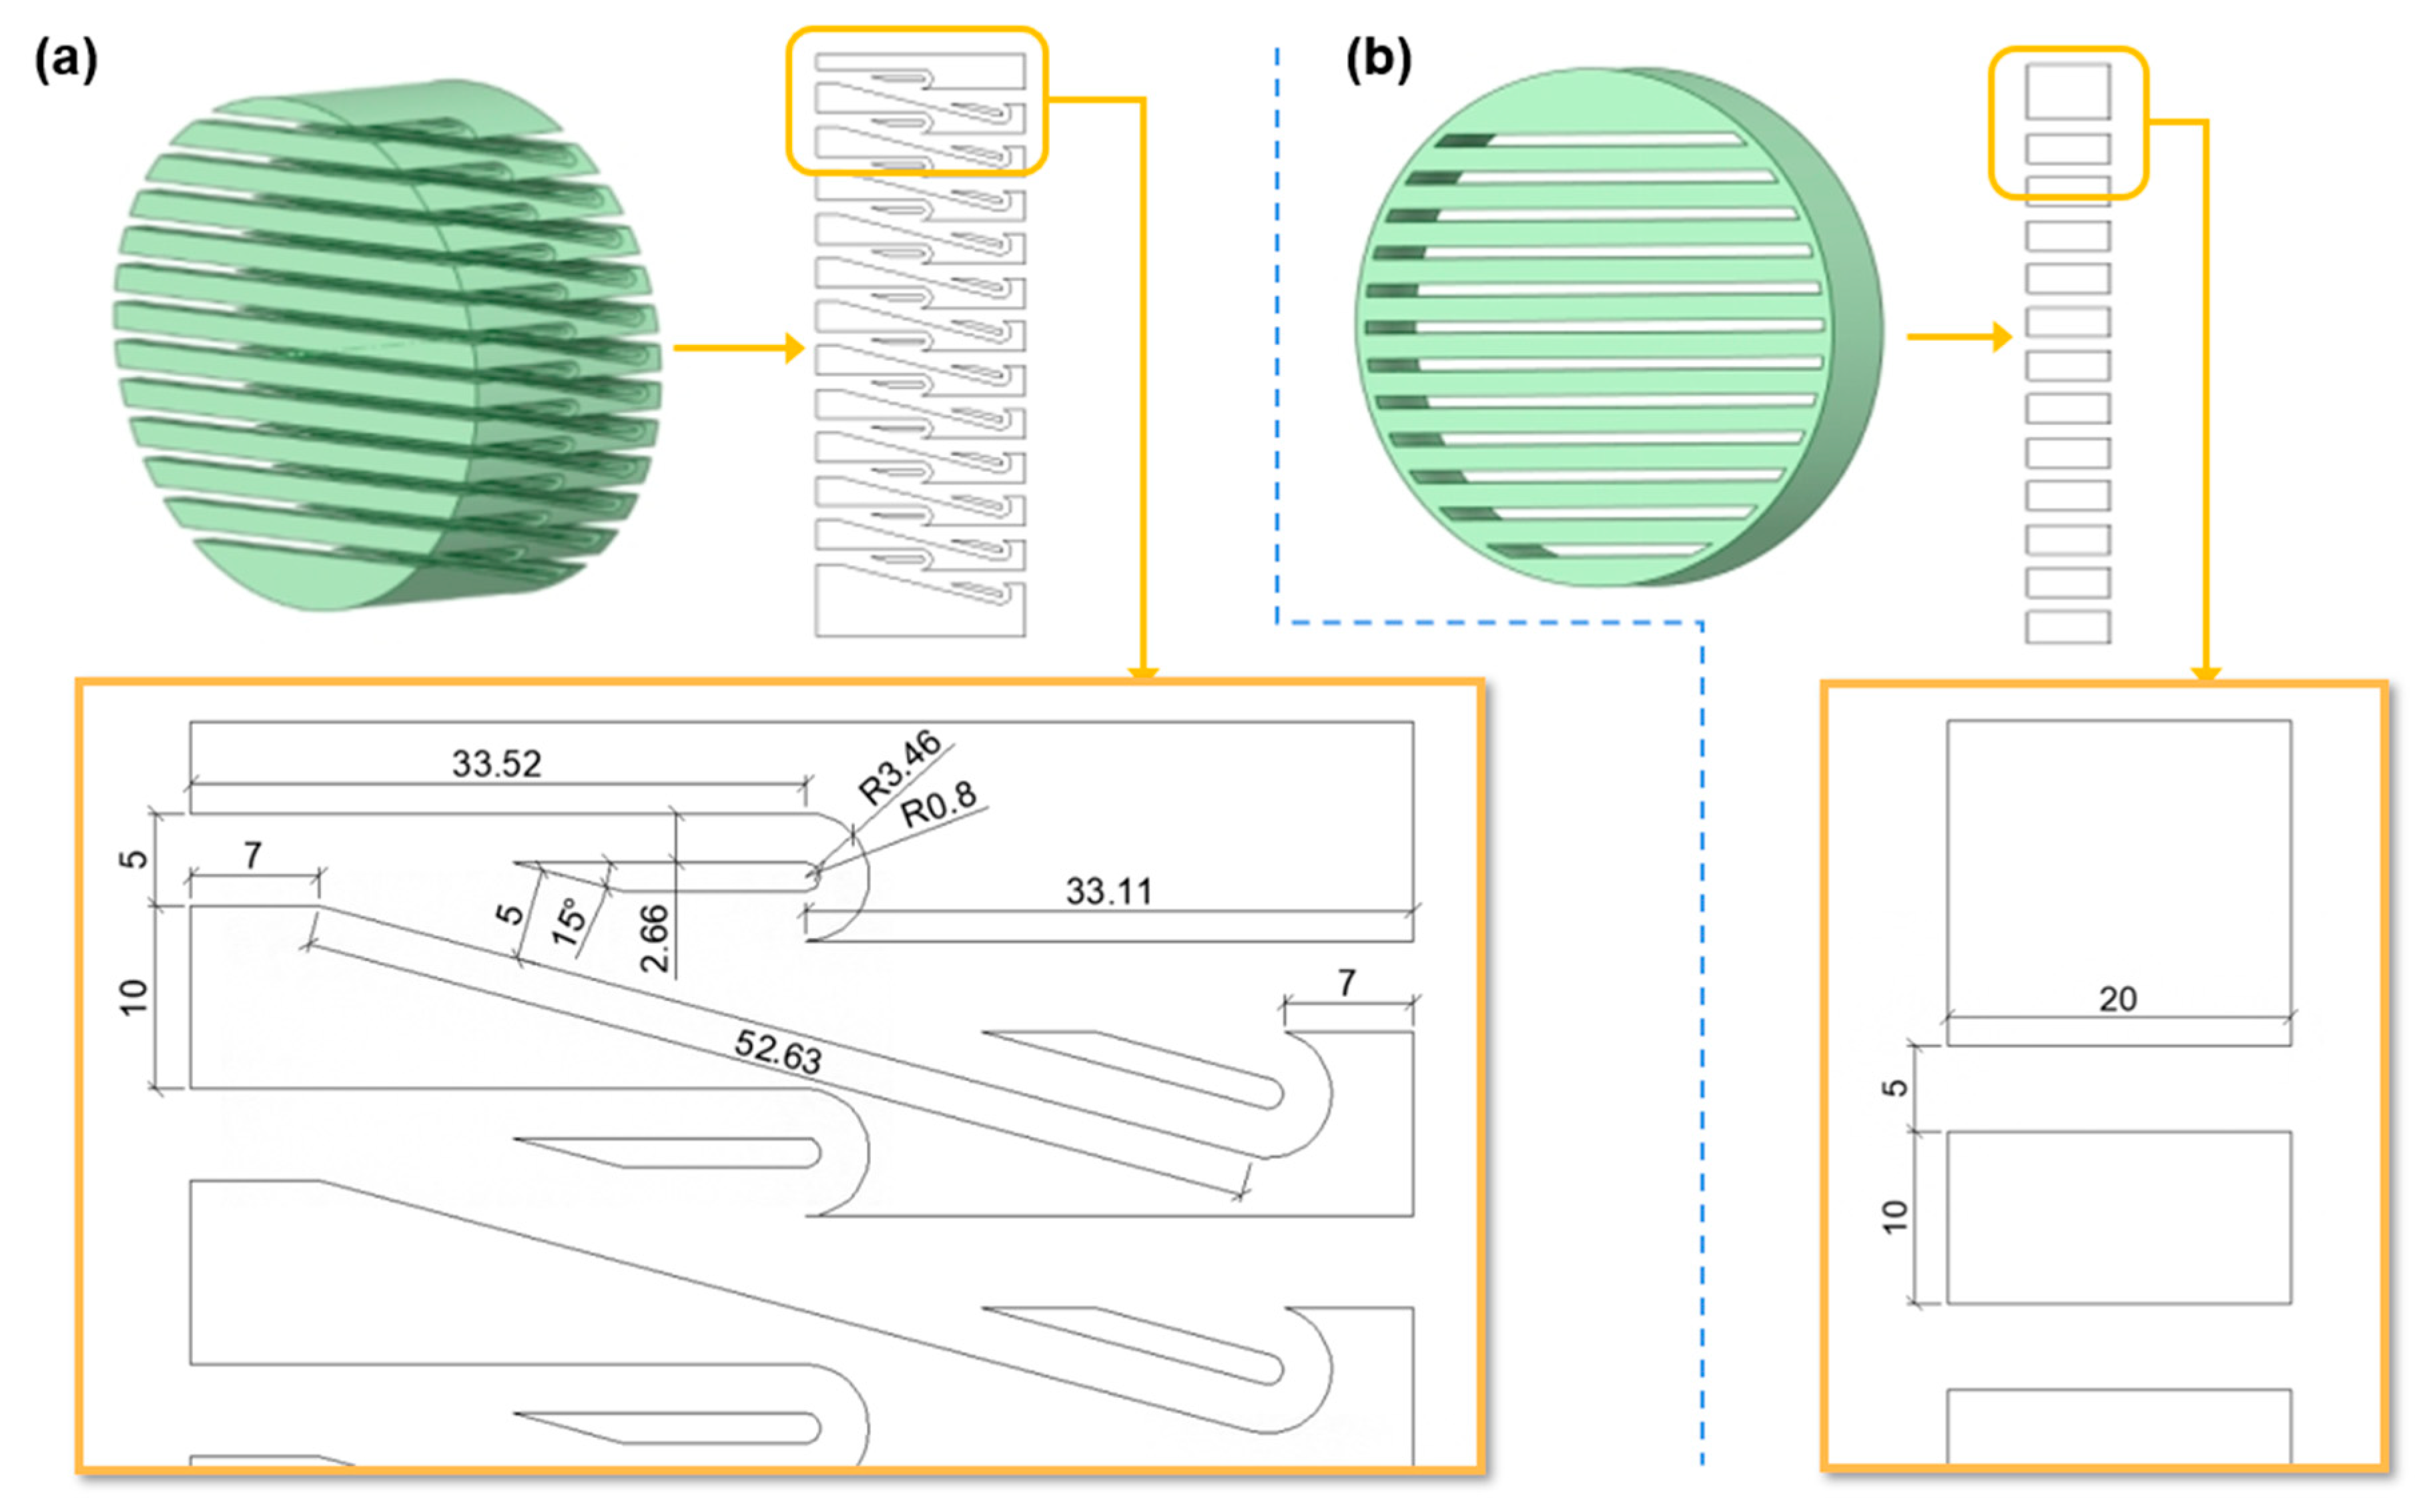
Figure 4: Porous cylinder models and dimensions (unit: mm): (a) tesla plate, and (b) straight channel.
For both the Tesla and straight channels, wind-blowing and suction conditions at the inlet are examined. Additionally, for the Tesla channel, both forward and reverse flow directions are considered. Accordingly, four scenarios—forward blowing, forward suction, reverse blowing, and reverse suction—are analyzed, as summarized in Table 1.
Table 1: Flow condition cases.
| Case No. | Channel Type | Inlet |
|---|---|---|
| S-B | straight channel | blowing |
| S-S | straight channel | suction |
| F-B | Tesla plate forward flow channel | blowing |
| F-S | Tesla plate forward flow channel | suction |
| R-B | Tesla plate reverse flow channel | blowing |
| R-S | Tesla plate reverse flow channel | suction |
Numerical analysis is performed using the Fluent flow solver in ANSYS software. As shown in Fig. 5a, a three-dimensional computational domain is constructed in SpaceClaim. The central section contains the test model (either the Tesla plate or the straight channel), which is connected to two circular ducts, each 2 m in length, on both sides. To account for air leakage caused by measurement probes, circular holes are introduced at the midspan of each duct. The main flow domain is meshed using unstructured grids with a predefined size of 20 mm, while the mesh near the walls is refined to 1 mm, with boundary-layer elements added along the surfaces. The completed mesh is shown in Fig. 5b. The boundary conditions of numerical simulations are presented in Table 2 for various operational scenarios.
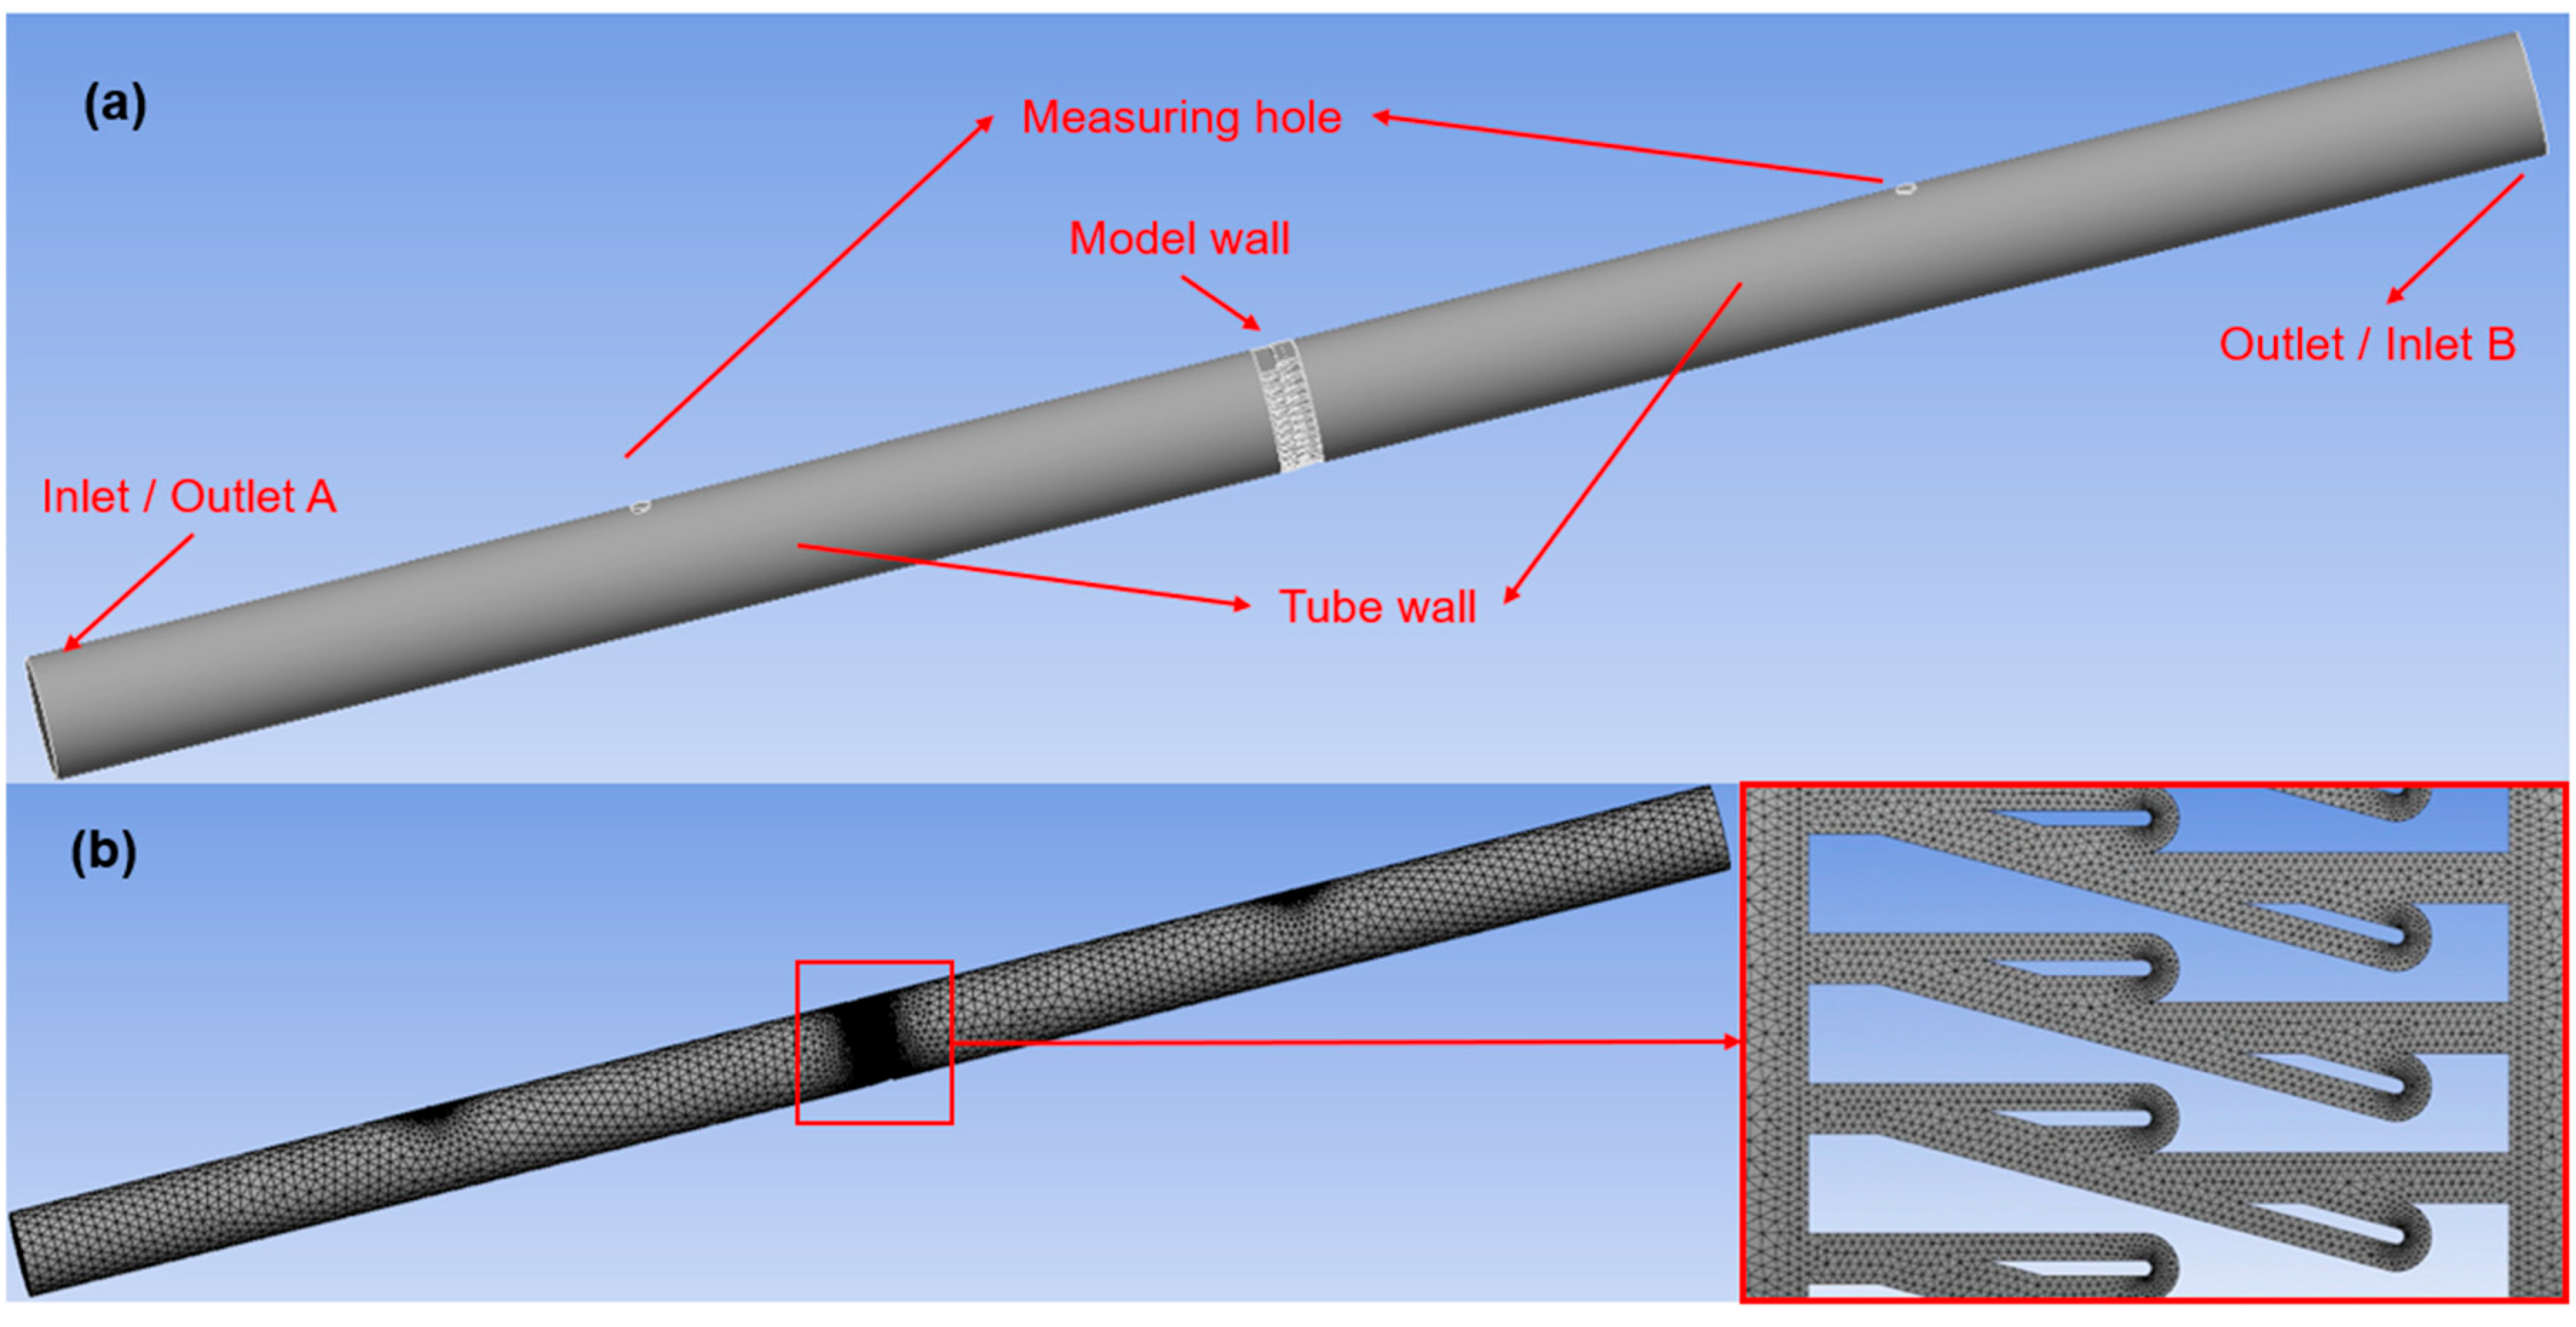
Figure 5: Internal flow model of Tesla plate: (a) tesla plate model; and (b) mesh system for numerical simulation.
Table 2: Boundary conditions of numerical simulations.
| Case | Inlet/Outlet A | Outlet/Inlet B | Model Wall | Tube Wall | Measuring Hole |
|---|---|---|---|---|---|
| F-B | Intake-fan | Outlet-vent | wall | wall | Outlet-vent |
| F-S | Inlet-vent | Exhaust-fan | wall | wall | Inlet-vent |
| R-B | Outlet-vent | Intake-fan | wall | wall | Outlet-vent |
| R-S | Exhaust-fan | Inlet-vent | wall | wall | Inlet-vent |
| S-B | Intake-fan | Outlet-vent | wall | wall | Outlet-vent |
| S-S | Inlet-vent | Exhaust-fan | wall | wall | Inlet-vent |
The flow in the computational domain is set to be ideal-gas. The turbulence model utilized for the numerical simulation is the k-ω SST model [30], considering the energy equation [31]. The SIMPLE algorithm is used to solve the Reynolds-averaged Navier-Stokes equations due to its good convergence performance [32].
An internal flow test rig is designed to measure pressure drop and validate the numerical simulations physically. As depicted in Fig. 6, the test model, 3D-printed from Polylactic Acid (PLA), is installed at the midspan of the setup. Both ends of the model are sealed and connected to circular ducts with a diameter of 200 mm. An axial-flow fan, manufactured by Sheng Shida Co. Ltd., is installed at the inlet and can generate a maximum wind pressure of 520 Pa. By adjusting the fan’s rotation, airflow can be either drawn from or blown into the duct, simulating suction or blowing conditions. Additionally, the Tesla plate can achieve both forward and reverse flow patterns by changing its installation orientation. Testing both blowing and suction conditions enables evaluation of the directional sensitivity and flow asymmetry of the Tesla-type structure, which is essential for wind-engineering applications where flow direction may reverse due to gusts or vortex-induced effects.
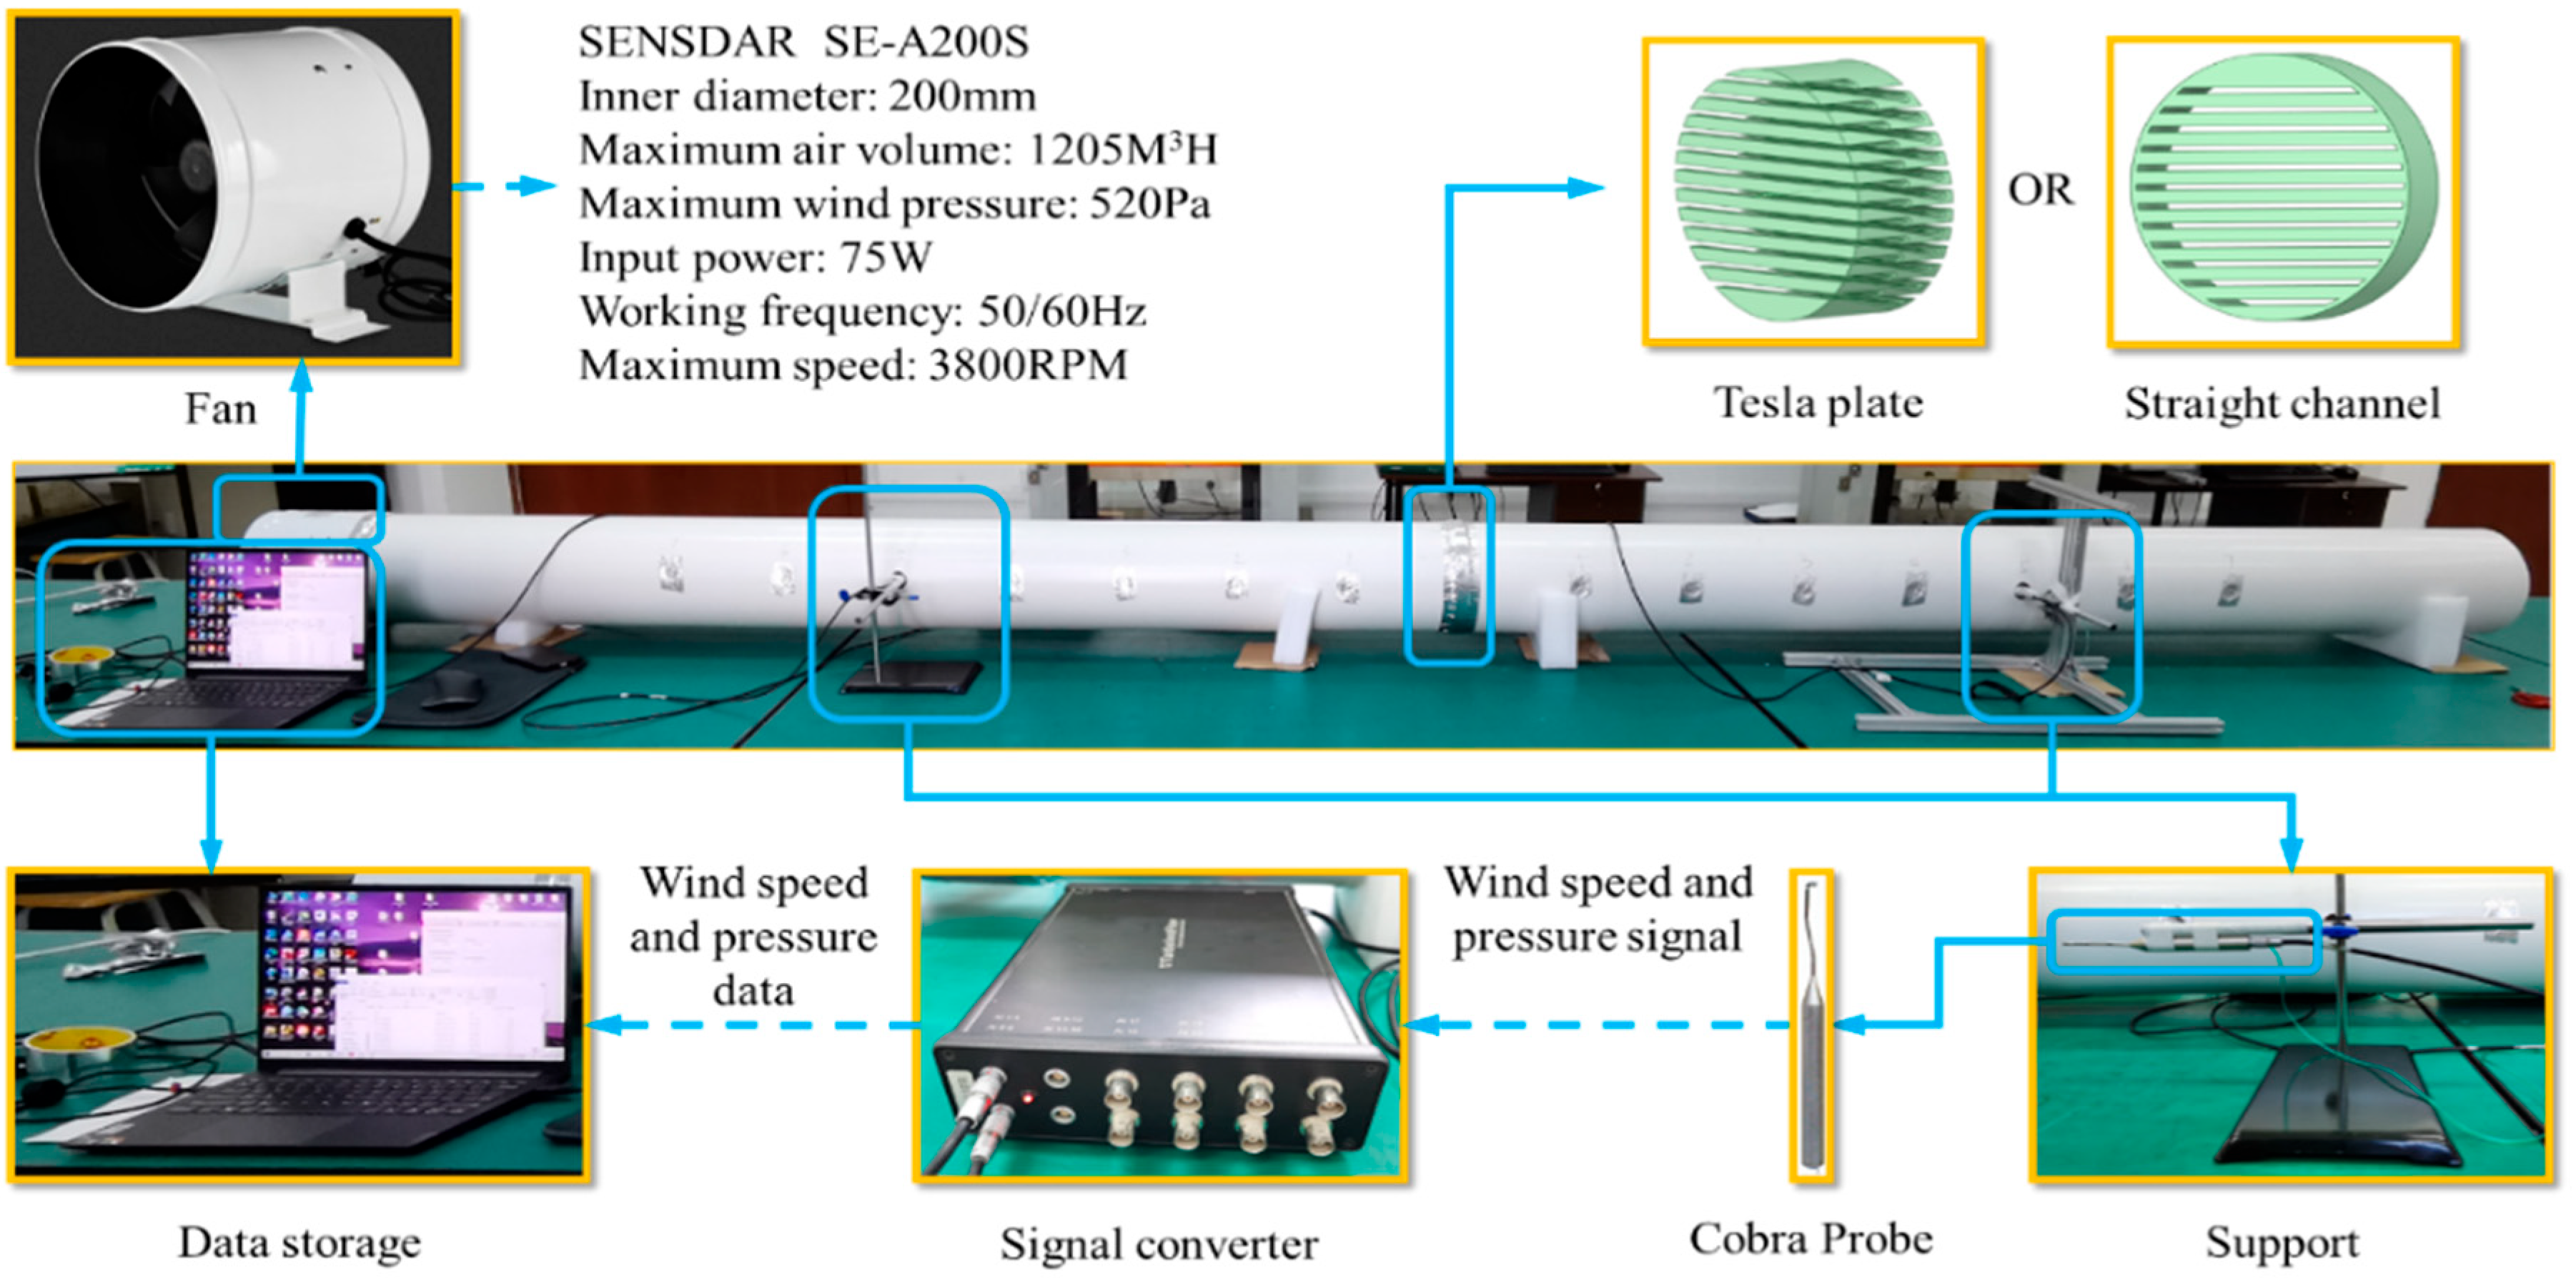
Figure 6: Test system.
Two three-dimensional pulsating wind velocity sensors, namely Cobra Probes, are installed to measure wind velocity and pressure upstream and downstream of the test plates. These probes can measure wind speeds ranging from 2 m/s to 100 m/s with an accuracy of ±0.5 m/s, while inclination and deflection angles are measured with an accuracy of ±1.0°. Seven probe points are symmetrically arranged on both sides at 200 mm intervals to capture variations in wind characteristics at different distances from the test plate. The acquired signals are transmitted to a signal converter, processed, and then stored on a computer for analysis.
3.3 Numerical Results and Validation
The results of the internal flow pipeline tests and corresponding numerical simulations are depicted in Fig. 7 for comparison. Fig. 7a illustrates the experimental and simulated results of wind blowing and suction effects under reverse flow conditions for the Tesla plate. The results between suction and blowing cases are very close to each other, and the simulated pressure-drop values are slightly larger than those of the experimental results. Fig. 7b shows the experimental and simulated results of wind blowing and suction effects under forward flow conditions for the Tesla plate. The experimental results closely align with the simulated outcomes when the wind speed is below 3 m/s. However, there is an increased difference when the wind velocity becomes larger. Fig. 7c presents the experimental and simulated results for wind-blowing and suction conditions in the straight channel. In the experiments, the pressure drop under the blowing condition is slightly higher than that under suction. In contrast, the simulated pressure-drop curves for both blowing and suction conditions nearly coincide. Overall, the numerical simulations capture the wind velocity–pressure drop relationship with good agreement compared to the experimental measurements. The observed variations in maximum velocity among the different cases in Fig. 7 are mainly caused by geometry-induced flow redistribution and localized acceleration effects, particularly in the Tesla plate configurations, whereas the straight channel exhibits a more uniform flow structure.
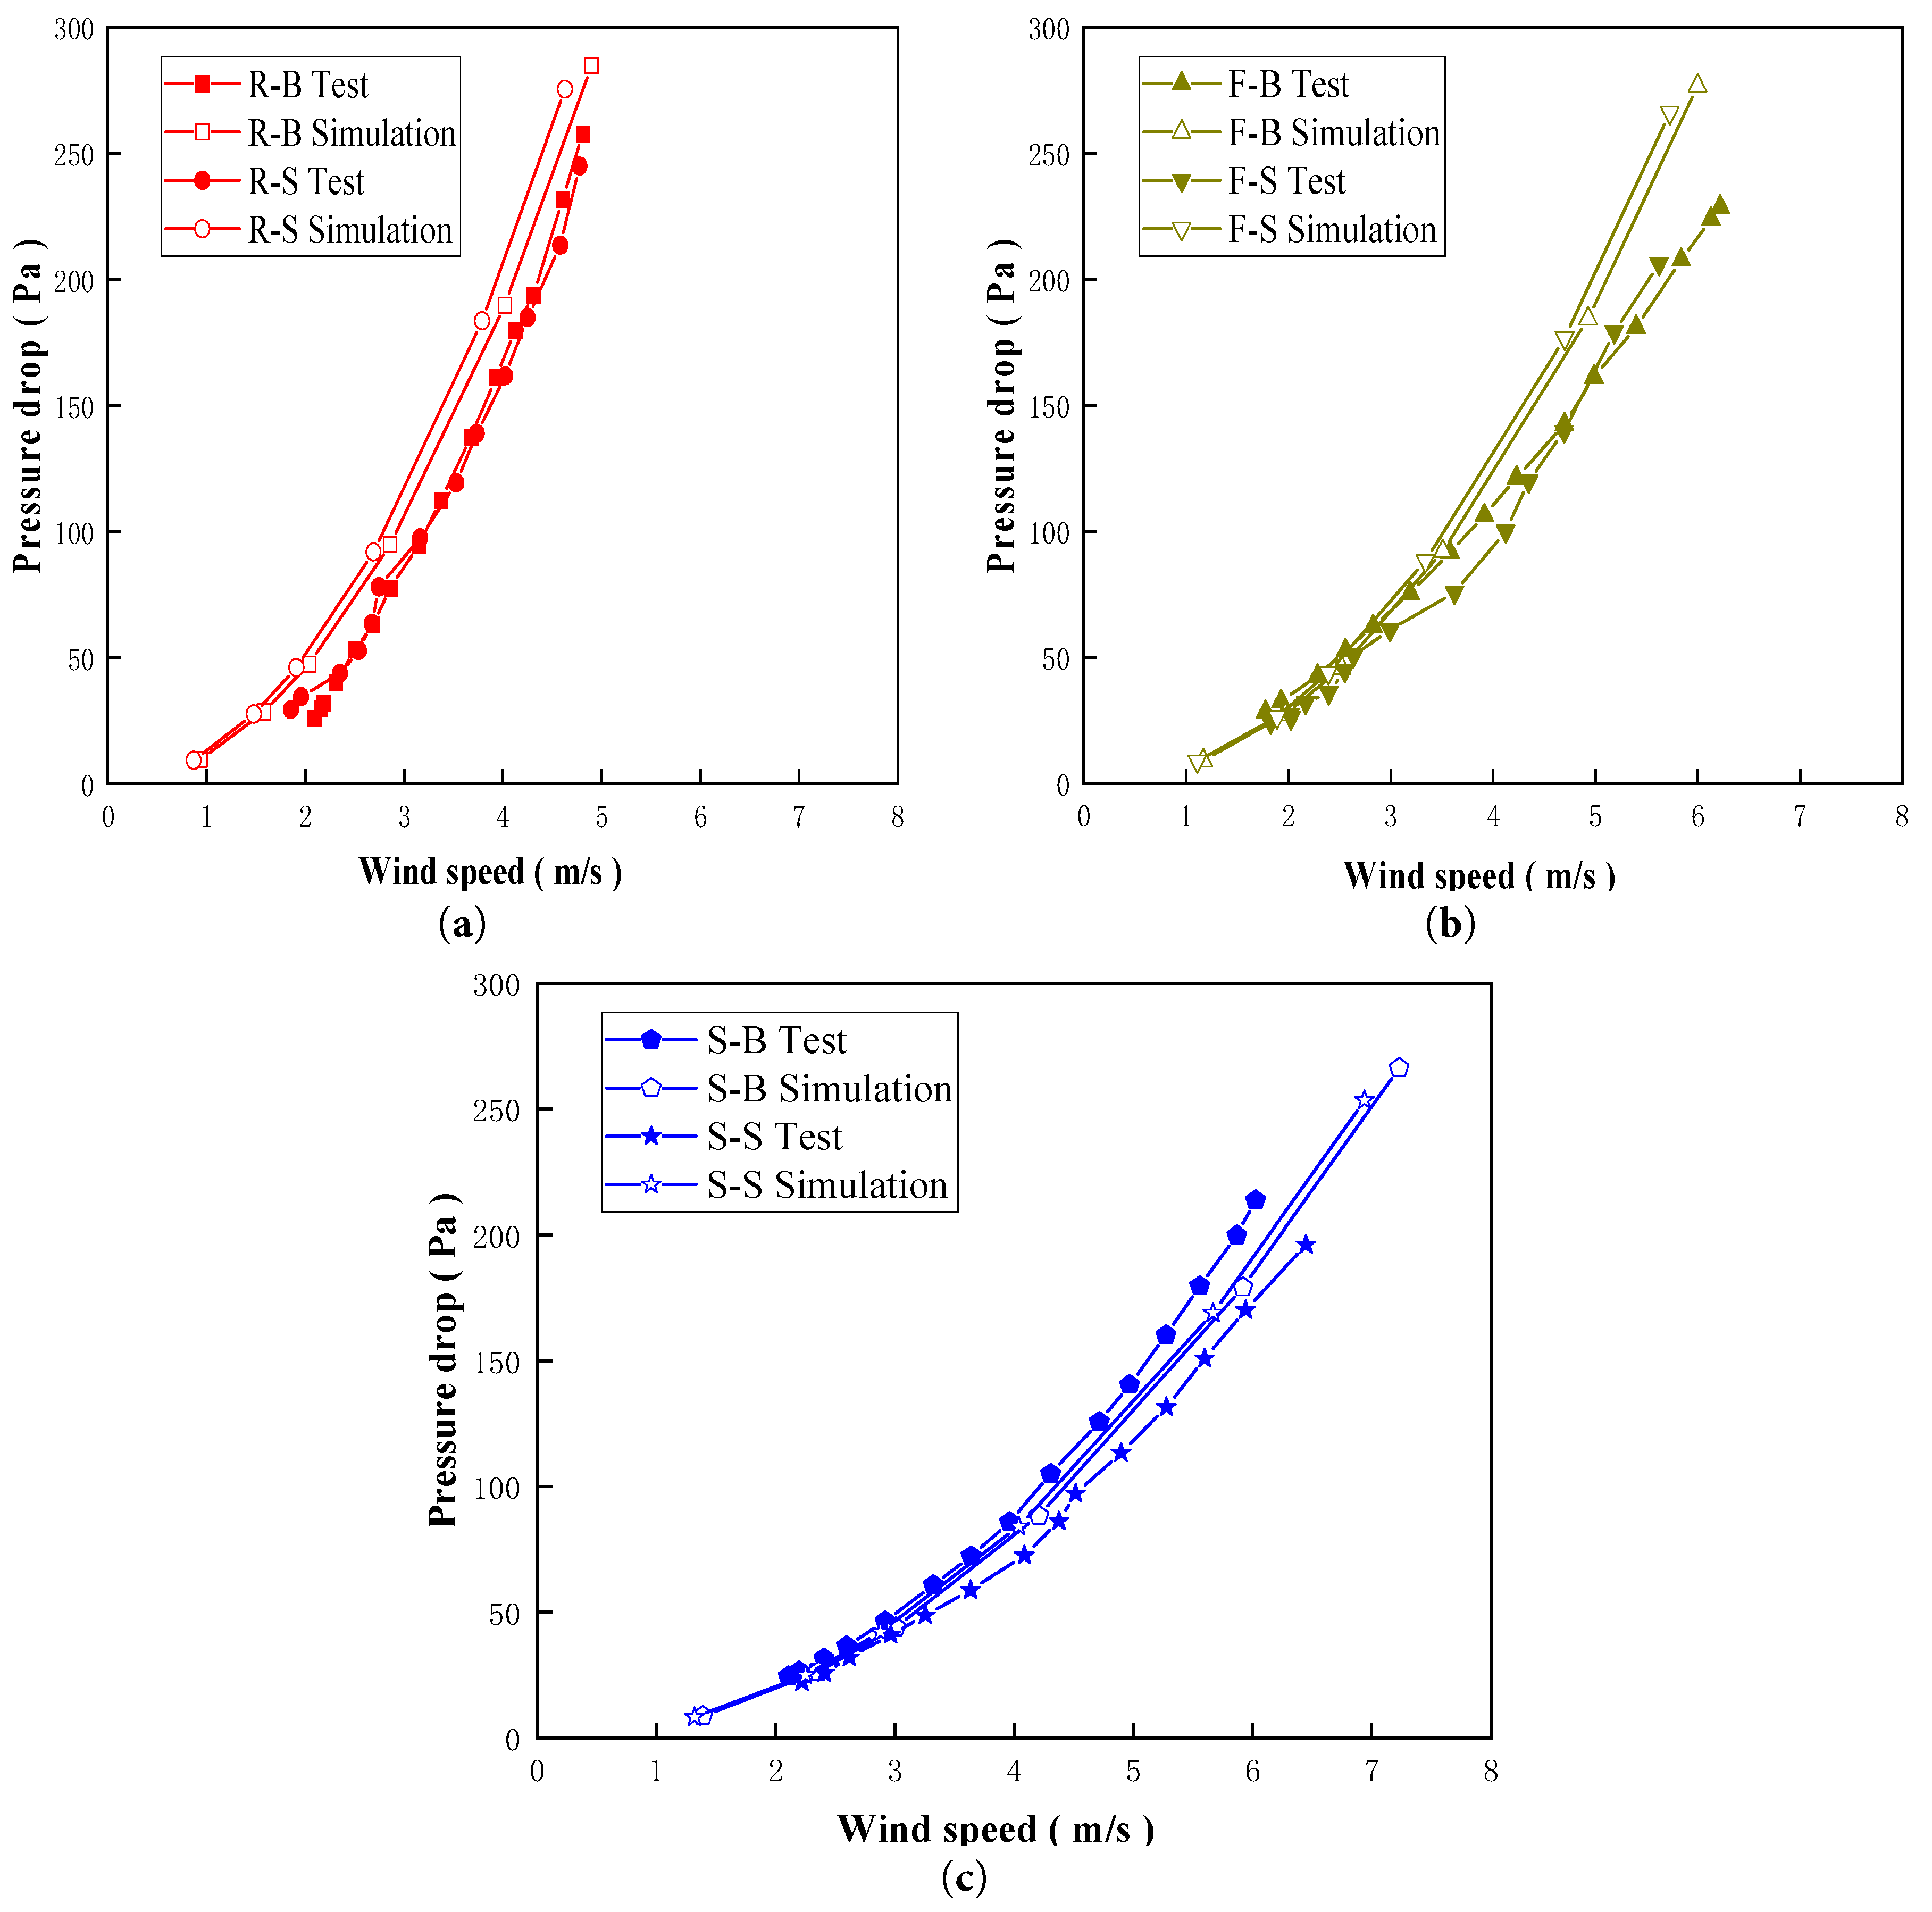
Figure 7: Comparison of wind velocity-pressure drop curves between the pipeline test and the numerical simulation. (a) Tesla plate reverse flow channel; (b) Tesla plate forward flow channel; (c) Straight channel.
The numerically simulated results for the Tesla plate and straight channel are compared in Fig. 8. It is evident that reverse flow in the Tesla plate generates higher pressure-drop values than forward flow at the same wind speed. Both Tesla-forward and Tesla-reverse flows exhibit greater pressure drops than the straight channel, indicating higher energy dissipation. No significant difference is observed between suction and blowing conditions, consistent with the internal flow test results. Therefore, only the blowing condition is considered in the subsequent parametric study of Tesla plates.
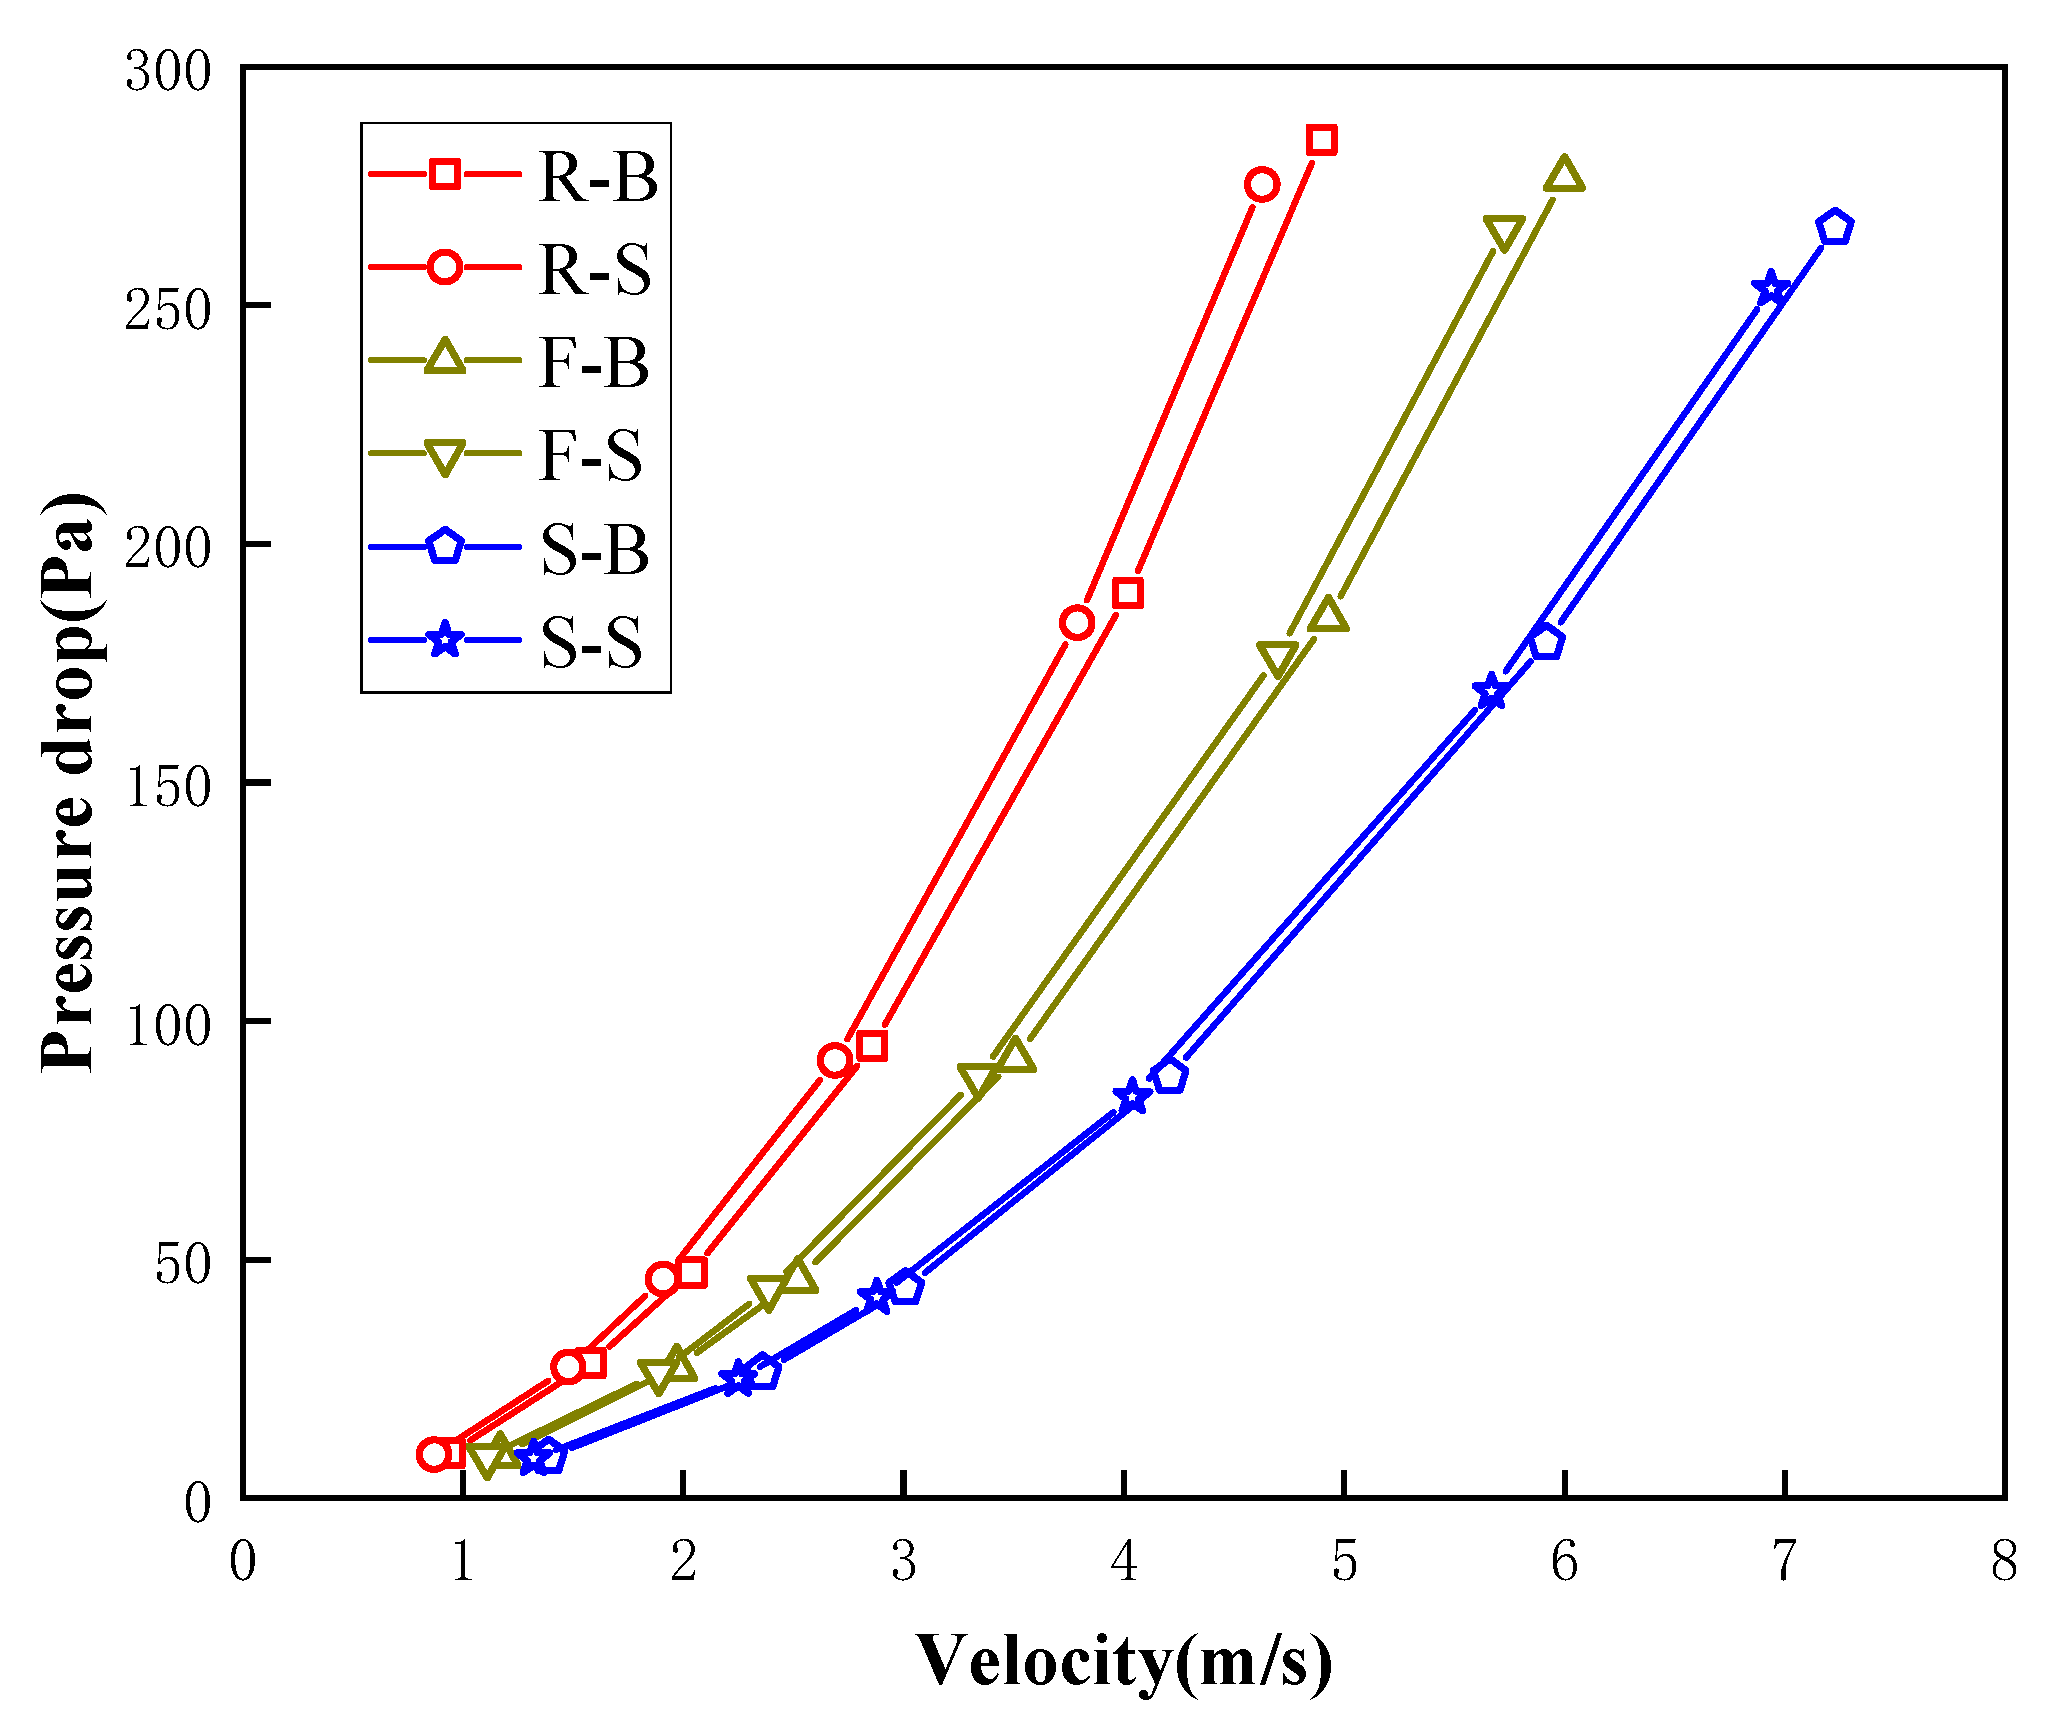
Figure 8: Comparison of wind velocity-pressure drop diagram by the numerical simulation.
The pressure drop performance of Tesla plate is closely related to its structural parameters. In this study, the channel ratio (γ = h/H), diversion angle (α), number of energy dissipation units (N) and porosity (φ) of the Tesla plate are examined for their effects on the pressure drop performance. As shown in Fig. 9, the entrance size of the basic unit of the used Tesla plate is H = 5 mm. After the shunt, it is divided into the primary channel and the secondary channel. The breadth of the primary channel is H = 5 mm, the direction produces a shunt angle α, and the width of the secondary channel is h. A 180° backflow channel is formed on the original direction path, and the angle of impact between the primary channel and the subsidiary channel is also α. The Tesla plate basic units can be connected to each other to form a channel group structure unit. By adjusting the distance between the channel group structure units, the porosity φ can be controlled. Accordingly, the designed parametric study cases are listed in Table 3.
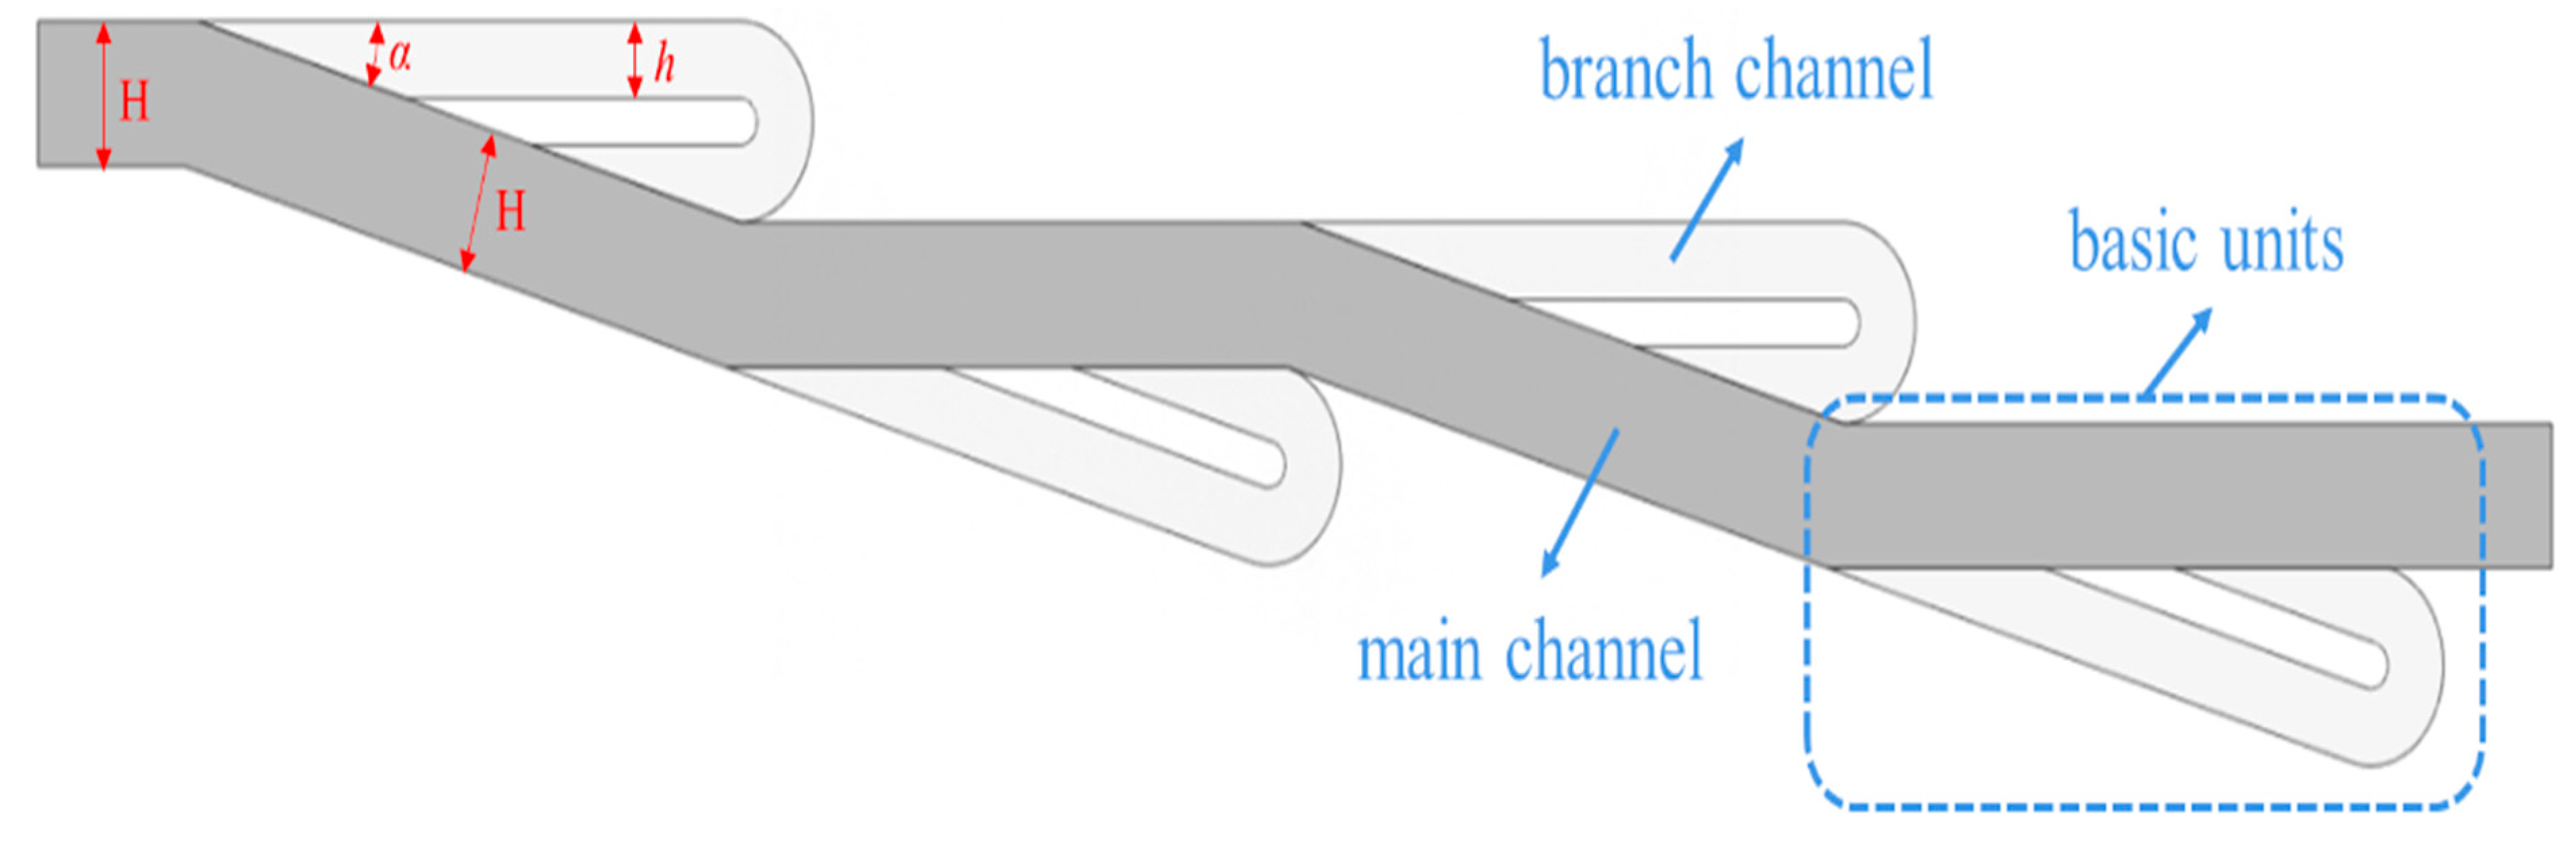
Figure 9: Schematic diagram of structural parameters of the Tesla plate channel group unit.
Table 3: Parametric study cases.
| Case No. | channel Ratio | diversion Angle | Number of Energy Dissipation Units | Porosity |
|---|---|---|---|---|
| 0-0 | 0.53 | 15 | 4 | 48 |
| 1-1 | 0.33 | 15 | 4 | 48 |
| 1-2 | 0.63 | 15 | 4 | 48 |
| 2-1 | 0.53 | 30 | 4 | 48 |
| 2-2 | 0.53 | 45 | 4 | 48 |
| 3-1 | 0.53 | 15 | 1 | 48 |
| 3-2 | 0.53 | 15 | 2 | 48 |
| 3-3 | 0.53 | 15 | 6 | 48 |
| 4-1 | 0.53 | 15 | 4 | 40 |
| 4-2 | 0.53 | 15 | 4 | 36 |
| 4-3 | 0.53 | 15 | 4 | 28 |
Since the primary pressure drop in the Tesla plate arises from flow collisions, discrepancies between the flow rates in the subsidiary and primary channels strongly influence energy dissipation. Therefore, the effect of the channel γ ratio on the pressure-drop performance of the Tesla plate is examined first.
Fig. 10 displays the wind speed contour on the cross section of Case 1-1 (γ = 0.33), Case 0-0 (γ = 0.53) and Case 1-2 (γ = 0.63) at an inlet pressure of 300 Pa. The figure shows that airflow from the primary and subsidiary channels converges at the exit of the subsidiary channels under all operating conditions, generating localized turbulence and a rapid increase in velocity. In the Tesla plate model with γ = 0.33, the maximum wind velocity can exceed 20 m/s, and it decreases as γ increases. When γ is small, the flow in the subsidiary channels is insufficient to significantly affect the velocity at the channel intersection, resulting in weak flow collisions.
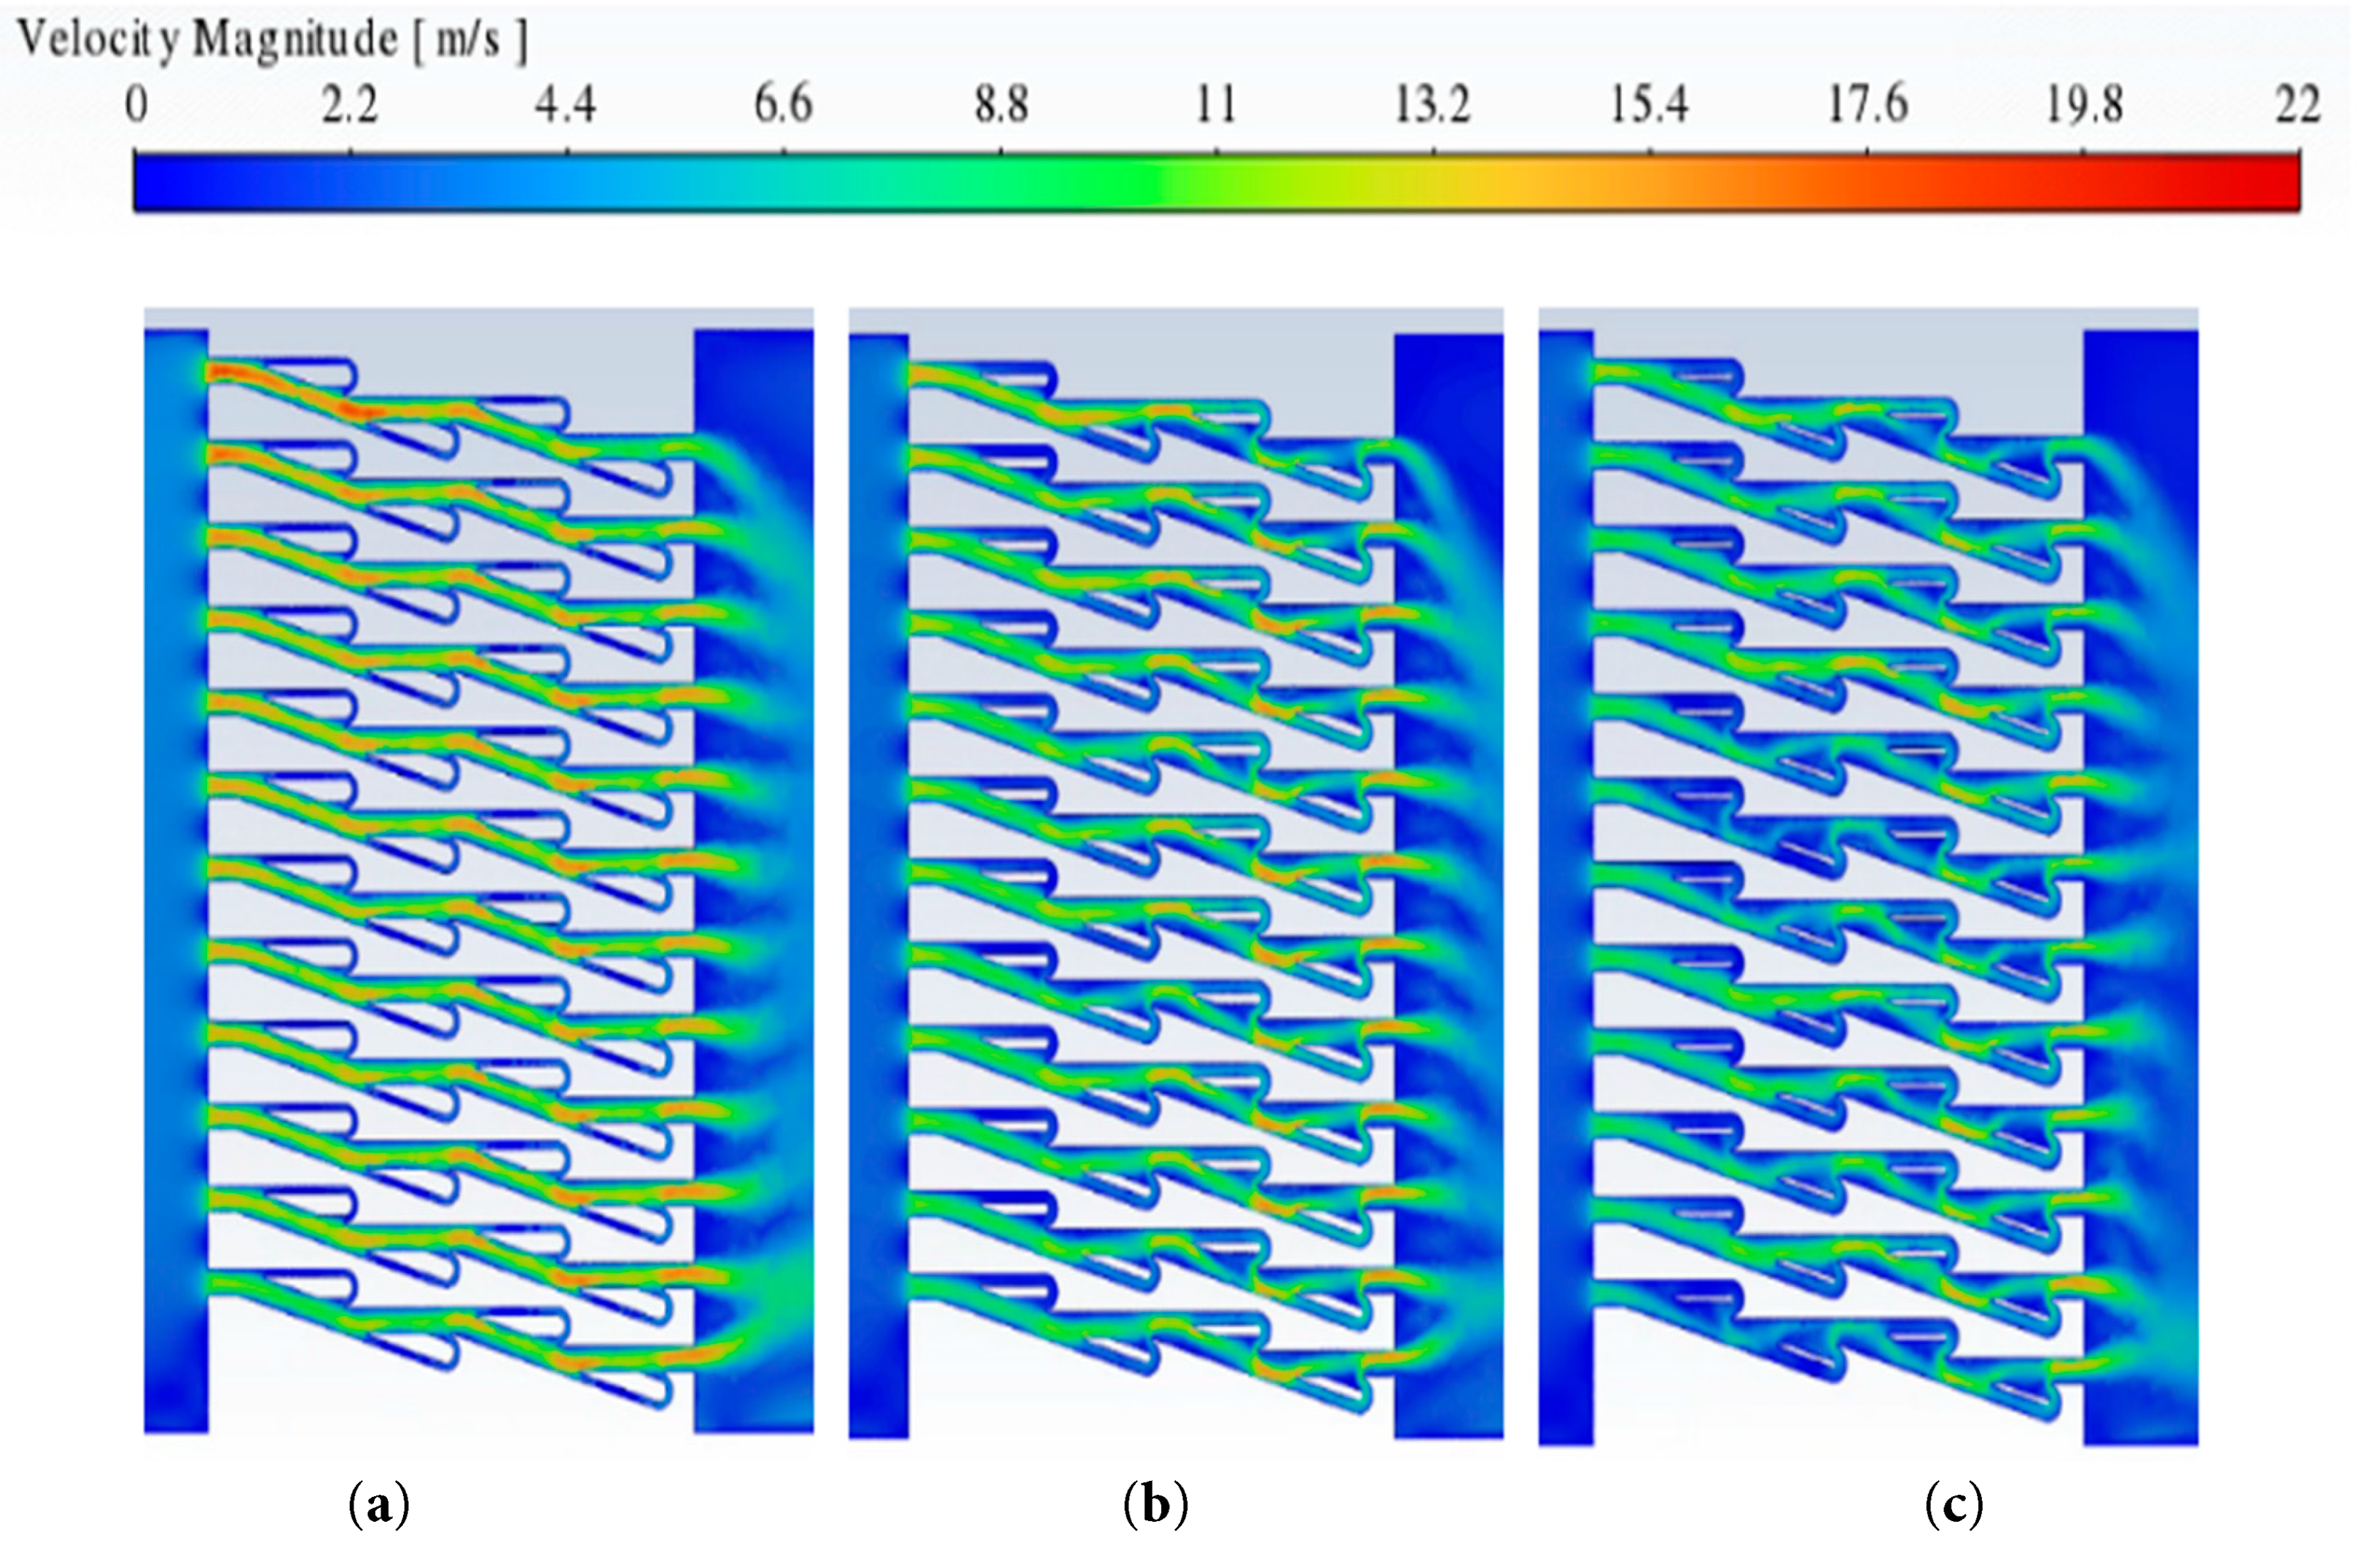
Figure 10: Wind velocity cloud images with different channel ratios (
The wind velocity-pressure drop curves under three working conditions are demonstrated in Fig. 11. The diagram shows that, under all three operating conditions, the pressure decreases significantly with wind speed, roughly following a quadratic trend. As the channel ratio γ increases, the pressure drop through the Tesla plate also rises. Therefore, in practical applications, the lateral channel width of a Tesla-type wind barrier should be maximized while maintaining the main channel width to enhance energy dissipation.
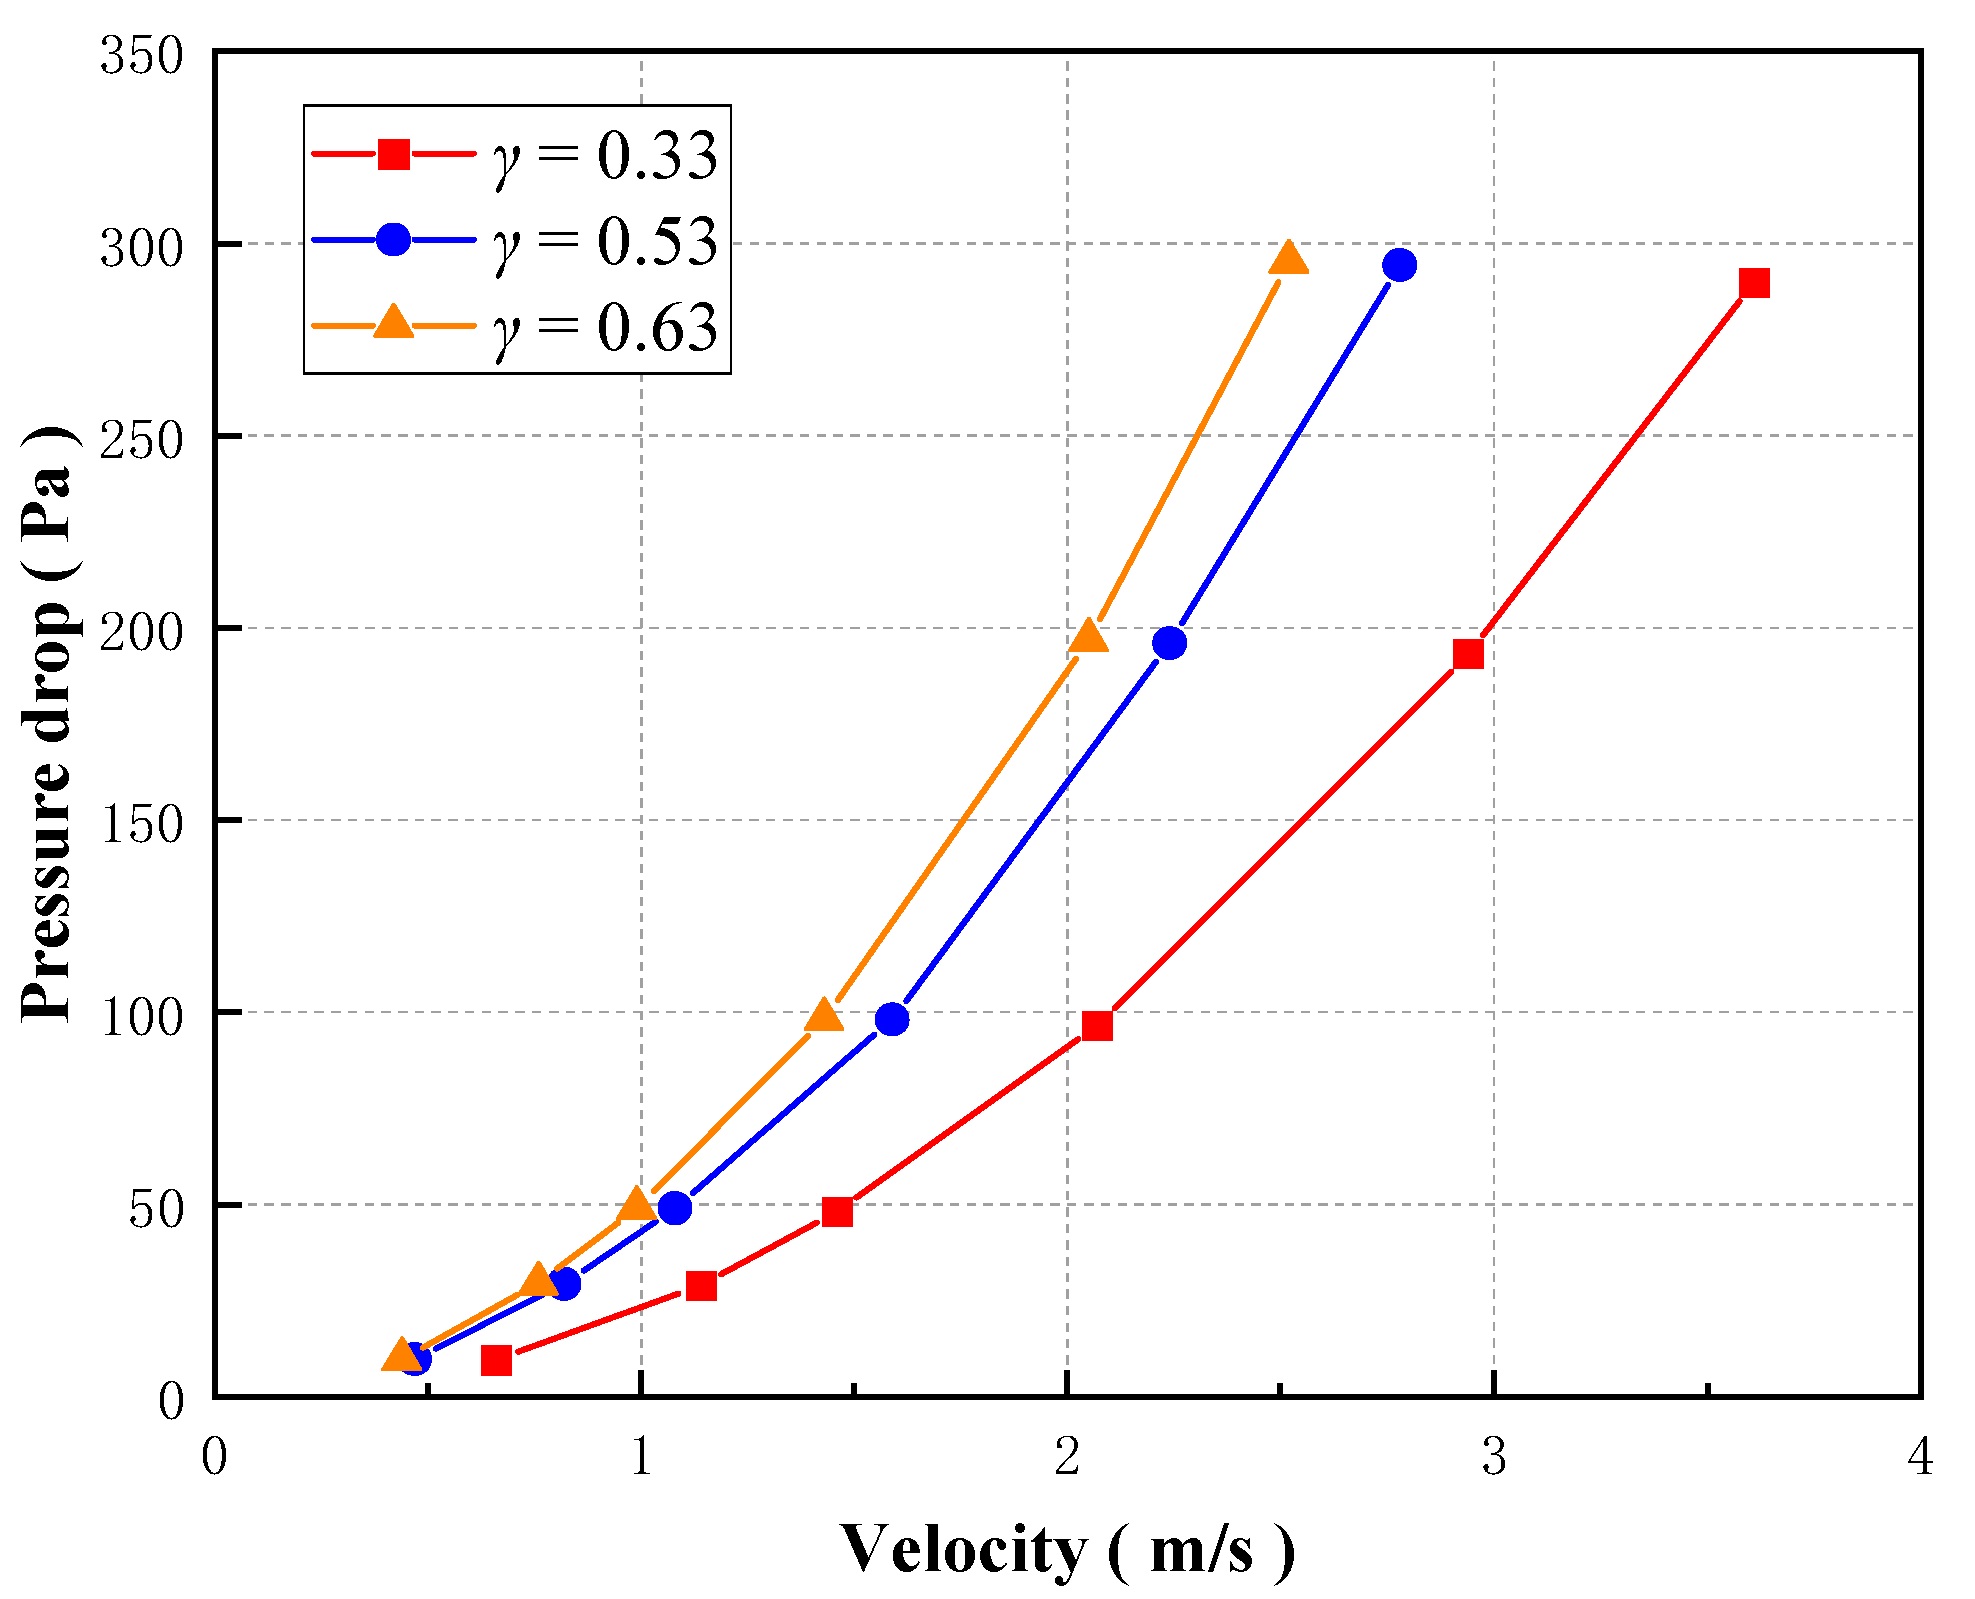
Figure 11: Wind velocity-pressure drop diagram with different channel ratios (
Similar to the effect of channel ratio γ on the Tesla plate, the diversion angle α changes the energy consumption efficiency by affecting the flow collision. The difference is that the channel ratio γ changes the proportion of flow movement rate within the subsidiary channel relative to the flow rate within the main channel, while the diversion angle α is the angle of the collision involving the flow within the subsidiary channel and the primary channel flow. Considering that the change of the angle may greatly affect the spacing between the channel groups when the structural plane is combined, this study explores the influence of the split angle α based on the actual arrangements.
Fig. 12 is the wind velocity contour on the middle section of Case 0-0 (α = 15°), Case 2-1 (α = 30°) and Case 2-2 (α = 45°) under the inlet pressure of 300 Pa. From the figure, it can be seen that the end of each energy dissipation unit in the Tesla plate structure model has an area with locally increased velocity for all cases. The maximum wind velocity inside the Tesla plate structure model with α = 15° can reach more than 18 m/s, and it decreases with the split angle α. Also, the turbulence zone in the rear of the Tesla plate model decreases with α.
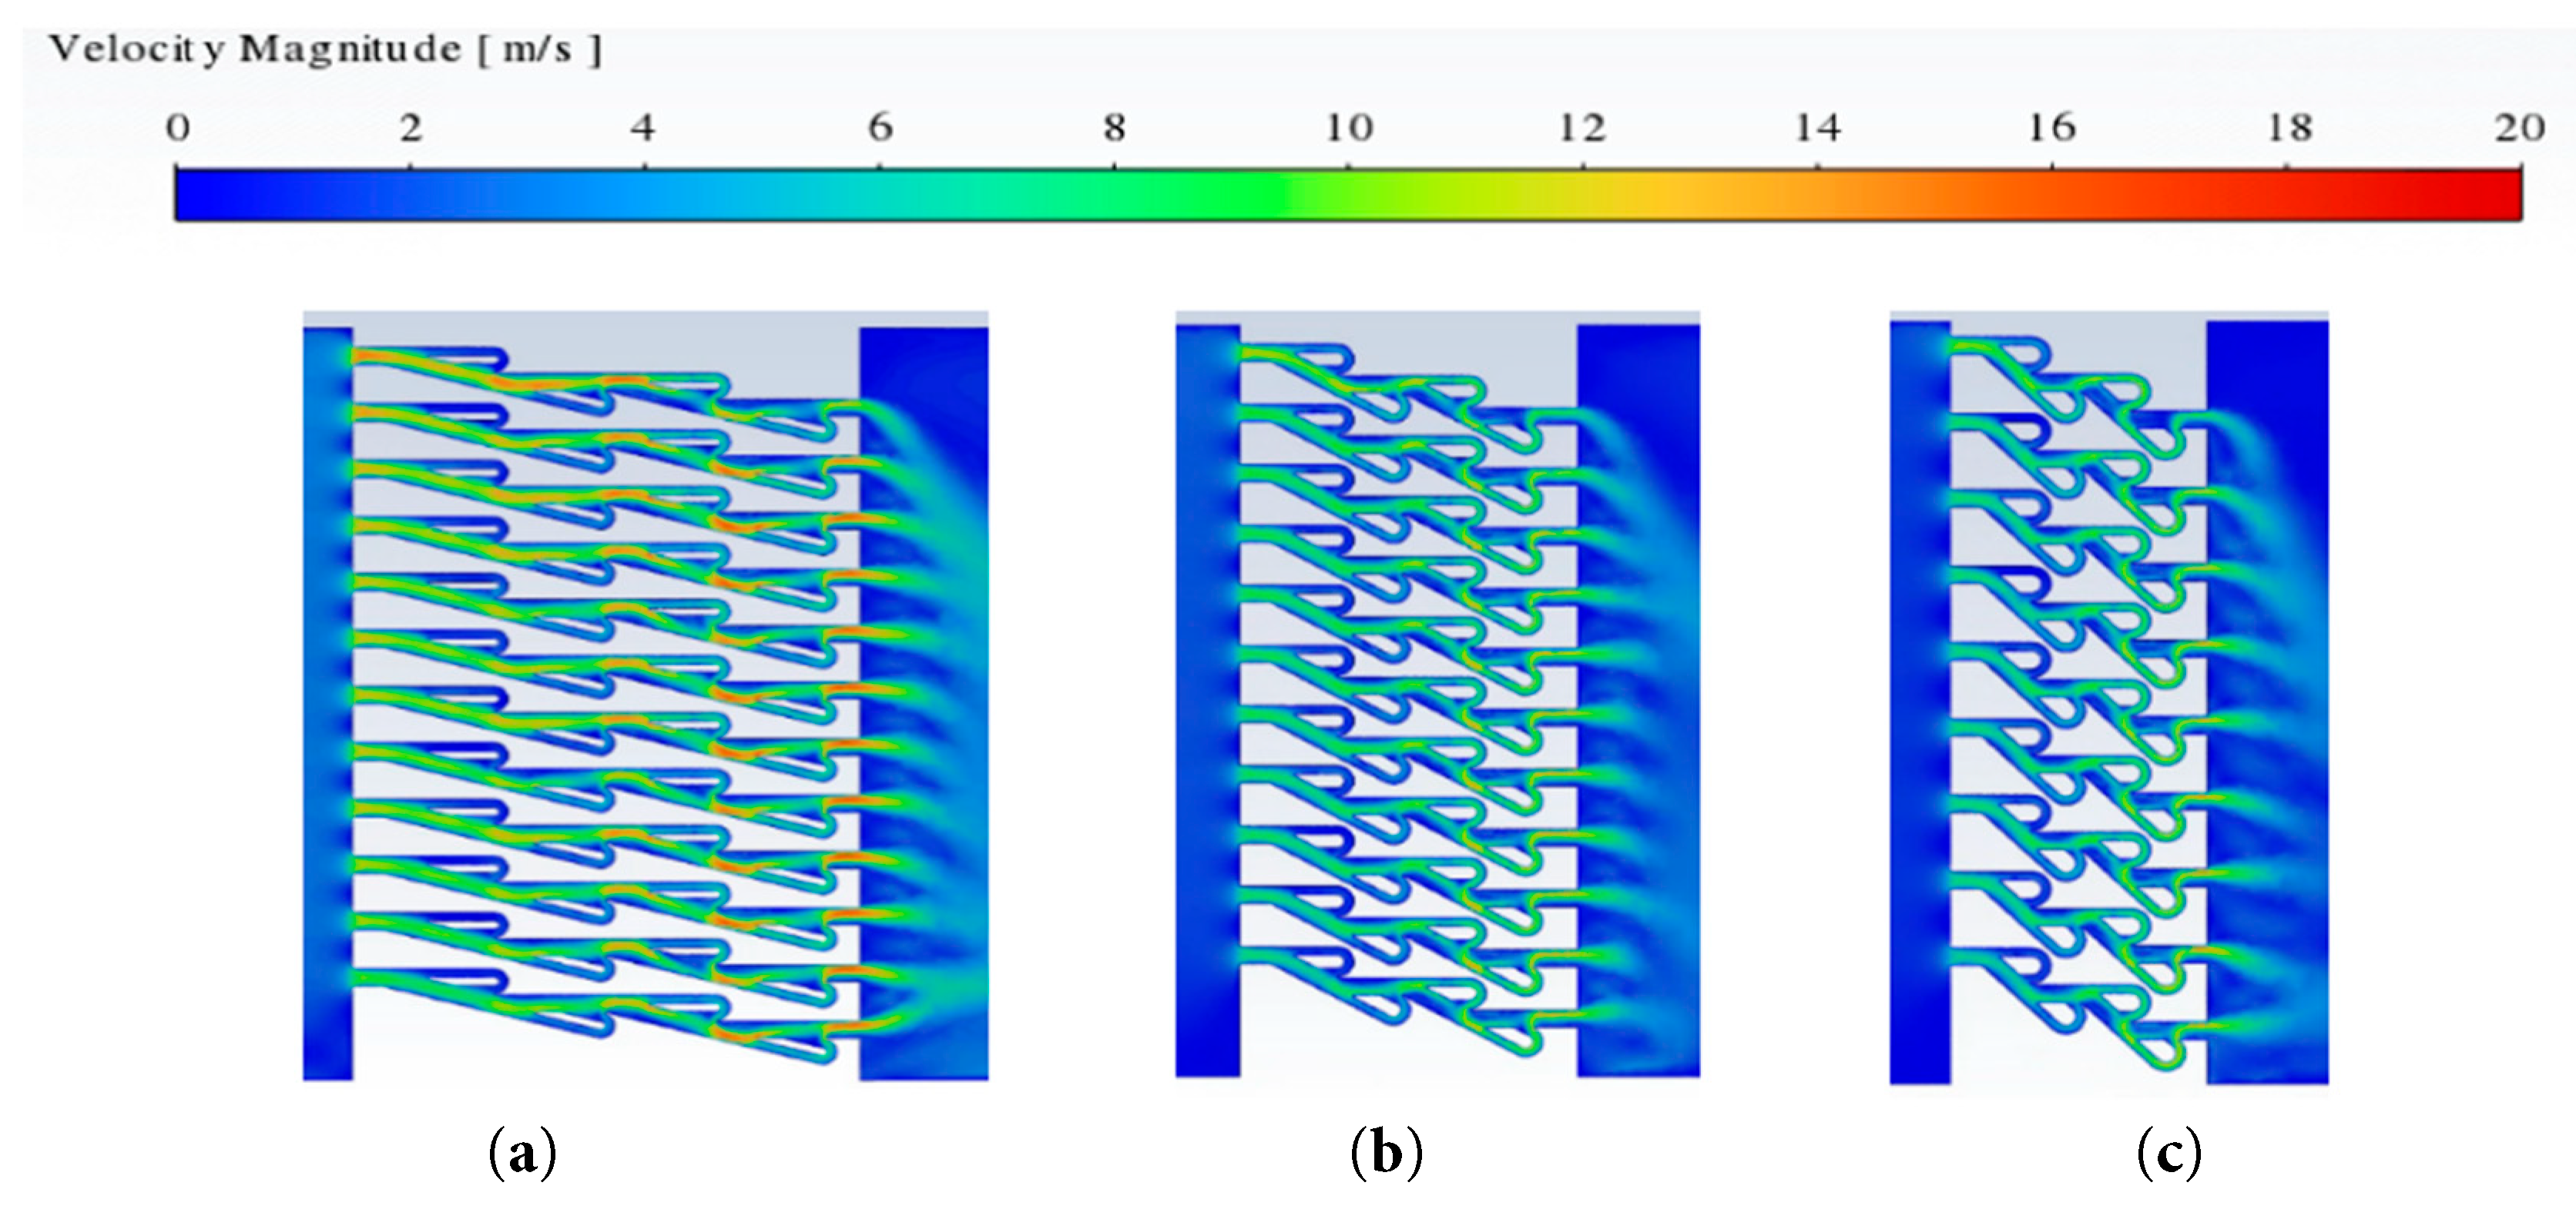
Figure 12: Wind velocity cloud images with different diverting angle (
The wind velocity-pressure drop curves under three working conditions are illustrated in Fig. 13. In all cases, pressure decreases significantly with wind speed, roughly following a quadratic trend. Here, the widths of the primary and lateral channels are kept constant, while the angle between them (α) and the number of channel groups in the vertical direction are varied. The pressure drop increases with α; however, while a larger collision angle tends to increase energy dissipation, it also alters the spacing of the channel arrangement, which has an opposing effect. In this case study, the effect of the arrangement spacing dominates, determining the overall pressure-drop behavior of the Tesla plate.
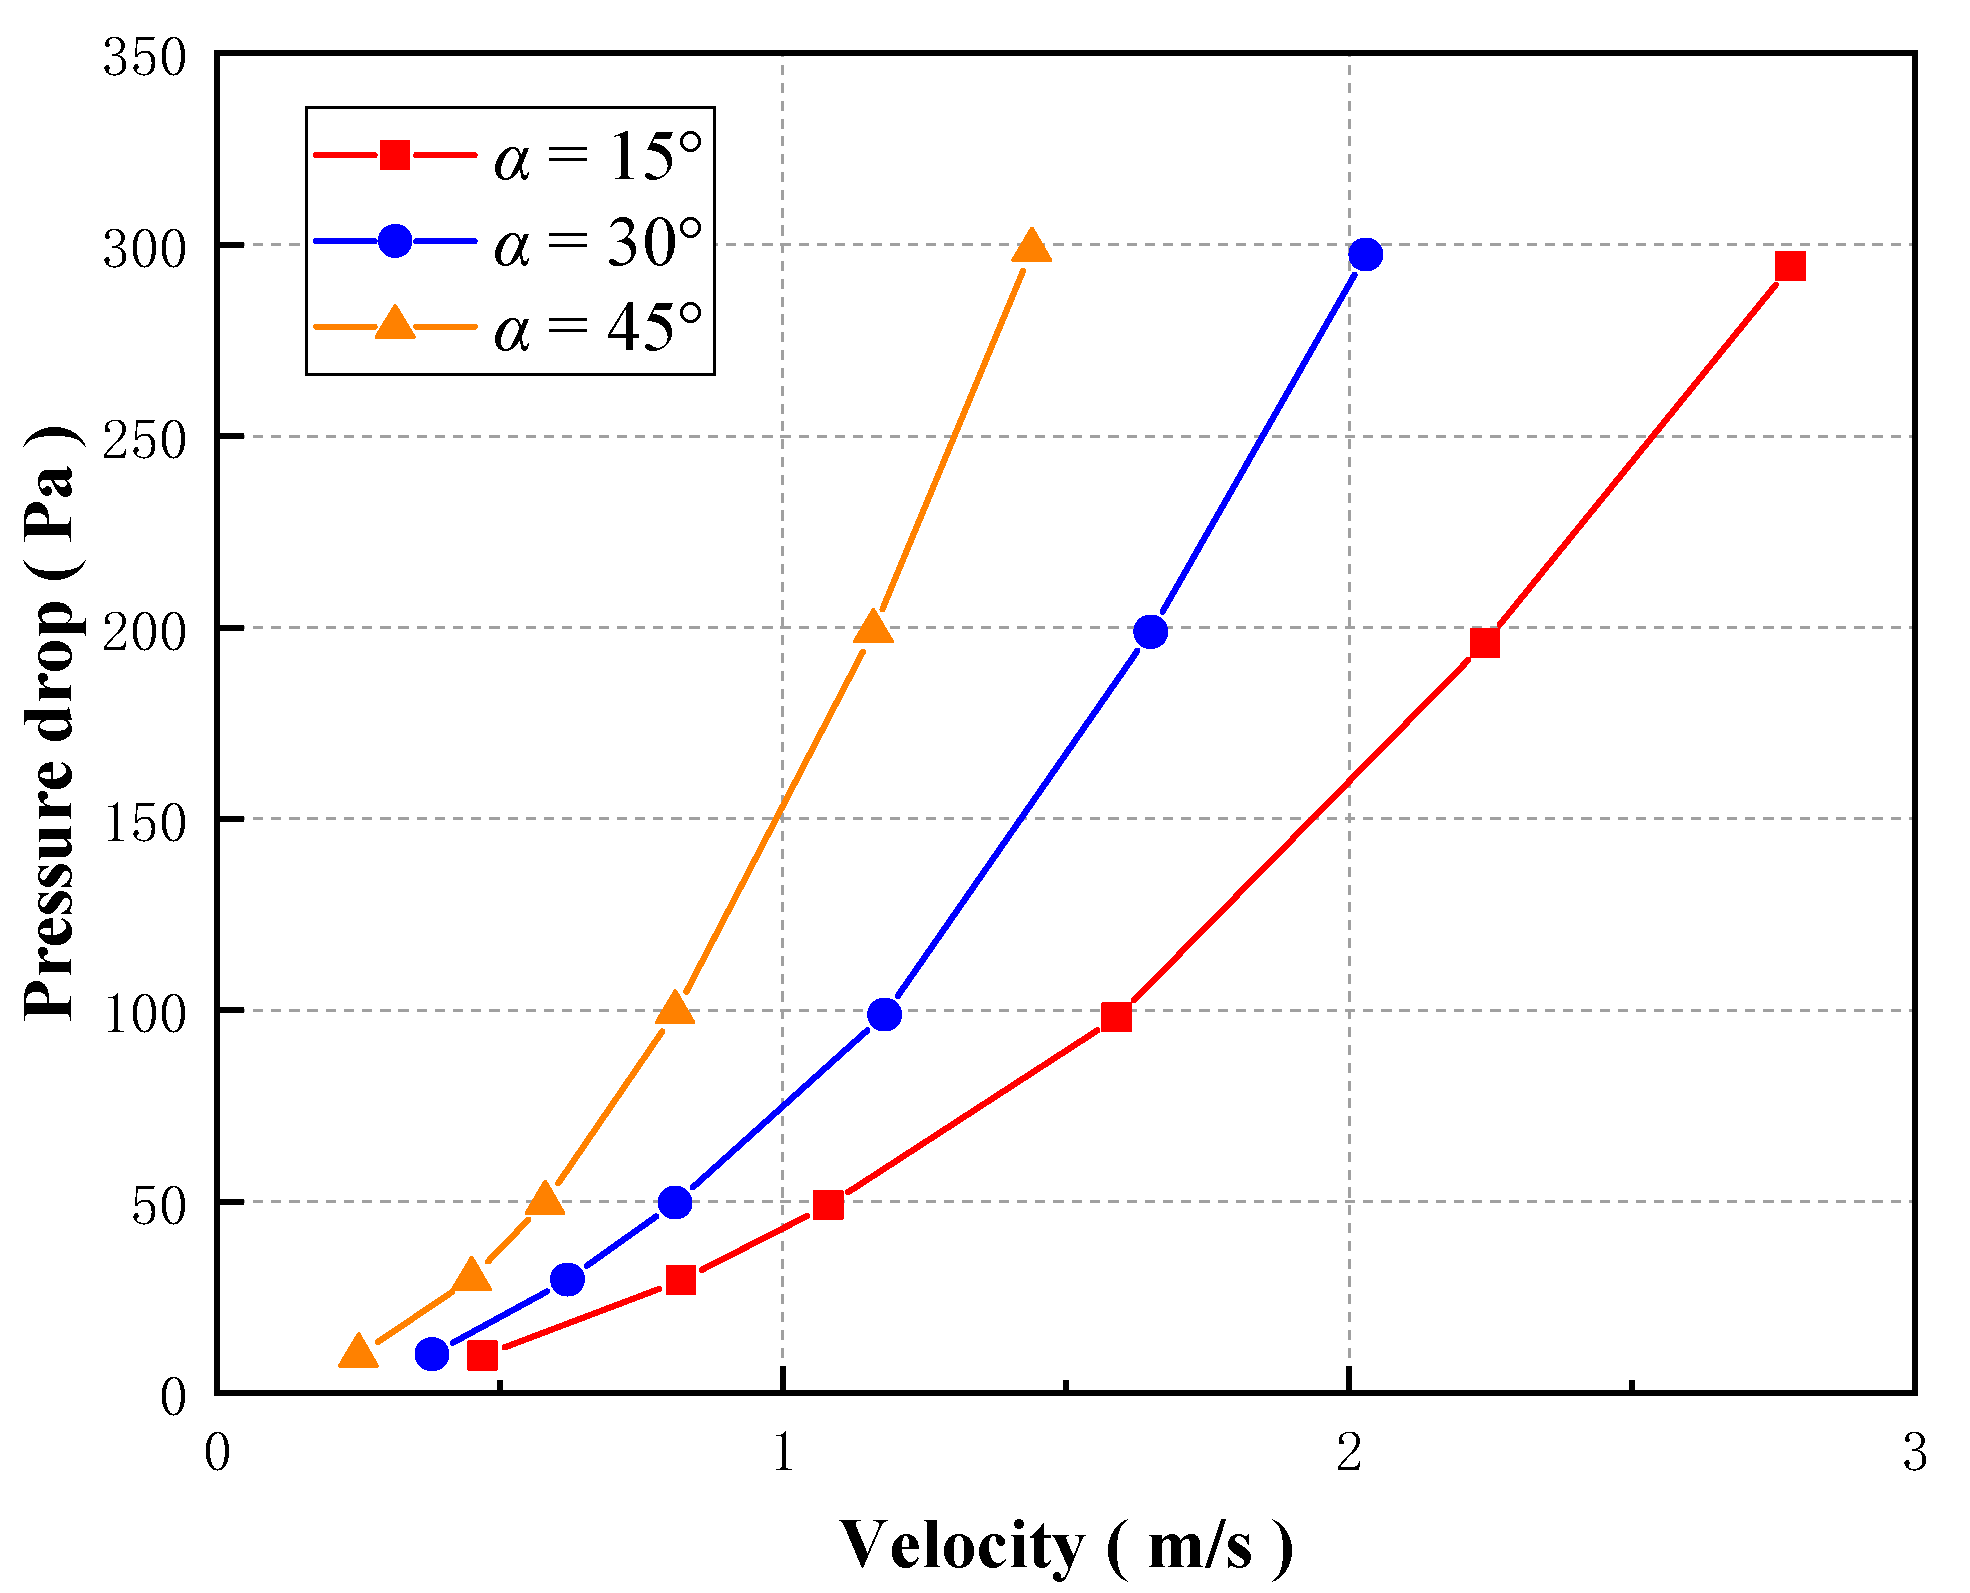
Figure 13: Wind velocity-pressure drop diagram with different diverting angle (
It is readily apparent that the quantity of energy-consuming units N exerts a significant impact on the pressure drop due to the Tesla plate. Fig. 14 is the wind velocity cloud map on the cross section of Case 3-1 (N = 1), Case 3-2 (N = 2), Case 0-0 (N = 4) and Case 3-3 (N = 6) under an inlet pressure of 300 Pa. In all cases, the airflow from the subsidiary channels intersects with the primary channel at their exits, generating pronounced localized turbulence. In the first energy-dissipation unit, the flow in the branch channel is weaker than in the downstream units. As the fluid passes through multiple energy-dissipation units, collisions between lateral and primary channel flows become increasingly pronounced. The maximum wind velocity inside the Tesla plate structure model with N = 1 can exceed 28 m/s. With the increase of the number of energy dissipation units N, the maximum wind velocity inside the Tesla plate structure model decreases, and the turbulence zone at the rear of the Tesla plate structure model shortens. When N is very low (N = 1, 2), the flow in the initial branch channels is insufficient to induce a strong localized pressure reduction. With higher N (=4, 6), the flow in the branch channels increases, enhancing collisions and thereby amplifying local pressure drop.
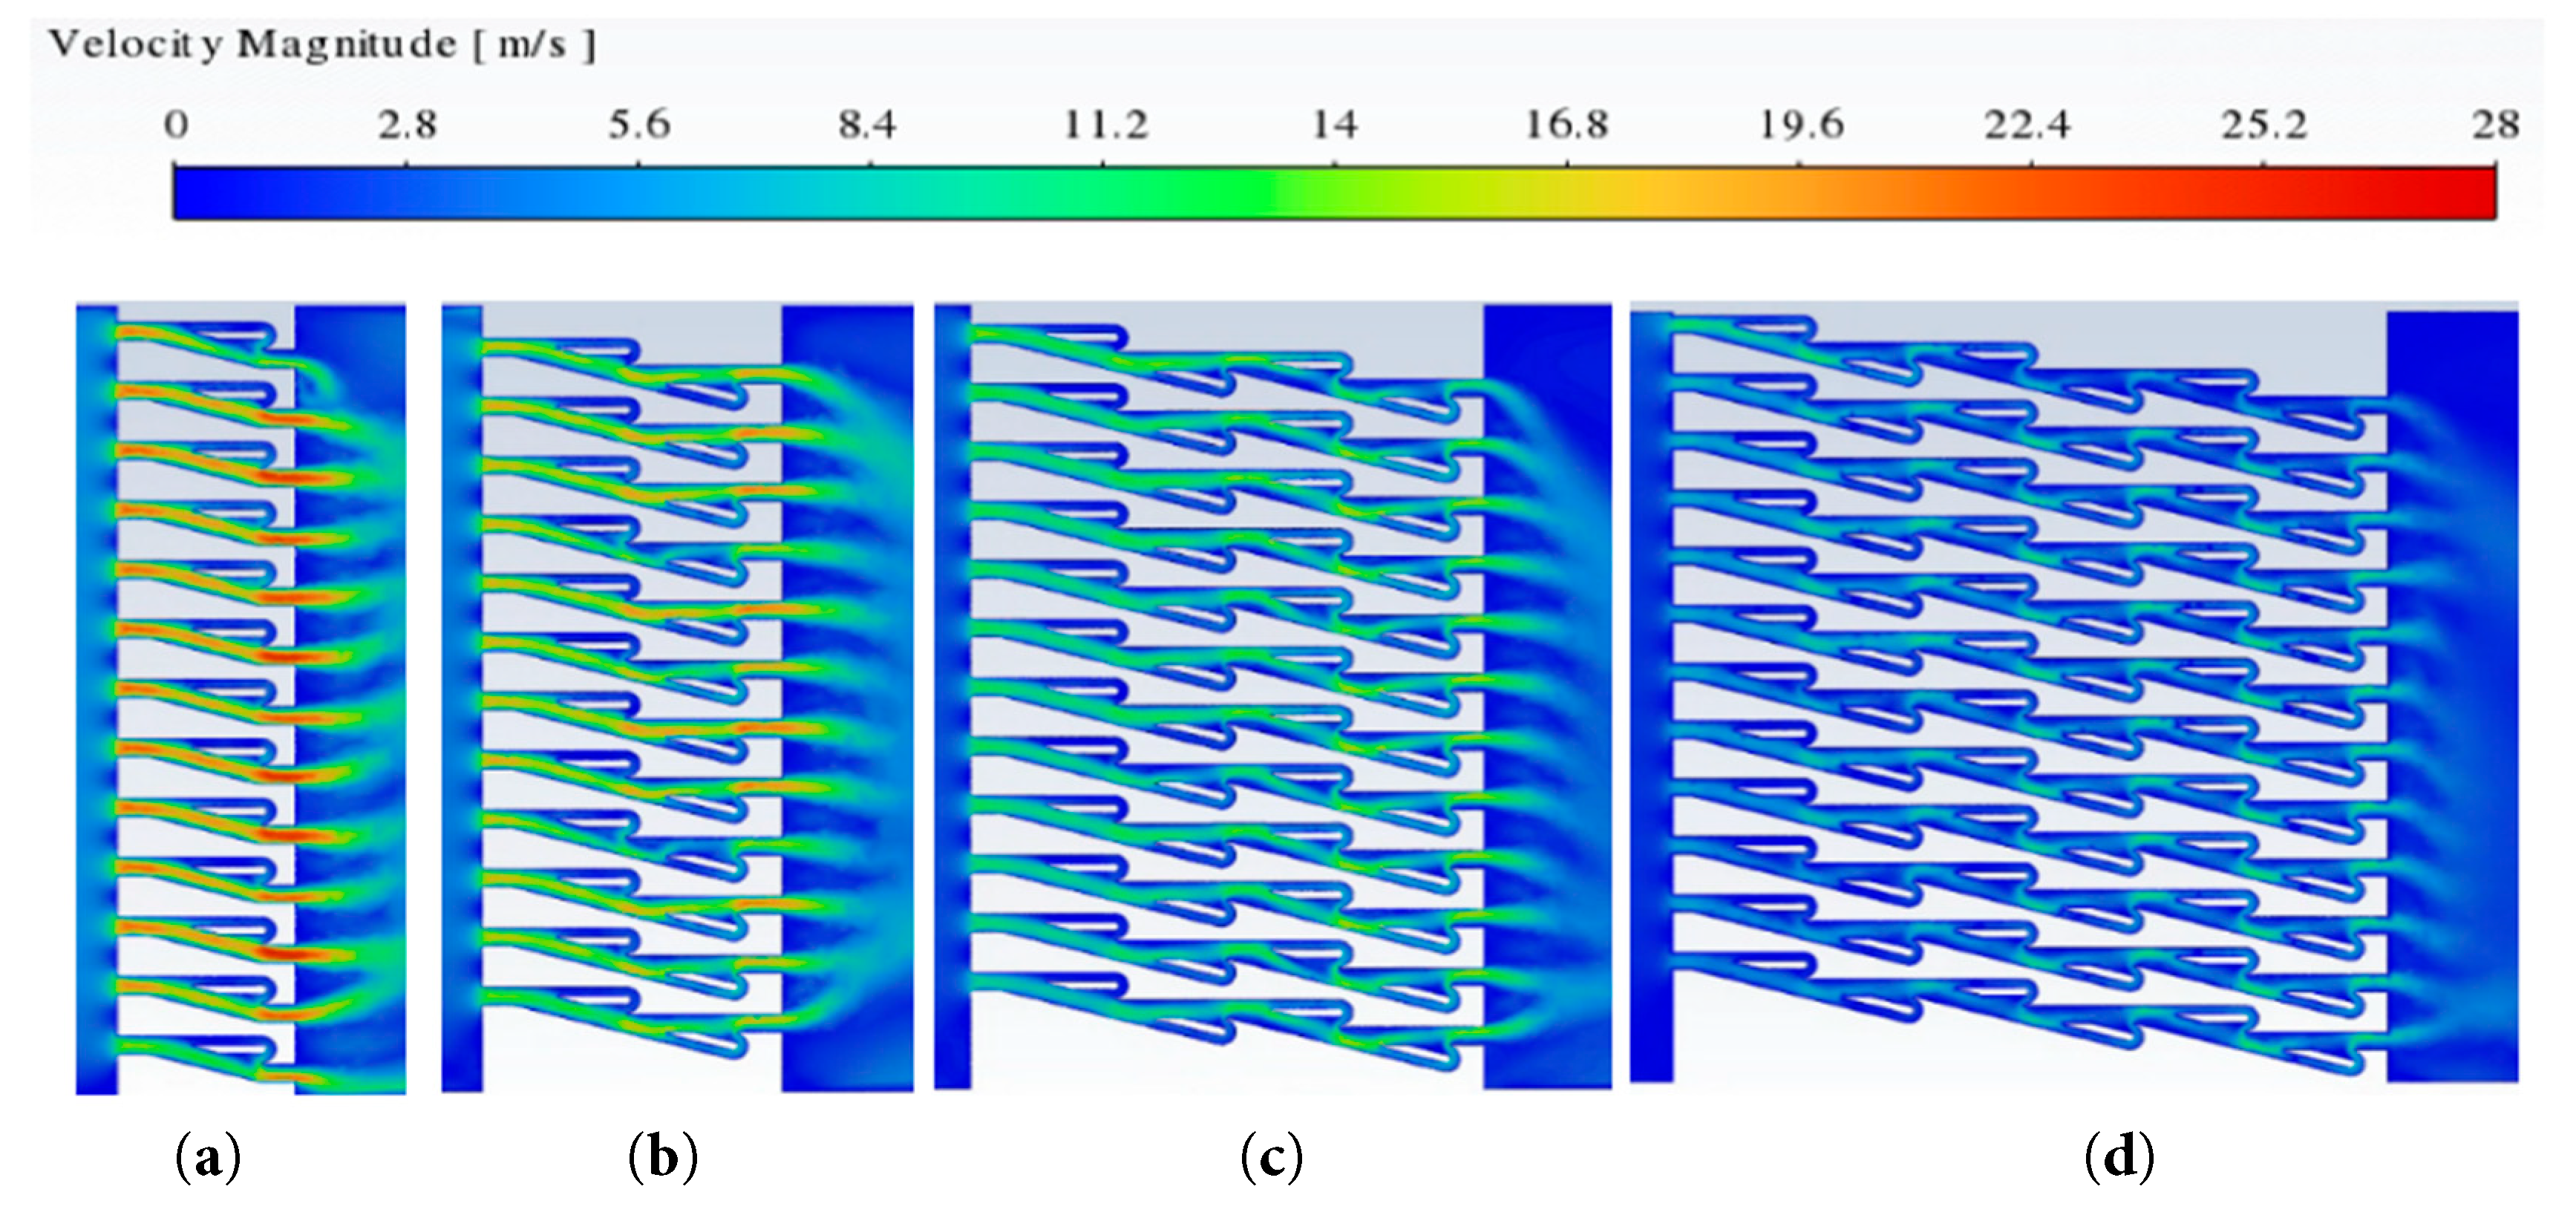
Figure 14: Wind velocity cloud images with different number of units (
The wind velocity-pressure drop curves under four working conditions are illustrated in Fig. 15. The figure shows that, under all four working conditions, the pressure drop increases with wind velocity, roughly following a quadratic trend. In these cases, the internal channel geometry remains the same, with only the number of lateral arrangements (energy-dissipation units, N) varying. As N increases, the pressure drop across the Tesla plate also rises. This indicates that, in practical applications, the number of energy-dissipation units should be maximized to ensure that airflow in each channel group undergoes sufficient collisions, thereby generating greater pressure drop and enhancing the overall energy-dissipation performance of the Tesla-type wind barrier.
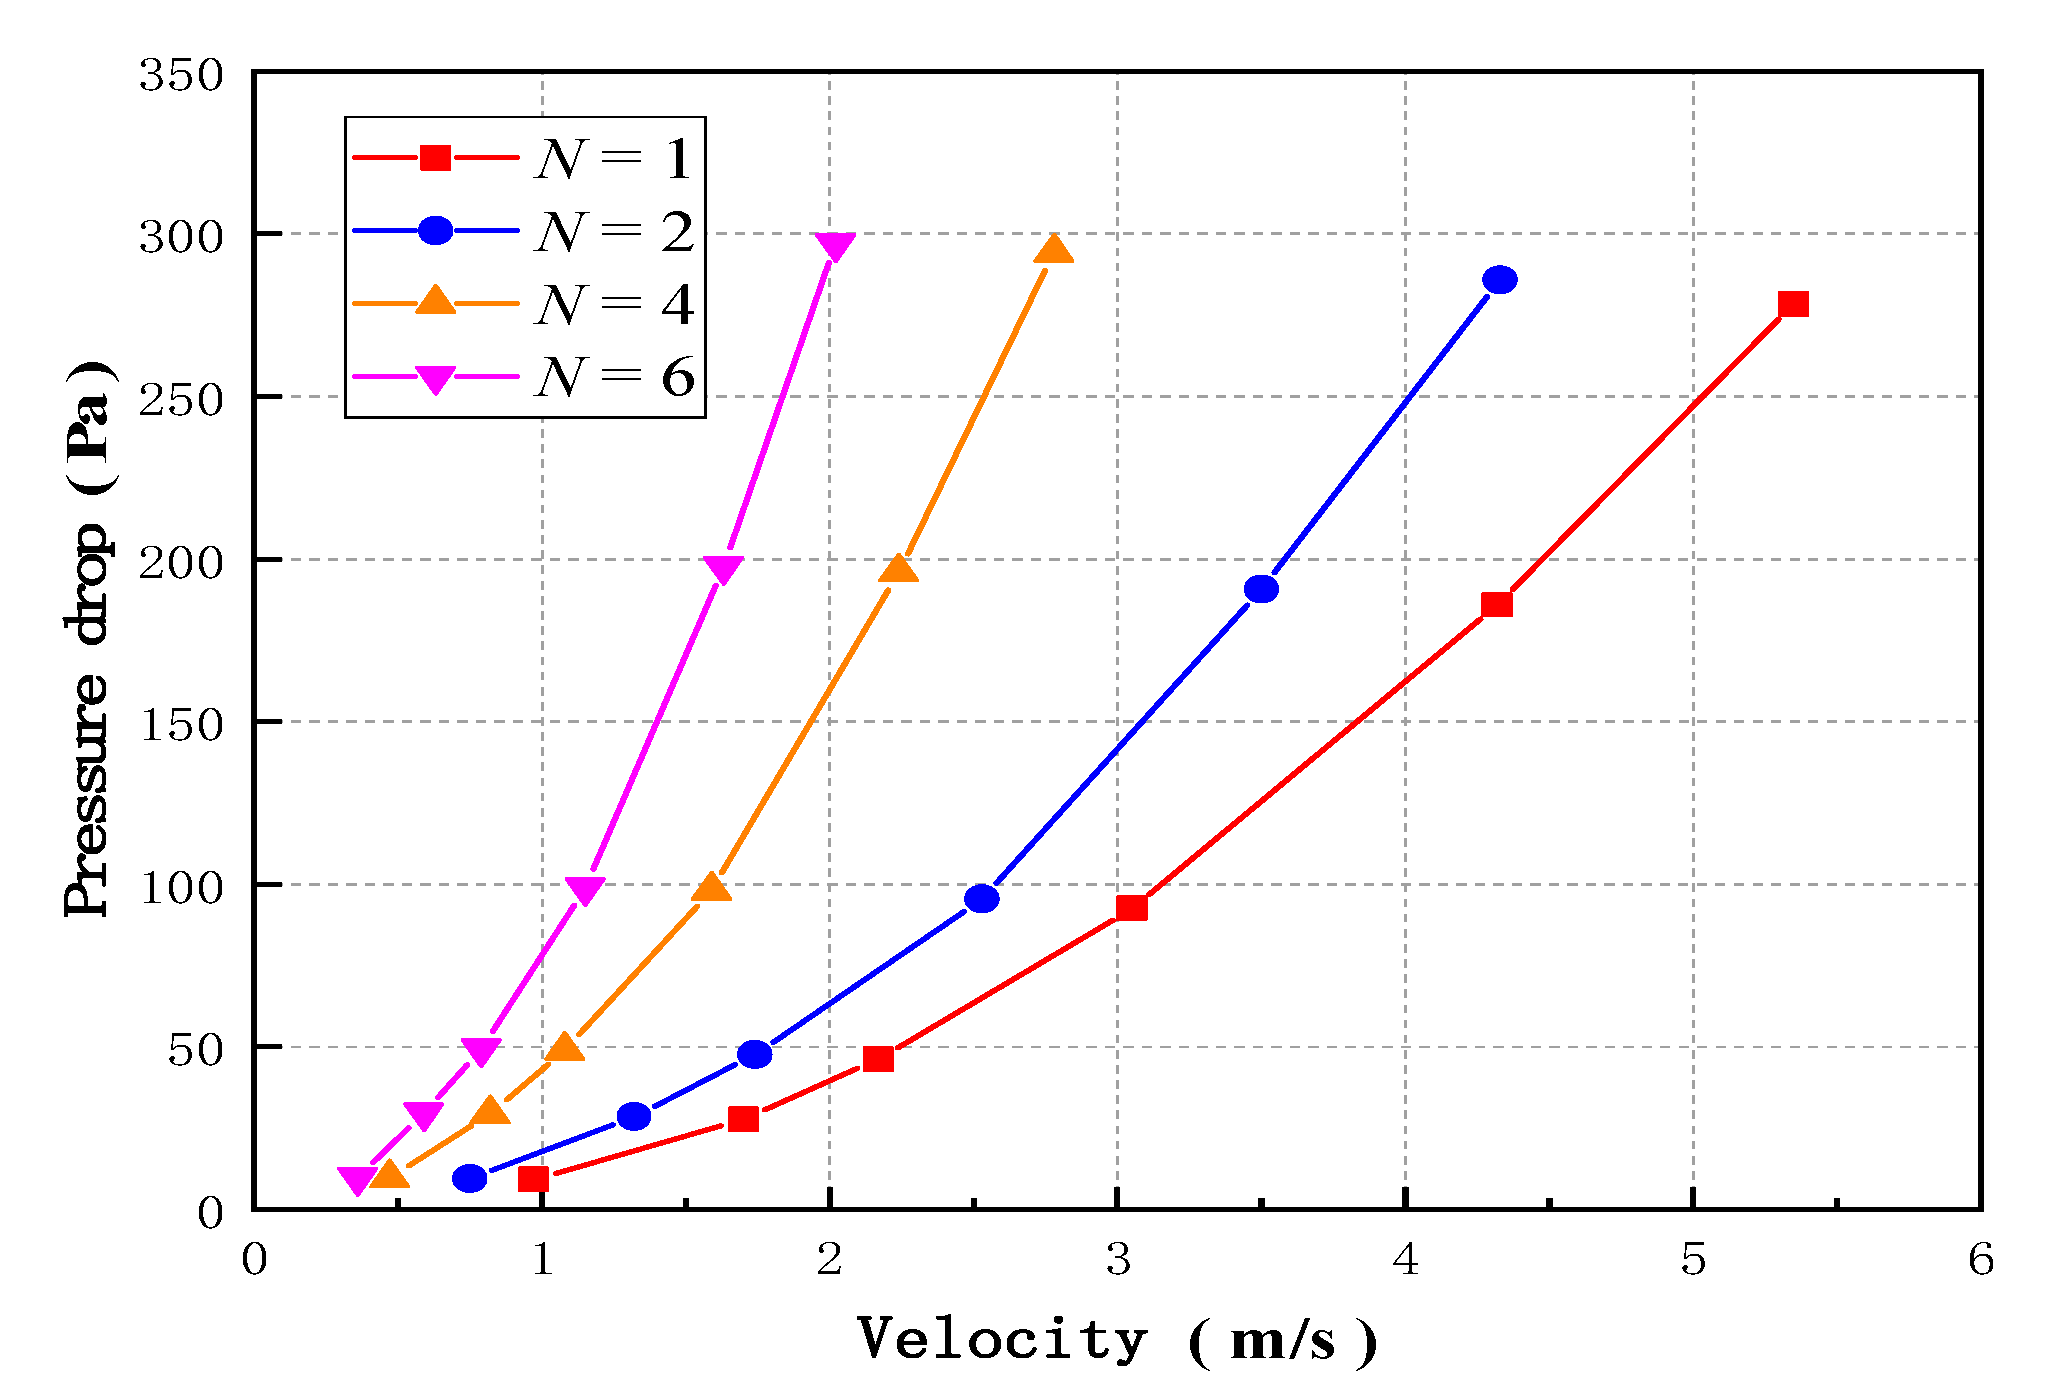
Figure 15: Wind velocity-pressure drop diagram with different numbers of units (
For conventional wind barrier structure types, the porosity φ significantly impacts the pressure drop performance. In order to determine whether this index has the same effect on the Tesla plate structure model, the various porosity φ values are achieved by changing the spacing between the channel structure groups. Fig. 16 is the wind velocity cloud map on the cross section of Case 0-0 (φ = 0.48), Case 4-1 (φ = 0.40), Case 4-2 (φ = 0.36) and Case 4-3 (φ = 0.28) under the inlet pressure of 300 Pa. The diagram highlights that the variation in porosity (φ) minimally impacts the flow pattern inside the channel structure of the Tesla plate structure model, and it will still produce obvious local turbulence at the end of each energy dissipation unit. The maximum wind velocity inside the Tesla plate structure model with φ = 0.48 can reach more than 18 m/s. With the decrease of porosity φ, the maximum wind velocity inside the Tesla plate structure model is also decreasing, and the size of the high wind velocity area is also decreasing.
Fig. 17 indicates that, in all cases, pressure drop increases with wind velocity, approximately following a quadratic trend. The internal channel geometry remains the same across these cases, with only the spacing between channel groups varying. As porosity φ decreases, the pressure drop across the Tesla plate increases, consistent with the typical relationship between porosity and pressure drop in conventional wind barriers. This suggests that, in practical applications, reducing the porosity of a Tesla-type wind barrier can effectively enhance its pressure drop performance and energy dissipation capability.
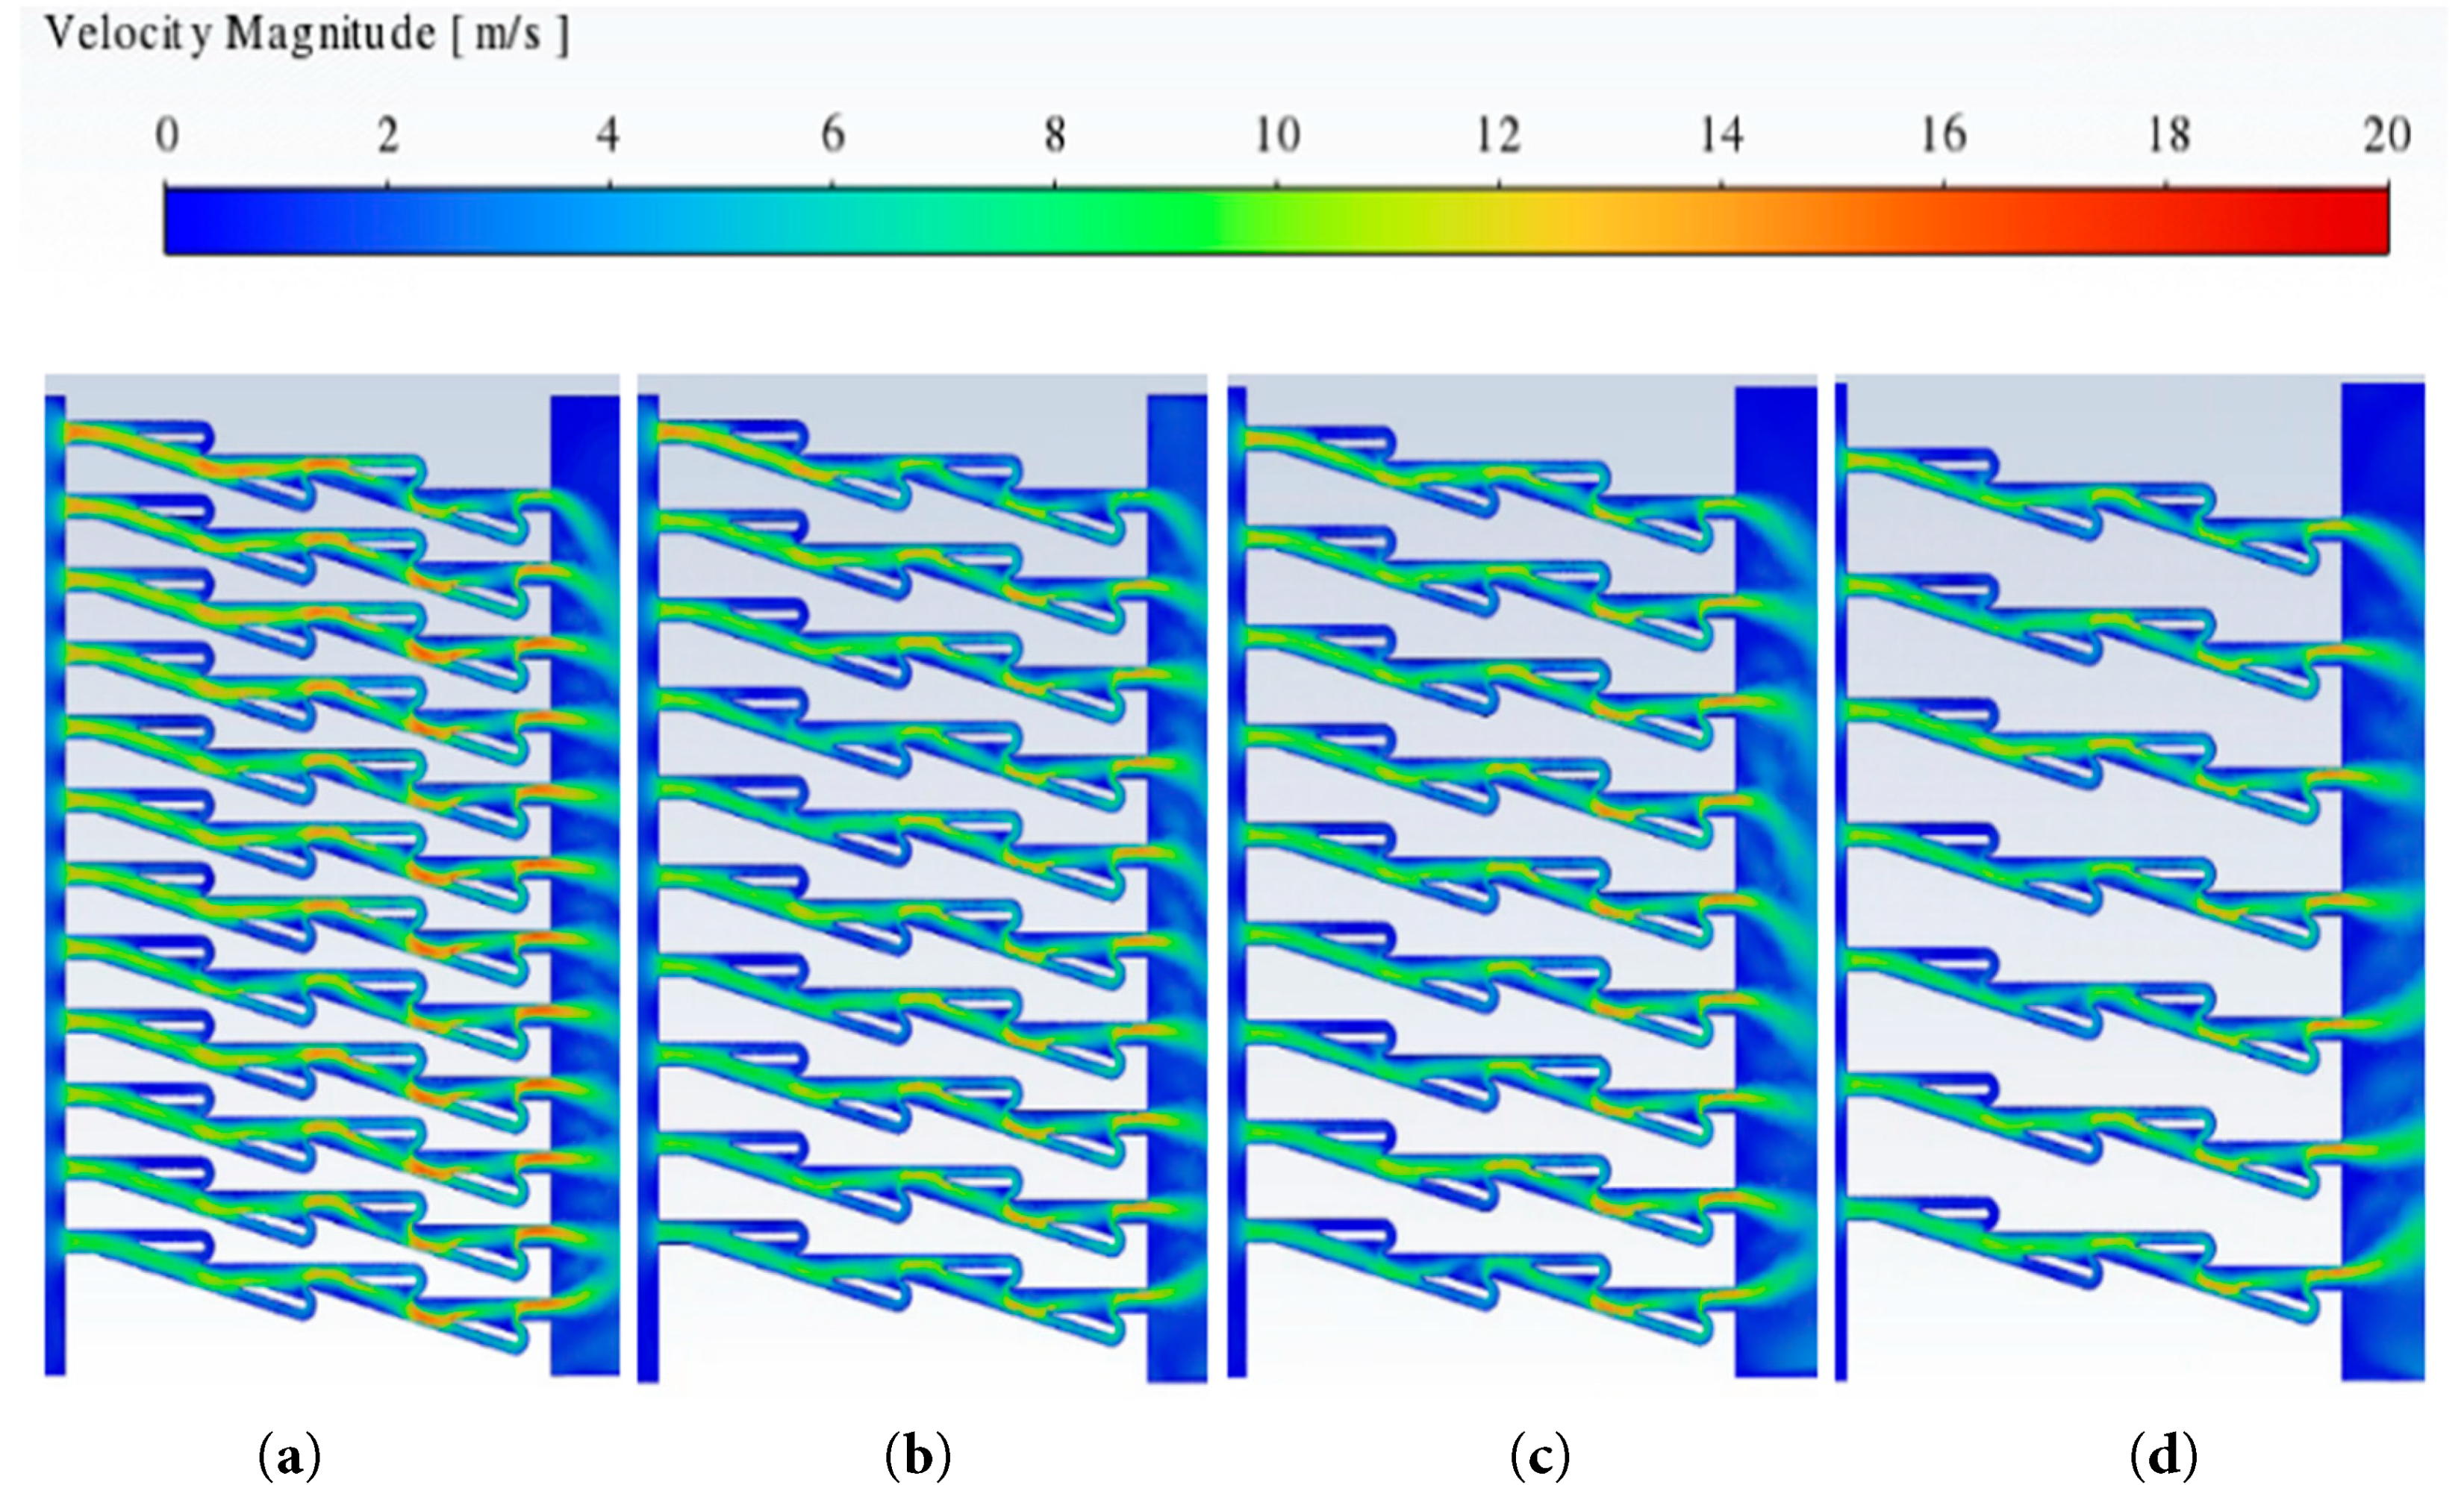
Figure 16: Wind velocity cloud images with different porosity (φ). (a) Case 0-0; (b) Case 4-1; (c) Case 4-2; (d) Case 4-3.
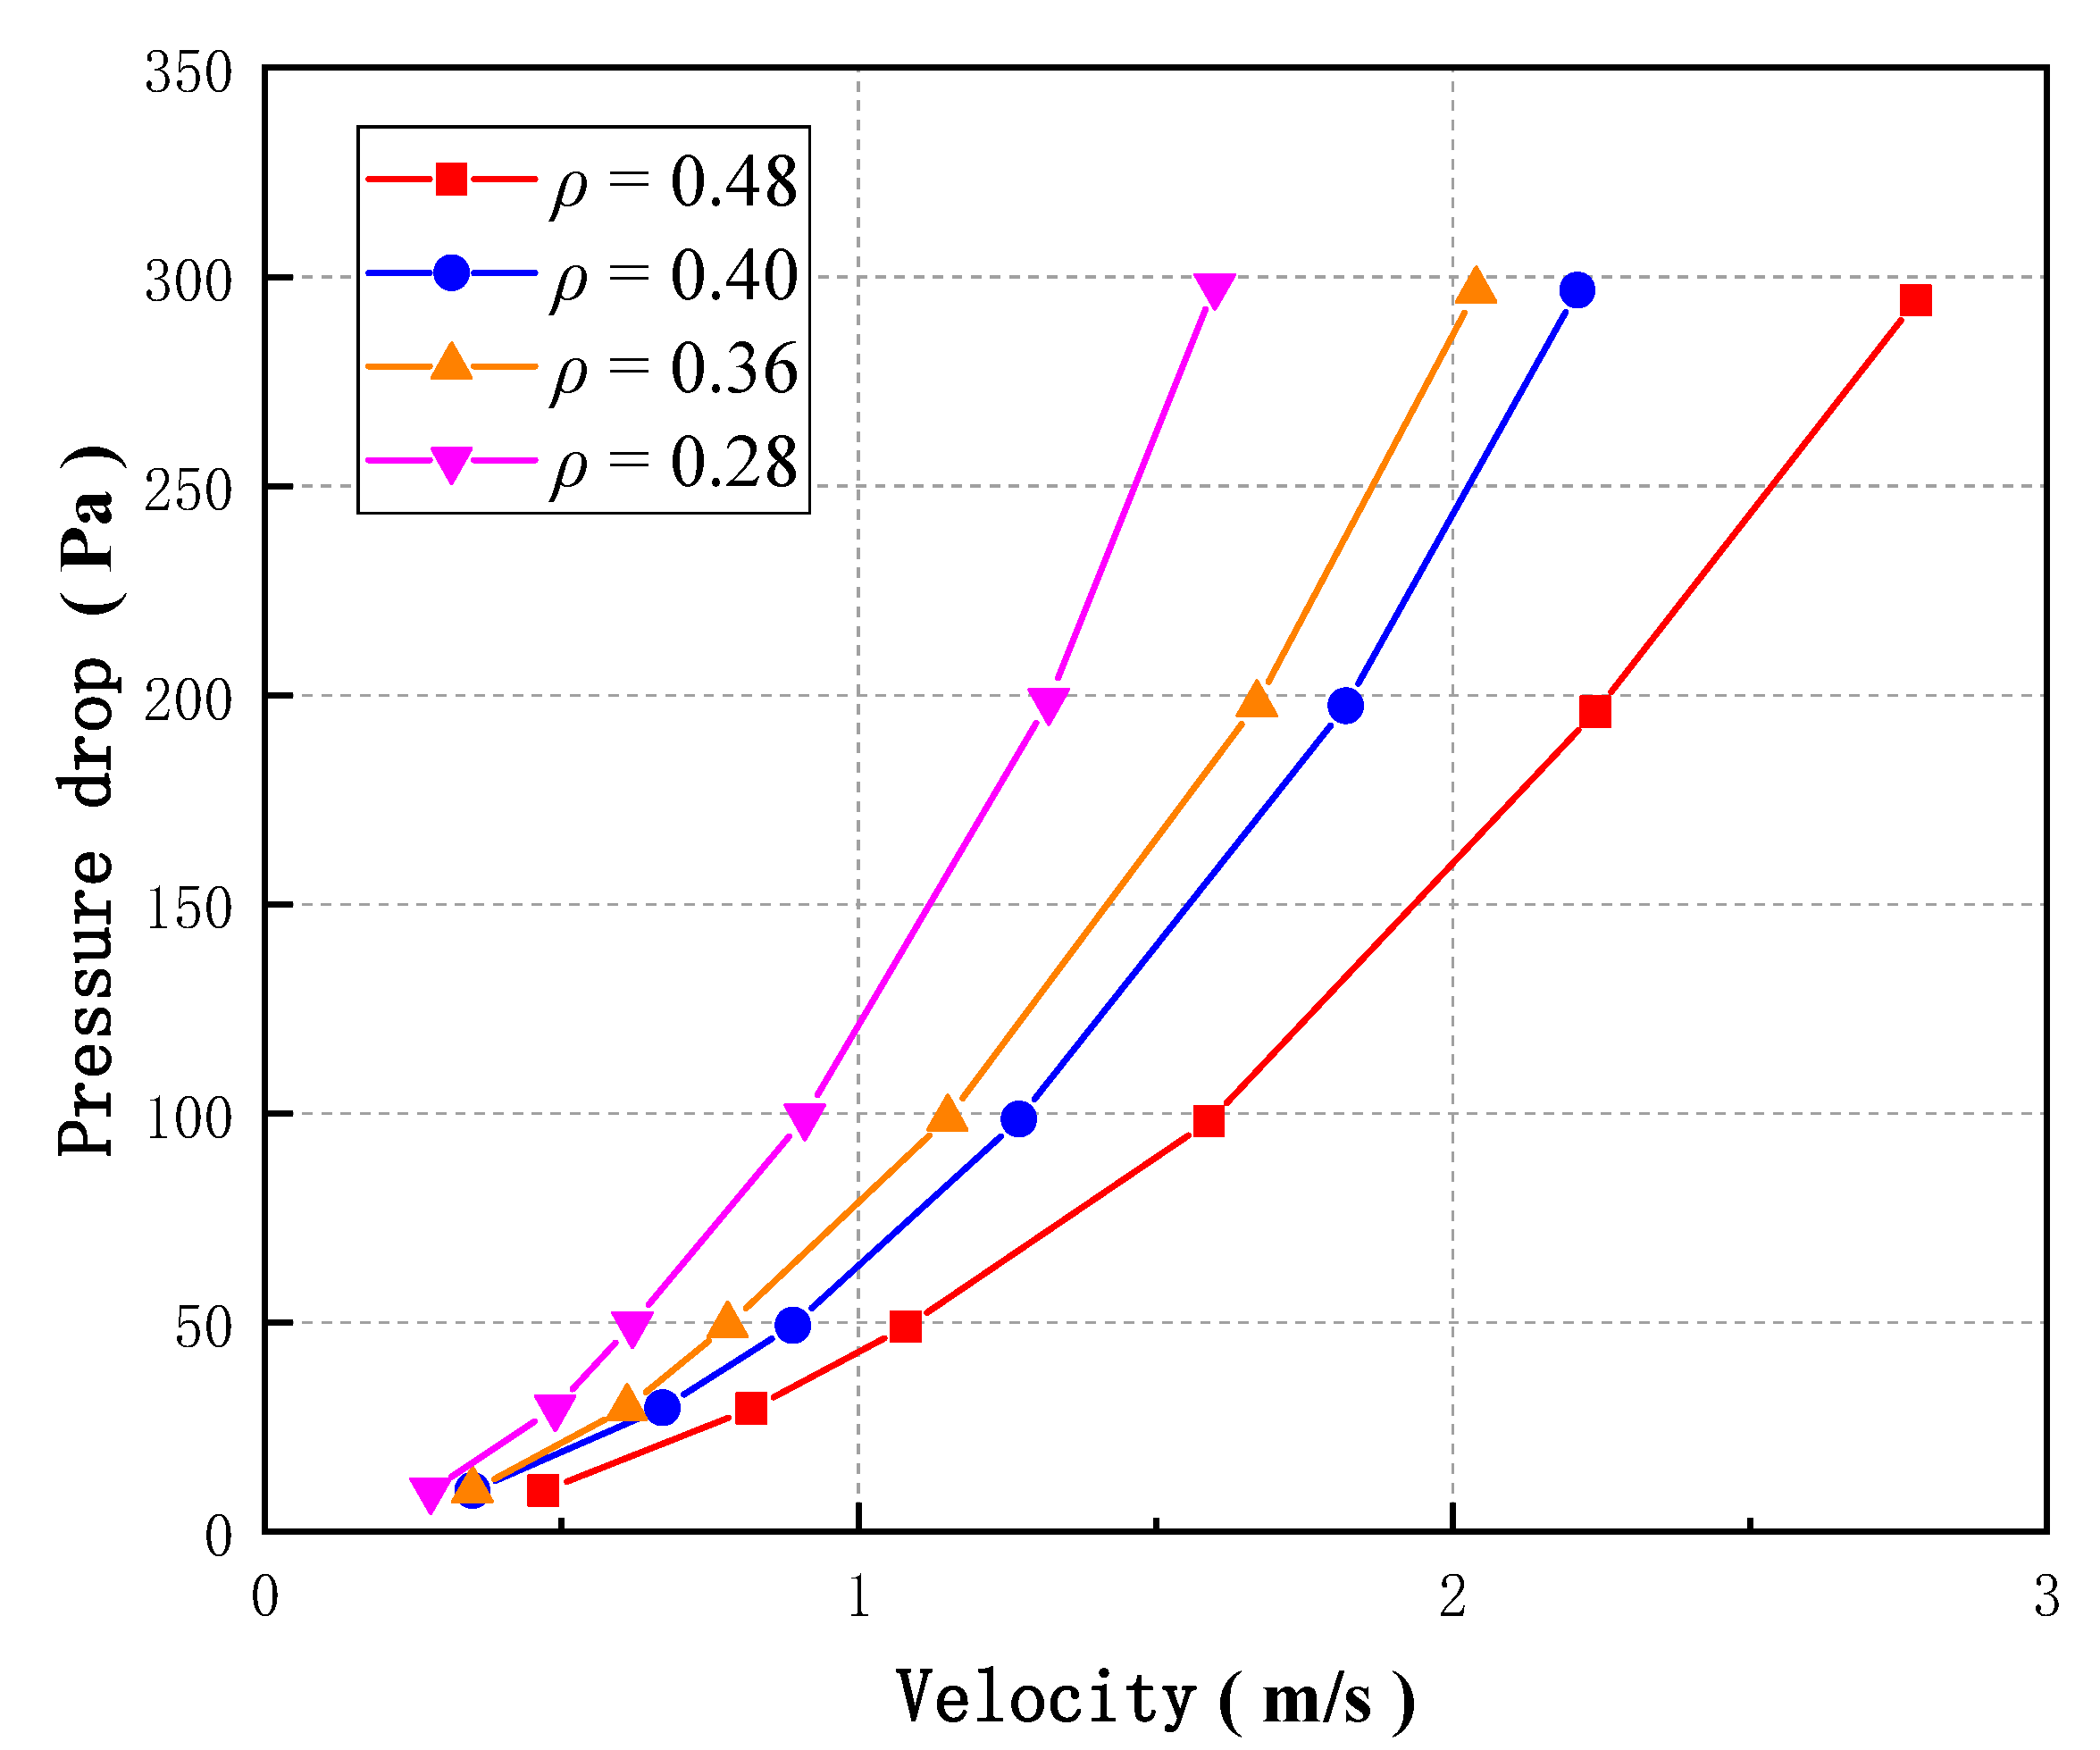
Figure 17: Wind velocity-pressure drop diagram with different porosity (φ).
5 Numerical Evaluation of Tesla-Type Wind Barriers for Bridge Applications
Wind barriers can be applied in various locations, including the flanking sides of bridges, the exterior protection of structures, and the outer regions of vegetation zones. In this section, Tesla-type wind barriers are compared with traditional barriers to evaluate their protective effect on railway bridge decks. To assess the effectiveness of Tesla plate barriers, a comprehensive numerical simulation framework is developed. This simulation investigates the performance and benefits of using Tesla-type barriers to mitigate wind-induced effects on bridge decks. The results provide valuable insights into the potential applications and advantages of Tesla plate wind barriers for enhancing the safety and stability of bridge structures.
The numerical simulation adopts a two-dimensional hybrid computational domain, with the wind barrier, train, and bridge deck. In the numerical simulation, the simulation model should be as close as possible to the real shape, but due to the limited computing power of the computer, the bridge structure needs to be appropriately simplified [33]. This section is founded upon the actual dimensions of the bridge segment in Gu’s research [8]. Fig. 18 illustrates the dimensions of the wind barrier relative to the train and bridge, showing its configuration before and after the train passes. Here, H denotes the vertical height of the wind barrier, which can be adjusted according to research requirements. The structural details of both the Tesla-type and traditional wind barriers are presented in Fig. 19.
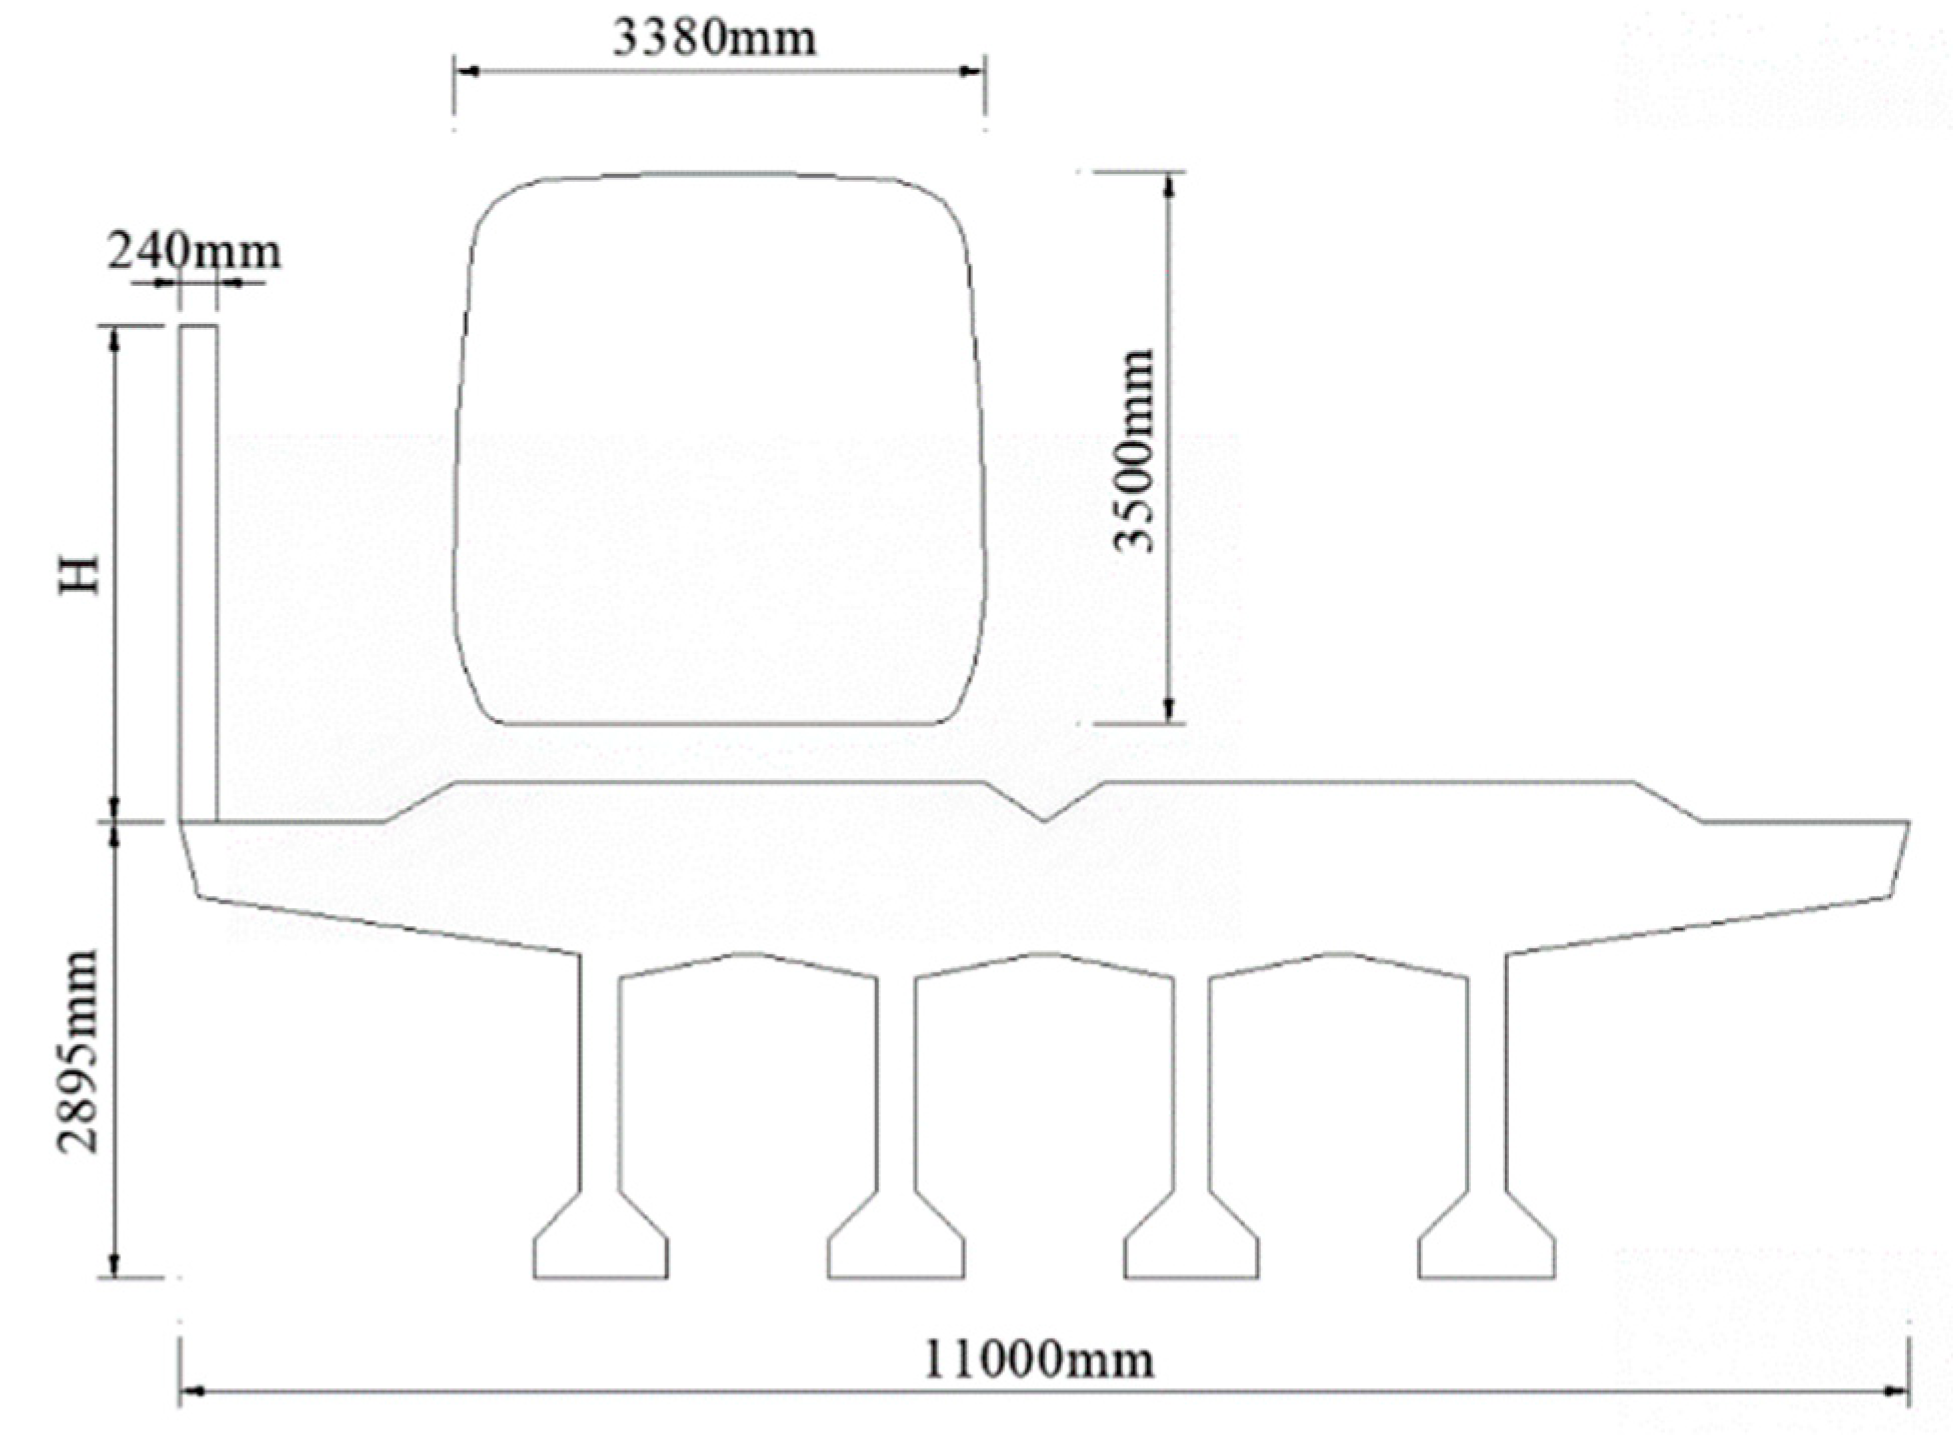
Figure 18: Dimensions of wind barriers, train and bridge.
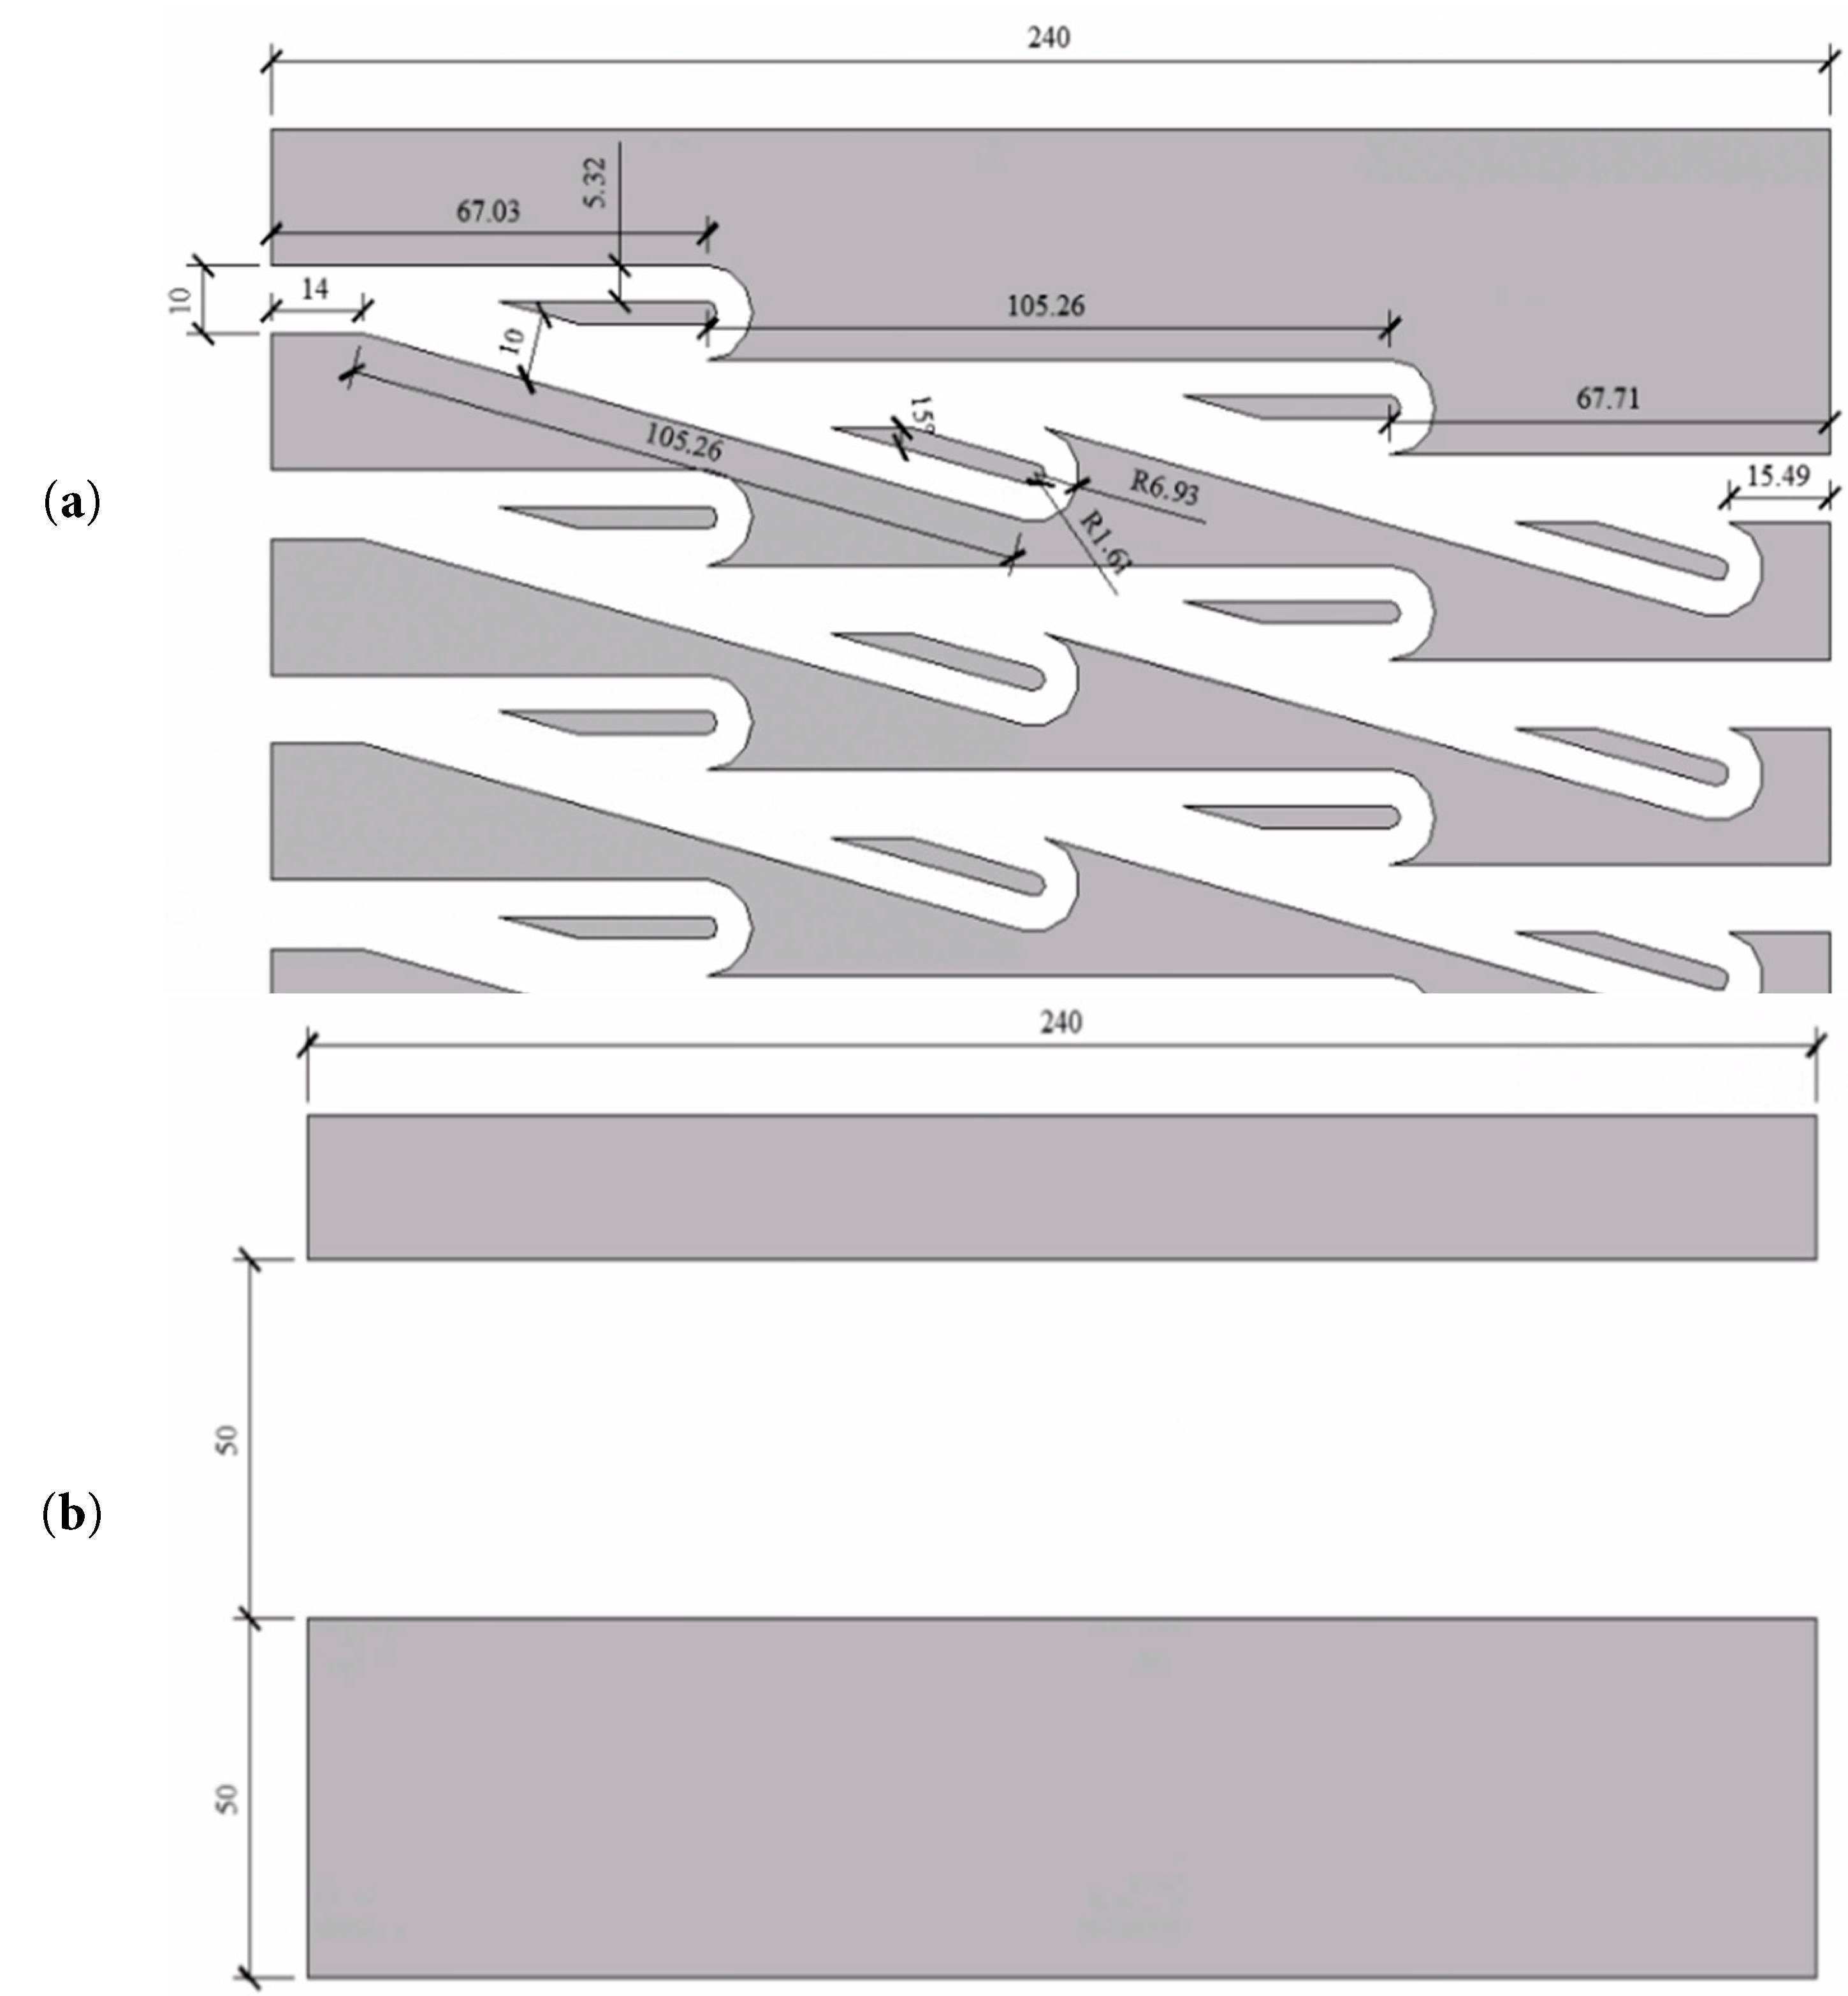
Figure 19: Profile of wind barrier (unit: mm): (a) tesla plate type wind barrier, and (b) traditional type.
To investigate the impact of wind barrier location on the force of trains in different lanes, the following four layouts are divided according to the position of wind barrier and rain passing over the bridge: (A) upstream wind barrier + lane 1, (B) upstream wind barrier + lane 2, (C) upstream and downstream wind barrier + lane 1, and (D) upstream and downstream wind barrier + lane 2. The positional relationship of the four layouts is depicted in Fig. 20. To corroborate the effectiveness of the Tesla plate wind barrier, it is necessary to set up a set of similar numerical simulations of the traditional barrier wind barrier for comparison, and set up three wind barrier heights in each wind barrier to contrast the effects of various wind barrier heights on the train. For each wind barrier height, four train–barrier layout configurations are analyzed. The complete list of working conditions is summarized in Table 4.
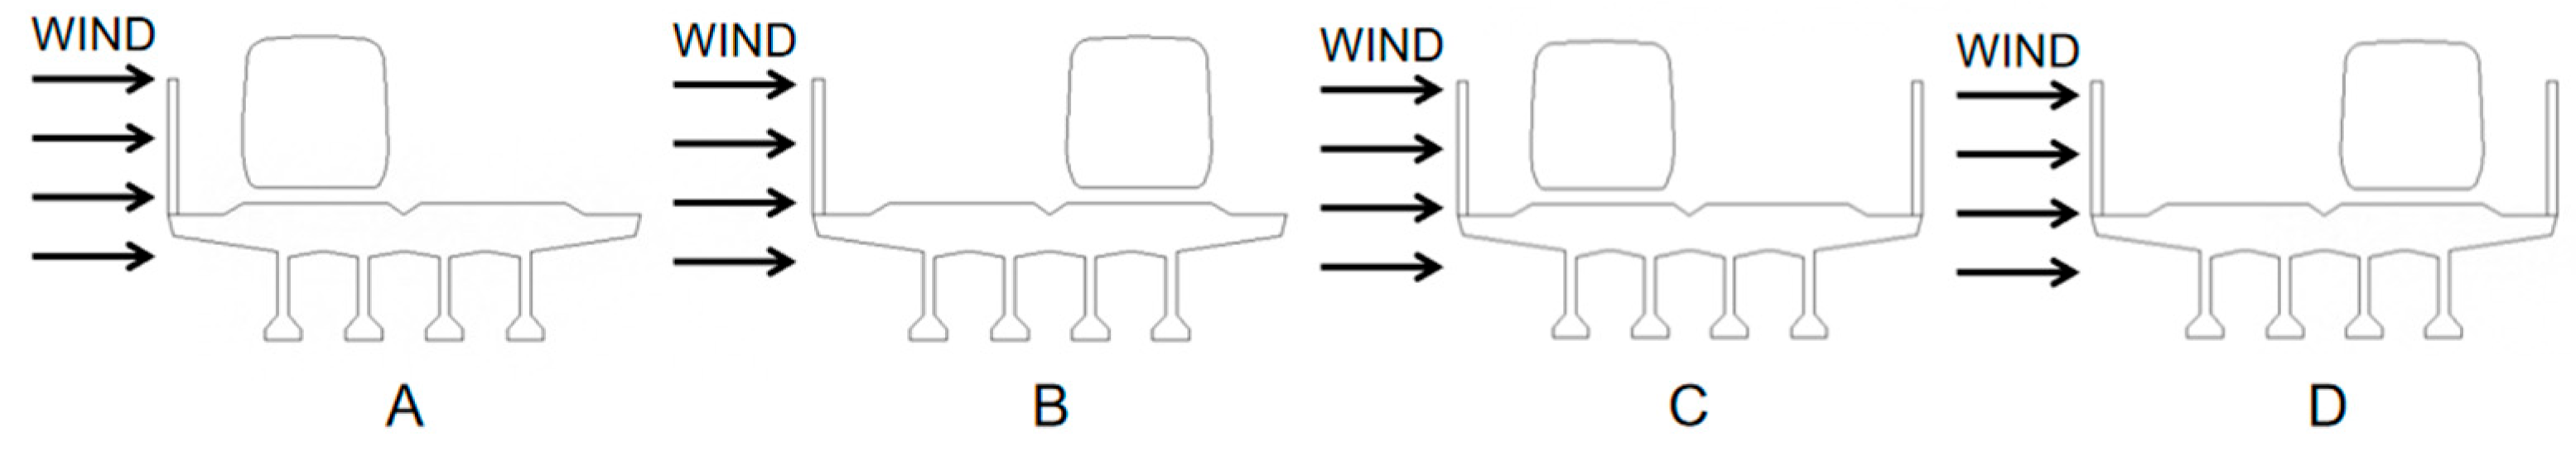
Figure 20: Four wind barriers and train layouts on the bridge: (A) upstream wind barrier + lane 1, (B) upstream wind barrier + lane 2, (C) upstream and downstream wind barrier + lane 1, and (D) upstream and downstream wind barrier + lane 2.
Table 4: Wind barrier cases.
| Type of Wind Barrier | Wind Barrier Height | Location of Wind Barrier | Lane | Case No. |
|---|---|---|---|---|
| Tesla plate wind barrier | 2.15 m | Upstream | Lane 1 | A1-1 |
| Lane 2 | B1-1 | |||
| Upstream + Downstream | Lane 1 | C1-1 | ||
| Lane 2 | D1-1 | |||
| 3.15 m | Upstream | Lane 1 | A1-2 | |
| Lane 2 | B1-2 | |||
| Upstream + Downstream | Lane 1 | C1-2 | ||
| Lane 2 | D1-2 | |||
| 4.15 m | Upstream | Lane 1 | A1-3 | |
| Lane 2 | B1-3 | |||
| Upstream + Downstream | Lane 1 | C1-3 | ||
| Lane 2 | D1-3 | |||
| Traditional wind barrier | 2.15 m | Upstream | Lane 1 | A2-1 |
| Lane 2 | B2-1 | |||
| Upstream + Downstream | Lane 1 | C2-1 | ||
| Lane 2 | D2-1 | |||
| 3.15 m | Upstream | Lane 1 | A2-2 | |
| Lane 2 | B2-2 | |||
| Upstream + Downstream | Lane 1 | C2-2 | ||
| Lane 2 | D2-2 | |||
| 4.15 m | Upstream | Lane 1 | A2-3 | |
| Lane 2 | B2-3 | |||
| Upstream + Downstream | Lane 1 | C2-3 | ||
| Lane 2 | D2-3 |
To confirm the impact of the Tesla plate wind barrier, it is necessary to compare and analyze the force of the train and wind barrier under different working conditions. This section uses the normalized three-component coefficient to evaluate [34,35]:
The numerical simulation employs a two-dimensional surface grid, dividing the computational domain into nine zones. The central zone, which contains the model, uses a dense mesh with additional refinement around the wind barriers, train, and bridge. The surrounding eight zones feature grids that gradually coarsen from the periphery toward the center, as shown in Fig. 21. Boundary conditions are set with a Velocity Inlet (wind velocity 10 m/s) at the inlet, a Pressure Outlet at the exit, Symmetry conditions on the upper and lower walls, and Wall conditions on the model surfaces. The energy equation is activated in the simulation, and the k-ω SST turbulence model is employed. The fluid is modeled as an ideal gas, and, to account for high-velocity compressible flow, the Coupled solver algorithm is selected.
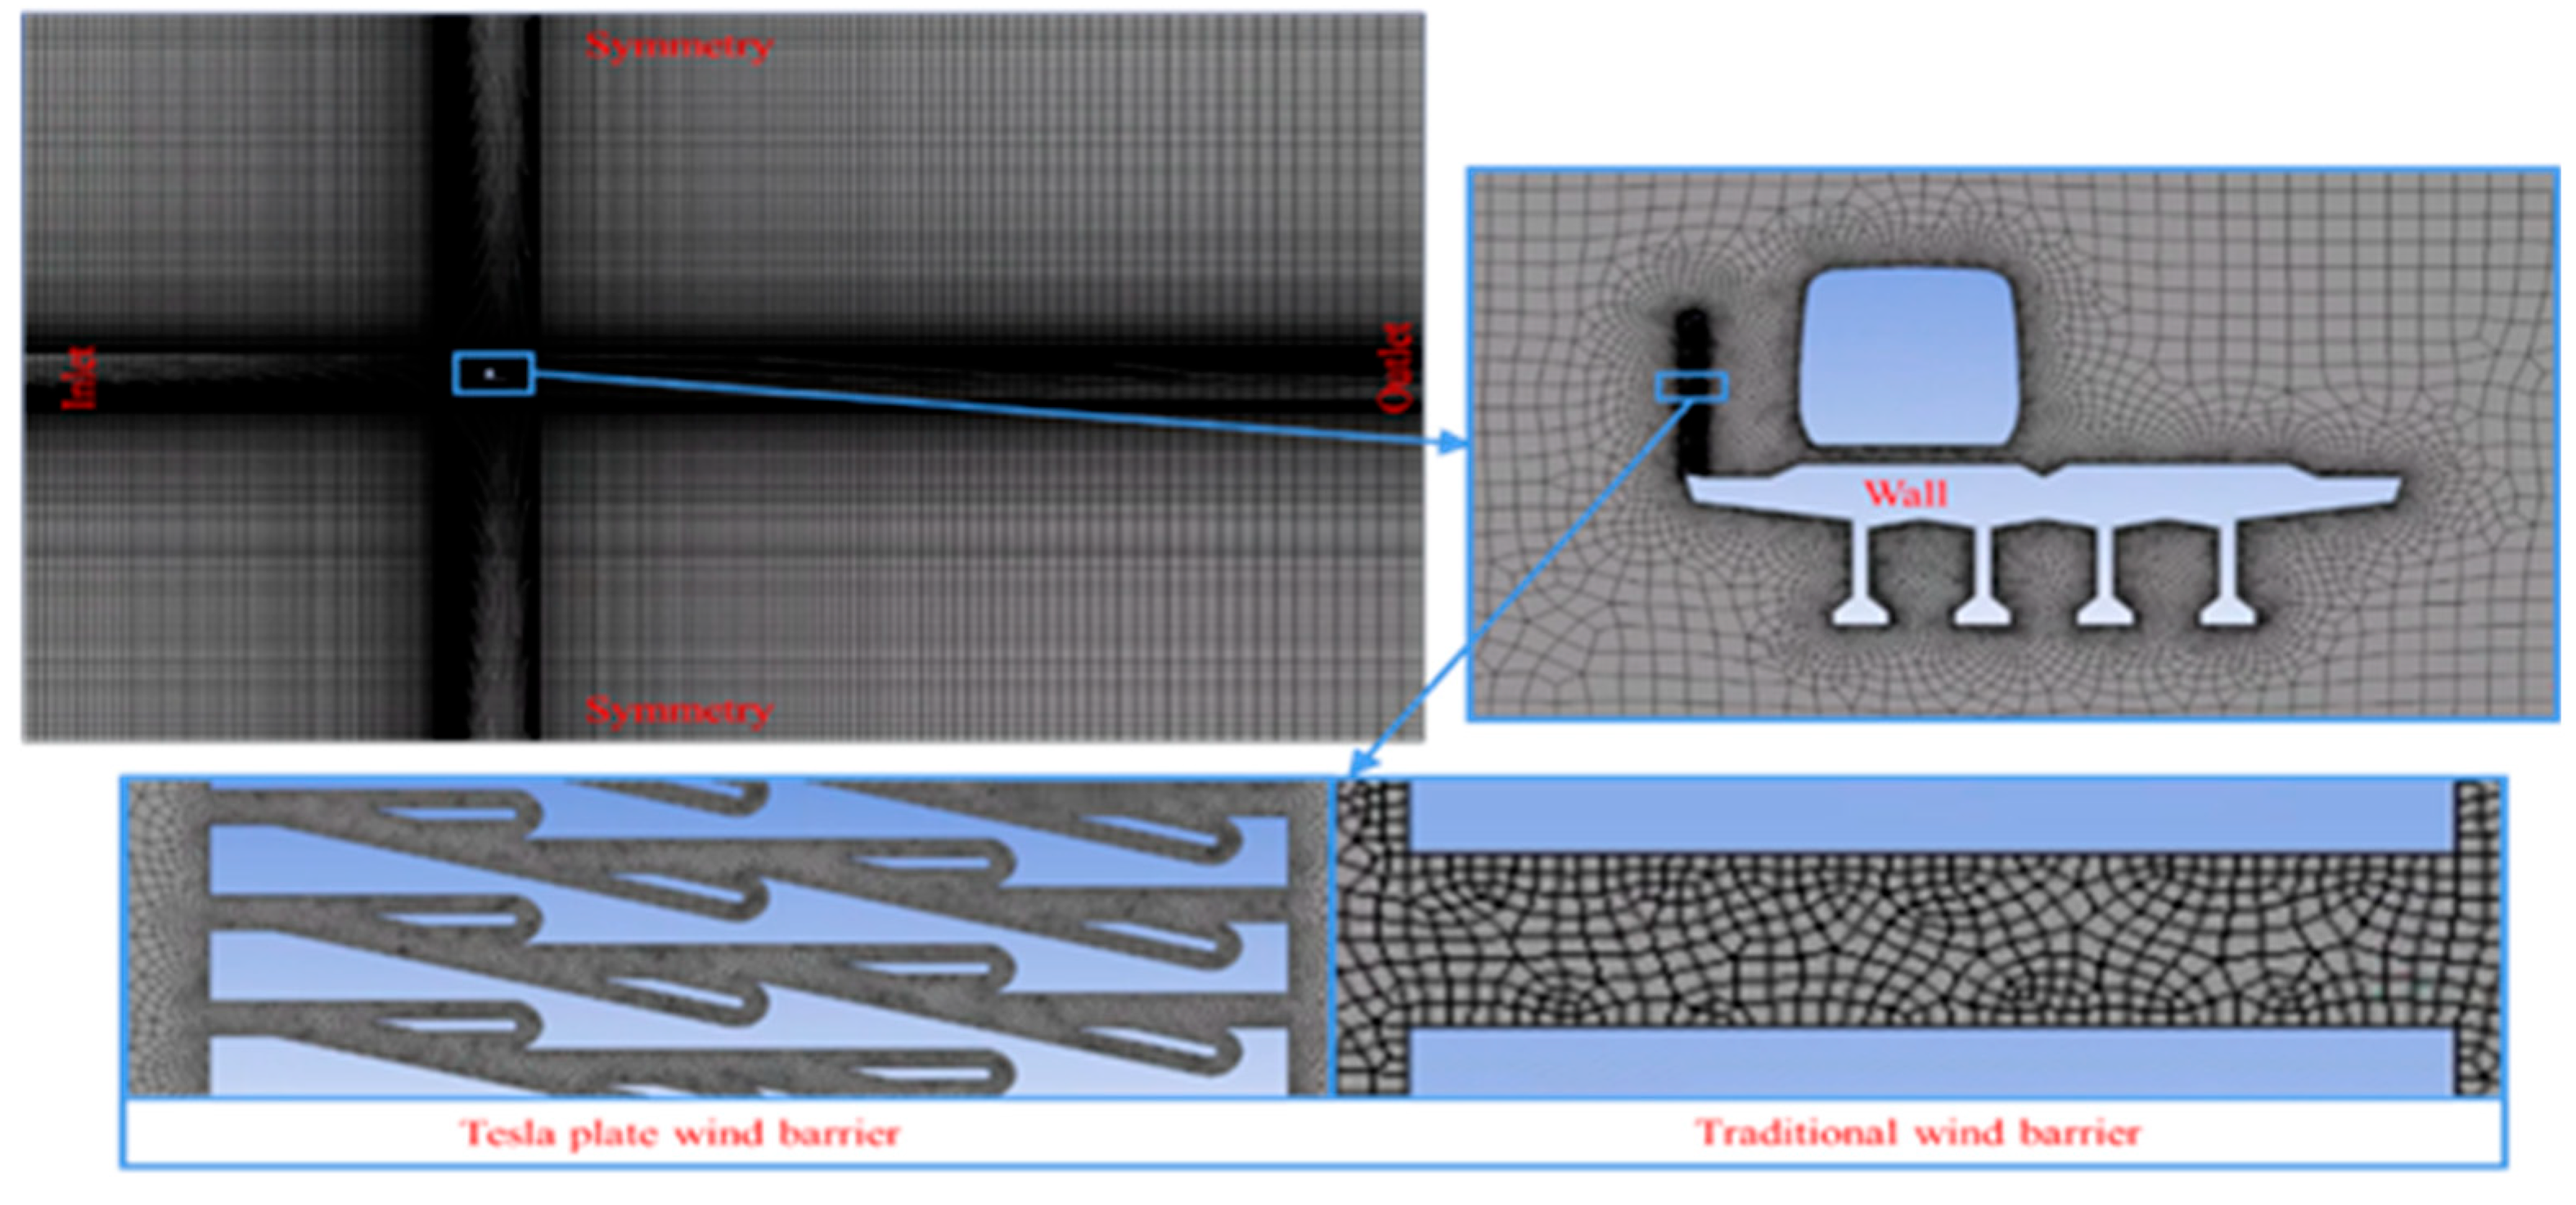
Figure 21: Mesh of the computational domain.
5.3 Force Coefficients of the Train
Fig. 22 is the histogram of the force coefficients related to the train. Based on the observations in Fig. 22a, the following conclusions can be drawn: The Tesla-type wind barrier exerts a significant influence on diminishing the lateral forces experienced by the train. The lateral force coefficient of the train following the implementation of the Tesla plate wind barrier is only 15%~25% of that after the traditional wind barrier. The lateral force coefficient of the train in any lane does not change a lot when the wind barriers are arranged in both upstream and downstream (C and D layout) and only in the upstream (A and B layout). Under the same wind barrier layout, the lateral force coefficient of the train on lane 2 (B, D layout) is smaller than that on lane 1 (A, C layout). When the wind barrier height is set at 3.15 m and 4.15 m, the lateral force coefficient of the train is not much different, and when the wind barrier height is too low (H = 2.15 m), the lateral resistance coefficient of the train is significantly larger than the other two.
The insights derived from Fig. 22b lead to the subsequent conclusions: When employing wind barrier heights of 3.15 m and 4.15 m, following the deployment of the Tesla plate wind barrier, the lift coefficient of the train displays a negative value, and the higher the wind barrier height, the higher the value. Conversely, with the traditional wind barrier, the lift coefficient of the train consistently assumes positive values. This finding suggests that, for suitably high wind barriers, the train after the Tesla plate wind barrier experiences a downward pressure that is advantageous to the train’s stability on the track. When the train is in the same lane, the lift coefficient of the train is slightly smaller when the configuration of the wind barriers is organized in both upstream and downstream (C and D layouts) than when the wind barriers are solely positioned in the upstream (A and B layouts). Under the same arrangement of the wind barriers, the lift coefficient experienced by the train on lane 2 (B, D layout) is smaller than that on lane 1 (A, C layout).
The following conclusions can be drawn from Fig. 22c: The Tesla plate wind barrier exerts a notable impact in mitigating the overturning moment experienced by the train, and this effect is related to the height of the wind barrier. When the wind barrier is adjusted to a height of 2.15 m, the coefficient of overturning moment displayed by the train after the Tesla plate wind barrier is about half of that after the traditional barrier. When the wind barrier height is adjusted to 3.15 m and 4.15 m, the coefficient related to the overturning moment experienced by the train after the Tesla plate wind barrier is only about 10% of that after the traditional barrier. When wind barriers are installed both upstream and downstream of the train in the same lane (C and D layouts), the coefficient representing the train’s overturning moment shows little difference and is similar to the case with barriers only upstream (A and B layouts). Under the same barrier configuration, the overturning moment coefficient for a train on lane 2 (B and D layouts) is smaller than that for a train on lane 1 (A and C layouts).
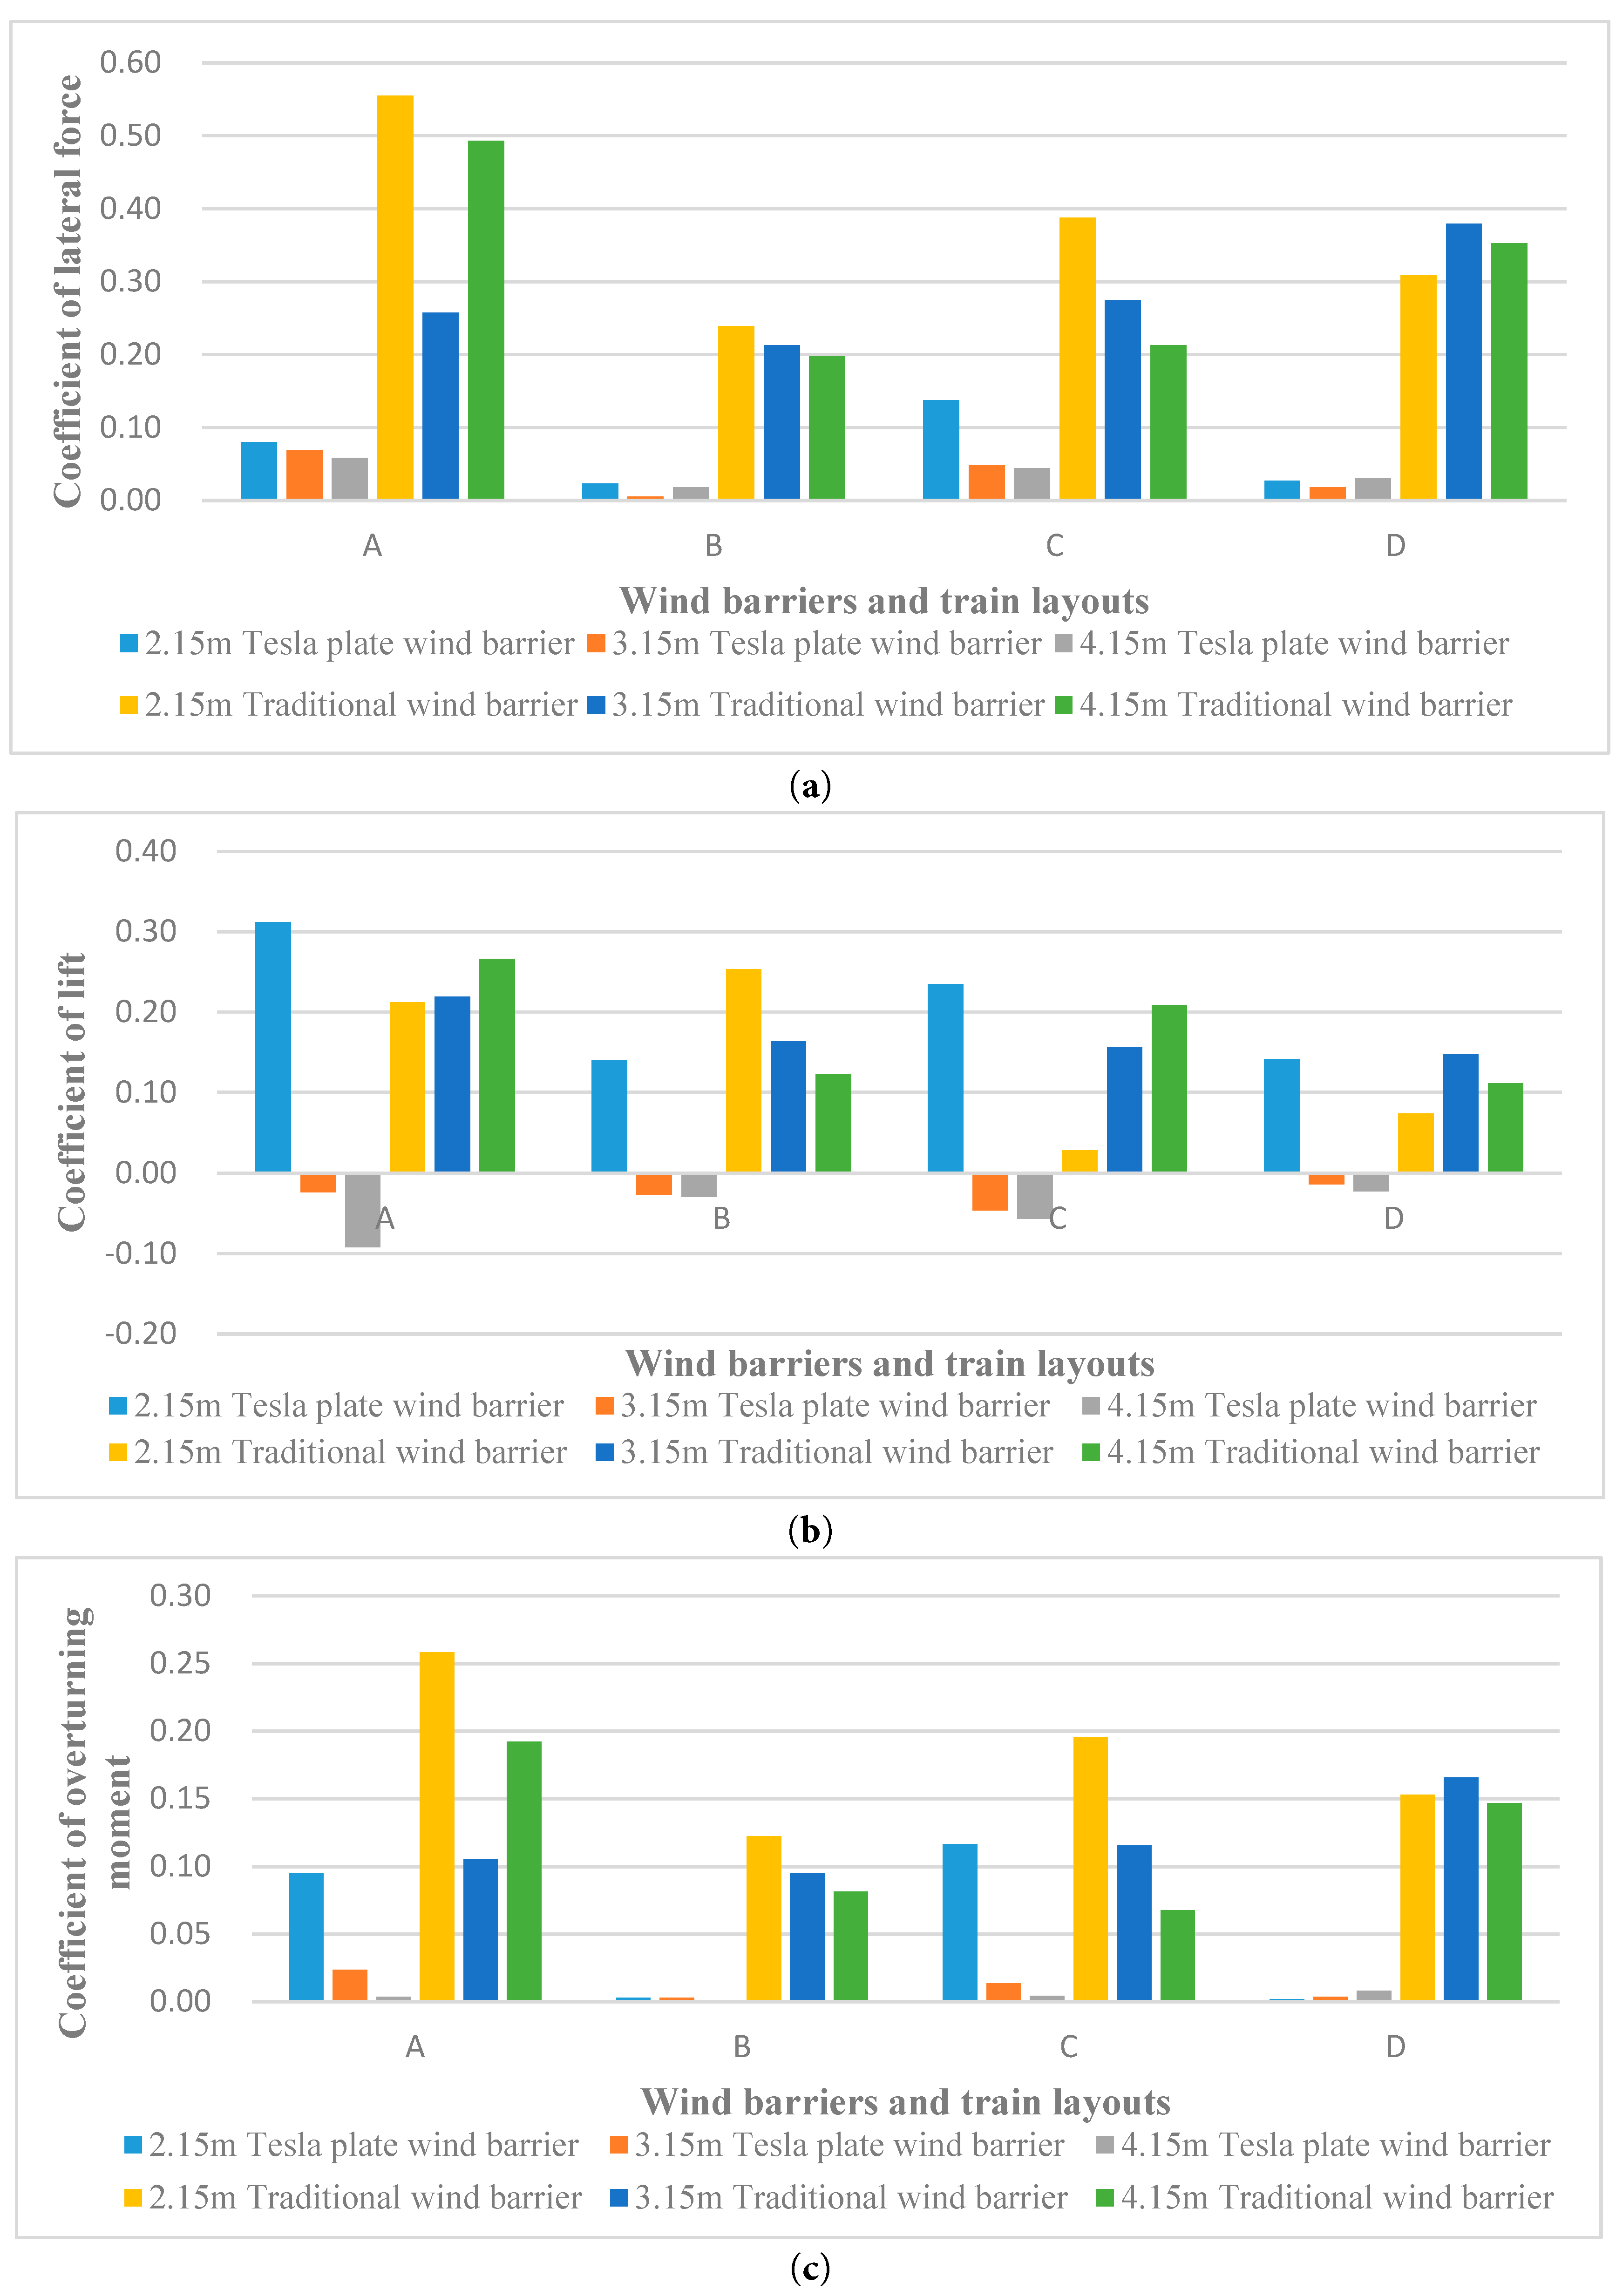
Figure 22: Diagram of three force components on the train. (a) Coefficient of lateral force; (b) Coefficient of lift force; (c) Coefficient of overturning moment.
5.4 Force Coefficients of the Upstream Wind Barrier
The data for force coefficients related to the upstream wind barrier is presented in Fig. 23. As can be observed in Fig. 23a, the lateral force coefficient of the wind barrier is greater for the Tesla plate wind barrier upstream than it is for the conventional barrier. As a result, the Tesla plate wind barrier can withstand higher wind loads and has stronger material requirements. When the train is located in lane 1 (A, C layout), the lateral force coefficient experienced by the upstream wind barrier is marginally less than that of the upstream wind barrier when the train is located in lane 2 (B, D layout). There is little difference in the lateral force coefficient of the upstream wind barrier when both upstream and downstream wind barriers are arranged (C, D layout) and solely upstream wind barriers are positioned (A, B layout). The lateral force coefficient of the upstream windbreak is barely affected by the windbreak’s height.
The following conclusions can be drawn from Fig. 23b: When the train occupies lane 1 and the wind barrier’s height is 3.15 m or 4.15 m, the lift coefficient of the upstream Tesla-type wind barrier’s magnitude is notably inferior compared to that of the upstream traditional barrier. With a wind barrier height set at 2.15 m, the lift coefficient exhibited by the upstream Tesla-type barrier is much smaller than that of the upstream traditional barrier. When the train is located at lane 2, the lift coefficient associated with the Tesla-type wind barrier positioned upstream is much smaller than that of the upstream traditional barrier. The train’s lift coefficient is not much different when the wind barrier is positioned upstream and downstream (C, D layout) and the wind barrier is arranged upstream (A, B layout).
The subsequent deductions can be made from the observations in Fig. 23c: no matter the pattern or kind of wind barrier, the upstream wind barrier’s overturning moment coefficient increases with the height of the wind barrier. The overturning moment coefficient of the Tesla-type barrier demonstrates a magnitude roughly two times bigger than that of the conventional barrier under the same configuration and wind barrier height. The overturning moment coefficients of the upstream Tesla-type barrier under the four layouts of A, B, C and D are very close.
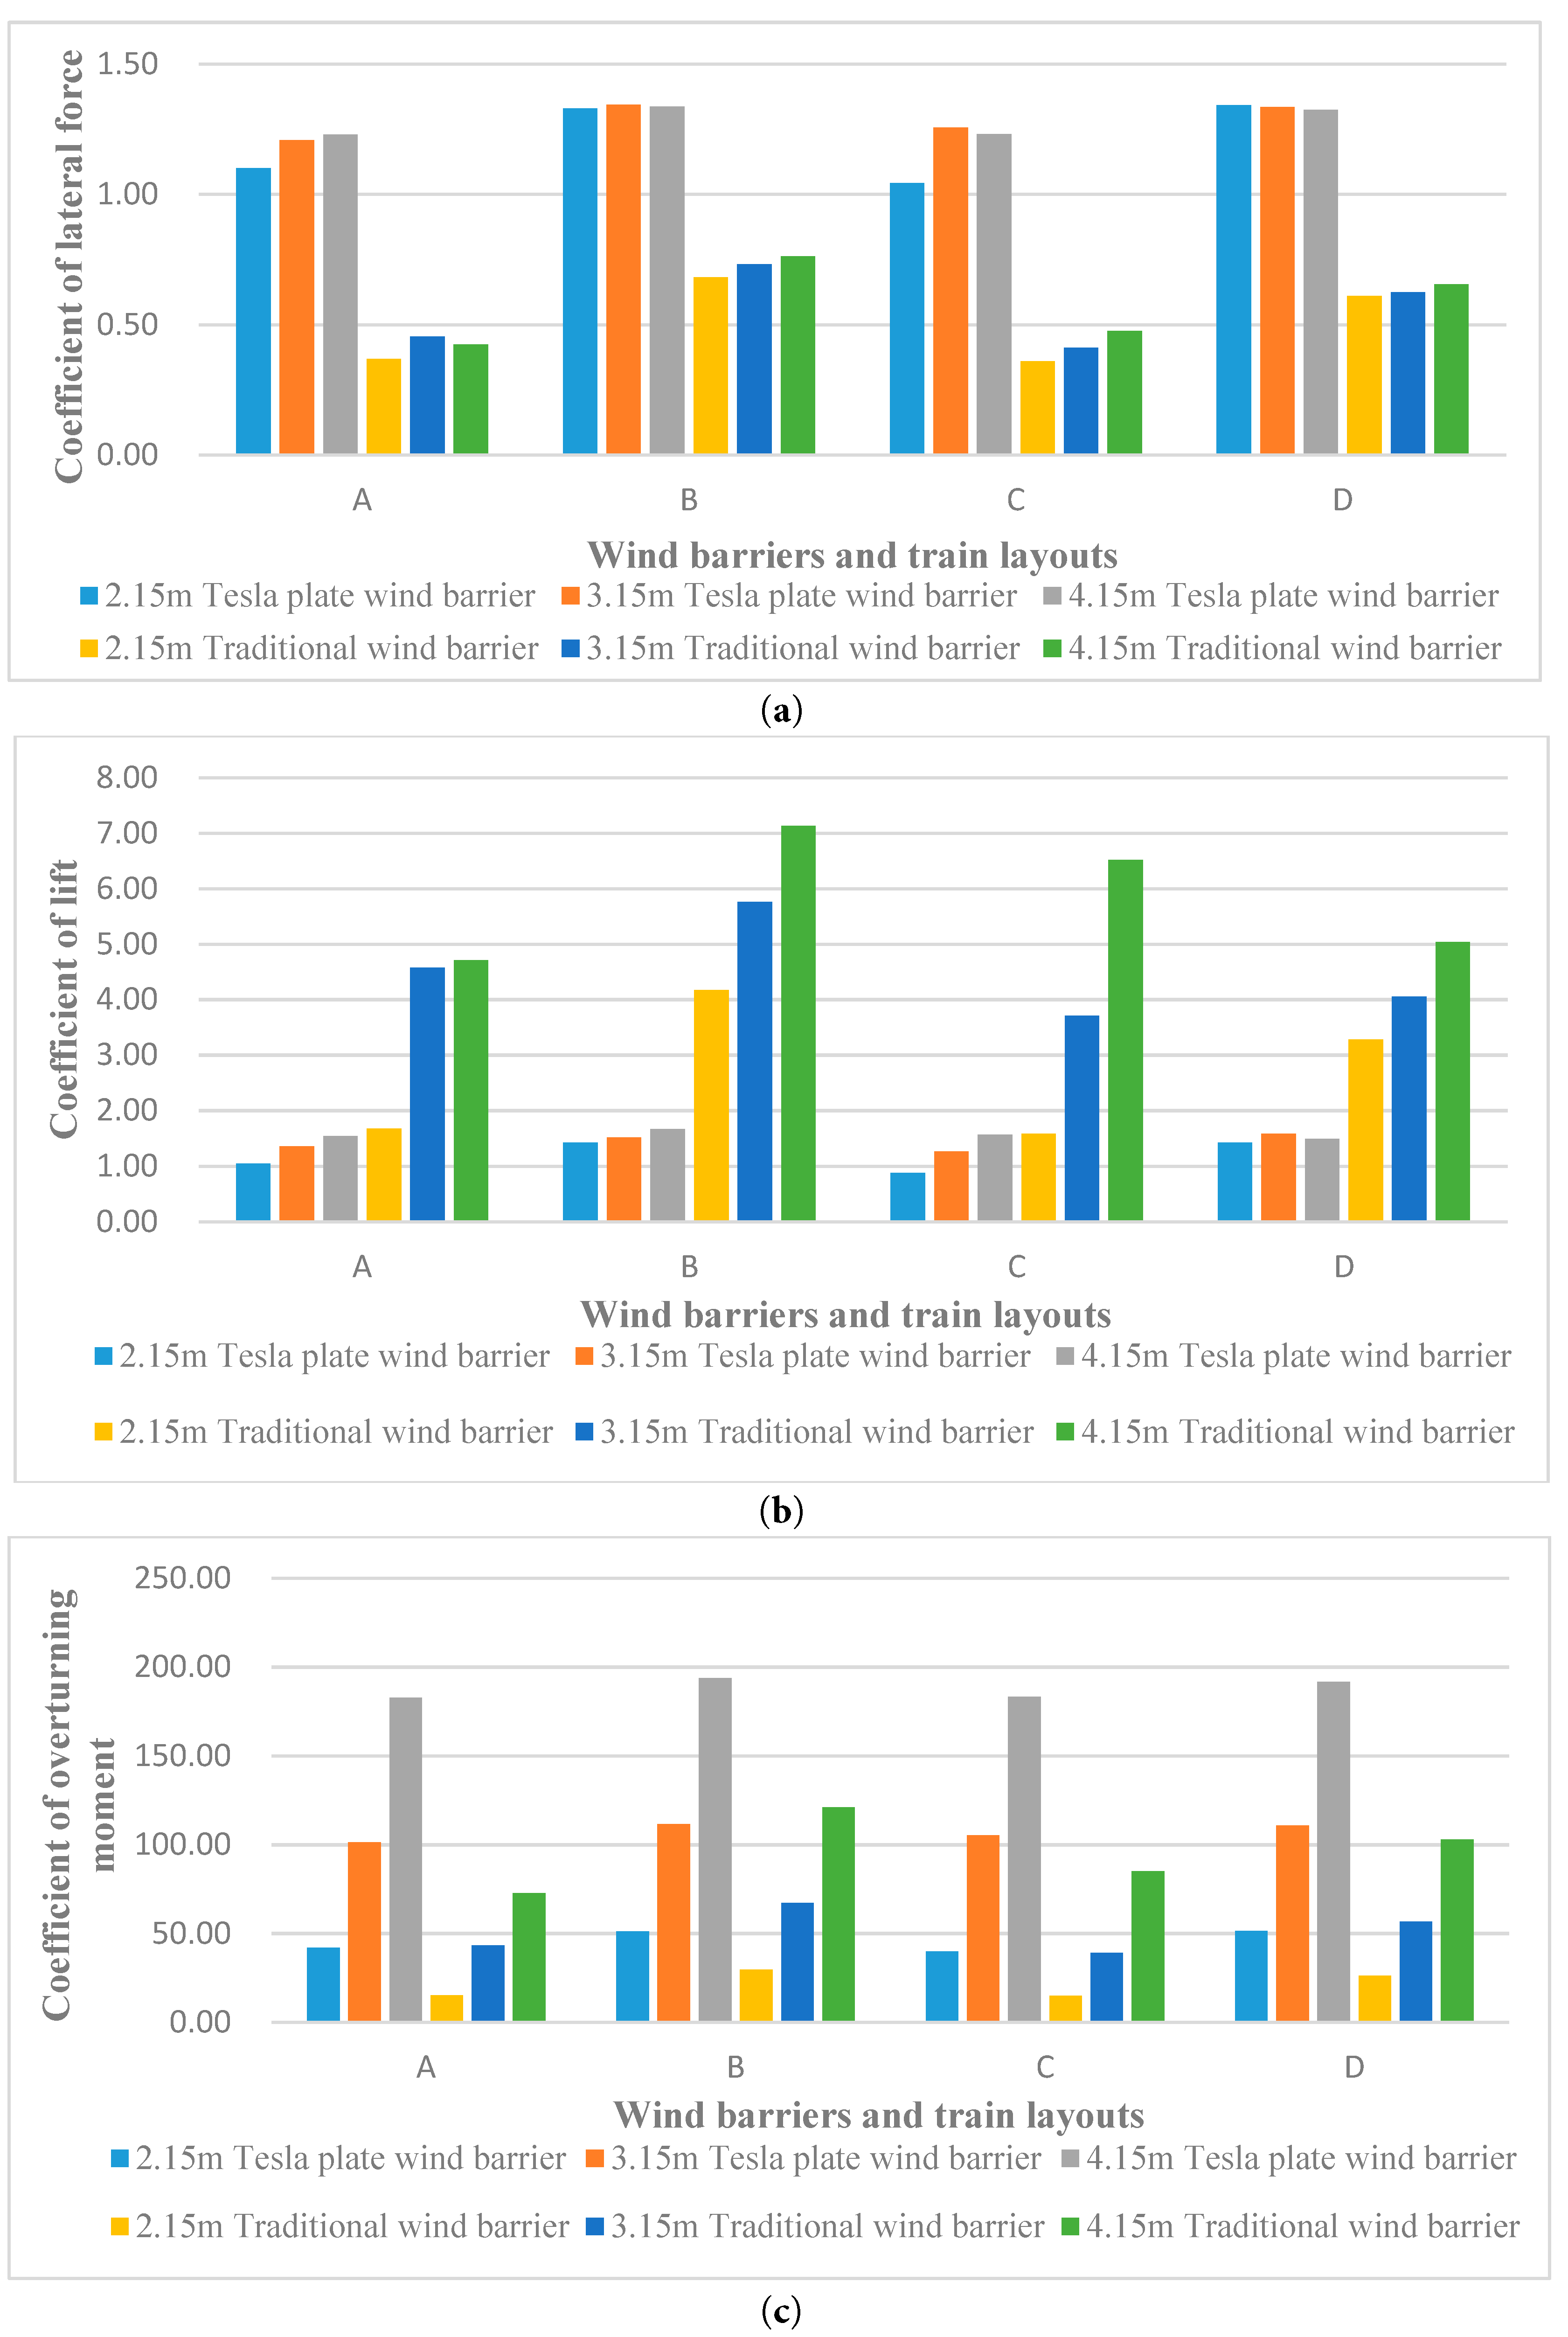
Figure 23: Diagram of three force components on the upstream wind barrier. (a) Coefficient of lateral force; (b) Coefficient of lift force; (c) Coefficient of overturning moment.
5.5 Force Coefficients of the Downstream Wind Barrier
The force coefficient data for the downstream wind barrier are shown in Fig. 24. From Fig. 24a, several observations can be made. Compared to the upstream barrier, the downstream barrier exhibits a significantly lower lateral force coefficient. In particular, the lateral force coefficient of the downstream Tesla-type barrier is much smaller than that of the conventional barrier. When the train occupies lane 2 (D layout), the lateral force coefficient on the downstream barrier is slightly lower than that of the upstream barrier with the train in lane 1 (C layout). Among the three barrier heights examined, the downstream Tesla-type barrier with a height of 3.15 m produces the lowest lateral force. For traditional barriers, increasing height generally reduces the lateral force coefficient.
From Fig. 24b, it is evident that the lift coefficient of the downstream barrier is markedly lower than that of the upstream barrier, and for the Tesla-type barrier, it is less than half that of the conventional barrier. When the train is in lane 2 (D layout), the lift coefficient on the downstream barrier is approximately 10% smaller than that of the upstream barrier in lane 1 (C layout). Additionally, the lift coefficient of the downstream barrier shows little dependence on barrier height.
Based on Fig. 24c, several conclusions can be drawn. The overturning moment coefficient of the Tesla-type downstream wind barrier ranges from 20% to 40% of that of the conventional barrier, which is also significantly lower than that of the upstream barrier. When the train is in lane 1 (C layout), the downstream Tesla-type barrier with a height of 3.15 m produces a smaller overturning moment than barriers of the other two heights. However, when the train is in lane 2 (D layout), barrier height has minimal effect on the overturning moment of the downstream wind barrier.
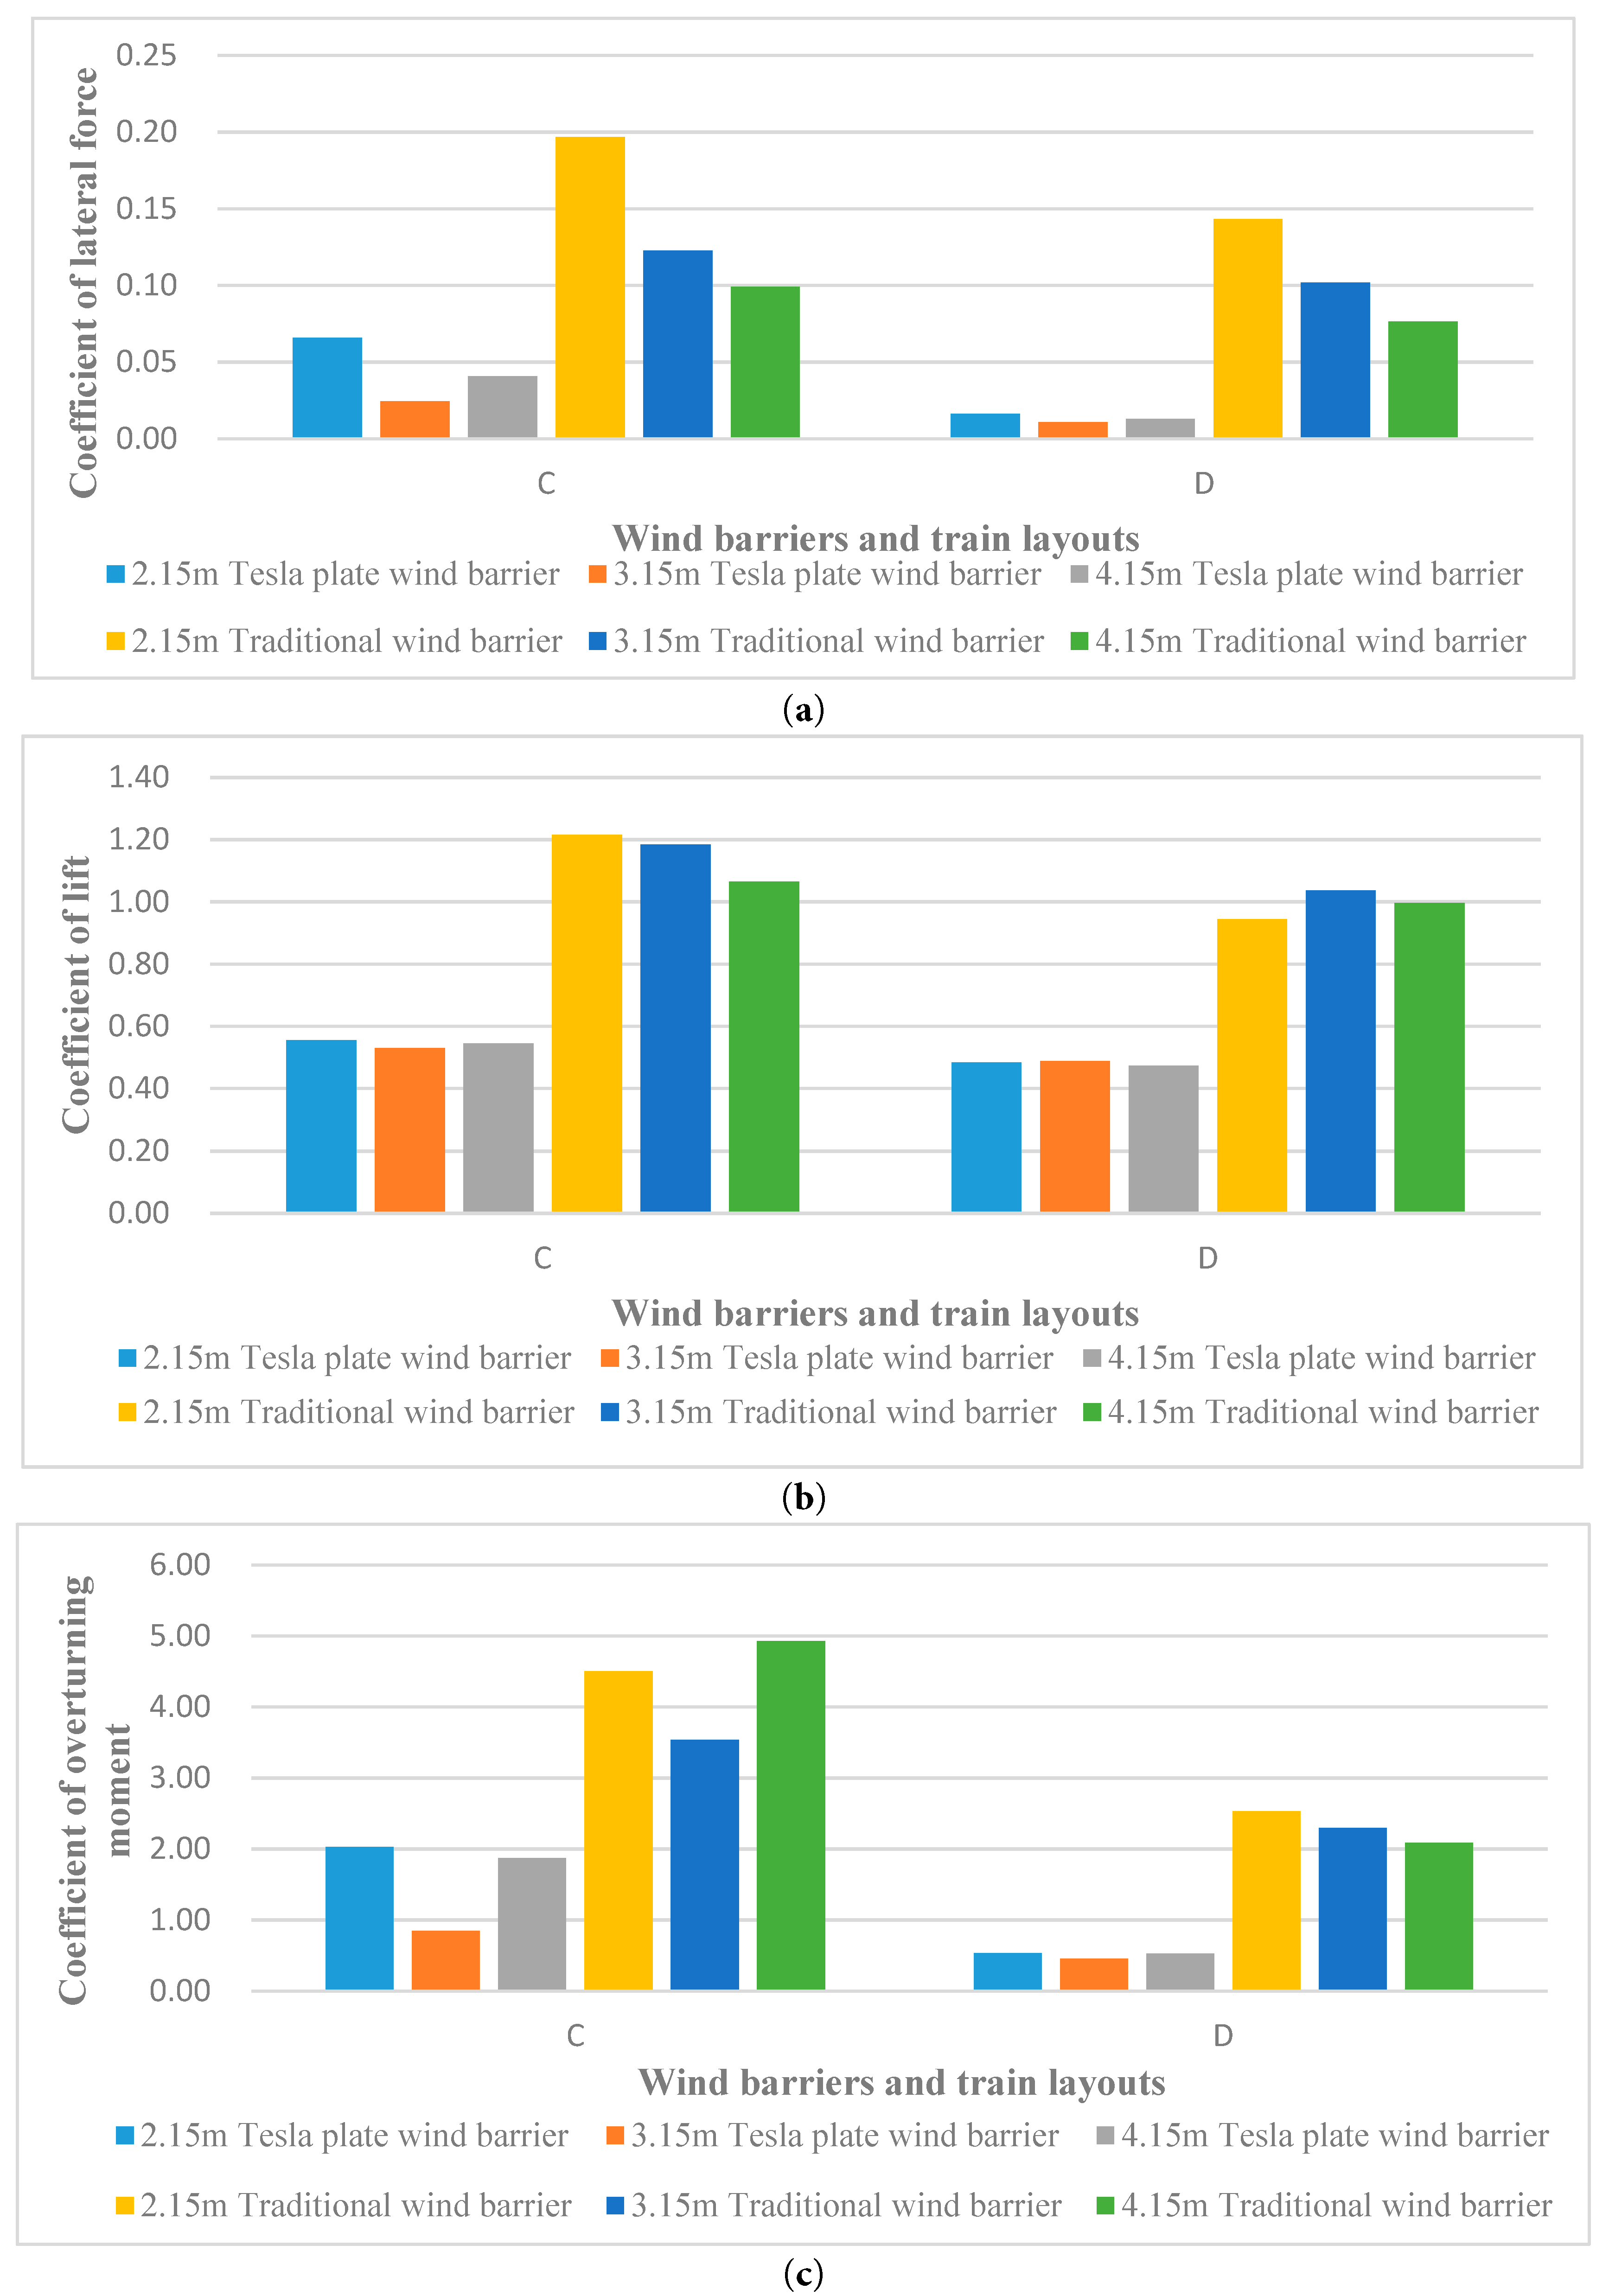
Figure 24: Diagram of three force components on the downstream wind barrier. (a) Coefficient of lateral force; (b) Coefficient of lift force; (c) Coefficient of overturning moment.
Based on the foundational working principle of the Tesla valve, a new Tesla-type wind barrier is proposed as a windbreak. Pressure drop characteristics are given through experimental study and parametric analysis. Furthermore, numerical simulations are conducted to evaluate the protective effect of the Tesla-type wind barrier on trains operating on the bridge deck. The primary conclusions can be outlined as follows:
- (1)The internal flow pipeline test was performed and contrasted with the numerical simulation outcomes for both the Tesla plate channel and the straight channel. Wind speed-pressure drop curves were obtained for the test and simulation with different channel configurations. The results confirm the accuracy of the numerical simulation technique in studying the Tesla plate structure by showing a high agreement between the wind speed-pressure drop patterns produced from the internal flow pipeline experimentation and the numerical simulation. The pressure drop in the Tesla plate reverse flow channel was found to be higher than that in the strip-type wind barrier, while the pressure drop in the Tesla plate forward flow channel was similar to that in the straight channel. This demonstrates the superiority of the Tesla plate reverse flow channel.
- (2)The internal flow numerical simulation of the influence parameters of the Tesla plate is carried out. The findings indicate that as the channel ratio γ increases, the corresponding pressure drop also amplifies for the fluid after passing through the Tesla plate structure model. A larger split angle α leads to an increased pressure drop as the fluid passes through the Tesla plate structure. As the number of units N increases, the resulting pressure drop also escalates due to the fluid after passing through the Tesla plate structure model. As the porosity φ decreases, the pressure drop of the fluid subsequently increases after passing through the Tesla plate structure model. In practical applications, the pressure-drop performance of a Tesla plate can be enhanced by selecting a higher channel ratio, a larger diversion angle, more energy-dissipation units, and lower porosity.
- (3)Through numerical simulation, the wind-proof properties of the Tesla-type barrier were examined, and an evaluation was done to compare the protective effects of the Tesla-type and the conventional wind barriers for the train. The findings indicate that the lateral force coefficient experienced by the train after the Tesla-type barrier is only 15%~25% of that encountered with the traditional barrier wind barrier under the same conditions. Additionally, the train experiences a downward force after passing through the Tesla-type barrier, enhancing overall travel safety by promoting smoother operation on the track. However, the barrier itself experiences increased aerodynamic loading. To mitigate this effect, a moderate barrier height of 3.15 m is recommended, balancing reduced structural force with effective train protection.
Compared with conventional porous and strip-type wind barriers reported in the literature, which primarily reduce wind effects through flow blockage and momentum attenuation, including recent optimized windbreak wall designs [36], the proposed Tesla-type wind barrier introduces an additional energy-dissipation mechanism via internal flow turning and collision. This mechanism enables a significantly higher pressure drop capability under comparable porosity conditions, resulting in improved wind protection performance for railway bridge applications. These results demonstrate that the Tesla-type wind barrier offers a distinct and advantageous alternative to traditional wind-barrier designs.
The present findings are consistent with recent numerical investigations on train–wind–structure interactions, further confirming the reliability of the adopted simulation framework. Research on Tesla plate structures, therefore, holds significant value. Building on existing studies and practical engineering applications, the following insights can be proposed:
Research on Tesla plates holds significant value. Building on existing studies and practical applications, the following insights can be proposed:
- (1)Future research could include more experimental studies to gain a deeper understanding of the performance of Tesla-type barriers. For example, experiments could explore a wider range of wind speeds and incorporate a wind–train–bridge aeroelastic model to investigate the influence of Tesla-type barriers on bridge aerodynamics and overall safety.
- (2)The energy-dissipation mechanism of Tesla plate structures remains a promising area for further study. Although the current design prioritizes energy dissipation efficiency and flow redirection, this results in increased structural complexity. Future work should therefore focus on theoretical and structural optimization, including simplifying the internal geometry, mitigating blockage risks, and improving scalability, to enhance the feasibility of Tesla-type barriers for practical engineering applications across a broader range of fields.
Acknowledgement:
Funding Statement: This work was supported by the National Natural Science Foundation of China (52475105), Special Fund for Science and Technology Innovation of Jiangsu Province (BE2022610), and National Natural Science Foundation of China (U23A20661).
Author Contributions: The authors confirm contribution to the paper as follows: Bo Su: Funding acquisition; Project administration; Validation. Mwansa Chambalile: Formal analysis; Investigation; Methodology; Resources; Writing—original draft. Shihao He: Investigation; Methodology, Writing—original draft. Wan Sun: Investigation; Validation. Enyuan Zhang: Investigation; Validation. Tong Guo: Investigation; Project administration. Jianming Hao: Investigation; Validation; Md. Mahbub Alam: Conceptualization; Acquisition; Supervision; Writing & editing. All authors reviewed and approved the final version of the manuscript.
Availability of Data and Materials: The data that support the findings of this study are available from the corresponding author.
Ethics Approval: Not applicable.
Conflicts of Interest: The authors declare no conflicts of interest.
References
1. Alam MM , Rehman S , Al-Hadhrami LM , Meyer JP . Extraction of the inherent nature of wind speed using wavelets and FFT. Energy Sustain Dev. 2014; 22: 34– 47. doi:10.1016/j.esd.2014.02.004. [Google Scholar] [CrossRef]
2. Snaiki R , Wu T , Whittaker AS , Atkinson JF . Hurricane wind and storm surge effects on coastal bridges under a changing climate. Transp Res Rec J Transp Res Board. 2020; 2674( 6): 23– 32. doi:10.1177/0361198120917671. [Google Scholar] [CrossRef]
3. Lawal A , Rehman S , Alhems LM , Alam MM . Wind speed prediction using hybrid 1D CNN and BLSTM network. IEEE Access. 2021; 9: 156672– 9. doi:10.1109/ACCESS.2021.3129883. [Google Scholar] [CrossRef]
4. Orcesi Dr A , O’Connor Prof A , Diamantidis Prof D , Sykora Dr M , Wu Dr T , Akiyama Prof M , et al. Investigating the effects of climate change on structural actions. Struct Eng Int. 2022; 32( 4): 563– 76. doi:10.1080/10168664.2022.2098894. [Google Scholar] [CrossRef]
5. Deng E , Yue H , Ni YQ , He XH , Yang WC , Chen ZW . Wake dynamic characteristics of windproof structures in embankment-bridge sections along a high-speed railway under natural strong crosswinds. Phys Fluids. 2023; 35( 5): 055109. doi:10.1063/5.0147079. [Google Scholar] [CrossRef]
6. Telenta M , Šubelj M , Tavčar J , Duhovnik J . Detached eddy simulation of the flow around a simplified vehicle sheltered by wind barrier in transient yaw crosswind. Mechanics. 2015; 21( 3): 193– 200. doi:10.5755/j01.mech.21.3.8942. [Google Scholar] [CrossRef]
7. Buljac A , Kozmar H , Pospíšil S , Macháček M . Aerodynamic and aeroelastic characteristics of typical bridge decks equipped with wind barriers at the windward bridge-deck edge. Eng Struct. 2017; 137: 310– 22. doi:10.1016/j.engstruct.2017.01.055. [Google Scholar] [CrossRef]
8. Gu H , Liu T , Jiang Z , Guo Z . Research on the wind-sheltering performance of different forms of corrugated wind barriers on railway bridges. J Wind Eng Ind Aerodyn. 2020; 201: 104166. doi:10.1016/j.jweia.2020.104166. [Google Scholar] [CrossRef]
9. Su B , He S , Zhang M , Feng J . Experimental study on flow-induced vibration of a circular cylinder with a downstream square plate. Ocean Eng. 2022; 247: 110768. doi:10.1016/j.oceaneng.2022.110768. [Google Scholar] [CrossRef]
10. Judd MJ , Raupach MR , Finnigan JJ . A wind tunnel study of turbulent flow around single and multiple windbreaks, part I: Velocity fields. Bound Layer Meteor. 1996; 80( 1): 127– 65. doi:10.1007/BF00119015. [Google Scholar] [CrossRef]
11. Deng E , Diao LY , Yue H , Dong Y . Aerodynamic characteristics of windbreak wall–wind barrier transition section along high-speed railways during strong crosswinds. J Wind Eng Ind Aerodyn. 2025; 258: 106038. doi:10.1016/j.jweia.2025.106038. [Google Scholar] [CrossRef]
12. Lyu J , Wang CM , Mason MS . Review of models for predicting wind characteristics behind windbreaks. J Wind Eng Ind Aerodyn. 2020; 199: 104117. doi:10.1016/j.jweia.2020.104117. [Google Scholar] [CrossRef]
13. Dong Z , Luo W , Qian G , Wang H . A wind tunnel simulation of the mean velocity fields behind upright porous fences. Agric For Meteor. 2007; 146( 1–2): 82– 93. doi:10.1016/j.agrformet.2007.05.009. [Google Scholar] [CrossRef]
14. Shang J , Zhou Q , Alam MM , Liao H , Cao S . Numerical studies of the flow structure and aerodynamic forces on two tandem square cylinders with different chamfered-corner ratios. Phys Fluids. 2019; 31( 7): 075102. doi:10.1063/1.5100266. [Google Scholar] [CrossRef]
15. Wang P , Zhou Q , Alam MM , Yang Y , Li M . Streamwise sinusoidal flow over two identical tandem circular cylinders. Ocean Eng. 2023; 285: 115461. doi:10.1016/j.oceaneng.2023.115461. [Google Scholar] [CrossRef]
16. Zhou Y , Hao J , Alam MM . Wake of two tandem square cylinders. J Fluid Mech. 2024; 983: A3. doi:10.1017/jfm.2024.119. [Google Scholar] [CrossRef]
17. He X , Shi K , Wu T , Zou Y , Wang H , Qin H . Aerodynamic performance of a novel wind barrier for train-bridge system. Wind Struct. 2016; 23( 3): 171– 89. doi:10.12989/was.2016.23.3.171. [Google Scholar] [CrossRef]
18. He X , Xue F , Zou Y , Chen S , Han Y , Du B , et al. Wind tunnel tests on the aerodynamic characteristics of vehicles on highway bridges. Adv Struct Eng. 2020; 23( 13): 2882– 97. doi:10.1177/1369433220924791. [Google Scholar] [CrossRef]
19. Kozmar H , Procino L , Borsani A , Bartoli G . Optimizing height and porosity of roadway wind barriers for viaducts and bridges. Eng Struct. 2014; 81: 49– 61. doi:10.1016/j.engstruct.2014.09.029. [Google Scholar] [CrossRef]
20. Su Y , Xiang H , Fang C , Wang L , Li Y . Wind tunnel tests on flow fields of full-scale railway wind barriers. Wind Struct. 2017; 24( 2): 171– 84. doi:10.12989/was.2017.24.2.171. [Google Scholar] [CrossRef]
21. Tominaga Y , Shirzadi M . RANS CFD modeling of the flow around a thin windbreak fence with various porosities: validation using wind tunnel measurements. J Wind Eng Ind Aerodyn. 2022; 230: 105176. doi:10.1016/j.jweia.2022.105176. [Google Scholar] [CrossRef]
22. Tesla N , inventor; Tesla N , assignee . Valvular conduit. United States patent US 1,329,559. 1920 Feb 3. [Google Scholar]
23. Thompson SM , Ma HB , Wilson C . Investigation of a flat-plate oscillating heat pipe with Tesla-type check valves. Exp Therm Fluid Sci. 2011; 35( 7): 1265– 73. doi:10.1016/j.expthermflusci.2011.04.014. [Google Scholar] [CrossRef]
24. Yang AS , Chuang FC , Chen CK , Lee MH , Chen SW , Su TL , et al. A high-performance micromixer using three-dimensional Tesla structures for bio-applications. Chem Eng J. 2015; 263: 444– 51. doi:10.1016/j.cej.2014.11.034. [Google Scholar] [CrossRef]
25. Nguyen QM , Huang D , Zauderer E , Romanelli G , Meyer CL , Ristroph L . Tesla’s fluidic diode and the electronic-hydraulic analogy. Am J Phys. 2021; 89( 4): 393– 402. doi:10.1119/10.0003395. [Google Scholar] [CrossRef]
26. Monika K , Chakraborty C , Roy S , Sujith R , Datta SP . A numerical analysis on multi-stage Tesla valve based cold plate for cooling of pouch type Li-ion batteries. Int J Heat Mass Transf. 2021; 177: 121560. doi:10.1016/j.ijheatmasstransfer.2021.121560. [Google Scholar] [CrossRef]
27. Cao Z , Zhao T , Wang Y , Wang H , Zhai C , Lv W . Novel fluid diode plate for use within ventilation system based on Tesla structure. Build Environ. 2020; 185: 107257. doi:10.1016/j.buildenv.2020.107257. [Google Scholar] [CrossRef]
28. Xu M , Patruno L , Lo YL , de Miranda S . On the use of the pressure jump approach for the simulation of separated external flows around porous structures: a forward facing step. J Wind Eng Ind Aerodyn. 2020; 207: 104377. doi:10.1016/j.jweia.2020.104377. [Google Scholar] [CrossRef]
29. Mahgoub AO , Ghani S . Numerical and experimental investigation of utilizing the porous media model for windbreaks CFD simulation. Sustain Cities Soc. 2021; 65: 102648. doi:10.1016/j.scs.2020.102648. [Google Scholar] [CrossRef]
30. Yakhot V , Orszag SA . Renormalization group analysis of turbulence. I. Basic theory. J Sci Comput. 1986; 1( 1): 3– 51. doi:10.1007/BF01061452. [Google Scholar] [CrossRef]
31. Hiers R . A control volume derivation of the energy equation for LII modeling. Appl Phys B. 2008; 92( 4): 635– 41. doi:10.1007/s00340-008-3122-3. [Google Scholar] [CrossRef]
32. Qin J , Pan H , Rahman MM , Tian X , Zhu Z . Introducing compressibility with SIMPLE algorithm. Math Comput Simul MATCOM. 2021; 180: 328– 53. doi:10.1016/j.matcom.2020.09.010. [Google Scholar] [CrossRef]
33. Getachew A , Obrien EJ . Simplified site-specific traffic load models for bridge assessment. Struct Infrastruct Eng. 2007; 3( 4): 303– 11. doi:10.1080/15732470500424245. [Google Scholar] [CrossRef]
34. Noguchi Y , Suzuki M , Baker C , Nakade K . Numerical and experimental study on the aerodynamic force coefficients of railway vehicles on an embankment in crosswind. J Wind Eng Ind Aerodyn. 2019; 184: 90– 105. doi:10.1016/j.jweia.2018.11.019. [Google Scholar] [CrossRef]
35. Mashhadi A , Sohankar A , Alam MM . Flow over rectangular cylinder: effects of cylinder aspect ratio and Reynolds number. Int J Mech Sci. 2021; 195: 106264. doi:10.1016/j.ijmecsci.2020.106264. [Google Scholar] [CrossRef]
36. Wang J , Deng E , Ni YQ , He XH , Chan PW , Yang WC , et al. Mitigating inflow acceleration effects in twin mountains using air jets: emphasis on anti-wind for high-speed railways. Phys Fluids. 2024; 36( 5): 055128. doi:10.1063/5.0202419. [Google Scholar] [CrossRef]
Cite This Article
 Copyright © 2026 The Author(s). Published by Tech Science Press.
This work is licensed under a Creative Commons Attribution 4.0 International License , which permits unrestricted use, distribution, and reproduction in any medium, provided the original work is properly cited.
 Downloads
 Citation Tools