
 Submit a Paper
 Propose a Special lssue
 Open Access
ARTICLE

Numerical Assessment of Novel Windbreak Designs for Flow Control and Heat Transfer Enhancement in Natural Draft Dry Cooling Towers
1 School of Nuclear Science, Energy and Power Engineering, Shandong University, Jinan, China
2 Shenzhen Research Institute of Shandong University, Shenzhen, China
3 China Nuclear Power Engineering Co., Ltd., Beijing, China
4 Shandong Qinglei Environmental Science and Technology Co., Ltd., Jinan, China
5 Shandong Hetong Information Technology Co., Ltd., Jinan, China
* Corresponding Author: Suoying He. Email:
# These authors contributed equally to this work as the first author
(This article belongs to the Special Issue: Fluid Mechanics & Thermodynamics in Renewable Energy and HVAC Systems)
Fluid Dynamics & Materials Processing 2026, 22(2), 3 https://doi.org/10.32604/fdmp.2026.077360
Received 08 December 2025; Accepted 11 February 2026; Issue published 04 March 2026
 View Full Text
 Download PDF
Abstract
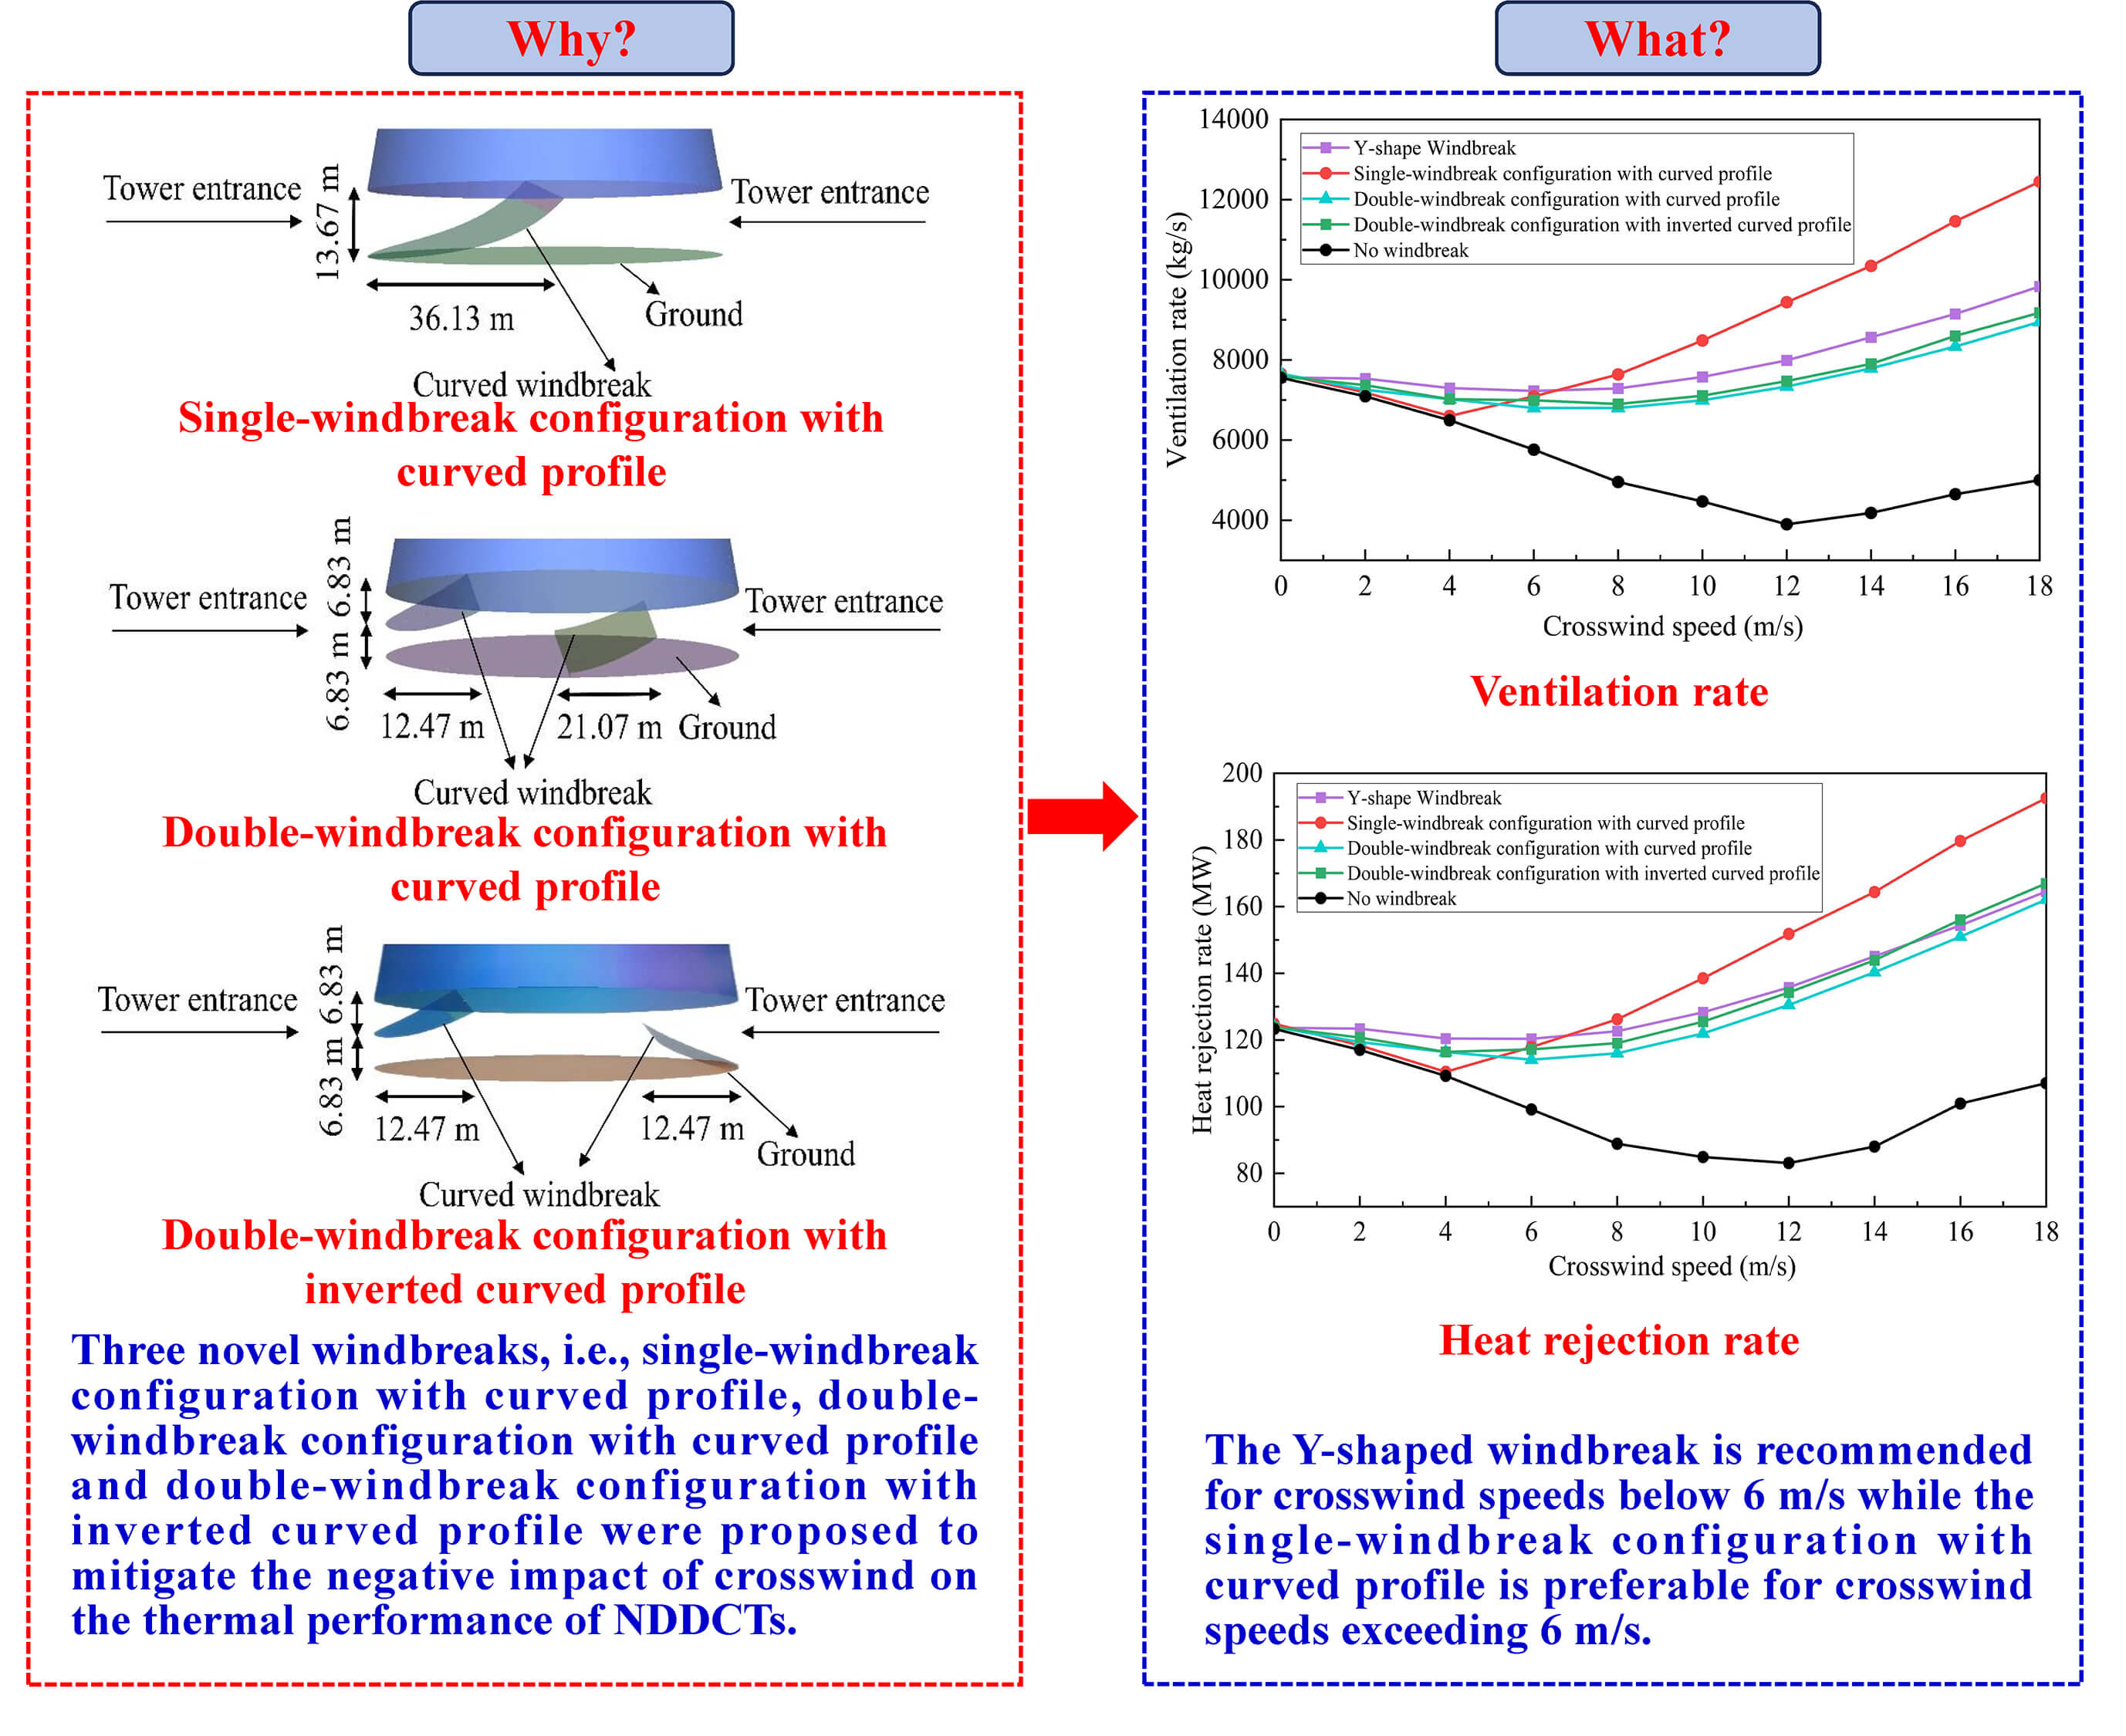
This study aims to mitigate crosswind-induced performance degradation in Natural Draft Dry Cooling Towers used in power plants by developing and assessing windbreak configurations that enhance ventilation while minimizing additional airflow resistance. Three novel windbreak designs, namely single-windbreak configuration with curved profile, double-windbreak configuration with curved profile, and double-windbreak configuration with inverted curved profile, are proposed accordingly and evaluated against conventional solutions. Three-dimensional numerical models of a 120 m high NDDCT equipped with these windbreaks, together with a conventional Y-shaped windbreak, are developed for systematic comparison. The results demonstrate that windbreak effectiveness strongly depends on crosswind intensity. At low crosswind speeds of 0–6 m/s, the Y-shaped windbreak provides the greatest enhancement, increasing the ventilation rate by 25.45% and the heat rejection rate by 21.37% at 6 m/s compared with the no-windbreak configuration. In contrast, under moderate to strong crosswinds of 6–18 m/s, the single-windbreak configuration with curved profile exhibits superior performance. At 18 m/s, it increases the ventilation rate by 148.88% and the heat rejection rate by 79.74% relative to the baseline case, outperforming the Y-shaped windbreak by 26.59% in ventilation rate and 17.01% in heat rejection capacity. Analysis of airflow structure, temperature fields, and velocity distributions confirms that the single-windbreak configuration with curved profile more effectively suppresses crosswind penetration and promotes stable upward airflow at higher wind speeds. Based on a comprehensive assessment of aerodynamic and thermal performance, the Y-shaped windbreak is recommended for regions where crosswind speeds remain below 6 m/s, whereas the single-windbreak configuration with curved profile is preferable for sites exposed to stronger crosswinds exceeding this threshold.Graphic Abstract
Keywords
Electricity is a fundamental pillar supporting national economic growth. On a global scale, thermal power generation remains the dominant source, accounting for approximately 54% of the total installed capacity by the end of 2024 [1]. Consequently, improving the efficiency of thermal power systems is essential. As critical cold-end components, cooling towers play a decisive role in the operational economy of thermal power plants [2].
The performance of these heat dissipation devices is intrinsically linked to energy utilization efficiency and the stability of the entire thermodynamic system in industrial applications [3]. Therefore, comprehensive investigations into their performance characteristics have long been a focal point in both academic research and engineering practice, including the numerical study of near-field drift characteristics and vortex dynamics under varying crossflow conditions [4]. Various aspects, such as experimental analyses [5], developing empirical correlations [6], and multi-objective and multi-parameter optimizations [7] about cooling towers have been carried out. Besides, advanced algorithms can also be used to carry out unconstrained optimization of the cooling tower’s parameters to achieve the lowest energy consumption [8] and exergy optimization [9]. As for natural draft cooling towers, the ambient crosswind is an important factor that cannot be ignored. This is because natural draft cooling towers, as passive ventilation devices, rely on the buoyancy effect due to the air density difference inside and outside the tower to drive the airflow [10]. As a result, the airflow field inside the tower is highly susceptible to environmental crosswind [11]. The flow field within the tower becomes unstable when the crosswinds are present, leading to phenomena such as vortices at the base of the tower and wind cap at the tower’s top [12]. As a result, the towers’ performance is impaired by the crosswind. This is even worse for natural draft dry cooling towers (NDDCTs). The ambient crosswind affects the thermal performance of NDDCTs due to the through-draught flow caused by the crosswind. The through-draught flow will impair the cooling performance of the NDDCT, and it should be avoided. The through-draught flow means the airflow just flows from the windward side to the leeward side at the bottom of the NDDCT without passing through the heat exchanger inside the NDDCT. That means the through-draught flow reduces the airflow rate passing through the heat exchanger inside the NDDCT, and therefore decreases the overall heat transfer coefficient and thermal efficiency.
Scholars have conducted extensive research on the impact of crosswind on NDDCTs. Zhao et al. [13] utilized numerical simulations to investigate this effect, revealing that the cooling water outlet temperature increased by over 1°C at a crosswind speed of 5 m/s, and by more than 5°C when the wind speed reached 10 m/s. Similarly, Li [14] developed a three-dimensional model of a NDDCT and explored the impact of crosswind on the performance of the NDDCT with different heat rejection rates. The study demonstrated that increasing crosswind speeds leads to higher outlet water temperatures, a reduced pressure differential between the inside and outside of the tower, and a consequent drop in ventilation rate. Zhao et al. [15] conducted experimental tests on a 900 MW cross-flow dry cooling tower, observing a reduction in heat rejection rate by 31.26 kJ/h at a crosswind speed of 9.27 m/s. They proposed that four windbreaks be arranged crosswise at the inlet of the tower, which could effectively mitigate the unfavorable effects of crosswind.
In recent years, many researchers have focused on enhancing the cooling performance of cooling towers. Some studies explored the application of advanced working fluids, such as nanofluids, to improve the heat transfer efficiency [16,17]. Meanwhile, optimizing the air-side flow field is another effective approach, among which installing windbreaks has attracted significant attention. Wang et al. [18] proposed a numerical method to utilize a localized maintenance structure as a protective enclosure against crosswind. The simulation results indicated that this configuration effectively increased the tower’s ventilation rate by 36%, leading to a 7°C reduction in the circulating water temperature. Subsequently, Wang et al. [19,20] numerically evaluated the efficacy of a windbox-type wind protection system encircling the tower. Their analysis confirmed that such a comprehensive wind protection design could enhance the overall cooling performance by 60%. Al-Waked and Behnia [21] explored the impact of the location and porosity of windbreak on the heat transfer performance of a NDDCT. They concluded that external windbreaks are superior under low crosswind speed conditions, whereas internal windbreaks offer better protection at higher crosswind speeds. Consequently, an optimal configuration involving a combination of both inner and outer windbreaks was recommended to maximize heat transfer. Ma et al. [22] assessed the impact of the rotatable windbreak on the thermal performance of a tower. The results demonstrated that the rotatable windbreak could enhance the thermal performance of the tower by 2.50% compared to traditional fixed radial windbreaks. Lu et al. [23] used numerical methods to study a 15-m-high NDDCT equipped with a triple-leaf windbreak at the bottom. Their results showed that windbreaks mitigate the crosswind effects. The optimal performance is achieved when the crosswind speeds are larger than 10 m/s, and the angle between the crosswind direction and the windbreak is within 0°–10°. However, the 50°, 60° and 0° angles are most favorable at low speeds. Furthermore, Lu et al. [24] employed an experimental method to establish a NDDCT model with a scale ratio of 1:12.5 and investigated crosswind effects and windbreaks on the thermal performance of the cooling towers. The results indicated that the cooling towers achieved the best thermal performance when the windbreaks were parallel to the direction of the crosswind.
From the above literature review, it is evident that the adverse effects of crosswinds on the thermal performance of NDDCTs are verified. Various mitigation strategies have been proposed and studied, including the widely studied Y-shaped windbreak [23,24]. Although the windbreaks improve the thermal performance of NDDCTs [25,26], it is still necessary to investigate more effective windbreak designs to further mitigate the effects of crosswinds and maximize the thermal efficiency of NDDCTs. Particularly, the existing Y-shaped design has three vertical plates installed at the bottom of the NDDCT, and this design may cause high airflow resistance. In the NDDCT, the inlet airflow stream inside the tower is tilted upward. It is necessary to design a windbreak whose shape is in accordance with the tower inlet airflow field. The intention of this design is to extend the inlet airflow rather than disturbing the airflow so as to minimize the airflow resistance caused by the windbreak. Therefore, the current study proposes three novel windbreaks, i.e., single-windbreak configuration with curved profile, double-windbreak configuration with curved profile and double-windbreak configuration with inverted curved profile.
The objectives of the current study are: (1) to develop three-dimensional models of NDDCTs installed with the proposed windbreaks and the existing Y-shaped windbreak for comparative study; (2) to investigate the feasibility of the three novel windbreaks for mitigating the detrimental impact of crosswind on the thermal performance of NDDCTs; (3) to find the most promising windbreak for performance improvement of NDDCTs under crosswind conditions. The innovations of this study are: (1) three novel designs of windbreaks (i.e., single-windbreak configuration with curved profile, double-windbreak configuration with curved profile and double-windbreak configuration with inverted curved profile) are firstly proposed for performance improvement of NDDCTs under crosswind conditions; (2) three-dimensional models of a 120 m high NDDCT installed with proposed windbreaks are developed to compare the performance improvement effects of the three proposed windbreaks with the existing Y-shaped windbreak, the performance improvement effects of the four windbreaks are compared in terms of air temperature, velocity distributions, the ventilation rate and heat rejection rate under a wind range of crosswind speeds of 0–18 m/s; (3) the existing Y-shaped windbreak is good for the NDDCT’s locations where the crosswinds are low (below 6 m/s), while the proposed single-windbreak configuration with curved profile is good for the NDDCT’s locations where the crosswinds are high (above 6 m/s). Therefore, this study fills in the gaps of the lacking design reference of NDDCT’s windbreaks for both low-speed and high-speed crosswind regions.
The current study only performs steady-state analyses and no transient simulation will be performed. This is because the current study is to investigate the feasibility of the three novel windbreaks in terms of the air temperature distributions, air velocity distributions, ventilation rate and heat rejection rate. The steady-state analyses are able to meet the requirements of this study. The genesis of using Y-shaped windbreak includes: (1) The Y-shaped windbreak was studied by many researchers and there are available data for model validation. Then, the validated model will be modified to simulate the current situations. (2) The current study is to investigate the feasibility of the three novel windbreaks. Comparative study between the three novel windbreaks and the existing Y-shaped windbreak will be carried out regarding the air temperature distributions, air velocity distributions, ventilation rate and heat rejection rate, aiming to further verify the feasibility of the three novel windbreaks.
Current NDDCTs face performance degradation under crosswind conditions primarily due to the through-draught flow. To mitigate this adverse effect and enhance the airflow passing through the heat exchanger, windbreaks are proposed. Fig. 1 presents a NDDCT installed with a Y-shaped windbreak.
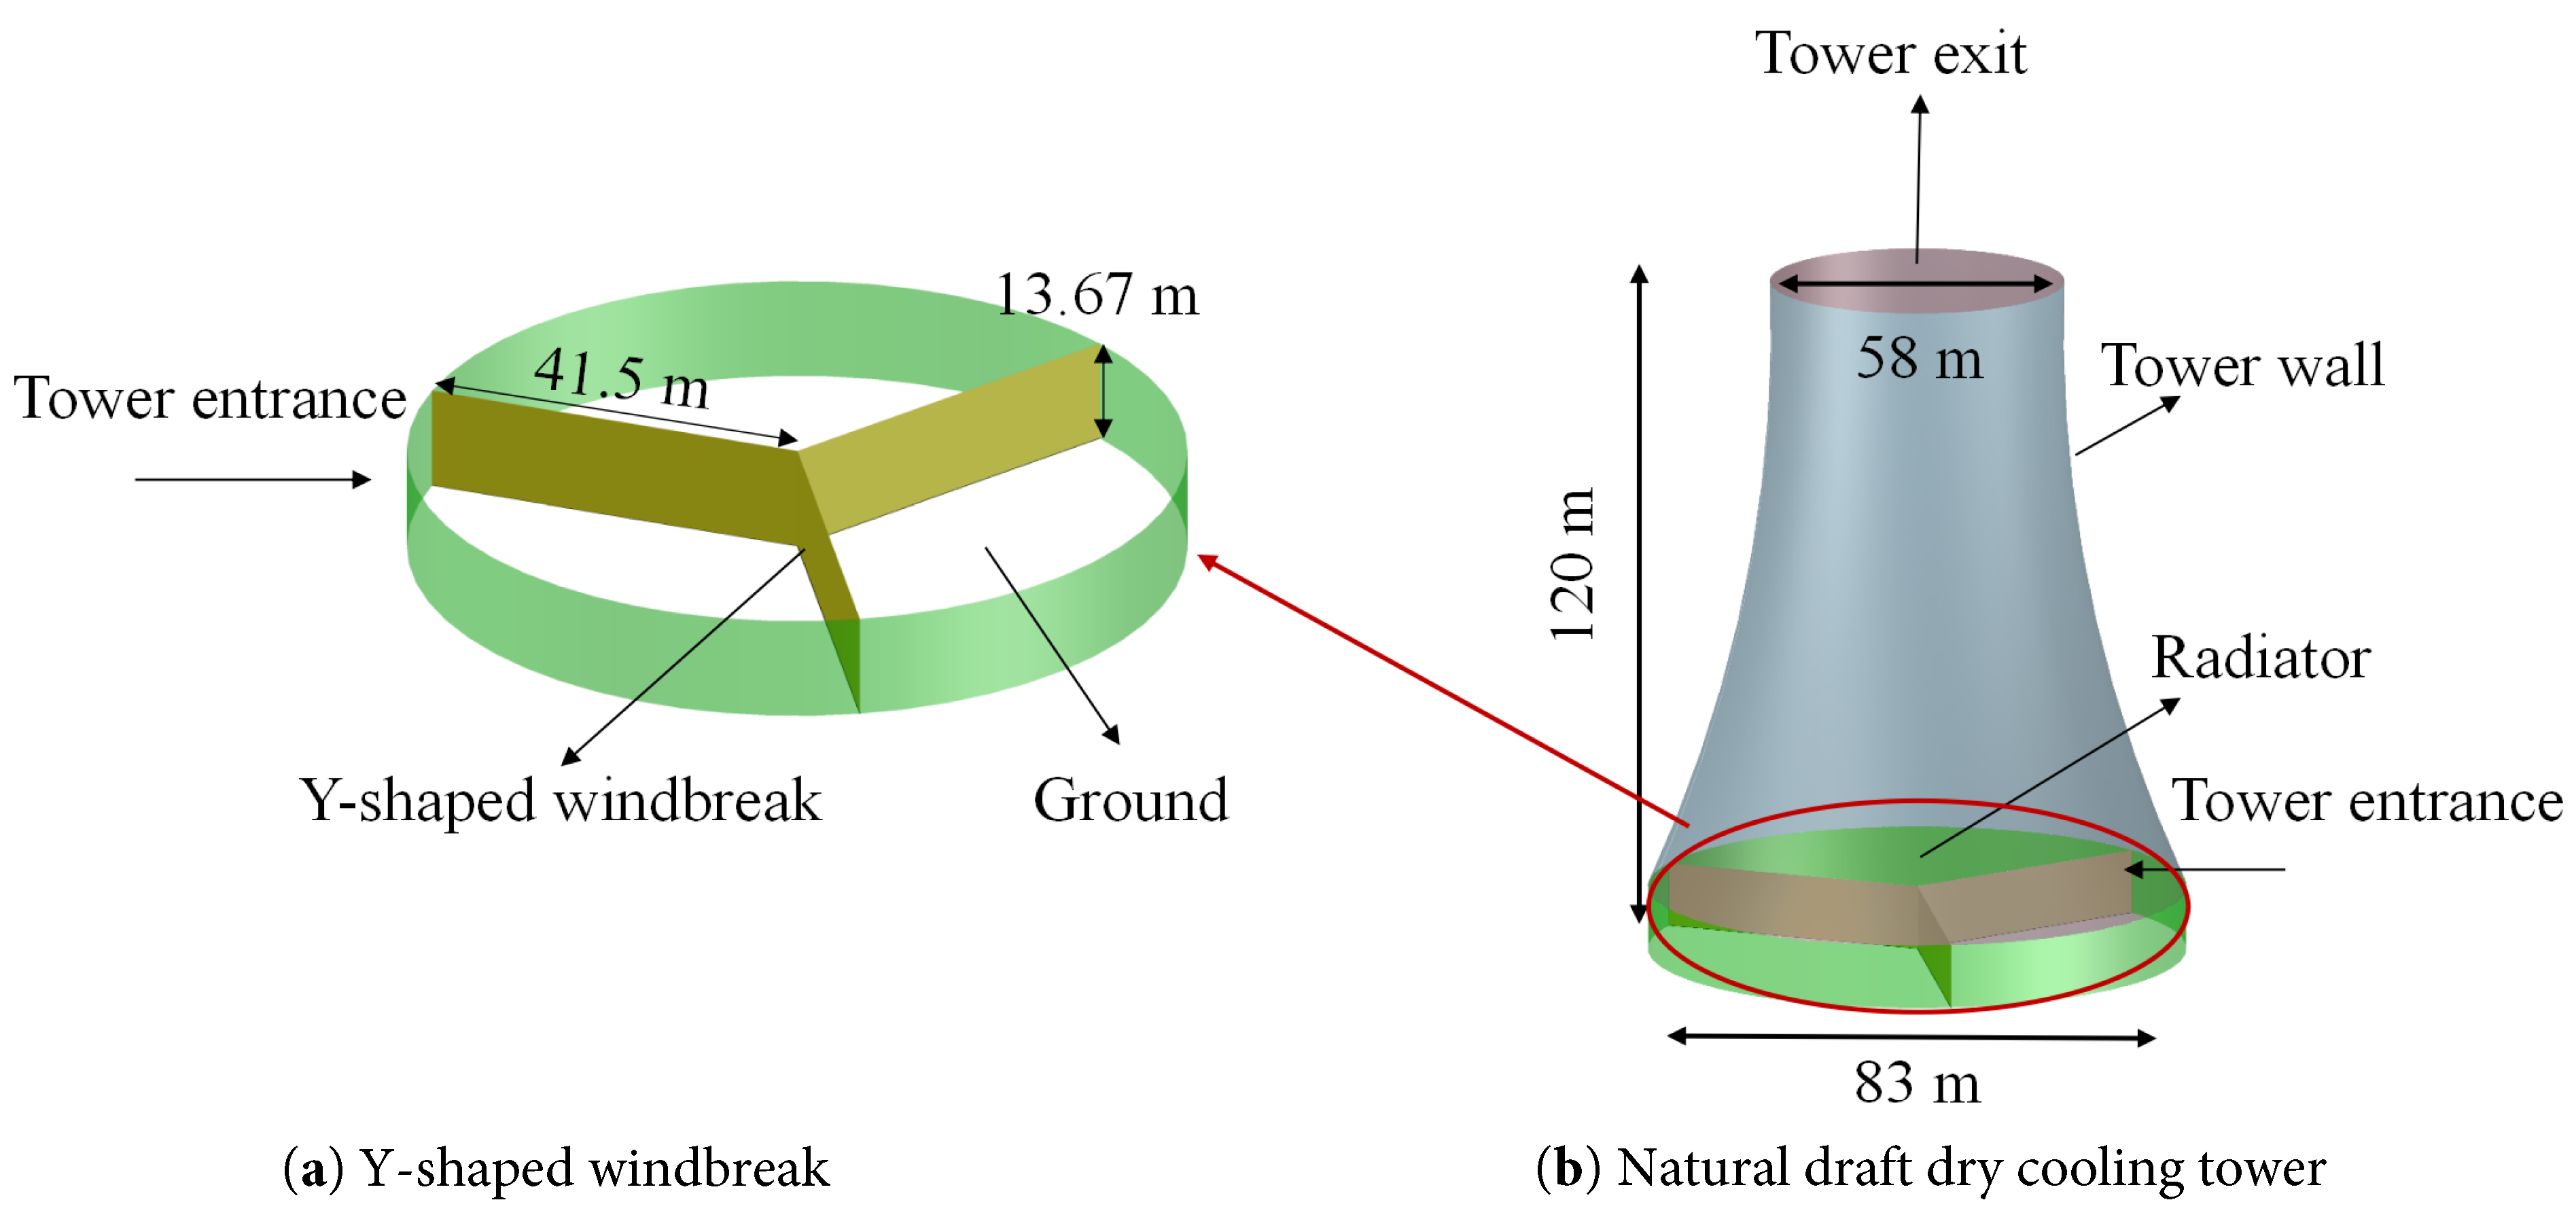
Figure 1: Geometric model of the NDDCT installed with the Y-shaped windbreak [24].
A three-dimensional model of the NDDCT installed with the Y-shaped windbreak was developed [27]. The parameters of the NDDCT and the radiator are presented in Table 1. The radiator is arranged inside the tower, and the height of the Y-shaped windbreak equals to the height of the tower’s inlet. The reason why the other parameters were fixed during simulation, taking the ambient temperature and humidity for example, is because these conditions are typical-extreme operating conditions of the NDDCT. NDDCTs usually operate in hot and dry regions. For a NDDCT, if it performs well under typical-extreme operating conditions, the NDDCT will perform well in other conditions. Besides, the current study is to investigate the feasibility of the three novel windbreaks. It is better to do comparative study between the three novel windbreaks and the existing Y-shaped windbreak under the same environmental conditions. Essentially, the effect of environmental conditions on the performance of pre-cooled NDDCTs was studied in our previous study [28], and found that both the ambient temperature and humidity affect the tower’s performance. This is similar to the tower’s dimensions and the heat exchanger’s design.
The primary impact of ambient humidity on the NDDCT manifests in the alteration of air density. Thermodynamically, at a constant temperature and pressure, moist air exhibits a lower density compared to dry air due to the lower molecular weight of water vapor. In the present numerical model, the airflow is driven by the buoyancy force resulting from the density differential between the ambient air and the air within the tower. To accurately capture this phenomenon, the density of the intake air was calculated based on the state equation for moist air, as described by Kröger [27]. The density of moist air
Table 1: Parameters of the NDDCT and the Y-shaped windbreak [27].
| Items | Parameters | Value and Unit |
|---|---|---|
| Natural draft dry cooling tower | Tower height | 120 m |
| Height of Y-shaped windbreak | 13.67 m | |
| Height of air inlet | 13.67 m | |
| Inlet diameter | 83 m | |
| Outlet diameter | 58 m | |
| Radiator | Layout pattern | Type A |
| Layout height | 13.67 m | |
| Layout type | Finned tube radiator | |
| Number of pipe rows | 4 | |
| Pipe length | 15 m | |
| Effective length | 14.40 m | |
| Operating parameters | Effective frontal area | 4625.34 m2 |
| Circulating water flow | 4390 kg/s | |
| Inlet water temperature | 61.45°C | |
| Ambient temperature | 40°C | |
| Ambient humidity | 40% |
The parameters of the NDDCTs installed with the three novel windbreaks are consistent with those listed in Table 1. Fig. 2 shows a geometric model of the NDDCT installed with the three novel windbreaks and schematic of the airflow streamlines at the tower inlet under no crosswind conditions. Specifically, Fig. 2a depicts one curved windbreak arranged on the windward side of the tower inlet, referred to as the single-windbreak configuration with curved profile in this study. Fig. 2b illustrates one curved windbreak on the windward side and another at the tower center, named as the double-windbreak configuration with curved profile. Fig. 2c presents a curved windbreak on the windward side and another on the leeward side, named as the double-windbreak configuration with inverted curved profile. Fig. 3 provides a detailed 3D view of the single-windbreak configuration with curved profile, double-windbreak configuration with curved profile, and double-windbreak configuration with inverted curved profile to clearly demonstrate their curvature characteristics. Since the three novel windbreaks are proposed for the first time in this study, their design was derived from the aerodynamic flow analysis of the tower inlet. The primary design objective was to mitigate the through-draught flow caused by crosswinds, where air passes directly from the windward to the leeward side at the tower bottom without passing through the heat exchanger. To address this problem, the windbreak shapes were designed to align with the tower’s inlet airflow field. As illustrated in Fig. 2d, the inlet airstream follows an upward-tilted trajectory due to the buoyancy drive. Consequently, the proposed windbreaks utilized a curved geometry that conforms to this streamline, aiming to extend the effective inlet path and minimize aerodynamic resistance compared to vertical plates. As for the single-windbreak configuration with curved profile, it was proposed to use one curved shape to minimize the through-draught flow caused by the crosswind. The through-draught flow will impair the cooling performance of the NDDCT and it should be avoided. As for the double-windbreak configuration with curved profile, the first curved shape at the crosswind speed direction is to minimize the through-draught flow from the middle to the top height of the tower inlet. In addition, the second curved shape is to minimize the through-draught flow from the bottom to the middle height of the tower inlet. Two curved shapes were considered in order to make the air distribution more uniform. As for the double-windbreak configuration with inverted curved profile, the first curved shape at the crosswind speed direction is to minimize the through-draught flow from the middle to the top height of the tower inlet. Simultaneously, the second curved shape is to minimize the through-draught flow from the bottom to the middle height of the tower inlet. The first curved shape is designed in accordance with the tower inlet airflow field at the upwind direction while the second curved shape is designed in accordance with the tower inlet airflow field at the downwind direction. Two curved shapes were considered in order to make the air distribution more uniform. However, these windbreak shapes may have the limitations at full scale applications, e.g., large structural dimensions, difficult to install and construct, and have to consider the impact of strong winds on their structural strength. The optimization study will be carried out in the future with considering the variations of the curvature, constructability, material requirements and operational cost to provide guidance for engineering application. Therefore, the current study will employ simulation method to analyze the effects of the novel windbreaks on the air temperature distributions, air velocity distributions, ventilation rate and heat rejection rate of the NDDCT, aiming to determine the influence of the novel windbreaks on the performance of the cooling tower in a crosswind environment, and to obtain their initial feasibility of application. Besides, comparative study between the three novel windbreaks and the existing Y-shaped windbreak will be carried out to evaluate their feasibility.
In terms of practical construction and installation, the proposed windbreaks are designed as self-supporting structures independent of the cooling tower shell, adopting structural design principles for tall windbreak panels that utilize independent steel supports and concrete foundations to manage wind-induced loads [29]. Specifically, the windbreaks can be constructed using a steel truss framework covered with color-coated steel plates to form the specific curved surfaces. The steel columns of the framework are anchored to an independent reinforced concrete strip foundation located at the periphery of the tower inlet using high-strength anchor bolts. This fixation method effectively resists the overturning moments caused by strong crosswinds and prevents vibration transmission to the main cooling tower structure, which aligns with the standard design principles for windbreak panels.
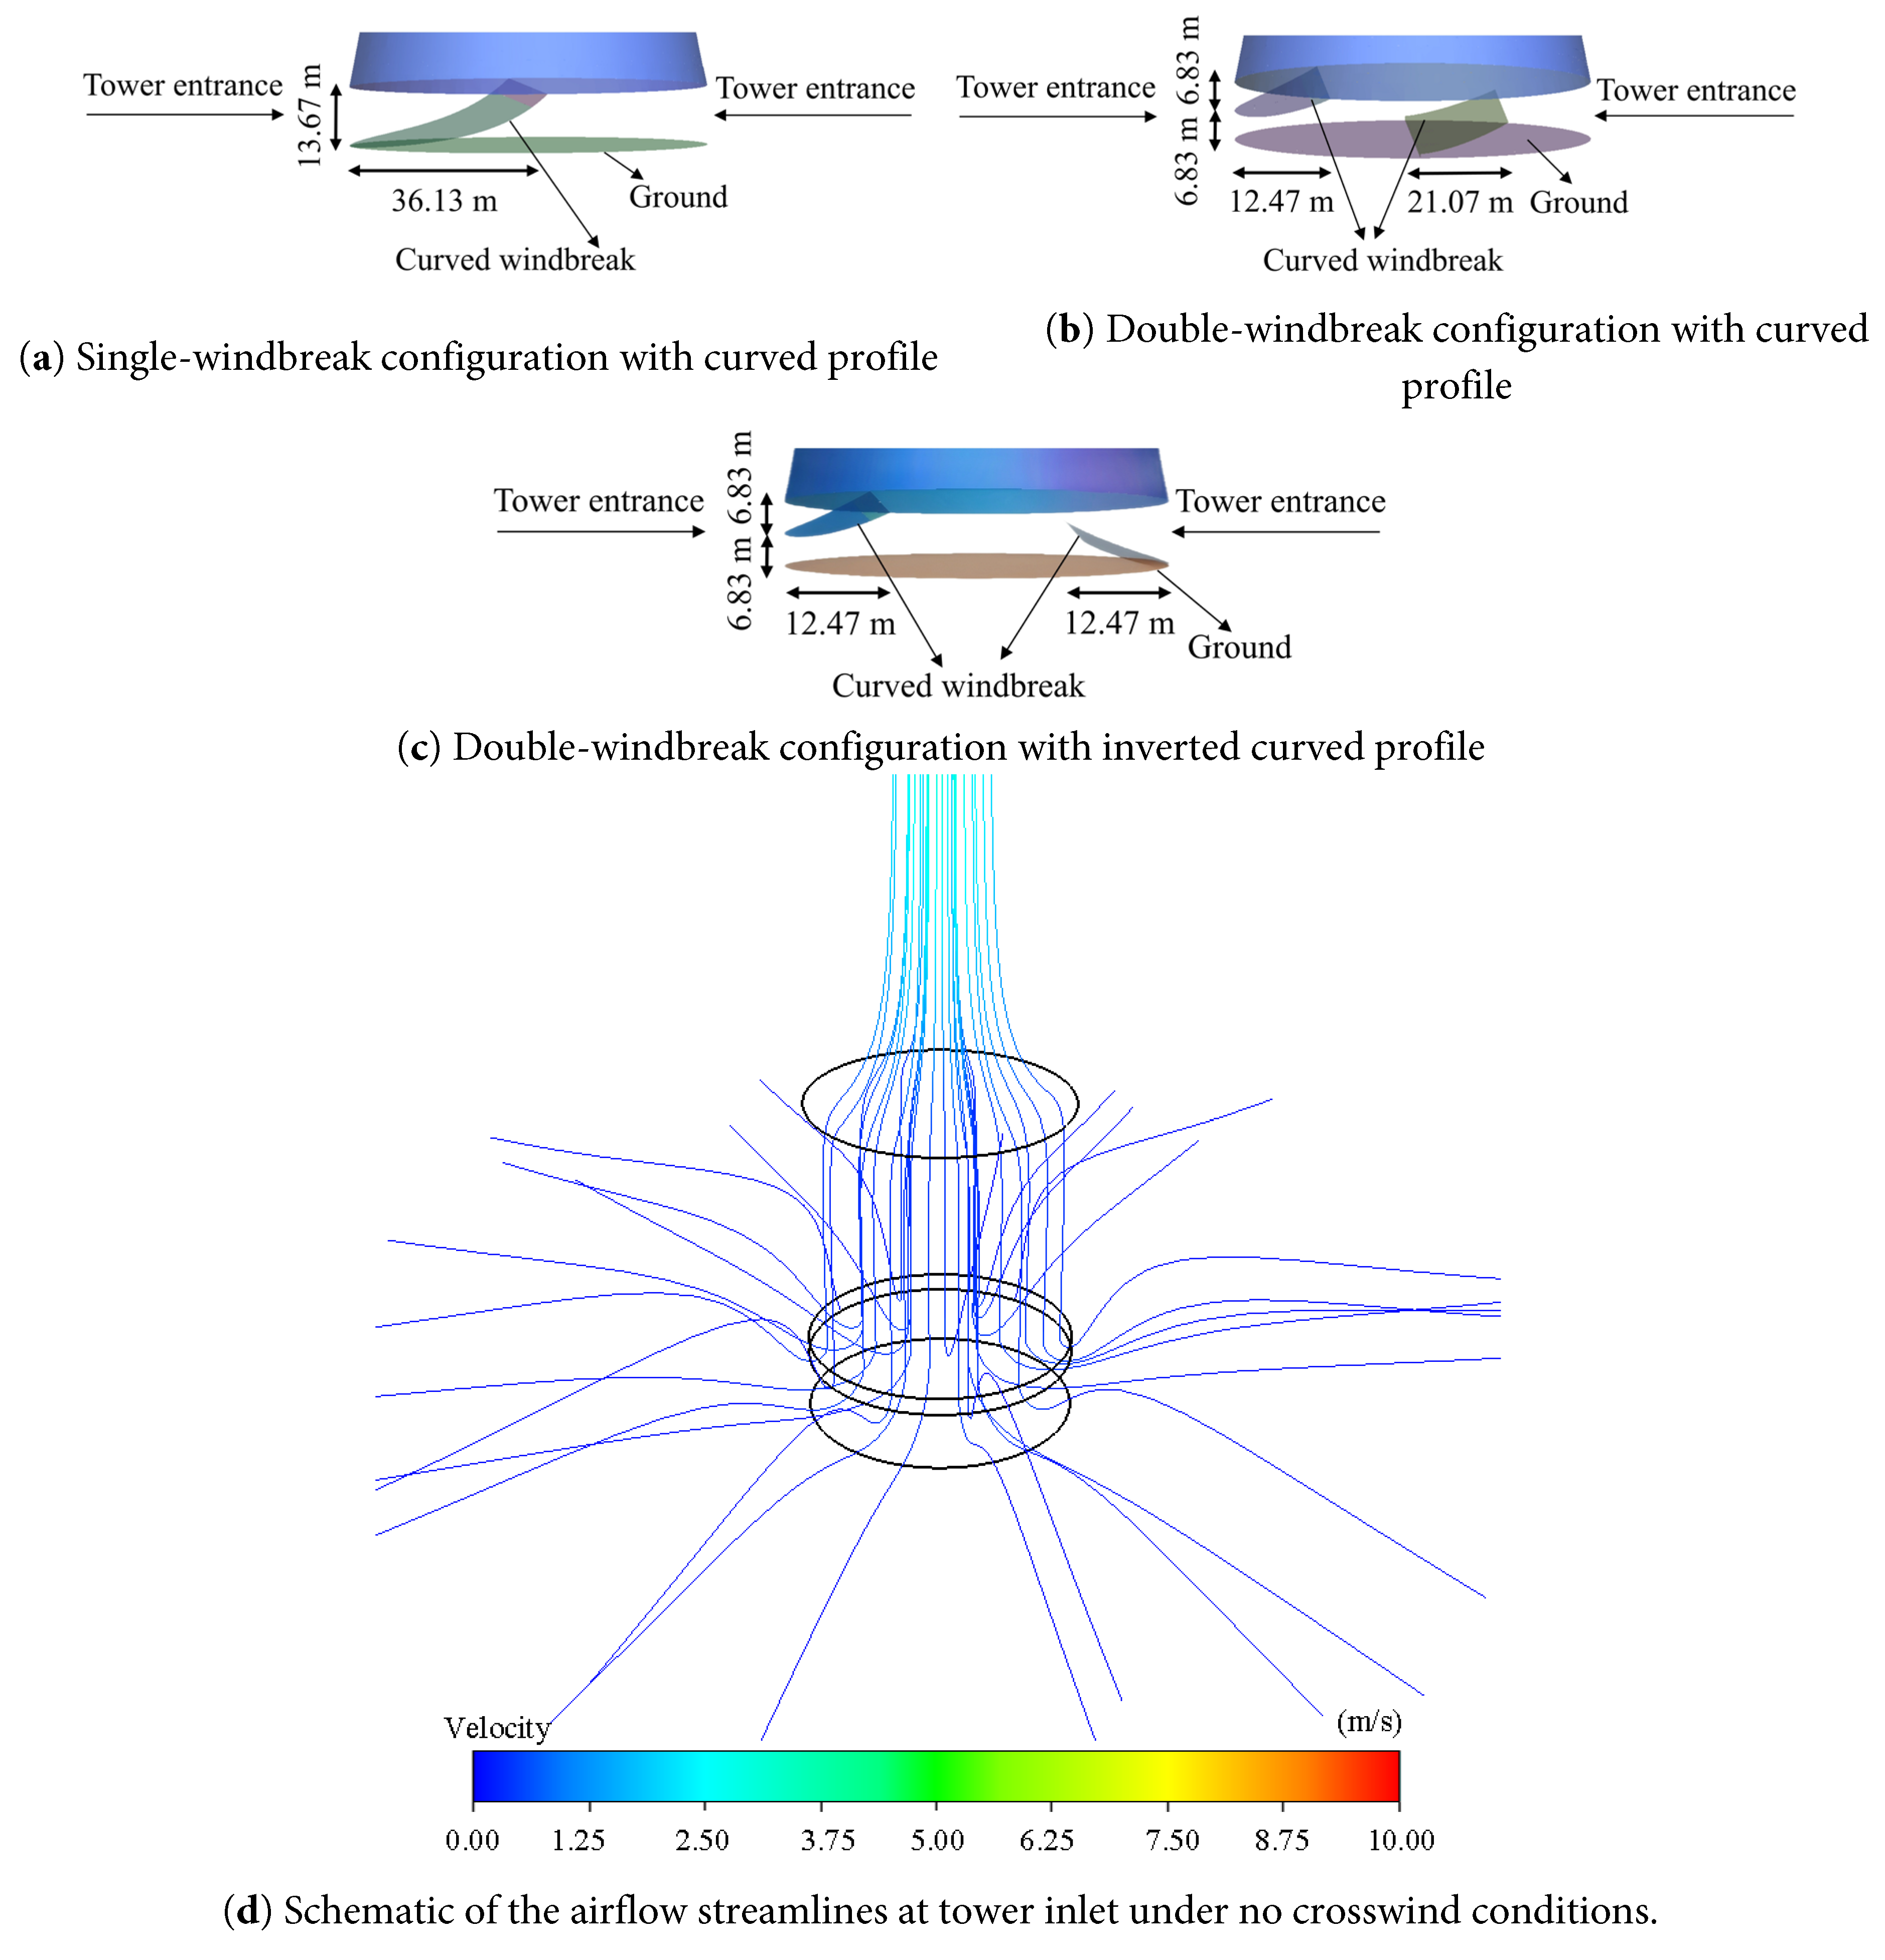
Figure 2: Geometric models of the NDDCT installed with the three novel windbreaks. Adapted with permission from [26]. Copyright 2013, Elsevier.
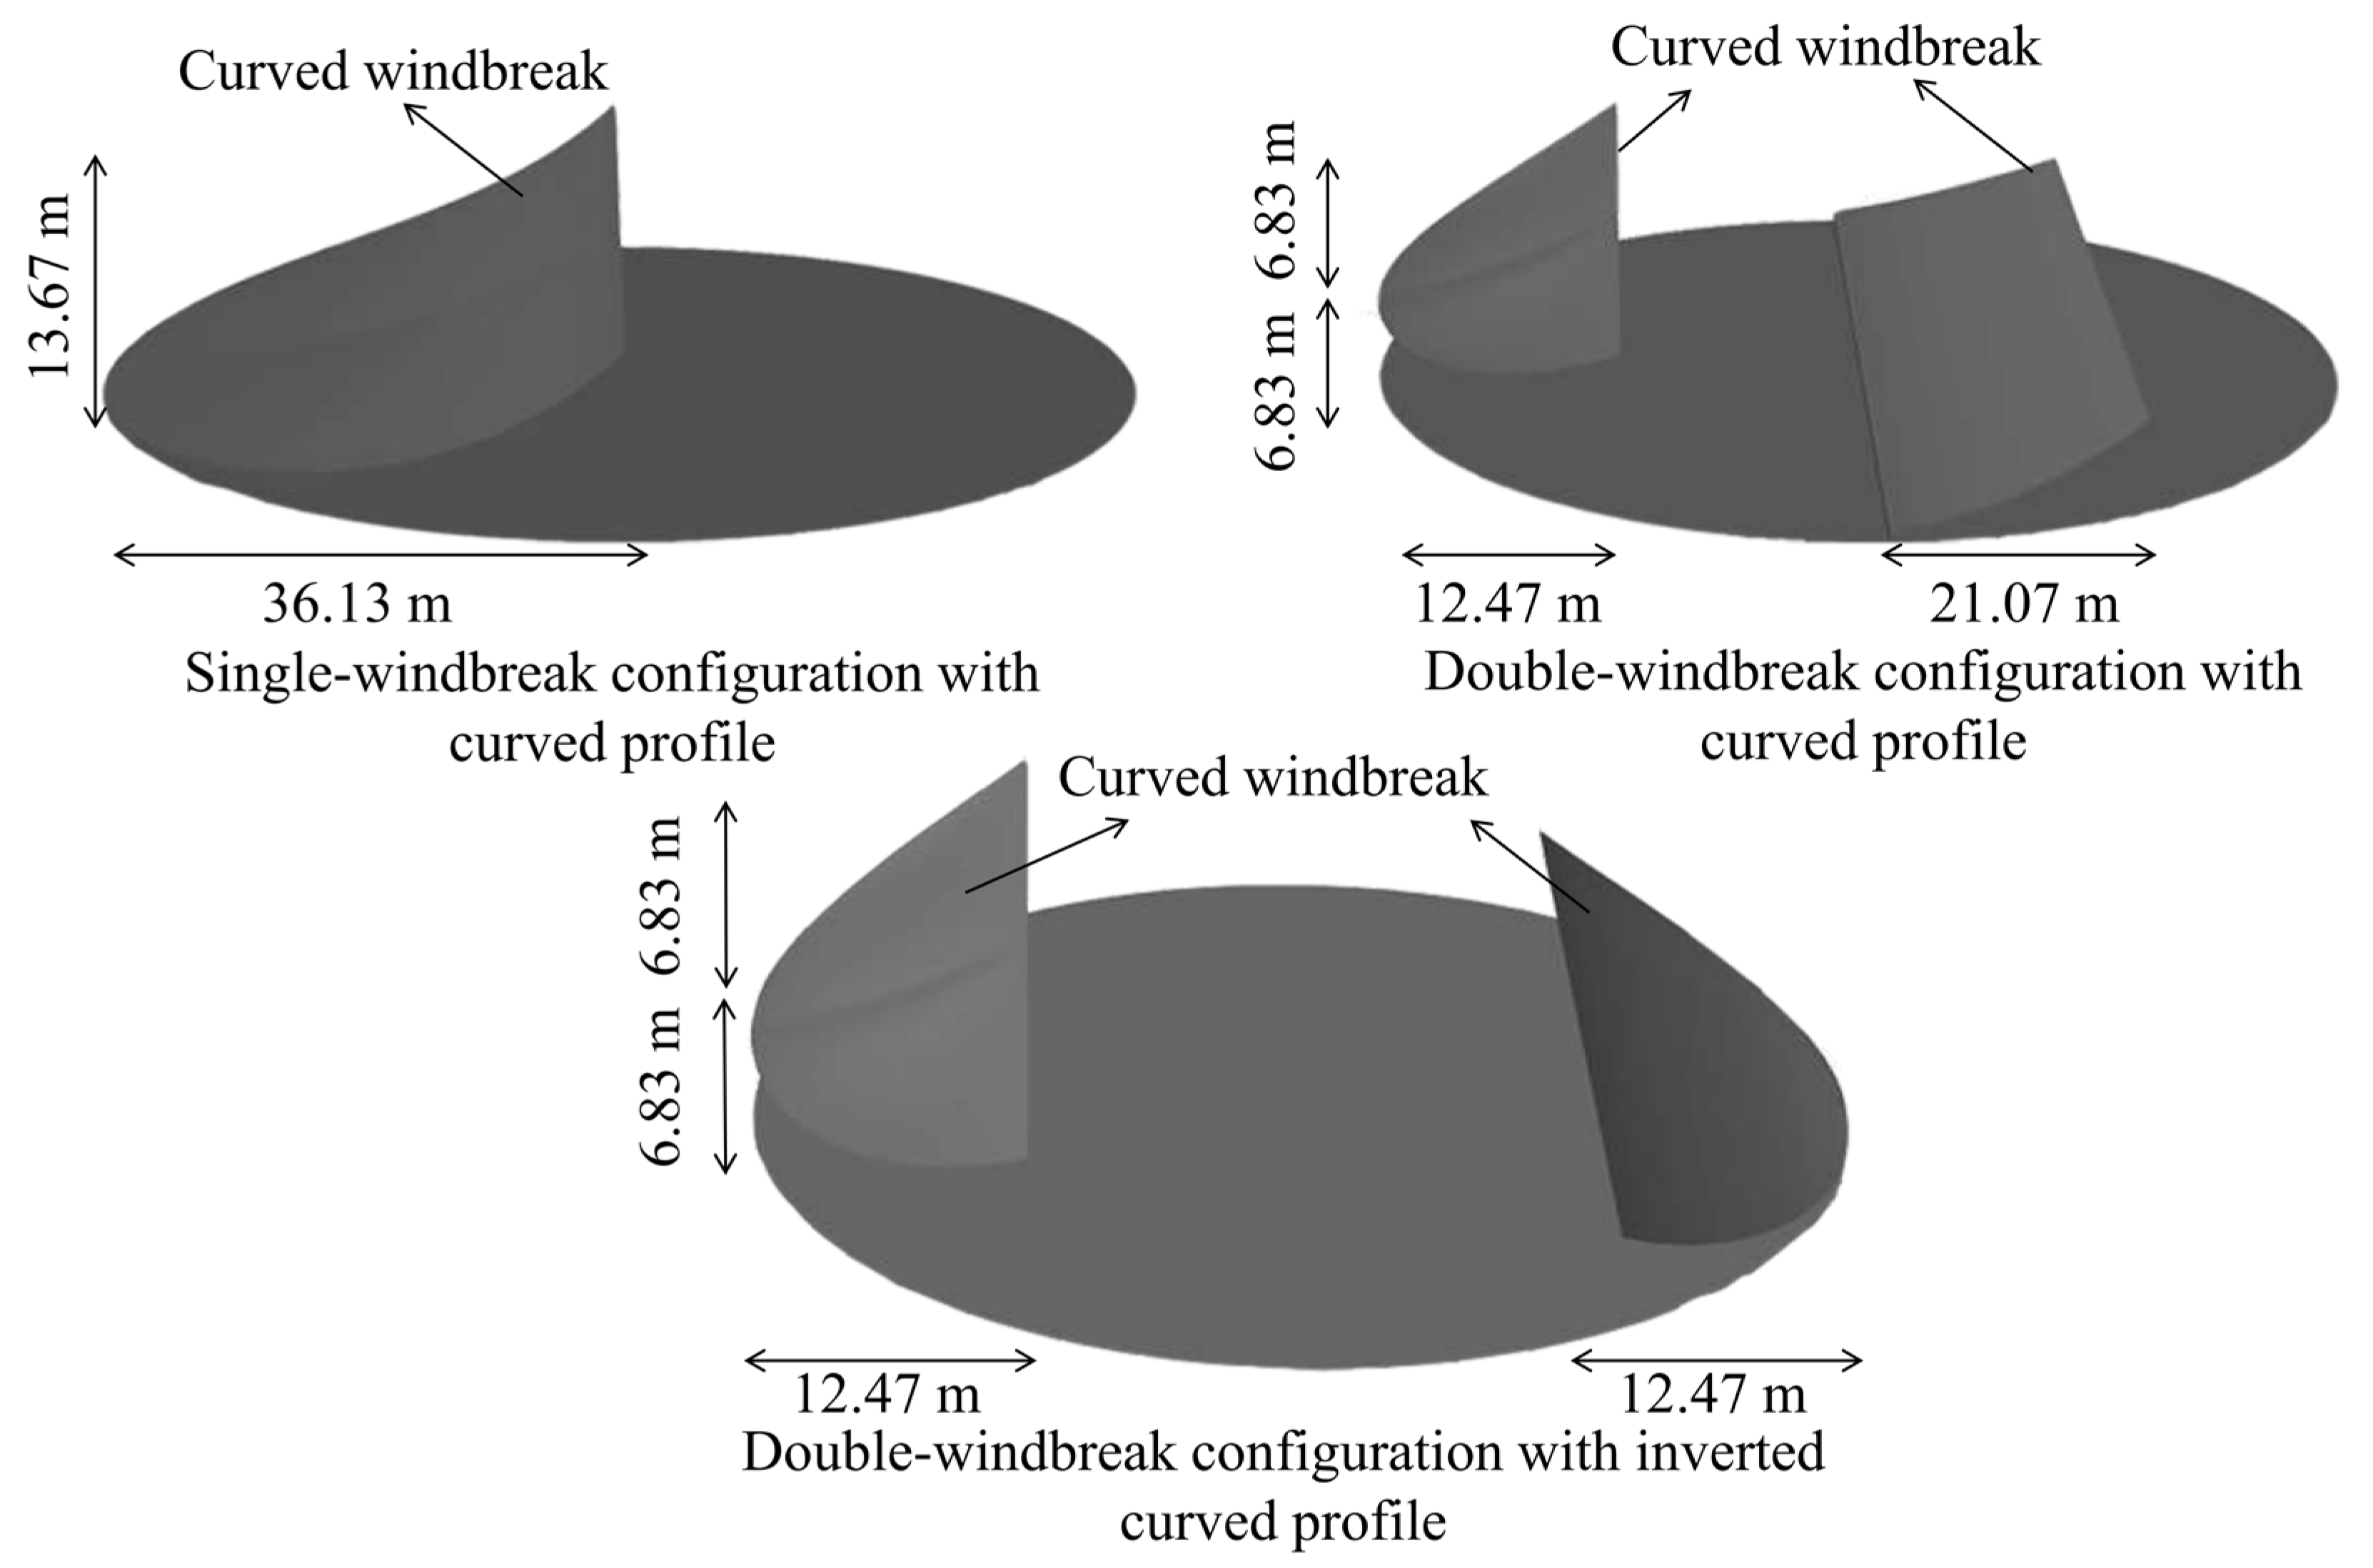
Figure 3: The detailed 3D view of the three novel windbreaks.
In the NDDCT, no fans are required as the air flowing through the radiator tube bundle is driven by buoyancy effect. The difference in air density between the inside and outside the tower, which is due to the air temperature difference between the inside and outside the tower, generates the buoyancy force. The operation of the NDDCT needs to satisfy both the draft equation and the energy equation.
As for the draft equation, the total pressure drop by each part of the tower is balanced by the buoyancy force. Therefore, the draft equation is presented in Eq. (1) [27].
The energy equation is presented in Eq. (2) [30].
As mentioned above, the current study only performs steady-state analyses and no transient simulation will be performed. Therefore, air was treated as a steady, incompressible ideal gas during simulation. The main objectives of the current study are to compare the performance improvement effects of the three proposed windbreaks with the existing Y-shaped windbreak. Therefore, the current study mainly focuses on the overall performance prediction. Besides, the computational dimension of the NDDCT is large and requires efficient computation. The standard k-ε model provides a stable and efficient method for comparative analysis and fits the requirements of the current study well. What’s more, many publications about NDDCT study validated that the standard k-ε model can provide sufficiently accurate predictions of these global integral performance metrics (e.g., ventilation and heat rejection rates in the current study) for comparative studies just like the current study [18,31].
The general conservation equations describe the fundamental behavior of fluid flow and heat transfer. However, to accurately represent the specific system situation of the NDDCT studied herein, these general equations are simplified based on the appropriate coordinate system and boundary conditions derived from the geometric model in Fig. 4. The simplification process is conducted according to the following specific approximations: (1) considering the three-dimensional asymmetric flow caused by crosswinds, a three-dimensional Cartesian coordinate system is adopted instead of a two-dimensional or axisymmetric model; (2) since the study focuses on the stable operational performance of the NDDCT, the time-dependent terms in all governing equations are eliminated; (3) the airflow is driven by the density difference (buoyancy effect). Therefore, while the air is treated as an incompressible ideal gas, the gravitational body force term is explicitly retained in the momentum equation to account for the natural draft. Based on these simplifications, the specific governing equations for the present study are expressed as follows [32]:
In the derivation of the standard k-ε model, the assumption is that the flow is fully turbulent. Furthermore, the effects of molecular viscosity are negligible. The standard k-ε model is therefore valid only for fully turbulent flows. This model is adopted to characterize the flow regime through the tower and radiator bundles. The turbulence kinetic energy, k, and its rate of dissipation, ε, are obtained from the following transport equations [33]:
The current study focuses on dry cooling tower; there is no mass transfer in dry cooling tower. Therefore, the heat exchanger was treated as radiator model to simulate the heat transfer in dry cooling tower. This method is frequently used in dry cooling tower simulations, e.g., the references [23,26]. The radiator model in the ANSYS Fluent simplifies an actual finned tube radiator as a zero-thickness surface with resistance coefficient and heat transfer coefficient, ignoring the temperature difference along the height of the actual finned tube radiator. Despite this limitation, the focus of this study is to compare the performance improvement effects of the three proposed windbreaks with the existing Y-shaped windbreak. Therefore, this limitation of the radiator model is acceptable and will not affect the results too much.
The radiator model was treated as a zero-thickness surface, and the heat transfer processes and flow resistance are described by Eqs. (10) and (11), respectively [26].
In the simulation of NDDCTs, the radiator surface temperature (Tr) can be calculated as
The empirical formulas for the heat transfer coefficient and resistance coefficient are reported in Eqs. (12) and (13), respectively [27].
To characterize the flow and heat transfer behaviors, key dimensionless parameters are defined in this study. The Reynolds number, which determines the flow regime through the radiator bundles, is calculated as:
The Nusselt number represents the ratio of convective to conductive heat transfer and is given by:
The pressure coefficient used to analyze the pressure distribution on the tower surface is defined as:
In this study, the standard k-ε model is adopted to simulate turbulence, and the near-wall treatment is based on the research of Launder et al.’s study [37], utilizing standard wall functions. This approach bridges the viscosity-affected region between the wall and the fully turbulent core using the semi-empirical formulas known as the law of the wall. The dimensionless wall distance is monitored to ensure appropriate wall treatment for the turbulence model:
Specifically, the dimensionless velocity is defined by the logarithmic law:
Similarly, the temperature distribution is governed by the Reynolds analogy between momentum and energy transfer, described by the logarithmic law for mean temperature:
These formulations allow the solver to efficiently compute the wall shear stress and heat transfer rates without resolving the viscous sublayer directly.
To ensure the validity of the Standard Wall Functions, the first-layer mesh height was rigorously selected. According to the ANSYS Fluent Theory Guide [33], the first grid node must be located within the logarithmic region of the boundary layer, which typically requires the non-dimensional wall distance y+ to be in the range of 30 < y+ < 300. In this study, simulation checks confirmed that the y+ values on key walls (e.g., the radiator and tower shell) mainly fell within the valid range of 30 to 300, ensuring the accuracy of the near-wall simulation.
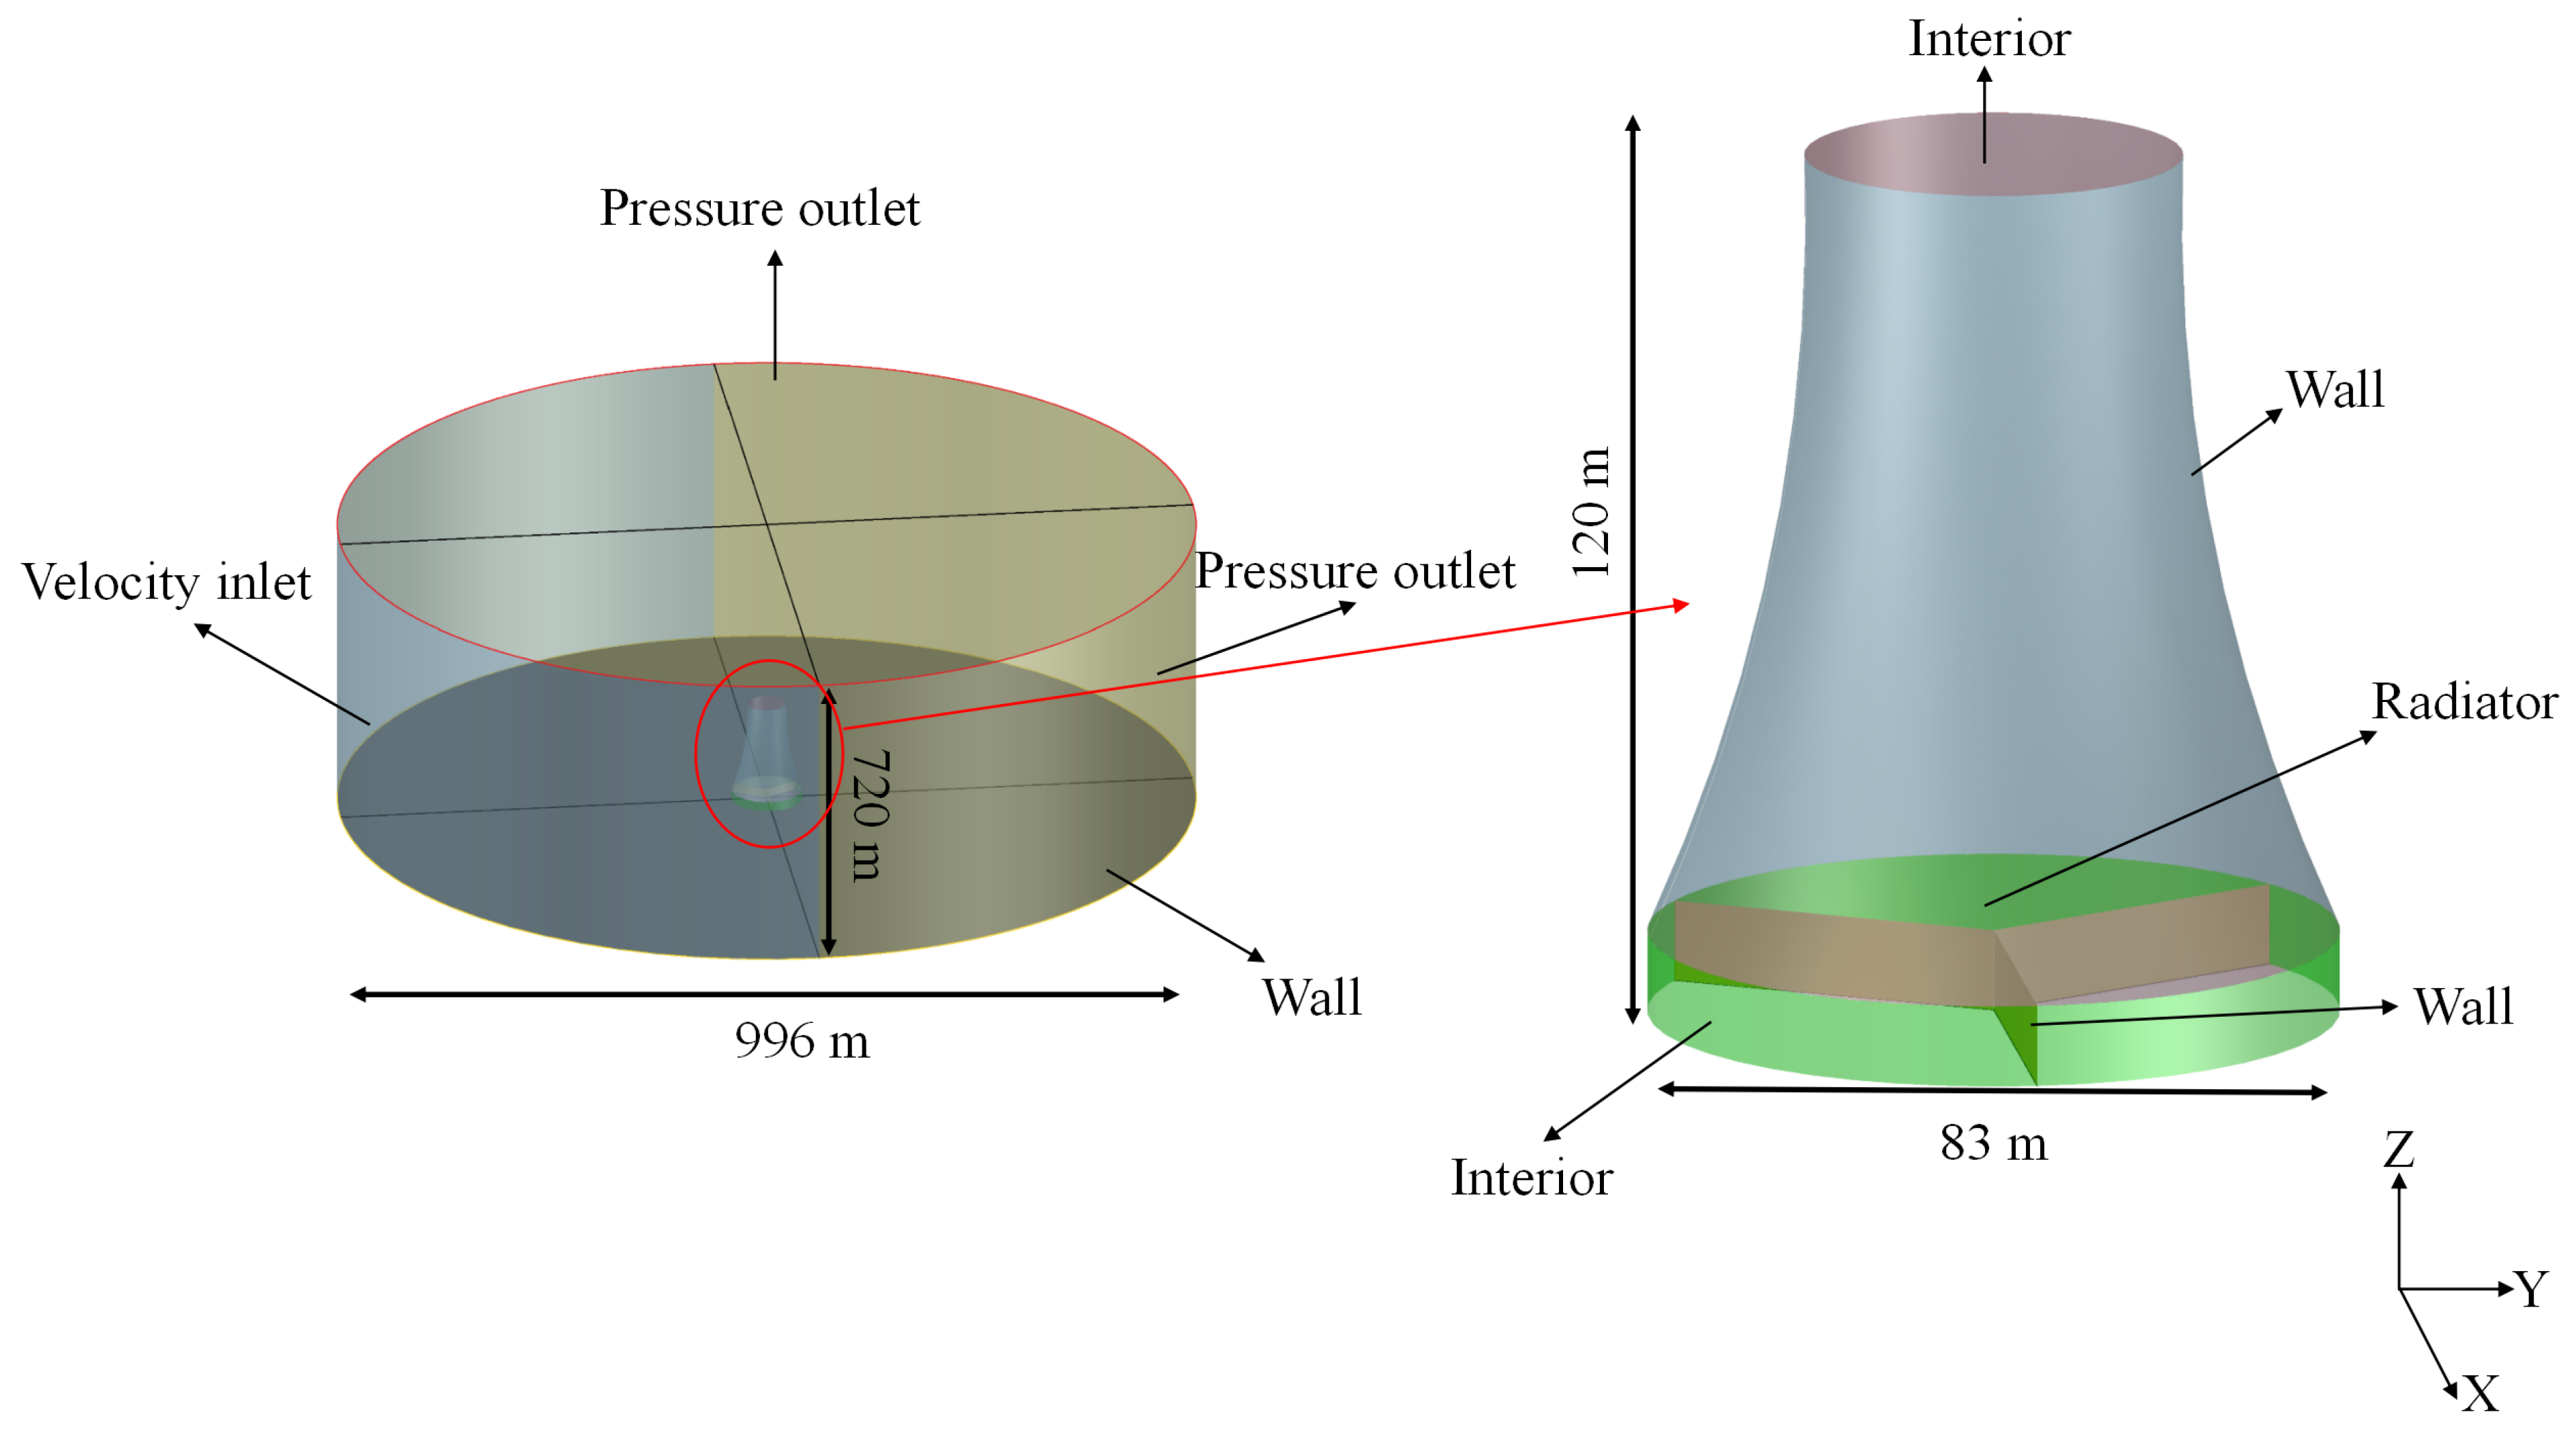
Figure 4: Computational domain and boundary conditions (under crosswind condition).
The airflow field around the cooling tower was highly susceptible to the influence of surrounding environmental factors, the computational domain around the cooling tower was set to be 12 times the diameter of the tower and 6 times its height [38]. As a result, the height of the computational domain is 720 m while the diameter of the computational domain is 996 m.
The selection of boundary conditions is strictly determined by the physical driving forces and environmental characteristics to ensure simulation accuracy. For the windward boundaries, the setting depends on the absence and presence of crosswind. In the absence of crosswind, the airflow is solely driven by the buoyancy-induced pressure differential; thus, the windward side was set as a pressure inlet to allow natural air intake. Conversely, in the presence of crosswind, the tower was subjected to the atmospheric boundary layer effect. Consequently, the windward side was set as a velocity inlet. The profile of the inlet x-velocity as U obeys the power law defined by Eq. (20) [39] while the other two velocity components V and W equal to 0. The crosswind speed at different heights was defined through the User-Defined Function (UDF). This was achieved by loading different UDFs in the ANSYS Fluent with the direction of the crosswind paralleling to the ground. In practice, the crosswind speed varies with the tower’s height. This power law was adopted to describe the crosswind speed, which is consistent with the reality. This approach yields more accurate results when compared with using the average crosswind speed for simulation. The power law of the crosswind speed with the height is presented in Eq. (20).
Zref and vref are determined based on the standard meteorological definitions to ensure the physical validity of the atmospheric boundary layer simulation. Zref is set to 10 m. This value is selected in accordance with the World Meteorological Organization standard [40], which stipulates that the standard height for surface wind speed measurement is 10 m above open ground. vref corresponds to the crosswind speed at the reference height. In this study, vref serves as the independent variable for different crosswind cases. These values represent the wind speeds measured at the standard 10 m height, which are then used to generate the vertical wind profile vcw via the power law.
For the flow exit regions, including the leeward side and the top of the computational domain, the pressure outlet boundary condition was applied. This setting reflects the physical reality that the domain extends sufficiently far (12 times the tower diameter) into the open atmosphere, where the influence of the tower plume becomes negligible and the static pressure recovers to the ambient level. Regarding the solid structures, such as the ground, tower wall, and windbreaks, a wall boundary condition with a no-slip shear constraint was applied, reflecting the viscous nature of the airflow over fixed surfaces. These walls are also treated as adiabatic, assuming no heat exchange with the surroundings except for the radiator zone. This simplification is justified because the heat transfer rate through the tower shell and ground is orders of magnitude lower than the massive heat rejection at the radiator. Similar assumptions have been widely adopted in previous numerical studies [23,26], which demonstrated that the impact of ignoring wall heat transfer on the overall cooling performance is negligible. Finally, the inlet and outlet of the tower are designated as interior boundary to ensure the continuity of mass, momentum, and energy transmission across the mesh zones. The boundary conditions are illustrated in Fig. 4.
It is important to note that the windbreaks in the present study are modeled as impermeable thin walls. Consequently, their effects are implemented through boundary conditions rather than by introducing source terms into the governing equations. Specifically, a no-slip stationary wall boundary condition is applied to the windbreak surfaces for the momentum equations. For the energy equation, these surfaces are defined as adiabatic boundaries, assuming no heat exchange across them. For the turbulence equations, standard wall functions are adopted to resolve the near-wall turbulence quantities on the windbreak surfaces.
The grid generation method in this study was customized according to geometric complexity. For the NDDCT installed with the Y-shaped windbreak, fully structured hexahedral meshes were adopted, while hybrid mesh strategies were employed for the NDDCT installed with three novel windbreaks. Specifically, the internal tower region (i.e., radiator and its above) used structured meshes to ensure the boundary layer resolution on the radiator surface. The air inlet region of the cooling tower adopted unstructured polyhedral meshes to conform to curved geometries with local flexible encryption. The computational domain used structured meshes. The generated grids are depicted in Fig. 5 and Fig. 6.
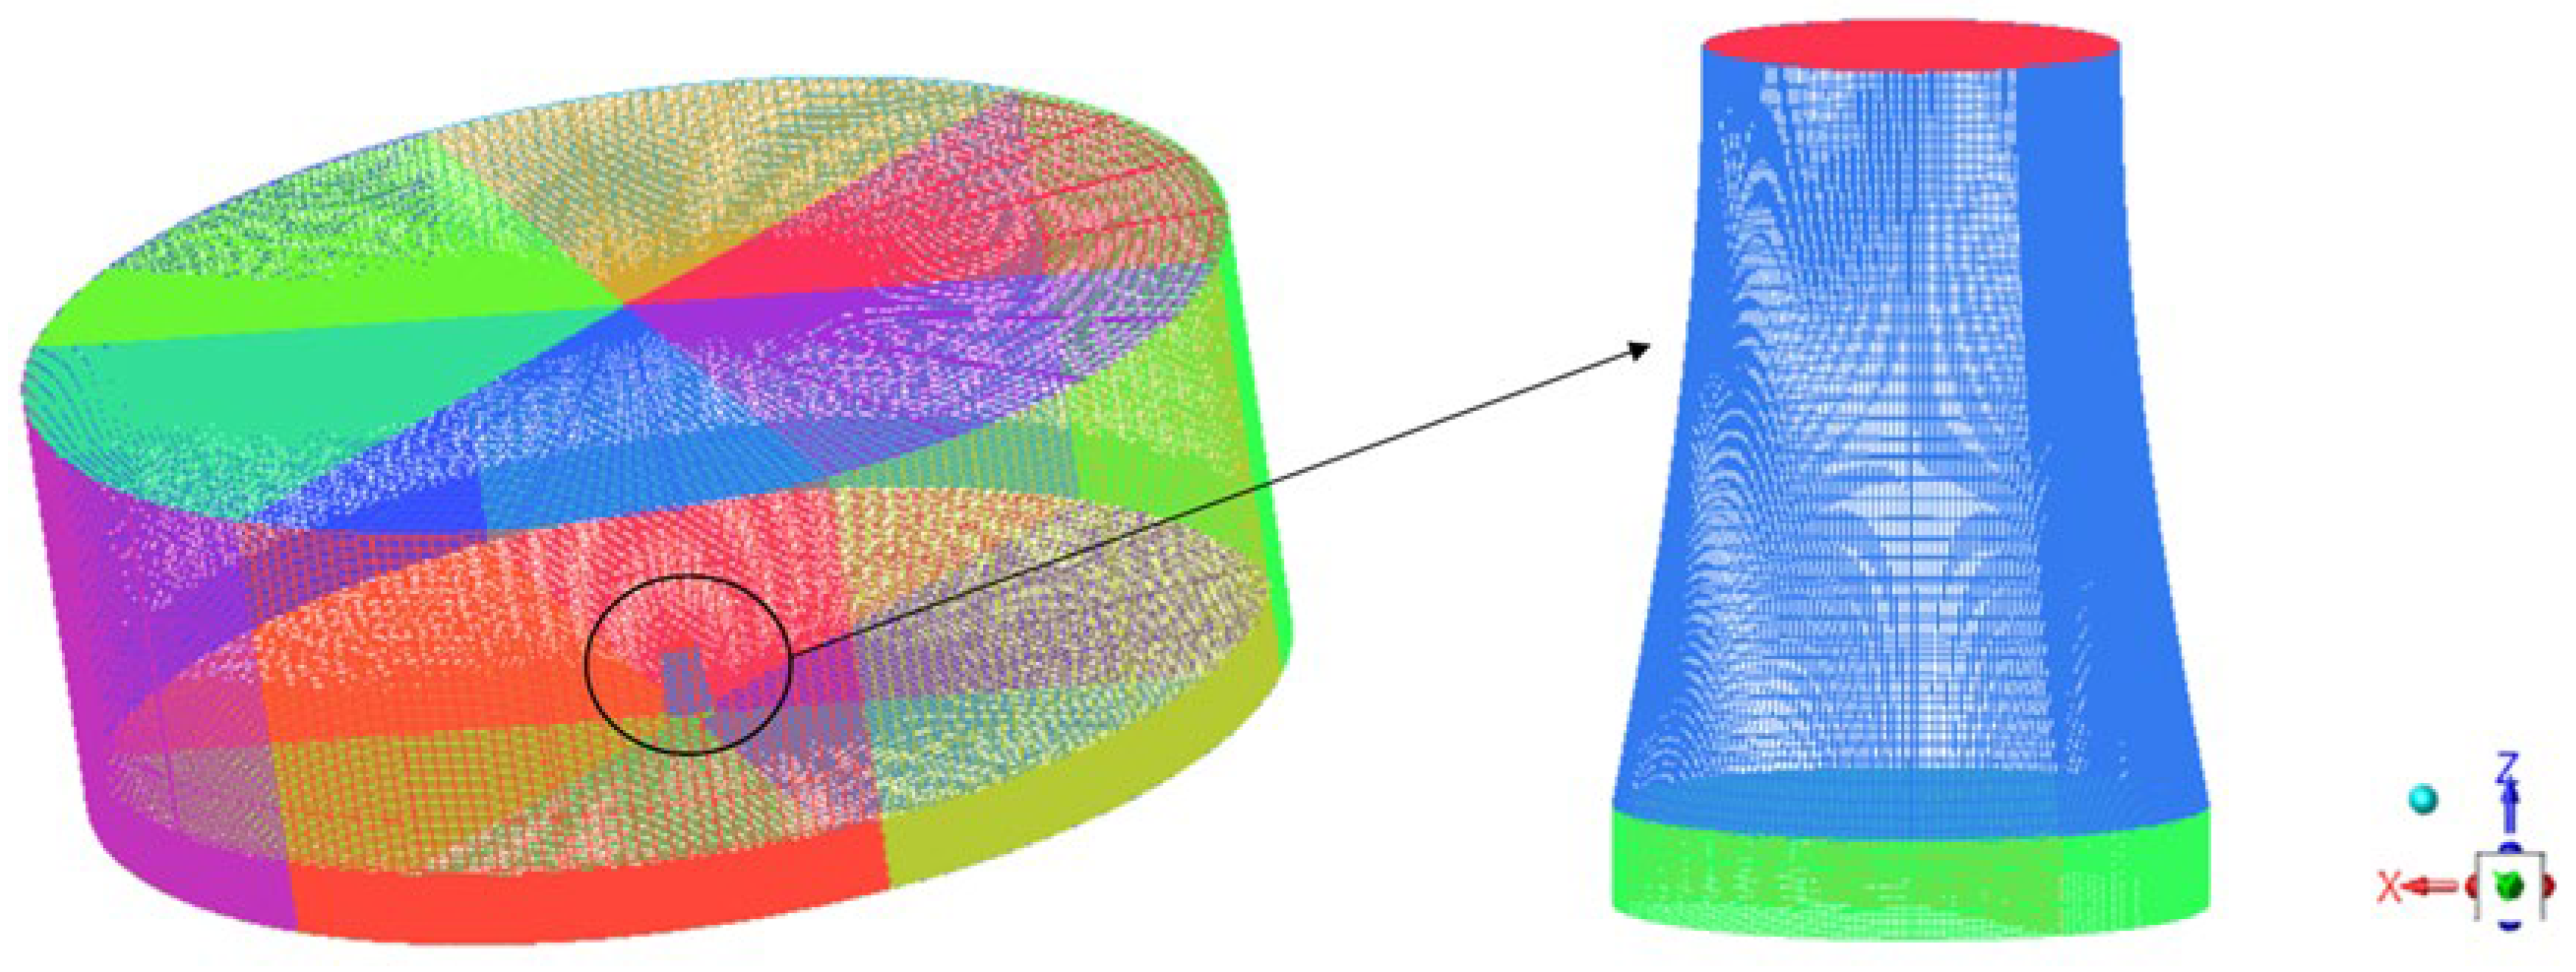
Figure 5: Grid generation of the NDDCT installed with the Y-shaped windbreak.
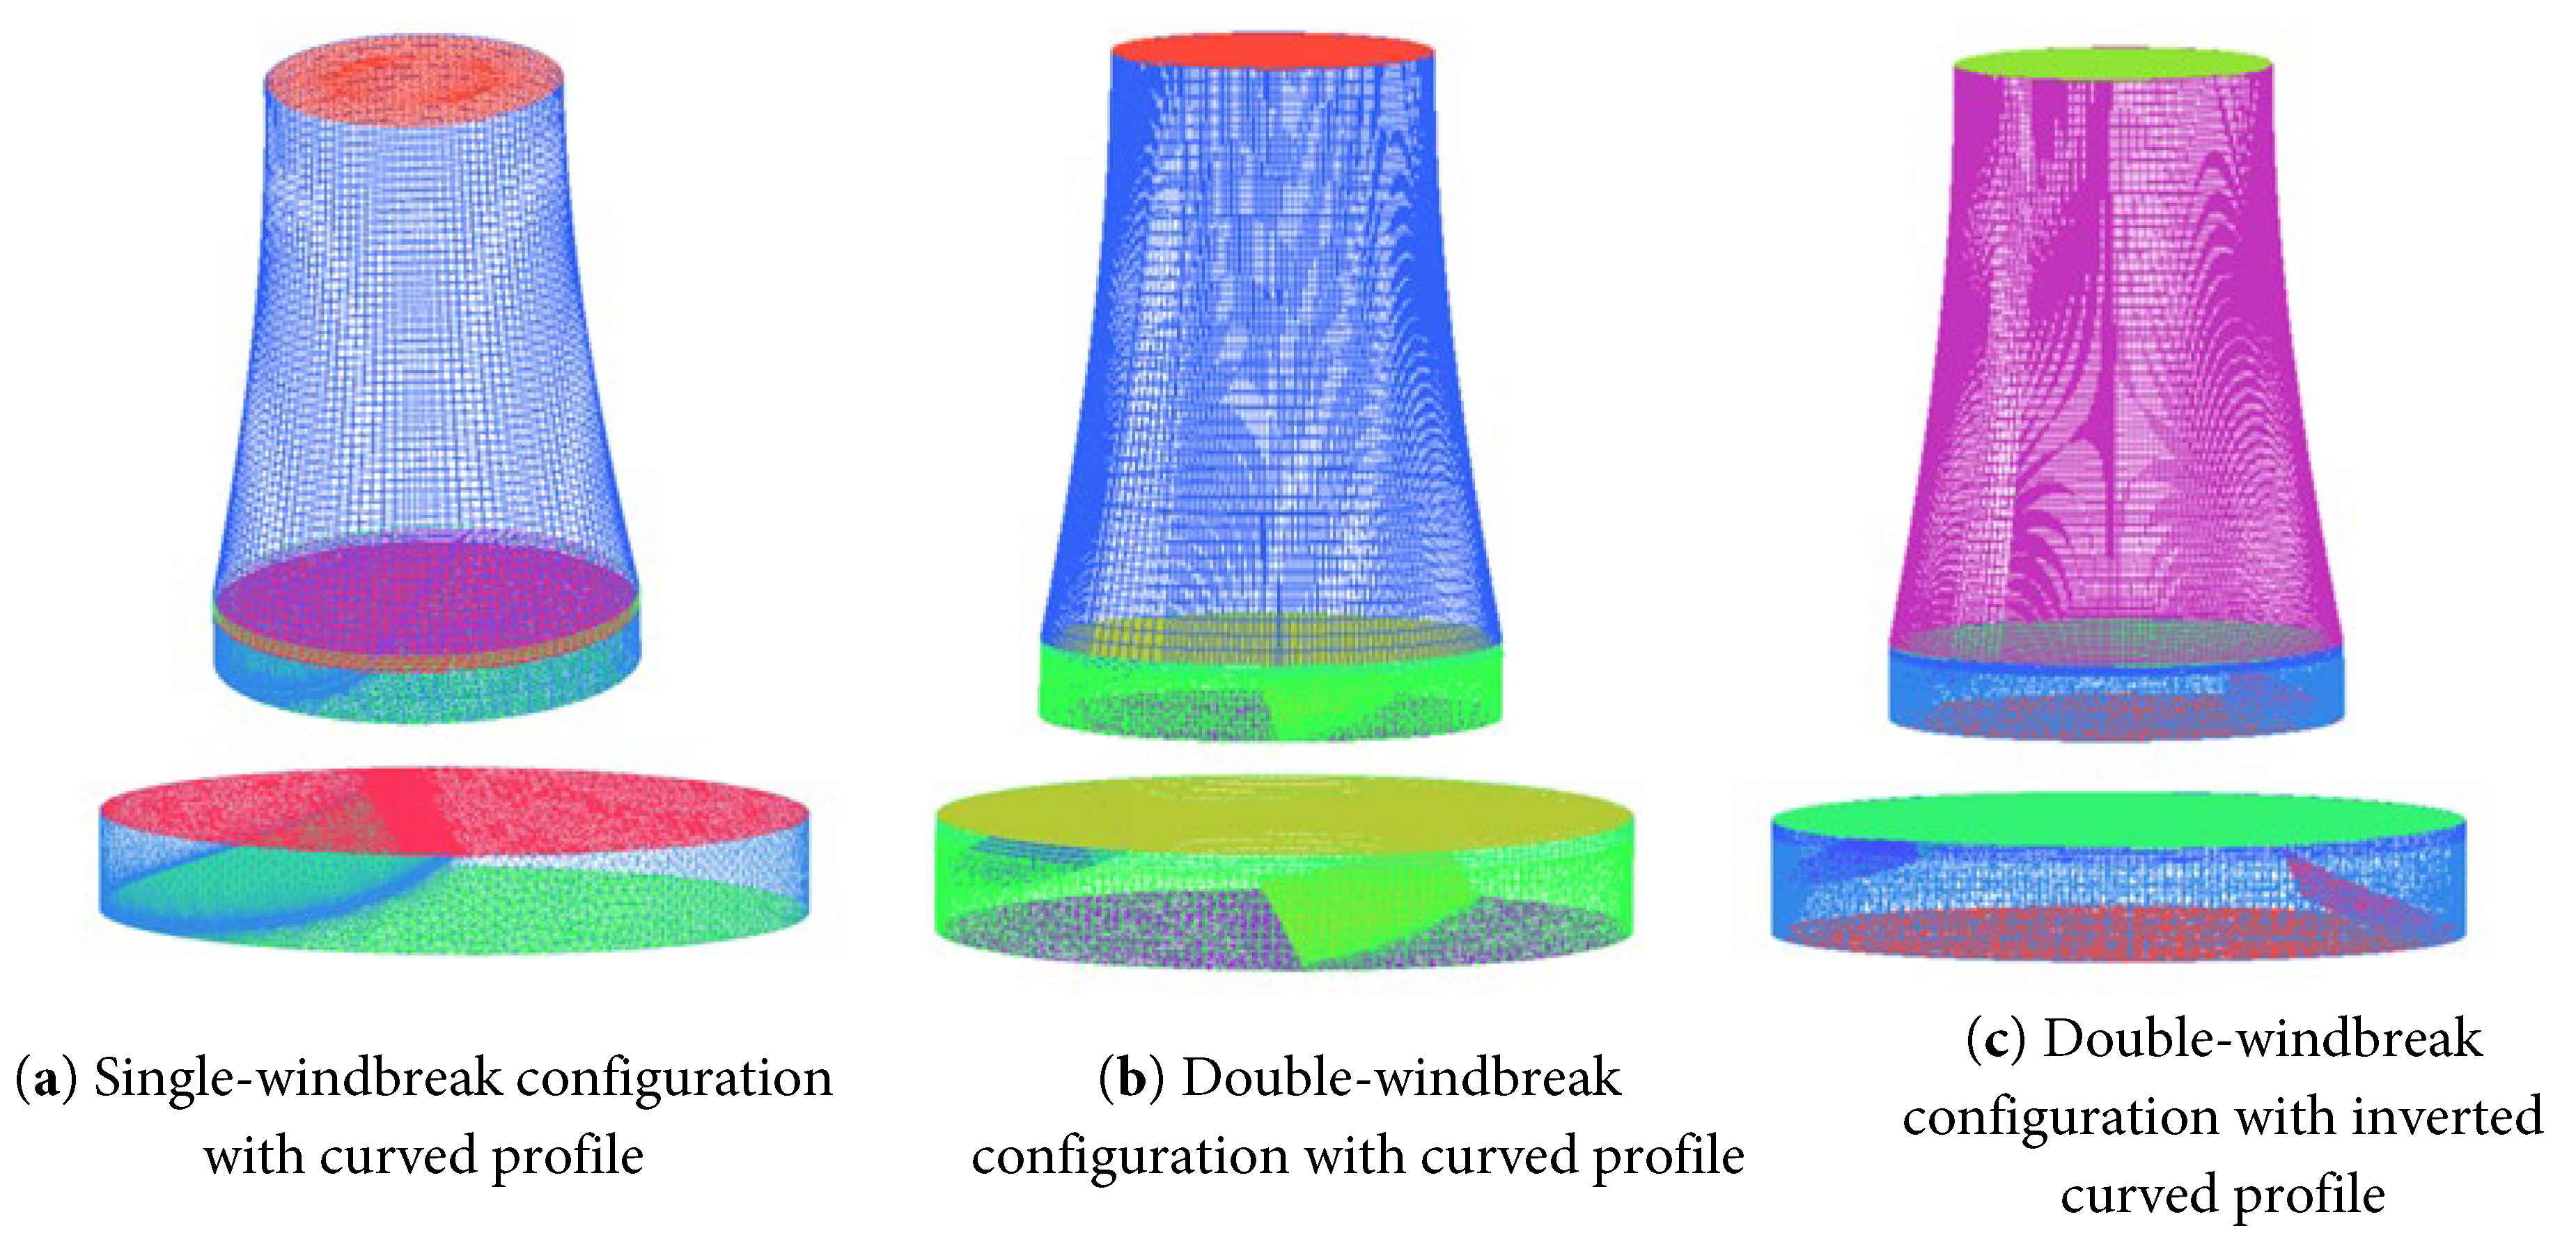
Figure 6: Grid generation of the NDDCT installed with the three novel windbreaks.
The grid independence verification of the NDDCT was conducted under the conditions: ambient air temperature of 40°C, inlet water temperature of the radiator as 61.45°C and circulating water flow rate of 4390 kg/s. Four grid cell numbers were studied for each windbreak. Taking the single-windbreak configuration with curved profile as an example, the grid cell numbers of 2,748,096; 3,026,030; 3,404,719 and 3,650,856 were compared. Comparative analyses of air temperature and speed at the tower outlet and radiator surface were conducted and the results are presented in Table 2. As can be seen from Table 2, the variations of the air temperature and speed become insignificant when the grid cell number is increased from 3,404,719 to 3,650,856. Therefore, taking into account the accuracy and computational time, the NDDCT model installed with the single-windbreak configuration with curved profile with a grid cell number of 3,404,719 was selected for the next simulations. Similarly, the other three NDDCT models installed with the Y-shaped windbreak, double-windbreak configuration with curved profile and double-windbreak configuration with inverted curved profile were verified and the results are presented in Table 2.
Table 2: Grid independence study.
| Windbreak Type | Grid Cell Number | Cooling Tower Outlet Air Temperature (K) | Cooling Tower Outlet Air Speed (m/s) | Radiator Surface Air Temperature (K) | Radiator Surface Air Speed (m/s) |
|---|---|---|---|---|---|
| Y-shaped windbreak | 1,238,688 | 327.68 | 2.78 | 322.14 | 1.62 |
| 2,387,376 | 327.69 | 2.77 | 322.24 | 1.62 | |
| 3,514,496 | 327.66 | 2.77 | 321.85 | 1.61 | |
| 4,229,186 | 327.66 | 2.77 | 321.85 | 1.61 | |
| Single-windbreak configuration with curved profile | 2,748,096 | 327.46 | 2.87 | 322.30 | 2.80 |
| 3,026,030 | 327.40 | 2.90 | 322.24 | 2.79 | |
| 3,404,719 | 327.90 | 2.97 | 322.11 | 2.86 | |
| 3,650,856 | 327.89 | 2.97 | 322.11 | 2.86 | |
| Double-windbreak configuration with curved profile | 2,433,450 | 327.25 | 3.20 | 321.60 | 2.46 |
| 3,330,406 | 326.87 | 3.38 | 321.69 | 2.52 | |
| 4,237,654 | 326.78 | 3.42 | 321.78 | 2.50 | |
| 5,336,282 | 326.79 | 3.42 | 321.78 | 2.50 | |
| Double-windbreak configuration with inverted curved profile | 2,980,414 | 326.55 | 3.53 | 322.99 | 2.79 |
| 3,934,772 | 327.30 | 3.34 | 324.61 | 2.01 | |
| 4,593,814 | 326.59 | 3.58 | 322.95 | 2.79 | |
| 4,657,454 | 326.61 | 3.58 | 322.96 | 2.79 |
Based on the geometric model, governing equations, boundary conditions, and computational mesh established in the previous sections, the numerical solution is carried out to resolve the flow and heat transfer fields. To solve the governing equations established above, the Finite Volume Method based on the ANSYS Fluent solver is employed. The SIMPLE algorithm is selected for pressure-velocity coupling. To ensure calculation accuracy, Second-order Upwind Schemes are utilized for the spatial discretization of momentum, energy, and turbulence quantities. The solution is considered converged when the normalized residuals for continuity, momentum, and turbulence parameters drop below 10−4, and the energy residual drops below 10−6. Furthermore, the stability of the monitored outlet air temperature and mass flow rate is verified to ensure a steady state is reached.
The three novel designs of windbreaks are firstly proposed in the current study, and therefore, they lack experimental data for model validation. The model was validated from two aspects, one aspect is the NDDCT without windbreak, the other aspect is the approach temperature for the NDDCT installed with Y-shaped windbreak. Then, the model was modified to simulate the current situations.
As for the model of NDDCT without windbreak, the same geometric models were developed, and the same working conditions were used as the reference [41]. The simulation results were compared with the reference [41] for the NDDCT model validation. Seven operating conditions were compared, and the results are presented in Table 3. As shown in Table 3, the uncertainty analysis of air temperature on the radiator surface was provided during model validation. The inlet temperature, flow rates, wind speed profile, geometry were not analyzed during model validation because the reference [41] did not report the data of these parameters. It should be noted that these validation cases were conducted under no crosswind conditions to verify the baseline aerodynamic and thermal performance of the tower driven solely by buoyancy. Table 3 indicates that the overall discrepancy between the simulated values and the experimental measurements is insignificant. Specifically, the maximum relative error is 4.76%, suggesting that the current model is reliable.
Table 3: Model validation of the NDDCT without windbreak.
| Items | Conditions | ||||||
|---|---|---|---|---|---|---|---|
| Parameters | 1 | 2 | 3 | 4 | 5 | 6 | 7 |
| Environmental temperature (°C) | 11.58 | 13.67 | 18.2 | 21.37 | 24.97 | 26.48 | 27.94 |
| Inlet water temperature (°C) | 40.95 | 43.41 | 48.34 | 51.33 | 54.02 | 55.28 | 57.16 |
| Air temperature on the radiator surface (experimental results) (°C) [41] | 25.79 | 28.36 | 32.98 | 36.77 | 40.42 | 41.74 | 43.29 |
| Air temperature on the radiator surface (simulation results) (°C) | 24.84 | 27.12 | 31.92 | 35.10 | 38.50 | 39.96 | 41.60 |
| Relative errors (%) | 3.69 | 4.38 | 3.22 | 4.52 | 4.76 | 4.25 | 3.89 |
As for the model of the NDDCT installed with the Y-shaped windbreak under crosswind, the approach temperature was used for model validation. The approach temperature is very important for evaluating the performance of cooling towers, a lower approach temperature signifies better thermal performance of the cooling tower. The approach temperature is defined as the temperature difference between the outlet water temperature and the inlet air temperature, which is able to describe the performance deterioration of the NDDCT under different wind speeds. That is why the approach temperature was used for model validation. Besides, the available literature lacks data of large NDDCT under crosswinds, only the experimental values of the 650 MW dry cooling tower were reported by Preez and Kröger [25,42]. The reason why two towers with different heat rejection rates were compared is to assess the crosswind effects on the NDDCT based on the limited data. The approach temperature is defined by Eq. (21).
The model validation of the NDDCT without windbreak and installed with the Y-shaped windbreak is presented in Fig. 7. As shown in Fig. 7, the variation of the approach temperature differences of the two cooling towers gradually increases in the same trend with the increase of ambient wind speed, which indicates that the performance of the NDDCT deteriorates. The variation of approach temperature differences of the studied NDDCT with the heat rejection rate of 354 MW is always higher than the NDDCT with the heat rejection rate of 650 MW when the ambient wind speed is constant. The results also prove that the lower the heat rejection rate of the tower, the more susceptible to crosswind.
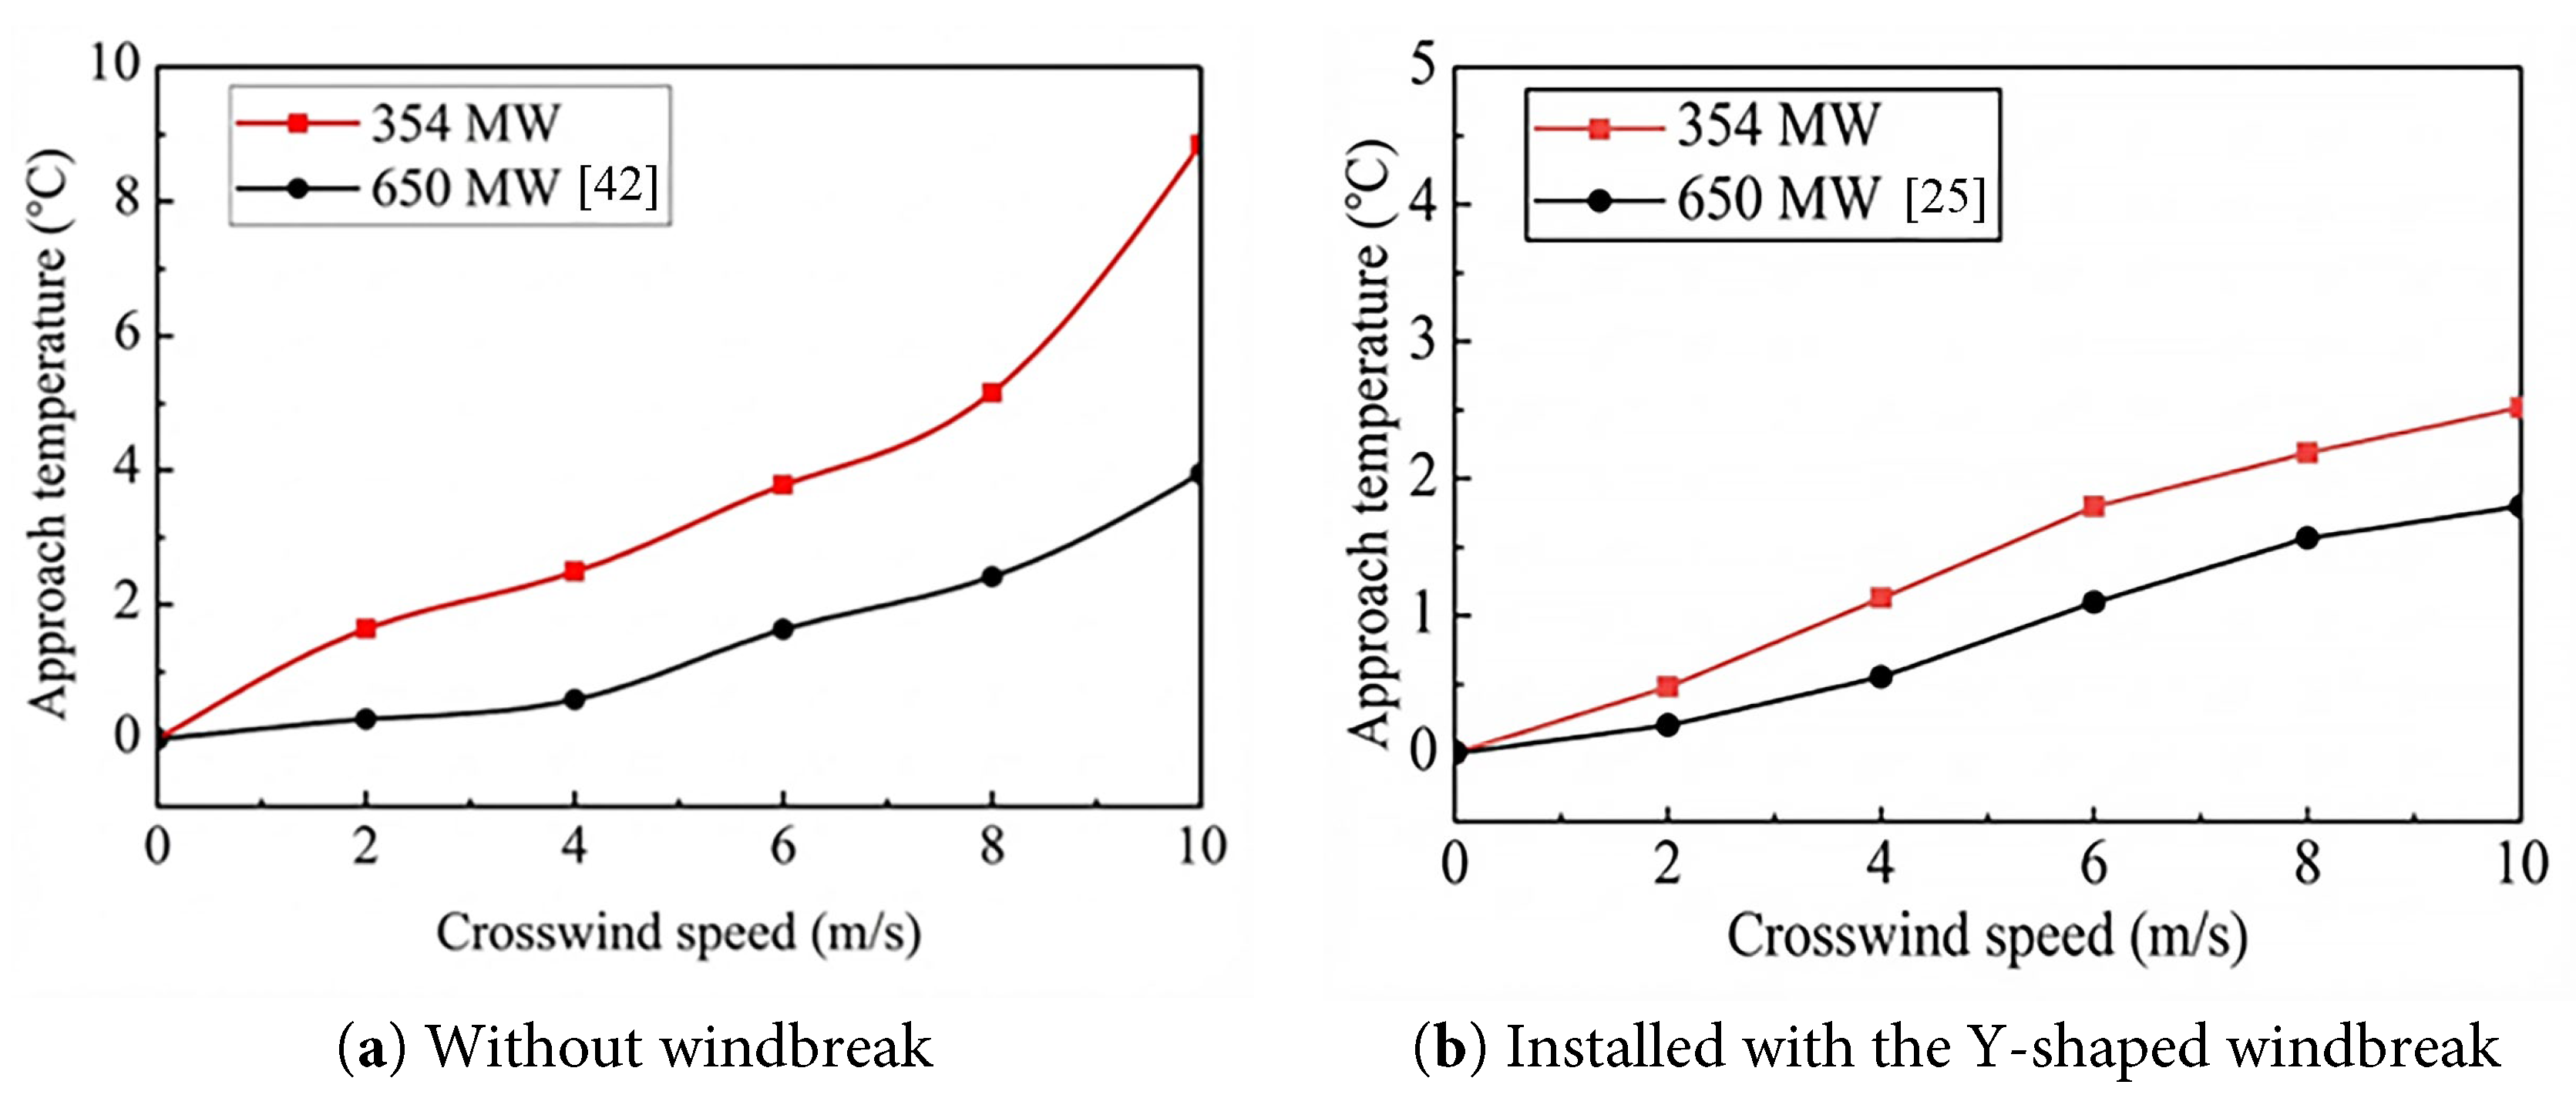
Figure 7: Model validation of the NDDCT.
The above model verification demonstrates that the simulation model can accurately describe the heat transfer process in the NDDCT installed with windbreaks under windless and windy conditions, and obtain a reliable and reasonable result. What’s more, many publications about NDDCT under crosswinds used similar methods for model validation (e.g., the references [10,11,23]). As for the model validation of the new windbreak geometries, the three novel designs of windbreaks are firstly proposed by our study. There is no available data in the literature for model validation. Besides, the structures of the novel windbreaks are large and not easy to install, experimental study has not been done. Besides, the current study is to investigate the feasibility of the three novel windbreaks. Therefore, the model was validated from the above two aspects. Then, the model was modified to simulate the new windbreak geometries. In the future, experimental studies about the potential design found by this study, as the single-windbreak configuration with curved profile, and structure optimization, will be carried out for engineering applications. However, the simulation results are robust to minor changes, which is due to the fact that comparative study between the three novel windbreaks and the existing Y-shaped windbreak was carried out in the current study. Essentially, identical boundary conditions were used during the comparative study, and therefore, minor changes may affect the specific values of the simulation, but they have no influence on the trends or the comparison results.
As the three novel windbreaks are firstly proposed by our study, there are no relevant references studying these three new windbreaks. Besides, the current study is to investigate the feasibility of the three novel windbreaks. Therefore, the following section will do comparative study between the three novel windbreaks and the existing Y-shaped windbreak.
This study evaluates the performance of NDDCTs from air temperature distributions, air velocity distributions, ventilation rate and heat rejection rate. The air temperature distributions reflect the heat transfer characteristics inside the tower, while the air velocity distributions reflect the pressure characteristics. The temperature contours directly visualize thermal gradients, while the velocity contours reveal the flow patterns and pressure losses (e.g., low-velocity zones indicate high flow resistance). Except for air temperature distributions and air velocity distributions, the ventilation rate and heat rejection rate are of great importance for NDDCT evaluation. The heat rejection rate (Q) can be calculated as
3.1 Air Temperature Distributions
Fig. 8a shows the radiator surface air temperature distribution of the NDDCT installed with the Y-shaped windbreak. The air temperature distribution remains uniform when the crosswind speed increases from 0 m/s to 2 m/s. An evident high-temperature region emerges on the leeward side as the crosswind speed increases to 4 m/s. This is in accordance with Lu et al.’s study [26]. Lu et al.’s study [26] found that high-temperature region starts to occur at a crosswind speed of 0.5 m/s. The crosswind speed at which high-temperature region appears in this study is higher than Lu et al.’s study, which is because the NDDCT in the current study is a large-scale cooling tower. The high-temperature regions appear on both the windward and leeward sides when the crosswind speed is within 6 m/s–18 m/s, and the temperature on the windward side is higher than that on the leeward side. Concurrently, as the crosswind speed continues to increase, the area of the high-temperature regions on both windward and leeward sides expands. Simultaneously, the degree of non-uniformity of air temperature distribution on the radiator surface gradually intensifies, which is consistent with Li et al.’s results [44]. This phenomenon can be attributed to the deterioration of the aerodynamic field at the tower inlet caused by strong crosswinds. With the increase of crosswind speed, a high-pressure stagnation zone forms at the windward entrance, leading to significant aerodynamic blockage that impedes the inflow of fresh ambient air. Furthermore, as observed in experimental studies [44], high crosswinds induce a low-pressure region underneath the windward heat exchanger sectors. This pressure difference drives the internal hot air to flow downwards and outwards (reversed flow), preventing effective heat exchange in this region. Simultaneously, strong vortices generated inside the tower further disrupt the airflow uniformity. Consequently, the local air mass flow rate through the windward and lateral radiator sectors decreases drastically, resulting in a sharp rise in wall temperature and the expansion of high-temperature zones.
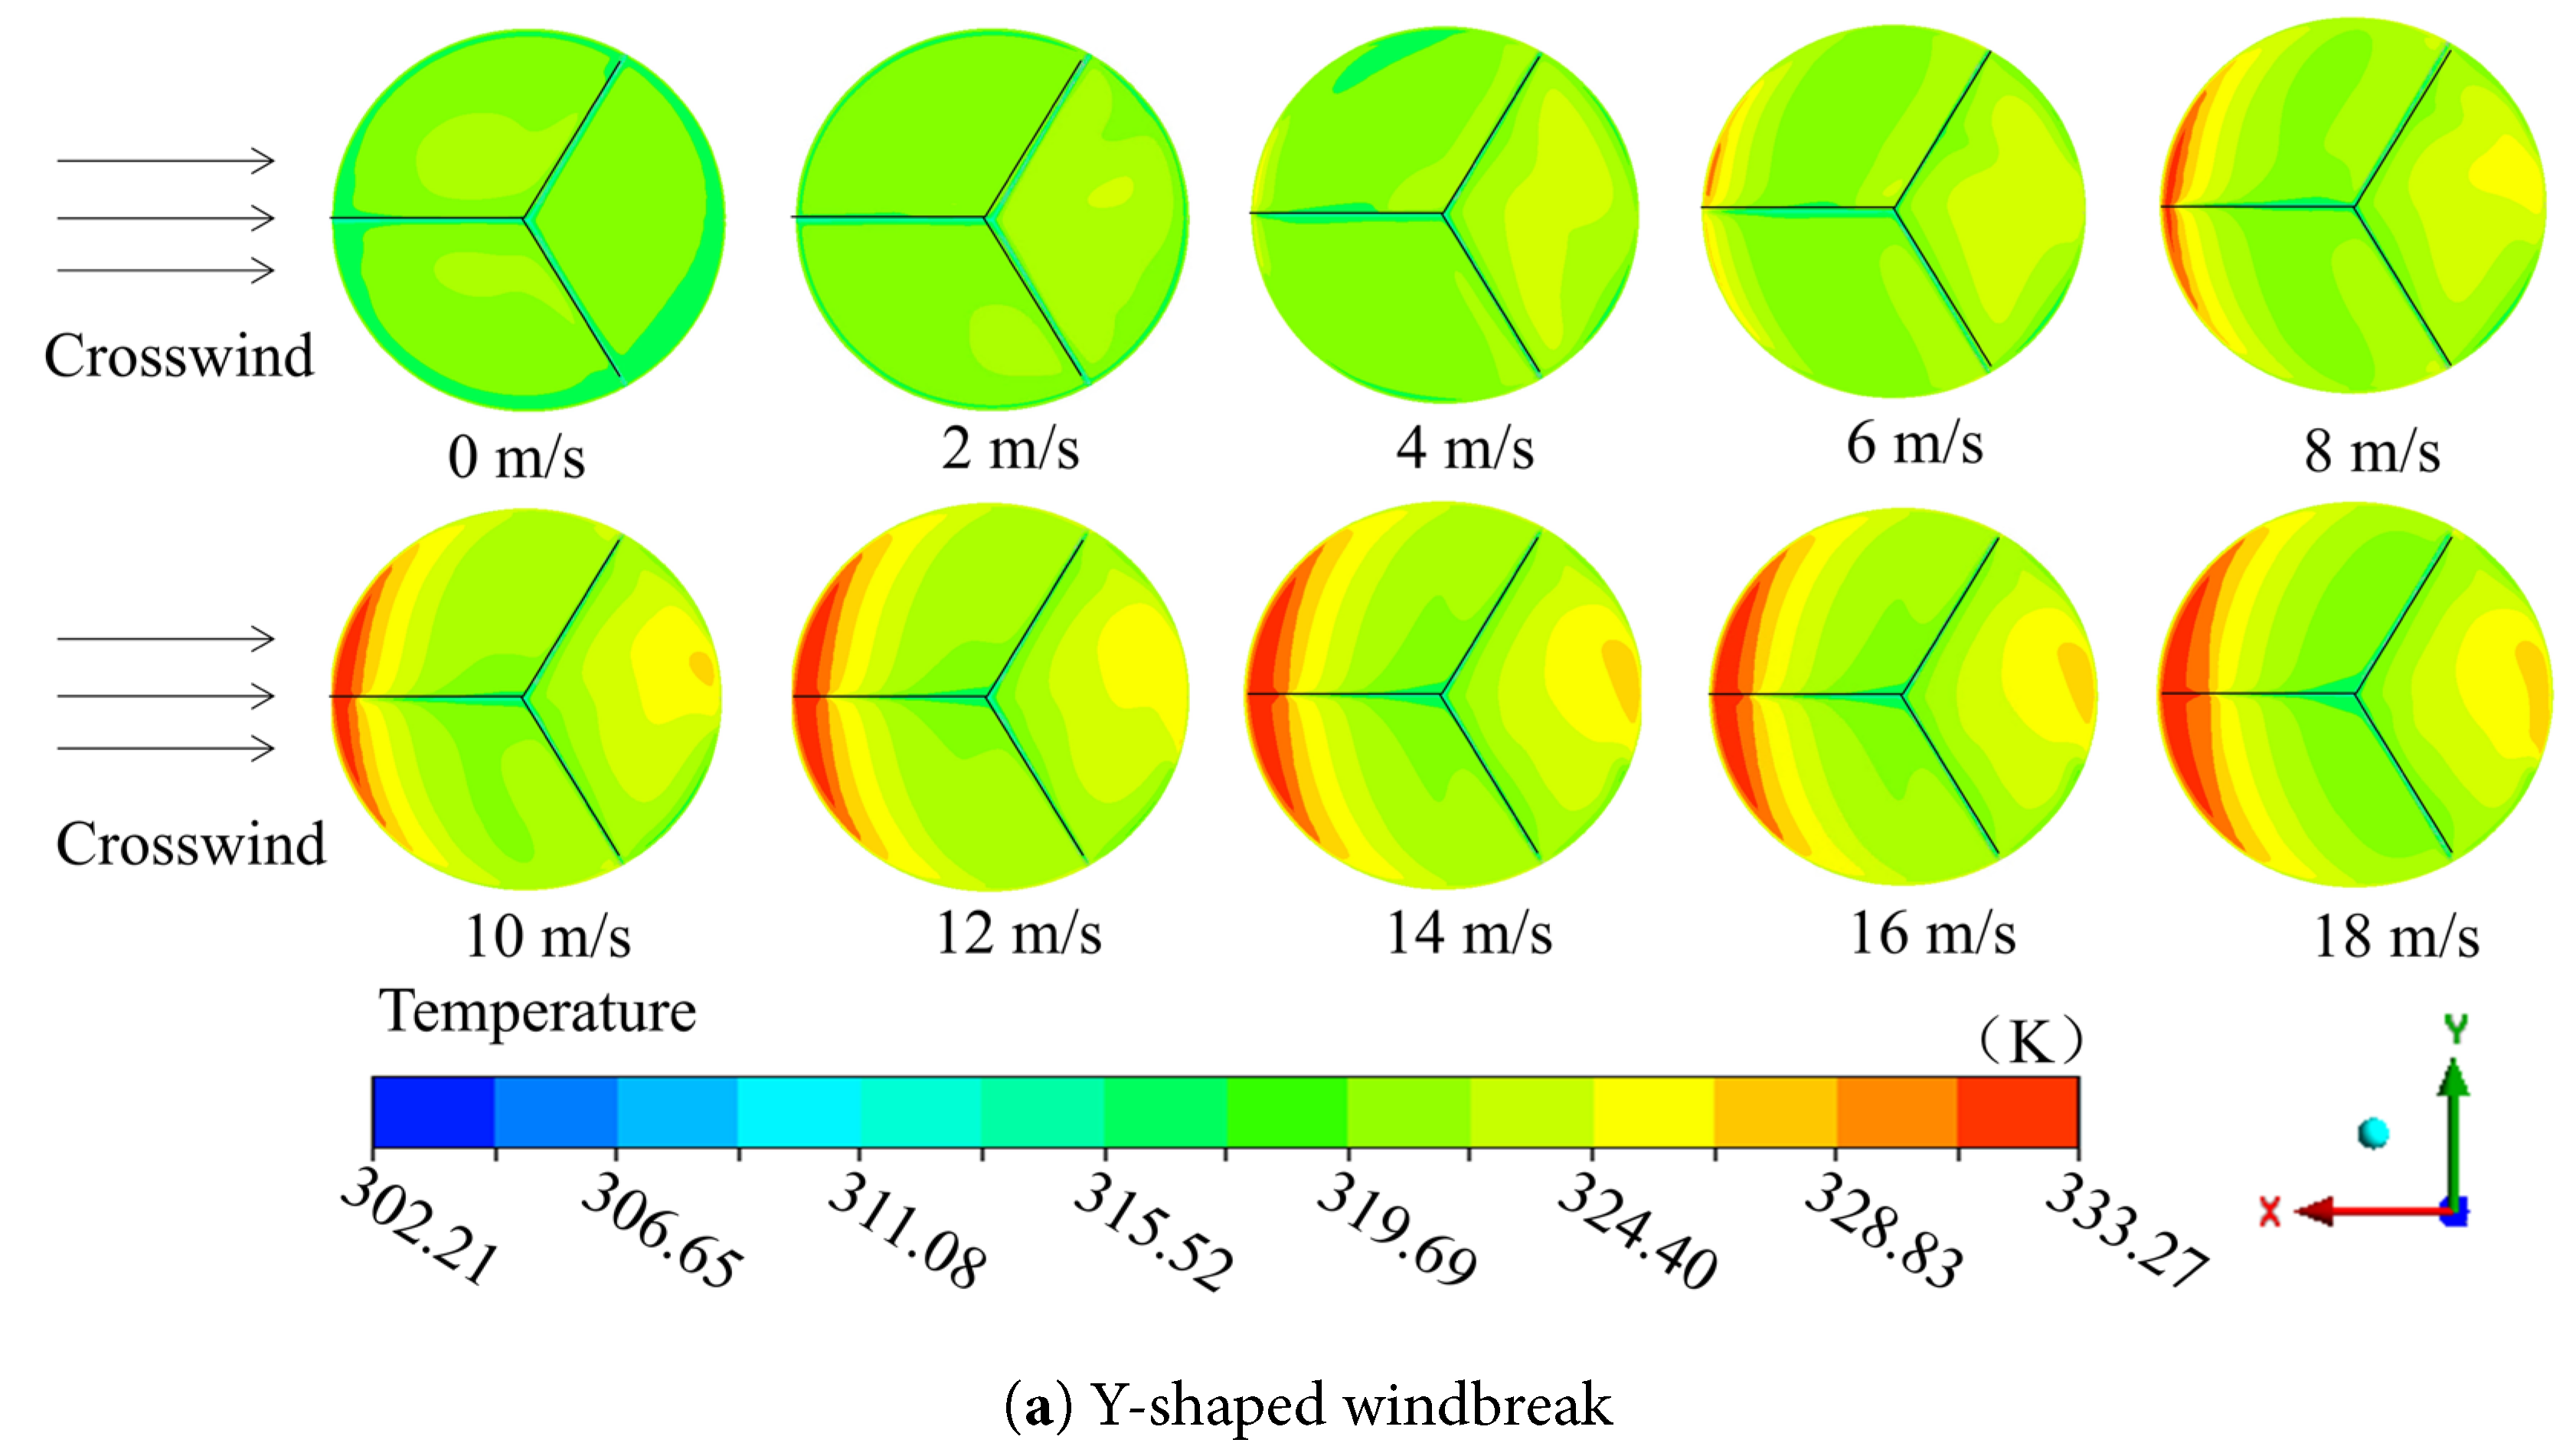
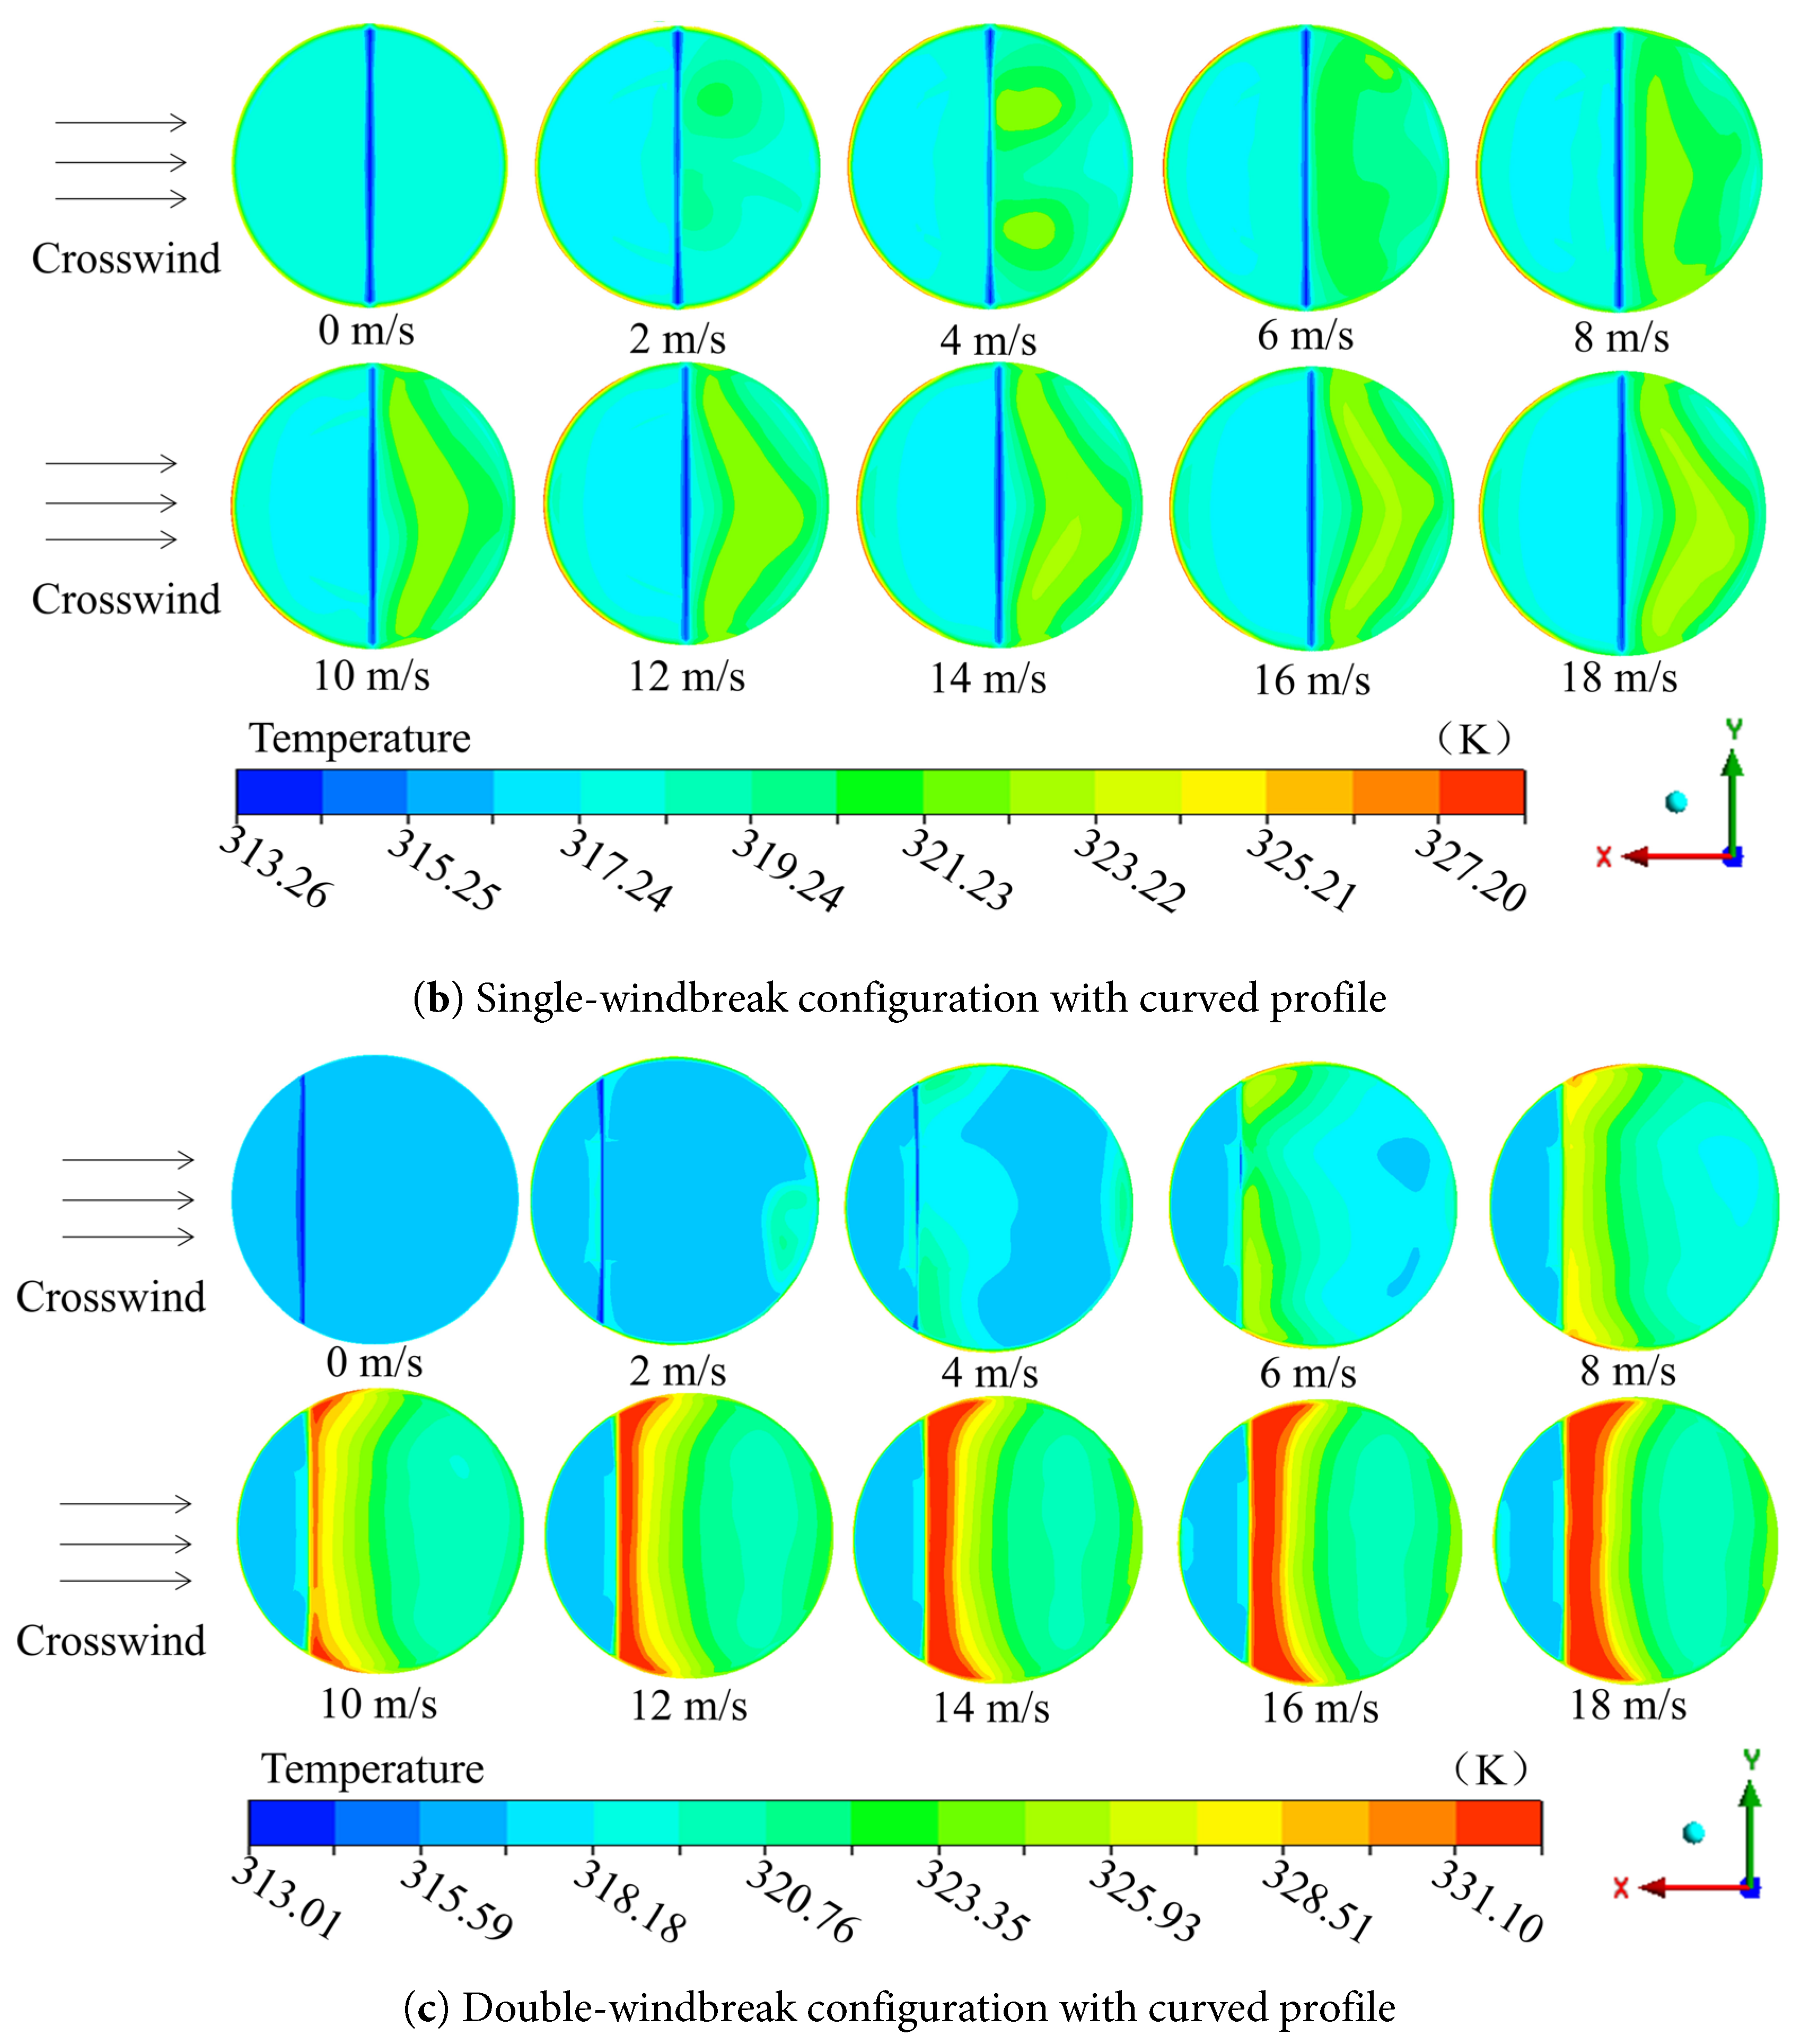
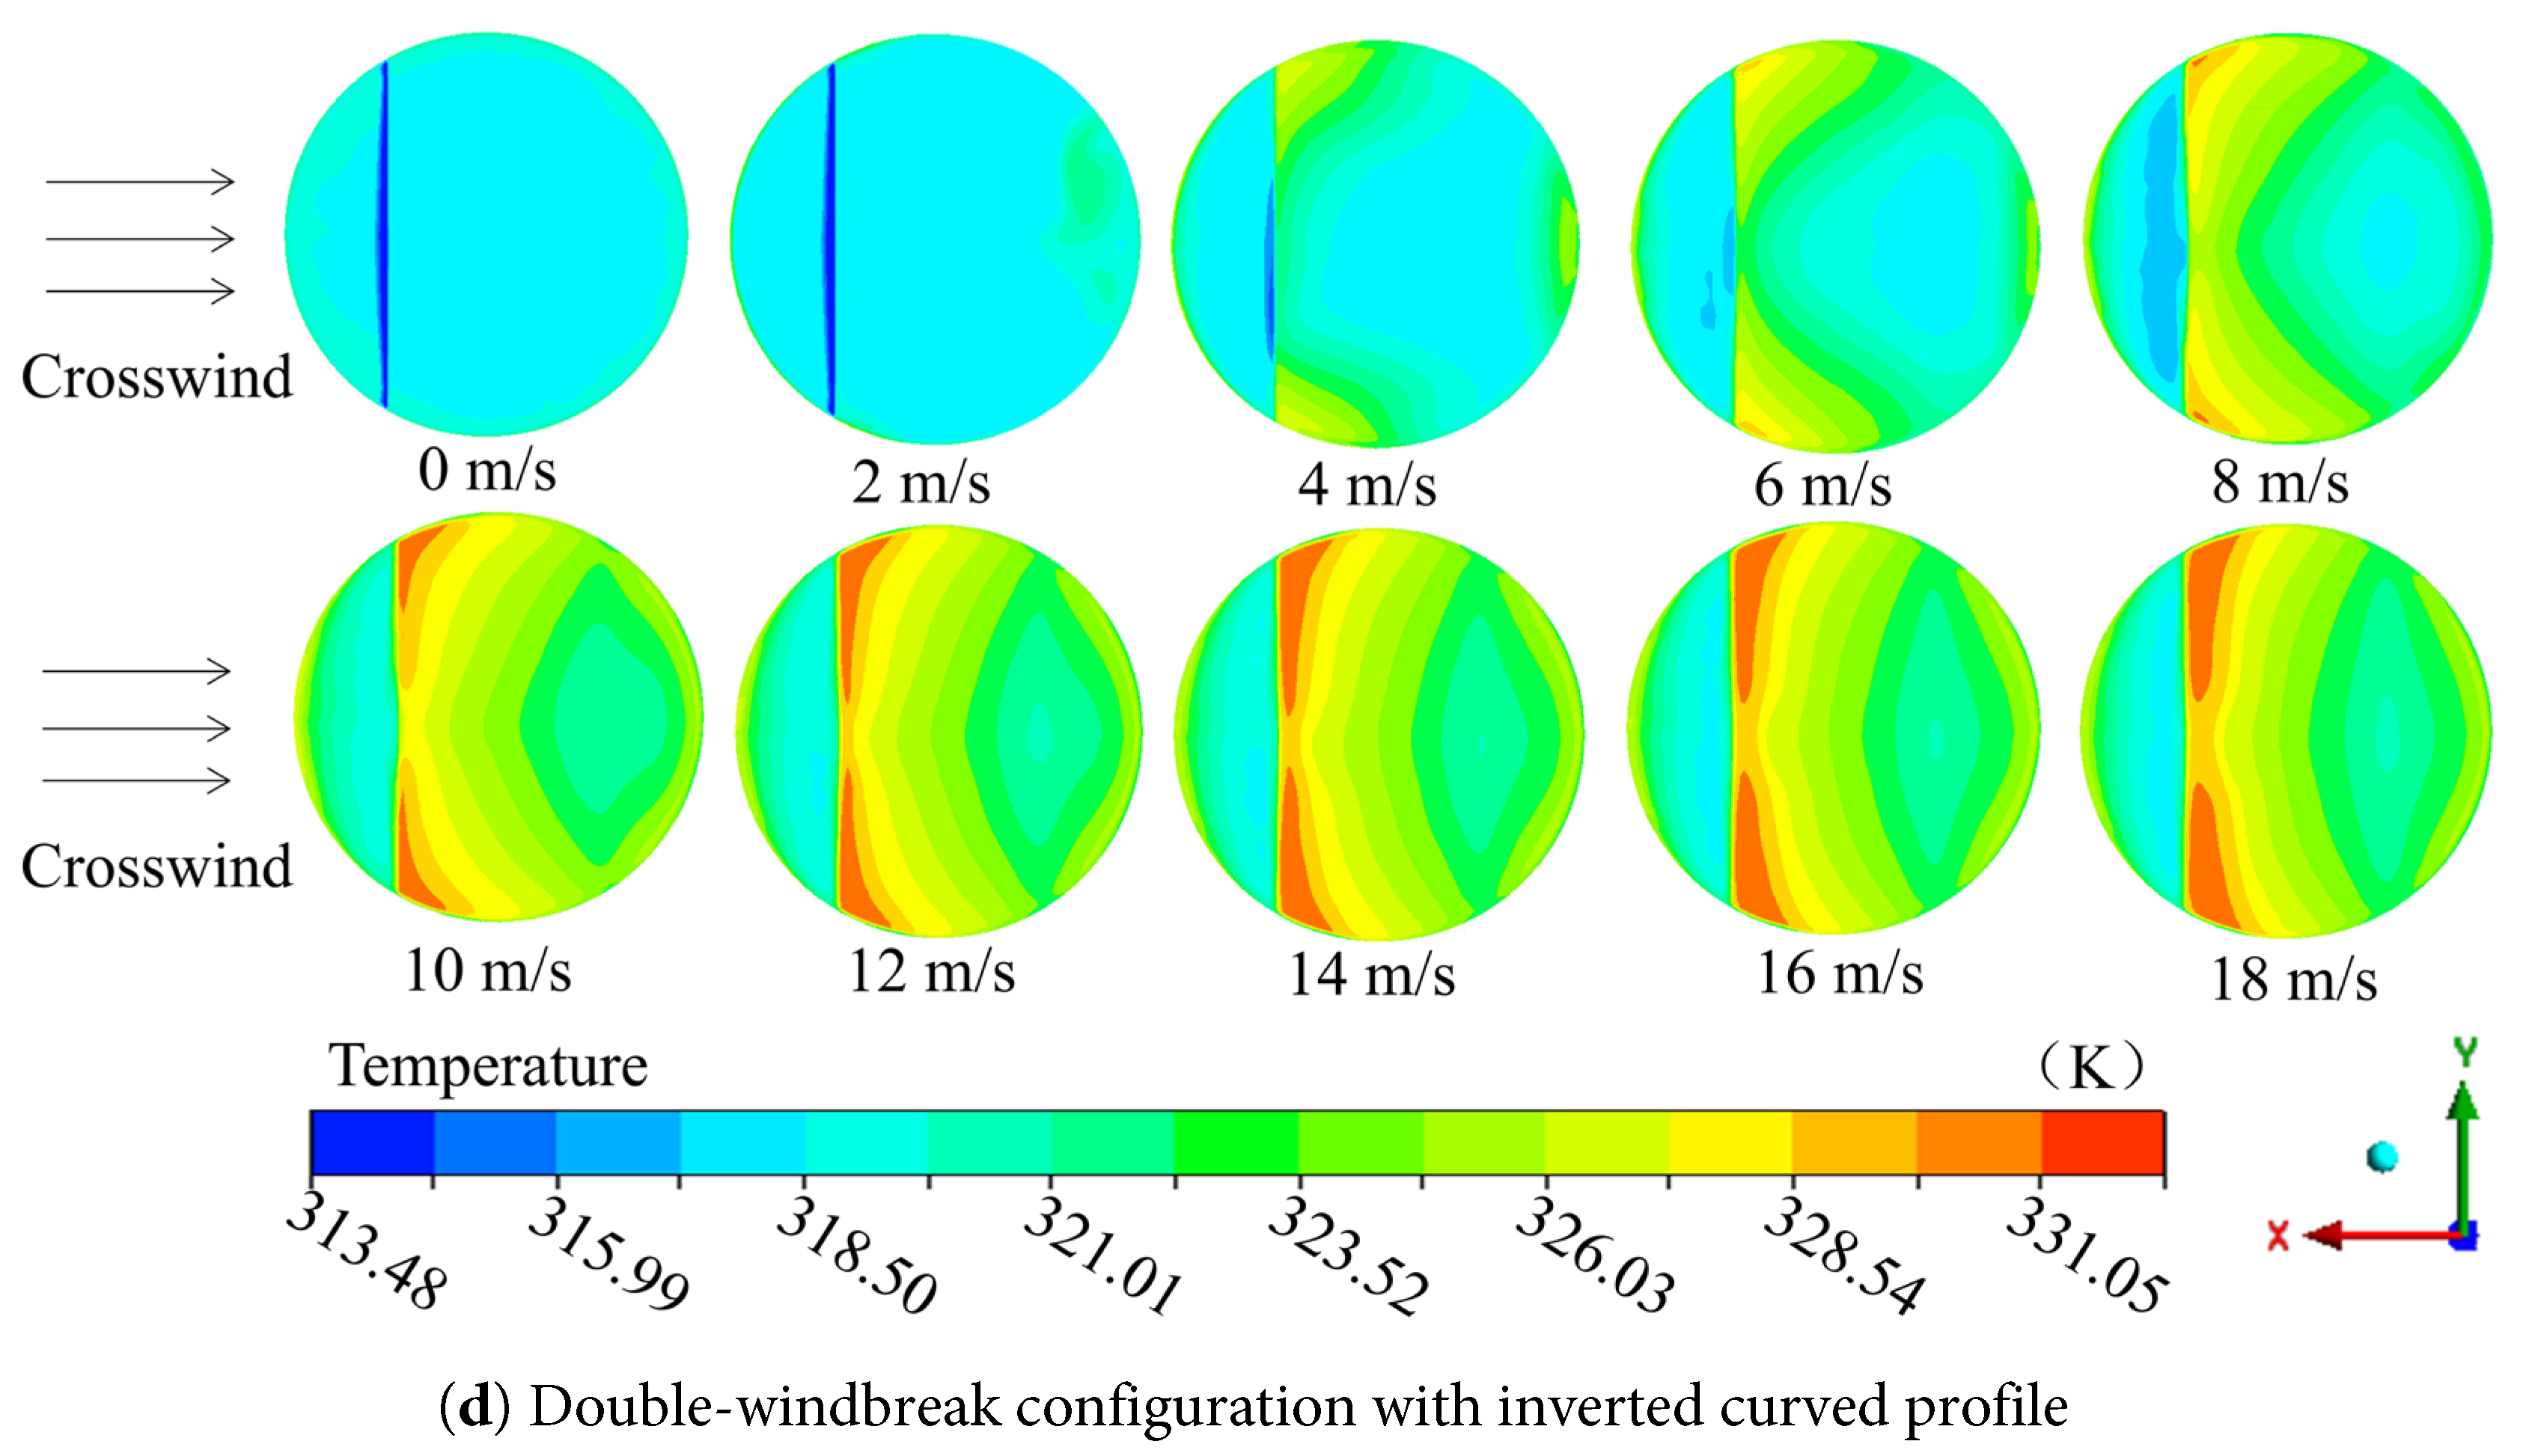
Figure 8: Air temperature distributions on the radiator surface of the NDDCT.
The air temperature distributions on the radiator surface of the NDDCT installed with the single-windbreak configuration with curved profile are presented in Fig. 8b. The air temperature on the windward side is lower than that on the leeward side. The single-windbreak configuration with curved profile was proposed to use one curved shape to minimize the through-draught flow caused by the crosswind. As a result, the airflow speed on the windward side rises and therefore, the heat transfer is intensified. As shown in Fig. 8b, the low-temperature zones on the windward side exist and expand gradually as the crosswind speed increase. Since there is no windbreak on the leeward side, the temperature on leeward side is relatively high when compared with the windward side.
The air temperature distributions on the radiator surface of the NDDCT installed with the double-windbreak configuration with curved profile are presented in Fig. 8c. The air temperature distribution is relatively homogeneous when the crosswind speed ranges from 0 m/s to 2 m/s. The air temperature close to the second curved shape at the crosswind speed direction rises gradually as the crosswind speed increases from 4 m/s to 18 m/s. However, the temperature on the windward side remains relatively low. The air temperature on the windward side is lower than that on the leeward side. Fig. 8c indicates that as for the double-windbreak configuration with curved profile, the first curved shape at the crosswind speed direction improves the tower’s performance while the second curved shape at the crosswind speed direction functions not well.
The air temperature distributions on the radiator surface of the NDDCT installed with the double-windbreak configuration with inverted curved profile are presented in Fig. 8d. Similar to the double-windbreak configuration with curved profile, the air temperature distribution is relatively homogeneous when the crosswind speed ranges from 0 m/s to 2 m/s. The air temperature close to the second curved shape at the crosswind speed direction rises gradually as the crosswind speed increases from 4 m/s to 18 m/s. However, the temperature on the windward side remains relatively low. The air temperature on the windward side is lower than that on the leeward side. The air temperature of the double-windbreak configuration with inverted curved profile on the leeward side is lower than that of the double-windbreak configuration with curved profile. This indicates that the double-windbreak configuration with inverted curved profile mitigates the high-temperature region on the leeward side, and the air temperature discrepancy between the windward and leeward sides is diminished when compared with the double-windbreak configuration with curved profile.
As mentioned above, the through-draught flow reduces the airflow rate passing through the heat exchanger inside the NDDCT, and therefore decrease the overall heat transfer coefficient and thermal efficiency. Therefore, the through-draught flow will impair the cooling performance of the NDDCT and it should be avoided. The windbreaks are proposed to avoid the through-draught flow. However, the turbulence intensity of the airflow increases as the crosswind speed increases, and as a result, the air velocity distributions on the radiator surface of the NDDCT become increasingly non-uniform, this is illustrated in the Fig. 9. The air temperature distributions on the radiator surface are usually high when the air velocity is low. On the contrary, the air temperature distributions are low when the air velocity is high. These trends are demonstrated in Fig. 8 and Fig. 9. Finally, high temperature zone forms with the increase in crosswind speed for various windbreaks as there are low air velocity zones. Taking a further investigation on the ventilation rate and the heat rejection rate reported in Fig. 10, it can be found that both the ventilation rate and the heat rejection rate follow the same trend of decrease firstly and then increase as the crosswind speed increases. That is to say, the adverse effect of crosswind increases firstly and then decreases as the crosswind speed increases. But the crosswind will impair the cooling performance of the NDDCT when there is no windbreak, as shown in Fig. 10, the values of the ventilation rate and the heat rejection rate are always lower than their values at no crosswind (i.e., crosswind speed is zero). As for the cases with windbreaks, the ventilation rates are improved by the windbreaks when the crosswind speeds are larger than certain values (these values are different for different windbreaks). As a result, the heat rejection rates are improved by the windbreaks when the crosswind speeds are larger than certain values. What’s more, both the ventilation rate and the heat rejection rate are even higher than their values at no crosswind as shown in Fig. 10. The same trends were reported by many researchers, e.g., the references [44].
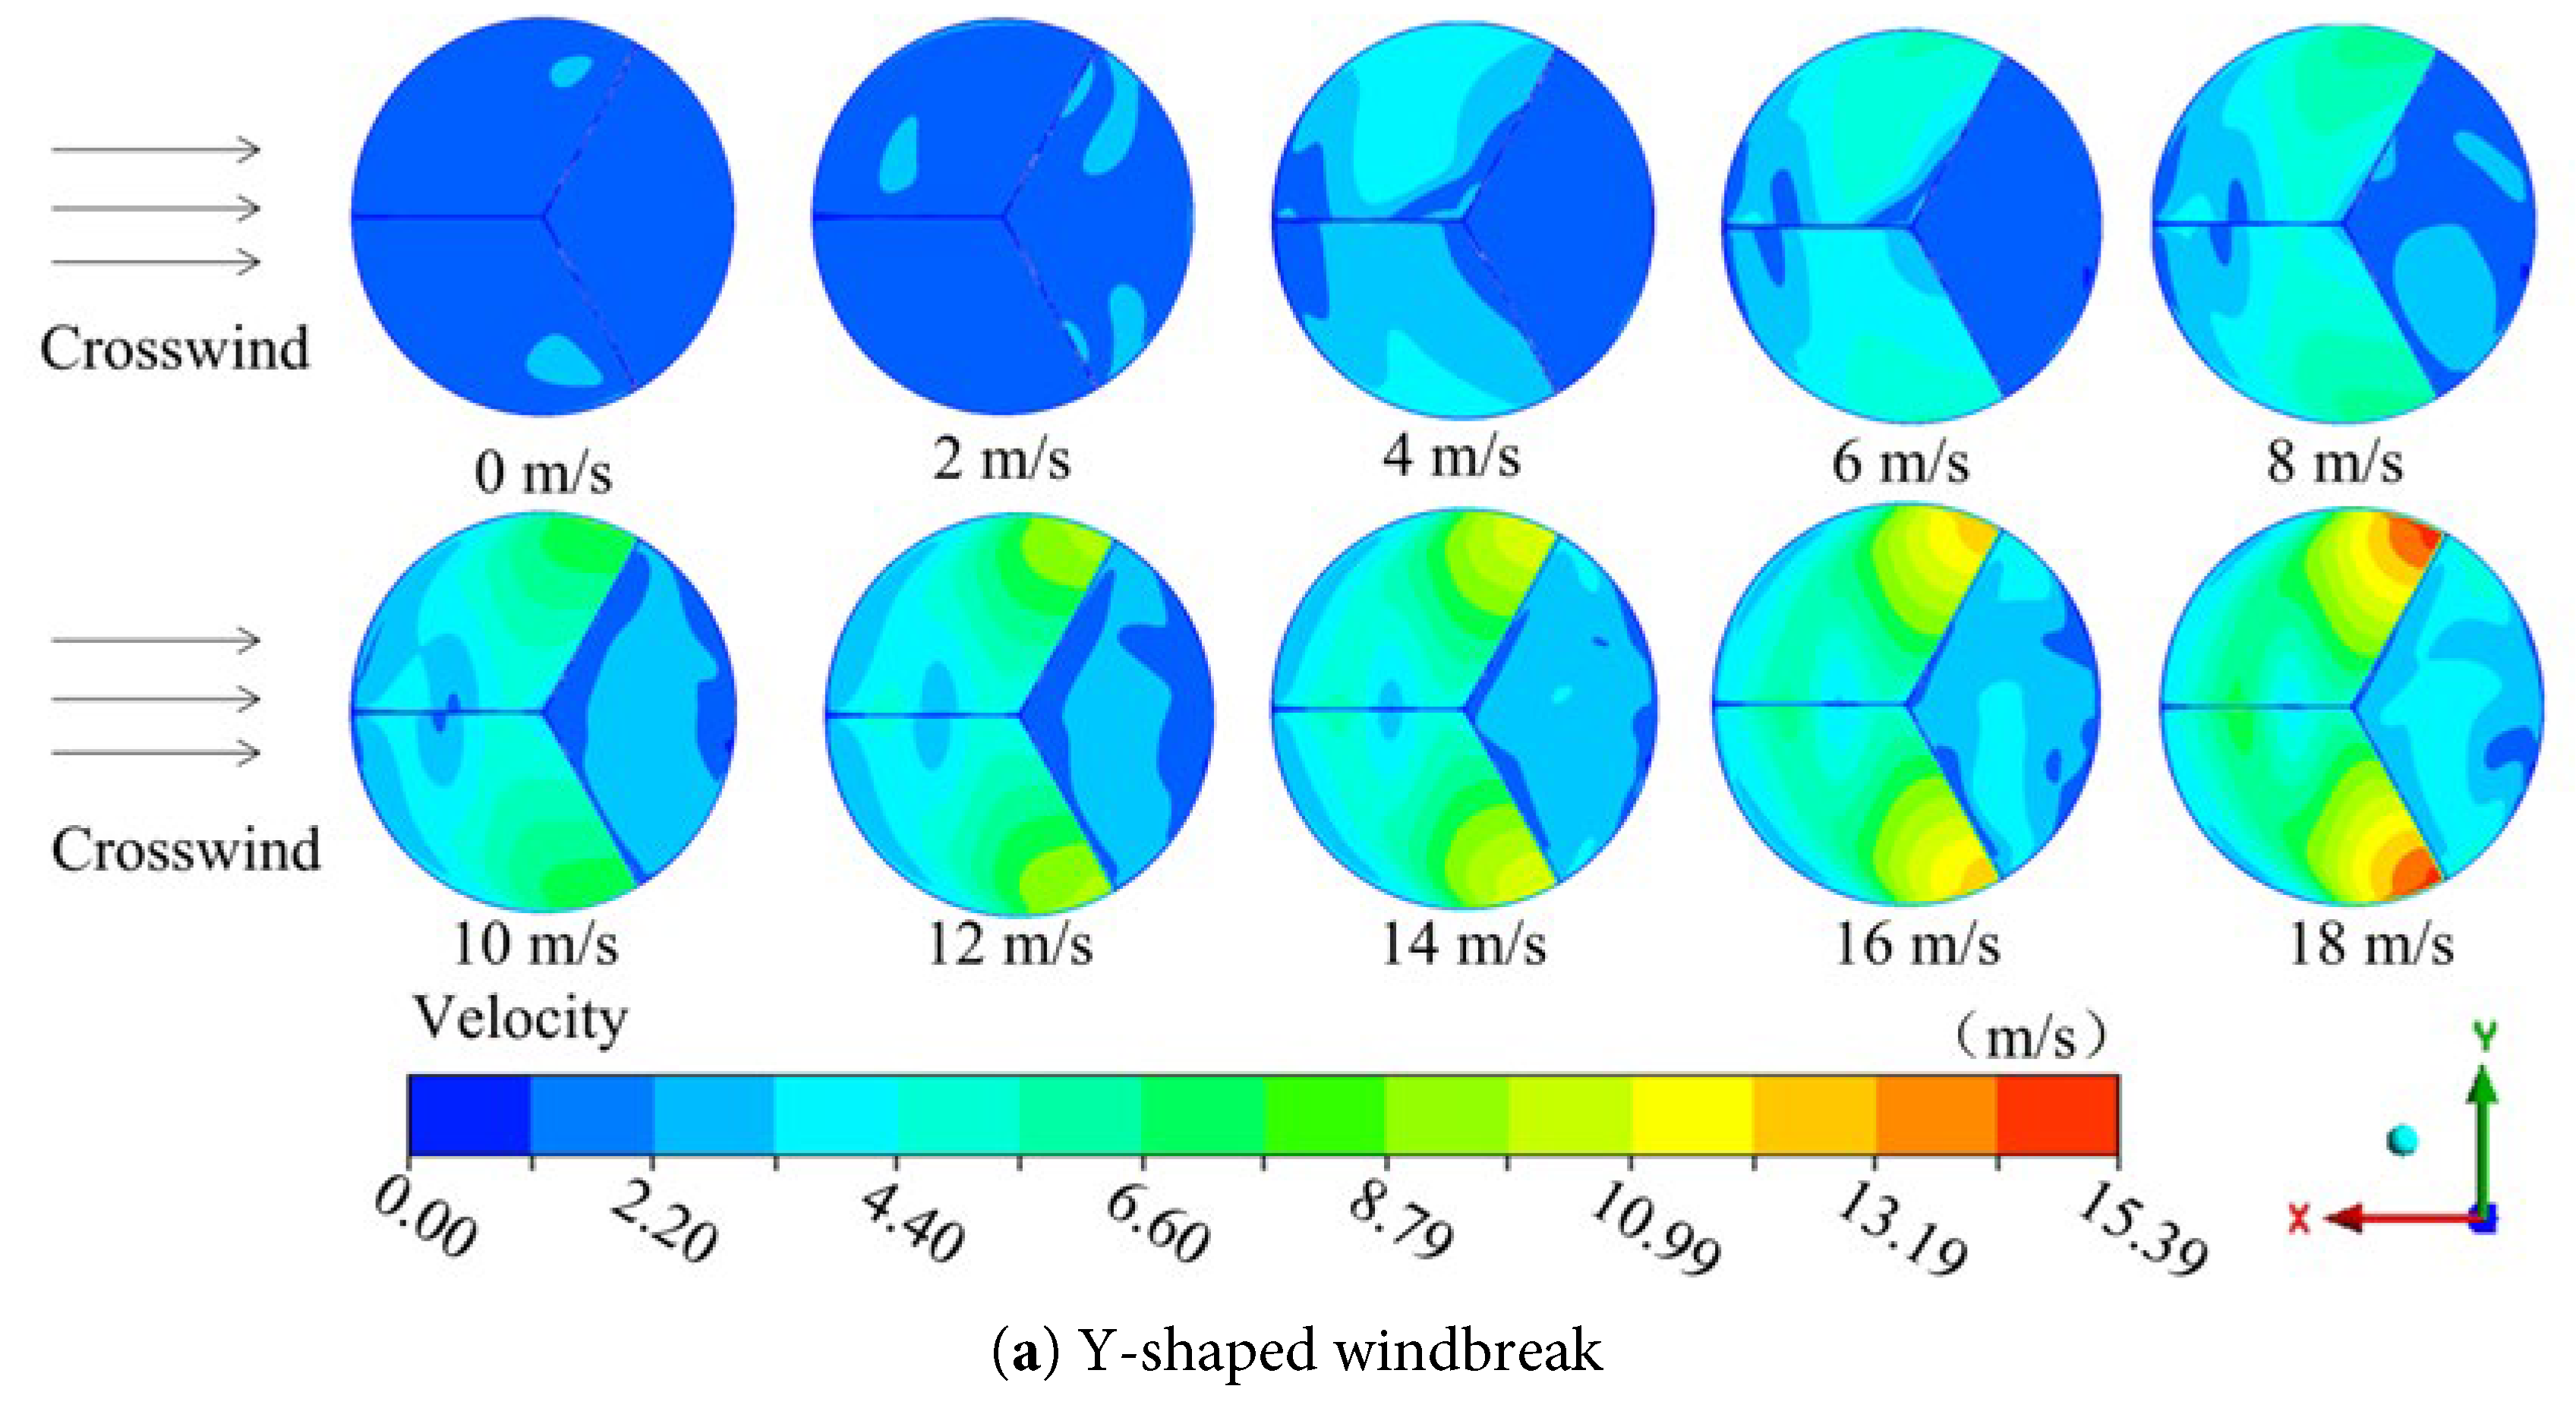
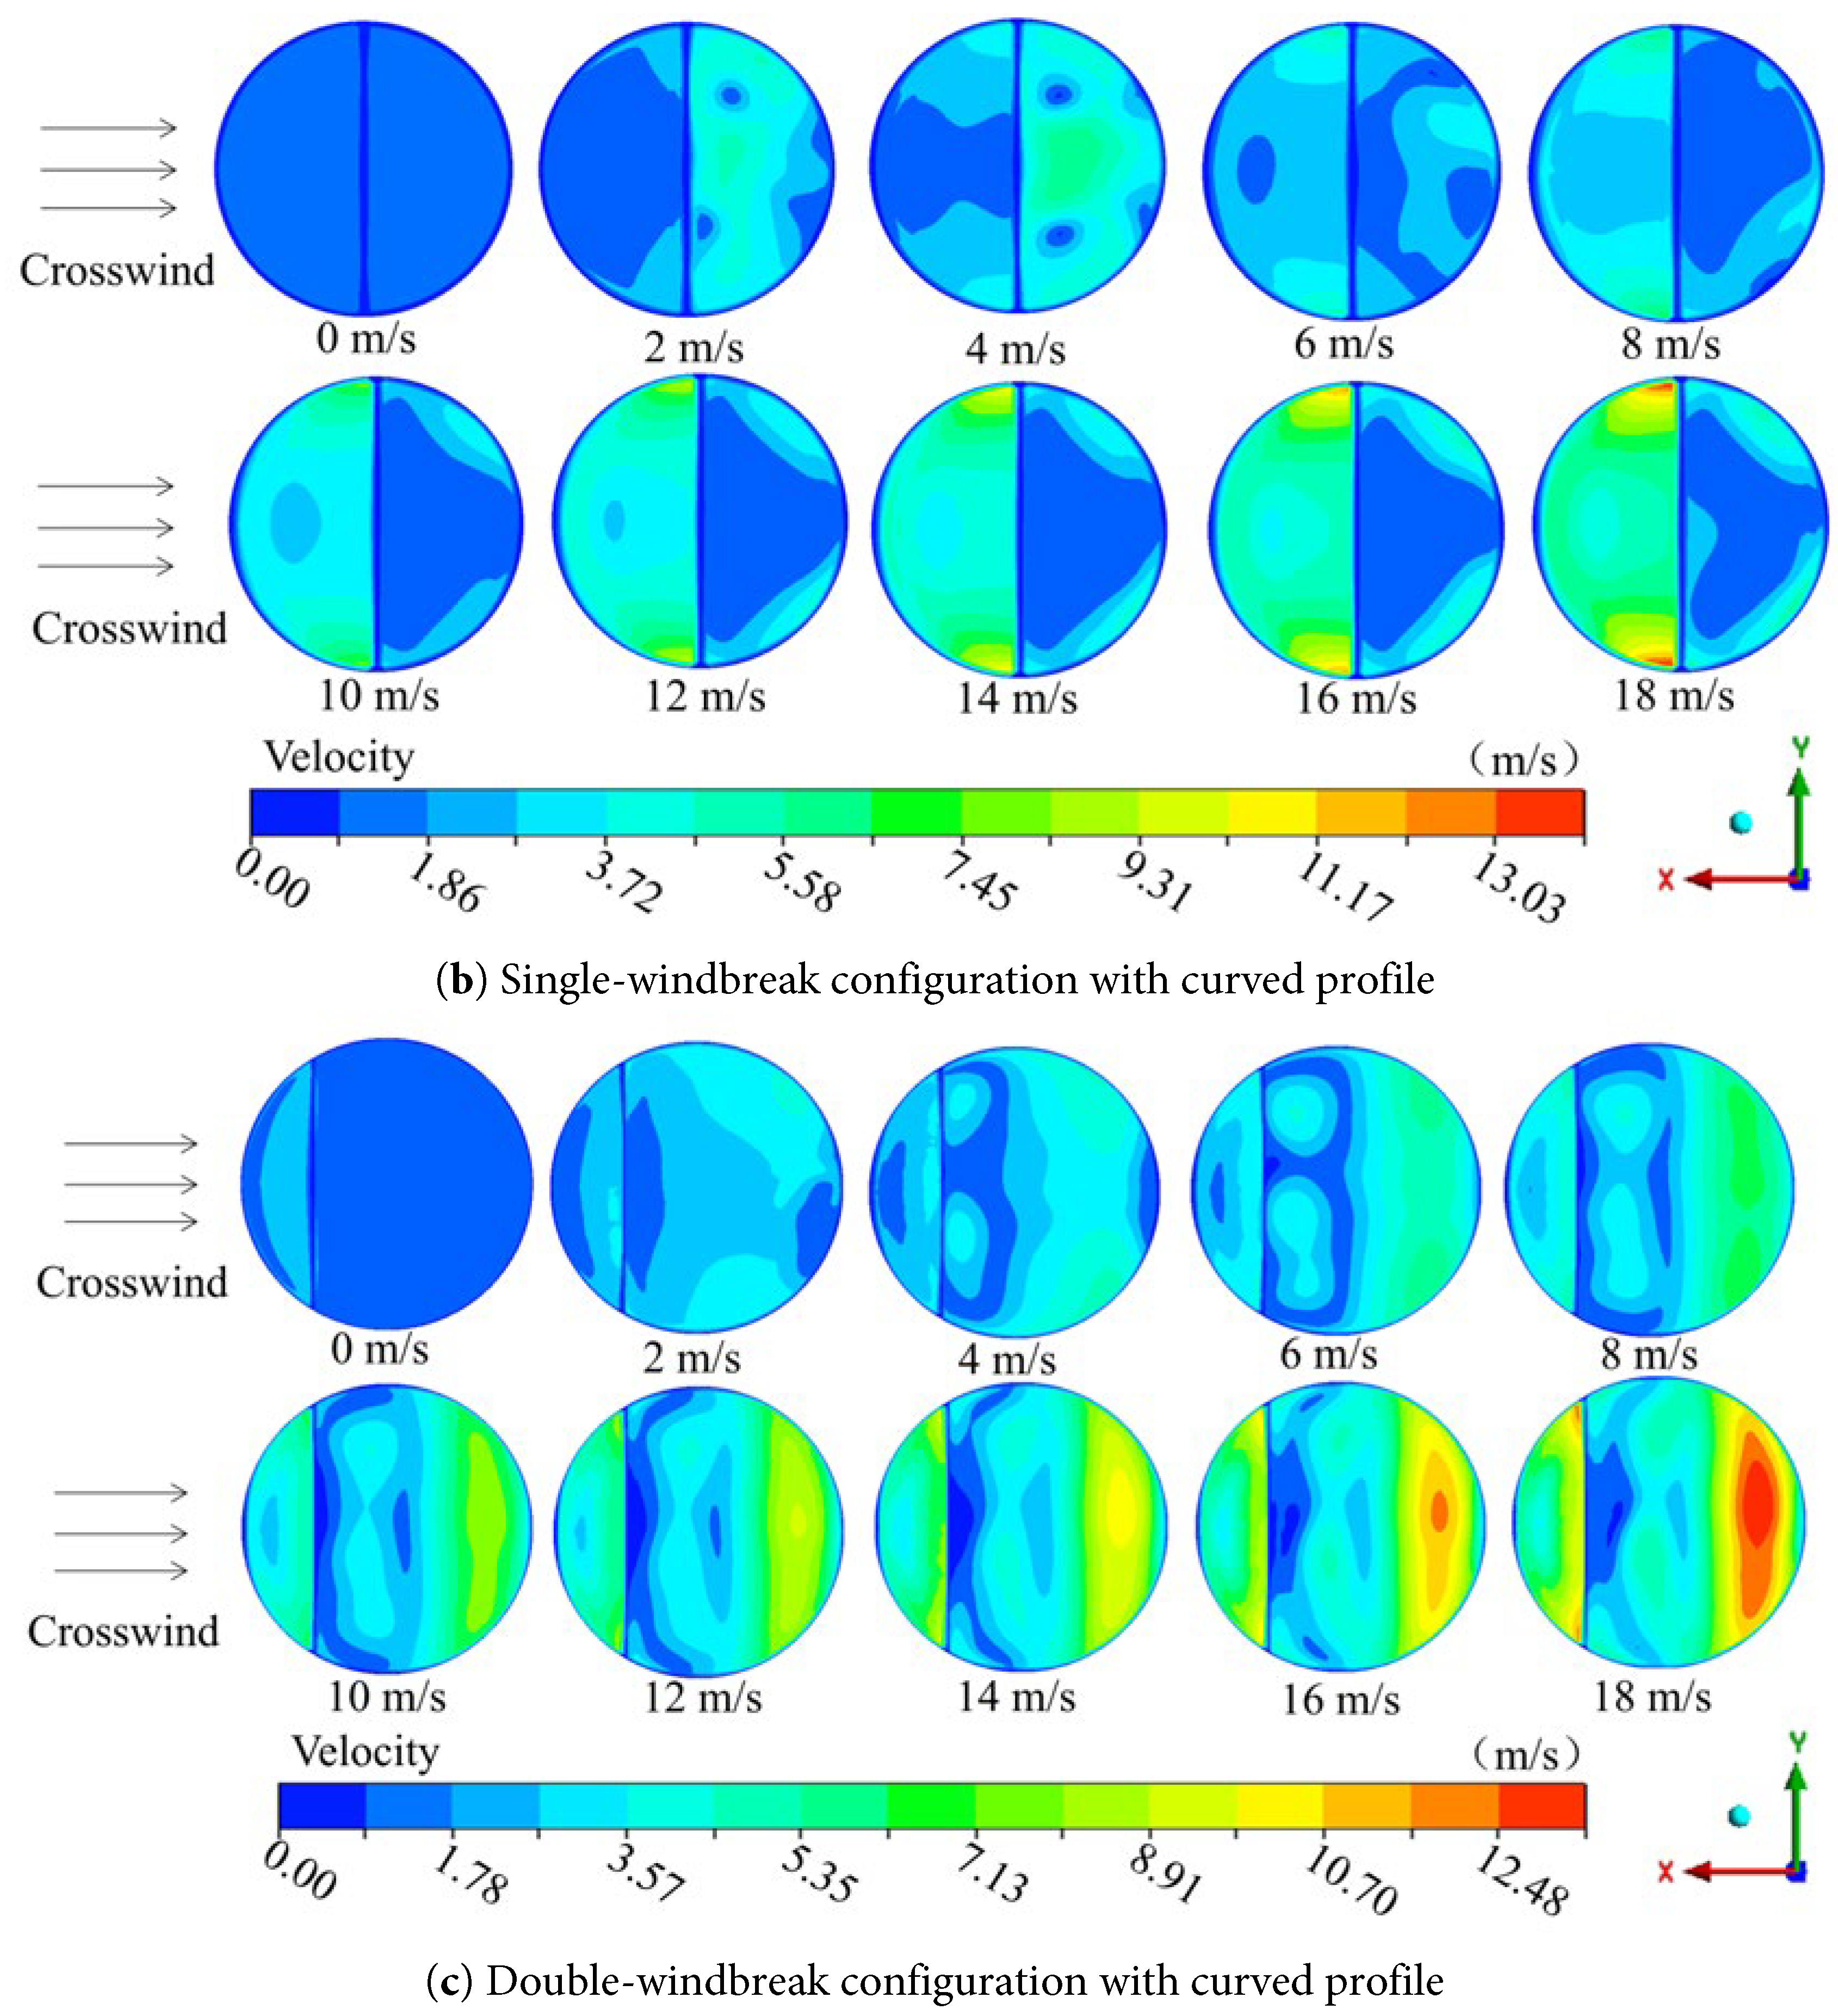
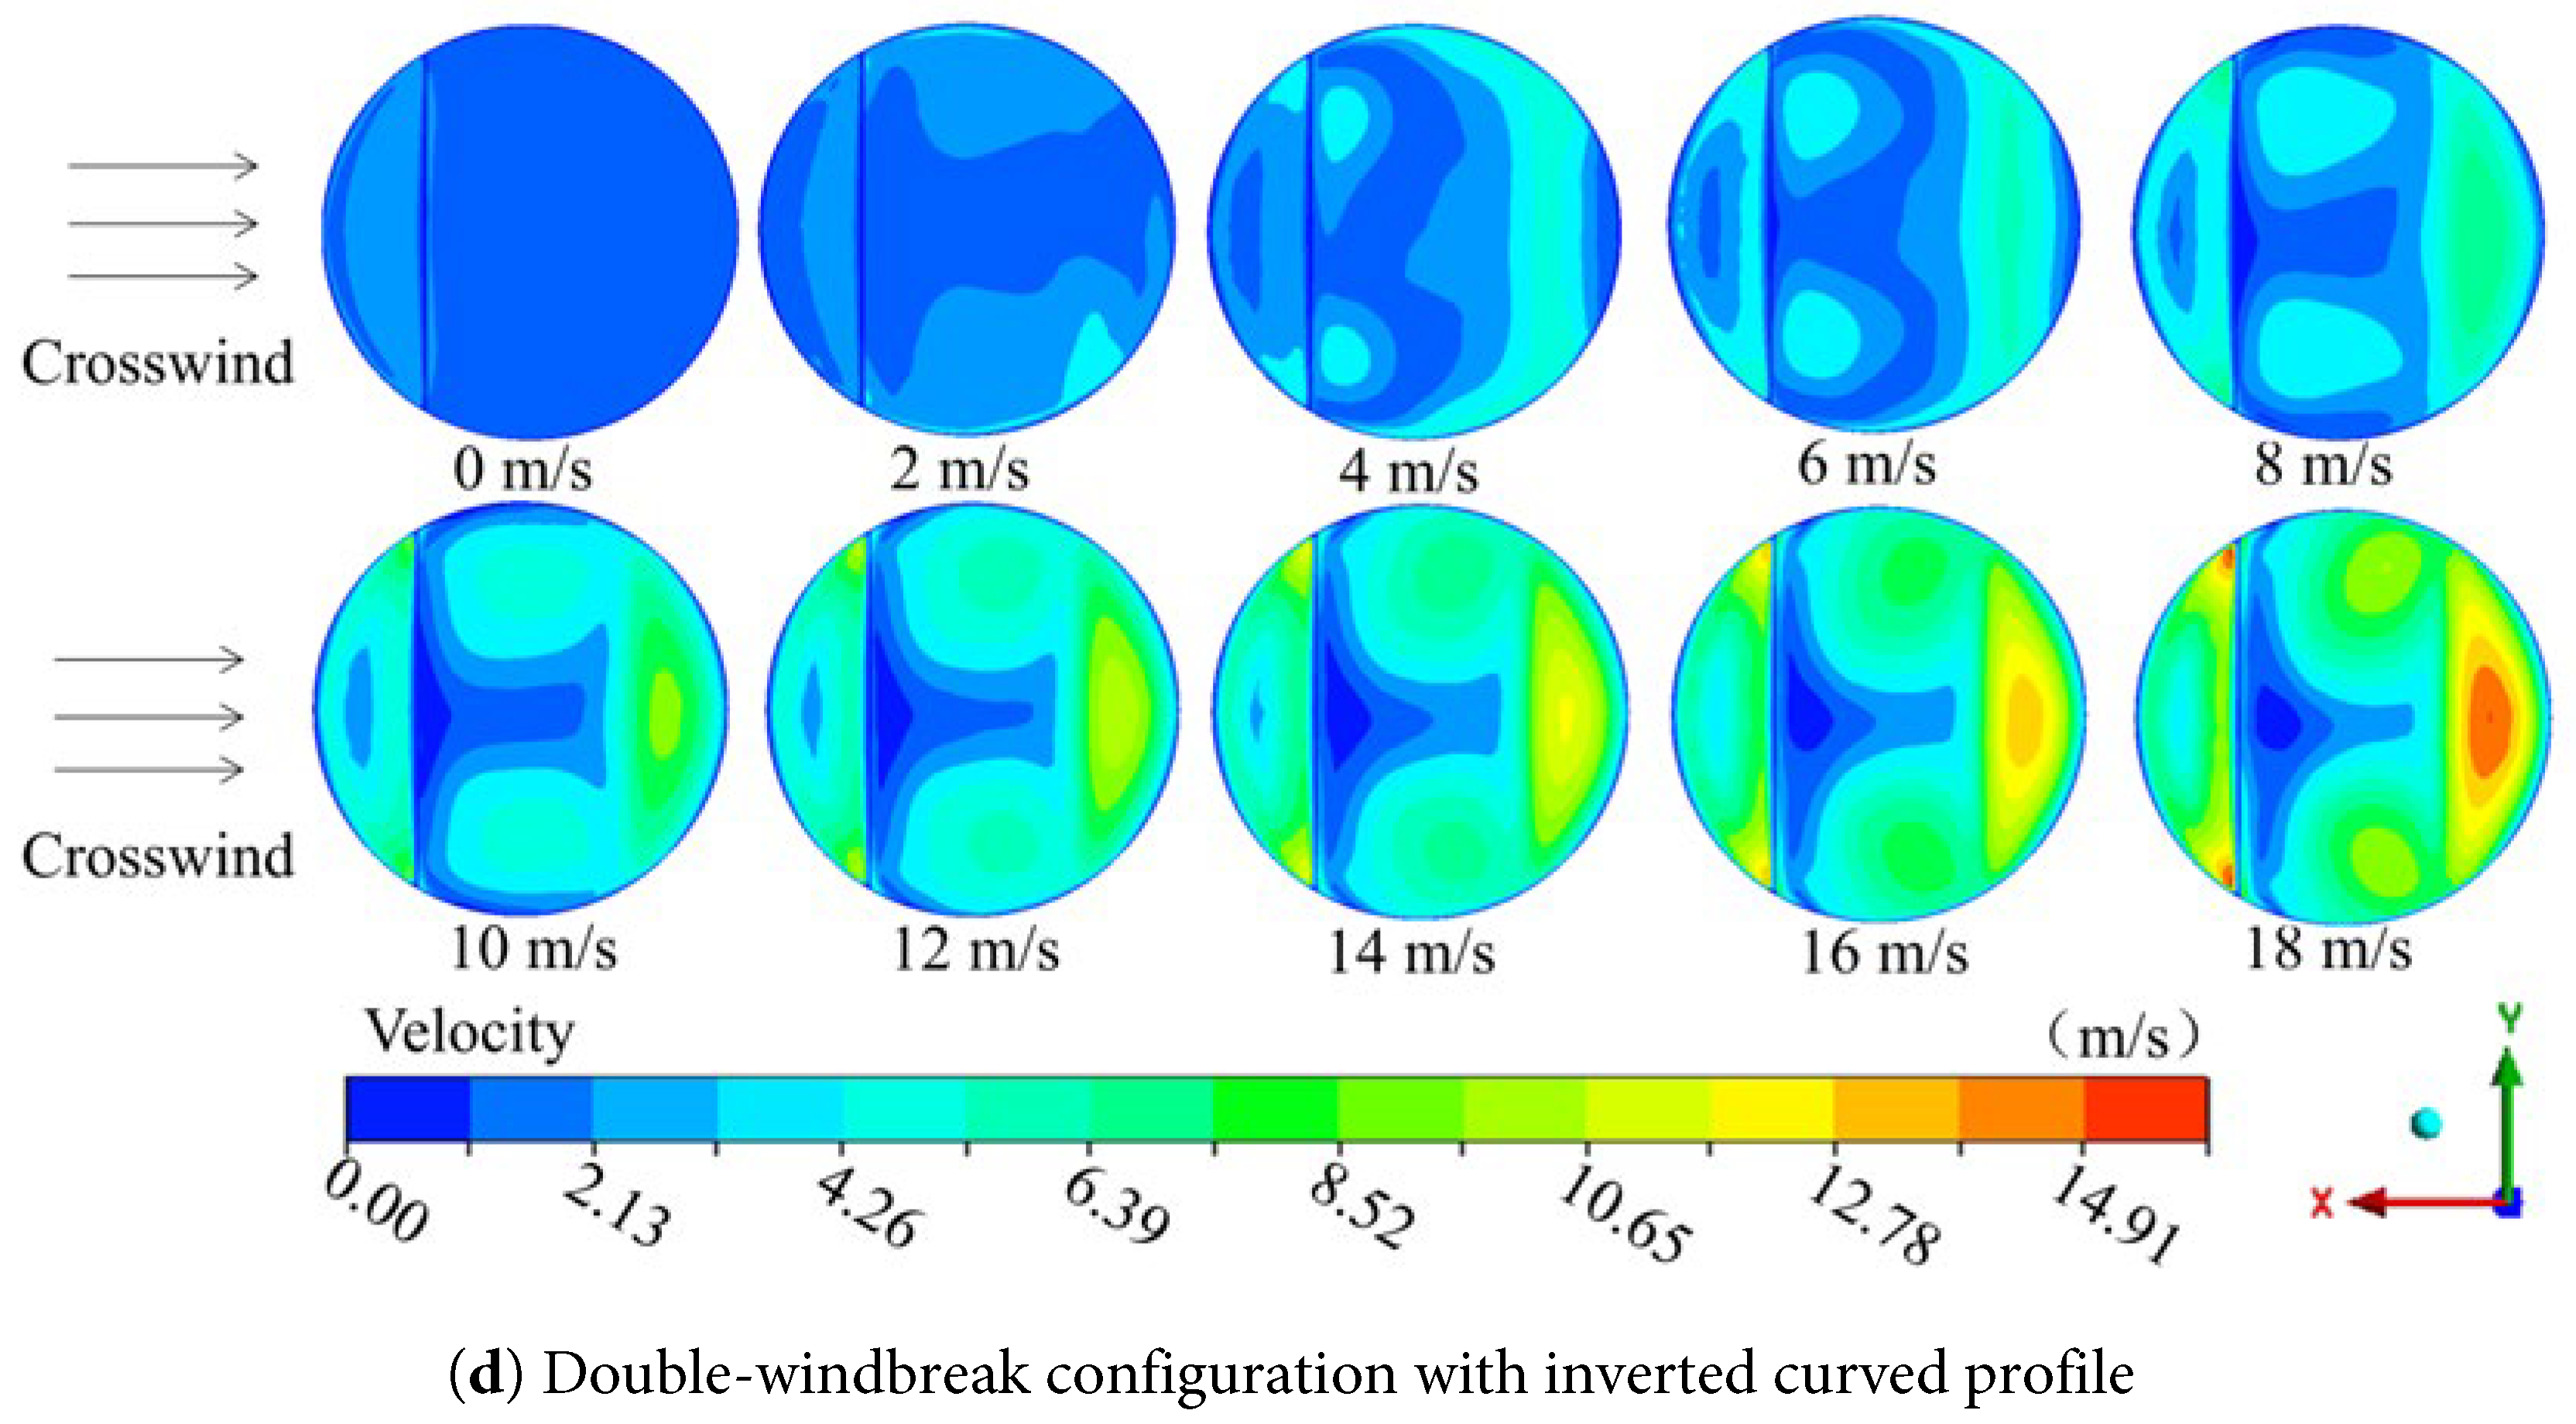
Figure 9: Air velocity distributions on the radiator surface of the NDDCT.
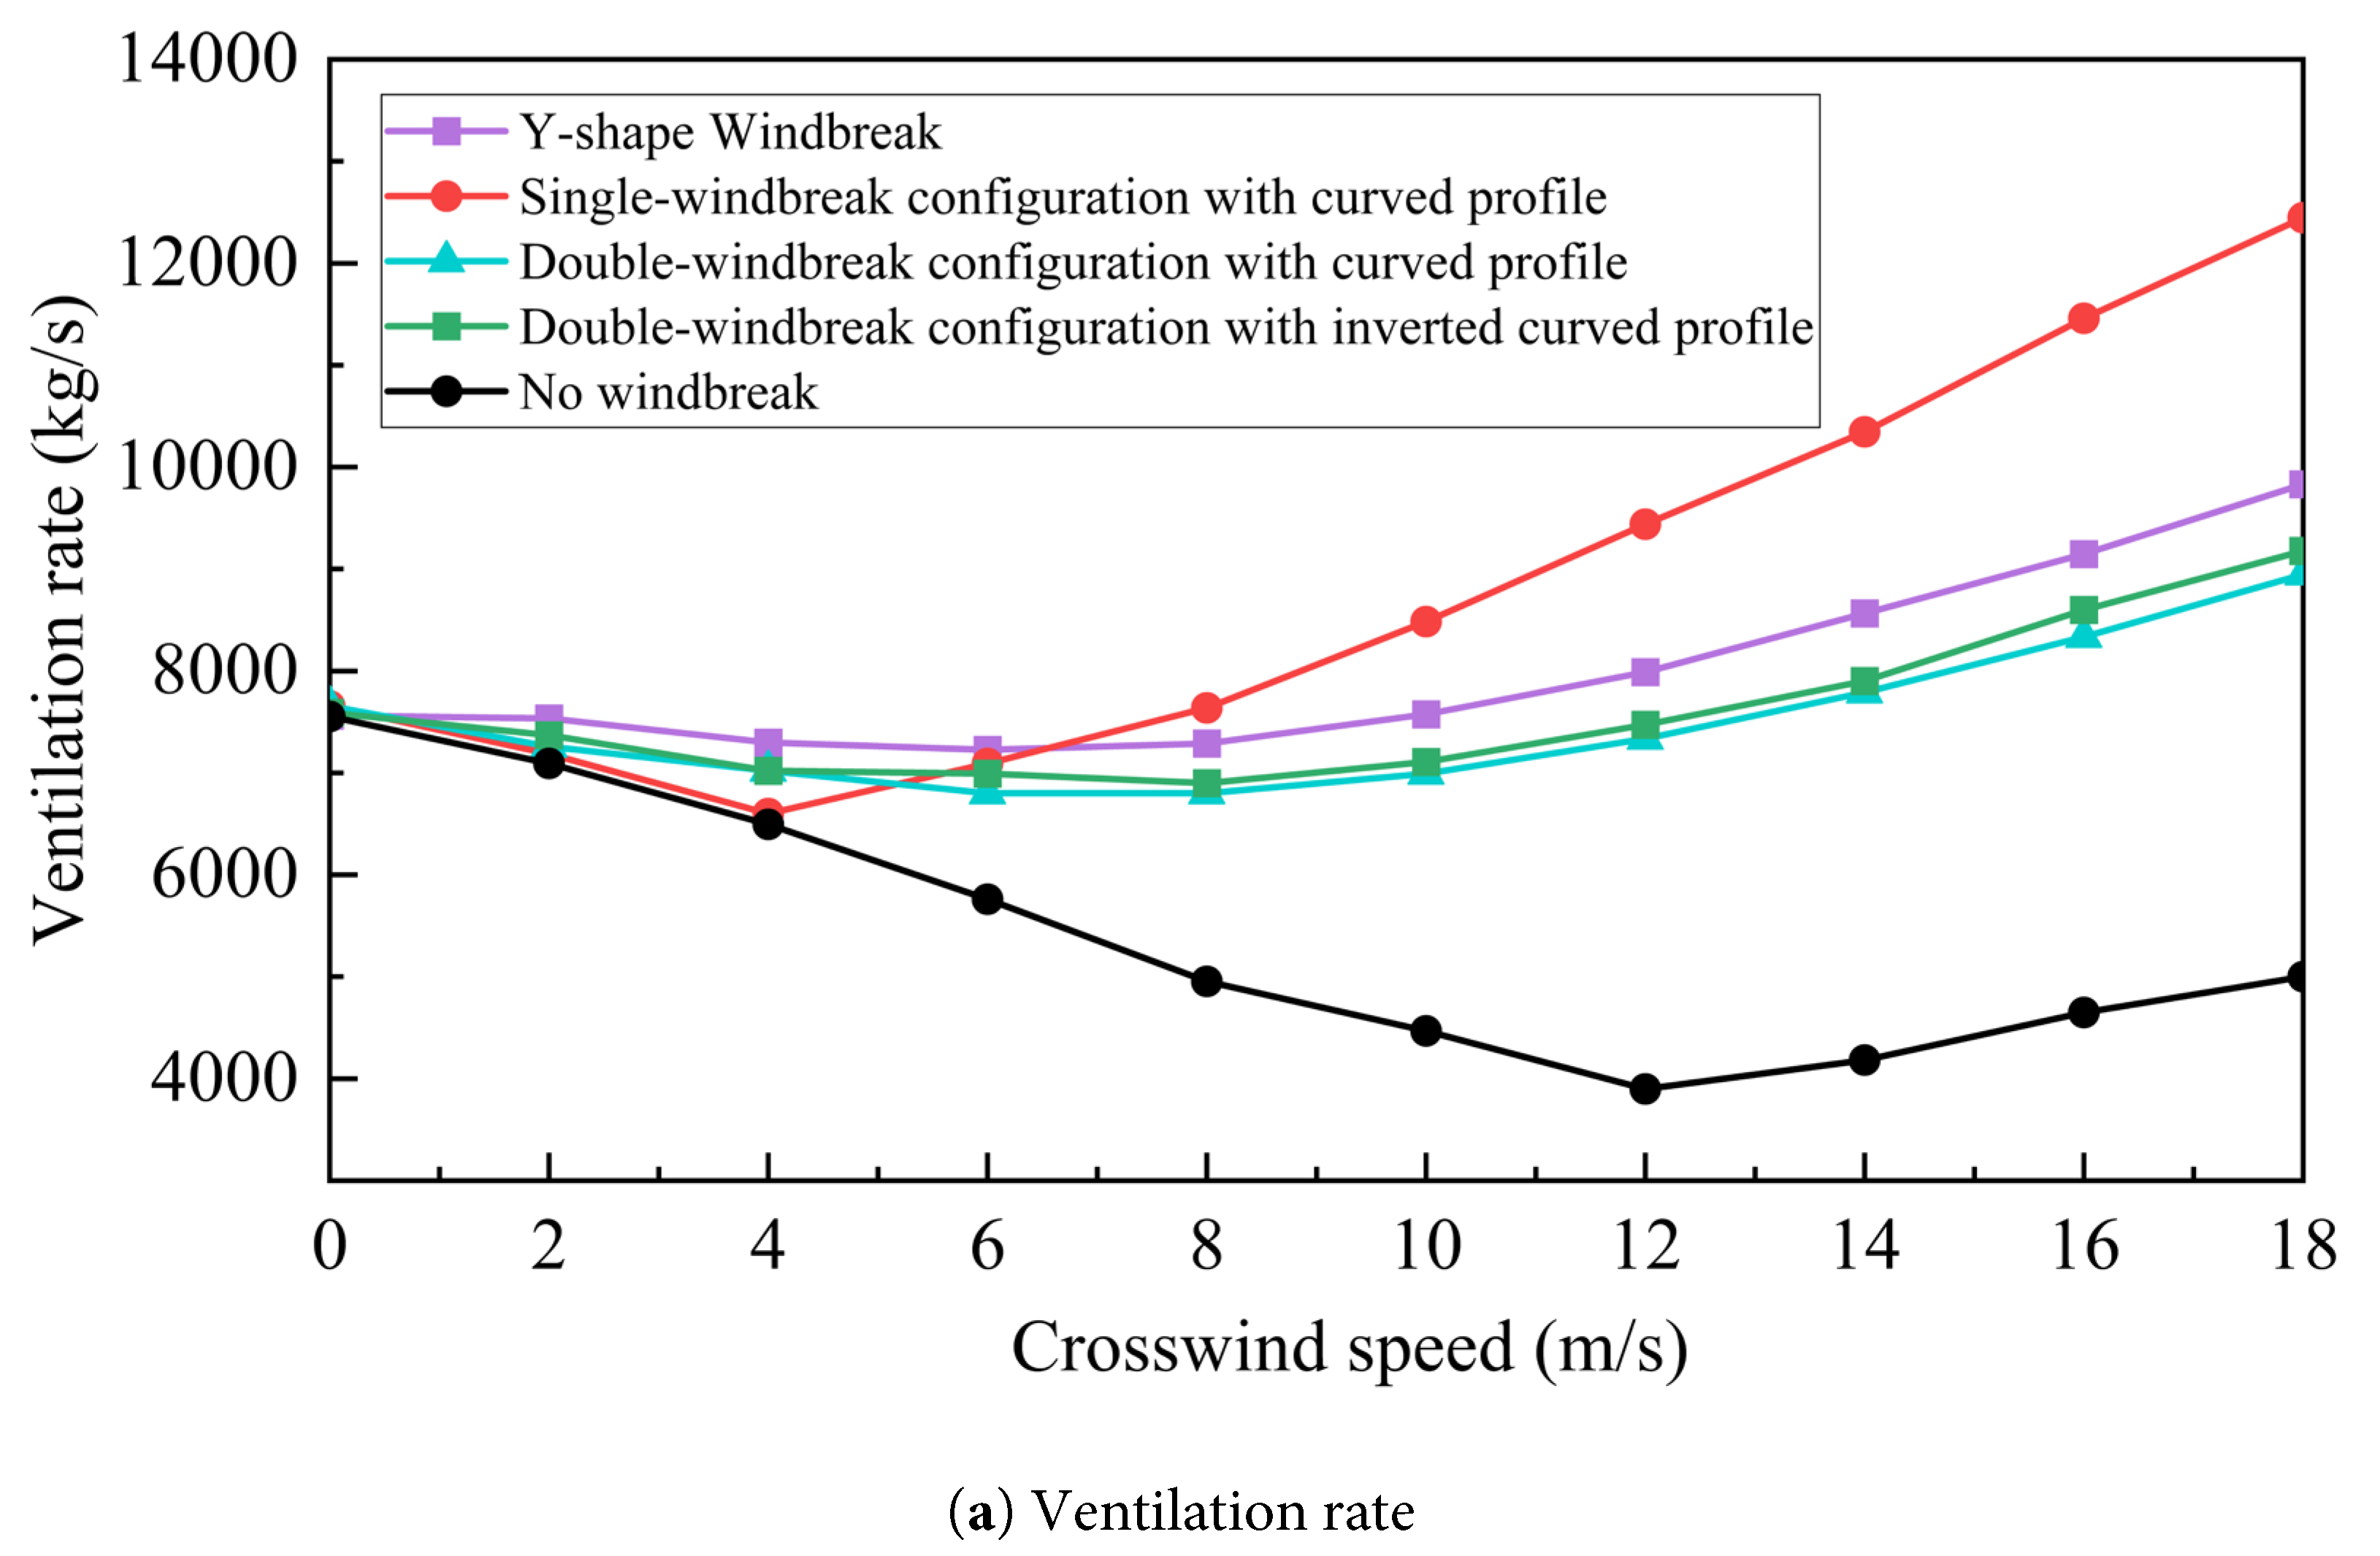
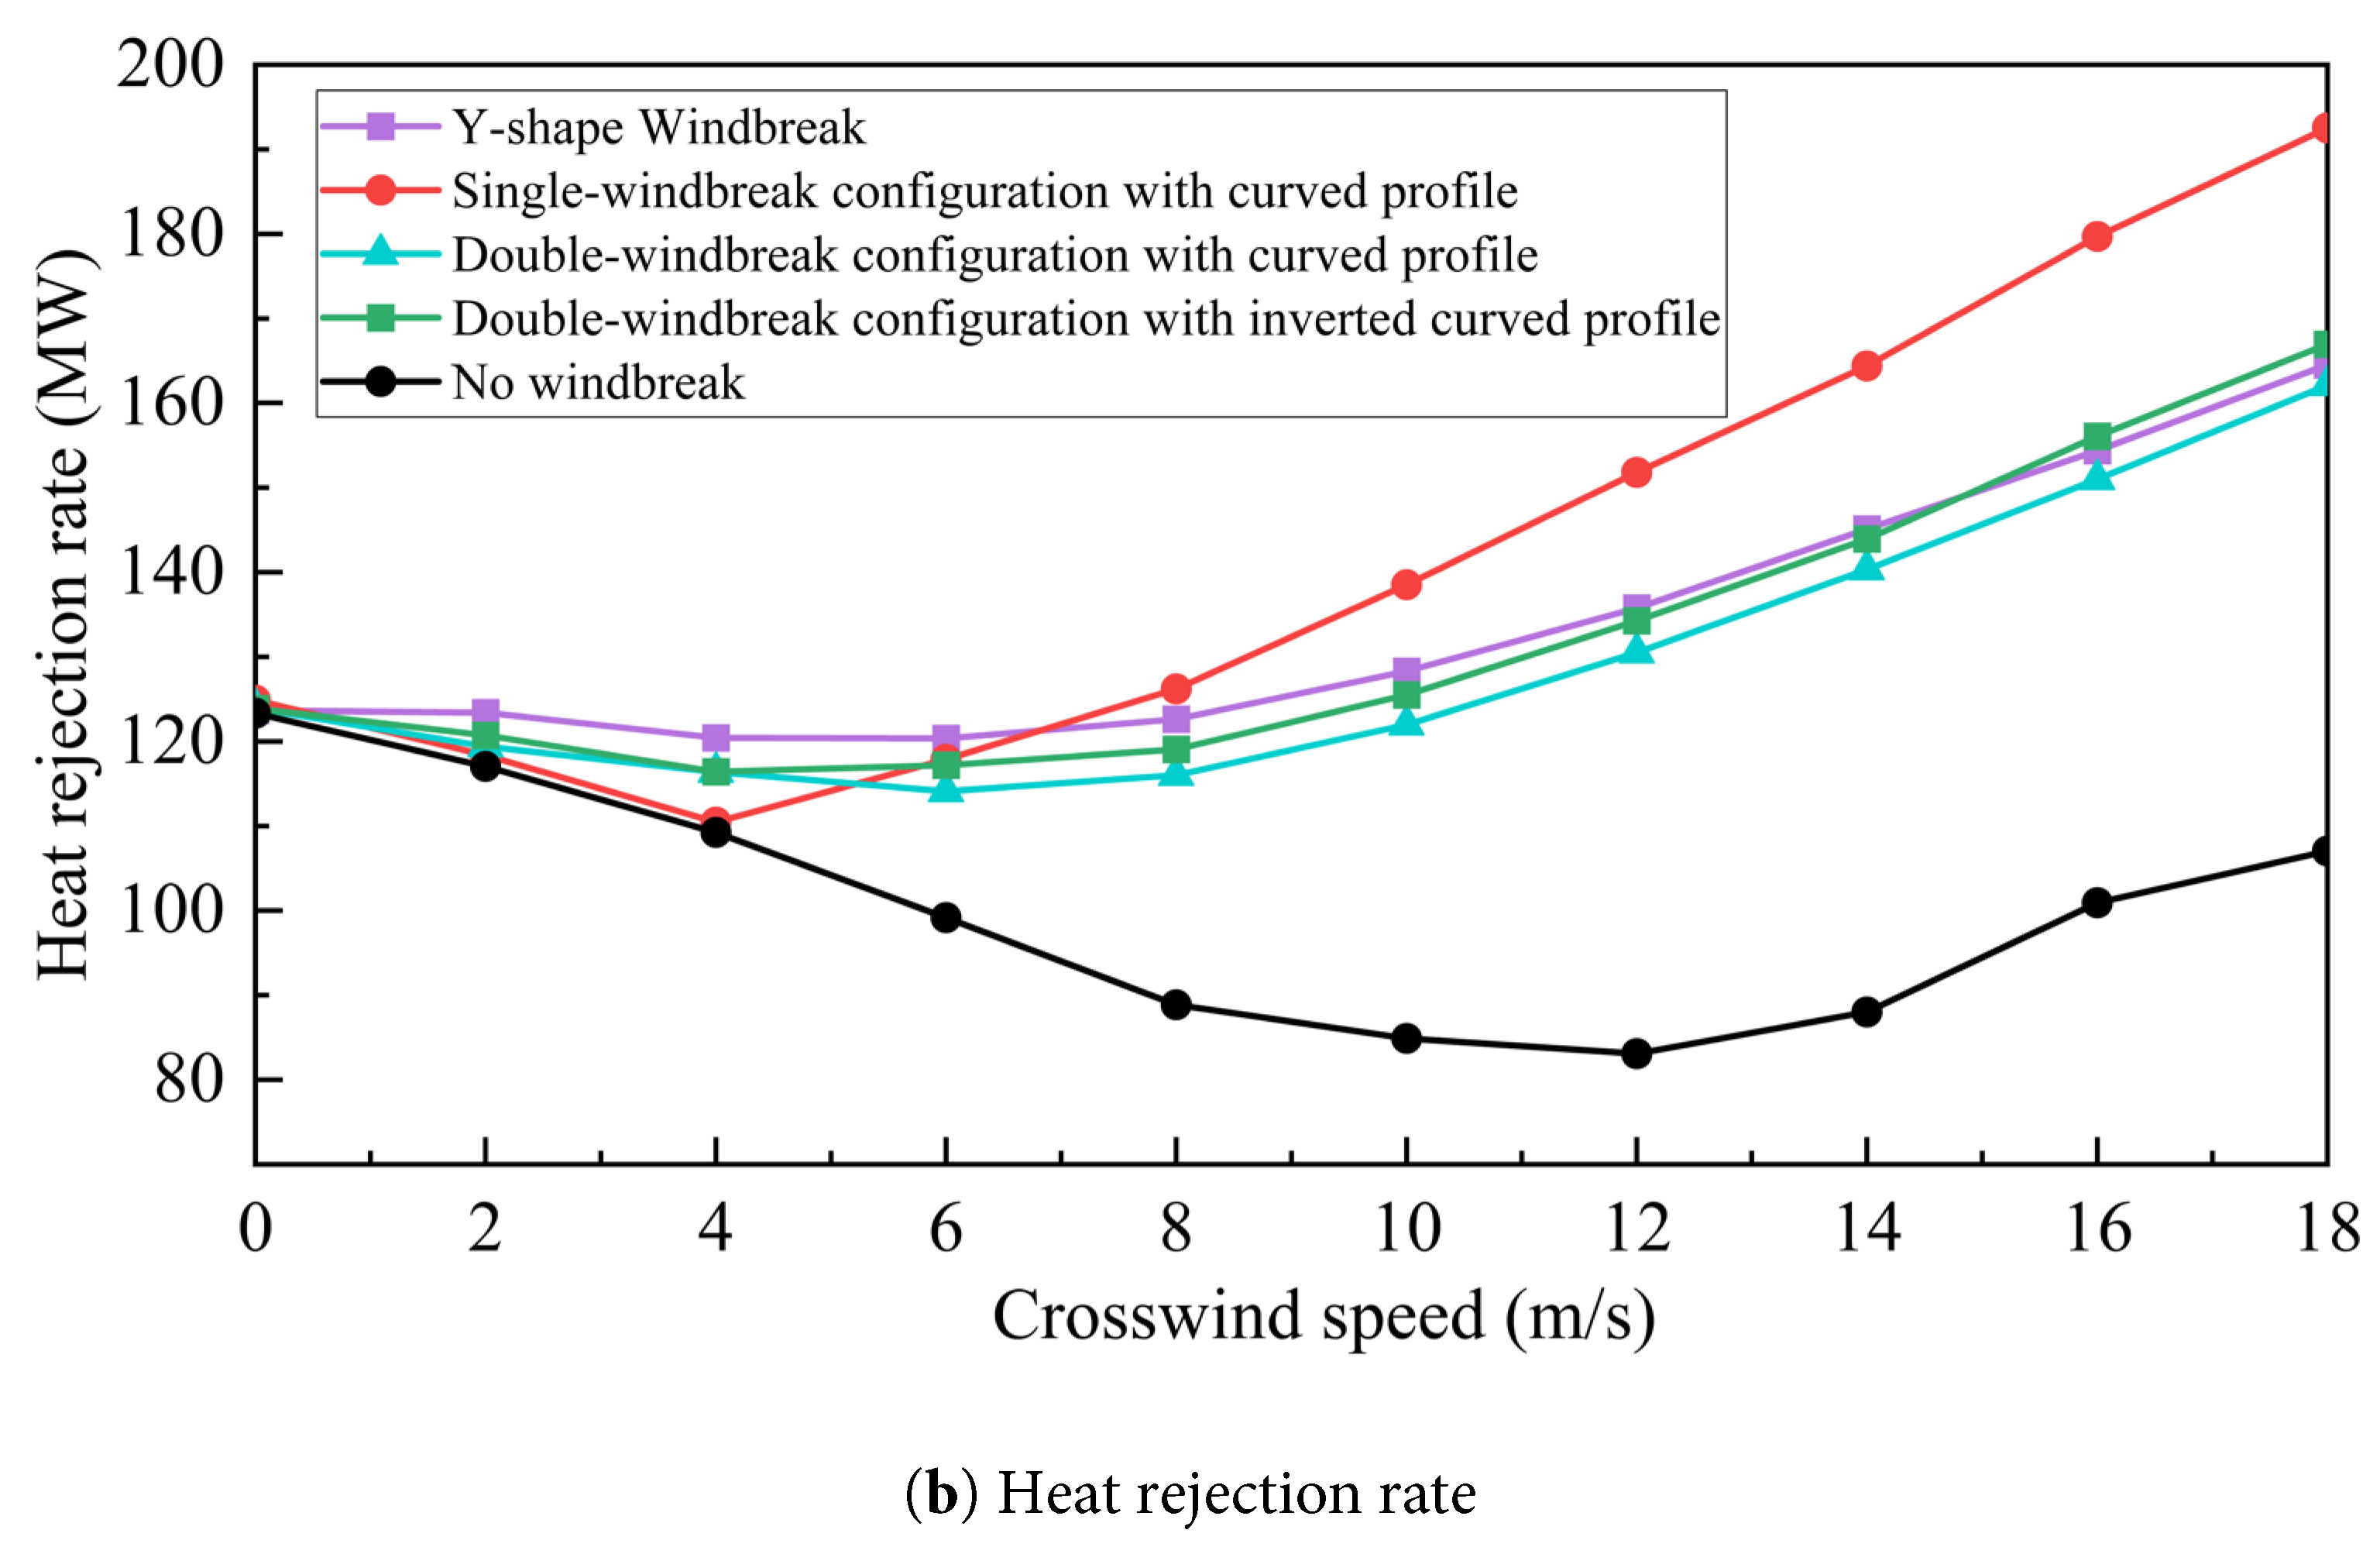
Figure 10: The variations of the (a) ventilation rate and (b) heat rejection rate of the NDDCT.
3.2 Air Velocity Distributions
The NDDCT is a heat rejection device that creates the air flow through the heat exchanger bundles by means of buoyancy effects due to the difference in air density between the inside and outside of the tower. Therefore, the air velocity distributions reflect the pressure characteristics. The velocity contours reveal the flow patterns and pressure losses, e.g., low-velocity zones indicate high flow resistance. The effect of windbreaks on the internal pressure differential of the tower is also indicated by the air velocity distributions. Besides, the pressure distributions influence the thermal region. The pressure distributions reflect the air velocity distributions and ventilation rate of the NDDCT, and in turn affect the thermal region (i.e., air temperature distributions and heat rejection rate).
Fig. 9a shows air velocity distributions on the radiator surface of the NDDCT installed with the Y-shaped windbreak. The air velocity distributions are relatively uniform when the crosswind speed ranges from 0 m/s to 2 m/s. High-velocity region emerges on the windward side as the crosswind speed increases from 4 m/s to 6 m/s. High-velocity region emerges on both the windward and leeward sides as the crosswind speed increases from 8 m/s to 18 m/s, and the velocity on the windward side is higher than that on the leeward side. Concurrently, as the crosswind speed increases, the high-velocity areas on both the windward and leeward sides expand, and the non-uniformity of air velocity distribution is intensified. This phenomenon is mainly attributed to the redistribution of the pressure field and the enhancement of wind-induced forced convection [44]. Under strong crosswind conditions, the airflow mechanism shifts from natural convection to crosswind-driven forced convection. A high-pressure stagnation zone forms at the windward inlet, blocking the airflow. In contrast, a relative low-pressure zone develops on the leeward side due to the airflow acceleration effect. This significant pressure gradient drives the ambient air to surge into the tower from the leeward side. Additionally, strong internal vortices generated by the crosswind reorganize the flow field, causing the airflow to concentrate and accelerate in the leeward region. Consequently, the high-velocity area on the leeward side expands significantly as the crosswind speed increases.
Fig. 9b shows air velocity distributions on the radiator surface of the NDDCT installed with the single-windbreak configuration with curved profile. The high-velocity region on the windward side expands as the crosswind speed increases. As a result, the velocity within the high-velocity region on the windward side gradually rises. The air velocity on the windward side is higher than that on the leeward side. The single-windbreak configuration with curved profile was proposed to use one curved shape to minimize the through-draught flow caused by the crosswind. As a result, the air speed on the windward side rises as shown in Fig. 9b. That is why the low-temperature zones on the windward side exist and expand gradually as the crosswind speed increase as shown Fig. 8b. Since there is no windbreak on the leeward side, the air speed on leeward side is relatively low when compared with the windward side.
Fig. 9c shows air velocity distributions on the radiator surface of the NDDCT installed with the double-windbreak configuration with curved profile. The high-velocity region on the windward side gradually enlarges as the crosswind speed rises from 0 m/s to 18 m/s. Concurrently, low velocity region emerges on the leeward side close to the second curved shape at the crosswind speed direction. This low velocity region reduces the airflow and subsequently decreases the airflow rate of the tower. Besides, the low velocity region is gradually diminished as the crosswind speed continues to increase. Fig. 9c indicates that as for the double-windbreak configuration with curved profile, the first curved shape at the crosswind speed direction improves the tower’s performance while the second curved shape at the crosswind speed direction functions not well.
Fig. 9d shows air velocity distributions on the radiator surface of the NDDCT installed with the double-windbreak configuration with inverted curved profile. Similar to the double-windbreak configuration with curved profile, the high-velocity region on the windward side gradually enlarges as the crosswind speed rises from 0 m/s to 18 m/s. Concurrently, low velocity region emerges on the leeward side close to the second curved shape at the crosswind speed direction. This low velocity region reduces the airflow and subsequently decreases the airflow rate of the tower. Besides, the low velocity region is gradually diminished as the crosswind speed continues to increase.
3.3 The Performance of the NDDCT
Fig. 10 reports the variations of the ventilation rate and heat rejection rate of the NDDCT under different crosswind speeds. As the crosswind speed rises from 0 m/s to 18 m/s, the ventilation rate and heat rejection rate of the tower firstly decrease and then increase. However, the ventilation rate and heat rejection rate are improved by windbreaks when compared with no windbreak situation. The same trends were reported by many researchers, e.g., the references [26,44].
As shown in Fig. 10, the ventilation rate and heat rejection rate of the NDDCT decline significantly with increased crosswind speed when there is no windbreak. The ventilation rate and heat rejection rate of the NDDCT reach to their minimum values when the crosswind speed is 12 m/s, the values of the ventilation rate and heat rejection rate are 51.61% and 67.36% of those at crosswind speed of 0 m/s, respectively. It is observed that when the crosswind speed exceeds 12 m/s, both the ventilation rate and heat rejection rate of the NDDCT exhibit an increasing trend; however, they remain consistently lower than the values obtained under windless conditions. The underlying reason for the performance recovery at high crosswind speeds is the transition of the dominant airflow driving mechanism from natural buoyancy to crosswind dynamics. For the NDDCT without windbreaks, when the crosswind speed is below 12 m/s, the airflow is driven by the density difference between the inside and outside air. In this regime, the crosswind primarily acts as a disturbance, causing flow disorder, vortices, and local recirculation at the windward inlet. These factors hinder the smooth inflow of ambient air, resulting in a decrease in ventilation and cooling performance. However, when the crosswind speed exceeds 12 m/s, the dynamic effect of the crosswind overwhelms the natural buoyancy, becoming the dominant force driving the airflow. The low-pressure suction effect on the leeward side is drastically enhanced, which forcibly increases the mass flow rate of cooling air sucked through the leeward radiators. Additionally, the higher transverse air velocity flowing across the bottom surface of the radiator significantly increases the contribution of forced convective heat transfer [44]. These enhancing effects induced by the crosswind dynamic pressure collectively override the negative impacts of the windward flow deterioration and natural draft attenuation. Consequently, the total heat rejection rate and ventilation rate exhibit a definitive increasing trend as the crosswind speed rises in this high-velocity range.
As for the Y-shaped windbreak case, the ventilation rate and heat rejection rate are improved significantly when compared to the case with no windbreak. The ventilation rate and heat rejection rate drop to their minimum values when the crosswind speed is 6 m/s, the values of the ventilation rate and heat rejection rate are 95.57% and 97.31% of those at crosswind speed of 0 m/s, respectively. The ventilation rate and heat rejection rate of the Y-shaped windbreak case are increased by 25.45% and 21.37%, respectively when compared to the no windbreak case. However, the ventilation rate and heat rejection rate of the Y-shaped windbreak case exceed those at crosswind speed of 0 m/s when the crosswind speed is increased to 10 m/s. The improvements of the ventilation rate and heat rejection rate of the Y-shaped windbreak case range from 0.12% to 96.60% and 0.27% to 53.71%, respectively within the crosswind speed range of 0 m/s–18 m/s when compared to the no windbreak case.
As for the single-windbreak configuration with curved profile case, the ventilation rate and heat rejection rate are improved significantly when compared to the case with no windbreak, especially at high crosswind speeds. The ventilation rate and heat rejection rate of the single-windbreak configuration with curved profile case drop to their minimum values when the crosswind speed is 4 m/s, the values of the ventilation rate and heat rejection rate are 86.21% and 88.46% of those at crosswind speed of 0 m/s, respectively. The ventilation rate and heat rejection rate of the single-windbreak configuration with curved profile case are improved by 1.61% and 1.11%, respectively when compared to the no windbreak case. The Y-shaped windbreak exhibits superior performance to the single-windbreak configuration with curved profile when the crosswind speed ranges from 0 m/s to 6 m/s. However, the single-windbreak configuration with curved profile is superior to the Y-shaped windbreak when the crosswind speed ranges from 6 m/s to 18 m/s. The improvements of the ventilation rate and heat rejection rate of the single-windbreak configuration with curved profile case are 26.59% and 17.01%, respectively at the crosswind speed of 18 m/s when compared to the Y-shaped windbreak case.
As for the double-windbreak configuration with curved profile case, the ventilation rate and heat rejection rate are improved significantly when compared to the case with no windbreak. The ventilation rate and heat rejection rate of the double-windbreak configuration with curved profile case drop to their minimum values when the crosswind speed is 6 m/s, the values of the ventilation rate and heat rejection rate are 88.83% and 92.09% of those at crosswind speed of 0 m/s, respectively. The ventilation rate and heat rejection rate of the double-windbreak configuration with curved profile case are improved by 18.04% and 15.05%, respectively when compared to the no windbreak case. The improvements of the ventilation rate and heat rejection rate of the double-windbreak configuration with curved profile case range from 1.37% to 78.94% and 0.47% to 51.43%, respectively within the crosswind speed range of 0 m/s–18 m/s when compared to the no windbreak case.
As for the double-windbreak configuration with inverted curved profile case, the ventilation rate and heat rejection rate are improved significantly when compared to the case with no windbreak. The ventilation rate and heat rejection rate of the double-windbreak configuration with inverted curved profile case drop to their minimum values when the crosswind speed is 4 m/s, the values of the ventilation rate and heat rejection rate are 92.49% and 93.96% of those at crosswind speed of 0 m/s, respectively. The ventilation rate and heat rejection rate of the double-windbreak configuration with inverted curved profile case are improved by 8.10% and 6.56%, respectively when compared to the no windbreak case. The improvements of the ventilation rate and heat rejection rate of the double-windbreak configuration with inverted curved profile case range from 0.52% to 83.51% and 0.45% to 55.98%, respectively within the crosswind speed range of 0 m/s–18 m/s when compared to the no windbreak case. Besides, the heat rejection rate of the double-windbreak configuration with curved profile case is larger than that of the Y-shaped windbreak case when the crosswind speed is within 16 m/s–18 m/s.
Therefore, the Y-shaped windbreak is recommended for the regions with crosswind speeds below 6 m/s while the single-windbreak configuration with curved profile is preferable for the regions with crosswind speeds exceeding 6 m/s. The aerodynamic mechanism governing the superior performance of the single-windbreak configuration with curved profile at high crosswind speeds (crosswind speeds exceeding 6 m/s) involves a critical trade-off between flow uniformity and momentum capture efficiency. As established in previous studies [23,26], the degradation of cooling performance under strong crosswinds is predominantly caused by the through-draught effect, where high-momentum air penetrates horizontally through the tower bottom, inducing a low-pressure suction zone underneath the radiator. To counteract this, the windbreak must effectively intercept the horizontal momentum and convert it into upward static pressure. In this regard, the single-windbreak configuration with curved profile exhibits a distinct geometric advantage. Its continuous concave structure functions as a robust flow interceptor, creating a concentrated stagnation pressure zone at the windward entrance. Unlike the double-windbreak configuration with curved profile and double-windbreak configuration with inverted curved profile, which utilize segmented leading edges to split airflow for better uniformity, the single-windbreak configuration with curved profile minimizes flow bypass and separation at the structural tips. While the double-windbreak configuration with curved profile and double-windbreak configuration with inverted curved profile designs are effective at homogenizing the flow field at lower crosswind speeds, their segmented geometry inherently reduces the effective frontal area available for intercepting strong crosswinds. Consequently, when the crosswind speed exceeds 6 m/s, the dominance of the through-draught inertia renders the uniformity factor secondary. The single-windbreak design, by providing the maximum continuous interception area, most effectively suppresses the horizontal penetration and forces the high-speed air upward into the heat exchanger. This mechanism explains its superior ventilation and heat rejection rates under high crosswind conditions, despite its simpler geometry compared to the double-windbreak configuration with curved profile and double-windbreak configuration with inverted curved profile.
To visually illustrate the aerodynamic mechanism governing the superior performance of the single-windbreak configuration with curved profile, the air-velocity streamlines beneath and above the radiator with a crosswind speed at 4 m/s are plotted in Fig. 11. Fig. 11 shows that the single-windbreak configuration with curved profile functions as a robust flow interceptor due to its continuous concave geometry. The incoming crosswind is effectively blocked at the windward side, creating a distinct stagnation zone. Instead of penetrating horizontally through the tower bottom (i.e., through-draught flow), the streamlines are forced to turn sharply upward into the heat exchanger. This geometric interception mechanism, while illustrated here at 4 m/s, remains the fundamental governing principle across the crosswind speed range. Specifically, as the crosswind speed increases (exceeding 6 m/s), the inertia of the horizontal airflow becomes stronger, making this forced upward redirection increasingly critical for preventing through-draught flow. Consequently, the single-windbreak design, which provides the most effective physical blockage and flow redirection, sustains the highest ventilation and heat rejection rates under strong crosswind conditions.
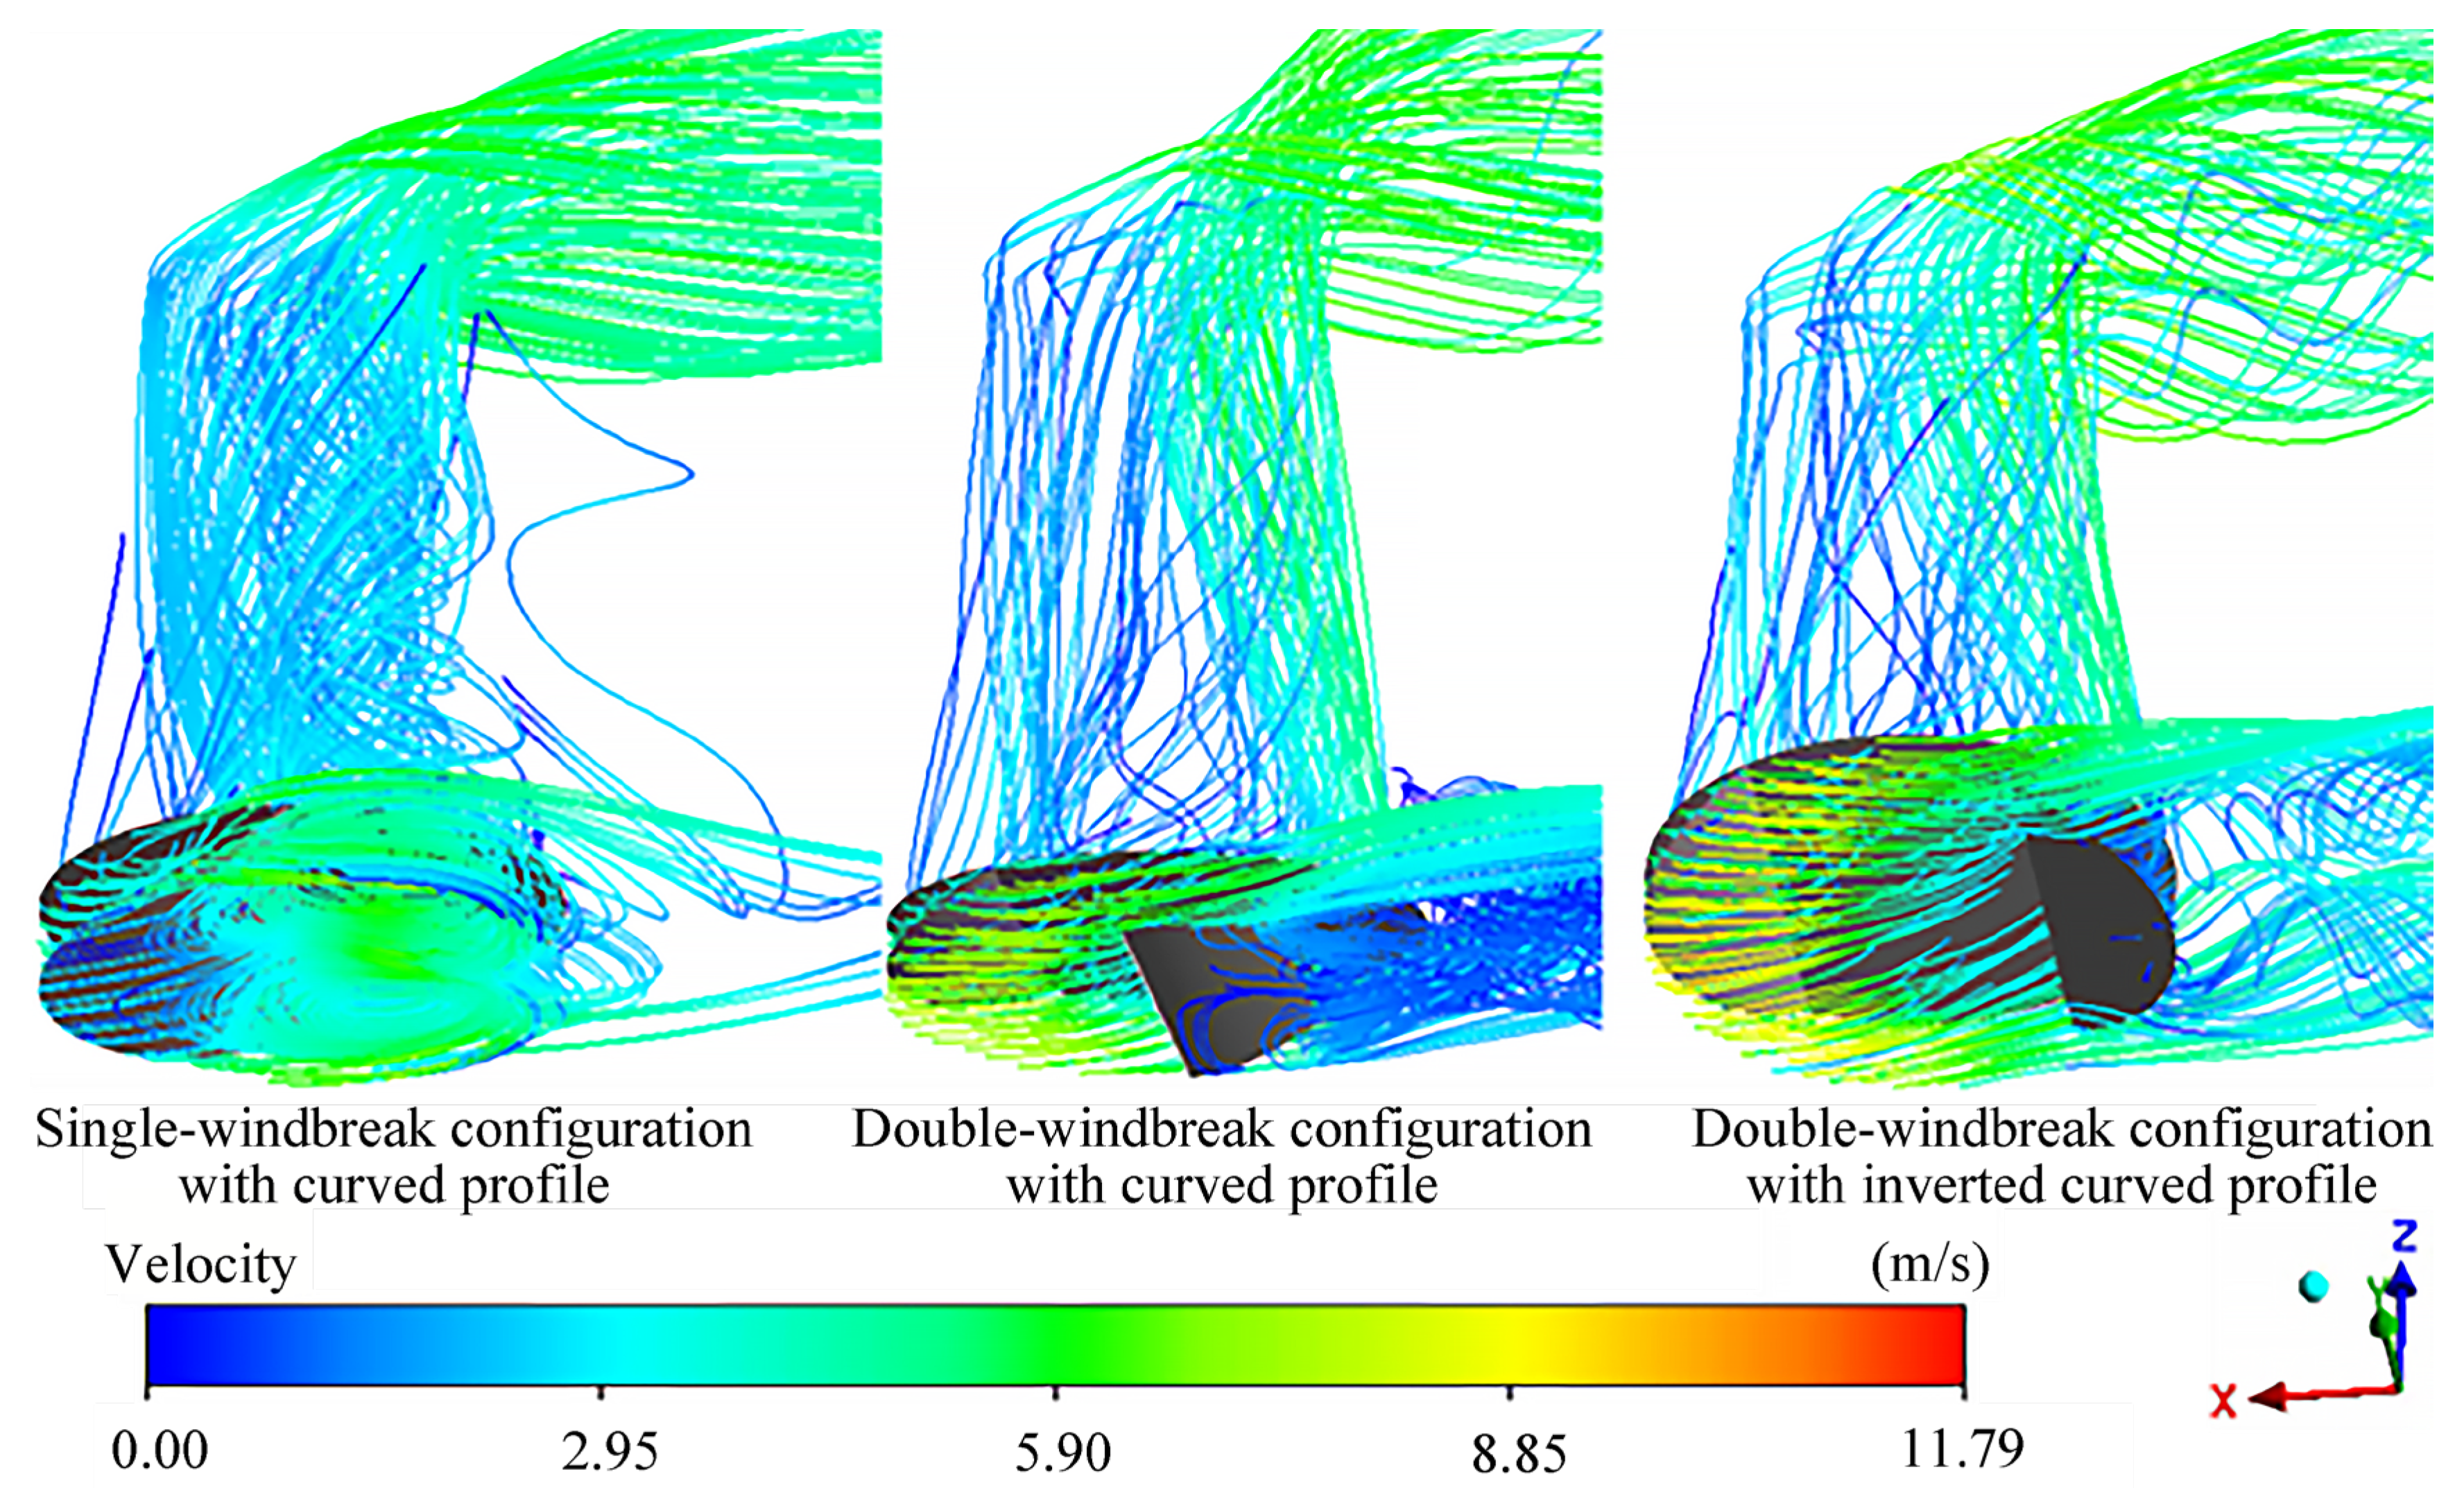
Figure 11: Air-velocity streamlines around the NDDCT with a crosswind speed at 4 m/s.
Results show that for NDDCTs, regardless of whether windbreaks are installed, there exists a specific critical crosswind speed. When the crosswind speed is lower than that, the heat rejection rate and ventilation rates of the NDDCT gradually decrease to a minimum as the crosswind speed increases. Conversely, once the crosswind speed exceeds this critical crosswind speed, the heat rejection rate and ventilation rates begin to recover and gradually increase with rising crosswind speed. Specifically, the critical crosswind speed for the NDDCT without windbreaks is 12 m/s. However, the design of windbreaks significantly alters the critical crosswind speed. Our results demonstrate that different windbreaks lead to different critical crosswind speeds: 6 m/s for the Y-shaped, 4 m/s for the single-windbreak configuration with curved profile, 6 m/s for the double-windbreak configuration with curved profile, and 4 m/s for the double-windbreak configuration with inverted curved profile.
Table 4 lists the turning point values and the characteristics of air temperature distributions and air velocity distributions on the radiator surface of the NDDCT installed with no windbreak, the Y-shaped windbreak, the single-windbreak configuration with curved profile, the double-windbreak configuration with curved profile and the double-windbreak configuration with inverted curved profile.
Table 4: The turning point values and the characteristics of air temperature and velocity distributions.
| Windbreak Type | The Crosswind Speed at Turning Point (m/s) | The Ventilation Rate at Turning Point (kg/s) | The Heat Rejection Rate at Turning Point (MW) | The Characteristics of Air Temperature Distributions | The Characteristics of Air Velocity Distributions |
|---|---|---|---|---|---|
| No windbreak | 12 | 3898.5 | 83.1 | / | / |
| Y-shaped windbreak | 6 | 7227.6 | 120.4 | Moderately uniform | Moderately uniform |
| Single-windbreak configuration with curved profile | 4 | 6600.7 | 110.5 | Moderately uniform | Moderately uniform |
| Double-windbreak configuration with curved profile | 6 | 6801.1 | 114.1 | Non-uniform | Non-uniform |
| Double-windbreak configuration with inverted curved profile | 4 | 7022.5 | 116.4 | Non-uniform | Non-uniform |
To further assess the superiority of the novel proposed windbreaks under strong crosswind conditions, the performance of the single-windbreak configuration with curved profile is compared with windbreak structures reported in previous studies. Goodarzi et al. [45] investigated radiator-type windbreaks which increased the heat rejection rate by approximately 26.26% under a crosswind speed of 10 m/s. Yan et al. [46] investigated windbreak walls for a two-tower system and reported a heat rejection rate enhancement of roughly 32% at a crosswind speed of 12 m/s. Additionally, Wang et al. [20] proposed a windbox structure which increased the ventilation rate by approximately 60% under a crosswind speed of 20 m/s. In comparison, the single-windbreak configuration with curved profile proposed in this work achieves a 63.13% increase in heat rejection rate at 10 m/s, an 82.69% increase in heat rejection rate at 12 m/s and a 148.88% increase in ventilation rate at 18 m/s compared to the no windbreak case. These comparisons demonstrate that the proposed single-windbreak configuration with curved profile exhibits superior performance under high crosswind conditions, significantly enhancing the ventilation rate and heat rejection rate of the cooling tower.
The primary design objective was to mitigate the through-draught flow caused by crosswinds, where air passes directly from the windward to the leeward side at the tower bottom without passing through the heat exchanger. To address this problem, the windbreak shapes were designed to align with the tower’s inlet airflow field. As shown in Fig. 10, the novel proposed windbreaks improve the overall ventilation rate of the NDDCT when compared with no windbreak case. In the current study, the variation of the curvature was not considered. In the future, experimental study about the potential design found by this study as the single-windbreak configuration with curved profile, and its structure optimization with considering the variations of the curvature, constructability, material requirements and operational cost will be carried out to provide guidance for engineering application. Besides, the current study did not consider the effect of the windbreaks on acoustic behavior or interaction with the surrounding environment. As far as we know, as for the acoustic behavior, the windbreaks may cause additional flow noise. But the additional flow noise will not be excessive. This is because the shapes of the windbreaks are in accordance with the tower inlet airflow field. The intention of these designs is to extend the inlet airflow rather than disturbing the airflow so as to minimize the airflow resistance caused by the windbreaks. As for the surrounding environment (e.g., prevailing winds), the windbreaks are installed inside the NDDCT to mitigate the detrimental impact of ambient crosswind on the thermal performance of the NDDCT; they will not affect the prevailing winds on the windward side, but they may affect the prevailing winds on the leeward side, especially the wind speed on leeward side. Besides, the current study did not consider the economic potential of the proposed windbreaks. Further studies about the effect of the windbreaks on acoustic behavior or interaction with the surrounding environment and the economic potential of the proposed windbreaks are suggested.
The following conclusions can be drawn from this study.
- (1)The installation of windbreak significantly influences the uniformity of air temperature distributions and velocity distributions on the radiator surface of the NDDCT under crosswind conditions. The uniformity of air temperature distributions and velocity distributions decreases significantly as the crosswind speed increases. Among the four studied windbreaks, the Y-shaped windbreak achieves the highest uniformity of air temperature distributions and velocity distributions within the crosswind speed range of 0–6 m/s. However, the single-windbreak configuration with curved profile is superior to the other windbreaks when the crosswind speed exceeds 6 m/s.
- (2) Both the ventilation rate and the heat rejection rate decrease remarkably as the crosswind speed increases. Among the four studied windbreaks, the Y-shaped windbreak demonstrates the highest ventilation rate and heat rejection rate within the crosswind speed range of 0–6 m/s. The Y-shaped windbreak achieves a 25.45% improvement in the ventilation rate (i.e., increased from 5761.5 kg/s at no windbreak to 7227.6 kg/s) and a 21.37% improvement in the heat rejection rate (i.e., increased from 99.2 MW at no windbreak to 120.4 MW) at the crosswind speed of 6 m/s. The single-windbreak configuration with curved profile is superior to the other windbreaks when the crosswind speed exceeds 6 m/s. The single-windbreak configuration with curved profile achieves a 148.88% improvement in the ventilation rate (i.e., increased from 5001.5 kg/s at no windbreak to 12,447.6 kg/s) and a 79.74% improvement in the heat rejection rate (i.e., increased from 107.1 MW at no windbreak to 192.5 MW) at the crosswind speed of 18 m/s. The single-windbreak configuration with curved profile improves the ventilation rate, heat rejection rate of NDDCT by 26.59% and 17.01%, respectively at crosswind speed of 18 m/s when compared with the Y-shaped windbreak.
In conclusion, with considering the air temperature distributions, air velocity distributions, ventilation rate and heat rejection rate, the Y-shaped windbreak is recommended for the regions with crosswind speeds below 6 m/s while the single-windbreak configuration with curved profile is preferable for the regions with crosswind speeds exceeding 6 m/s. The current study only investigates the feasibility of the three novel windbreaks, future work is suggested to focus on experimental verification, optimization of the structure with considering the variations of the curvature, constructability, material requirements and operational cost to provide guidance for engineering application. Besides, the model’s sensitivity to small geometric variations of the windbreaks is suggested for future study.
Acknowledgement:
Funding Statement: This work was supported by the National Natural Science Foundation of China (Grant No. 52476206), the Key R&D Program of Shandong Province, China (Grant No. 2025CXGC010203), the Guangdong Basic and Applied Basic Research Foundation (Grant No. 2025A1515012123) and the Shandong Natural Science Foundation (Grant No. ZR2022ME008).
Author Contributions: The authors confirm contribution to the paper as follows: conceptualization: Suoying He, Yushe Li, Peishe Wang, Huimin Pang; data curation: Yushe Li, Peishe Wang; formal analysis: Yushe Li, Peishe Wang, Suoying He; funding acquisition: Suoying He; investigation: Yushe Li, Peishe Wang, Suoying He, Chunguan Zhou; methodology: Yushe Li, Peishe Wang, Suoying He, Huimin Pang; Project administration: Suoying He, Feiyang Long, Zongjun Long, Zhe Geng, Shuzhen Zhang; resources: Suoying He, Chunguan Zhou, Feiyang Long, Zongjun Long, Maojin Fu, Jinyang Sheng, Zhe Geng, Shuzhen Zhang; software: Yushe Li, Peishe Wang, Suoying He, Huimin Pang; supervision: Suoying He, Chunguan Zhou, Feiyang Long, Zongjun Long, Zhe Geng, Shuzhen Zhang, Ghulam Qadir Chaudhary, Ming Gao; validation: Yushe Li, Peishe Wang, Suoying He, Huimin Pang; visualization: Yushe Li, Peishe Wang, Huimin Pang, Lin Xia; writing—original draft: Yushe Li, Peishe Wang; writing—review & editing: Suoying He, Chunguan Zhou, Ghulam Qadir Chaudhary, Ming Gao. All authors reviewed and approved the final version of the manuscript.
Availability of Data and Materials: The data that support the findings of this study are available from the corresponding author, [Suoying He], upon reasonable request.
Ethics Approval: Not applicable.
Conflicts of Interest: The authors declare no conflicts of interest.
Nomenclature
| a | Constant | Tp | Mean temperature of the air at the near-wall node, K |
| E | Empirical constant | Twall | Wall temperature |
| C1ε, C2ε, C3ε | Constants in turbulence equations | ΔTapproach | Approach temperature, °C |
| Cp | Specific heat, J/(kg·K) | u* | Dimensionless velocity |
| Cμ | Coefficient in turbulent viscosity | Friction velocity, m/s | |
| g | Acceleration of gravity, m/s2 | v | Speed, m/s |
| Gb | Turbulent kinetic energy source term due to buoyancy | y | Distance from the wall to the first grid node, m |
| Gk | Turbulent kinetic energy source term due to mean velocity gradients | Dimensionless wall distance | |
| h | Convective heat transfer coefficient, W/(m2·K) | Z | Height, m |
| ΔH | The height from the radiator to the top of the tower, m | NDDCT | Natural draft dry cooling tower |
| K | Laminar thermal conductivity, W/(m·K) | ||
| Kresist | Resistance coefficient | Greek symbols | |
| k | Turbulent kinetic energy, m2/s2 | ε | Turbulent kinetic energy dissipation, m2/s3 |
| kr | Resistance coefficient of the radiator | Von Kármán constant | |
| L | Characteristic length, m | μ | Laminar viscosity, kg/(m·s) |
| m | Mass flow rate, kg/s | μt | Turbulent viscosity, kg/(m·s) |
| Nu | Nusselt number | ρ | Density, kg/m3 |
| P | Empirical term dependent on the Prandtl number | σk | Turbulent Prandtl number for k |
| Pr | Laminar Prandtl number | σε | Turbulent Prandtl number for ε |
| Prt | Turbulent Prandtl number | ||
| p | Pressure, Pa | Subscripts | |
| Ambient pressure, Pa | a | Air | |
| ΔP | Total pressure drop by each part of the tower, Pa | ai | Air inlet |
| Δp | Pressure drop of the heat exchanger, Pa | ao | Air outlet |
| Q | Heat transfer rate or heat rejection rate, W | cw | Crosswind |
| qr | Heat flux, W/m2 | in | Inlet |
| Wall heat flux, W/m2 | out | Outlet | |
| Rmix | Gas constant for the humid mixture | r | Radiator |
| Re | Reynolds number | ref | Reference value |
| SE | Energy source term, W/m3 | w | Water |
| T | Temperature, K | wo | Water outlet |
| T* | Dimensionless temperature | ||
References
1. IRENA. Renewable capacity statistics 2025. Abu Dhabi, United Arab Emirates: International Renewable Energy Agency; 2025. [Google Scholar]
2. He S , Gurgenci H , Guan Z , Hooman K , Zou Z , Sun F . Comparative study on the performance of natural draft dry, pre-cooled and wet cooling towers. Appl Therm Eng. 2016; 99: 103– 13. doi:10.1016/j.applthermaleng.2016.01.060. [Google Scholar] [CrossRef]
3. Chen X , Wu Y , Zhu Z , Zhao L . Wind-induced response characteristics of reduced-scale aeroelastic models for cooling towers: Comparative analysis of shell model and beam-net model. Phys Fluids. 2025; 37( 7): 077127. doi:10.1063/5.0271599. [Google Scholar] [CrossRef]
4. Park J , Won Y , Lee G , Kang S . Near-field characteristics of drift under crossflow conditions. Phys Fluids. 2025; 37( 3): 033382. doi:10.1063/5.0255806. [Google Scholar] [CrossRef]
5. Suranjan Salins S , Kumar S , González AT , Shetty S . Influence of packing configuration and flow rate on the performance of a forced draft wet cooling tower. J Build Eng. 2023; 72: 106615. doi:10.1016/j.jobe.2023.106615. [Google Scholar] [CrossRef]
6. Fang J , Zhao X , Zhang L , Bu S , Yu Z , Xu W , et al. Thermodynamic investigation on the performance of closed wet cooling tower. J Therm Sci Eng Appl. 2022; 14( 3): 031010. doi:10.1115/1.4051633. [Google Scholar] [CrossRef]
7. Singh K , Das R . An experimental and multi-objective optimization study of a forced draft cooling tower with different fills. Energy Convers Manag. 2016; 111: 417– 30. doi:10.1016/j.enconman.2015.12.080. [Google Scholar] [CrossRef]
8. Singh K , Das R . Simultaneous optimization of performance parameters and energy consumption in induced draft cooling towers. Chem Eng Res Des. 2017; 123: 1– 13. doi:10.1016/j.cherd.2017.04.031. [Google Scholar] [CrossRef]
9. Singh K , Das R . Exergy optimization of cooling tower for HGSHP and HVAC applications. Energy Convers Manag. 2017; 136: 418– 30. doi:10.1016/j.enconman.2017.01.024. [Google Scholar] [CrossRef]
10. Pang H , Wang M , Gao Q , Cheng S , Liu Z , Geng Z , et al. Nozzle arrangement study for pre-cooling the inlet air of natural draft dry cooling tower under crosswinds. Int J Refrig. 2023; 148: 1– 12. doi:10.1016/j.ijrefrig.2023.01.011. [Google Scholar] [CrossRef]
11. Liu T , Wang J , Song T , He S , Zhan J , Geng Z , et al. Investigation on the spray strategy for the inlet air pre-cooling of natural draft dry cooling tower under typical crosswind. J Wind Eng Ind Aerodyn. 2023; 239: 105465. doi:10.1016/j.jweia.2023.105465. [Google Scholar] [CrossRef]
12. Wu J . The indirect air cooling towers optimization of shape under crosswind condition [ master’s thesis]. Harbin, China: Harbin Institute of Technology; 2020. [Google Scholar]
13. Zhao S , Xu M , Zhang H , Guo F . Numerical simulation of the indirect air cooling tower layout optimization. Chin J Hydrodyn. 2013; 28( 2): 197– 202. [Google Scholar]
14. Li W . Distribution characteristics and effect mechanism of key parameters for natural draft dry cooling tower [ master’s thesis]. Jinan, China: Shandong University; 2020. [Google Scholar]
15. Zhao Z , Shi J , Wei Q , Zhang B . The engineering improvement for weakening the bad effect of natural wind on the dry cooling towers. J Appl Sci. 1998; 16( 1): 112– 20. [Google Scholar]
16. Imani-Mofrad P , Zeinali Heris S , Shanbedi M . Experimental investigation of the effect of different nanofluids on the thermal performance of a wet cooling tower using a new method for equalization of ambient conditions. Energy Convers Manag. 2018; 158: 23– 35. doi:10.1016/j.enconman.2017.12.056. [Google Scholar] [CrossRef]
17. Javadpour R , Zeinali Heris S , Mohammadfam Y . Optimizing the effect of concentration and flow rate of water/MWCNTs nanofluid on the performance of a forced draft cross-flow cooling tower. Energy. 2021; 217: 119420. doi:10.1016/j.energy.2020.119420. [Google Scholar] [CrossRef]
18. Wang W , Zhang H , Liu P , Li Z , Lv J , Ni W . The cooling performance of a natural draft dry cooling tower under crosswind and an enclosure approach to cooling efficiency enhancement. Appl Energy. 2017; 186: 336– 46. doi:10.1016/j.apenergy.2016.02.007. [Google Scholar] [CrossRef]
19. Wang W , Zhang H , Li Z , Lv J , Ni W , Li Y . Adoption of enclosure and windbreaks to prevent the degradation of the cooling performance for a natural draft dry cooling tower under crosswind conditions. Energy. 2016; 116: 1360– 9. doi:10.1016/j.energy.2016.07.102. [Google Scholar] [CrossRef]
20. Wang W , Zhang H , Lyu J , Liu Q , Yue G , Ni W . Ventilation enhancement for a natural draft dry cooling tower in crosswind via windbox installation. Appl Therm Eng. 2018; 137: 93– 100. doi:10.1016/j.applthermaleng.2018.03.059. [Google Scholar] [CrossRef]
21. Al-Waked R , Behnia M . The effect of windbreak walls on the thermal performance of natural draft dry cooling towers. Heat Transf Eng. 2005; 26( 8): 50– 62. doi:10.1080/01457630591003763. [Google Scholar] [CrossRef]
22. Ma H , Si F , Zhu K , Wang J . The adoption of windbreak wall partially rotating to improve thermo-flow performance of natural draft dry cooling tower under crosswind. Int J Therm Sci. 2018; 134: 66– 88. doi:10.1016/j.ijthermalsci.2018.08.005. [Google Scholar] [CrossRef]
23. Lu Y , Gurgenci H , Guan Z , He S . The influence of windbreak wall orientation on the cooling performance of small natural draft dry cooling towers. Int J Heat Mass Transf. 2014; 79: 1059– 69. doi:10.1016/j.ijheatmasstransfer.2014.09.012. [Google Scholar] [CrossRef]
24. Lu Y , Guan Z , Gurgenci H , Alkhedhair A , He S . Experimental investigation into the positive effects of a tri-blade-like windbreak wall on small size natural draft dry cooling towers. Appl Therm Eng. 2016; 105: 1000– 12. doi:10.1016/j.applthermaleng.2016.03.175. [Google Scholar] [CrossRef]
25. du Preez AF , Kröger DG . The effect of the heat exchanger arrangement and wind-break walls on the performance of natural draft dry-cooling towers subjected to cross-winds. J Wind Eng Ind Aerodyn. 1995; 58( 3): 293– 303. doi:10.1016/0167-6105(95)00026-7. [Google Scholar] [CrossRef]
26. Lu Y , Guan Z , Gurgenci H , Zou Z . Windbreak walls reverse the negative effect of crosswind in short natural draft dry cooling towers into a performance enhancement. Int J Heat Mass Transf. 2013; 63: 162– 70. doi:10.1016/j.ijheatmasstransfer.2013.03.075. [Google Scholar] [CrossRef]
27. Kröger DG . Air-cooled heat exchangers and cooling towers: Thermal-flow performance evaluation and design. Tulsa, OK, USA: PennWell Corp.; 2004. [Google Scholar]
28. He S , Guan Z , Gurgenci H , Jahn I , Lu Y , M Alkhedhair A . Influence of ambient conditions and water flow on the performance of pre-cooled natural draft dry cooling towers. Appl Therm Eng. 2014; 66( 1–2): 621– 31. doi:10.1016/j.applthermaleng.2014.02.070. [Google Scholar] [CrossRef]
29. Maraveas C . Design of tall cable-supported windbreak panels. Open J Civ Eng. 2019; 9( 2): 106– 22. doi:10.4236/ojce.2019.92008. [Google Scholar] [CrossRef]
30. Dong P , Li X , Yu Y , Zhang Z , Feng J . Direct air capture via natural draft dry cooling tower. Int J Greenh Gas Control. 2021; 109: 103375. doi:10.1016/j.ijggc.2021.103375. [Google Scholar] [CrossRef]
31. Deng W , Sun F . Comparative study on the cooling characteristics of different fill layout patterns on a single air inlet induced draft cooling tower. Energies. 2021; 14( 19): 6303. doi:10.3390/en14196303. [Google Scholar] [CrossRef]
32. Zhang S , Law AWK . Performance of Reynolds averaged Navier–stokes and large eddy simulation models in simulating flows in a crossflow ultraviolet reactor: An experimental evaluation. Water. 2024; 16( 2): 271. doi:10.3390/w16020271. [Google Scholar] [CrossRef]
33. Boysan HF , Ayers B . Ansys fluent theory guide. [cited 2025 Jan 1]. Available from: https://ansyshelp.ansys.com/public/account/secured?returnurl=////Views/Secured/corp/v242/en/flu_th/flu_th_sec_turb_ke.html. [Google Scholar]
34. Abbasi M , Alighanbari F , Sarvestani AB , Golneshan AA . The effect of crosswind and installation of wind-break deflector on the performance of natural draft dry cooling tower (NDDCT). J Wind Eng Ind Aerodyn. 2022; 229: 105146. doi:10.1016/j.jweia.2022.105146. [Google Scholar] [CrossRef]
35. Wang W , Zeng DL , Hu Y . The modified iteration method for wet cooling towers to calculate the cooled water outlet temperature. Appl Mech Mater. 2013; 483: 253– 6. doi:10.4028/www.scientific.net/amm.483.253. [Google Scholar] [CrossRef]
36. Katinas C , Reichardt T , D’Entremont B , Ray W , Willis M , Kulp T . Calculation of nuclear reactor cooling tower performance with limited data streams. J Therm Sci Eng Appl. 2023; 15: 011013. doi:10.1115/1.4055746. [Google Scholar] [CrossRef]
37. Launder BE , Spalding DB . The numerical computation of turbulent flows. Comput Meth Appl Mech Eng. 1974; 3( 2): 269– 89. doi:10.1016/0045-7825(74)90029-2. [Google Scholar] [CrossRef]
38. Lu Y . Small natural draft dry cooling towers for renewable power plants [ dissertation]. Brisbane, Australia: University of Queensland; 2015. [Google Scholar]
39. Yang LJ , Du XZ , Yang YP . Space characteristics of the thermal performance for air-cooled condensers at ambient winds. Int J Heat Mass Transf. 2011; 54( 15–16): 3109– 19. doi:10.1016/j.ijheatmasstransfer.2011.04.023. [Google Scholar] [CrossRef]
40. World Meteorological Organization (WMO). Guide to meteorological instruments and methods of observation. 7th ed. Geneva, Switzerland: World Meteorological Organization; 2008. [Google Scholar]
41. Sun Y , Guan Z , Gurgenci H , Li X , Hooman K . A study on multi-nozzle arrangement for spray cooling system in natural draft dry cooling tower. Appl Therm Eng. 2017; 124: 795– 814. doi:10.1016/j.applthermaleng.2017.05.157. [Google Scholar] [CrossRef]
42. du Preez AF , Kröger DG . Effect of wind on performance of a dry-cooling tower. Heat Recovery Syst CHP. 1993; 13( 2): 139– 46. doi:10.1016/0890-4332(93)90033-R. [Google Scholar] [CrossRef]
43. Wang Y , Yang J , Xu Q , Zhang Q , He S , Gao M . Numerical simulation on the enhancement of heat transfer performance by deflector plates for the mechanical draft cooling towers. Energy. 2023; 283: 129180. doi:10.1016/j.energy.2023.129180. [Google Scholar] [CrossRef]
44. Li X , Gurgenci H , Guan Z , Wang X , Duniam S . Measurements of crosswind influence on a natural draft dry cooling tower for a solar thermal power plant. Appl Energy. 2017; 206: 1169– 83. doi:10.1016/j.apenergy.2017.10.038. [Google Scholar] [CrossRef]
45. Goodarzi M , Keimanesh R . Heat rejection enhancement in natural draft cooling tower using radiator-type windbreakers. Energy Convers Manag. 2013; 71: 120– 5. doi:10.1016/j.enconman.2013.03.031. [Google Scholar] [CrossRef]
46. Yan J , Wang W , Chen L , Yang L , Du X . Enhancement of thermo-flow performances by windbreakers for two-tower indirect dry cooling system. J Therm Sci. 2020; 29( 3): 676– 86. doi:10.1007/s11630-020-1294-2. [Google Scholar] [CrossRef]
Cite This Article
 Copyright © 2026 The Author(s). Published by Tech Science Press.
This work is licensed under a Creative Commons Attribution 4.0 International License , which permits unrestricted use, distribution, and reproduction in any medium, provided the original work is properly cited.
 Downloads
 Citation Tools