
 Submit a Paper
 Propose a Special lssue
 Open Access
ARTICLE

Cavitation Effects and Flow Field Analysis of a Jet Impingement-Negative Pressure Ammonia Removal Reactor
1 College of Mechanical Engineering, Sichuan Vocational College of Chemical Technology, Luzhou, 646300, China
2 The Key Laboratory of Manufacturing and Application of Intelligent Well Control for Oil and Gas Production and Transportation of Luzhou, Sichuan Vocational College of Chemical Technology, Luzhou, 646300, China
3 College of Chemistry and Chemical Engineering, Chongqing University of Technology, Chongqing, 400054, China
* Corresponding Author: Facheng Qiu. Email:
(This article belongs to the Special Issue: Enhancement Technologies for Fluid Heat and Mass Transfer)
Frontiers in Heat and Mass Transfer 2025, 23(6), 1865-1882. https://doi.org/10.32604/fhmt.2025.073409
Received 17 September 2025; Accepted 10 November 2025; Issue published 31 December 2025
 View Full Text
 Download PDF
Abstract
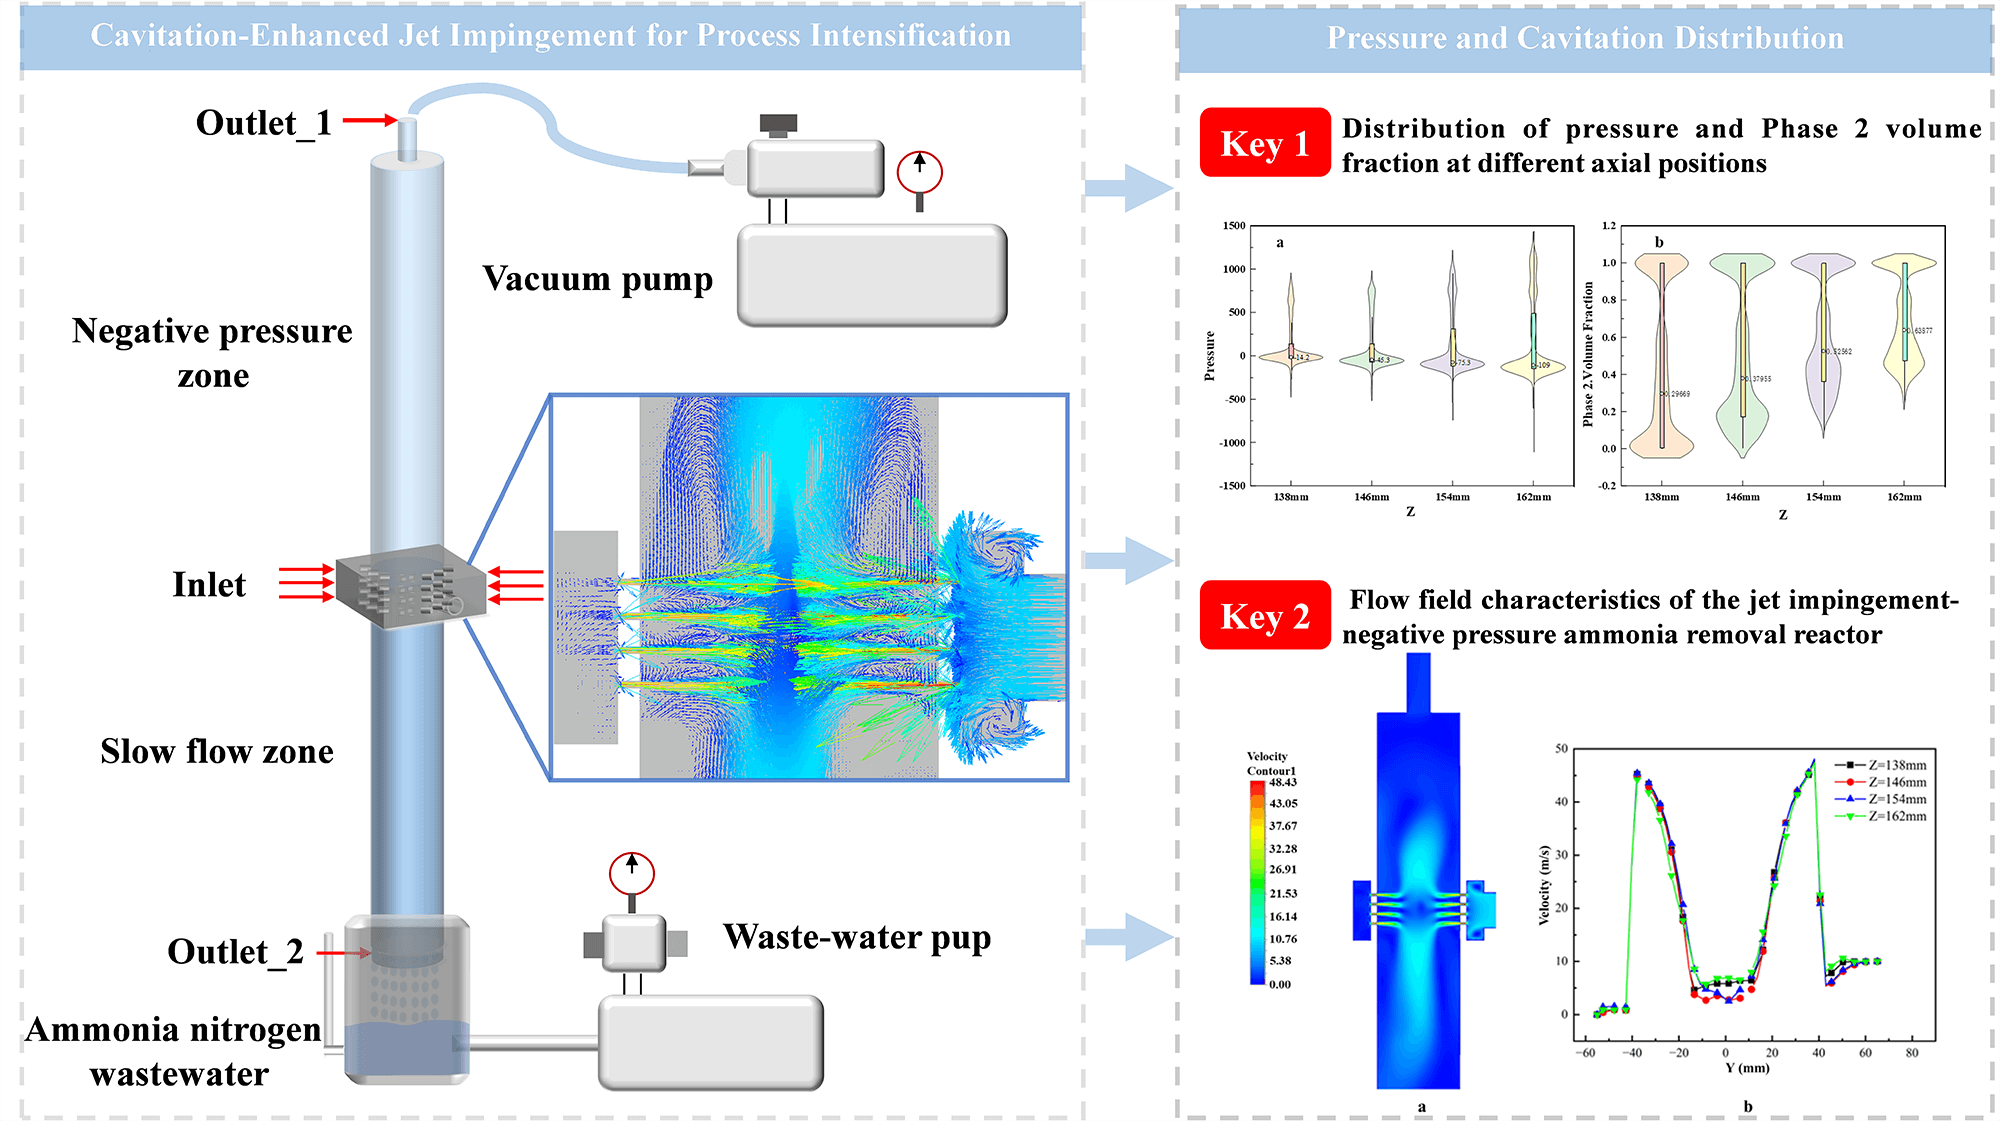
With the acceleration of industrialization and urbanization, ammonia nitrogen pollution in water bodies has become increasingly severe, making the development of efficient and low-consumption wastewater treatment technologies highly significant. This study employs three-dimensional computational fluid dynamics (CFD) to investigate the cavitation mechanisms and flow field characteristics in a novel jet impingement-negative pressure ammonia removal reactor. The simulation, validated by experimental pressure data with a high degree of consistency, utilizes the Mixture model, the Realizable k-ε turbulence model, and the Schnerr-Sauer cavitation model. The results demonstrate that the flow velocity undergoes a substantial acceleration within the orifice nozzle, triggering a dramatic pressure drop from an inlet value of approximately 1.17 MPa to below the saturated vapor pressure, reaching as low as −109 kPa, which induces intense cavitation. Cavitation bubbles primarily originate on the inner wall of the nozzle, with the vapor volume fraction peaking at about 0.42 within the orifice. A strong positive correlation was observed between the local vapor fraction and the flow velocity, indicating that cavitation enhances jet intensity. Furthermore, vortex structures near the wall and within the jacket sustain low-pressure zones, facilitating continuous cavitation and efficient mixing. This study quantitatively elucidates the cavitation dynamics and its interplay with the flow field, providing a solid theoretical and numerical basis for optimizing the reactor design to enhance ammonia removal efficiency.Graphic Abstract
Keywords
Nomenclature
| Symbols | Description |
| C1, C2 | Empirical constants in the turbulence model |
| F | External body force |
| Generation of turbulent kinetic energy due to mean velocity gradients | |
| Generation of turbulent kinetic energy due to buoyancy | |
| g | Gravitational acceleration vector |
| k | Turbulent kinetic energy |
| Mass transfer rate from phase p to phase q | |
| N | Number of phases |
| p | Pressure |
| S | Modulus of the mean rate-of-strain tensor |
| t | Time |
| u | Velocity vector/velocity component |
| Drift velocity of phase p | |
| um | Mass-averaged velocity of the mixture |
| YM | Contribution of fluctuating dilatation to dissipation |
| αp | Volume fraction of phase p |
| ε | Turbulent kinetic energy dissipation rate |
| η | Dimensionless parameter in turbulence model |
| μ | Dynamic viscosity |
| Turbulent viscosity | |
| Density | |
| Mixture density | |
| Turbulent prandtl numbers for k and ε | |
| Viscous stress tensor of the mixture | |
| Phase indices | |
| m | Mixture |
| CFD | Computational fluid dynamics |
| JI-NPR | Jet impingement-negative pressure reactor |
With the rapid development of industries such as petroleum and chemicals, along with improvements in living standards, the concentration of ammonia nitrogen in municipal wastewater and landfill leachate has increased significantly, making it a widespread and persistent inorganic pollutant [1–3]. If discharged directly, ammonia nitrogen wastewater can lead to eutrophication of water bodies, posing risks to both ecological environments and human health [4]. Hence, its effective treatment is crucial for environmental protection and resource recycling. Current treatment technologies for ammonia nitrogen are mainly divided into two categories: physico-chemical methods (e.g., membrane separation, ion exchange, chemical oxidation, and adsorption) and biological methods (e.g., A/O, anaerobic ammonium oxidation (anammox), and A2/O processes) [5]. However, physico-chemical approaches are often costly and prone to causing secondary pollution, while biological methods require sophisticated operational conditions and have limited applicability [6]. Both strategies struggle to treat high-concentration ammonia nitrogen wastewater efficiently, remaining a major challenge in current research.
In recent years, water jet impingement technology has offered a new option for large-scale, low-cost wastewater treatment. The application of jet impingement, however, extends beyond chemical processes into energy systems. For instance, Kryak et al. [7] successfully employed a hot air jet impinging technique to enhance the melting process of phase change materials in a disc-shaped container for thermal energy storage, demonstrating the versatility of this technology in improving heat and mass transfer. The concept of impinging streams was first proposed by the Soviet scientist Elperin in the early 1960s [8], with the aim of enhancing interphase mass transfer. A number of experimental studies have been conducted on liquid breakup patterns, liquid film characteristics, breakup length, droplet size, and breakup mechanisms in open impinging streams [9–13]. Erni suggested that the droplet breakup mechanism is caused by the Rayleigh-Plateau (R-P) instability at the edge of the liquid film [14]. Dombrowski et al. [15] investigated the close relationship between droplet size and breakup mechanisms. Impinging streams are defined as the collision of two coaxial gas-solid two-phase jets composed of solid particles. These two streams are fully accelerated by two equal gas flows, creating a highly turbulent, high-shear-strain rate impingement zone upon collision. This phenomenon significantly reduces external resistance during transfer processes, thereby improving heat and mass transfer and promoting mixing. The schematic diagram of this process is shown in Fig. 1.
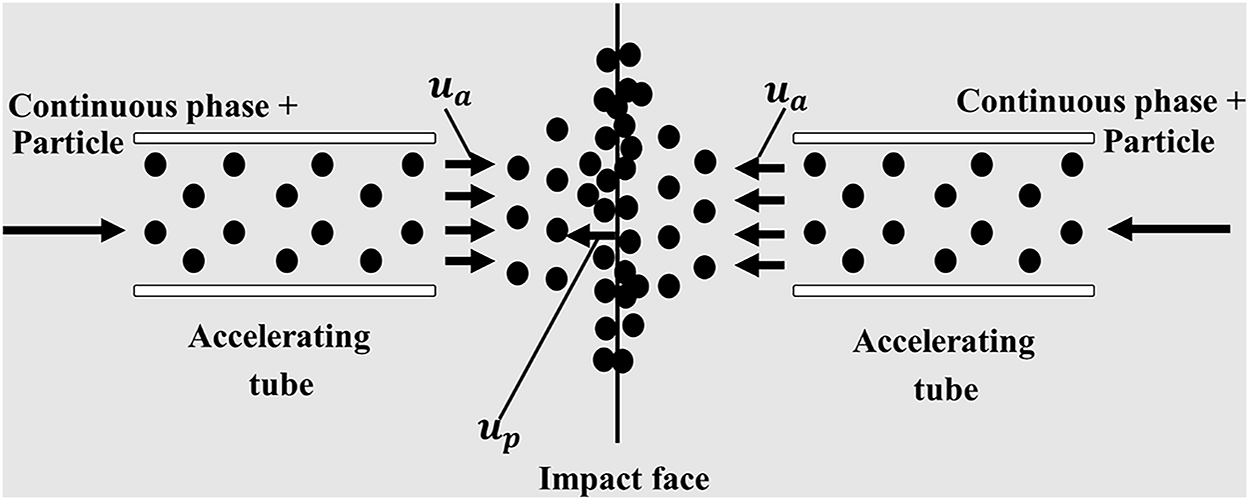
Figure 1: Schematic diagram of impinging stream
Based on this principle, our research group adopted a mass transfer enhancement strategy, utilizing a conventional transport pump to drive a multi-jet impingement process through an annular jacket structure. This design enables continuous ammonia removal under slight negative pressure conditions, significantly reducing the energy input typically required to maintain high vacuum levels. As a result, a novel and efficient jet impingement-negative pressure reactor was developed [16,17]. During the reactor design, a jacket-style jet impingement configuration incorporating numerous micro-channels was implemented. Inside the reactor, a complex pressure distribution is formed, including zones such as the jet positive-pressure inlet, regions with pressure differences across the micro-orifices, a top negative-pressure area, and local high-pressure impingement zones. This multi-gradient pressure environment promotes localized cavitation as the fluid passes near the small orifices. Studies indicate that cavitation occurs when the local liquid pressure falls below the saturated vapor pressure at the given temperature, causing rapid growth and expansion of vapor cavities [18]. Moreover, cavitation is a dynamic process involving formation, development, and collapse, accompanied by extreme physical effects such as high temperatures, high pressures, intense shockwaves, and micro-jets [19]. In 2010, Professors Li Fubao and Li Qin first introduced the concept of cavitating impinging streams [20,21]. Macroscopically, this refers to the use of specially structured nozzles to eject two high-velocity water jets that collide and generate cavitation effects in the impingement zone. The entire process—formation, development, and collapse of cavitation bubbles—produces high temperatures, high pressures, shockwaves, and micro-jets. These conditions create a favorable physico-chemical environment that enhances chemical reaction rates. Notably, research by Flint et al. [22] showed that at the moment of collapse, cavitation bubbles can reach temperatures as high as 5000 K and generate micro-jets with velocities of 100 m/s and pressures up to 50 MPa. In recent years, cavitation technology has been widely applied in various fields including wastewater treatment, industrial cleaning, chemical engineering, and pharmaceuticals.
This work specifically aims to delineate the intrinsic relationship between the flow field (especially pressure distribution) and the cavitation dynamics (characterized by vapor volume fraction) inside the reactor. By establishing the Mixture multiphase flow model, a thorough analysis was conducted on the velocity distribution, gas phase volume fraction, pressure variation, and streamline structure inside the reactor. The core objective is to quantitatively reveal the initiation, evolution, and collapse mechanisms of the cavitation effect and their correlation with key flow field parameters.
2.1 Model Setup and Mesh Generation
The computational model represents the internal fluid volume of the reactor. The geometry is a single, continuous fluid domain, and the surfaces of this domain correspond to the internal walls of the physical reactor structure. These surfaces were assigned stationary, no-slip wall boundary conditions to simulate the physical presence and frictional effect of the tube and jacket walls on the fluid flow.
In the model, a square orifice with a side length of 2 mm was employed to simplify the geometry, replacing the original circular orifice with a diameter of 2 mm. To rigorously justify this simplification, a comparative simulation study was conducted. The results, summarized in Table 1, demonstrate a strong geometric equivalence between the two configurations across key flow parameters. Velocity profiles exhibited the highest consistency (correlation coefficient R2 = 0.92, relative difference = 3.6%), confirming that the jet characteristics and flow contraction effects are nearly identical. While the pressure distributions showed expected local variations due to geometric differences (R2 = 0.86), both configurations consistently produced the negative pressure conditions essential for cavitation inception. The turbulence characteristics were also well-correlated (R2 = 0.87), indicating similar energy dissipation patterns. Therefore, the square orifice simplification is validated to effectively capture the essential flow physics of the circular orifice while significantly reducing computational resources, and thus was adopted for all subsequent simulations. The optimized model is illustrated in Fig. 2.
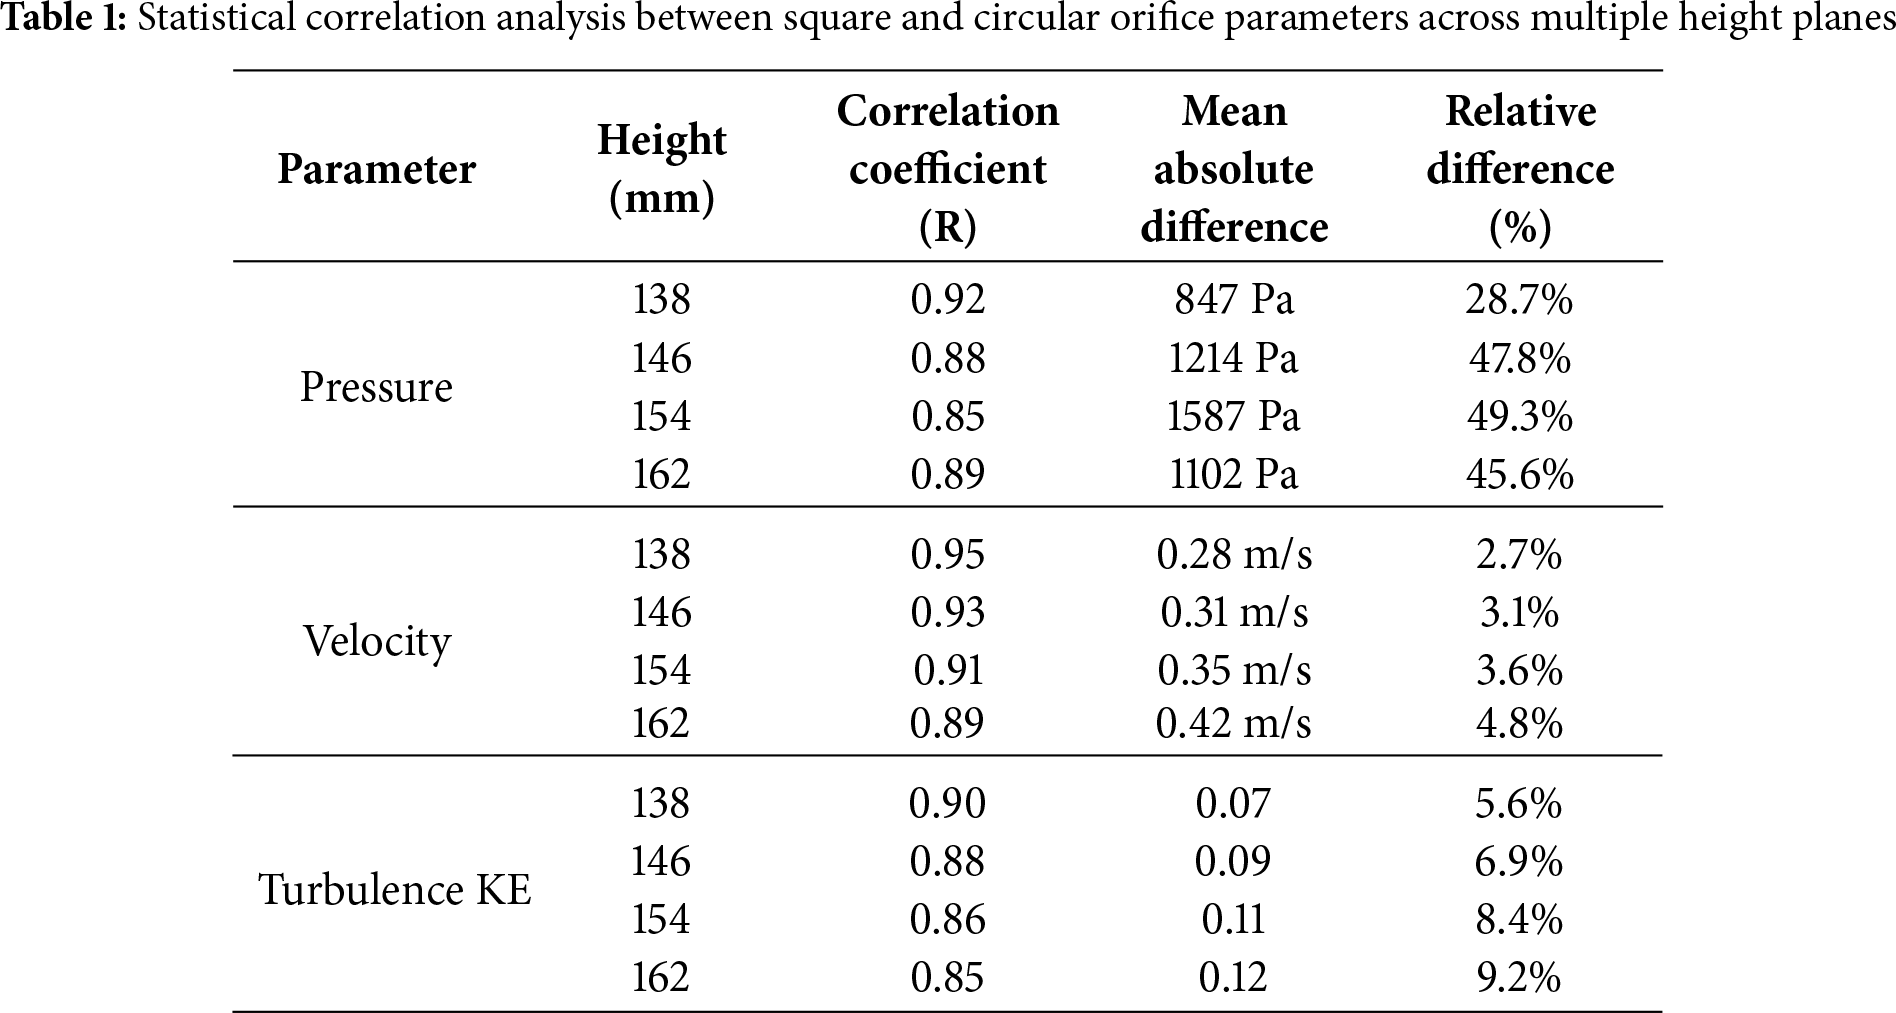
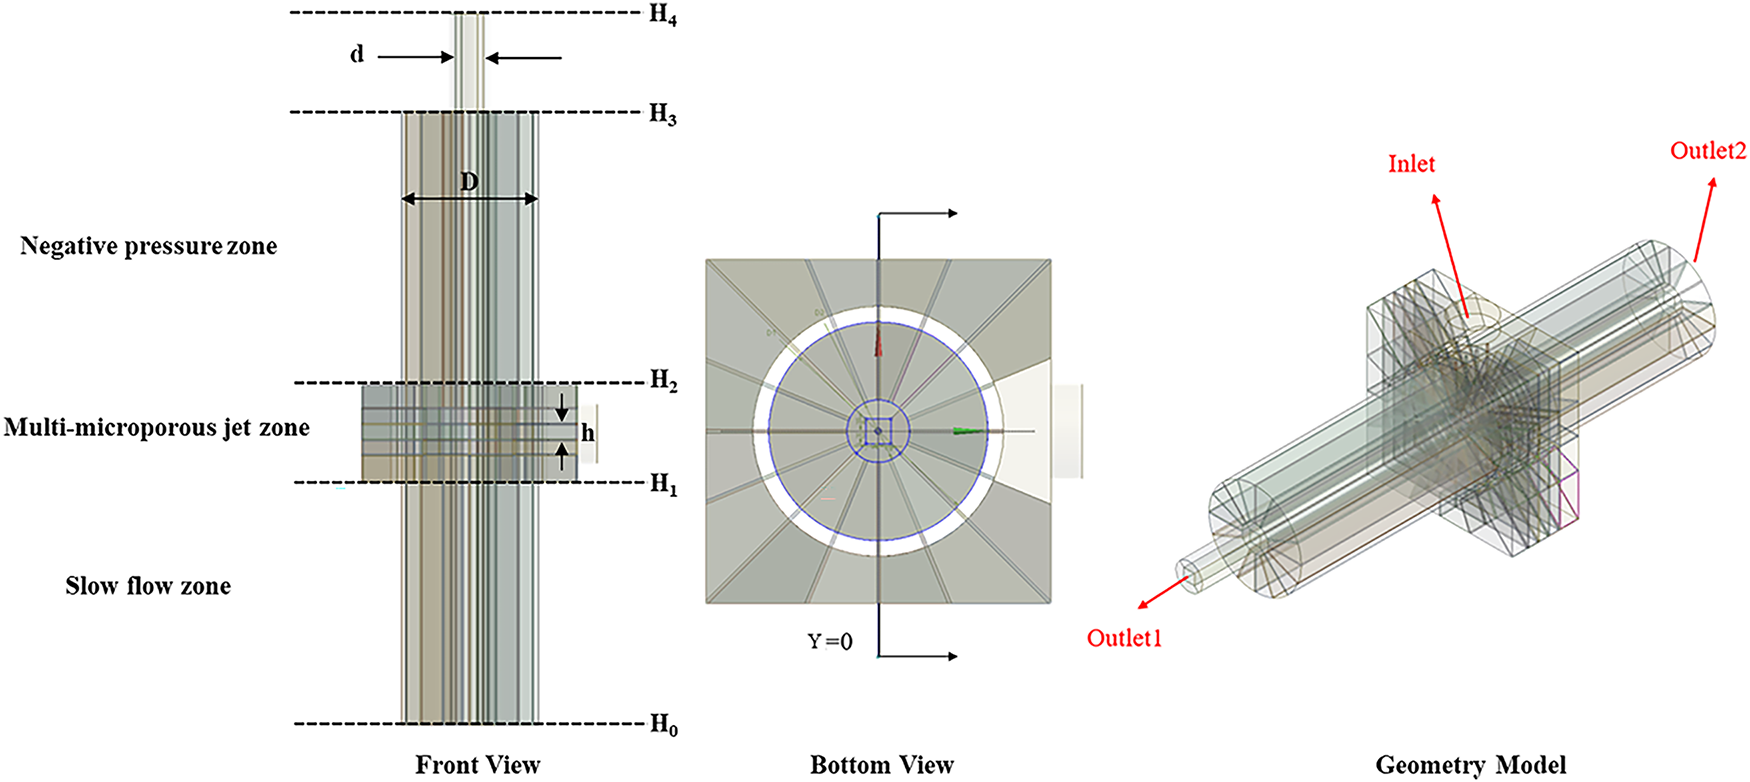
Figure 2: Schematic diagram of the reactor geometric model
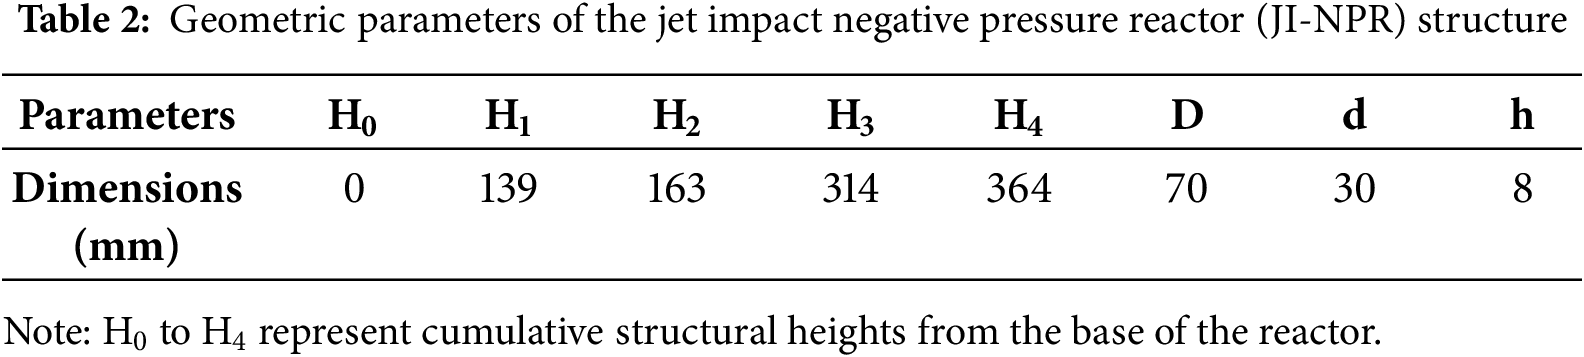
To enhance the accuracy of the computational domain, a structured mesh was generated throughout the entire region. Local mesh refinement was also applied at the jet inlet and boundary layers to ensure high simulation fidelity. The specific structural dimensions of the reactor are provided in Table 2. For flow field analysis, a Cartesian coordinate system was defined with its origin at the reactor base. The axial coordinate is denoted as Z. The analysis presented in this study focuses on four key cross-sections corresponding to the inlet planes of the jet orifices, located at axial positions of Z = 138, 146, 154, and 162 mm, respectively.
In computational simulations, particularly in three-dimensional (3D) modeling, mesh resolution exerts a critical influence on the accuracy of the results. Complex geometries generally require finer mesh discretization to capture detailed flow features. However, an excessive number of grid elements can lead to prohibitively high computational costs. To address this trade-off, a grid independence study is typically conducted to determine the minimum number of elements that ensures result reliability. As shown in Fig. 3, this study evaluated three mesh configurations-containing 2,516,757, 3,294,506, and 5,862,026 elements, respectively.
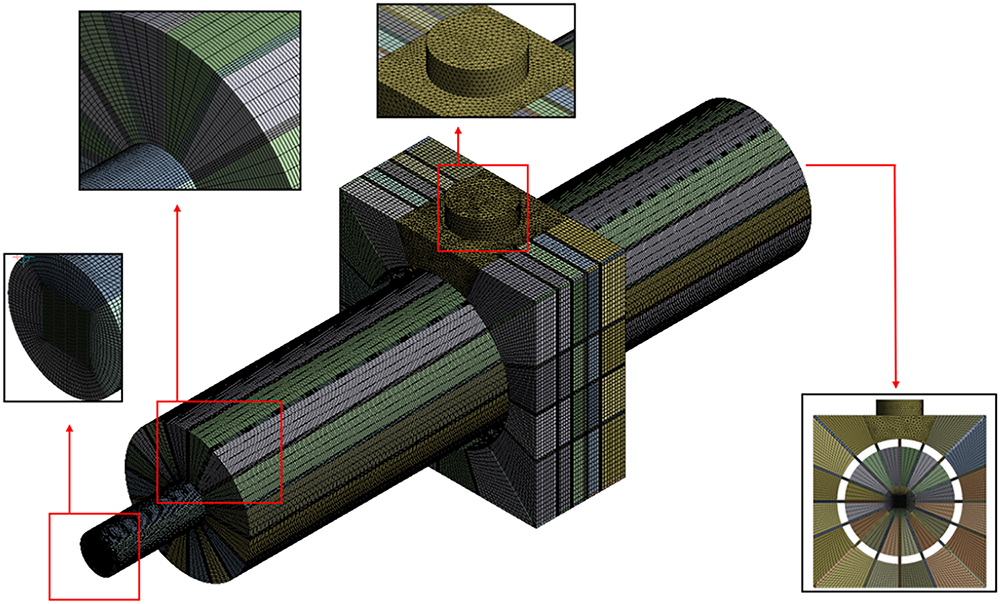
Figure 3: Mesh generation of the geometric model
Using the turbulent kinetic energy dissipation rate as the metric, a grid independence verification was conducted. As the number of elements increased from 2.52 million to 2.87 million, the deviation in the dissipation rate remained within 5% (Fig. 4). Thus, the mesh configuration with 3.29 million elements was selected to balance computational efficiency with accuracy.
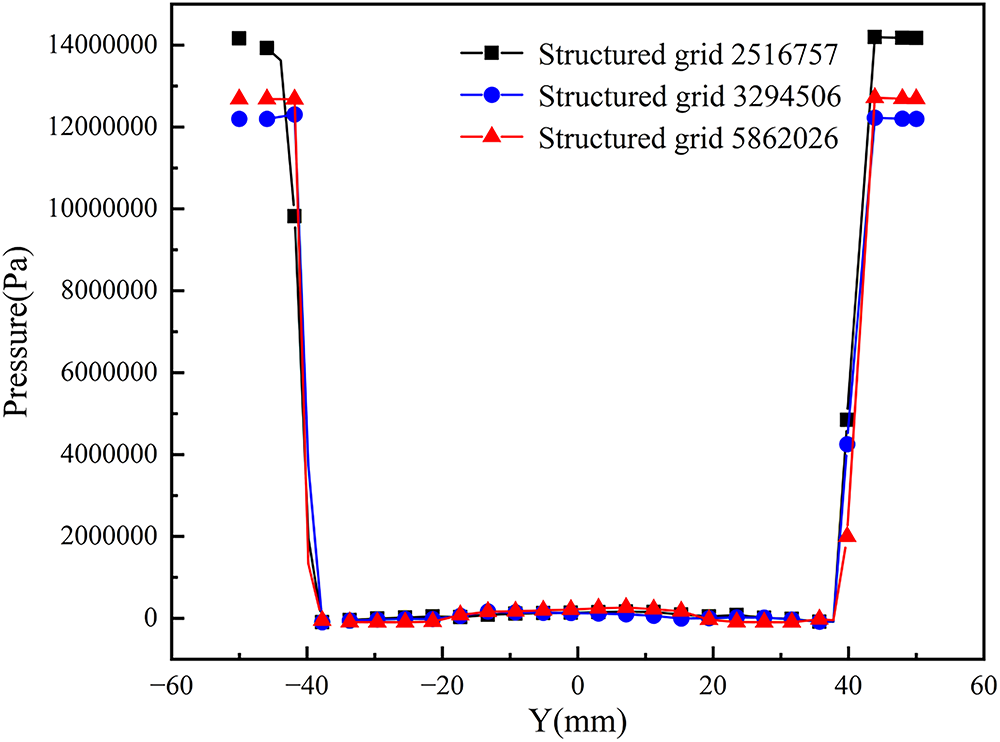
Figure 4: Grid independence verification
The fluid was modeled within a Eulerian two-phase flow framework, treating the first phase as a compressible ideal gas and the second phase as liquid water. The annular porous inlet boundary was defined as a velocity inlet with a speed of 10 m/s. The volume fraction of liquid water was set to 1, and the hydraulic diameter was specified as 2 mm. For the outlet boundaries, outlet_1 was configured as a pressure outlet with a gauge pressure of −10,000 Pa and a hydraulic diameter of 20 mm, while outlet_2 was set as a pressure outlet with a hydraulic diameter of 70 mm.
The study of cavitation phenomena and jet impingement processes involves multiphase flow. The numerical simulations were conducted using the three-dimensional, double-precision, pressure-based transient solver in ANSYS Fluent. The Mixture model was selected as the multiphase flow model without considering slip velocity, using liquid water, vapor, and air as the medium. The Realizable k-ε turbulence model, along with the scalable wall function, was employed to simulate fluid turbulence. The operating pressure was set to 101,325 Pa. The Schnerr-Sauer method was adopted to model the cavitation process. The inlet boundary condition was defined as a velocity inlet, while the outlet was set as a pressure outlet. The pressure-velocity coupling scheme used was Coupled, and the PRESTO! method was selected for pressure discretization. To enhance accuracy, second-order upwind schemes were applied for discretizing the turbulent kinetic energy, turbulent dissipation rate, and momentum equations, while a first-order upwind scheme was used for the volume fraction. The simulation was carried out transiently with a time step of 10−3 s and a maximum of 20 iterations per time step. A solution was considered converged when the scaled residuals for all governing equations dropped below 10−3, and the area-weighted average pressure and velocity at the Z = 138 mm plane, as well as the inlet mass flow rate, exhibited stable behavior with minimal fluctuation.
2.2 Numerical Simulation Methodology
The numerical simulations were performed using the commercial CFD code ANSYS Fluent (version 2022 R1), employing a three-dimensional, double-precision, pressure-based transient solver. The following subsections detail the mathematical models and numerical schemes adopted in this study.
2.2.1 Mixture Multiphase Flow Model
The gas-liquid flow within the JI-NPR was resolved using the Eulerian-Eulerian Mixture model. This model is computationally efficient for simulating multiphase flows where the phases are strongly coupled and interpenetrating, making it particularly suitable for capturing the cavitation dynamics in the present study. The model solves the mixture continuity and momentum equations, as given by Eqs. (1) and (2), and a transport equation for the volume fraction of the secondary phases, as shown in Eq. (3). The slip velocity between the phases was neglected in this formulation, assuming local equilibrium over short spatial scales, which is a common and valid simplification for the high-velocity, intensely mixed flow in the reactor. The governing equations for the mixture model are as follows [23]:
(1) Mixture Continuity:
(2) Mixture Momentum:
where
(3) Phase Volume Fraction:
where
The cavitation process, which involves the phase change between liquid and vapor, was modeled using the Schnerr-Sauer method. This model is well-established for simulating cavitating flows in nozzles and orifices, as it robustly handles the mass transfer between liquid and vapor phases based on the dynamics of bubble populations. Its implementation within the mixture model framework provides a stable and accurate approach for predicting the inception and development of cavitation, which aligns perfectly with the core objective of this work.
The complex turbulent flow induced by jet impingement and cavitation was simulated using the Realizable k-ε model. This model was selected for its demonstrated superior performance over the Standard k-ε model in predicting flows with strong streamline curvature, vortices, and local high shear rates-all of which are defining features of the flow within the JI-NPR. The transport equations for the turbulent kinetic energy (k) and its dissipation rate (ε) are provided in Eqs. (4) and (5). To accurately resolve the near-wall flow in the context of a high-Reynolds-number model, the scalable wall function was employed. This function provides consistent results even as the mesh is refined, ensuring a reliable prediction of the wall shear stress and boundary layer development that influence the core flow dynamics. The transport equations for turbulent kinetic energy (k) and its dissipation rate (ε) are given as follows [24]:
(1) Turbulent Kinetic Energy Equation:
(2) Dissipation Rate Equation:
where
The Realizable k-ε model provides enhanced performance in predicting the spreading rate of jets and flow separation under strong pressure gradients, which is essential for accurately capturing the hydrodynamic behavior in the jet impingement-negative pressure ammonia removal reactor.
To validate the simulation results experimentally, a lab-scale setup was constructed. As illustrated in Fig. 5, the system primarily consisted of a storage tank, a centrifugal pump, a control valve, a flow meter, the JI-NPR reactor, and a data acquisition unit.
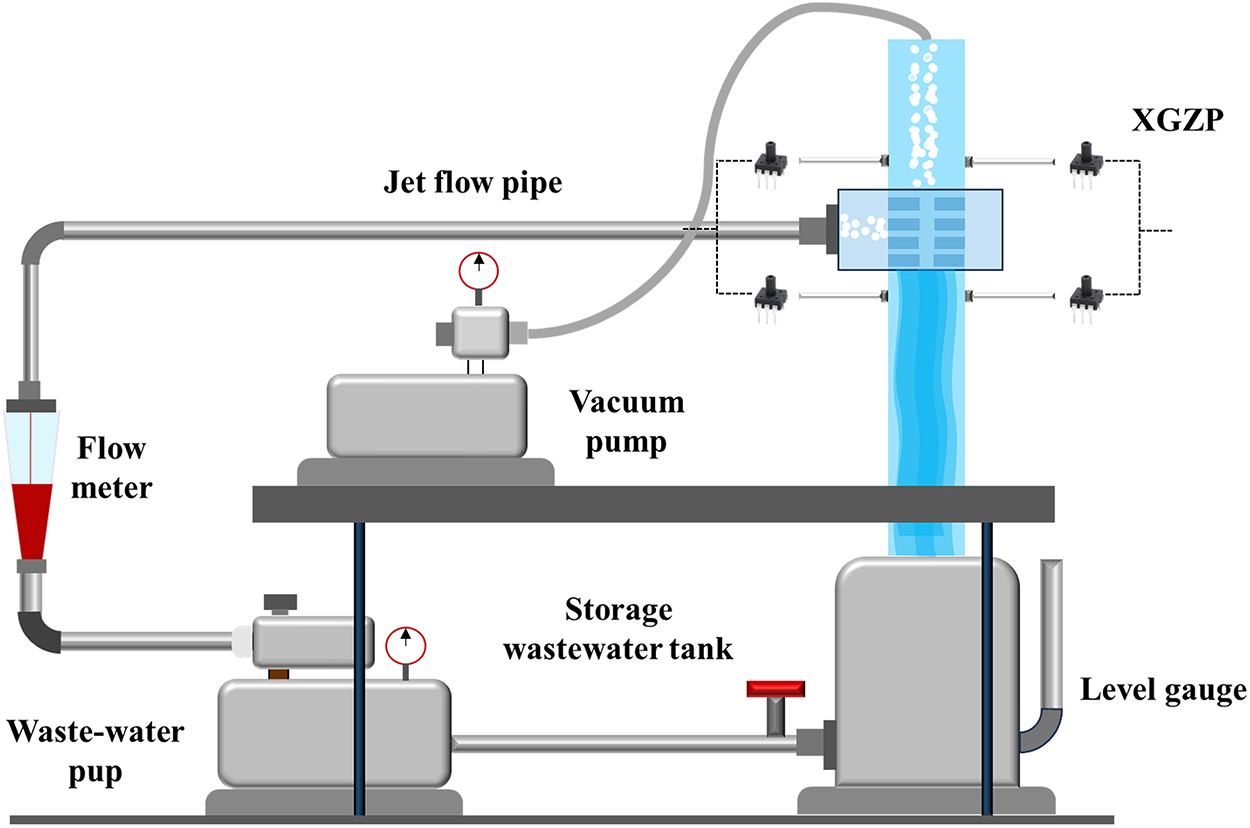
Figure 5: Schematic diagram of the experimental setup
The tank was prefilled with the working fluid. A centrifugal pump was started to drive the flow. The flow rate was adjusted to the predetermined value using the control valve and monitored by the flow meter, allowing the pump to draw water from the tank. The jets collided within the reactor and were then recirculated back to the storage tank.
Real-time pressure data were collected at five measurement points located above the impingement zone of the JI-NPR using XGZP pressure sensors. The voltage signals obtained from pressure fluctuations were computationally processed to derive real-time pressure profiles. As shown in Fig. 6, the simulation results closely aligned with the experimental data, confirming the reliability of the model in visualizing the flow field evolution within the reactor.
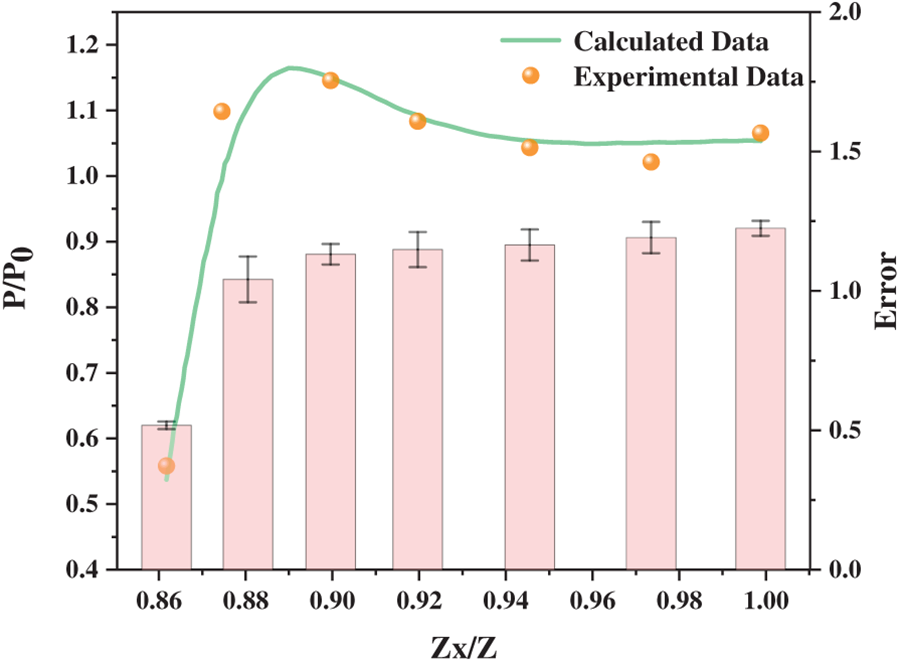
Figure 6: Comparison of experimental and simulated pressure values
This section presents a systematic analysis of the flow field and cavitation dynamics within the jet impingement-negative pressure reactor. The discussion is structured to first elucidate the fundamental driver of cavitation by examining the pressure distribution at different axial locations. Subsequently, the velocity field is analyzed to reveal its coupling with the pressure drop and its role in imparting kinetic energy. The core of the analysis then focuses on the spatial and temporal evolution of the vapor phase, quantifying the cavitation intensity and its direct relationship with the local flow parameters. Finally, the vortex structures and streamline patterns are investigated to explain the mechanisms behind sustained cavitation and efficient mixing. Throughout this section, numerical results are interpreted in the context of underlying physical principles and, where applicable, compared with established findings in the literature.
3.1 Pressure and Cavitation Distribution (Z)
As shown in Fig. 7, the distributions and variation trends of pressure (Fig. 7a) and Phase 2 volume fraction (i.e., the volume fraction of cavitation bubbles, Fig. 7b) differ significantly at various axial positions (Z = 138, 146, 154, and 162 mm). For pressure distribution (Fig. 7a), at Z = 138 mm, the pressure is concentrated around −14.2 kPa within a narrow range. As Z increases to 146, 154, and 162 mm, the negative pressure drops progressively to −45.3 kPa, −75.3 kPa, and −109 kPa, respectively, with a noticeably broadening distribution. Regarding the Phase 2 volume fraction (Fig. 7b), at Z = 138 mm, the value clusters around 0.2969 with a relatively concentrated profile. It slightly decreases to 0.2785 at Z = 146 mm, then rises to 0.3262 and 0.3537 at Z = 154 and 162 mm, respectively, accompanied by a widening distribution range.
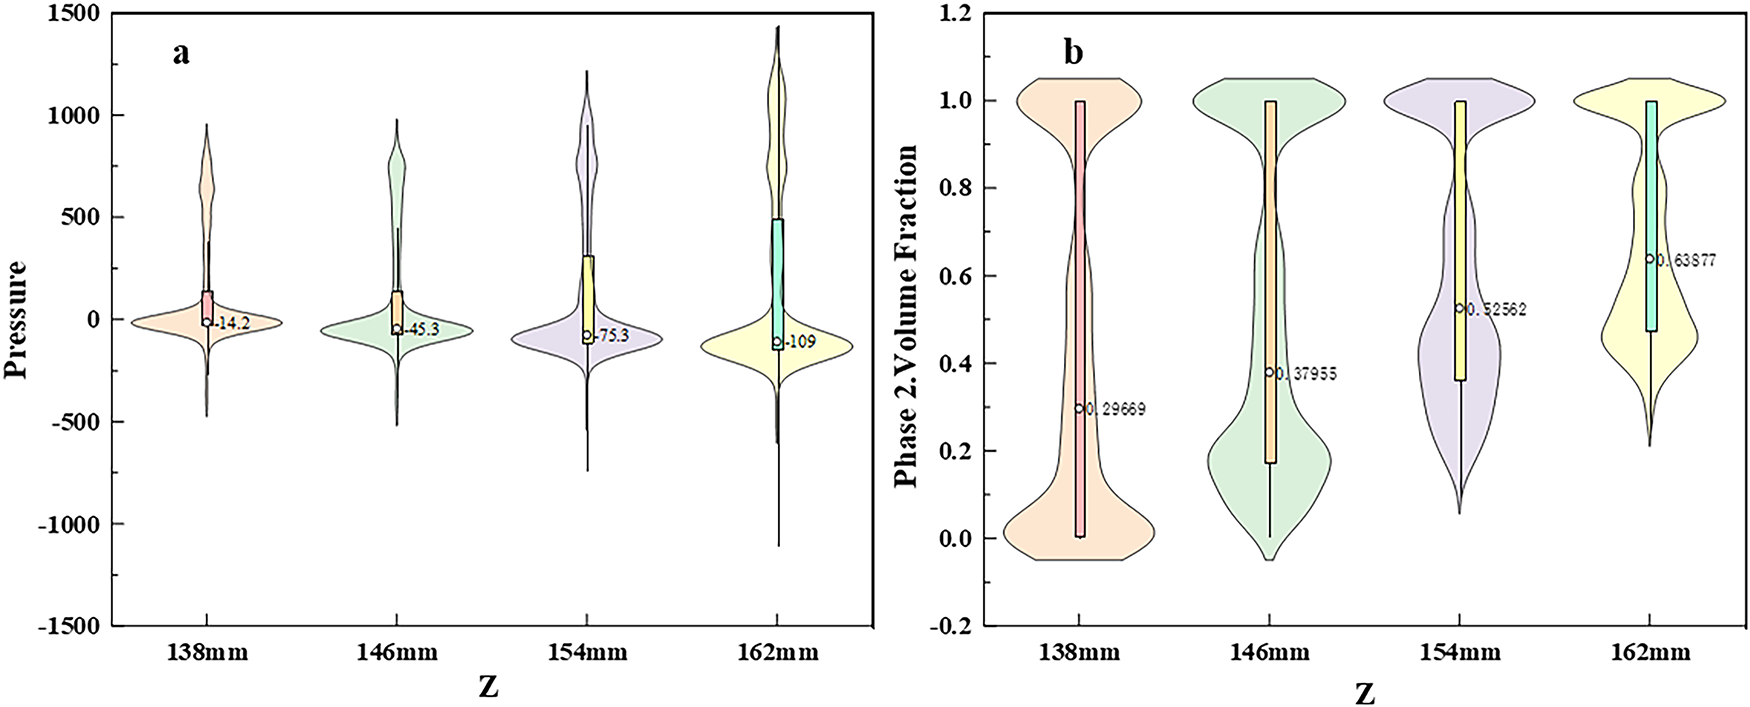
Figure 7: Distribution of pressure and Phase 2 volume fraction at different axial positions (Z = 138, 146, 154, 162 mm): (a) Pressure distribution (b) Phase 2 volume fraction distribution
The inception of cavitation follows a fundamental physical principle: when the local static pressure falls below the saturated vapor pressure of the liquid at the operating temperature, the fluid undergoes phase change and vapor cavities form, a direct consequence of thermodynamic instability of the liquid under low-pressure conditions [25]. In this study, the pressure drops as low as −109 kPa, far below the saturated vapor pressure of water (approximately 2.3 kPa at 20°C), creating a powerful driving force for explosive bubble growth and confirming that the JI-NPR design successfully establishes the necessary physical environment for intense cavitation. Notably, lower Z regions (e.g., 138 mm), characterized by relatively low pressure, are more susceptible to cavitation inception. As Z increases, despite the further decline in pressure (which enhances the cavitation driving force), the volume fraction of cavitation bubbles continues to rise, reflecting the dynamic process from bubble formation to growth and highlighting the governing role of axial pressure variation in cavitation development within the reactor. Specifically, the pressure drops sharply from an inlet value of approximately 1.17 MPa to a minimum of −109 kPa, serving as the primary driver for intense cavitation. This drastic reduction, far below the saturated vapor pressure, aligns with classical cavitation inception criteria [26]. The magnitude and dynamics of this pressure drop directly regulate the formation, growth, and subsequent collapse of cavitation bubbles-processes that generate energy-intensive effects essential for process intensification in the reactor.
As shown in Fig. 8a, the orifice nozzle region exhibits a noticeably high-velocity profile, with colors shifting toward red and orange, which represent higher speeds. In contrast, areas such as the reactor center, inlet, and outlet appear blue, indicating lower flow velocities. This visually confirms that the highest flow rates occur within the orifice nozzle. Fig. 8b further demonstrates that velocity curves at different axial positions (Z) show distinct peaks within the Y-interval corresponding to the orifice nozzle, reinforcing that the maximum flow velocity is located inside the nozzle.
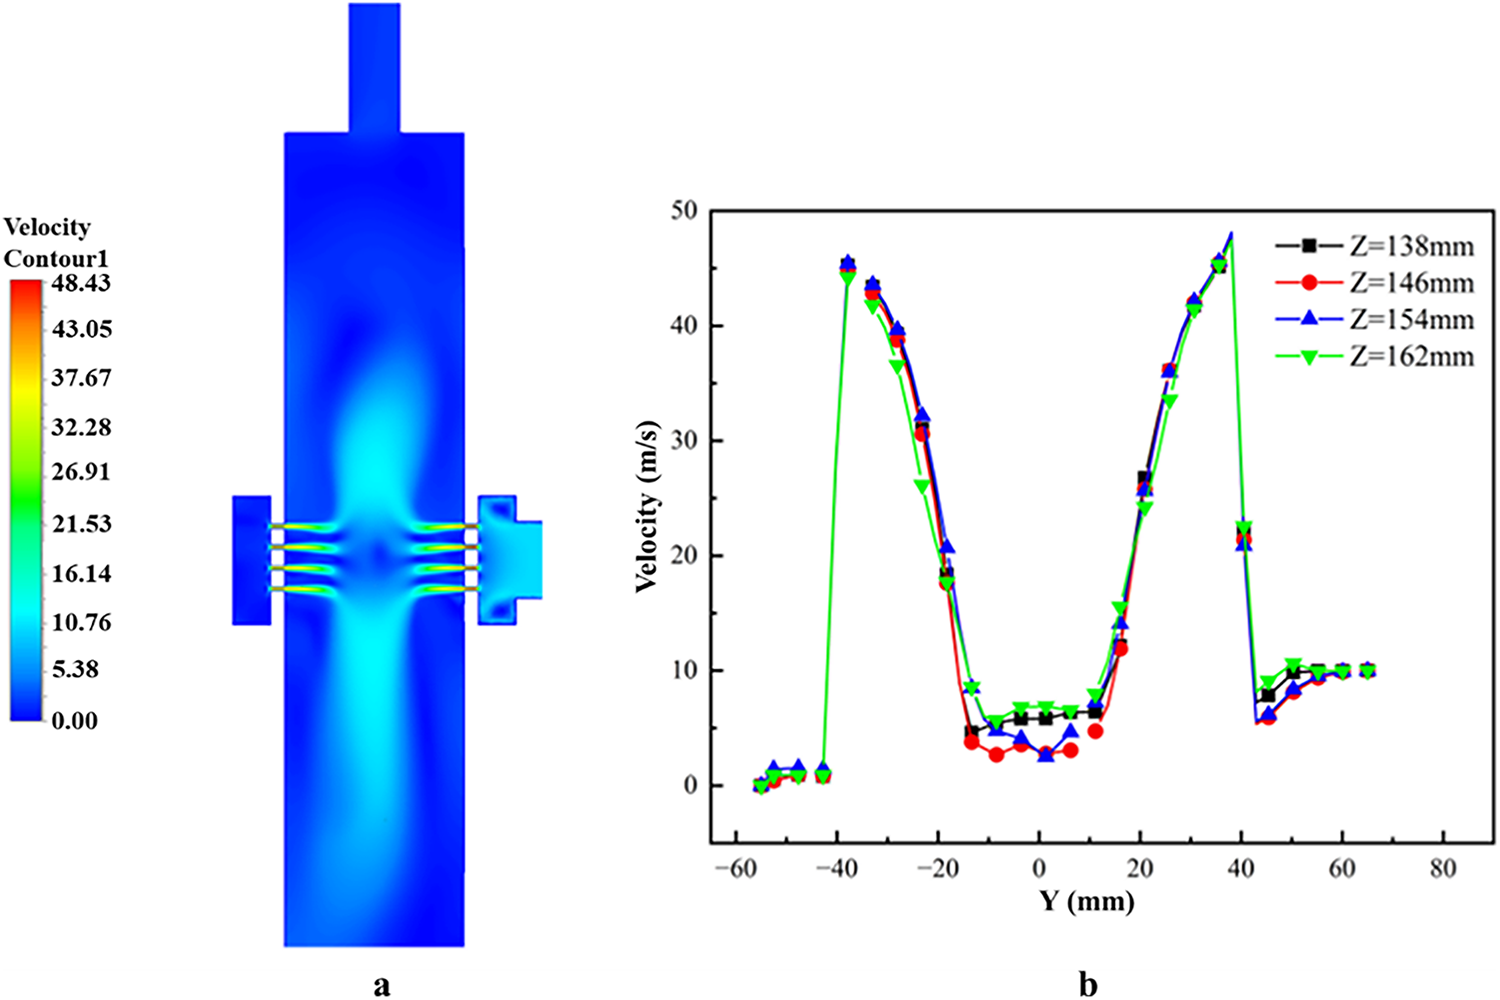
Figure 8: Flow field characteristics of the jet impingement-negative pressure ammonia removal reactor: (a) velocity distribution contour, (b) fluid velocity distribution curve along the Y-axis
As water flows from the inlet toward the orifice, the velocity curve shows a sharp increase. This occurs because the flow cross-section rapidly contracts when passing through the orifice nozzle. The dramatic acceleration of flow within the orifice nozzle is a direct manifestation of the principle of mass conservation (continuity equation). As the cross-sectional area contracts, the velocity must increase to maintain a constant mass flow rate. This conversion between pressure energy and kinetic energy is fundamentally described by Bernoulli’s principle for incompressible flow. The high kinetic energy in the jet core is attained at the direct expense of static pressure, causing it to plummet and trigger cavitation. This explains the physical mechanism linking the geometric design of the orifice to the observed cavitation inception. When the pressure falls below the saturated vapor pressure of the fluid, cavitation occurs.
Upon entering the reactor interior, the flow passage suddenly expands, causing a rapid decrease in flow velocity and a conversion of kinetic energy. This results in the formation of a low-pressure zone near the reactor wall. Within this low-pressure environment, pre-existing cavitation bubbles—which have relatively higher internal pressure—expand and increase in volume. This behavior is consistent with the physical principles of cavitation, further indicating that changes in the flow field within the reactor promote the initiation and development of cavitation.
Fig. 9 displays the vapor volume fraction distribution at cross-sections corresponding to different axial positions (Z). It can be observed that the vapor phase is primarily concentrated near the inner wall of the orifice, exhibiting a distinct annular distribution pattern. This morphology is a characteristic feature of “sheet cavitation”, a well-documented phenomenon in confined flows where the local pressure falls below the fluid’s saturated vapor pressure [18]. The clear visual contrast between the vapor-rich regions (non-blue) along the wall and the vapor-free core flow (blue) confirms that cavitation initiates predominantly at the inner wall of the orifice nozzle, where local flow conditions—such as the sharp pressure drop and high velocity—are most conducive to its inception. The simulation’s ability to capture this typical behavior validates its reliability. Furthermore, the high vapor volume fraction peak of 0.42 indicates that the JI-NPR design achieves a cavitation intensity sufficient to induce strong physico-chemical effects, as the collapse of such dense cavitation clouds is known to generate intense shockwaves and micro-jets [19].
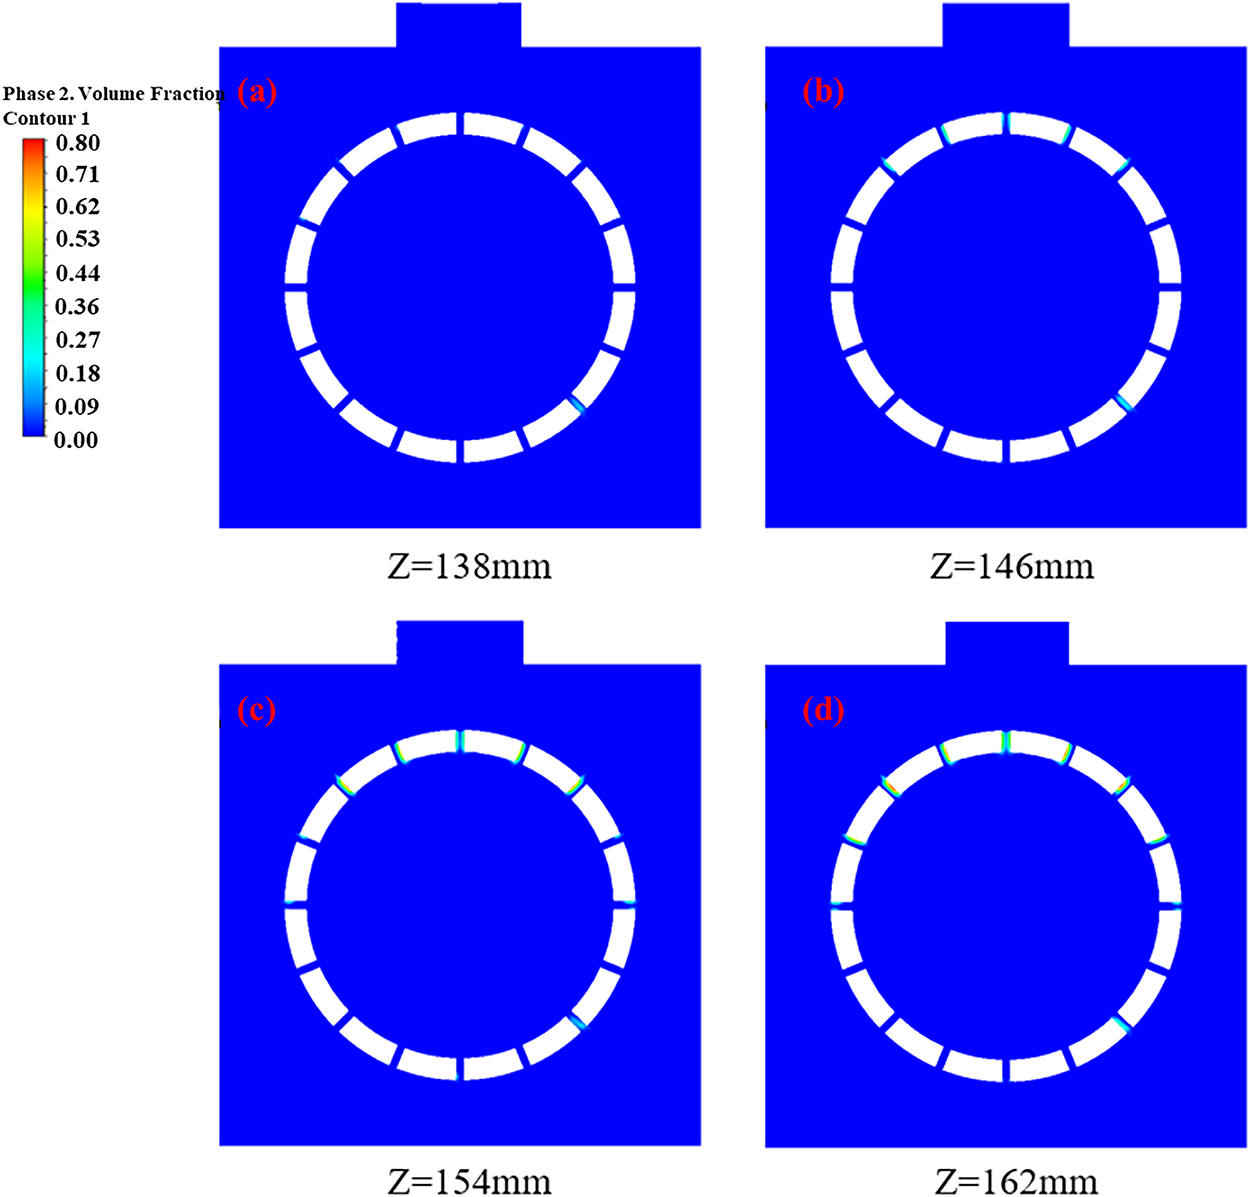
Figure 9: Vapor volume fraction contours at different cross-sections: (a) Z = 138 mm, (b) Z = 146 mm, (c) Z = 154 mm, (d) Z = 162 mm
As observed in Fig. 10, which shows the vapor volume fraction distribution along the Y-axis, the vapor fraction remains nearly zero after the water enters the jacket and before it reaches the orifice, indicating no significant cavitation occurs at this stage. As the flow passes through the orifice, the vapor fraction increases sharply and reaches its maximum near the center of the orifice (for example, the green curve corresponding to Z = 162 mm shows a peak vapor fraction of approximately 0.42; the exact value varies at different Z positions). Beyond this point, the vapor fraction gradually decreases.
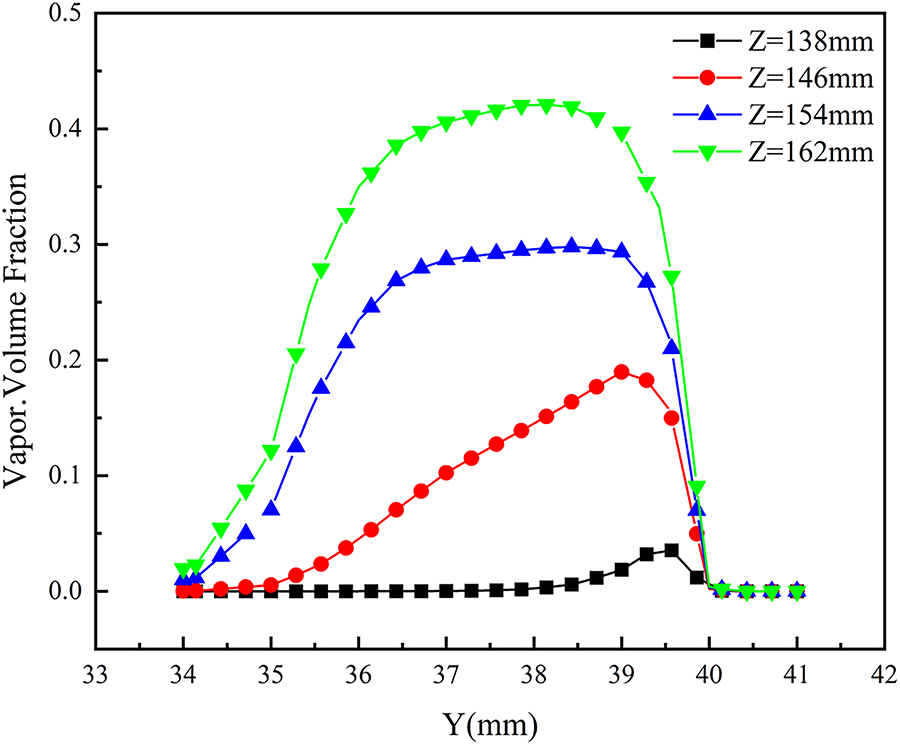
Figure 10: Vapor volume fraction distribution along the Y-axis
The magnitude of the vapor fraction reflects the amount of cavitation bubbles present. A rapid increase suggests massive generation and growth of cavitation bubbles, marking the onset of cavitation development. The subsequent decline indicates the collapse of the bubbles, as they dissolve back into the liquid upon implosion, leading to a reduction in the vapor volume fraction. This pattern of initial rise and subsequent fall in vapor volume fraction illustrates the complete dynamic process of cavitation bubble development and collapse.
As shown in Fig. 11, the relationship between fluid velocity and vapor volume fraction in the flow field is illustrated. For the curve corresponding to Z = 138 mm, the velocity increases sharply even at very low vapor volume fractions, quickly reaching a high value. This indicates that at this axial position, even a small amount of vapor phase significantly enhances the flow velocity, likely due to early cavitation inception and rapid development. The dynamic behavior of cavitation bubbles (generation, motion, etc.) intensifies the jet flow efficiently.
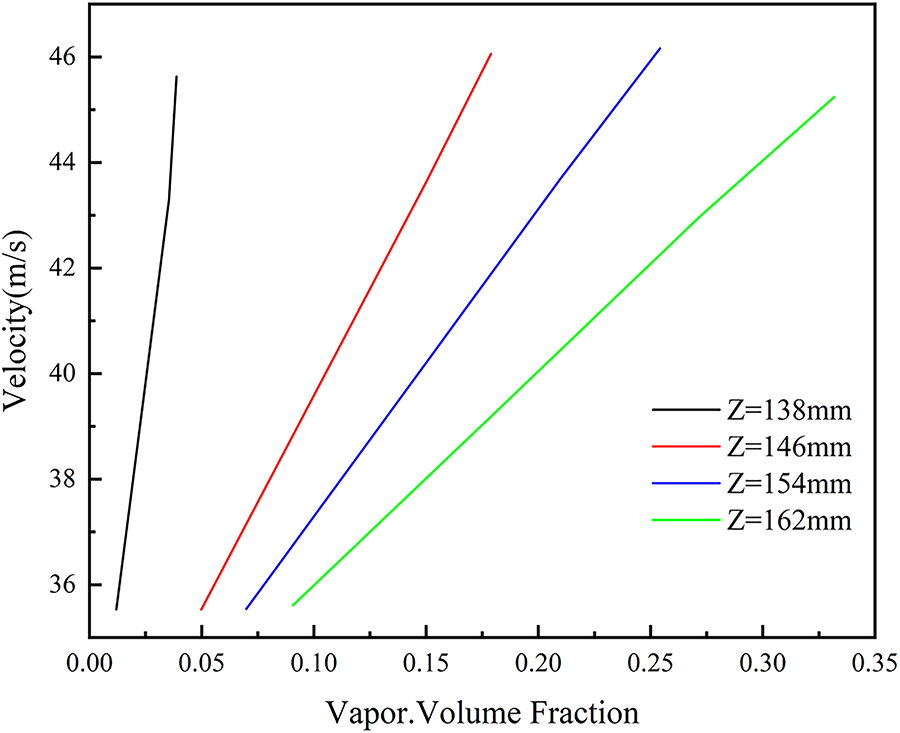
Figure 11: Relationship between flow velocity and vapor volume fraction
For the other three curves, as the vapor volume fraction increases gradually from low to high, the velocity exhibits an approximately linear upward trend. This reflects a stable positive correlation between vapor volume fraction and velocity at these axial positions. An increase in vapor volume fraction indicates a greater number of cavitation bubbles in the flow field. During the process of bubble generation, deformation, and collapse, the surrounding fluid experiences strong disturbances. On one hand, the presence of bubbles reduces the effective flow cross-section, effectively “squeezing” the fluid within the jet channel (orifice) and accelerating the flow. On the other hand, the observed positive correlation between vapor fraction and velocity is reinforced by the physics of bubble collapse. The presence of vapor bubbles reduces the effective flow area, constricting the liquid and accelerating it. More importantly, upon collapse near a wall, the asymmetric implosion of a cavitation bubble, governed by the Rayleigh-Plesset equation and its extensions, generates a physically destructive micro-jet. This micro-jet is a well-documented physical phenomenon that can reach velocities of over 100 m/s [22], imparting significant momentum and creating intense local shear and turbulence in the surrounding fluid. This energy transfer from collapsing bubbles to the bulk flow is a key physical mechanism for the enhanced turbulence and mixing that are crucial for improving mass transfer in the ammonia removal process.
As shown in the pressure contour (Fig. 12), distinct pressure differences are observed across different regions. The left region, colored in blue, corresponds to relatively high pressure. As the water jet exits the nozzle and passes through the orifice and subsequent areas, the color transitions gradually to green and yellow, eventually turning orange in the right region, indicating a significant decrease in pressure. This visually demonstrates the progressive pressure attenuation as the flow moves from the inlet through the orifice nozzle. The formation of a low-pressure zone provides a favorable environment for cavitation, as cavitation typically occurs when the local pressure falls below the saturated vapor pressure of the fluid.
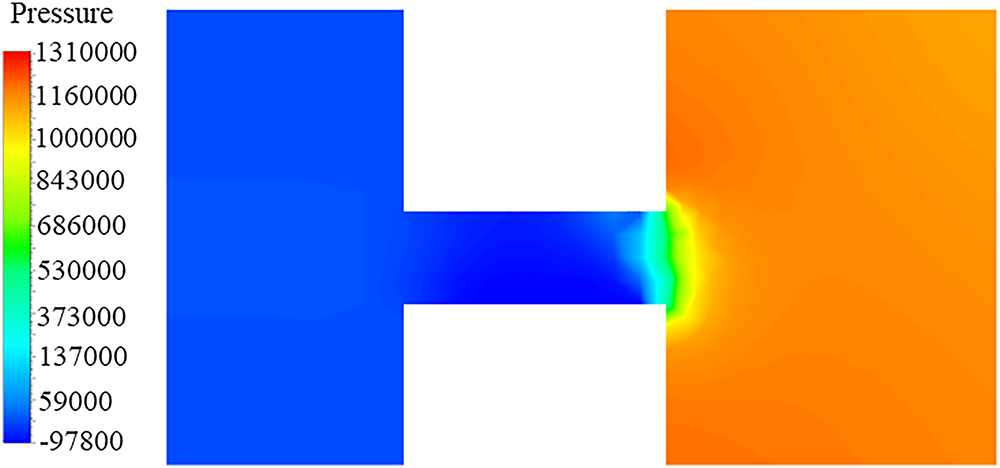
Figure 12: Pressure contour of the jet impingement-negative pressure ammonia removal reactor
The variation of maximum pressure along the Y-axis is illustrated in Fig. 13. Initially, as the flow enters from the inlet, the maximum pressure remains stable at approximately 1.17 MPa, indicating that the fluid has not yet entered the orifice nozzle and the pressure is still dominated by the inlet condition. Once the fluid enters the orifice nozzle, the maximum pressure first decreases to 1.08 MPa, then further drops to 0.92 MPa, followed by a sharp decline eventually reaching −0.04 MPa. This rapid and significant pressure reduction directly reflects the formation of cavitation bubbles in the flow field. The presence of cavitation bubbles alters the pressure distribution, as the internal pressure of these bubbles—mainly filled with vapor or gas—is much lower than that of the surrounding liquid. The accumulation of cavitation bubbles significantly reduces the overall pressure within the orifice, enhancing the cavitation effect and further confirming that cavitation indeed occurs inside the orifice, playing a critical role in pressure attenuation.
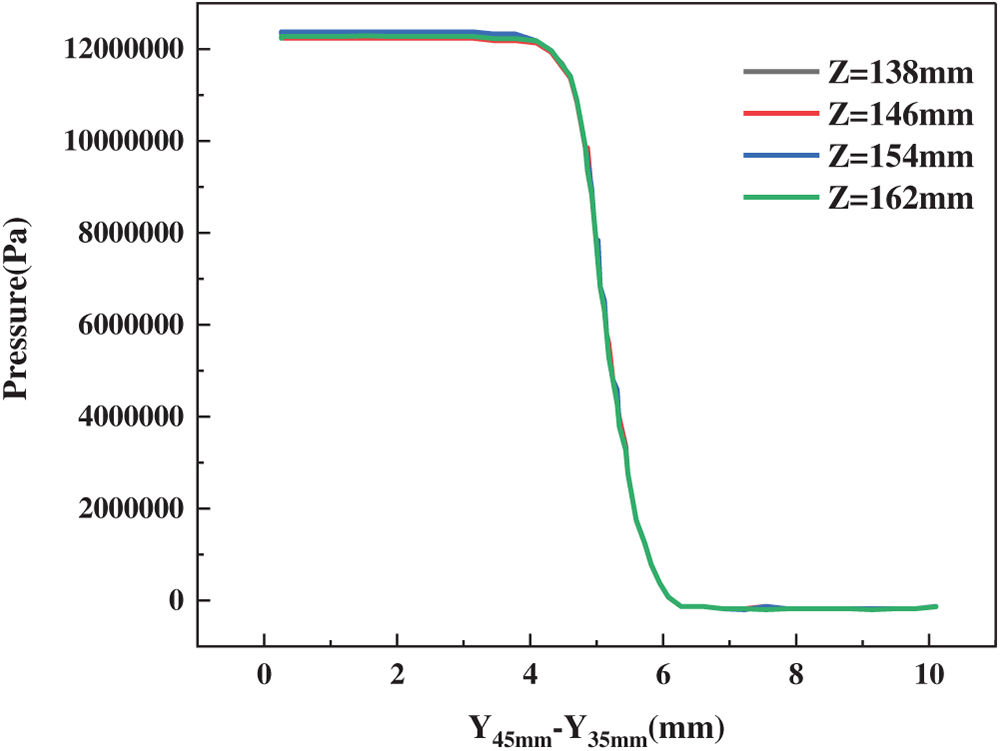
Figure 13: Fluid pressure distribution curve along the Y-axis
As illustrated in Fig. 14, the complex flow characteristics within the reactor are clearly visible. In the region near the outlet of the orifice nozzle, the velocity vectors exhibit a strong jet-like behavior with high flow velocities, resulting in significant kinetic energy in this zone. According to the principle of energy conservation in fluid dynamics, high kinetic energy is often accompanied by a reduction in pressure. Near the wall surrounding the nozzle, the distribution of velocity vectors indicates that the flow pattern is altered due to wall confinement, leading to the formation of vortex structures along the wall. The vortex structures identified near the wall and within the jacket are critical to sustaining cavitation. The low pressure in the core of a vortex is a result of the radial pressure gradient required to centripetally accelerate the swirling fluid parcels. According to the governing momentum equations, the pressure at the vortex core is significantly reduced to balance the centrifugal forces. This self-sustaining low-pressure environment, governed by the physics of rotational flow, provides a persistent region where the pressure can remain below the vapor pressure, thereby facilitating the continuous formation and growth of cavitation bubbles even away from the primary orifice jet.
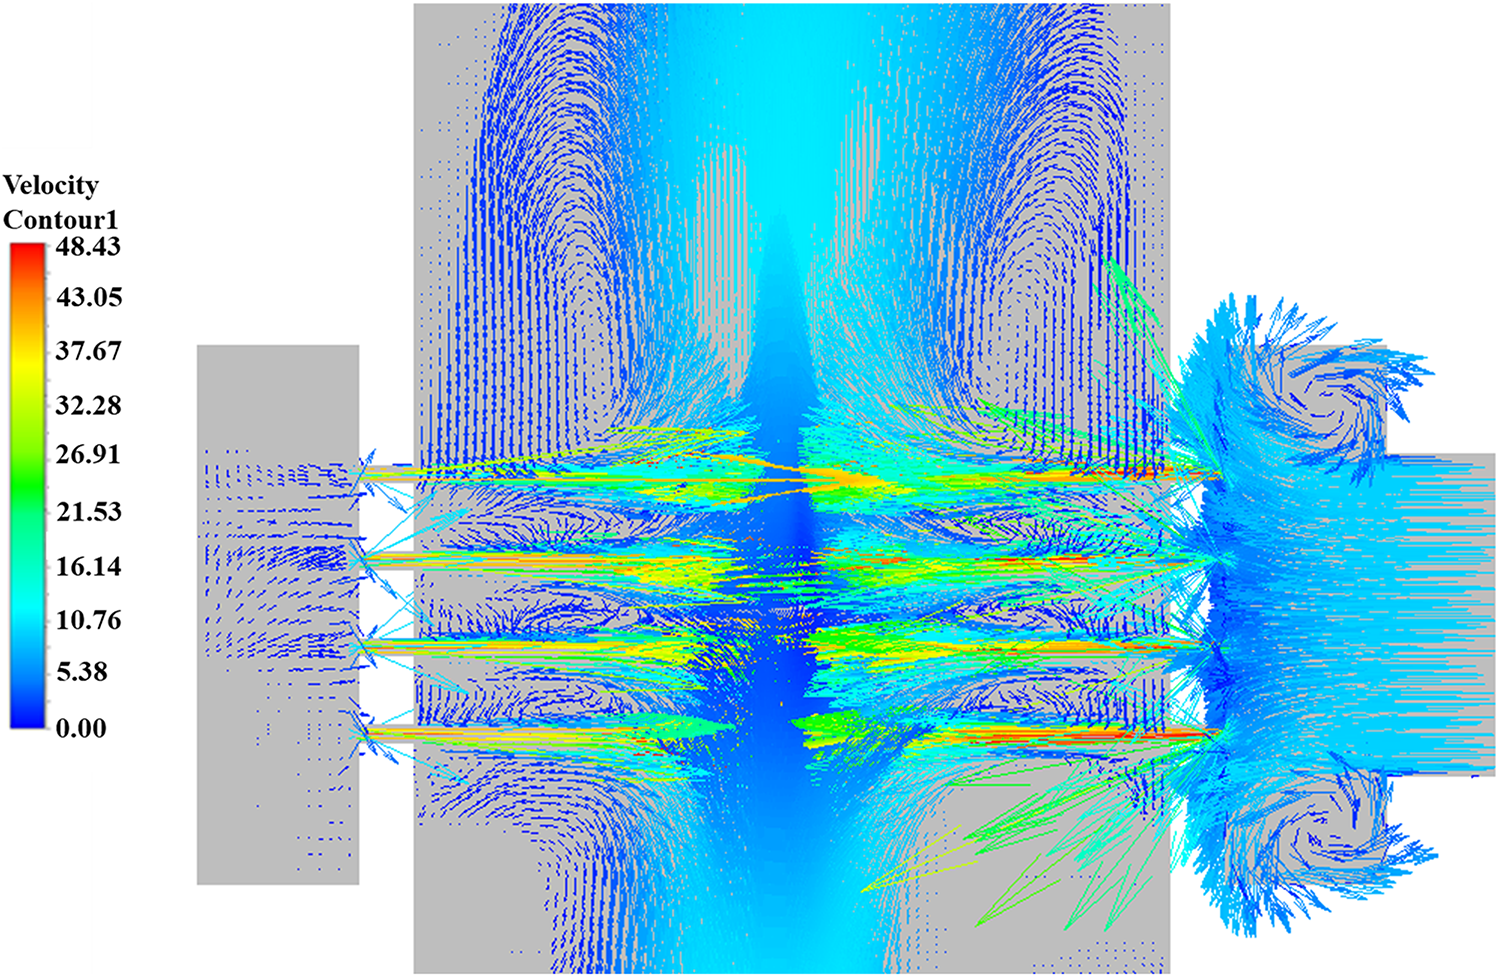
Figure 14: Velocity vector diagram of the flow field in the jet impingement-negative pressure ammonia removal reactor
In the jacket section, large-scale vortices are clearly observed in the velocity vector diagram. The structure of the jacket causes the fluid to form recirculating vortex patterns under the influence of boundary effects. At the center of these vortices, the rotational motion of the fluid significantly reduces the pressure due to centrifugal forces and other rotational effects, preventing the pressure from remaining high. This creates a low-pressure environment conducive to the formation of bubbles, as bubble generation typically requires reduced pressure to promote the release of dissolved gases or vaporization of the liquid.
This study conducted a comprehensive numerical investigation into the flow field characteristics and cavitation effects in a jet impingement-negative pressure ammonia removal reactor using three-dimensional CFD simulations. The main findings are summarized as follows:
(1) The flow velocity significantly increases within the orifice nozzle due to flow contraction, resulting in a sharp decrease in local pressure that induces cavitation. The internal wall of the nozzle is identified as the primary region for cavitation initiation.
(2) The vapor volume fraction distribution reveals the dynamic process of cavitation bubble generation, development, and collapse. A positive correlation is observed between the vapor volume fraction and flow velocity, indicating that cavitation enhances jet intensity and promotes turbulence.
(3) Pressure distribution analysis confirms the formation of low-pressure zones near the orifice and within vortex cores, providing favorable conditions for cavitation. A substantial pressure drop—from 1.17 MPa to negative values—is observed along the flow direction, further validating the occurrence of cavitation.
(4) The vortex structures formed near the wall and inside the jacket contribute to sustained low-pressure regions, facilitating continuous cavitation and efficient mixing, which are critical for enhancing ammonia removal.
The numerical results are in good agreement with experimental pressure data, confirming the reliability of the applied numerical models. However, this study has certain limitations that also point toward future research directions. The current isothermal model, while effectively capturing the hydrodynamic cavitation mechanisms, does not account for the thermal effects of bubble collapse or the actual ammonia removal process involving mass transfer and reactions. Furthermore, the investigation was conducted under a specific operational condition. Therefore, future work should focus on a comprehensive parametric study to optimize reactor performance, coupled with the development of a multiphysics model that integrates species transport and reaction kinetics. The ultimate goal is to validate these advanced models against experimental data on ammonia removal efficiency, thereby bridging the gap between hydrodynamic analysis and practical wastewater treatment application.
Acknowledgement: Not applicable.
Funding Statement: The study was supported by Chongqing Natural Science Foundation Innovation and Development Joint Fund (CSTB2023NSCQ-LZX0095), Chongqing Natural Science Foundation General Project (CSTB2025NSCQ-GPX0955), Science and Technology Research Program of Chongqing Municipal Education Commission of China (KJQN202401157), The Open and Innovation Fund of Hubei Three Gorges Laboratory (SK250005), The Key Laboratory of Manufacturing and Application of Intelligent Well Control for Oil and Gas Production and Transportation of Luzhou (2024LZOGB-05) and postgraduate Innovation Project of Chongqing University of Technology (CYS240709).
Author Contributions: Dong Hu: Writing—review & editing, Writing—original draft, Visualization, Supervision, Resources, Methodology, Investigation, Formal analysis, Data curation, Conceptualization. Lingxing Hu: Writing—review & editing, Writing—original draft, Visualization, Resources, Methodology, Investigation, Formal analysis, Data curation, Conceptualization. Facheng Qiu: Writing—review & editing, Writing—original draft, Visualization, Supervision, Methodology, Funding acquisition, Formal analysis, Data curation, Conceptualization. All authors reviewed the results and approved the final version of the manuscript.
Availability of Data and Materials: Data will be made available on request.
Ethics Approval: Not applicable.
Conflicts of Interest: The authors declare no conflicts of interest to report regarding the present study.
References
1. Weralupitiya C, Wanigatunge R, Joseph S, Athapattu BCL, Lee TH, Kumar Biswas J, et al. Anammox bacteria in treating ammonium rich wastewater: recent perspective and appraisal. Bioresour Technol. 2021;334(17):125240. doi:10.1016/j.biortech.2021.125240. [Google Scholar] [PubMed] [CrossRef]
2. Liu Q, Zhu J, Ouyang W, Ding C, Wu Z, Ostrikov KK. Cold plasma turns mixed-dye-contaminated wastewater bio-safe. Environ Res. 2024;246:118125. doi:10.1016/j.envres.2024.118125. [Google Scholar] [PubMed] [CrossRef]
3. Xu H, Deng Y, Li X, Liu Y, Huang S, Yang Y, et al. Effect of increasing C/N ratio on performance and microbial community structure in a membrane bioreactor with a high ammonia load. Int J Environ Res Public Health. 2021;18(15):8070. doi:10.3390/ijerph18158070. [Google Scholar] [PubMed] [CrossRef]
4. Ali H, Min Y, Yu X, Kooch Y, Marnn P, Ahmed S. Composition of the microbial community in surface flow-constructed wetlands for wastewater treatment. Front Microbiol. 2024;15:1421094. doi:10.3389/fmicb.2024.1421094. [Google Scholar] [PubMed] [CrossRef]
5. Mishra S, Singh V, Cheng L, Hussain A, Ormeci B. Nitrogen removal from wastewater: a comprehensive review of biological nitrogen removal processes, critical operation parameters and bioreactor design. J Environ Chem Eng. 2022;10(3):107387. doi:10.1016/j.jece.2022.107387. [Google Scholar] [CrossRef]
6. Meng X, Han Y, Huang Z, Gong X. Challenges and solutions of anammox in mainstream wastewater treatment plants. Environ Eng. 2022;40(10):203–14. [Google Scholar]
7. Kıyak B, Öztop HF, Gökhan Aksoy İ. Experimental and numerical investigation on melting of phase change material in a disc-shaped container via hot air jet impinging. Appl Therm Eng. 2024;236:121761. doi:10.1016/j.applthermaleng.2023.121761. [Google Scholar] [CrossRef]
8. Elperin IT. Heat and mass transfer in opposing currents. J Eng Phys. 1961;6(6):62–8. [Google Scholar]
9. Bai F, Diao H, Zhang M, Chang Q, Wang E, Du Q. Breakup characteristics of power-law liquid sheets formed by two impinging jets. Fluid Dyn Res. 2014;46(5):055506. doi:10.1088/0169-5983/46/5/055506. [Google Scholar] [CrossRef]
10. Lai WH, Huang W, Jiang TL. Characteristic study on the like-doublet impinging jets atomization. Atomiz Spr. 1999;9(3):277–89. doi:10.1615/atomizspr.v9.i3.30. [Google Scholar] [CrossRef]
11. Huang JCP. The break-up of axisymmetric liquid sheets. J Fluid Mech. 1970;43(2):305–19. doi:10.1017/s0022112070002392. [Google Scholar] [CrossRef]
12. Li R, Ashgriz N. Characteristics of liquid sheets formed by two impinging jets. Phys Fluids. 2006;18(8):087104. doi:10.1063/1.2338064. [Google Scholar] [CrossRef]
13. Jung S, Hoath SD, Martin GD, Hutchings IM. Atomization patterns produced by the oblique collision of two Newtonian liquid jets. Phys Fluids. 2010;22(4):042101. doi:10.1063/1.3373513. [Google Scholar] [CrossRef]
14. Erni P, Elabbadi A. Free impinging jet microreactors: controlling reactive flows via surface tension and fluid viscoelasticity. Langmuir. 2013;29(25):7812–24. doi:10.1021/la401017z. [Google Scholar] [PubMed] [CrossRef]
15. Dombrowski ND, Hooper PC. A study of the sprays formed by impinging jets in laminar and turbulent flow. J Fluid Mech. 1964;18(3):392–400. doi:10.1017/s0022112064000295. [Google Scholar] [CrossRef]
16. Hu L, Peng Y, Yan H, Qiu F, Cheng Z. A random forest-optimized sensor fusion approach for non-invasive ammonia measurement: enhancing performance in jet impact-negative pressure reactors. Measurement. 2026;258(5):119121. doi:10.1016/j.measurement.2025.119121. [Google Scholar] [CrossRef]
17. Hu L, Pan C, Hu D, Yan H, Qiu F, Cheng Z. Coupled CFD-machine learning optimization of inlet water-jet orifices in jet impact negative pressure reactors. J Taiwan Inst Chem Eng. 2025;175(7):106248. doi:10.1016/j.jtice.2025.106248. [Google Scholar] [CrossRef]
18. Zi D, He DQ, Yao ZF, Wang FJ, Zhong Q, Lyu P. Investigations of the dynamical behaviors of a millimeter-scale cavitation bubble near the rigid wall. J Hydrodyn. 2023;35(6):1064–76. doi:10.1007/s42241-023-0075-2. [Google Scholar] [CrossRef]
19. Szala M, Hejwowski T, Lenart I. Cavitation erosion resistance of Ni-Co based coatings. Adv Sci Technol Res J. 2014;8(21):36–42. doi:10.12913/22998624.1091876. [Google Scholar] [CrossRef]
20. Li FB, Sha W, Li Q. Research on mathematical model of liquid-continuous impinging streams. Appl Mech Mater. 2013;394:80–5. doi:10.4028/www.scientific.net/amm.394.80. [Google Scholar] [CrossRef]
21. Li Q, Wang HL, Li FB. Numerical simulation of the flow field in cavitations nozzle for impinging streams reactor. Adv Mater Res. 2010;139-141:1048–51. doi:10.4028/www.scientific.net/amr.139-141.1048. [Google Scholar] [CrossRef]
22. Flint EB, Suslick KS. The temperature of cavitation. Science. 1991;253(5026):1397–9. doi:10.1126/science.253.5026.1397. [Google Scholar] [PubMed] [CrossRef]
23. Islam MT, Nguyen AV, Afzal A. Bubble’s rise characteristics in shear-thinning xanthan gum solution: a numerical analysis. J Taiwan Inst Chem Eng. 2022;132:104219. doi:10.1016/j.jtice.2022.104219. [Google Scholar] [CrossRef]
24. Payri F, Payri R, Salvador FJ, Martínez-López J. A contribution to the understanding of cavitation effects in diesel injector nozzles through a combined experimental and computational investigation. Comput Fluids. 2012;58(7):88–101. doi:10.1016/j.compfluid.2012.01.005. [Google Scholar] [CrossRef]
25. Zhang J, Chen W, Li P, Liu G, Han W. Numerical simulation of ventilated supercavitating flow structure. Sci Rep. 2025;15(1):20662. doi:10.1038/s41598-025-08046-7. [Google Scholar] [PubMed] [CrossRef]
26. Brennen CE. Cavitation and bubble dynamics. Cambridge, UK: Cambridge University Press; 1995. [Google Scholar]
Cite This Article
 Copyright © 2025 The Author(s). Published by Tech Science Press.
This work is licensed under a Creative Commons Attribution 4.0 International License , which permits unrestricted use, distribution, and reproduction in any medium, provided the original work is properly cited.
 Downloads
 Citation Tools