
 Submit a Paper
 Propose a Special lssue
 Open Access
ARTICLE

Experimental Study on Heat Transfer Characteristics of New Jacketed Cold Storage Condenser
1 College of Mechanical Engineering, Jiamusi University, Jiamusi, China
2 Key Laboratory of Ocean Energy Utilization and Energy Conservation of Ministry of Education, Dalian University of Technology, Dalian, China
* Corresponding Authors: Dongyue Jiang. Email: ; Qiang He. Email:
(This article belongs to the Special Issue: Enhancement Technologies for Fluid Heat and Mass Transfer)
Frontiers in Heat and Mass Transfer 2026, 24(1), 1 https://doi.org/10.32604/fhmt.2026.075774
Received 08 November 2025; Accepted 16 January 2026; Issue published 28 February 2026
 View Full Text
 Download PDF
Abstract
In response to the actual demands of the energy storage type organic Rankine power generation cycle, this study proposes a new type of jacketed shell and tube heat exchanger with integrated cold storage and heat exchange. N-tedecane is selected as the phase change material for cold storage, low-temperature water as the cold source, and R134a as the heat source. The phase change material for cold storage is filled inside the jacket tube of the heat exchanger. Cold fluid is introduced into the inner tube to cause the phase change material to condense and store cold. After the cold storage is completed, R134a flows in from the shell side and condenses through heat exchange with the solidified phase change material for energy storage. This study discusses the influence laws of different cold water mass flow rates and temperatures on the cold storage performance of this heat exchanger, and analyzes the condensation effect of R134a. The results show that when the mass flow rate is 0.5 kg/s and the cold water temperature is between 3 and 4°C, the average power of the energy storage heat exchanger in the condensation experiment is 80 W, and the average convective heat transfer coefficient is 110.73 W/(m2·K). This research provides an experimental basis for the development of energy storage organic Rankine power generation cycles.Keywords
The escalating energy crisis and global warming, driven by the extensive exploitation of fossil fuels, have intensified the focus on waste heat recovery across various industrial sectors, now advancing into a phase of deep exploration [1]. The energy storage-type organic Rankine cycle (ORC) power generation system represents a promising technology that harnesses medium- and low-grade waste heat and cold, converting them into electricity via organic working fluids, thereby significantly elevating the utilization efficiency of industrial waste energy. A primary operational challenge for such systems, however, is the spatio-temporal mismatch between the availability of waste heat resources and user demand. Thermal and cold energy storage technologies offer an effective solution to mitigate this discrepancy. Conventional thermal energy storage technologies are predominantly categorized into three types [2]: thermochemical [3], sensible [4], and latent heat storage [5]. Thermochemical energy storage operates on the reversibility of chemical reactions to store and release thermal energy, offering high energy storage density [6]. Nevertheless, its practical application is often hindered by uncontrollable and potentially unsafe heat release processes, coupled with high system complexity. Sensible heat storage, in contrast, relies on the heat capacity of materials, storing or releasing energy through temperature variations. Common media such as water, rock, and sand are cost-effective but suffer from low energy storage density and consequently require large volumes. Latent heat storage, utilizing phase change materials (PCMs), presents a superior alternative by leveraging the high energy density of phase transitions. Crucially, this method provides a compact and thermally stable solution for cold energy storage, addressing key limitations of the other technologies [7,8].
Enhancing heat storage and release capacity necessitates not only the adoption of efficient storage technologies but also the optimization of heat exchanger design. Conventional energy storage heat exchangers typically feature three primary structures: plate, packed bed, and shell-and-tube types. The plate-type heat exchanger employs a layered parallel-plate design, where the heat transfer fluid (HTF) flows through channels between the plates, and the phase change material (PCM) is encapsulated within the plate core interlayer. Categorized as a compact energy storage heat exchanger, this design offers advantages such as strong applicability and a high heat transfer coefficient. However, it is also limited by a complex encapsulation process and a significant risk of thermal expansion deformation [9]. In the packed bed type, thermal energy is stored and released by the flow of the HTF through a bed of capsules or other containment units filled with PCM. This configuration provides excellent sealing performance, facilitates coupling with various heat sources, and operates efficiently across a wide temperature range. Its drawbacks, however, include a susceptibility to tank wall deformation during thermal cycling and non-negligible heat loss at the end faces, which can adversely affect heat transfer efficiency [10]. The shell-and-tube configuration, another prevalent type, comprises a head and a shell. The head acts as a buffer zone for the HTF, which then flows through the tube-side working chamber, while the PCM is contained within the shell-side interlayer. Owing to its simple structure and low cost, the shell-and-tube heat exchanger is regarded as the most widely utilized type in energy storage applications [11]. However, a key challenge for deep integration of latent heat storage within ORC condensers lies in the inherent design of standard shell-and-tube units. In such traditional layouts, the functions of heat exchange (via tube-side/shell-side fluid paths) and energy storage (via PCM in the shell) are physically separated. This can lead to non-optimal thermal coupling, increased overall system volume, and potential performance issues such as the liquid retention zones on the shell-side which reduce the effective heat transfer area for condensation, as noted in condenser performance studies. Furthermore, during the phase transition, the PCM’s low thermal conductivity can dominate the system’s thermal resistance, limiting the power density during charge and discharge cycles. Recent advancements in integrated thermal systems further highlight the synergy between PCMs and advanced heat exchanger geometries to overcome the inherent limitations of conventional designs, such as low energy density or poor heat transfer rates. For instance, Parach et al. numerically investigated a photovoltaic-thermal system integrated with PCM and rectangular fins, demonstrating that fin geometry (aspect ratio and count) significantly impacts the PCM’s melting fraction and the system’s overall electrical efficiency [12]. Their work underscores the critical role of extended surfaces and geometric optimization in enhancing heat transfer within PCM compartments, a principle that is directly applicable to the design optimization of latent heat storage exchangers. However, most studies, including the aforementioned, focus on medium-to-high temperature applications (e.g., solar thermal, PVT) or specific system configurations. Research on condensers that intrinsically integrate latent heat cold storage for Organic Rankine Cycle (ORC) applications, particularly using a jacketed design where the condenser itself acts as the cold storage unit, remains scarce. This design approach, with the PCM encapsulated in an annular jacket surrounding the inner coolant/condensate tube, aims to mitigate the aforementioned challenges by: (1) achieving a more compact and intimate thermal coupling between the PCM and the primary heat transfer surface, potentially enhancing heat transfer rates; (2) simplifying the system architecture by combining two functional components (cold storage tank and condenser) into one, which could reduce cost and footprint; and (3) providing a stable, isothermal-like cold source during condensation by leveraging the PCM’s phase change plateau, which is beneficial for maintaining a consistent thermal driving force for the working fluid (e.g., R134a) condensation. Particularly using a jacketed design where the condenser itself acts as the cold storage unit, remains scarce. This study aims to bridge this gap by proposing and experimentally investigating a novel jacketed cold storage condenser specifically designed for ORC systems, where the condensation and cold storage functions are synergistically combined.
To address the limitation of traditional shell-and-tube heat exchangers in functioning as integrated heat storage and exchange units, this study proposes a novel jacketed shell-and-tube phase change energy storage heat exchanger. The research focuses on two core objectives. First, during the energy storage stage, it aims to achieve efficient PCM phase change and cold storage by investigating the influence of key parameters-specifically, circulating water inlet temperature (2.0°C–4.0°C) and mass flow rate (0.25–1.00 kg/s)-on the temperature field distribution. This involves establishing quantitative relationships between these flow parameters and the resulting wall temperature, total cold storage capacity, and cooling power, thereby summarizing the underlying influence mechanisms to provide reliable theoretical support for engineering applications. Second, during the condensation stage, the study evaluates the condensation performance of R134a. This is achieved by examining the effects of working medium inlet temperature and energy storage time, with particular emphasis on evaluating the convective heat transfer coefficient and dynamic thermal resistance. The findings are intended to outline future optimization pathways to meet practical engineering requirements.
2.1 System Design and Components
A conventional organic Rankine cycle (ORC) system typically comprises core components such as a working fluid pump, evaporator, condenser, and turbine generator set [13]. However, as this study focuses specifically on the condensation and heat transfer characteristics of a jacketed energy storage heat exchanger, a simplified semi-closed system was designed. This design, resulting from a comprehensive consideration of research objectives and cost, eliminates complex energy conversion devices like the turbine generator. The primary loop consists of key components including a refrigerant recovery unit, R134a storage tank, the energy storage condenser, and regulating valves [14]. This semi-closed configuration not only significantly reduces system complexity and commissioning difficulty but also concentrates the research focus on the core component-the jacketed shell-and-tube energy storage heat exchanger. The prototype heat exchanger features a single inner tube (copper, outer diameter 15 mm, wall thickness 1.5 mm) through which the cold water flows. This inner tube is concentrically placed within a larger outer jacket tube (stainless steel, inner diameter 40 mm), creating an annular gap of 12.5 mm which is fully filled with the n-tetradecane PCM. The effective length of the jacketed section is 1000 mm. The shell side (annulus surrounding the outer jacket tube) has an inner diameter of 100 mm and serves as the flow path for the condensing R134a vapor. All ends are sealed with flanges.
Fig. 1 presents a schematic diagram of the experimental system. The main apparatus includes the jacketed energy storage shell-and-tube heat exchanger, a data acquisition system, a large-capacity low-temperature water tank, a water pump, thermocouples, pressure sensors, an R134a storage vessel, and a refrigerant recovery unit. In Fig. 1, the blue arrows indicate the flow direction of the low-temperature water cold source, the red arrows show the flow path of the R134a working fluid on the condensing side, and the black dashed lines represent data signal transmission paths. The physical picture of the heat exchanger experimental platform is shown in Fig. 2. This provides a visual representation of the actual setup used in the experiments.
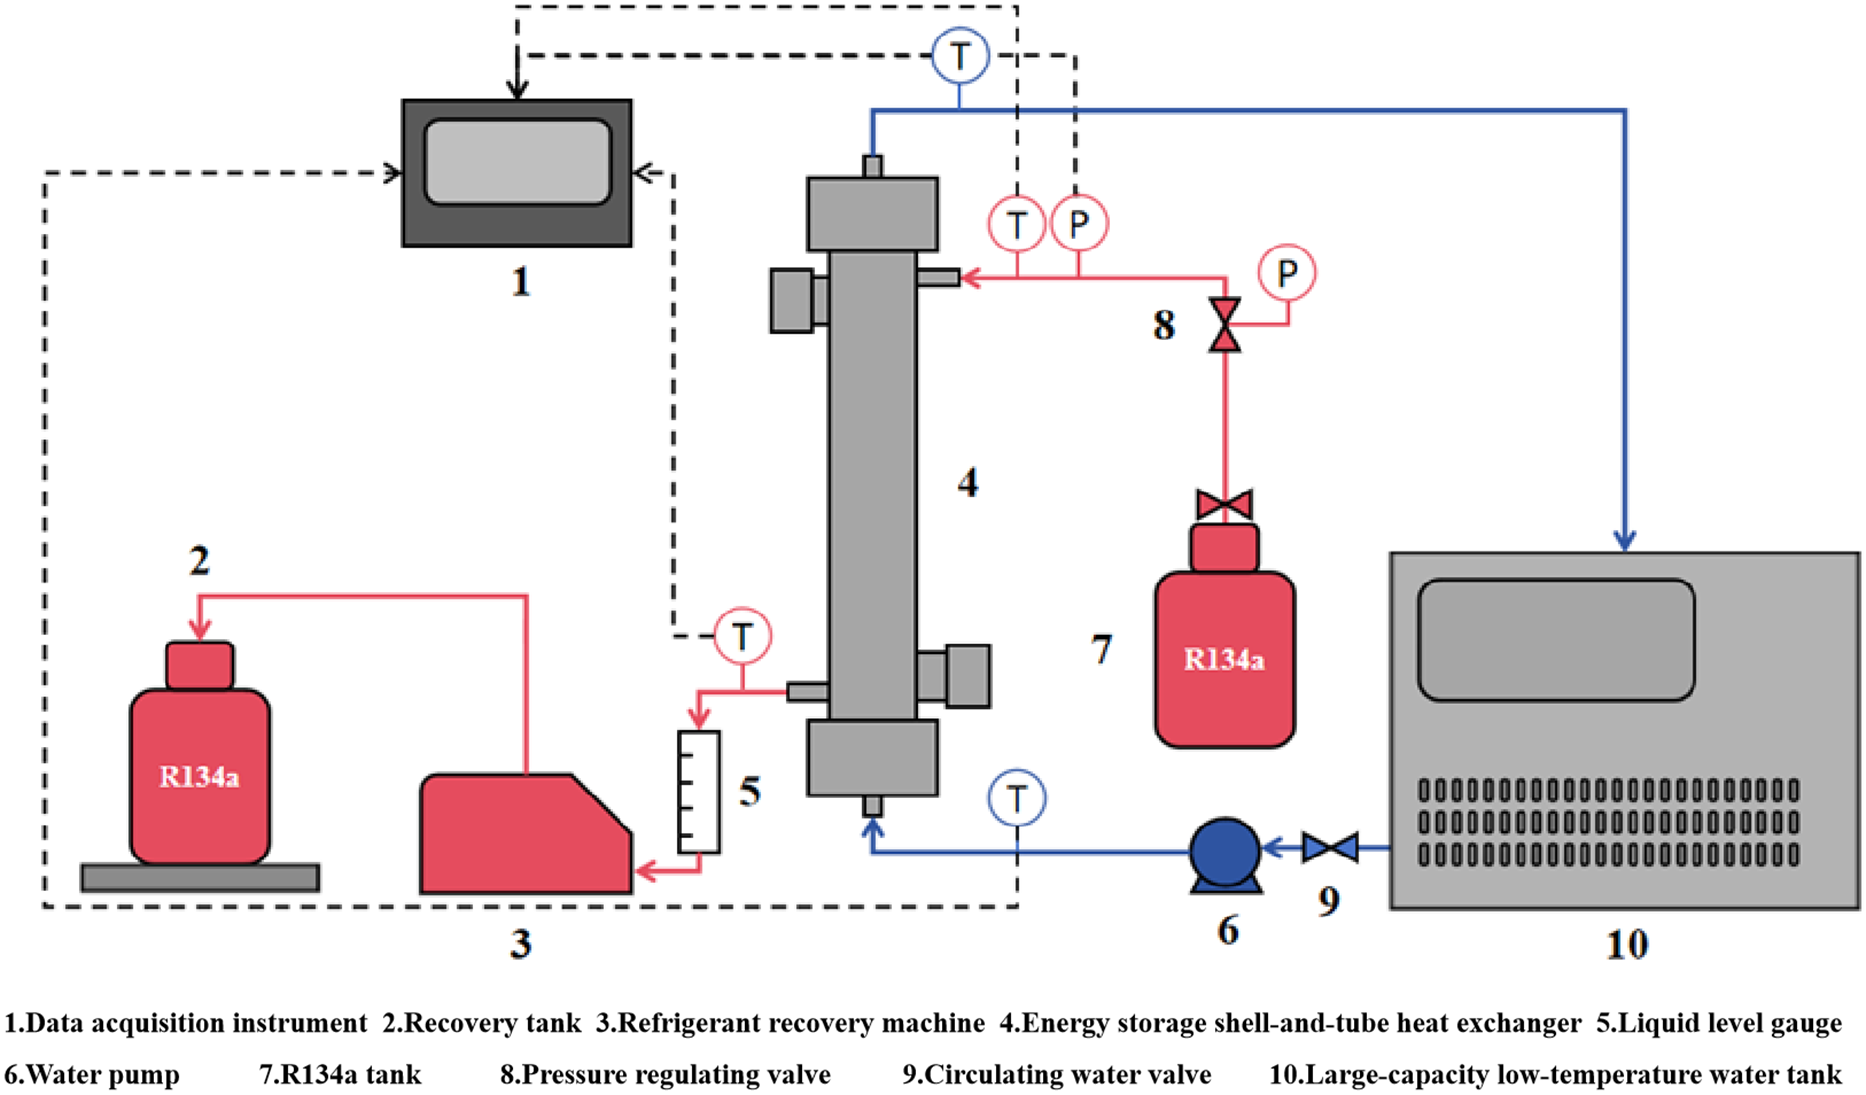
Figure 1: Schematic diagram of semi-closed experimental system.
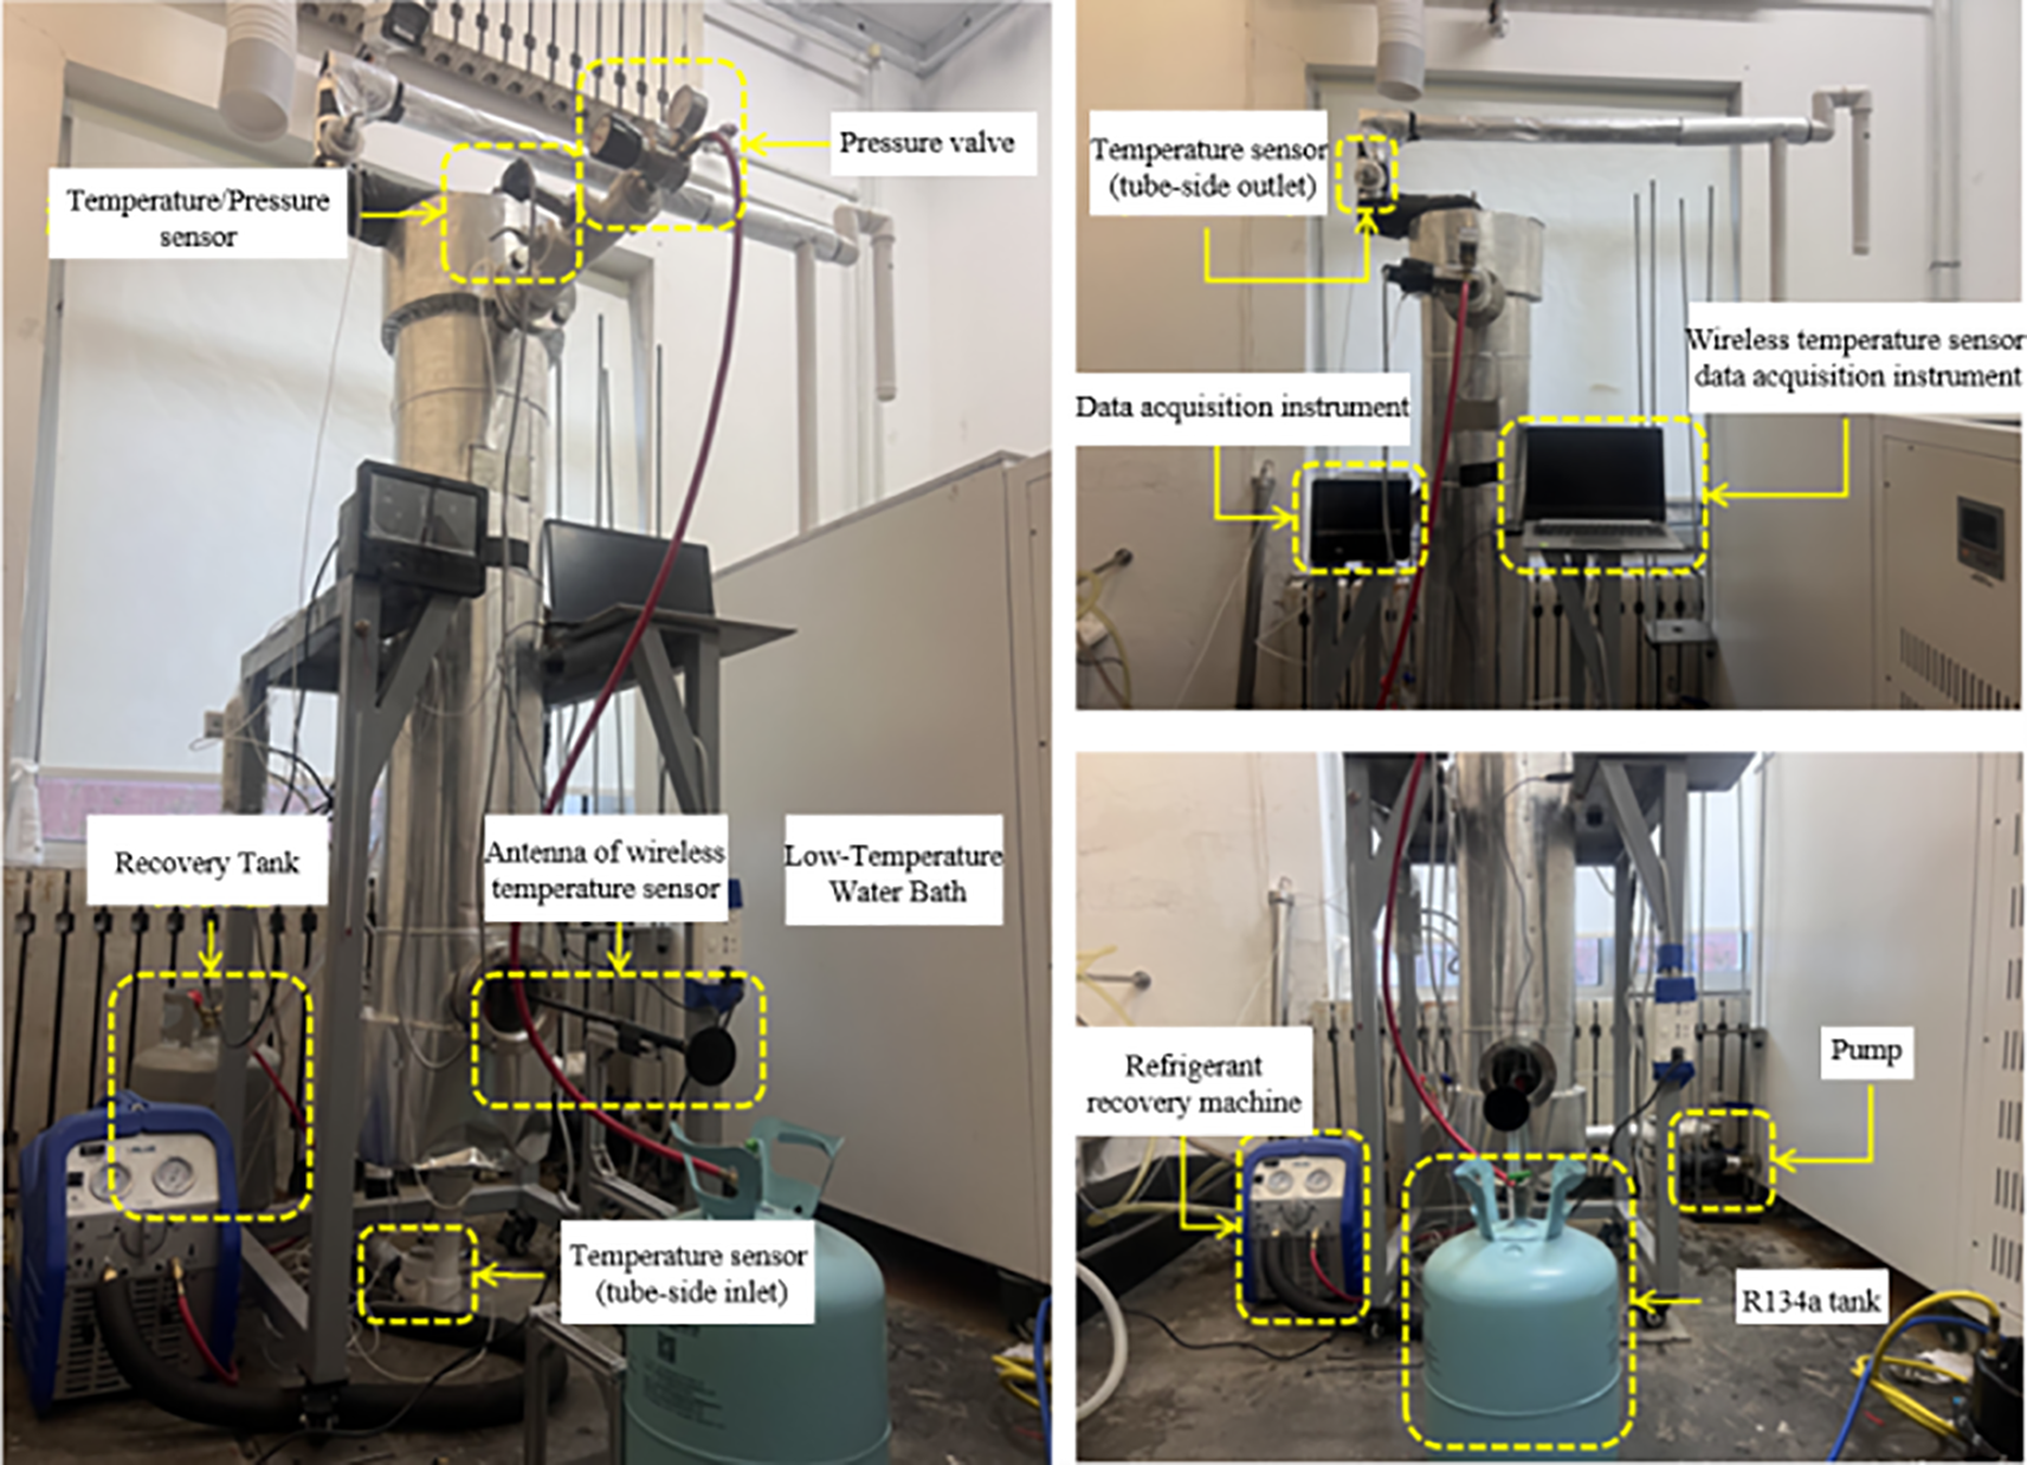
Figure 2: Heat exchanger experimental platform physical picture.
The phase change material (PCM) selected for cold storage was the commercially available organic compound n-tetradecane. The selection was made after considering several candidate PCMs for low-temperature cold storage applications. Key selection criteria included: (1) a phase transition temperature slightly above the target cold water temperature range (2°C–4°C) to ensure a sufficient and controllable driving force for solidification during the charging process; (2) high latent heat of fusion to maximize energy storage density; (3) chemical stability and safety for repeated cycling; and (4) commercial availability and reasonable cost. Inorganic salt hydrates, while often possessing high latent heat, were excluded due to potential issues like supercooling, phase segregation, and corrosion. Among organic PCMs (e.g., paraffins, fatty acids), n-tetradecane (C14H30) offers a suitable phase change temperature of approximately 6.8°C, which is optimally positioned to be effectively frozen by the 2°C–4°C cold water while providing a stable, near-isothermal cold source during the subsequent condensation of R134a. Its relatively high latent heat (~218 kJ/kg), congruent melting/freezing behavior, and chemical inertness further support its use in this prototype study.
The cold source for the experiments was low-temperature water, maintained at 4°C. This chilled water was supplied by a large-capacity low-temperature water tank, with its flow rate regulated by a circulating water pump. On the high-temperature side, the system was designed to condense R134a vapor. The pressure and temperature of the superheated vapor were controlled using a pressure-regulating valve at the outlet. The phase change material (PCM) selected for cold storage was the commercially available organic compound n-tetradecane. Its thermophysical properties are summarized in Table 1.
2.3 Instrumentation and Data Acquisition
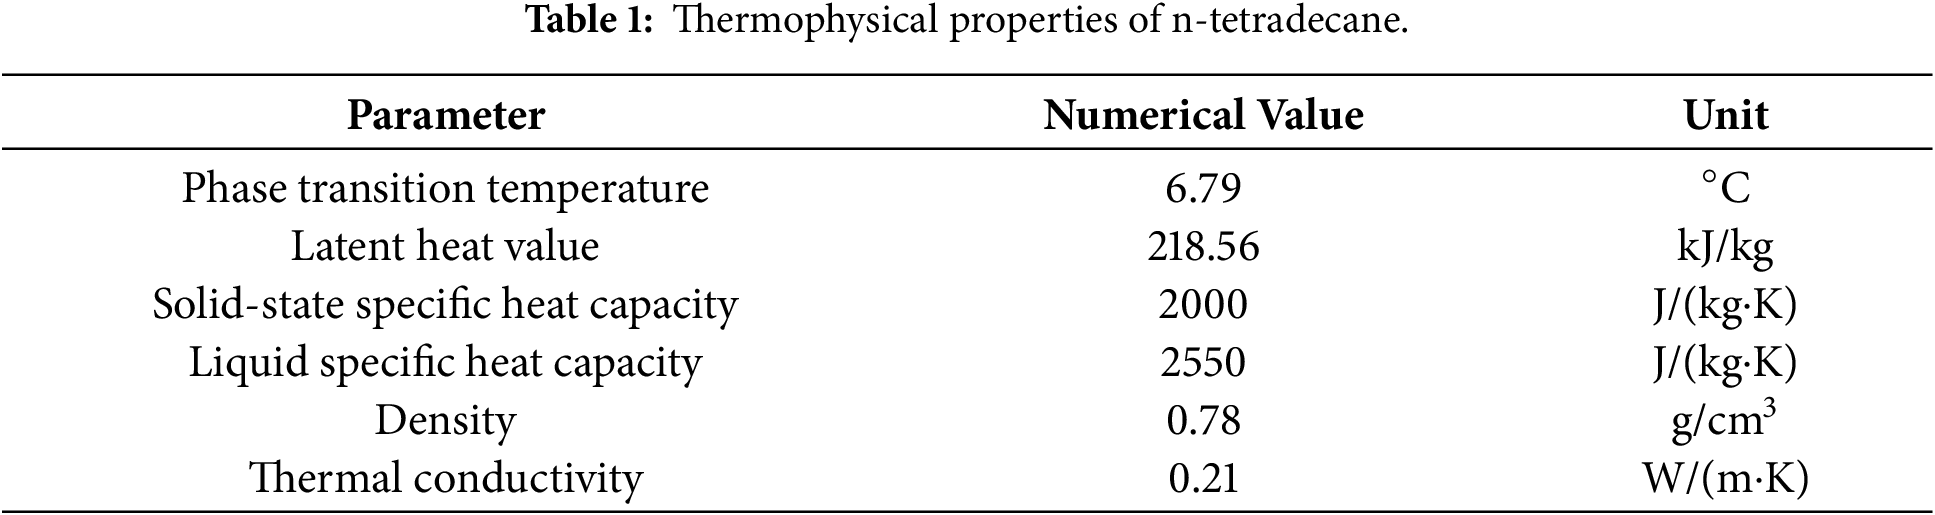
The placement and identification of the wall temperature measurement points were conducted as follows. The sight glass was removed to access three characteristic phase change tubes along the axis of the observation window. Surface-mounted thermocouples were then installed on these tubes. Prior to installation, all T-type thermocouples were calibrated in a controlled temperature bath (Fluke 7102) against a certified platinum resistance thermometer (PRT) over a range of 0°C–30°C. The post-calibration accuracy, including the data logger channel (Agilent 34970A), was determined to be within ±0.15°C. As illustrated in Fig. 3, view (1) shows the top section of the phase change tubes (200 mm ± 5 mm from the upper end face), where, from left to right, the tubes are designated as Tube 3, Tube 2, and Tube 1. Conversely, view (2) shows the bottom section (200 mm ± 5 mm from the lower end face), with the tubes from left to right labeled as Tube 1, Tube 2, and Tube 3. During installation, thermal grease (λ ≥ 3.5 W/(m·K)) was applied to improve thermal contact, and the sensors were secured using copper foil tape.
Figure 3: Thermocouple fixing position (a) is the upper end of the unit, (b) is the lower end of the unit.
During experiments, temperature data from all measurement points were recorded at a 5-s sampling interval and denoised using a time-domain averaging method. This approach effectively captured the transient temperature evolution during phase change while mitigating the impact of random measurement errors. The absolute pressure on the R134a side was measured using a pressure transducer (Rosemount 3051S) with a range of 0–1 MPa and a stated accuracy of ± 0.075% of the calibrated span. The differential pressure for monitoring system pressure changes during condensation was measured with another transducer (Rosemount 3051S) with a lower range (0–10 kPa), also with ±0.075% accuracy. Both pressure transducers were factory-calibrated, and their readings were validated against a dead-weight tester (Desgranges & Huot 5202) at ambient conditions prior to the experiments. The mass flow rate of the low-temperature water during the cold storage stage was controlled and measured using a Coriolis mass flow meter (Siemens, Massflow 2100) with an accuracy of ±0.1% of the reading. Its calibration was verified against a gravimetric method using a collection tank and a precision scale (Sartorius, ±1 g).
To preserve the structural integrity and sealing of the heat exchanger during the critical condensation experiments, a wireless temperature measurement system was employed. The spatial positioning of these wireless sensors is depicted in Fig. 4. This contact-based method eliminated the need for penetrations required by traditional probes, thereby avoiding potential damage and ensuring continuous monitoring of the wall temperature field. Prior to testing, all wireless temperature measurement devices (Omega, OM-CP-RFTC) were calibrated in the same temperature bath against the certified PRT over the range of 0°C–25°C, confirming their accuracy to be within ±0.2°C, verifing their accuracy, confirming they met the experimental requirements.
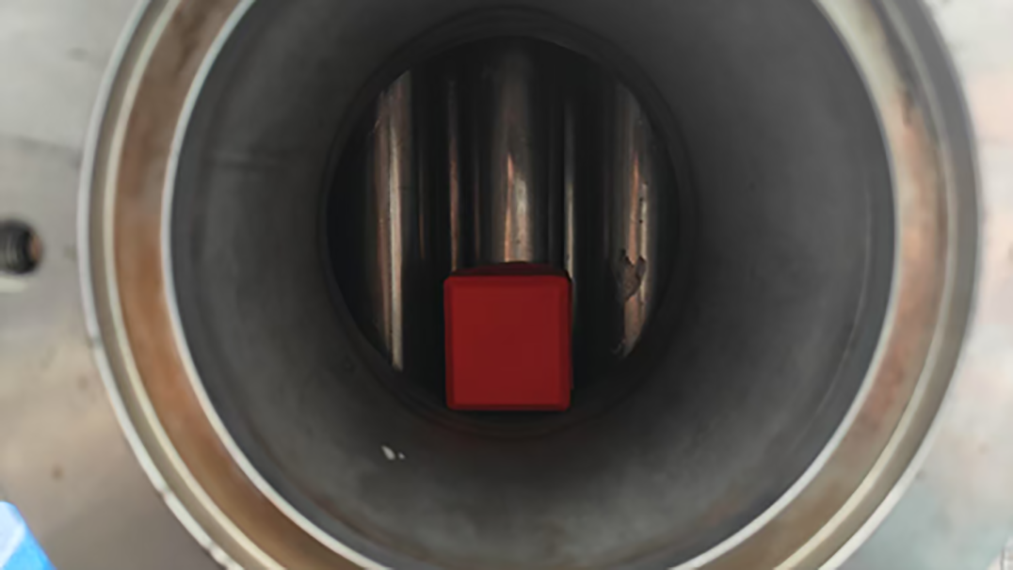
Figure 4: Wireless temperature measuring device fixed position.
3.1 Cold Storage Experiment of Phase Change Materials
The cold storage process involves the complete solidification of n-tetradecane using low-temperature water, thereby storing thermal energy in the form of latent heat. The experimental procedure was conducted as follows. Prior to initiating the test, all power supplies and fluid connections were disconnected, and all valves were verified to be in a fully closed position. The multi-channel data acquisition instrument was then activated in its digital display mode, configured for 24-channel parallel acquisition. Subsequently, the low-temperature water bath was started and set to a reference working temperature of 4°C (with a control accuracy of ±0.3°C). The system was allowed to stabilize until the refrigeration cycle reached thermal equilibrium.
Upon confirmation that the low-temperature water was prepared, the voltage signal to the water pump was adjusted to regulate the circulation flow rate to the target value. The circulating water valve and the water pump were then switched on sequentially. Real-time monitoring of the temperature at the upper and lower walls of the characteristic tubes commenced immediately. The system was maintained under these conditions for a duration of 2.5 h, after which the water pump was powered off to terminate the supply of low-temperature cold water. Following the completion of the test, the circulating water was heated to 23°C. The water pump was restarted and operated for 1.0 h to ensure the PCM was fully melted and returned to its initial liquid state, thus preparing the system for subsequent experimental rounds. For tests involving variable conditions, only the temperature setpoint in the water bath or the voltage signal to the pump required adjustment; all other procedures remained consistent with the protocol described above.
3.2 R134a Condensation Experiment
The condensation experiment is designed to release the stored cold energy from the solidified n-tetradecane to condense R134a vapor on the shell side. The experimental procedure consisted of the following sequential steps. First, the system’s airtightness was verified to ensure proper sealing. All power to the experimental apparatus was switched off, and the main valve, pressure-reducing valve, and inlet valve of the R134a storage and recovery tanks were confirmed to be closed. The data acquisition system was then started, confirming an initial pressure sensor reading of 101 kPa (atmospheric pressure). The inlet pipeline of the recovery tank was disconnected and vented to the atmosphere. The selector knob on the refrigerant recovery unit was set to the gaseous recovery position, and the unit was activated (ultimate vacuum ≤ 10 kPa) to evacuate the system. Once the pressure sensor reading reached ≤ 10 kPa, the recovery tank inlet pipeline was reconnected to the system, and the recovery unit was switched off. The valve on the R134a tank was subsequently opened to introduce R134a vapor into the system, allowing the working fluid to fill the entire volume. The tank valve was closed once the pressure sensor reading stabilized, indicating the completion of the pre-charging operation.
Following this, the cold storage experiment was conducted by selecting the desired operating conditions (e.g., circulating water temperature and mass flow rate) and executing the corresponding steps from Section 3.1 until the cold storage phase was complete. Upon completion of cold storage, the R134a tank valve was reopened. The knob on the refrigerant recovery unit was turned to the liquid recovery position, and the unit was started, marking the official commencement of the R134a condensation experiment. Changes in the glass tube liquid level gauge and electronic scale readings were observed and recorded throughout this process.
After allowing R134a to flow continuously for ten minutes, the tank valve was closed, concluding the condensation experiment. The refrigerant recovery unit was then switched to gaseous recovery mode to remove any residual working fluid from the system until the pressure fell below 10 kPa. Subsequently, the unit was set to self-cleaning mode and operated steadily for 5 min to purge any remaining refrigerant from both the system and the recovery unit itself. Finally, the valves on the recovery tank and the pressure-reducing valve were closed, the recovery unit was powered down, and the system was vented to atmosphere to restore ambient pressure.
3.3 Assessment of Heat Transfer Model and Circumferential Uniformity
The jacketed configuration, with the phase change material (PCM) encapsulated in an annular space around the inner coolant tube, raises a valid concern regarding potential circumferential non-uniformity in the heat transfer surface temperature. To validate the sufficiency of the one-dimensional (1D) radial heat transfer assumption used in our data reduction and analysis, the circumferential temperature distribution was examined using the eight T-type thermocouples installed around the perimeter of the test section tube (as described in Section 3.1 and illustrated in Fig. 2). During the steady-state cold storage phase and the R134a condensation phase, the temperature differences among the eight circumferential measurement points at the same axial location were analyzed. The maximum observed circumferential temperature variation (ΔTcirc) was typically within 0.3°C. This small ΔTcirc is attributed to the high thermal conductivity of the copper tube wall and the geometry of the setup, which promotes rapid circumferential conduction. The significance of this variation relative to the dominant radial temperature difference (ΔTradial), which was on the order of 2°C–20°C, was evaluated. The ratio ΔTcirc/ΔTradial was consistently less than 5%, confirming that the primary temperature gradient is indeed in the radial direction. This justifies the use of a 1D radial conduction model for the tube wall in our heat transfer coefficient calculations, an approach supported by similar studies in literature [15,16]. Therefore, for the conditions of this study, the 1D radial heat transfer assumption is deemed sufficient. Furthermore, the thermal contact resistance between the PCM and the inner wall of the jacket tube was minimized by applying a high-conductivity thermal grease (λ ≥ 3.5 W/(m·K)). In the data reduction, the effect of this interface was not explicitly modeled with a separate contact resistance; instead, it was implicitly included in the measured wall-to-PCM temperature difference. This treatment is justified because the high-conductivity grease and the good wettability of the n-tetradecane reduce the contact resistance to a level that is small compared to the conductive resistance of the solid PCM layer during the phase-change process, an approach adopted in similar PCM-based storage studies [17].
3.4 Uncertainty Analysis of Wireless Temperature Measurement
The wireless temperature sensors were installed on the outer wall of the condenser tube to preserve the structural integrity of the heat exchanger. This configuration introduces a spatial and thermal lag between the location of the solidification front within the PCM and the sensor measurement point. The primary sources of this lag are the conductive thermal resistance through the tube wall and through the solidified PCM layer between the inner tube wall and the moving solid-liquid interface. An order-of-magnitude estimation of the steady-state temperature difference (ΔTlag) across these resistances was performed for a representative heat flux. Using Fourier’s law and representative values (copper tube: L = 1.5 mm, k ≈ 400 W/(m·K); solid PCM: mean L ≈ 2.5 mm, k = 0.21 W/(m·K); q′′ ~ 1 kW/m2), the calculated ΔTlag is dominated by the PCM resistance, amounting to approximately 12°C. This confirms that the measured wall temperature (Twall) is significantly higher than the temperature at the solidification front. However, for the purposes of this study, the key information lies in the temporal evolution and relative trends of Twall under different operating conditions. The systematic bias (ΔTlag) remains relatively constant during each process stage, as the dominant thermal resistance changes slowly. Therefore, the identified cooling stages, comparative cooling rates, and the effects of cold water parameters remain valid. Furthermore, in the condensation analysis, any constant bias in Twall is absorbed into the logarithmic mean temperature difference used for heat transfer coefficient calculation. The sensor’s dynamic response time is negligible compared to the process duration. Thus, while the spatial lag affects absolute temperature readings, it does not invalidate the comparative performance analysis or the calculation of integrated energy metrics central to this study.
3.5 Mass Flow Rate Determination and Uncertainty during Condensation
During the R134a condensation experiment, the mass flow rate was determined from the rate of liquid accumulation in a graduated glass tube gauge. To address the density variation in the condensing two-phase flow, the following method was employed. The system pressure was measured continuously. For each time interval, the vapor quality (x) of the R134a at the gauge location was estimated from an energy balance from the test section inlet, using measured heat inputs and refrigerant properties from REFPROP. The effective density (ρeff) was then calculated as ρeff = [x/ρv + (1 − x)/ρl]−1, where ρv and ρl are the saturated vapor and liquid densities at the measured pressure. The mass flow rate was calculated as
The analysis of experimental data incorporated considerations for measurement uncertainty to validate the observed trends. Key derived parameters, such as the cold storage capacity and heat transfer coefficients, were calculated using the methods described in Sections 2.3, 3.4 and 3.5, which detail the instrumentation accuracy, wireless temperature measurement spatial lag, and mass flow rate determination with its associated uncertainty (<8%). For the presentation of steady-state or quasi-steady-state temperature values (e.g., in Stages I and III of the cold storage process), the mean value along with the observed range (e.g., ±0.1°C) is reported, reflecting the stability of the measurement under those conditions. The temporal evolution curves (e.g., temperature vs. time, cooling rate) are plotted using data averaged over the 5-s sampling intervals, as described in Section 2.3. The trends and comparative conclusions drawn are based on consistent, repeatable patterns observed across multiple experimental runs and are interpreted within the context of the estimated experimental uncertainties.
4.1 Cold Storage Experiment Analysis
4.1.1 Influence of Cold Source Mass Flow Rate on the PCM Cold Storage Process
To investigate the effect of cold source mass flow rate on the thermal behavior of the heat exchanger, experiments were conducted with the low-temperature water maintained at a constant 3°C, while the mass flow rate was varied at 0.25, 0.50, and 1.00 kg/s. The evolution of the temperature field and the consequent cold storage capacity were analyzed. Fig. 5 presents the temperature histories at various measurement points, which reveal three distinct stages in the cooling process:
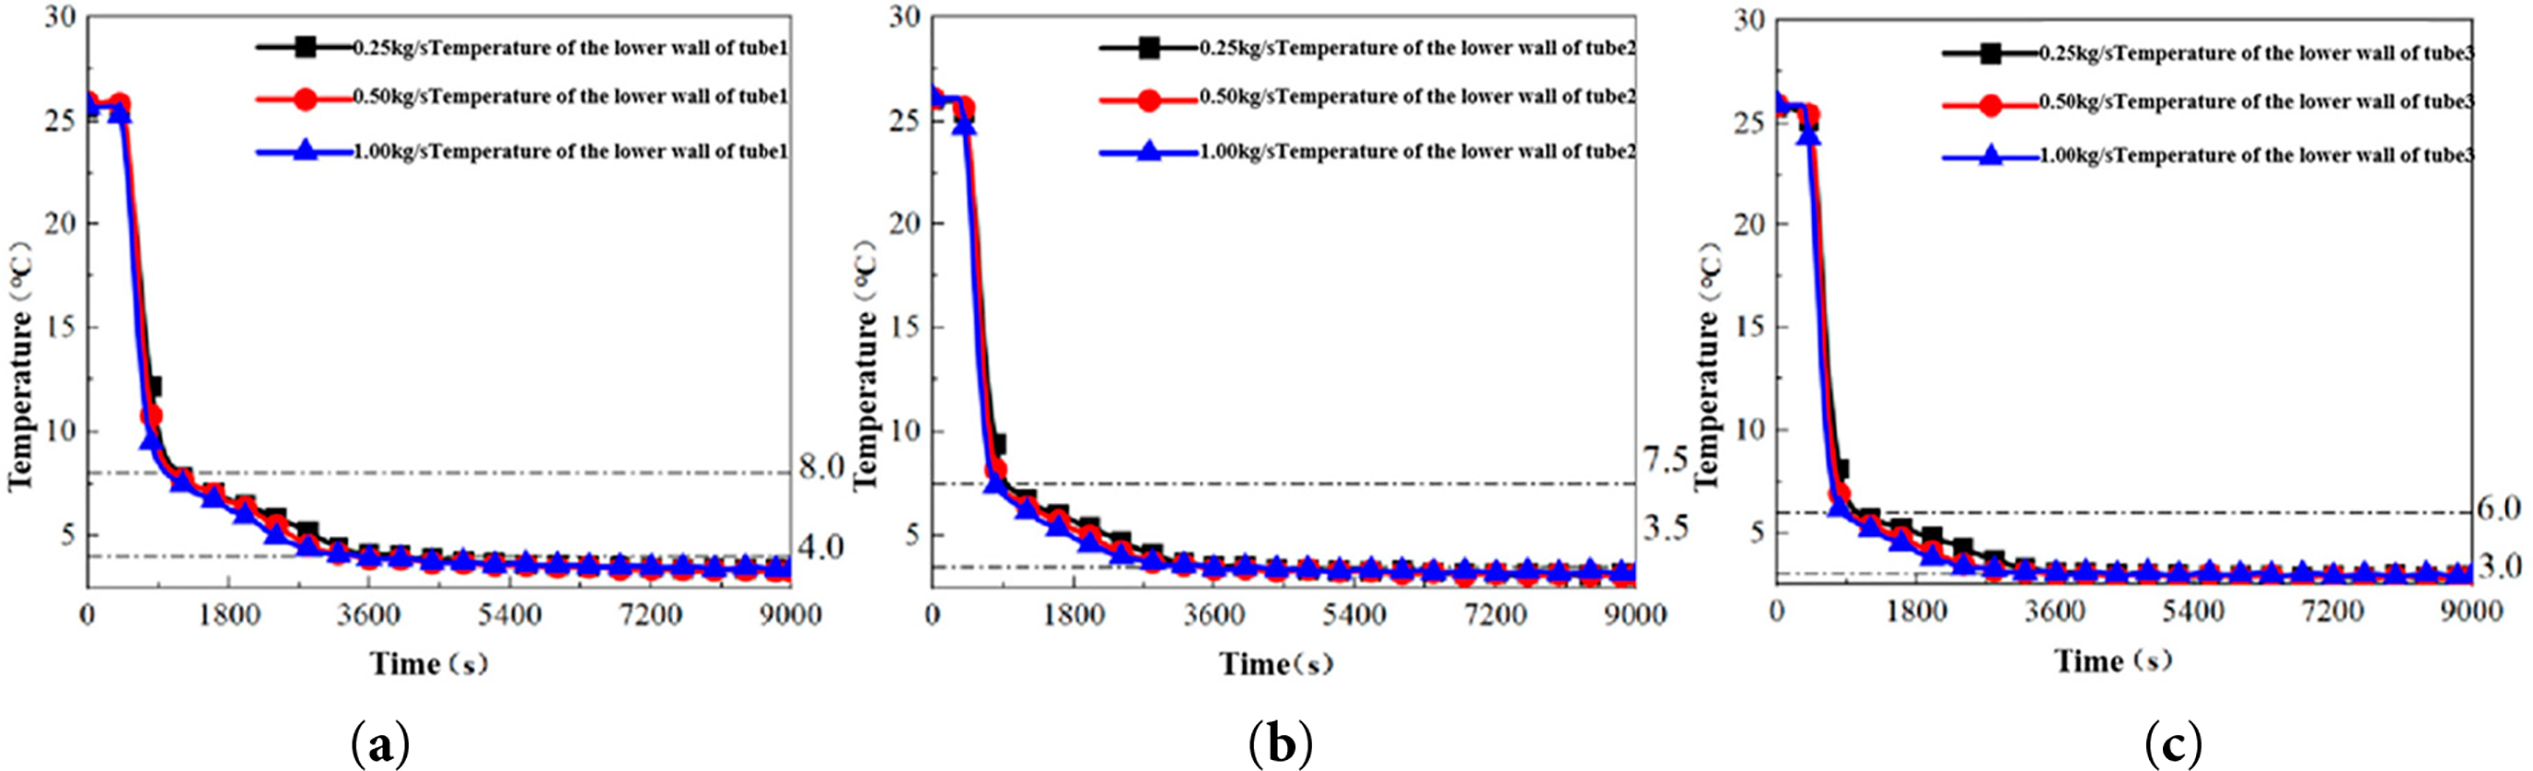
Figure 5: Temperature variation curves of the lower wall of different unit tubes under different mass flow rates Wireless temperature measuring device fixed position. (a) Tube 1: Lower-wall temperature variation measured at Tube 1. (b) Tube 2: Lower-wall temperature variation measured at Tube 2. (c) Tube 3: Lower-wall temperature variation measured at Tube 3. The definitions and locations of Tube 1–3 are provided in Section 2.3.
(1) Stage I (0–900 s): Rapid Sensible Cooling
The lower wall temperatures of all unit tubes decreased sharply from an initial equilibrium state of 25.5°C. The first inflection points in the cooling curves for Tubes 1, 2, and 3 occurred at approximately 8.0°C, 7.5°C, and 6.0°C, respectively. This stage, characterized by a total temperature drop of 17.5°C–19.5°C, represents a period of intense sensible heat transfer, where forced convection between the circulating water and the PCM is the dominant heat transfer mechanism.
(2) Stage II (900–3000 s): Latent Heat Dominated Phase Change
Following the initial inflection point, the cooling rate exhibited a pronounced attenuation [18]. Although temperatures continued to decrease, the rate of decline diminished significantly, with second characteristic inflection points observed at around 4.0°C, 3.5°C, and 3.0°C for Tubes 1, 2, and 3, respectively. This stage corresponds to the solidification of the PCM, where the release of latent heat at the phase change interface-which forms and progressively moves toward the outer wall-substantially moderates the temperature drop rate. This phase transition period persisted for approximately 2000 s.
(3) Stage III (3000–9000 s): Quasi-Steady State Solid Cooling
The lower wall temperatures stabilized into a quasi-steady state, maintaining values of 3.2 ± 0.1°C, 3.0 ± 0.1°C, and 2.9 ± 0.1°C for Tubes 1, 2, and 3, respectively. The residual minor temperature gradient of about 0.3°C is primarily attributable to fluctuations in the circulating water temperature. These stable temperature profiles indicate that the phase change process near the lower tube end is essentially complete, and any further cooling involves sensible heat extraction from the solid PCM. Notably, Unit Tube 3 demonstrated superior temperature stability, exhibiting a smaller fluctuation range in its steady-state temperature compared to Tubes 1 and 2.
Given the visual similarity of the temperature trends in Fig. 5, a quantitative analysis of the cooling rate was essential to elucidate the influence of mass flow rate. The rate of temperature change was therefore calculated and is presented in Fig. 6. The data demonstrate that an increase in mass flow rate under the 3°C condition markedly intensifies the heat exchange at the lower wall. Specifically, as the mass flow rate was raised from 0.25 to 1.00 kg/s, the peak temperature change rate increased by up to 33.9%.
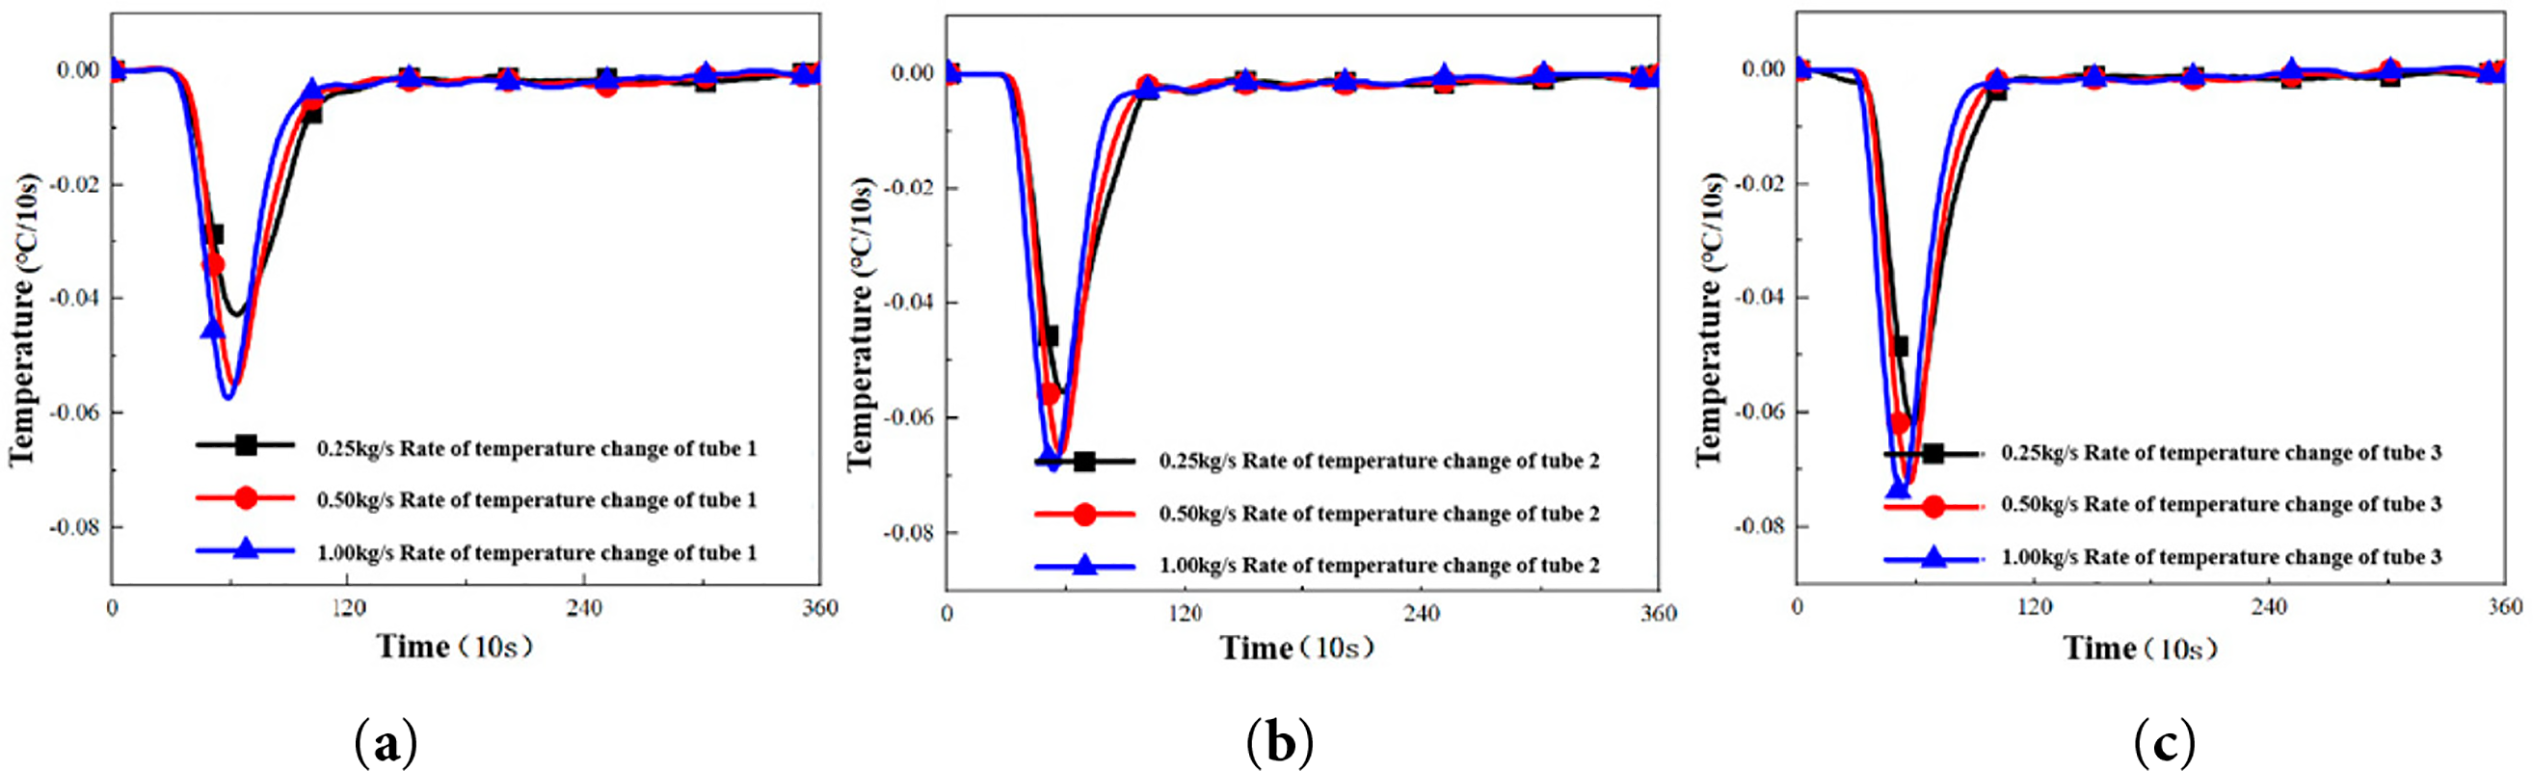
Figure 6: Temperature change rate curve of the lower wall surface of different unit tubes under different mass flow rates. (a) Tube 1: Temperature change rate of the lower wall surface measured at Tube 1. (b) Tube 2: Temperature change rate of the lower wall surface measured at Tube 2. (c) Tube 3: Temperature change rate of the lower wall surface measured at Tube 3. The definitions and locations of Tube 1–3 are provided in Section 2.3.
As evidenced in Fig. 6, the rate of wall temperature change increases with the mass flow rate [19]. However, once the mass flow rate surpasses 0.5 kg/s, further increases yield a diminishing enhancement, suggesting a performance plateau likely governed by the intrinsic thermodynamic properties of the PCM. Furthermore, the effect of mass flow rate on heat exchange efficiency exhibits a pronounced spatial dependence across the unit tubes. For example, the temperature change rate of Unit Tube 1 demonstrates the most significant enhancement in response to increasing flow rates.
The influence of different mass flow rates on the upper wall temperature is presented in Fig. 7. The thermal behavior can be categorized into two distinct stages based on the cooling rate:
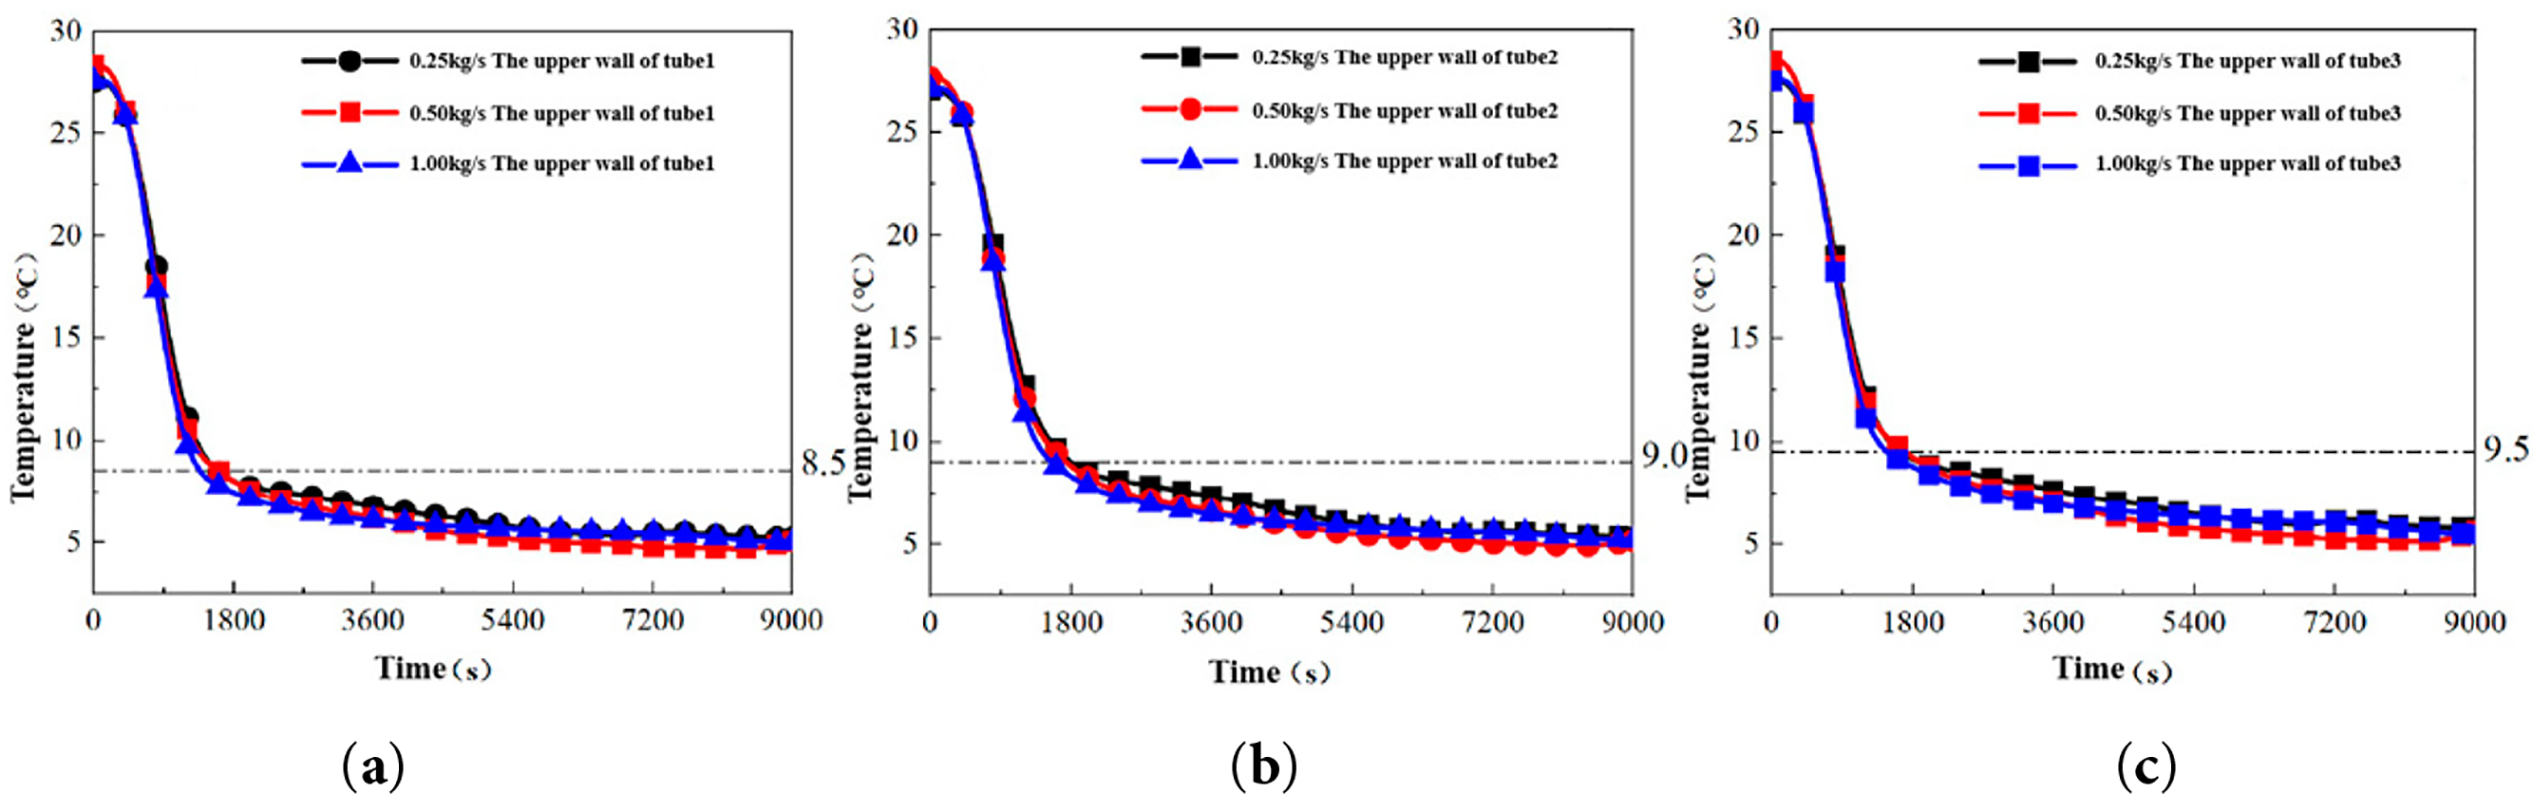
Figure 7: Temperature variation curves of the upper wall of different unit tubes under different mass flow rates. (a) Tube 1: Upper wall temperature variation measured at Tube 1. (b) Tube 2: Upper wall temperature variation measured at Tube 2. (c) Tube 3: Upper wall temperature variation measured at Tube 3. The definitions and locations of Tube 1–3 are provided in Section 2.3.
(1) Stage I (0–1800 s): Rapid Forced Convective Cooling
The upper wall temperatures of all unit tubes decreased rapidly due to forced convective heat transfer with the cold fluid. The first inflection points for Tubes 1, 2, and 3 were observed near 8.5°C, 9.0°C, and 9.5°C, respectively. This stage is characterized by sensible heat extraction from the liquid PCM.
(2) Stage II (1400–9000 s): Phase Change Dominant Regime
A significant attenuation in the cooling rate occurred, with temperatures eventually stabilizing. This stage corresponds to the latent heat release during the PCM solidification process, demarcating the initiation and completion of the primary phase change.
The thermal response of the upper wall to mass flow rate variations differs notably from that of the lower wall. This discrepancy can be attributed to the solidification dynamics [20]. When cold water is introduced, the PCM at the bottom of the tube initiates solidification first. The associated volume contraction causes the liquid PCM level to recede. The upper temperature sensor, located 10% from the top of the tube, eventually contacts the air phase as the liquid level drops below this point. This air-PCM contact at the sensor location likely induces the observed inflection point. Subsequently, as the cold storage process advances, the top sensor continues to detect the wall temperature in contact with the air gap, resulting in a markedly lower observed temperature change rate compared to the bottom sensor.
To quantitatively evaluate the influence of circulating water mass flow rate on the cooling capacity, the total cold storage was calculated based on the thermodynamic properties of the PCM. The cold storage capacity was computed using a segmented energy balance method, as defined in Eq. (1):
where, m represents the PCM mass of a single energy storage unit tube, in kg; Cp,liquid and Cp,solid are respectively the specific heat capacities at constant pressure of PCM in liquid and solid states, kJ/(kg·°C). Tt represents the temperature at time t, which is taken from the average of the upper and lower wall temperatures of the same unit tube, in °C. Tliquid and Tsolid are the theoretical melting and solidification temperatures of PCM, respectively, in °C. L represents the latent heat value of PCM, in kJ/kg [21].
The cold storage capacity, computed using Eq. (1), is plotted against time in Fig. 8. For the experiments conducted at a constant circulating water temperature of 3°C, the evolution of cold storage capacity under different mass flow rates reveals three characteristic stages, categorized by the dominant energy storage mechanism:
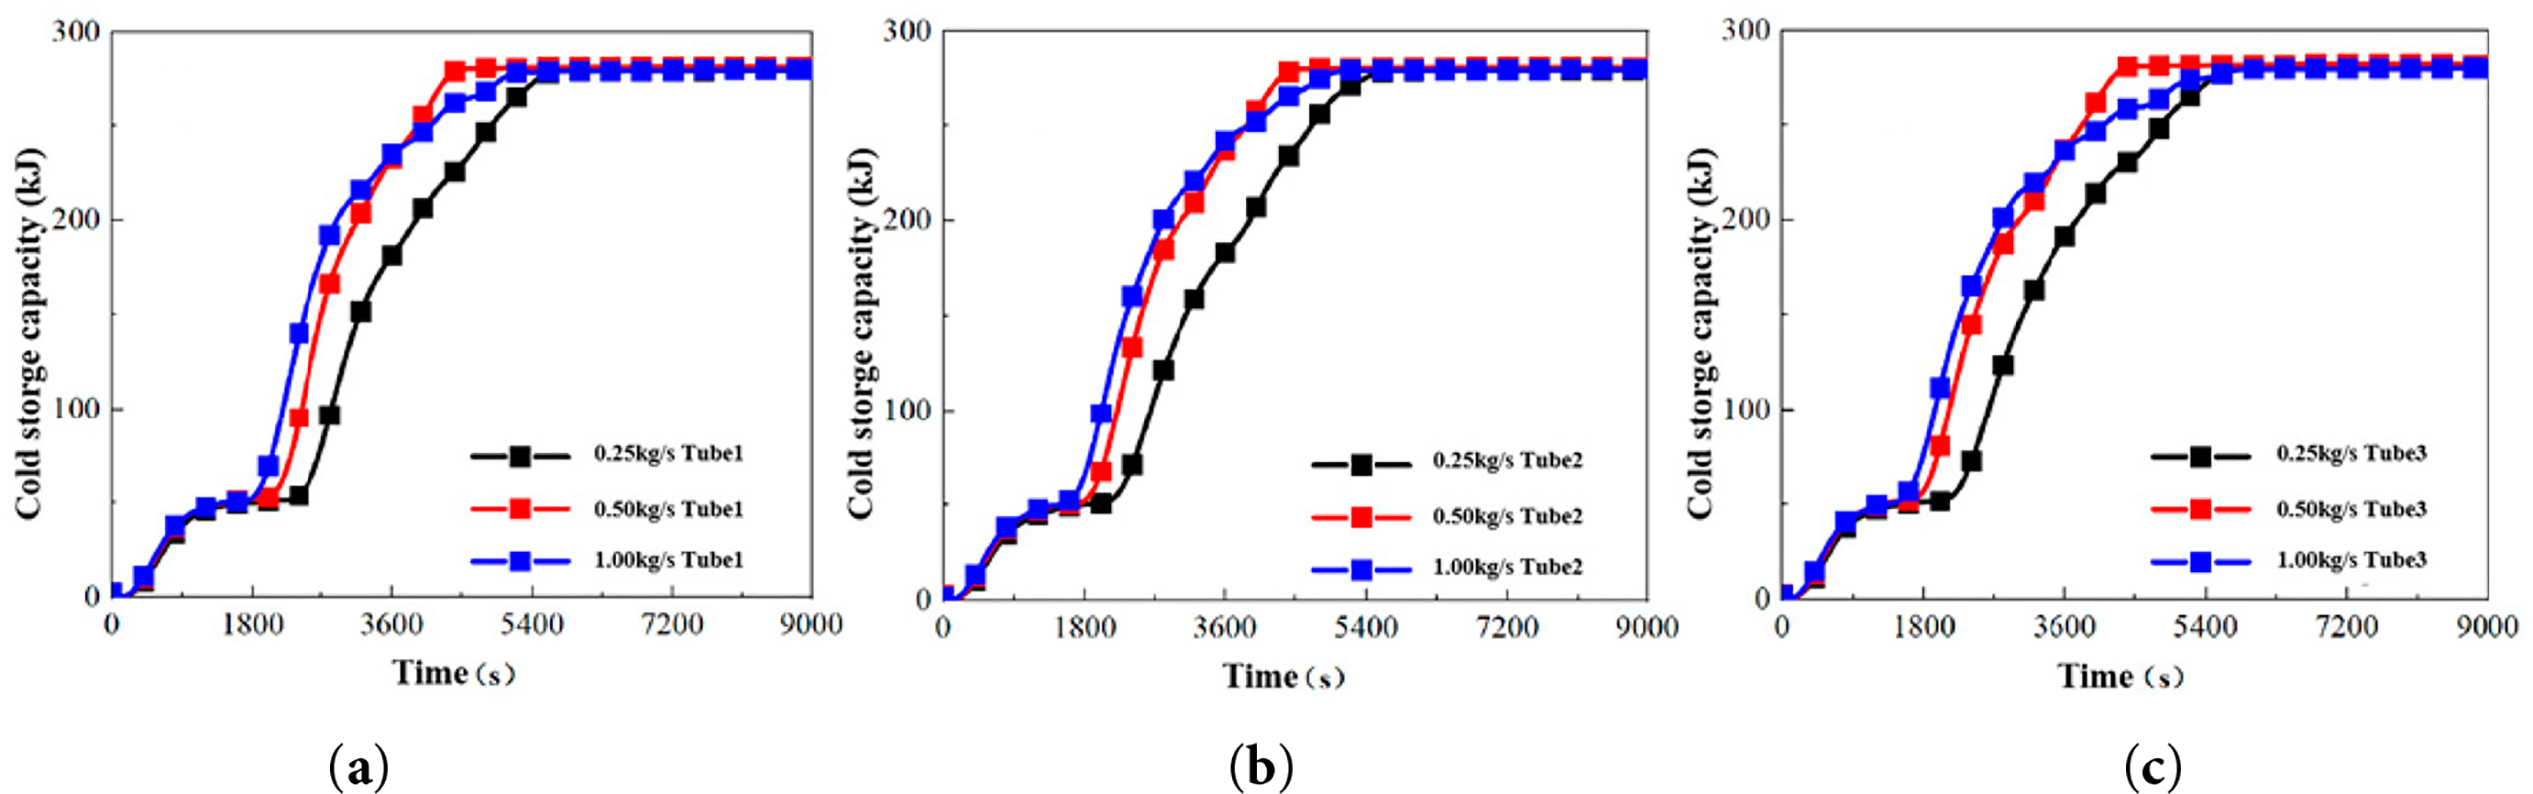
Figure 8: Change curves of cold storage capacity of different unit tubes under different mass flow rates. (a) Tube 1: Cold storage capacity variation of Tube 1. (b) Tube 2: Cold storage capacity variation of Tube 2. (c) Tube 3: Cold storage capacity variation of Tube 3. The definitions and locations of Tube 1–3 are provided in Section 2.3.
(1) Stage I (0–1000 s): Liquid Sensible Heat Storage
During this initial stage, the PCM cools from ambient temperature to its melting point, with energy being removed primarily as sensible heat from the liquid phase. An increased mass flow rate enhances the convective heat transfer, accelerating the cooling rate and causing the high-flow condition (1.00 kg/s) to transition to the next stage more rapidly than the lower-flow conditions.
(2) Stage II (1000–3600 s): Latent Heat Storage
As the PCM enters its phase transition temperature range, energy storage is dominated by the release of latent heat during solidification. The influence of mass flow rate becomes more pronounced in this regime. Under the high flow rate condition (1.00 kg/s), the enhanced convective heat transfer intensifies the phase change process, resulting in a significantly steeper slope of the cold storage capacity curve compared to the preceding sensible heat stage.
(3) Stage III (3600–5400 s): Solid Sensible Heat Storage
This final stage commences after the PCM has fully solidified. The continued flow of cold water further reduces the temperature of the solid PCM, storing additional energy as sensible heat. Beyond approximately 5400 s, the temperature difference between the solid PCM and the cold fluid becomes minimal, leading to a sharp reduction in the heat transfer rate and causing the cold storage capacity curve to asymptotically approach a stable maximum value.
4.1.2 Influence of Cold Source Temperature on the PCM Cold Storage Process
Based on the analysis in Section 4.1.1, a mass flow rate of 0.50 kg/s was selected for subsequent experiments, as it provides a significantly higher heat transfer rate than 0.25 kg/s while offering diminishing returns for further increases to 1.00 kg/s. Consequently, this section investigates the evolution of the outer wall temperature field and the cold storage capacity under a constant mass flow rate of 0.50 kg/s and varying circulating water temperatures (2°C, 3°C, 4°C).
Under the constant mass flow rate condition (0.50 kg/s), the temperature evolution on the lower wall of the cold storage unit tube exhibits distinct temperature-dependent characteristics, as illustrated in Fig. 9. The cooling process can be delineated into three stages:
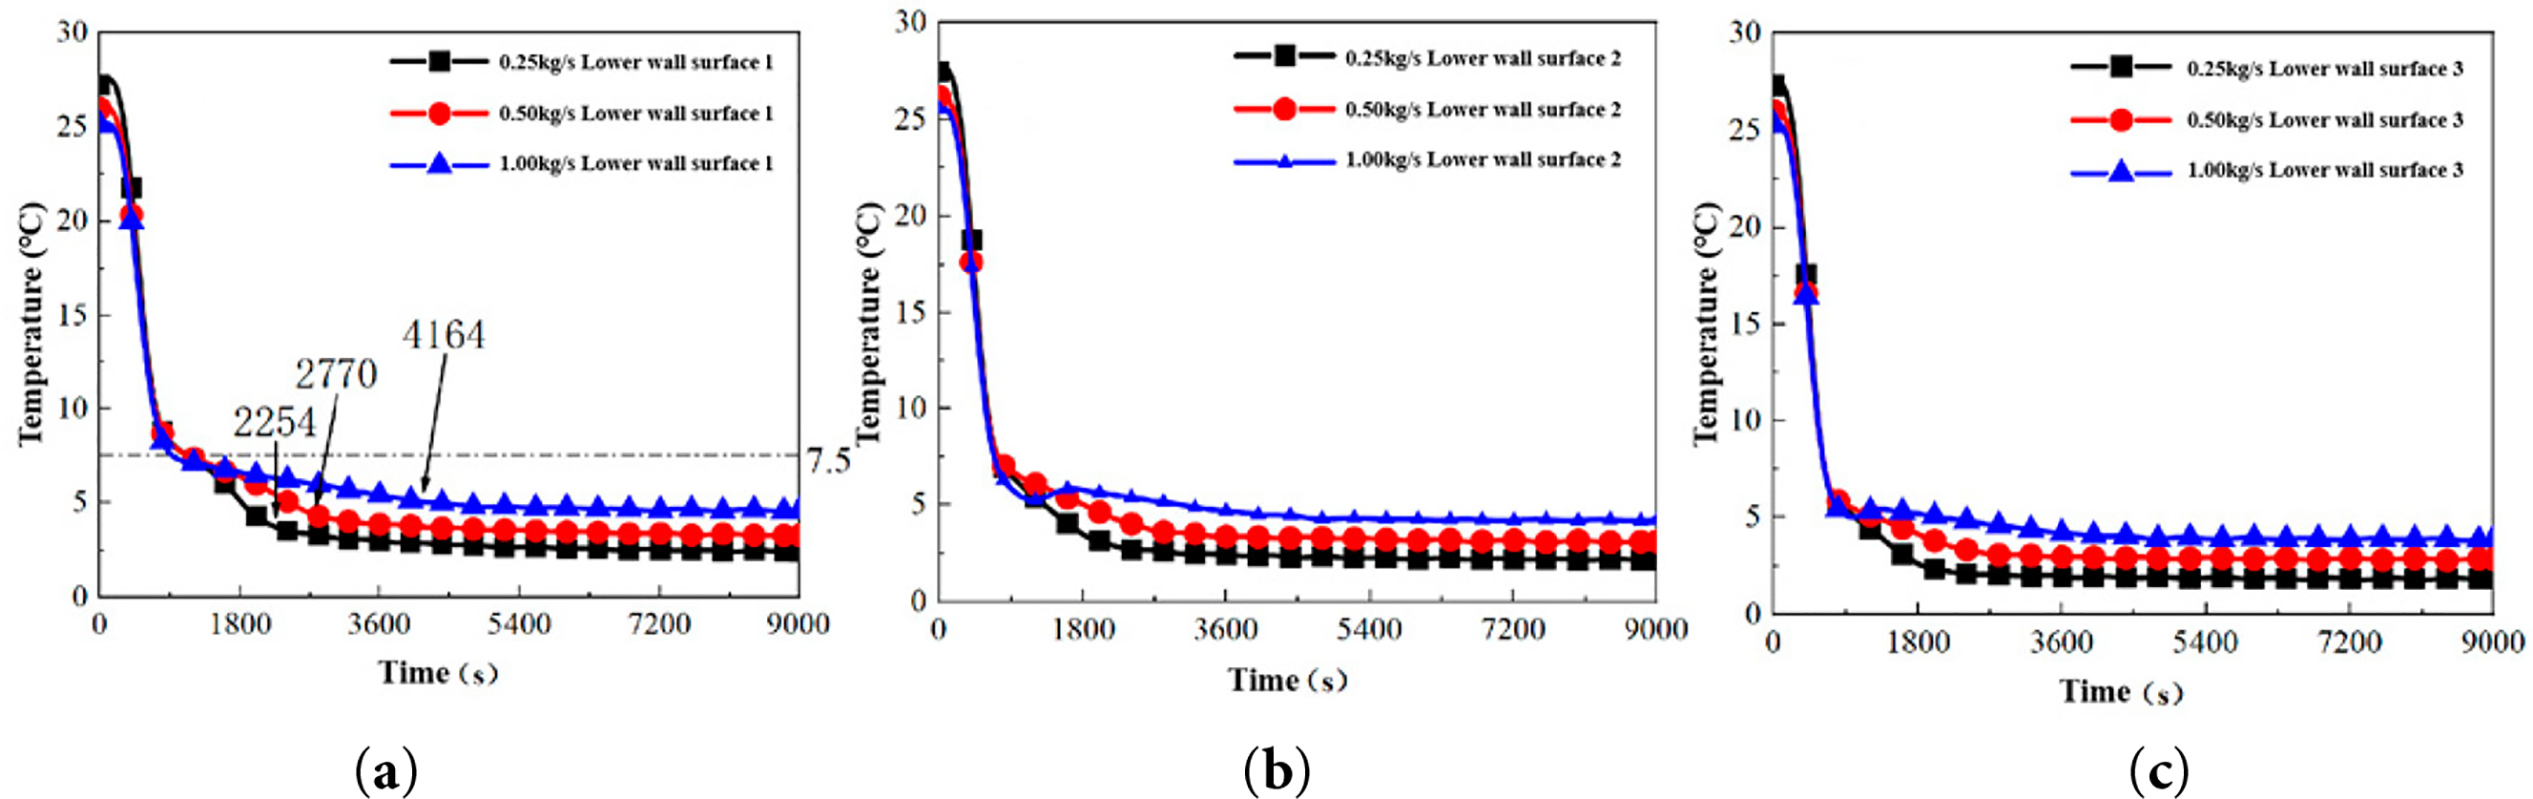
Figure 9: Temperature variation curve of the lower wall of each unit tube at different circulating water temperatures. (a) Tube 1: Lower wall temperature variation of Tube 1. (b) Tube 2: Lower wall temperature variation of Tube 2. (c) Tube 3: Lower wall temperature variation of Tube 3. The definitions and locations of Tube 1–3 are provided in Section 2.3.
(1) Stage I: Rapid Sensible Heat Extraction
This initial phase is characterized by rapid cooling dominated by sensible heat transfer. The first temperature inflection points for Tubes 1, 2, and 3 occurred at approximately 7.5°C, 7.5°C, and 6.0°C, respectively. The temperature decrease in this stage accounted for over 70% of the total initial temperature difference.
(2) Stage II: Latent Heat Release Phase
The initiation of the phase change process marks the transition to this stage, where latent heat release becomes dominant. Using Tube 2 as a representative example, reducing the circulating water temperature from 4°C to 2°C shortened the phase change duration from 4162 to 2299 s-a reduction of 44.8%. This acceleration stems from the enhanced thermal driving force; a lower cold source temperature increases the temperature gradient between the PCM and the circulating water, thereby intensifying the phase change evolution.
(3) Stage III: Solid-Phase Sensible Heat Storage
Thermodynamic equilibrium is approached in this final stage, where the deviation between the wall temperature and the incoming fluid temperature stabilizes within ±0.3°C. This indicates the completion of the phase change process and the commencement of solid-phase sensible heat storage. Experimental data confirm that the final equilibrium temperatures under all conditions converge to the respective circulating water inlet temperatures.
A notable phenomenon was observed during the 4°C condition, where the temperature evolution curves for Tubes 2 and 3 exhibited non-monotonic fluctuations during the phase change stage. Specifically, between 1120 and 1680 s, the temperature dropped to approximately 5.0°C and then experienced an anomalous increase of about 0.6°C, persisting for roughly 500 s. Two potential mechanisms may explain this temperature rise: First, metastable undercooling of the PCM may accumulate a significant phase change driving force during cooling, with instantaneous solidification triggered by this undercooling releasing latent heat and causing a local temperature increase. Second, this non-steady-state heat transfer behavior resembles phenomena reported by Fukai et al. [22], where buoyancy-driven migration of nucleated solid PCM particles alters the local thermal resistance distribution, potentially leading to transient temperature fluctuations.
The temperature reversal observed in Fig. 9, characterized by a drop to approximately 5.0°C followed by a rise of about 0.6°C, is a clear signature of supercooling (undercooling). In this metastable state, the liquid PCM cools below its thermodynamic phase transition temperature (Tm = 6.79°C) until nucleation is triggered, leading to rapid solidification and the release of latent heat, which causes the local temperature increase. The degree of supercooling, ΔTsc, defined as ΔTsc = Tm − Tmin (where Tmin is the minimum temperature before the rebound), was quantified from the data in Fig. 9. For Tube 3, Tmin ≈ 5.0°C, yielding ΔTsc ≈ 1.8°C. For Tube 2, Tmin ≈ 5.3°C, giving ΔTsc ≈ 1.5°C. These values are consistent with the behavior of organic PCMs in confined geometries [23].
Regarding its impact on the cold storage capacity calculation using Eq. (1), it is important to distinguish between the transient energy release profile and the total integrated energy. Supercooling delays the onset of significant latent heat release and distorts its instantaneous rate. However, the calculation method based on the net enthalpy change of the PCM, derived from the continuous temperature measurement history (Tt in Eq. (1)), inherently captures the energy released during the post-nucleation temperature rebound. Therefore, the total cold storage capacity Qtotal remains accurate, as it is determined by the state change of the PCM from initial to final conditions, independent of the path involving supercooling. The potential systematic error in strictly partitioning energy into “sensible cooling to Tm” and “latent heat release at Tm” is minimized by our time-integrated approach. The duration of the supercooling-related fluctuation (~500 s) is short compared to the total phase change period (>2000 s), and the associated temperature deviation is small. We estimate that the resulting relative uncertainty in the reported total cold storage capacity due to this effect is well below 2%, which is within the broader experimental uncertainty. Thus, while supercooling is an important dynamic feature affecting the transient thermal power, it does not materially compromise the accuracy of the total energy storage comparisons central to this study.
Under a constant mass flow rate, the upper wall temperature of the unit tube demonstrates significantly nonlinear responses to variations in cold source temperature. The thermal evolution of the upper wall, as shown in Fig. 10, can be characterized by two distinct stages:
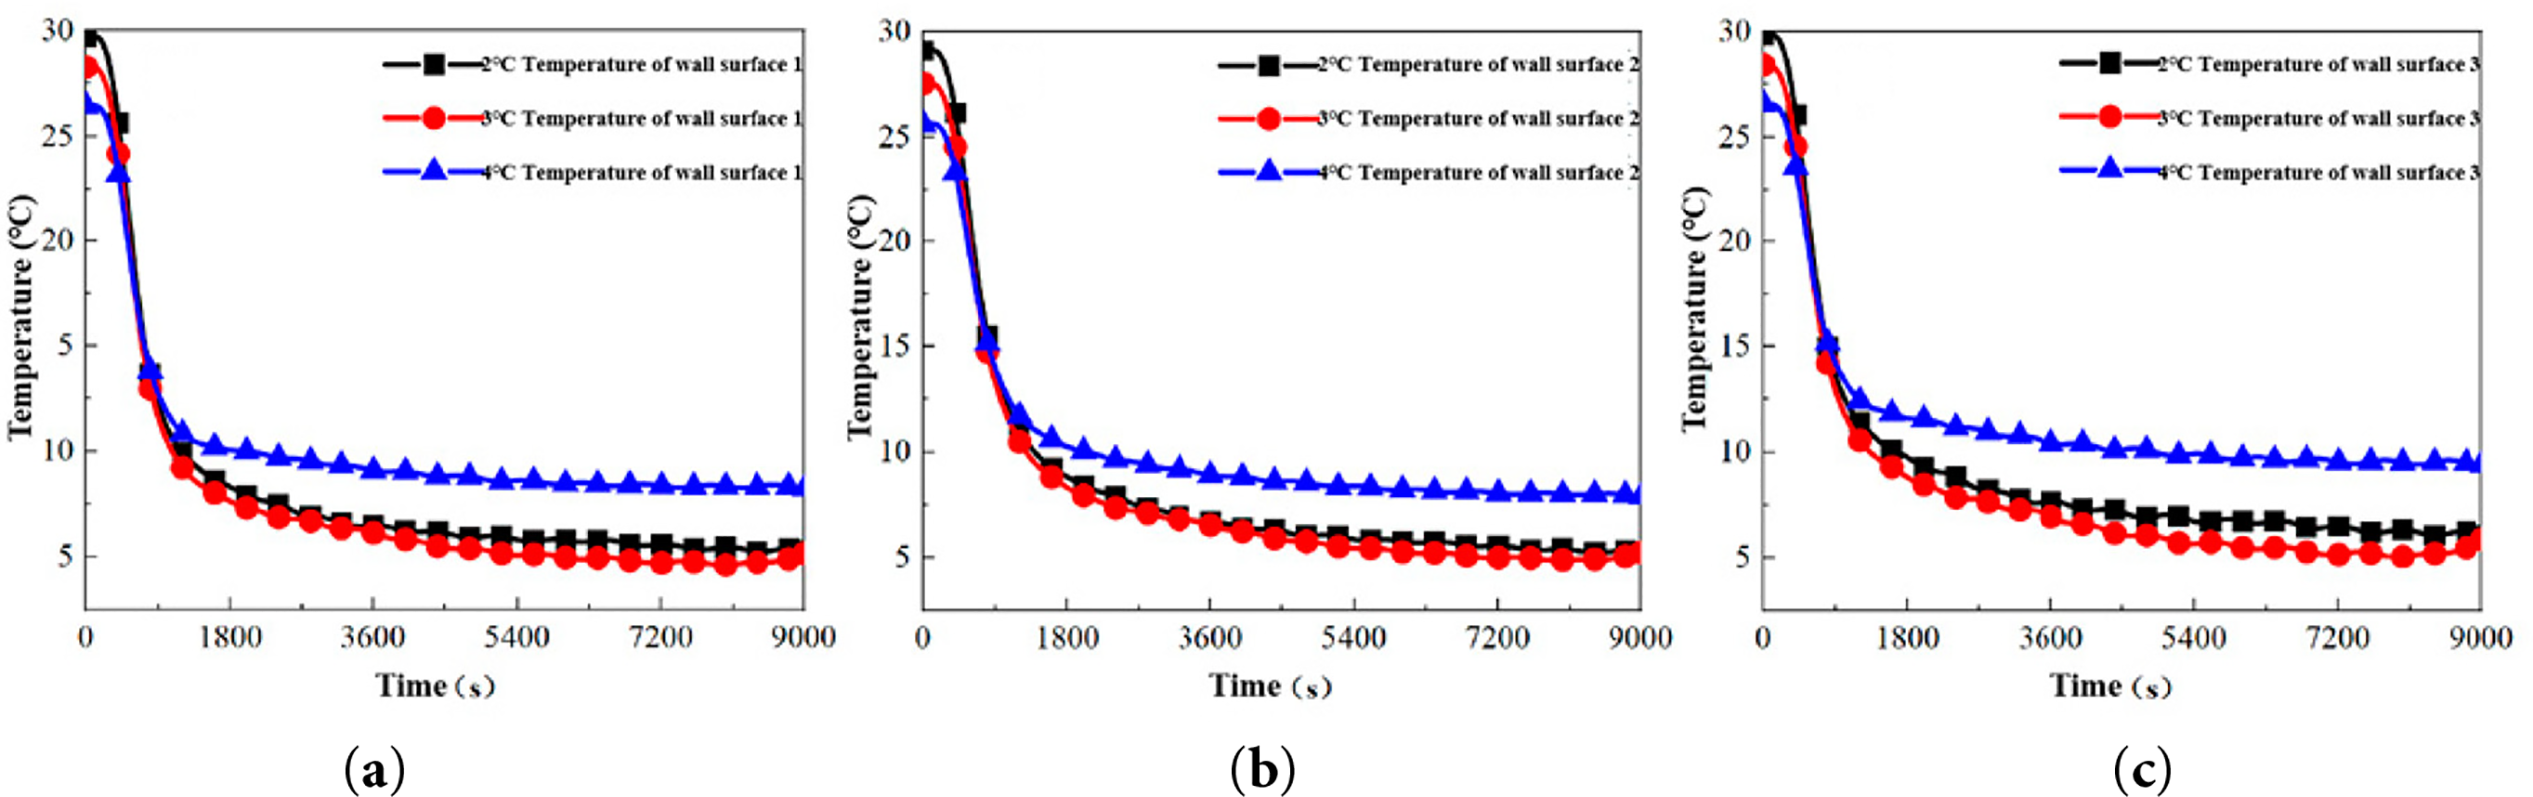
Figure 10: Temperature variation curves of the upper wall of different unit tubes at different circulating water temperatures. (a) Tube 1: Upper wall temperature variation of Tube 1. (b) Tube 2: Upper wall temperature variation of Tube 2. (c) Tube 3: Upper wall temperature variation of Tube 3. The definitions and locations of Tube 1–3 are provided in Section 2.3.
(1) Stage I (0–900 s): Rapid Convective Cooling
During this initial phase, the upper wall temperature decreases rapidly due to convective heat transfer with the cold fluid, approaching the PCM’s melting temperature. The cooling rate during this stage exhibits a negative correlation with the temperature of the cold fluid, with lower fluid temperatures producing steeper temperature declines.
(2) Stage II (900–9000 s): Air-Gap Influenced Regime
The thermal behavior in this extended stage parallels observations from Section 4.1.1, primarily influenced by PCM volume contraction during solidification. As the liquid level recedes below the upper temperature sensor due to solidification shrinkage, the sensor begins detecting temperatures at the air-PCM interface. This transition results in a single pronounced inflection point, after which the cooling rate diminishes significantly as the detection point monitors the gradually cooling air within the tube.
The influence of circulating water temperature on cold storage capacity was quantified using Eq. (1). Fig. 11 presents the temporal evolution of cold storage capacity across different temperature conditions, revealing three characteristic stages:
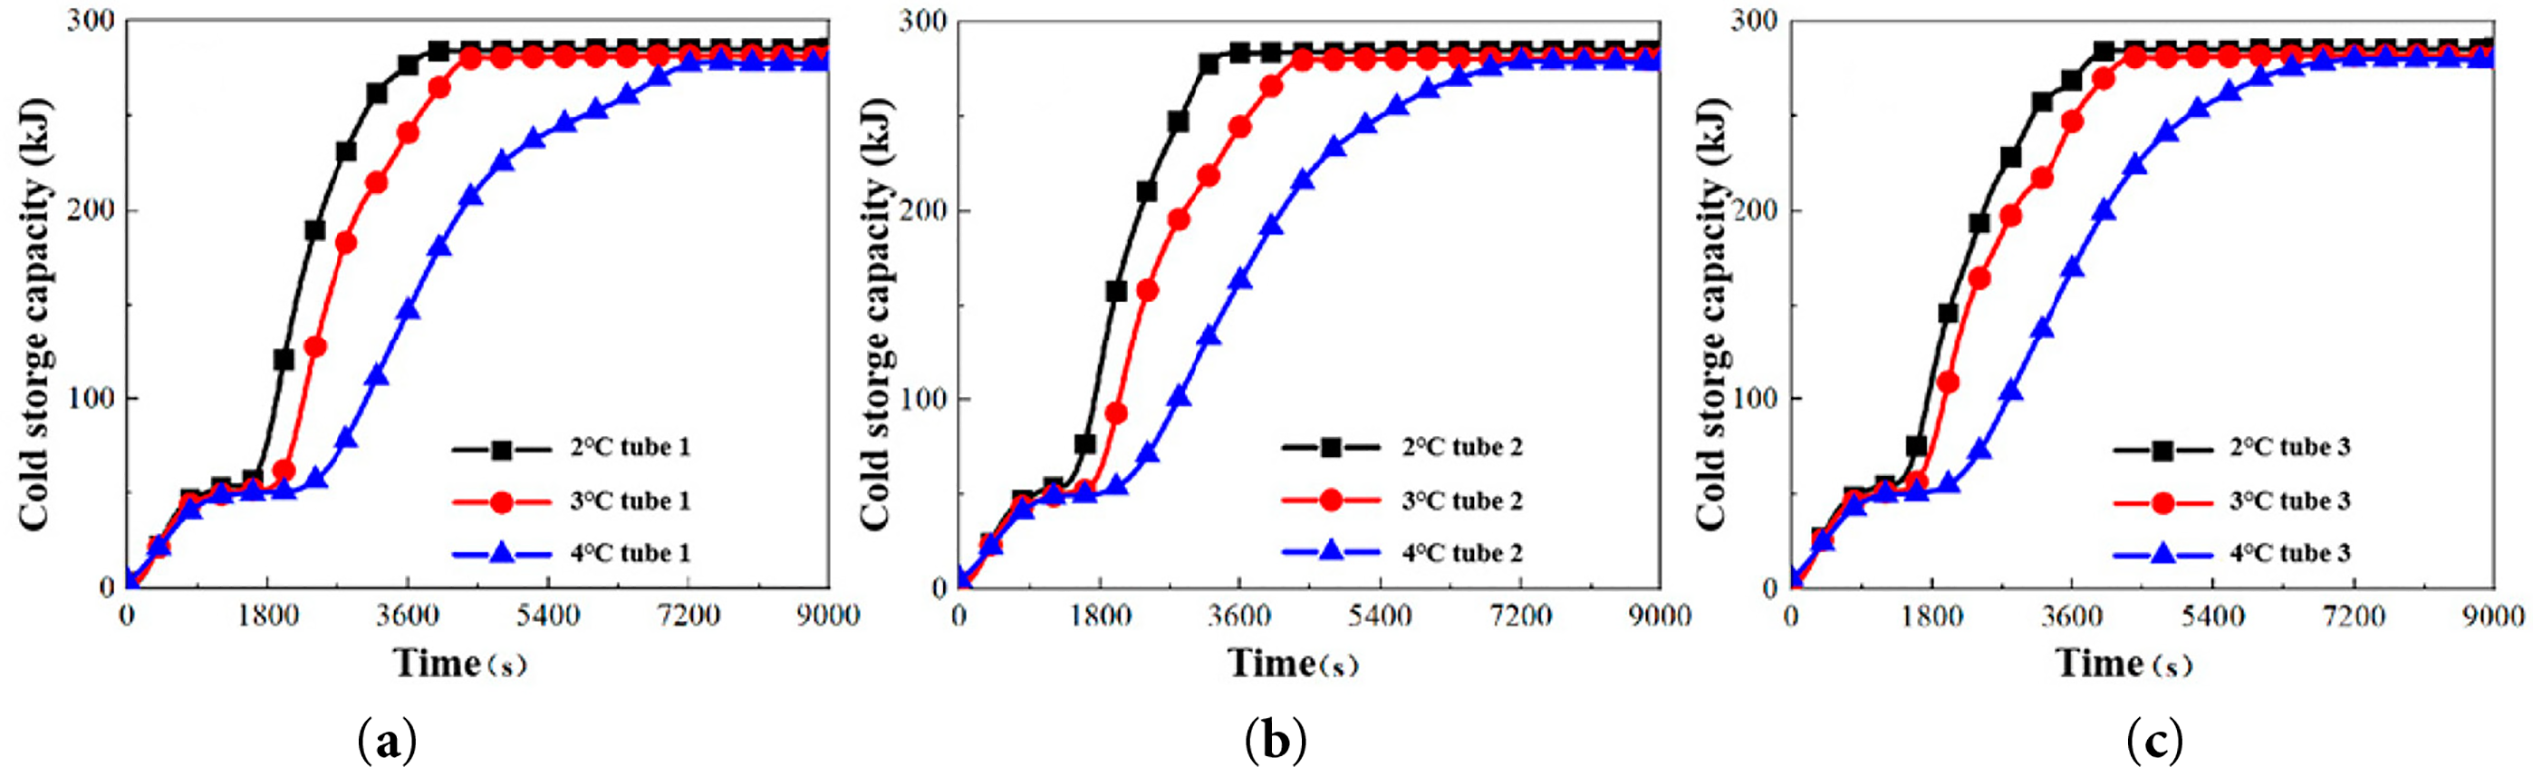
Figure 11: Change curve of cooling capacity of each unit tube at different circulating water temperatures. (a) Tube 1: Cooling capacity variation of Tube 1. (b) Tube 2: Cooling capacity variation of Tube 2. (c) Tube 3: Cooling capacity variation of Tube 3. The definitions and locations of Tube 1–3 are provided in Section 2.3.
(1) Stage I: Liquid Sensible Heat Extraction
This initial phase involves rapid release of sensible heat from the liquid PCM to the cold fluid via convection. The sensible heat extraction rate demonstrates a negative correlation with cold source temperature, with the 2°C condition reducing this stage’s duration by 25.5% compared to the 4°C condition.
(2) Stage II: Latent Heat Release
This stage corresponds to the PCM phase transformation, where energy is stored primarily as latent heat. The significantly steeper slope of the cold storage capacity curve indicates enhanced heat transfer efficiency, attributable to the transition from conduction-dominated heat transfer to natural convection during solidification.
(3) Stage III: Solid-Phase Sensible Heat Equilibrium
Following complete PCM solidification (beyond 3600 s), heat transfer reverts to conduction through the solid phase. The reduced slope of the cold storage capacity curve reflects diminished heat transfer rates resulting from both the lower thermal conductivity of solid PCM and the progressively decreasing temperature difference between the solid PCM and the cold fluid.
Thermodynamic analysis reveals that the total cold storage capacity exhibits comparable magnitudes across different cold source temperatures, as illustrated in Fig. 12. The minor variations observed primarily stem from temperature-dependent differences in solid-phase sensible heat storage, while the latent heat component-constituting the majority of the total capacity-remains unaffected by cold source temperature variations.
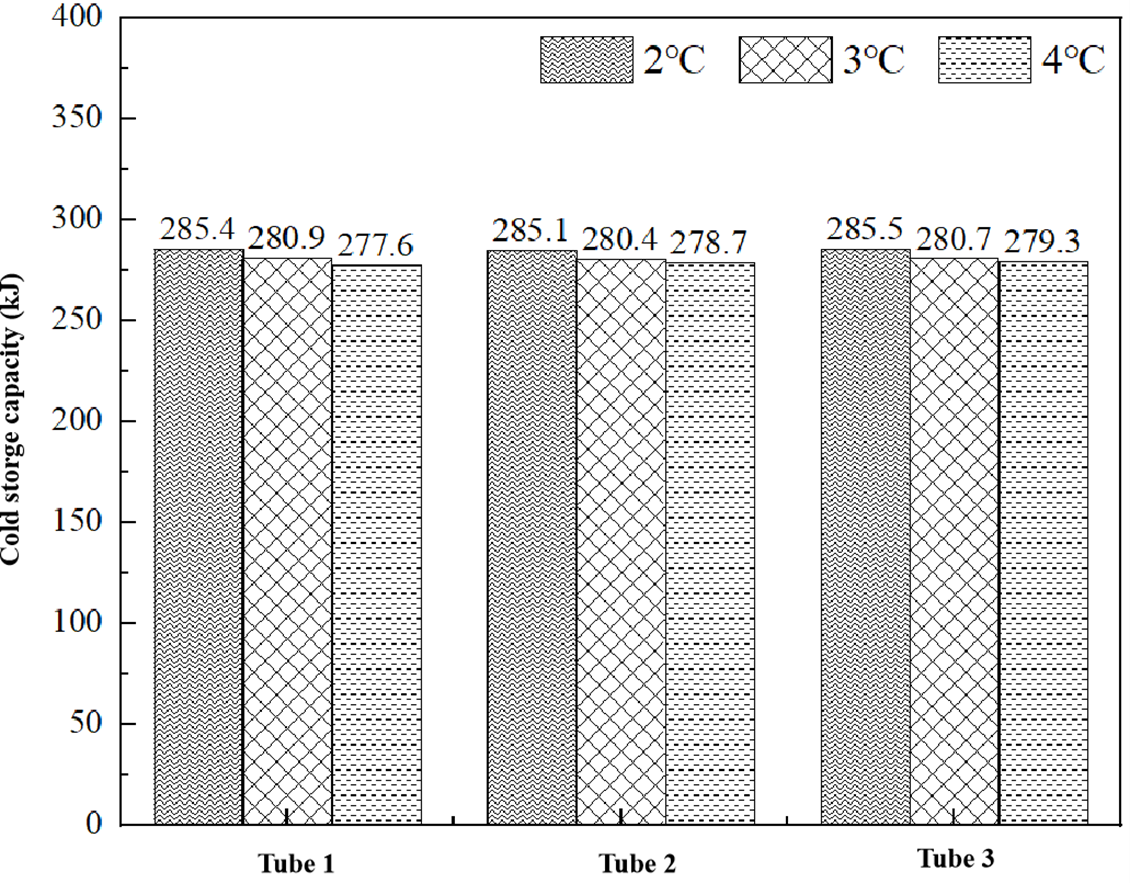
Figure 12: Total cooling capacity of different unit tubes during cooling cycle at different circulating water temperatures.
4.1.3 Dimensionless Analysis and Assessment of Natural Convection Effects
To quantitatively evaluate the heat transfer mechanisms and the role of natural convection during the PCM cooling process, a systematic dimensionless analysis was conducted. The Rayleigh number (Ra), Stefan number (Ste), and Fourier number (Fo) were calculated to assess the relative importance of buoyancy-driven convection, latent heat release, and thermal diffusion timescales, respectively.
The Rayleigh number (Ra), which compares buoyancy forces to viscous and thermal diffusion forces, was calculated for the initial liquid PCM stage. Using the expression Ra = gβΔTLc3/(να), with gravitational acceleration g = 9.81 m/s2, thermal expansion coefficient β ≈ 0.0009 K−1 for liquid n-tetradecane, characteristic temperature difference ΔT ≈ 22 K (between initial PCM ~25.5°C and cold wall ~3°C–4°C), characteristic length Lc ≈ 0.01 m (annular gap hydraulic radius), kinematic viscosity ν ≈ 3.5 × 10⁻⁶ m2/s, and thermal diffusivity α ≈ 9.0 × 10⁻⁸ m2/s, the calculated Ra was on the order of 105 to 106. This value significantly exceeds the critical threshold (~1700) for the onset of convection in enclosed horizontal layers, indicating that natural convection likely enhanced heat transfer from the bulk liquid PCM to the cooled tube wall during the initial sensible cooling period (Stage I in Figs. 5 and 7). This explains the rapid and relatively uniform temperature drop observed at the beginning of the experiments and the sensitivity of the cooling rate to external cold water flow conditions (Fig. 6).
The Stefan number (Ste), representing the ratio of sensible to latent heat, was calculated as Ste = cpΔTs/L, where cp = 2550 J/(kg·K) is the liquid specific heat, ΔTs ≈ 3–4 K is the subcooling degree, and L = 218.56 kJ/kg is the latent heat. The resulting Ste ranged from 0.035 to 0.047. This very low value (<0.1) confirms that the energy release during solidification is overwhelmingly dominated by latent heat, justifying the distinct quasi-isothermal plateau during Stage II in the temperature and cold storage capacity curves (Figs. 5, 8, 9 and 11).
The Fourier number (Fo), defined as Fo = αt/Lc2, was used to assess the relative timescale of thermal diffusion. For the initial cooling stage (t ≈ 900 s), Fo was calculated to be ~0.8. This indicates that thermal diffusion had sufficient time to propagate across the characteristic length during Stage I, supporting the observation of effective initial sensible heat removal. However, the dominant influence of natural convection (indicated by high Ra) during this stage means that the cooling process was augmented by convective mixing.
These analyses collectively demonstrate that natural convection plays a significant role in the initial cooling performance, aligning with the observed experimental trends. However, as solidification progresses and a solid layer forms, heat transfer transitions to being conduction-dominated through the solid PCM. This dimensionless framework provides a mechanistic basis for interpreting the experimental results and underscores the importance of initial conditions on the overall cold storage dynamics. Future refined modeling of such systems should consider transient natural convection in the liquid PCM phase for improved predictive accuracy.
4.2 Condensation Result Analysis
Temperature monitoring during the condensation experiments was accomplished using a wireless temperature measurement device installed on the lower wall of the condenser tube. This system transmitted temperature signals to a receiver via a direct line-of-sight path. Due to limitations in transmission range and battery life, the wireless device was activated exclusively during condensation testing.
Based on preliminary data analysis, the condition with R134a at an inlet temperature of 25°C was selected as a representative case for detailed examination. The temporal evolution of system temperature and pressure parameters under the 4°C cold storage condition is presented in Fig. 13. The complete experimental sequence comprised the initial cold storage phase followed by the condensation phase, with the latter further divisible into pre-condensation and formal condensation periods, characterized as follows:
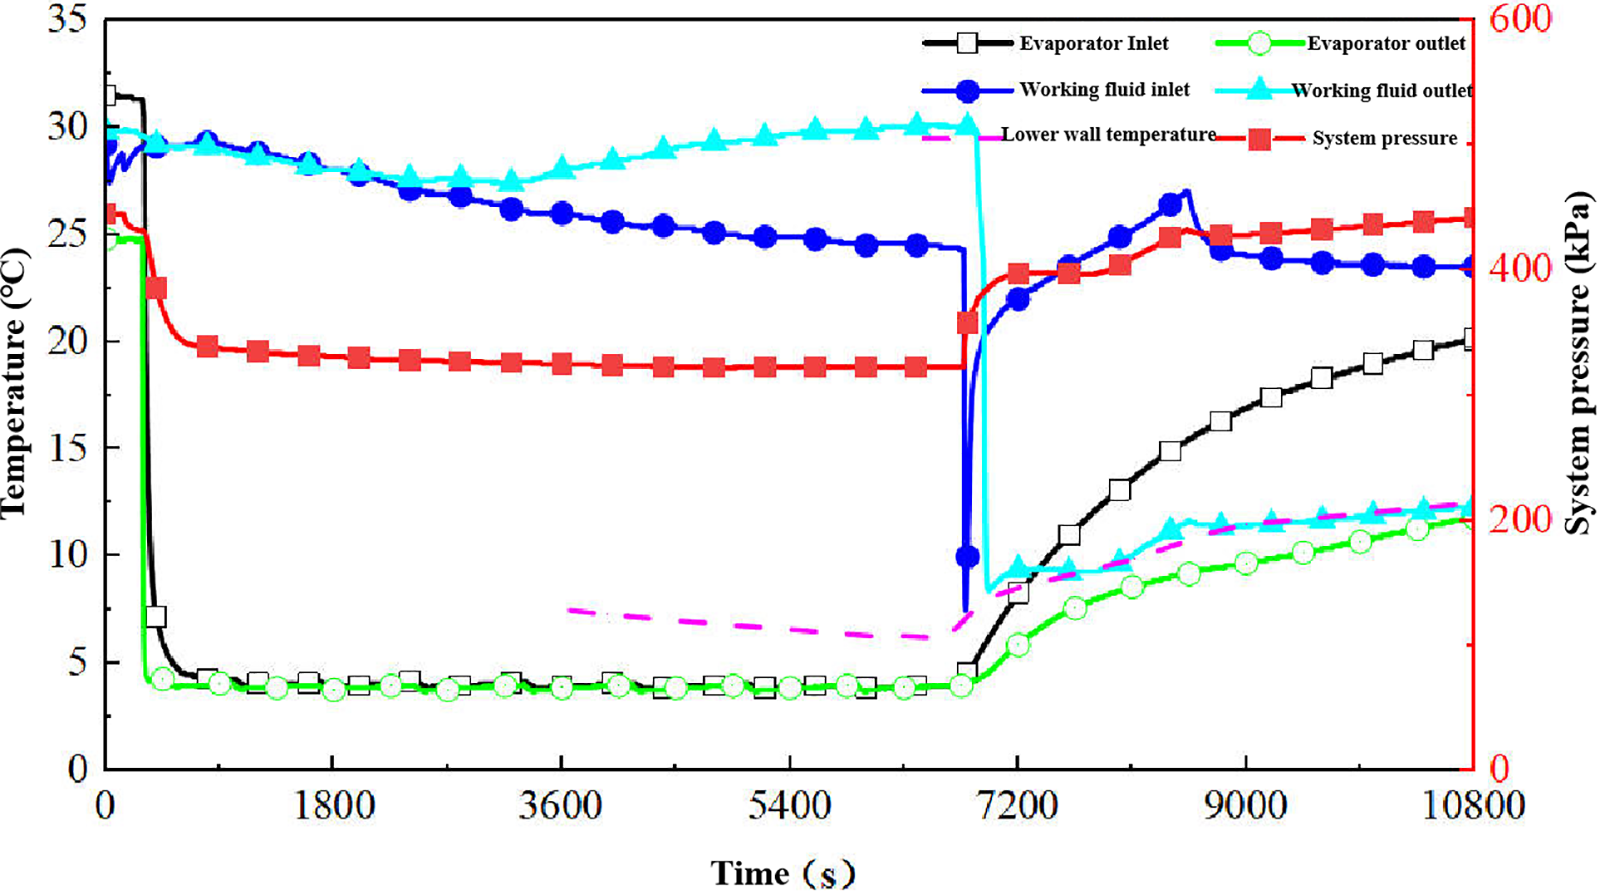
Figure 13: Typical condensation experiment temperature/pressure change curve.
(1) Pre-condensation Stage Characteristics: The cold storage process reduced the system pressure from 440 to 360 kPa. Following cold storage completion, pressure compensation was initiated by opening the pressure-regulating valve. The resultant pressure differential across the valve, combined with pipe diameter variations, induced throttling that produced a rapid temperature decrease throughout the system, with both the working medium inlet and outlet temperatures declining sharply. After thermal stabilization at the reference temperature of 25°C, the system transitioned to the formal experimental stage.
(2) Formal Condensation Stage Characteristics: This stage spanned from 7200 to 7800 s (10 min duration), during which system pressure stabilized at 398 ± 5 kPa. The working medium inlet temperature gradually attained the setpoint of 25°C through slow thermal equilibration. Notably, the working medium outlet temperature exhibited a continuous decline during the initial phase, eventually reaching dynamic equilibrium with the lower wall temperature. Concurrently, the lower wall temperature demonstrated a gradual increase, with its thermodynamic behavior confirming that continuous cold energy release promoted working medium phase change. Throughout the observation period, the lower wall temperature remained below 10°C.
Liquid level monitoring data from the glass tube gauge (Fig. 14) indicated significant condensate accumulation prior to the official commencement of the condensation experiment. As shown in Fig. 14a, the accumulated condensate volume exceeded the maximum scale of the measurement apparatus. Upon activation of the recovery machine, the condensate was rapidly evacuated from the experimental system. Fig. 14b,c demonstrate that approximately 110 mL of condensate was extracted between 60 and 252 s. This preliminary evacuation procedure was implemented to eliminate the influence of initial condensate on subsequent mass flow rate measurements.
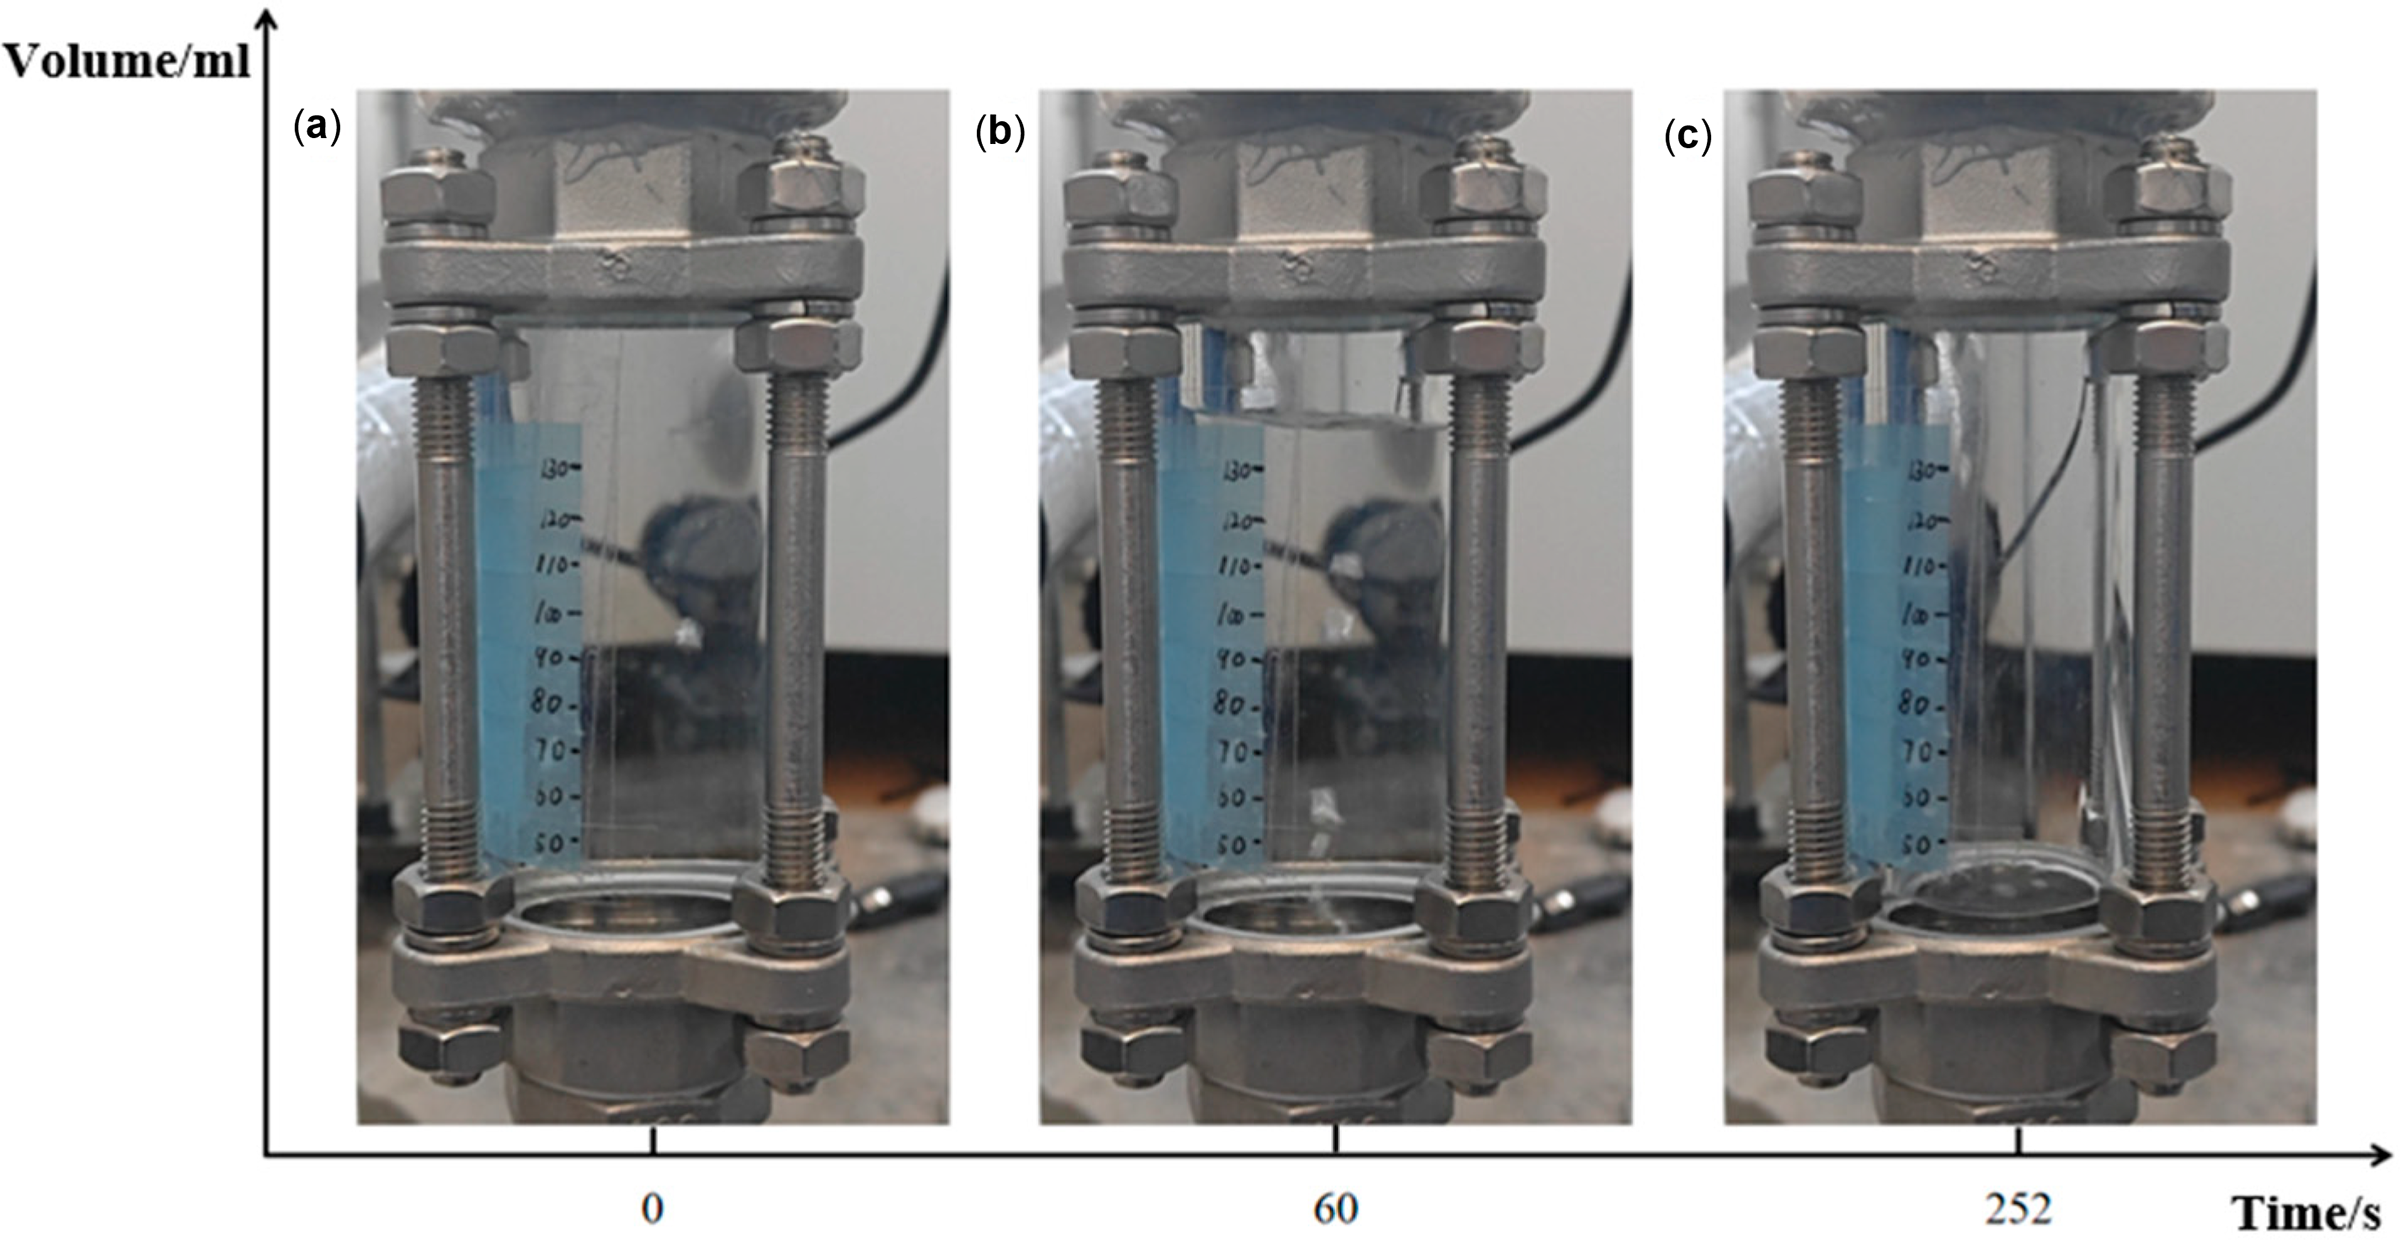
Figure 14: Liquid accumulation phenomenon at the initial moment of condensation experiment. (a) t = 0 s—initial condition: condensate level exceeds the maximum scale of the gauge (overfilled). (b) t = 60 s—rapid drawdown after activation of the recovery machine. (c) t = 252 s—near-empty gauge after evacuation.
The formal condensation stage is shown in Fig. 15. The accumulation process of the condensed liquid exhibits significant nonlinear characteristics: the liquid phase volume was measured to be 50 mL at t = 0 s, then increased to 80 mL at t = 60 s, and the volume growth rate slowed down significantly in the subsequent condensation stages (t = 60–160 s), eventually reaching 100 mL.
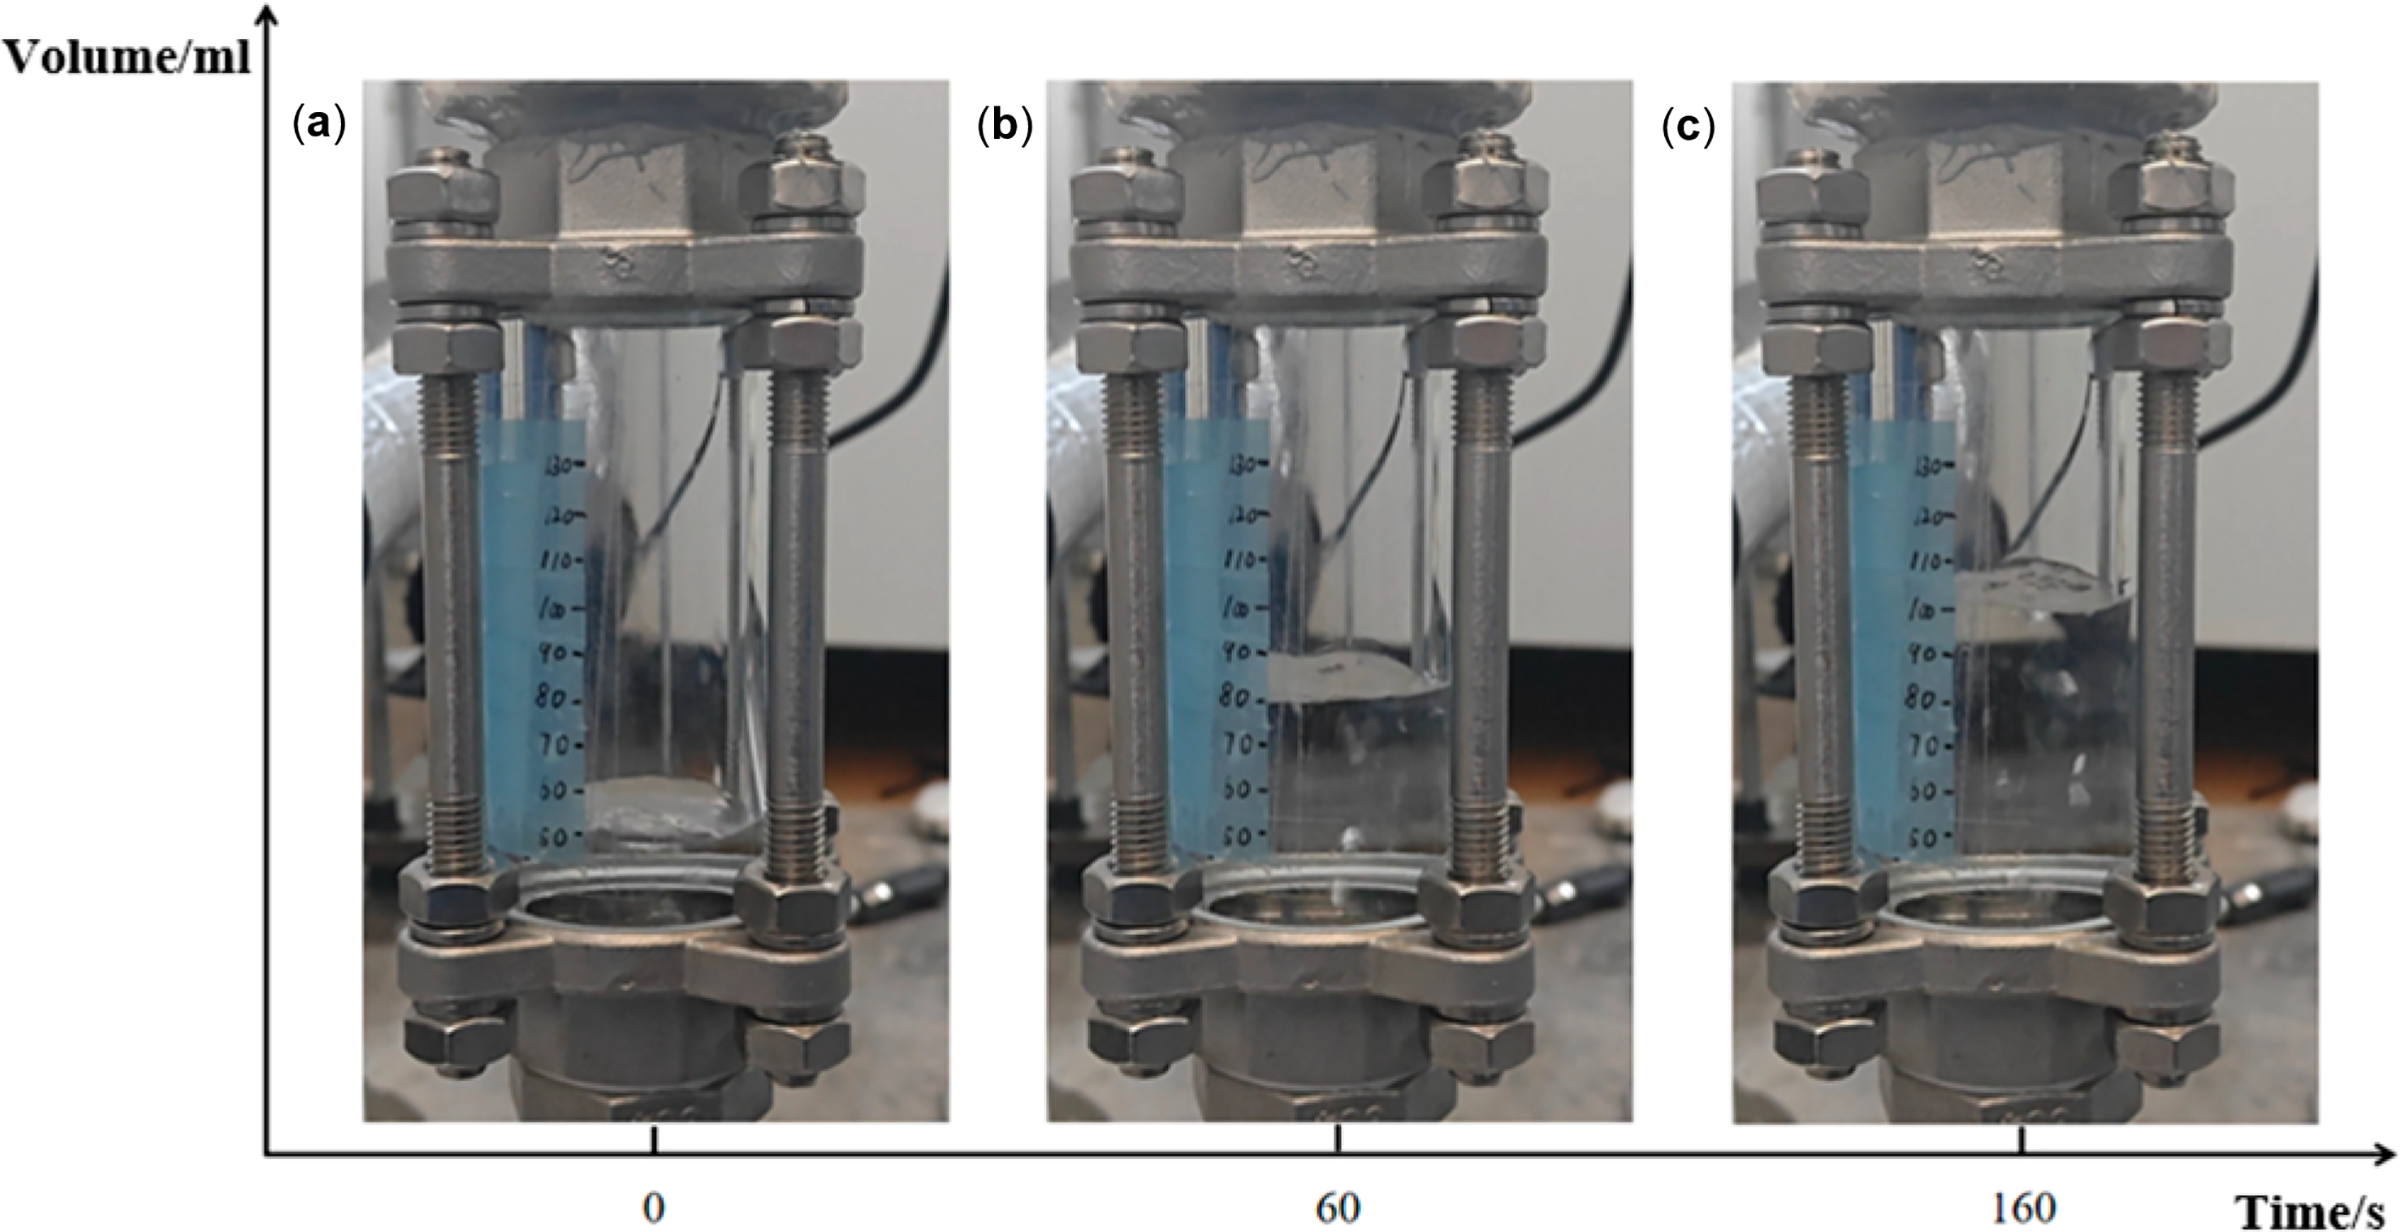
Figure 15: Liquid accumulation during condensation experiment. (a) t = 0 s—initial measured volume ≈ 50 mL. (b) t = 60 s—rapid rise to ≈ 80 mL. (c) t = 60 s—160 s—slowed growth reaching ≈ 100 mL.
The reason for the attenuation of the volume rate of the condensed liquid is, on the one hand, due to the pressure fluctuation of the system (which decreased by approximately 5 kPa). After checking REFPROP, it was found that the pressure fluctuation led to a decrease of about 0.4°C in the saturation temperature. This temperature fluctuation reduced the temperature difference required for phase change and significantly weakened the efficiency of latent heat transfer. On the other hand, due to the formation of a cavity structure between the lower outlet on the shell side and the bottom plate of the cold storage unit tube (L = 100 mm), a liquid phase retention zone is created, which reduces the effective heat exchange area and subsequently leads to the aforementioned slower rate phenomenon. During the formal condensation stage, the system pressure exhibited fluctuations within a range of approximately ±5 kPa. According To REFPROP, this corresponds to a variation in the saturation temperature of R134a of about ±0.4°C. In the primary data analysis for calculating average performance metrics (Section 4.3), the time-averaged pressure and corresponding saturation temperature were used to determine the driving temperature difference. To assess the sensitivity of the reported heat transfer coefficient to these pressure-induced saturation temperature deviations, a supplementary analysis was conducted. Considering the bounds of, the recalculated average convective heat transfer coefficient varied by approximately ±3%–4% from the reported mean value. This variation is within the overall experimental uncertainty and does not alter the comparative performance trends established under different cold storage conditions. The inference of a liquid retention zone is based on the observed condensation dynamics and the physical geometry of the shell-side lower outlet region. While direct flow visualization or computational fluid dynamics (CFD) validation was not conducted in this study, the nonlinear liquid accumulation profile (Fig. 15) and the structural cavity (L = 100 mm) strongly suggest local pooling of condensate, which reduces the effective heat transfer area for vapor condensation. Similar phenomena of liquid retention impacting condenser performance have been reported in studies on shell-and-tube heat exchangers [24,25]. Future work incorporating high-speed imaging or CFD simulations would be valuable to precisely characterize the liquid distribution and optimize the shell-side geometry to minimize such losses.
4.3 Condensation Performance Evaluation
Based on the First Law of thermodynamics, this subsection will establish a quantitative assessment of the condensation performance of energy storage heat exchangers. The main parameters to be evaluated include the heat flow rate of the heat exchanger and the convective heat transfer coefficient. The calculation formula is in the following form:
In the formula, Q represents the instantaneous heat flow rate, W; hin and hout are respectively the specific enthalpy at the inlet and outlet of the working medium, which are solved by REFPROP, J/g; m represents the mass flow rate, which is monitored by a glass tube liquid level gauge in kg/s. α is the coefficient of the convection heat exchanger, W/(m2·K); ΔTLM represents the logarithmic mean temperature difference, K; A represents the heat exchange area, in m2; Tsat is the saturation temperature of R134a at the corresponding system pressure, K; Twall,in and Twall,out are respectively the pipe wall temperatures at the inlet and the outlet, K.
The performance of the condenser was evaluated using the Logarithmic Mean Temperature Difference (LMTD) method, as all inlet and outlet temperatures of the working fluid and the wall temperatures were directly measured during the quasi-steady condensation period. This approach is experimentally straightforward and commonly employed in the analysis of phase-change heat exchangers. While the ε-NTU (effectiveness-Number of Transfer Units) method is a valuable alternative for design-oriented studies, the LMTD method is well-suited for the present work because it directly utilizes the measured temperature data to compute the driving potential for heat transfer, thereby inherently accounting for the actual transient and non-uniform wall temperature distribution observed during the PCM-coupled condensation process.
The variations of convection heat transfer coefficient and heat flow rate are presented in Fig. 16. Post-processing of the experimental data indicates that with a working medium inlet temperature of 20°C, the energy storage heat exchanger delivered a stable cooling power output of approximately 80 W. The relatively small fluctuation range of the heat flow curve demonstrates reasonable stability in cold source supply. In contrast, the convective heat transfer coefficient exhibited substantial transient behavior, fluctuating between 43.1 and 194.7 W/(m2·K). While the time-averaged value reached 110.73 W/(m2·K), the instantaneous coefficient was significantly influenced by complex two-phase flow dynamics and phase change heat transfer. This behavior reflects considerable spatio-temporal variations in local heat transfer efficiency during the condensation process. Structural optimization and refined temperature measurement strategies are necessary to improve data stability and uniformity.
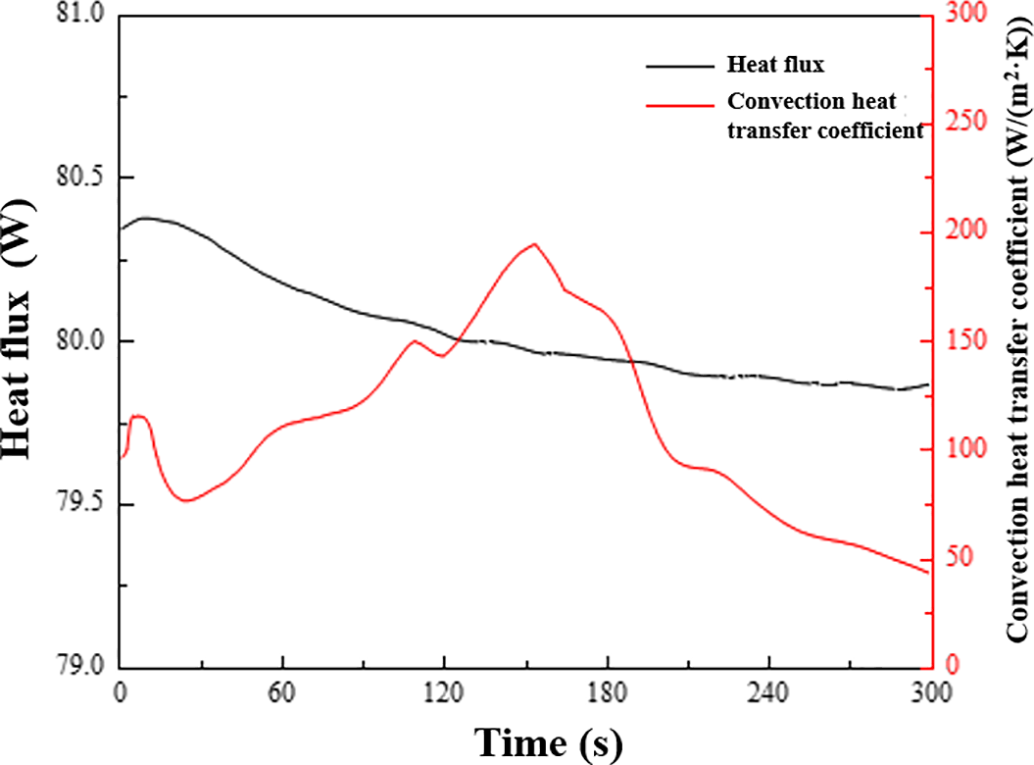
Figure 16: Convection heat transfer coefficient and heat flow change curve of heat exchanger shell side.
The current experimental methodology and data acquisition techniques present certain limitations. For instance, temperature measurements at the working medium inlet were affected by alternating contact with vapor and liquid phases, resulting in distorted local thermodynamic parameter readings. Additionally, mass flow instabilities arising from pressure fluctuations, combined with the reduction in effective heat transfer area due to condensate film formation, systematically underestimate the system’s true heat exchange capacity. Furthermore, the absence of two-phase flow visualization capabilities impedes precise analysis of the correlation between phase change progression and flow structure evolution, thereby limiting comprehensive understanding of complex heat transfer phenomena.
Future investigations should establish additional critical monitoring points integrated with high-precision sensors to enable real-time tracking of condensation process parameters. This approach would facilitate synchronized monitoring of PCM cold release and temperature field evolution, thereby enhancing measurement reliability and providing deeper insight into the heat transfer mechanisms governing energy storage heat exchangers. The calculation of the logarithmic mean temperature difference (∆TLM) in Eq. (2) employed the time-averaged saturation temperature derived from the measured system pressure. While instantaneous pressure fluctuations (±5 kPa) caused corresponding saturation temperature shifts, their effect on the time-averaged heat transfer coefficient was found to be minor, as detailed in Section 4.2.
5 Practical Implications and Potential for Scaling
The experimental findings of this study demonstrate the feasibility of the novel jacketed condenser design for integrating latent heat cold storage with refrigerant condensation, offering a compact solution to address the temporal mismatch in waste energy recovery systems. This technology holds practical promise for industrial applications with intermittent low-grade cold or waste heat streams, such as in chemical processing, data center cooling, or diurnal solar-thermal ORC systems. For scaling up, a modular approach employing multiple jacketed tube bundles is envisaged. The identified optimal operational parameters (e.g., cold water flow rate of ~0.5 kg/s per tube and temperature of 3°C–4°C) provide a direct basis for system design. The insights into heat transfer mechanisms-initially dominated by natural convection and later limited by PCM conduction-highlight the importance of maintaining a small heat conduction path or incorporating enhancement techniques (e.g., fins, composite PCMs) in larger units to preserve performance. Furthermore, the observed constraints on condensation performance, such as shell-side liquid retention, point to clear optimization pathways in scaled-up header and flow distribution design. By eliminating the need for a separate storage tank and exchanger, the integrated design offers potential benefits in reduced footprint, complexity, and cost. Future work will focus on developing and testing a multi-tube modular prototype to fully assess its technical and economic viability for industrial-scale energy storage applications.
This study systematically investigated the dynamic characteristics of cold storage and condensation processes in a jacketed shell-and-tube energy storage heat exchanger through experimental analysis. The principal findings are summarized as follows:
(1) Mass flow rate exerts a significant influence on cold storage performance: Maintaining a constant circulating water inlet temperature, increasing the mass flow rate enhances forced convective heat transfer efficiency and accelerates the cooling rate. When the flow rate increased from 0.25 to 0.50 kg/s, the peak temperature change rate at the lower wall rose by 16.4% to 28.6%. However, further increasing the flow rate to 1.00 kg/s produced diminishing returns (improvement < 5%), indicating performance saturation. Consequently, a moderate flow rate of 0.50 kg/s provides the optimal balance between cooling rate and total cold storage capacity.
(2) Circulating water temperature critically determines cold storage behavior: Reducing the inlet temperature significantly strengthens the thermal driving force between heat sources, substantially shortening the cooling cycle. When the temperature decreased from 4°C to 3°C, the phase change duration was reduced by 41.6% while total cold storage increased by 21.56%. However, further reduction to 2°C yielded limited improvement (only 13.39% time reduction) due to the marginal effect of solid-phase sensible heat storage. These results indicate that an inlet temperature range of 3°C–4°C represents the optimal balance between energy efficiency and performance in practical applications.
(3) Condensation performance is constrained by localized flow dynamics: Experimental results demonstrated an average cooling power of 80 W with a mean convective heat transfer coefficient of 110.73 W/(m2·K). However, instantaneous values exhibited substantial fluctuations attributable to two-phase flow complexities. Pressure variations (±5 kPa) induced saturation temperature shifts that compromised latent heat transfer efficiency, while shell-side liquid accumulation reduced the effective heat transfer area. Structural modifications to minimize liquid retention are recommended to enhance condensation stability.
(4) The identified liquid retention zone on the shell side highlights a structural limitation that reduces the effective heat transfer area. Although not directly visualized in this study, its impact is reflected in the condensation dynamics and overall performance. Future design iterations should aim to minimize such cavities, and complementary techniques like flow visualization or CFD modeling are recommended to quantitatively assess and mitigate liquid retention effects.
Acknowledgement: Not applicable.
Funding Statement: The authors would like to thank the the basic scientific research Funds project of Heilongjiang Universities [grant numbers 2024-KYYWF-0554].
Author Contributions: Lei Xing: investigation, data curation, writing—original draft, visualization. Haonan Huang: investigation, data curation. Mingyang Sun: writing—review & editing. Dongyue Jiang: conceptualization, project administration, resources, supervision. Qiang He: project administration, resources, funding, supervision. All authors reviewed and approved the final version of the manuscript.
Availability of Data and Materials: Data will be made available on request.
Ethics Approval: The article does not include human participants and/or animals research.
Conflicts of Interest: The authors declare no conflicts of interest.
References
1. Zhang Y, Ding W, Zhang Y, Shi J, Zhang G, Zhou D. Frost-free air source heat pump employing liquid desiccant pre-dehumidification: review, challenges, and prospects. Renew Sustain Energy Rev. 2026;226:116386. doi:10.1016/j.rser.2025.116386. [Google Scholar] [CrossRef]
2. Sun M, Liu T, Wang X, Liu T, Li M, Chen G, et al. Roles of thermal energy storage technology for carbon neutrality. Carbon Neutrality. 2023;2(1):12. doi:10.1007/s43979-023-00052-w. [Google Scholar] [CrossRef]
3. Prasad JS, Muthukumar P, Desai F, Basu DN, Rahman MM. A critical review of high-temperature reversible thermochemical energy storage systems. Appl Energy. 2019;254:113733. doi:10.1016/j.apenergy.2019.113733. [Google Scholar] [CrossRef]
4. Seyitini L, Belgasim B, Enweremadu CC. Solid state sensible heat storage technology for industrial applications—a review. J Energy Storage. 2023;62:106919. doi:10.1016/j.est.2023.106919. [Google Scholar] [CrossRef]
5. Sharma RK, Ganesan P, Tyagi VV, Metselaar HSC, Sandaran SC. Developments in organic solid–liquid phase change materials and their applications in thermal energy storage. Energy Convers Manag. 2015;95(1):193–228. doi:10.1016/j.enconman.2015.01.084. [Google Scholar] [CrossRef]
6. Ma D, Zhang S, Geng B, Jiang B, Yan T, Wang W, et al. Design and performance optimization of thermochemical energy storage reactor integrated high-thermal-conductivity porous structures. Appl Therm Eng. 2025;278:127265. doi:10.1016/j.applthermaleng.2025.127265. [Google Scholar] [CrossRef]
7. Gao L, Yue H, Deng Y, Fan J, Yang L. Heat transfer characterization and enhancement of spherical latent heat thermal energy storage unit under forced convection boundary conditions. Appl Therm Eng. 2025;280:128132. doi:10.1016/j.applthermaleng.2025.128132. [Google Scholar] [CrossRef]
8. Ostrowska M, Lech S, Pawliczek S, Czajkowski C. Heat transfer enhancement in thermal energy storage system with phase change material: a comprehensive experimental study of charge and discharge processes. Int Commun Heat Mass Transf. 2025;169:109747. doi:10.1016/j.icheatmasstransfer.2025.109747. [Google Scholar] [CrossRef]
9. Liu J. The classification of the heat exchangers and theory research. In: Proceedings of the 1st International Conference on Materials Science, Energy Technology, Power Engineering (MEP 2017); 2017 Apr 15–16; Hangzhou, China. p. 1–4. [Google Scholar]
10. Calderón-Vásquez I, Cortés E, García J, Segovia V, Caroca A, Sarmiento C, et al. Review on modeling approaches for packed-bed thermal storage systems. Renew Sustain Energy Rev. 2021;143:110902. doi:10.1016/j.rser.2021.110902. [Google Scholar] [CrossRef]
11. Wang Y, Zhang L, Zhang Q, Liu H, Lu Z, Heng Z. Research progress on the enhancement of heat transfer performance of ground heat exchangers: a review. Sustain Energy Technol Assess. 2025;76:104283. doi:10.1016/j.seta.2025.104283. [Google Scholar] [CrossRef]
12. Parach K, Jafari B, Hosseinzadeh K. Numerical analysis of integrated photovoltaic thermal systems utilizing nanoparticles with phase change material and fin attachments. Int J Thermofluids. 2025;27:101210. doi:10.1016/j.ijft.2025.101210. [Google Scholar] [CrossRef]
13. Ma Q, Lv Y, Sha H, Yu H, Luo S. Simulation modeling and working fluid usage reduction for small-scale low-temperature organic Rankine cycle (ORC) plate heat exchangers. Energies. 2025;18(20):5549. doi:10.3390/en18205549. [Google Scholar] [CrossRef]
14. Budianto D, Cahyadi, Lubis A, Alhamid MI, Hakim II, Aziz M. Thermodynamic and electrical output analysis of a small-scale organic Rankine cycle using R134a and a hermetic scroll expander. Energy Convers Manag. 2025;344(5):120278. doi:10.1016/j.enconman.2025.120278. [Google Scholar] [CrossRef]
15. Yang CY, Nalbandian H, Lin FC. Flow boiling heat transfer and pressure drop of refrigerants HFO-1234yf and HFC-134a in small circular tube. Int J Heat Mass Transf. 2018;121:726–35. doi:10.1016/j.ijheatmasstransfer.2017.12.161. [Google Scholar] [CrossRef]
16. Li H, Hrnjak P. Heat transfer coefficient, pressure gradient, and flow patterns of R1234yf evaporating in microchannel tube. J Heat Transf. 2021;143(4):042501. doi:10.1115/1.4049635. [Google Scholar] [CrossRef]
17. Li H, Hrnjak P. Heat transfer and pressure drop of R32 evaporating in one pass microchannel tube with parallel channels. Int J Heat Mass Transf. 2018;127:526–40. doi:10.1016/j.ijheatmasstransfer.2018.08.062. [Google Scholar] [CrossRef]
18. Jing R, Zhang L, Shen X, Zhang X, Bian H, Wang J. Numerical analysis on steam–air condensation at low wall sub-cooling under natural convection. Ann Nucl Energy. 2025;223:111692. doi:10.1016/j.anucene.2025.111692. [Google Scholar] [CrossRef]
19. Baday AA, El-Shazly YMS, Nosier SA, Abdel-Aziz MH. Mass transfer intensification in laminar flow using wall-mounted ribs: a CFD and experimental study. Int Commun Heat Mass Transf. 2025;169:109792. doi:10.1016/j.icheatmasstransfer.2025.109792. [Google Scholar] [CrossRef]
20. Benaissa M, Mahdi JM, Ramezanimouziraji H, Homod RZ, Yaïci W, Talebizadehsardari P, et al. Augmenting solidification dynamics in double-pipe latent heat storage: exploring optimized curved fin configurations. Int Commun Heat Mass Transf. 2025;165:109041. doi:10.1016/j.icheatmasstransfer.2025.109041. [Google Scholar] [CrossRef]
21. Ji HY, Kang C, Park D. Experiment and prediction analysis of thermal energy storage for heat load balancing in domestic hot water system. Energy. 2024;313(3):134040. doi:10.1016/j.energy.2024.134040. [Google Scholar] [CrossRef]
22. Fukai J, Hamada Y, Morozumi Y, Miyatake O. Improvement of thermal characteristics of latent heat thermal energy storage units using carbon-fiber brushes: experiments and modeling. Int J Heat Mass Transf. 2003;46(23):4513–25. doi:10.1016/S0017-9310(03)00290-4. [Google Scholar] [CrossRef]
23. Li H, Hrnjak P. Flow visualization of R32 in parallel-port microchannel tube. Int J Heat Mass Transf. 2019;128:1–11. doi:10.1016/j.ijheatmasstransfer.2018.08.120. [Google Scholar] [CrossRef]
24. Li H, Hrnjak P. Measurement of heat transfer coefficient and pressure drop during evaporation of R134a in new type facility with one pass flow through microchannel tube. Int J Heat Mass Transf. 2017;115:502–12. doi:10.1016/j.ijheatmasstransfer.2017.07.066. [Google Scholar] [CrossRef]
25. Mauro AW, Pelella F, Viscito L. Thermal-hydraulic characterization of R513A during flow boiling inside a 6.0 mm horizontal tube, comparison with R134a and development of a new correlation. Int J Refrig. 2023;155:47–57. doi:10.1016/j.ijrefrig.2023.08.018. [Google Scholar] [CrossRef]
Cite This Article
 Copyright © 2026 The Author(s). Published by Tech Science Press.
This work is licensed under a Creative Commons Attribution 4.0 International License , which permits unrestricted use, distribution, and reproduction in any medium, provided the original work is properly cited.
 Downloads
 Citation Tools