
 Submit a Paper
 Propose a Special lssue
 Open Access
ARTICLE

A Feature Learning-Based Model for Analyzing Students’ Performance in Supportive Learning
1 Department of Computer Science and Engineering, K. S. R College of Engineering, Thiruchengode, Tamil Nadu-637215, India
2 Centre for Artificial Intelligence, Chennai Institute of Technology, Chennai, Tamil Nadu-600069, India
3 Department of Computer Science and Engineering, S. A. Engineering College, Chennai, Tamil Nadu-600077, India
* Corresponding Author: P. Valarmathie. Email:
Intelligent Automation & Soft Computing 2023, 36(3), 2989-3005. https://doi.org/10.32604/iasc.2023.028659
Received 15 February 2022; Accepted 10 June 2022; Issue published 15 March 2023
 View Full Text
 Download PDF
Abstract
Supportive learning plays a substantial role in providing a quality education system. The evaluation of students’ performance impacts their deeper insight into the subject knowledge. Specifically, it is essential to maintain the baseline foundation for building a broader understanding of their careers. This research concentrates on establishing the students’ knowledge relationship even in reduced samples. Here, Synthetic Minority Oversampling TEchnique (SMOTE) technique is used for pre-processing the missing value in the provided input dataset to enhance the prediction accuracy. When the initial processing is not done substantially, it leads to misleading prediction accuracy. This research concentrates on modelling an efficient classifier model to predict students’ performance. Generally, the online available student dataset comprises a lesser amount of sample, and k-fold cross-validation is performed to balance the dataset. Then, the relationship among the students’ performance (features) is measured using the auto-encoder. The stacked Long Short Term Memory () is used to learn the previous feedback connection. The stacked model handles the provided data and the data sequence for understanding the long-term dependencies. The simulation is done in the MATLAB 2020a environment, and the proposed model shows a better trade-off than the existing approaches. Some evaluation metrics like prediction accuracy, sensitivity, specificity, AUROC, F1-score and recall are evaluated using the proposed model. The performance of the model is compared with existing approaches. The proposed model gives 89% accuracy, 83% precision, 86% recall, and 87% F-score. The proposed model outperforms the existing systems in terms of the earlier metrics.Keywords
Numerous colleges and universities suffer from the poor performance of students in today’s world. Even though the latest standard is raised to higher education outcome-based education [1], about 40% of college students joined college for a bachelor’s degree graduate. Meanwhile, the college dropout rate attained a massive rate of 40% in 2018. Many research studies tried to expand the automated models to conquer the consequences of the circumstances that help predict students’ academic performance in higher education [2]. The forecast about the performance of the students on time provides countless advantages, which include earlier detection of students fighting to pass their courses and the students, who are at the threat of dropping out from education, pathways to select the system, and also the features which impact the rates of student retention and behaviours [3]. This kind of brilliant perception empowers educational leaders to conceive and execute the correct interference to take care of academic advising, lead the way during changes and advancement in the curriculum, and decide the risks in the program [4]. Moreover, the selection of suitable machine learning techniques is used to evaluate the performance of students correctly that endure a complicated attempt [5].
The infinite number of attributes generally influences students’ academic achievements that differ from non-academic to educational features [6] and findings to identify them. Developing a complicated predictive model is essential, having the variability of the attributes. The individual learning modes are proven by the ensemble learning model, a hybrid learning model, which outperforms student academic performance prediction accuracy [7]. However, the latest research shows that about 50% of the researchers use supervised learning approaches. At the same time, about 5% of the studies employ unsupervised learning algorithms [8]. It is important to note that a supervised machine learning algorithm contributes adequate prediction accuracy [9]. Moreover, it is notable that increasing the supervised learning approaches will generate better accurate predictions than believing an unsupervised model with some commonly defined errors. Moreover, the prevailing model combines the effects of unsupervised and supervised learning algorithms.
The accessible algorithms and techniques enhance accuracy in predicting students’ performance [10]. There is a shortage in producing the descriptive examination of the available attributes that are variables that causes the execution of observed student. In addition, depending on the single technique, if this technique is non-linear or linear, that can be inadequate because of the challenges in obtaining multiple numbers of attributes in a single predictor technique [11]. Student performances are affected by the features that frequently vary between students and academic semesters for a similar set of students. Single linear modes usually suffer from the data that are under fitted to eliminate the ambiguity on the trained data that consists of multiple overlapping behaviours among the students leading to a greater rate of wrong predictions. At the same time, with non-linear models, the fake predictions will become high likelihood that the risk of overfitting problem is the factor of the data on that they are qualified [12]. This model will remember a few characteristics of behaviour only.
However, a solution in ensemble machine learning does not contain the contribution weighted dynamically to predict the students’ performance using participating techniques. Furthermore, restrictions concern the misuse of the training dataset or utilizing a single data set to approve the model [13]. The limits, as mentioned earlier, are addressed by contributing deep learning techniques to identify the enabled attributes and the factors which block the performance in the academic courses [14]. However, few models concentrate on the accomplishment of first-year students only on prediction (for example, [15]). Above 50% of the researchers utilized Artificial Neural Network (ANN) and Support Vector Machine (SVM) approaches to predict the performances. However, many associated techniques are available to confine in predicting the grades of future courses and are not related to the critical attributes that lead to the attained performance of students. Pupils’ accomplishments should be improved, and reducing dropout challenges from education is achieved by understanding the effect of enabled and interdicting attributes based on our perception. The suggested technique is eminent by the clustering attributes, which requires understanding the related features that lead to predicting future course grades. A proposed approach helps boost the accuracy of prediction on the same depending on the grades and the identification of necessary attributes that can cause the accomplishments of observed students. The strengths and weaknesses of the program are initiated using the group of features and the environments that are assumed to get latent or direct consequences in the results of academic students. Specifically, this research offers the major benefaction that includes:
■ Here, an online accessible dataset of students is taken and considered an input to the predictor model.
■ The imbalanced dataset with (minority or majority samples) is balanced using the pre-processing step known as SMOTE. Later, the features are analyzed with word embedding and auto-encoders, where the learnt features play a substantial role in enhancing the prediction accuracy.
■ Finally, the classification process is done with a stacked LSTM model, where the network model learns the initial state to measure the performance. The simulation is done with MATLAB 2020a environment, and various metrics like precision, accuracy, recall and F1-score are evaluated and compared with multiple prevailing approaches.
The exhaustive performance evaluation is performed with the help of various metrics of the paradigm instead of the prediction approaches for the performance of initial students with seven standard illustration data sets. The experimental outcome establishes the efficiency of performance and our predictive models with efficient advantages.
We discussed the associated work from two essential viewpoints since our study concentrates on computer-based predictive analysis. The first step introduces the fundamental ideas that describe academic performance. The second step explores the modern techniques which help predict and explain those.
Commonly, the data analytics on the academic information evolves two crucial aspects: learning analytics and predictive analytics [16]. Learning analytics helps gather and analyze the learning information, and the circumstance needs to enhance the learning process results. Moreover, predictive analytics helps student learning prediction and finds the failure rates performance, and insists that the course can obtain better outcomes in the future [17]. However, data mining techniques resolve the association between attributes and learning [18]. For instance, the cumulative grade point scores of the student are not reflected by ethnicity. At the same time, the requirements of cognitive university admission do not accurately explain the performance, proposing the non-academic attributes that provide an essential part of learning. Our study tries to enhance the performance prediction and describe the attained forecast, applying predictive and explanatory modelling. The current study explains performance as a proficiency scale in future programs [19]. It is important to note that estimation of excellence is a remarkable aim to conquer continuing problems in higher education. This aim includes low academic grades, failure and dropouts from education have been increased and extended time of graduation between students. The past semester grades and present coursework tests like midterms, assignments, projects, and final exams are considered to determine the achievements. Moreover, consecutive tasks are examined the influence of non-academic features like demographics of students and status of socio-economic on the successes of students [20]. The tests utilize the learning results less often despite their significance in estimating student performance. Previous conclusions denote the various entwined attributes that influence the performance and the accurate prediction with the enhancement of the refined techniques.
Prediction in higher education is a worthy task to achieve strategic advantages like the advancement of quick warning and the recommended methods to select the course path, the identification of unfortunate behaviour of students, and the automation of education program assessments [21]. Moreover, the exact prediction of student academic accomplishments is a complex study requiring a deep knowledge of all characteristics and the environments surrounding the student and their learning circumstance [9]. However, student performance prediction evolves to discover their activities, and the choice and different powerful academic and non-academic attributes are considered [22]. Moreover, the present summaries are not satisfactory; even now, it is noted that (i) single learning techniques provide low prediction accuracy; the attributes that lead to the noticed academic performance are recognized or determined insufficiently [23]. This study focuses on interconnecting the main difference.
For example, few studies have gone above predicting course grades to identify endangered students. Moreover, exact predictive modelling in academics is still tricky because of the data sparsity and exponentiality issues and influential classifiers like SVM. To manage, this illustrates the example that the last-mentioned provocation for the SVM [24] used a standard multivariate technique and the vector transformations to minimize the approach training period. Even though this approach has a minimum training time of about 59% approximately, the optimized algorithm attained promised accuracy of about 93% to recognize the most susceptible students with lack of success. The author in [25] expanded the productive consensual network-based deep support vector machine model in the consecutive task that denotes ICGAN-DSVM that manages the small training datasets and accurately predicts the performances. The outcomes demonstrated that family mentoring that integrates with school coaching enhances performance. Even though integrating the existing techniques such as CGAN improved the prediction by about 29%, small confirmation data sets are utilized to check the model’s performance. Many scientists indicated that learning univariate analysis and SVM produced better classification outcomes in project grades while the small datasets are trained like in the scenario of postgraduate courses [26]. Moreover, the research concentrates on predicting the students who may fail in future programs and does not fully describe the attributes that lead to the failure.
The researchers proposed a technique for genetic programming to find underperformed students, especially those who feel challenged by socio-economic demerits. Students’ data are gathered from different origins in this technique, which strengthens the response commended to the decision-makers. Moreover, the suggested architecture does not find the attributes that lead to the predicted performance. The author in [27] offers a genetic algorithm that becomes a part of an earlier warning method for identifying early dropouts from programs. The warning methods do not support the aims again beyond the feasible dropouts of students. The achievements which are predicted correctly is a complicated work involving brilliant innovative techniques that recognize the developing attributes and environments that affect student academic performance [28]. The effect of these attributes and environments might vary from one group of students to another batch and from one course to another course. The exhaustive analysis of the needed tasks exposed the gaps concerning the below areas [29]:
■ Due to the inadequate use of hybrid techniques, this technique integrates the benefits of unsupervised learning and supervised learning techniques to optimize and automate the performance of student academic prediction accuracy.
■ The existing techniques provide the inflexibility to examine myriad academic and non-academic factors that need to be considered to impact the quality of student education. Few methods help students’ accomplishments predict without relating them using the enabled attributes or feasible demerits. Meanwhile, only small subsets of efficient features are considered by others.
■ The hybrid techniques are comprised of models that do not modify the benefaction to estimate the predictions dynamically under the student’s environments.
Most prediction techniques are approved using the single dataset as an error to the approach’s viability [30–35]. The most related works are summarized in Table 1, which helps predict students’ achievements and represents their weaknesses by associating them with the research gaps.

This section provides a detailed analysis of the anticipated stacked LSTM model for exercising cooperative learning. Here, an online dataset known as students’ performance in the Exam dataset is considered for validation from Kaggle [23]. The student’s performance is measured with the stacked LSTM using the pre-processing steps like SMOTE, word embedding, and auto-encoding for the feature learning process are analyzed. The simulation is done in the MATLAB 2020a environment, and various performance metrics like precision, accuracy, recall and F1-score are evaluated and compared with multiple existing approaches.
The samples are imbalanced with diverse classes by examining the sample distribution. In the worst-case scenario, the number of samples with majority classes is ten times higher than the minority classes. However, some samples are nearer to the classification boundaries. These factors increase the complexity of the classification task and influence the model performance. Thus, data augmentation is considered a vital factor. Here, SMOTE is used as a pre-processing approach that generates synthetic data of the minority classes. However, it does not consider the significant factors related to adjacent majority classes while synthesizing the minority class data. Therefore, the classes are overlapped, and to resolve this issue, the borderlines of the data samples are given greater attention to evaluating the nearby points of the available minority class. If the minority class is labelled first, the nearest neighbours are extracted from those available samples with the minority class. Then, the set of chosen minority classes is related to the majority class. The chosen neighbours are selected and multiplied based on the distance among the samples. The nearest neighbours range from 0 to 1. These values are included with the available data samples. Thus, the synthetic models are generated based on Eq. (1):
Here,
3.2 Auto-Encoding for Feature Analysis
The auto-encoding part of NN is split into two diverse parts: encoder and decoder. It is mathematically provided as in Eqs. (2)–(4):
The network encoding part is specified with a function passed via bias parameter b, activation function σ and latent dimension z. It is shown in Eq. (5): the encoder part ϕ marks the provided original data
It is a related way of providing the NN’s decoding part, and it is represented with diverse activation functions, weight, and bias. It is expressed as in Eq. (6):
The loss function L for the provided NN is expressed using the encoding and decoding network function. It is expressed as in Eq. (7):
The objective of an auto-encoder is to choose suitable encoder and decoding functions with minimal information encoded and re-generated using the decoder with a minimal loss function. Based on the provided Eq. (7), the loss function L is used for training the NN via the standard back-propagation process. This method facilitates supervised learning by constructing cluster labels (sign and voice) using k-means clustering and the generated tags for a different purpose. The following is the step-by-step process:
■ Initially, capture the meta-data descriptive and characteristics as features and construct the feature vectors as
■ Apply the traditional k-means for feature vector clustering and predict the cluster group.
■ Consider the class groups and corresponding identifications (tags) as labels;
■ Fed the input data with corresponding feature vectors and generated labels for successive stages.
Then, construct the auto-encoder model based on NN with specific hidden neurons and layers, i.e., nodes.
■ The number of nodes over the inner layers specifies the number of clusters;
■ The number of nodes over the input layer specifies the feature size and vectors;
■ The nodes over the output layer specify the probabilistic values for the provided two datasets representing the cluster labels.
■ Then, partition the constructed data into testing/training datasets.
■ Train auto-encoder based stacked LSTM with the training dataset.
■ Predict and cluster the testing dataset labels with the trained network model.
The encoding part is accountable for predicting the sign or voice data’s most influencing or essential features. However, the encoder and decoder decrease the feature space, and the chosen features are used for clustering. The encoder then diminishes the full features from the most critical input data components. Subsequently, the decoder considers the diminished set of influencing features and intends to reconstruct initial values devoid of losing the information. The encoding pair forms the mechanism for diminishing the data dimensionality for clustering the clustered data. The objective of knowledge tracing relies on the students’ past status. While considering status, which is not connected with time series; however, it varies based on the learning ability. Generally, students learn gradually; therefore, while tracing students’ knowledge state, the consequences of time series are also considered. The learning level is updated constantly as it understands the related knowledge concept within a specific time and forgets it. Thus, the stacked LSTM model analyses the student’s sequence.
The concept of determining the multiple features with SMOTE measures the learning performance. Initially, to eliminate the unit restriction of every feature and transform it to a dimensional less and the numerical value of every sequential feature
Here,
The covariance matrix D is expressed as in Eq. (10):
The eigenvectors and their corresponding values are evaluated via D. The eigenvalues are sorted from the largest to the smallest. Thus, the corresponding eigenvectors are sorted, and this method chose the initial k highest eigenvalues and related eigenvalues to form the matrix
Here,
Here,
Here,
At
The stacked LSTM is efficiently used for resolving the gradient explosion with the set of memory units as in Fig. 1. It facilitates the network to learn the trust value of cooperative neighbourhood nodes and when to forget the prior network information of the memory unit (it holds the essential information) and provides the fact regarding when to update the memory unit with further new information. The memory unit preserves all the historical network information (pattern analysis, traffic flow, source and destination nodes, related information, cooperative details, previous network connection, and further connection establishment). All three gates manage it. This model is well suited for incoming data analysis and previously available datasets. The relationship and the dependencies among the incoming data are analyzed in time steps. To perform this function, any input dataset is considered. The dataset is partitioned into training and validation sets with

Figure 1: Block diagram of stacked LSTM model for feature learning
The fault or error over the incoming data flow is subjected to the Gaussian distribution. However, the storage assumptions are highly efficient and provide robust outcomes. Here, Gaussian probability distribution is used to identify the attributes in the presence of a specific class label. It is expressed as
Here,
4 Numerical Results and Discussion
Based on the above methodology, it is known that the anticipated model is composed of two diverse sub-tasks known as feature learning and classification. Here, 70% of data is considered for training and 30% of data is used for testing. The anticipated model adopts gradient descents for training the stacked LSTM model with a 0.01 learning rate and 100 epochs (mini-batches). The loss of function and accuracy need to be monitored. The training loss is reduced, and the accuracy is increased for all the epochs (refer to the Figs. 2 to 4). The accuracy and epochs are observed at the peak during the successive epochs. After the 10th epochs, the proposed stacked LSTM model initiates the training data optimization process. The anticipated model is trained from the beginning and evaluated during the testing process to avoid over-fitting issues. Here, cross-entropy is considered as the loss function, and it is expressed as in Eq. (26):

Figure 2: Training and validation accuracy

Figure 3: Training loss and validation loss

Figure 4: Accuracy prediction
While validating the multi-classification model, the proposed stacked LSTM model needs to produce the probability of every class where the target class possesses the highest probability. Here, y and y’ specify the expected and predicted possibility for the given label 1. The softmax function is utilized as an activation function over the stacked LSTM layers. The significant causes of using the softmax functions are to produce the probability range as an output from 0 to 1, and the sum of probabilities needs to be 1. The model alike of the softmax function makes the output in diverse ranges and aligns the result ranges from 0 to 1 while predicting the target class. The softmax function is provided at the output layer, and it is expressed as in Eq. (27):
Here,
The outcomes of the various word embedding model are depicted in Table 2. The anticipated model provides reasonable classification accuracy when word embedding is utilized as evaluated to pre-train the word. The initial layer output of feature extraction is shown in Table 2. The evaluated F1-score for feature extraction is predicted with the recall and precision of 86% and 83%, respectively. The outcomes are demonstrated for all categories. It is observed that the model shows a lesser F1-score in the evaluation category as the training instances for evaluation are lesser in number and because stacked LSTM has not learned the aspect label category. Therefore, the model provides more training samples for all the categories. Thus, the score is improved further. The performance of the successive layers during the prediction process with various recall and precision are considered for the targeted categories. The outcomes are mentioned in Table 3. The F1 values range from 87% to 90%, with an average value of 88%. The model performance is compared with some baseline investigations performed over the academic domain, as depicted in Tables. 2 and 3.


The model outperforms the baseline classifiers in feature learning and classification tasks, where the model attains 89% accuracy during the detection task and 90% accuracy in feature extraction. Some investigations evaluate the model over the standard dataset, including restaurant and laptop reviews. To validate the performance of the proposed model, it is applied over various domains by slight variation using the input and output parameters. Table 3 depicts the parameter evaluation of the standard set. It is observed that the dataset shows five diverse labelled categories and classification outcomes where the output parameters are changed based on feature learning and classification from layers 5 to 4 and 4 to 3 layers. The parameters are maintained alike in Table 3. However, some pre-processing steps (SMOTE) are applied using the benchmark dataset before feeding it to the stacked LSTM model as without these pre-processing steps. The model performance is degraded. Table 2 depicts the performance of the anticipated stacked LSTM model using the standard dataset with the various existing approaches. The model shows superior performance using the common dataset with 89% accuracy during the detection process and an F1 score of 87% during feature analysis. From all these observations (See Figs. 4–7), it is known that the model works over various feature selection and detection processes effectually.

Figure 5: Precision comparison
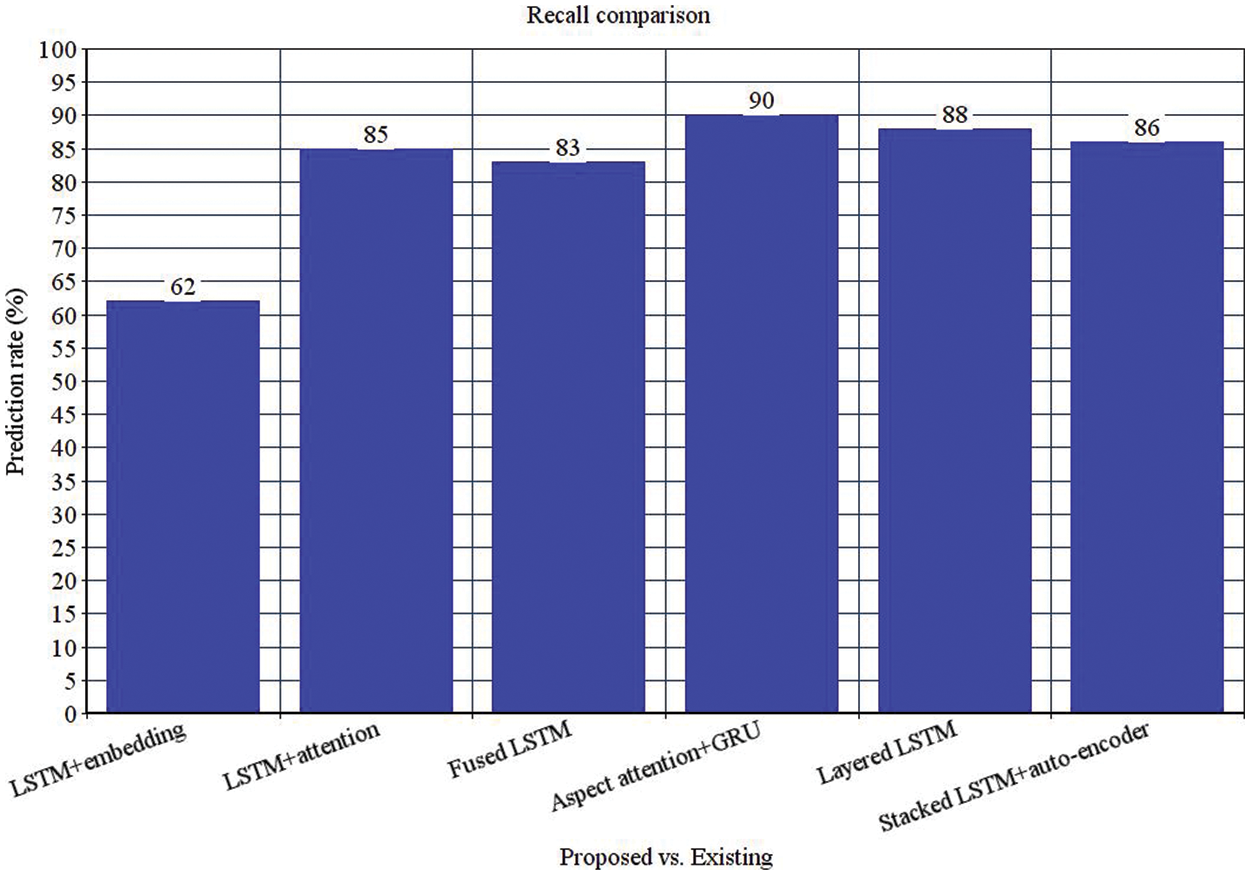
Figure 6: Recall comparison

Figure 7: F1-score comparison
The evaluation of students’ performance is done with various aspects, where some manual computation is also done in the real-time evaluation process. A novel stacked LSTM model is used for the automatic feature learning process with the available data and classification. The prediction framework applies SMOTE for pre-processing and stacked LSTM for the classification process. The features are learnt using the auto-encoder concept to measure the influencing features over the supportive learning process. The simulation is done in MATLAB 2020a environment and various metrics like accuracy, precision, F1-score and recall. The proposed model gives 89% accuracy, 83% precision, 86% recall, and 87% F-score. The proposed model offers satisfactory outcomes compared to various existing approaches. However, the model encounters constraints like data acquisition with constant labels as the classification criteria may change among the standard dataset. In the future, the construction of a real-time dataset is highly solicited to boost the performance of the proposed classifier model.
Funding Statement: The authors received no specific funding for this study.
Conflicts of Interest: The authors declare that they have no conflicts of interest to report regarding the present study.
References
1. N. Altrabsheh, M. Cocea, S. Fallahkhair and K. Dhou, “Evaluation of the SA-E system for analysis of students,” in Proc. IEEE 17th Int. Conf. on Advanced Learning Technologies (ICALT), Timisoara, Romania, pp. 60–61, 2017. [Google Scholar]
2. A. Mukherjee and B. Liu, “Aspect extraction through semi-supervised modeling,” in Proc. 50th Annual Meeting Association for Computational Linguistics, Jeju Island, Korea, vol. 1, pp. 339–348, 2012. [Google Scholar]
3. A. Cahyadi and M. L. Khodra, “Aspect-based sentiment analysis using convolutional neural network and bidirectional long short-term memory,” in Proc. 5th Int. Conf. on Advanced Informatics: Concept Theory and Applications (ICAICTA), Krabi, Thailand, pp. 124–129, 2018. [Google Scholar]
4. A. Ortigosa, J. M. Martín and R. M. Carro, “Sentiment analysis in facebook and its application to e-learning,” Computers in Human Behavior, vol. 31, pp. 527–541, 2014. [Google Scholar]
5. L. C. Yu, C. W. Lee, H. I. Pan, C. Y. Chou, P. Y. Chao et al., “Improving early prediction of academic failure using sentiment analysis on self-evaluated comments,” Journal of Computer Assisted Learning, vol. 34, no. 4, pp. 358–365, 2018. [Google Scholar]
6. F. F. Balahadia, M. C. G. Fernando and I. C. Juanatas, “Teacher’s performance evaluation tool using opinion mining with sentiment analysis,” in Proc. IEEE Region 10 Symp. (TENSYMP), Bali, Indonesia, pp. 95–98, 2016. [Google Scholar]
7. G. S. Chauhan, P. Agrawal and Y. K. Meena, “Aspect-based sentiment analysis of students’ feedback to improve teaching–learning process,” in Proc. Information and Communication Technology for Intelligent Systems, Singapore, pp. 259–266, 2019. [Google Scholar]
8. T. Young, D. Hazarika, S. Poria and E. Cambria, “Recent trends in deep learning based natural language processing,” IEEE Computational Intelligence Magazine, vol. 13, no. 3, pp. 55–75, 2018. [Google Scholar]
9. Y. Ma, H. Peng, T. Khan, E. Cambria and A. Hussain, “Sentic LSTM: A hybrid network for targeted aspect-based sentiment analysis,” Cognitive Computation, vol. 10, no. 4, pp. 639–650, 2018. [Google Scholar]
10. Z. Toh and W. Wang, “Dlirec: Aspect term extraction and term polarity classification system,” in In Proc. 8th Int. Workshop on Semantic Evaluation, Dublin, Ireland, pp. 235–240, 2014. [Google Scholar]
11. Y. Ding, J. Yu and J. Jiang, “Recurrent neural networks with auxiliary labels for cross-domain opinion target extraction,” in Proc. AAAI Conf. on Artificial Intelligence, Austin, Texas, vol. 31, no. 1, pp. 3436–3442, 2017. [Google Scholar]
12. M. Carlsson, G. B. Dahl, B. Öckert, and D. O. Rooth, “The effect of schooling on cognitive skills,” Review of Economics and Statistics, vol. 97, no. 3, pp. 533–547, 2015. [Google Scholar]
13. S. J. Ritchie, T. C. Bates and I. J. Deary, “Is education associated with improvements in general cognitive ability, or in specific skills?,” Developmental Psychology, vol. 51, no. 5, pp. 573, 2015. [Google Scholar] [PubMed]
14. C. Granberg and J. Olsson, “ICT-Supported problem solving and collaborative creative reasoning: Exploring linear functions using dynamic mathematics software,” The Journal of Mathematical Behavior, vol. 37, pp. 48–62, 2015. [Google Scholar]
15. D. Tod, C. Edwards, M. McGuigan and G. Lovell, “A systematic review of the effect of cognitive strategies on strength performance,” Sports Medicine, vol. 45, no. 11, pp. 1589–1602, 2015. [Google Scholar] [PubMed]
16. I. Fister, P. N. Suganthan, S. M. Kamal, F. M. Al-Marzouki, M. Perc et al., “Artificial neural network regression as a local search heuristic for ensemble strategies in differential evolution,” Nonlinear Dynamics, vol. 84, no. 2, pp. 895–914, 2016. [Google Scholar]
17. A. Daud, N. R. Aljohani, R. A. Abbasi, M. D. Lytras, F. Abbas et al., “Predicting student performance using advanced learning analytics,” in Proc. 26th Int. Conf. on World Wide Web Companion, Perth, Australia, pp. 415–421, 2017. [Google Scholar]
18. K. R. Koedinger, A. T. Corbett and C. Perfetti, “The knowledge-learning-instruction framework: Bridging the science-practice chasm to enhance robust student learning,” Cognitive Science, vol. 36, no. 5, pp. 757–798, 2012. [Google Scholar]
19. A. M. Shahiri, W. Husain and N. A. Rashid, “A review on predicting student’s performance using data mining techniques,” Procedia Computer Science, vol. 72, pp. 414–422, 2015. [Google Scholar]
20. J. McLurkin, J. Rykowski, M. John, Q. Kaseman and A. J. Lynch, “Using multi-robot systems for engineering education: Teaching and outreach with large numbers of an advanced, low-cost robot,” IEEE Transactions on Education, vol. 56, no. 1, pp. 24–33, 2013. [Google Scholar]
21. J. L. M. Nunez, E. T. Caro and J. R. H. Gonzalez, “From higher education to open education: Challenges in the transformation of an online traditional course,” IEEE Transactions on Education, vol. 60, no. 2, pp. 134–142, 2017. [Google Scholar]
22. J. Y. Chung and S. Lee, “Dropout early warning systems for high school students using machine learning,” Children Youth Services Review, vol. 96, pp. 346–353, 2019. [Google Scholar]
23. J. Kuzilek, M. Hlosta, D. Herrmannova, Z. Zdrahal and A. Wolff, “OU analyse: Analysing at-risk students at the open university,” Learning Analytics Review, vol. 8, pp. 1–16, 2015. [Google Scholar]
24. Y. Cui, F. Chen and A. Shiri, “Scale up predictive models for early detection of at-risk students: A feasibility study,” Information and Learning Sciences, vol. 121, no. 3–4, pp. 97–116, 2020. [Google Scholar]
25. T. Soffer and A. Cohen, “Students’ engagement characteristics predict success and completion of online courses,” Journal of Computer Assisted Learning, vol. 35, no. 3, pp. 378–389, 2019. [Google Scholar]
26. R. Baker, B. Evans, Q. Li and B. Cung, “Does inducing students to schedule lecture watching in online classes improve their academic performance? an experimental analysis of a time management intervention,” Research in Higher Education, vol. 60, no. 4, pp. 521–552, 2019. [Google Scholar]
27. J. M. Lim, “Predicting successful completion using student delay indicators in undergraduate self-paced online courses,” Distance Education, vol. 37, no. 3, pp. 317–332, 2016. [Google Scholar]
28. S. Lee and J. Y. Chung, “The machine learning-based dropout early warning system for improving the performance of dropout prediction,” Applied Sciences, vol. 9, no. 15, pp. 3093, 2019. [Google Scholar]
29. A. Behr, M. Giese and K. Theune, “Early prediction of university dropouts—A random forest approach,” Jahrbücher für Nationalökonomie und Statistik, vol. 240, no. 6, pp. 743–789, 2020. [Google Scholar]
30. A. Ortigosa, R. M. Carro, J. Bravo-Agapito, D. Lizcano, J. J. Alcolea et al., “From lab to production: Lessons learnt and real-life challenges of an early student-dropout prevention system,” IEEE Transactions on Learning Technologies, vol. 12, no. 2, pp. 264–277, 2019. [Google Scholar]
31. W. Sun, G. Z. Dai, X. R. Zhang, X. Z. He and X. Chen, “TBE-Net: A three-branch embedding network with part-aware ability and feature complementary learning for vehicle re-identification,” IEEE Transactions on Intelligent Transportation Systems, pp. 1–13, 2021. https://doi.org/10.1109/TITS.2021.3130403 [Google Scholar] [CrossRef]
32. W. Sun, L. Dai, X. R. Zhang, P. S. Chang, and X. Z. He, “RSOD: Real-time small object detection algorithm in UAV-based traffic monitoring,” Applied Intelligence, pp. 1–16, 2021. https://doi.org/10.1007/s10489-021-02893-3 [Google Scholar] [CrossRef]
33. P. Sushmitha, “Face Recognition Framework based on Convolution Neural Network with modified Long Short Term memory Method,” Journal of Computational Science and Intelligent Technologies, vol. 1, no. 3, pp. 22–28, 2020. https://doi.org/10.53409/mnaa.jcsit20201304 [Google Scholar] [CrossRef]
34. M. B. Sudhan, T. Anitha, M. Aruna, G. C. P. Latha, A. Vijay et al., “Weather forecasting and prediction using hybrid C5.0 machine learning algorithm,” International Journal of Communication Systems, vol. 34, no. 10, pp. e4805, 2021. https://doi.org/10.1002/dac.4805 [Google Scholar] [CrossRef]
35. R. Khilar, K. Mariyappan, M. S. Christo, J. Amutharaj, T. Anitha et al., “Artificial Intelligence-based security protocols to resist attacks in Internet of Things,” Wireless Communications and Mobile Computing, vol. 2022, no. 1440538, pp. 1–10, 2022. https://doi.org/10.1155/2022/1440538 [Google Scholar] [CrossRef]
Cite This Article
 Copyright © 2023 The Author(s). Published by Tech Science Press.
This work is licensed under a Creative Commons Attribution 4.0 International License , which permits unrestricted use, distribution, and reproduction in any medium, provided the original work is properly cited.
 Downloads
 Citation Tools