
 Submit a Paper
 Propose a Special lssue
 Open Access
ARTICLE

Artificial Neural Network-Based Development of an Efficient Energy Management Strategy for Office Building
Department of ECE, SRMIST, Kattankulathur, Chennai, 603203, India
* Corresponding Author: J. Subhashini. Email:
Intelligent Automation & Soft Computing 2023, 37(1), 1225-1242. https://doi.org/10.32604/iasc.2023.038155
Received 29 November 2022; Accepted 20 February 2023; Issue published 29 April 2023
 View Full Text
 Download PDF
Abstract
In the current context, a smart grid has replaced the conventional grid through intelligent energy management, integration of renewable energy sources (RES) and two-way communication infrastructures from power generation to distribution. Energy management from the distribution side is a critical problem for balancing load demand. A unique energy management strategy (EMS) is being developed for office building equipment. That includes renewable energy integration, automation, and control based on the Artificial Neural Network (ANN) system using Matlab Simulink. This strategy reduces electric power consumption and balances the load demand of the traditional grid. This strategy is developed by taking inputs from an office building electricity consumption behavior study, a power generation study of a solar photovoltaic system, and the supply pattern of a grid in peak and non-peak hours. All this is done in consideration of the Indian scenario, where real-time data of month-wise ANN-based intelligent switching has been established for intermittent renewable sources and peak load reduction, as well as average load reduction, has been demonstrated along with the power control loop without the battery system.Keywords
Commercial and residential buildings account for over 60% of energy uses in India, most of which are old structures. Power is being supplied through conventional grid systems, where the demand is fluctuating and uncertain [1]. Managing variable energy demands by consumers is a real challenge in traditional grid systems; a typical building appliance uses more power consumption with manual running operations and controls. On the other hand, intelligent building management includes various automation and controls, occupancy detection management, humidity control, temperature control, and renewable energy infrastructure management systems [2]. The energy management system of a building appliance depends on the proper operations and maintenance of equipment and balanced uses during peak and off-peak hours of demand. Managing variable energy demands and equipment operation controls is convenient with intelligent building management systems. In these systems, solar photovoltaic energy infrastructures play a vital role [3]. It has low carbon emissions and provides clean energy. Solar energy generation depends on weather conditions, solar irradiance, and cell temperature. Nevertheless, it has certain limitations in the rainy season; solar energy generation is lower than in other seasons. So an energy management system must use a comprehensive smart-choice approach based on artificial intelligence, which plays an essential role in energy decision-making with automatic operation controls of equipment and a combination of power supply from utility grid supply and renewable energy sources. It will avoid unpredicted faults, balance the grid’s load demand, and reduce daily electricity consumption [4]. Sustainable power management strategies between power generation and consumption with artificial intelligence control are required to utilize produced energy best and meet consumers’ energy demands [5,6]. Fig. 1 shows the smart grid energy management system.
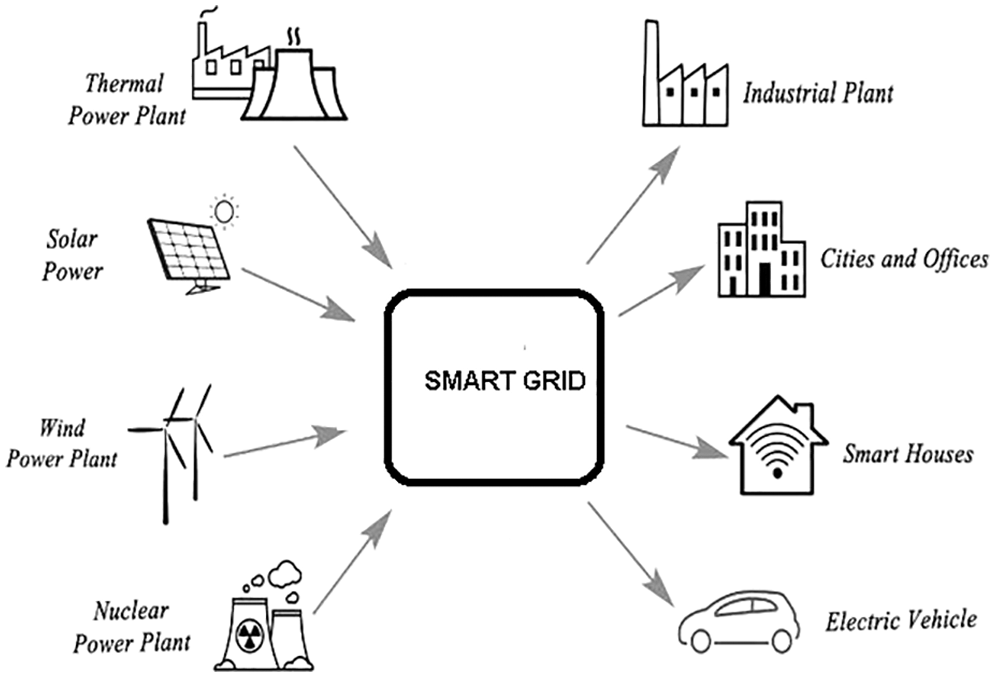
Figure 1: Smart grid energy management system
Shareef et al. [7] reviewed the microgrid energy management system in depth. The critical components of a microgrid system are compared. Distribution and control methods are discussed in distributed and centralized grid systems. Rafique et al. [8] looked at demand response (DR), intelligent technologies, and intelligent controllers in the context of home energy management systems (HEMS). The HEMS system’s residential demand response and the ANN system’s load scheduling applications are compared. Khan et al. [9] reviewed HEMS, load prediction, and monitoring of micro grids and renewable sources. As discussed by Khan et al., multi-agent systems are considered in distributed microgrid EMS [10]. Sendra-Arranz et al. [11] investigated the control of HVAC systems in smart homes using recurrent generative adversarial networks. Additionally, an LSTM ANN for HVAC systems’ daily building power consumption was established by Elnour et al. [12]. It uses optimal Pearson correlation coefficients and low error between the predicted and consumed values to obtain real-time output, as proposed by Hafeez et al. [13]. De et al. proposed a building occupancy prediction algorithm to maximize thermal, visual, and air quality comfort while minimizing energy consumption [14]. Dong et al. proposed in [15] a merged PEC with model predictive control to reduce HVAC energy consumption while increasing user comfort for short-term occupancy prediction. For optimization, a nature-inspired metaheuristic technique is used. Three types of responsive loads were considered, viz., residential, commercial, and industrial, which participated in DRP only during the summer and winter seasons, as taken into account by Kalaimani [16]. In the earlier work, a model was created for the energy management of an office Heating, Ventilation and Air Conditioning (HVAC) system using a fuzzy logic controller. In this proposed work, we have developed energy management strategies by analyzing the power consumption patterns of different appliances during an entire year. To reduce the load on the distribution side grid without impacting the load requirements. We have developed a MATLAB Simulink-based model by integrating the RES and an ANN controller. Temperature sensing, occupant comfort, load demand, and occupancy pattern in the office are inputs for developing the algorithm and energy management strategy, which will reduce the total power consumption and help achieve sustainable development energy management goals.
In the proposed work, four offices were selected from a commercial complex. Each office has an HVAC system and other essential equipment required for comfortable working conditions. These offices are considered to study power consumption and occupancy patterns in each season for the selected location. Using control strategies and the RES system, we have controlled the dependent variables, such as visibility, office temperature, and humidity, each season at a chosen location. Variation in the power consumption pattern depends on independent variables, such as occupancy, peak hour load variation, seasonal temperature, humidity, sunlight variations, etc. The power consumption is calculated in the first stage due to non-controllable variables. MATLAB Simulink software simulates an energy management model with various proposed strategies in the second stage. The flow of the proposed work is shown in Fig. 2.
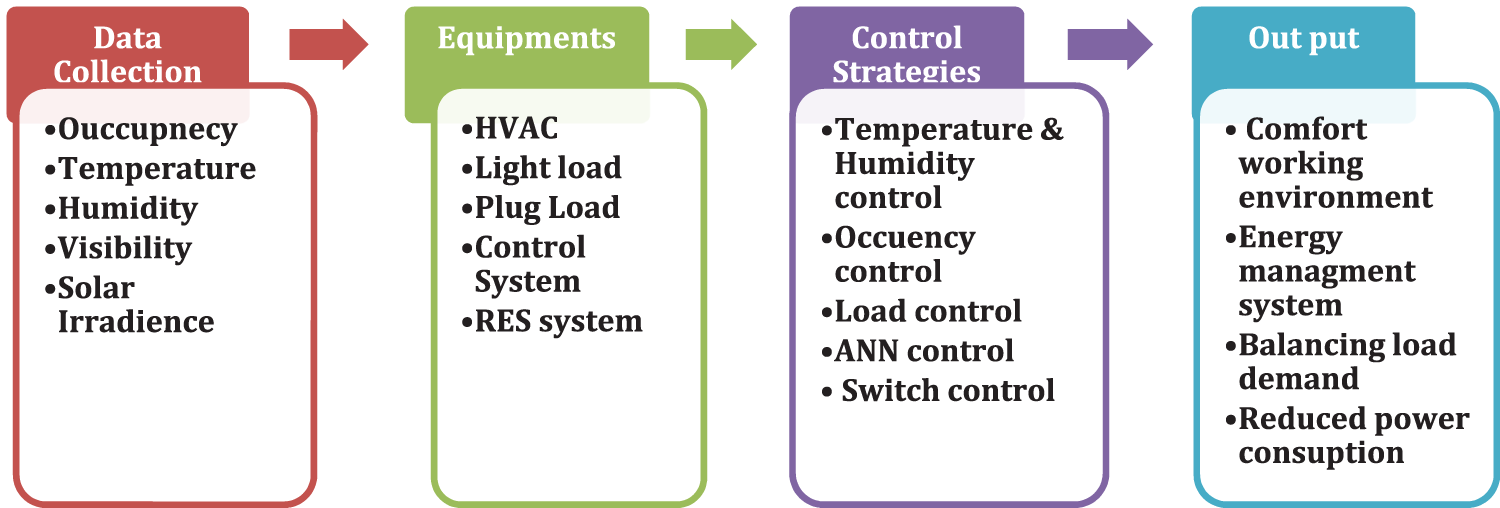
Figure 2: Energy management methodologies
3.1 Site Selection and Data Collection
Four offices were selected for developing an energy management control strategy in a commercial complex in Indore, M.P., India. Outside and inside the Office, environmental data were collected. These data include the daily and monthly weather conditions and outdoor environment temperature variations directly affecting the HVAC work. Also, solar irradiation and cell temperature data were collected to analyze the actual power generated by photovoltaic solar panels. Solar irradiance, cell temperature, wind pressure and climate condition every month in a year for season-wise power consumption analysis has been taken from the Government website [17]. Data analysis and categorization are shown in Fig. 3.
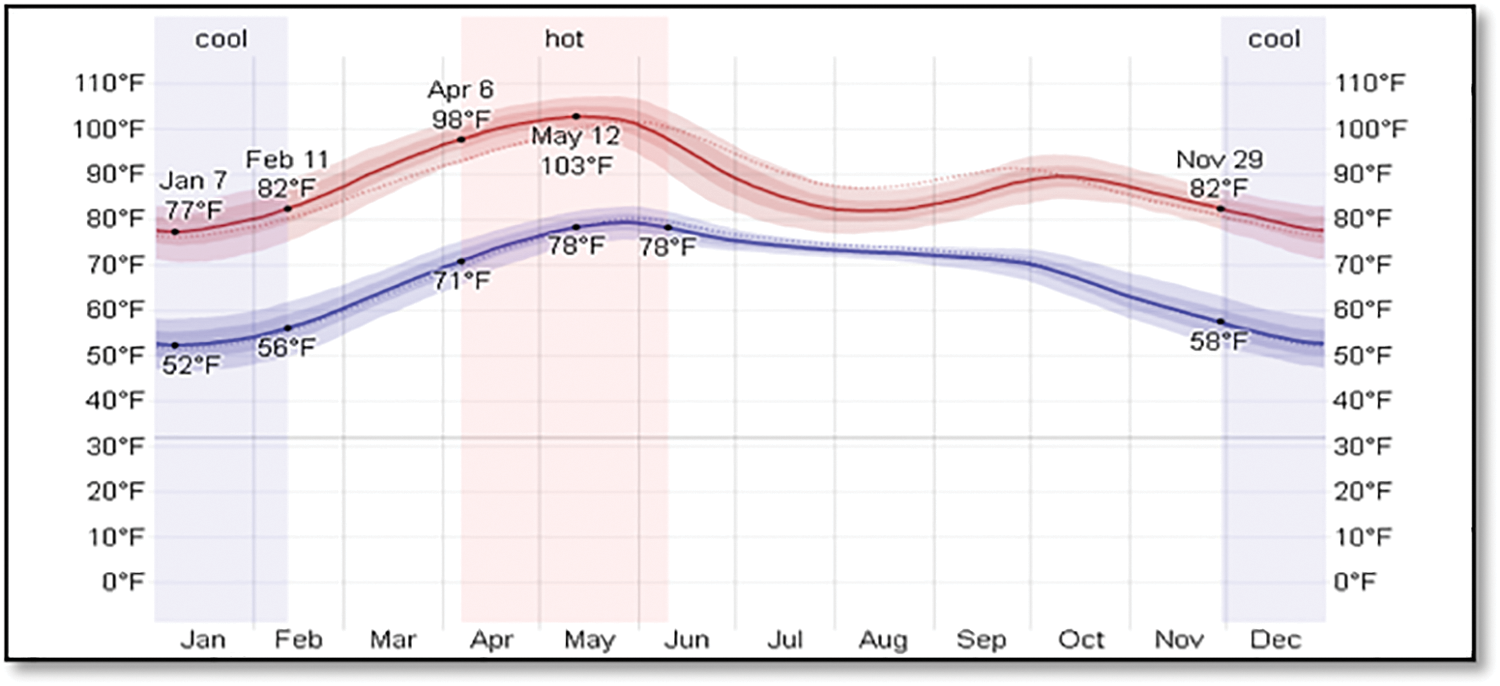
Figure 3: Temperature variation month-wise
With this data analysis, the power generated by RES is recorded. Also, the heat load is recorded for the HVAC system. Day-wise office occupancy and visibility data were collected.
3.2 Study of Environmental Parameter for Energy Analysis
The difference between comfort and the non-comfort zone is required for energy analysis and equipment’s power requirements. Fig. 3 shows the hourly change in climatic conditions for every month. With the help of these data, occupant’s comfort zone and the limits of environmental parameters can be fixed. Equipment and HVAC power consumption and power generation from renewable energy sources depend upon variations in climatic conditions, i.e., temperature, humidity and solar irradiance. Data are collected for the Indore location from M.P. Government’s website to investigate the impact of variation in external environmental conditions. Indore location is selected for study because variation in the climatic condition is available in all seasons [18] Shown in Fig. 4. These datasets create a Simulink block for monthly temperature and solar radiation variations during office hours. It will be helpful in actual RES system power generation and temperature setting for HVAC.
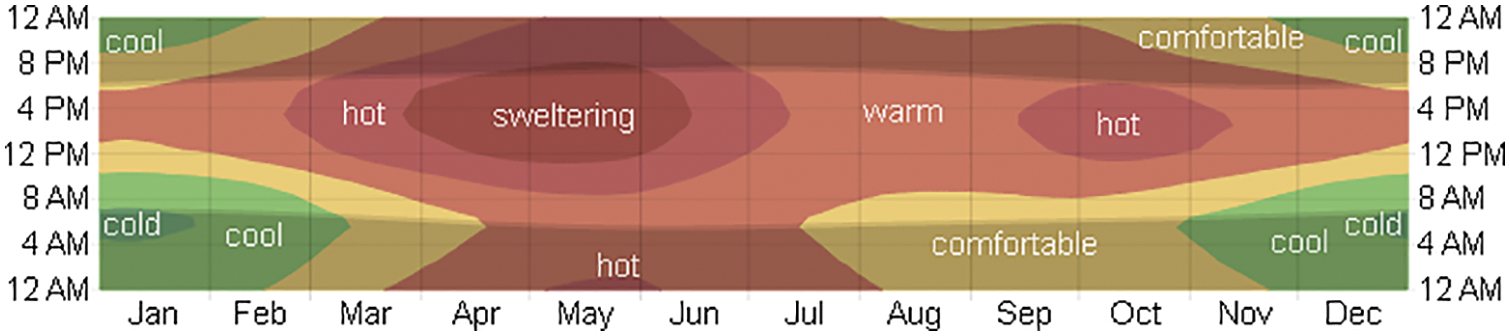
Figure 4: Climate conditions of Indore, Madhya Pradesh
3.3 Energy Consumption by Equipment
Environmental parameters, i.e., temperature, humidity, lux level and air flow rate, influence the comfort level of occupants. HVAC System, lighting and plug equipment are primary office equipment, which brings environmental parameters into the comfort zone of occupants [19].
3.3.1 Energy Consumed by HVAC System
In Fig. 5 Thermal model of the HVAC system is depicted. Energy consumed by HVAC systems is calculated based on the fundamental principles of thermodynamics [20,21].
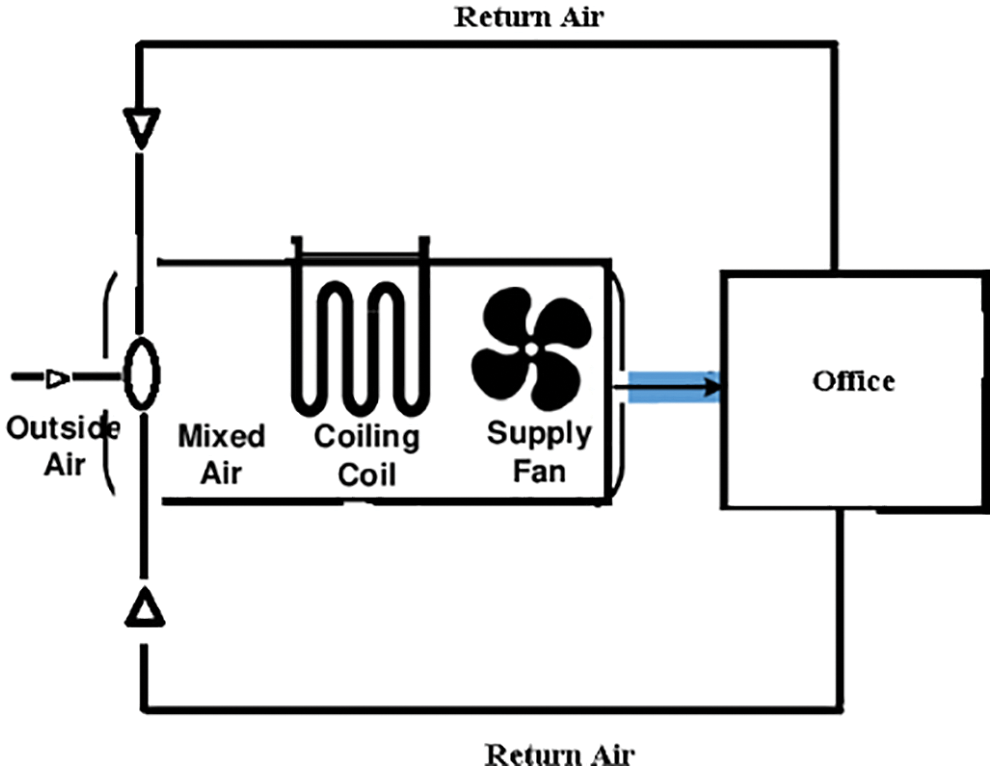
Figure 5: HVAC system
Energy consumption by HVAC system EHVAC is derived from
COPh; Coefficient Of Performance, SEER; Seasonal Energy Efficiency Ratio, qout ;Heat energy output, qH; energy Input, EHVAC; Energy consumption by HVAC system, mair; Air Volume Flow Rate, Cah; Air Heat Capacity, tHVAC; HVAC temperature, tOFC; Office Temperature and Efan; Fan Efficiency [20,22]. According to the established criteria, the average power consumption of each HVAC system in the workplace is 9000 btu/h. The power consumption was computed without any strategy for the office working period of 8:00 a.m. to 6:00 p.m., for 10 h each day [22].
3.3.2 Energy Consumed by Office Equipments
Power consumed during office hours by different lights and plug loads are analyzed. So the total energy consumed by the office is written as [22]
In Eq. (1) El; energy consumption by lighting loads, N; no. of office in the building, l = 1, 2, 3….., n; no of lights in each office, Pl; power consumed by n lights in tl working hours [20,22]. So, total energy consumed by office equipment
Integration of renewable sources of energy in the traditional grids plays a vital role in meeting the load demand [23]. A solar photovoltaic system is considered a renewable energy source for the alternate power supply from the grid to office appliances shown in Fig. 6 [21,24]. The lifelong benefits of continuous power generation outweigh the one-time installation cost. Rainy seasons and unfavorable weather are rare instances where RES electricity generation is decreased [23,25].
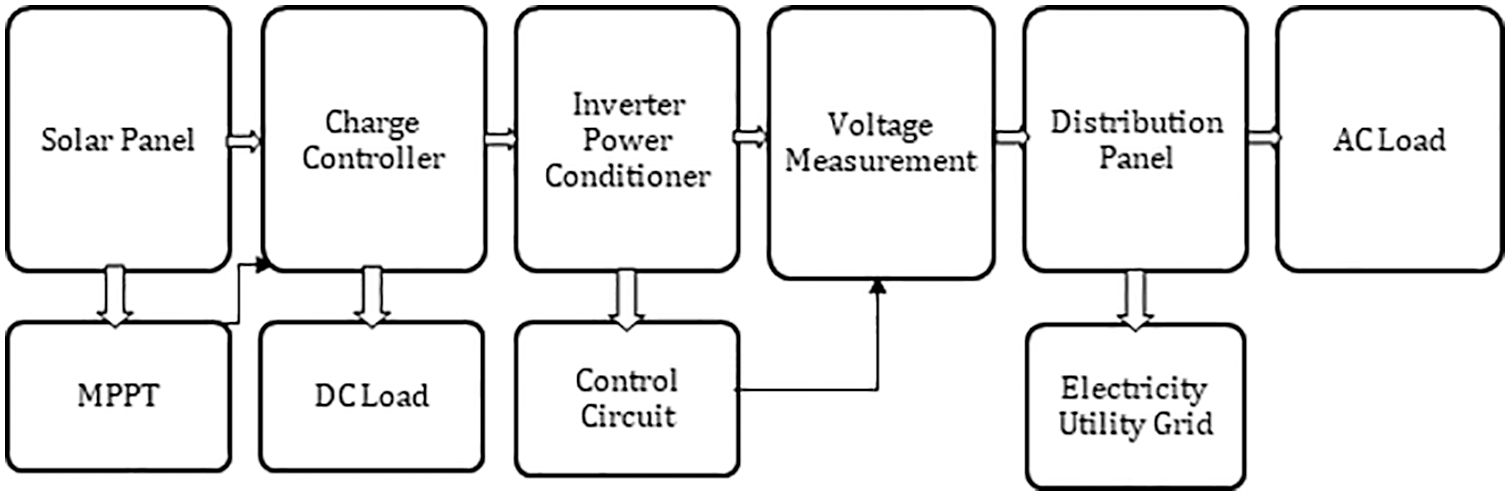
Figure 6: Renewable energy power generation block diagram
The neural network has some salient features such as non-linearity, parallel distribution processing, input-output mapping, learning with experience, fault tolerance,multi-variable implementation, etc. Artificial neural network trains to recognize datasets and predict future measures by learning from input data [26]. The main elements of the neuron model are interconnection weights, summing function and transfer function [27]. In proposed work three layers ANN has been designed for energy management decision shows in Fig. 7.
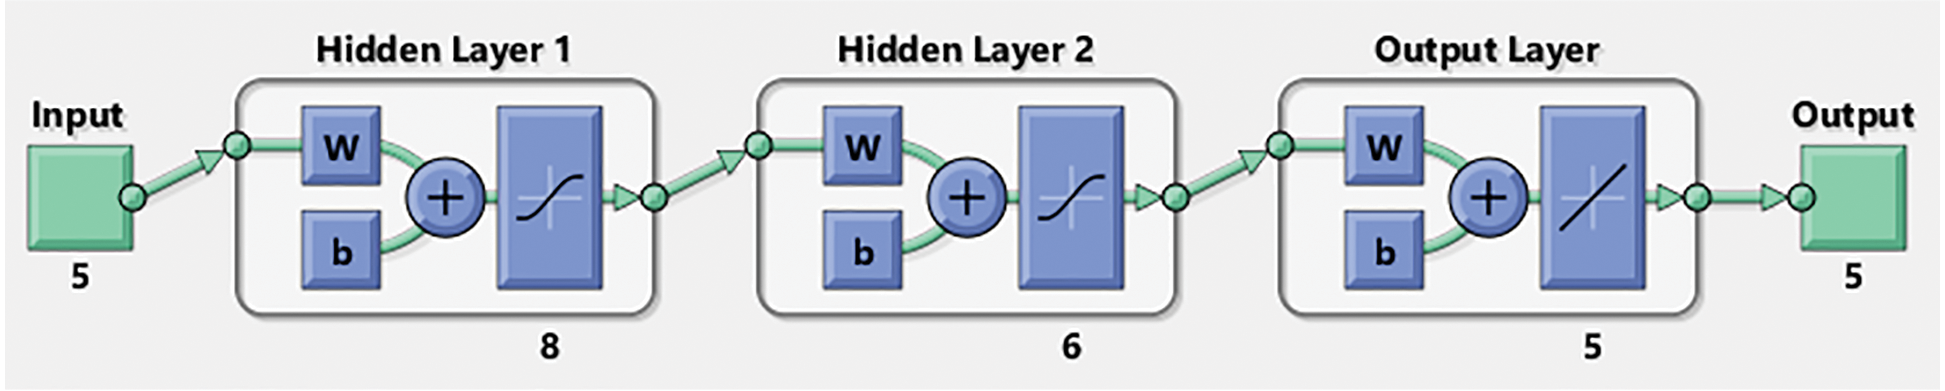
Figure 7: ANN system for energy management
One weight function and one transfer function for each input feature are randomly adjusted here. The proposed ANN system includes three hidden layers [28]. The output characteristic equation is
The input signal is represented by
The proposed work has established ANN-based smart switching control for intermittent renewable energy sources. It will be helpful in Peak load reduction as well as average load reduction. The ANN controller has undergone K-fold cross-validation for that purpose, Different scenarios’ outcomes have been taken into account. Fig. 8 depicts a comprehensive block design of an office building with suggested strategies.
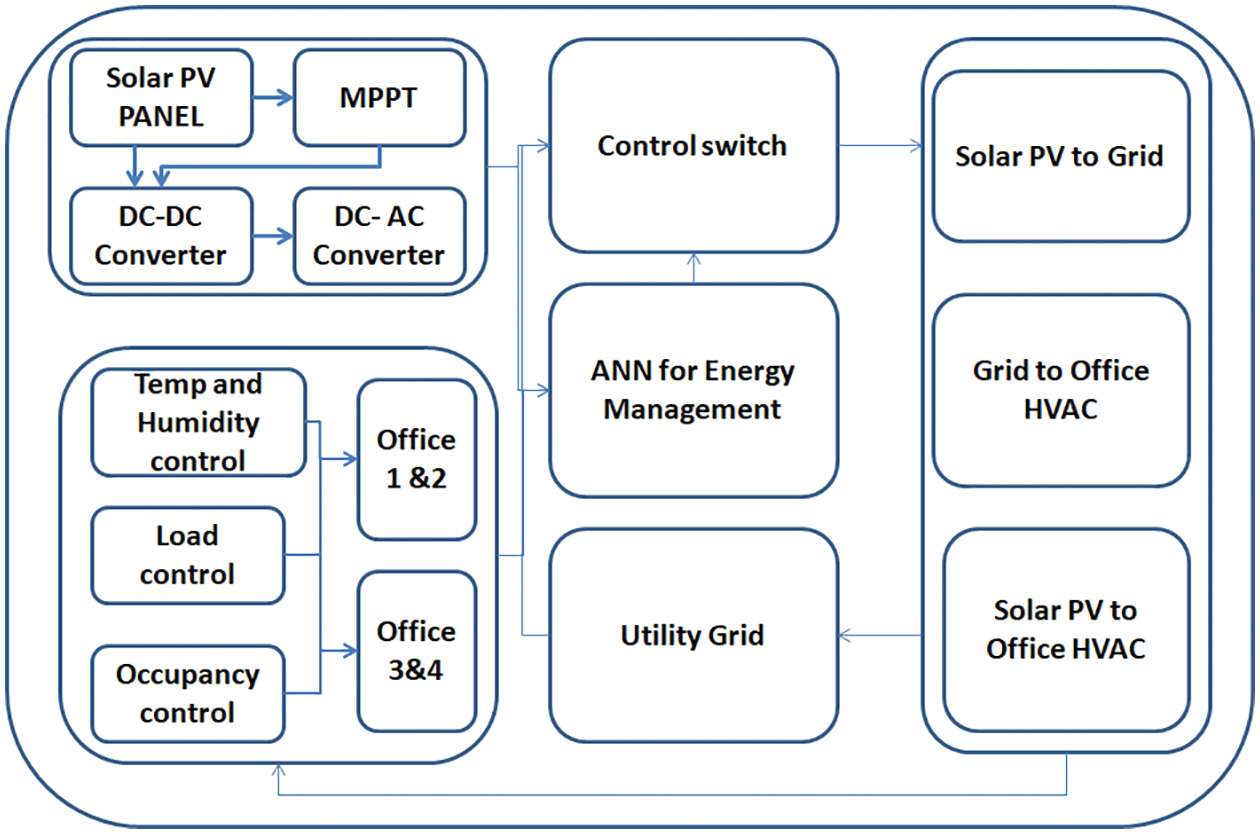
Figure 8: Complete block diagram for energy management
During manual operation control of the building energy management system, the Power consumption patterns of the HVAC system and Light and plug load were recorded. Based on these records following strategies were developed and simulated.
The strategy is developed for HVAC operations to maintain the indoor temperature and humidity in the comfort zone. For load control, a threshold value of power is fixed. Each Office has occupancy sensors installed to assess whether or not the office is occupied. In Eqs. (8) and (9), Kocp represents the occupancy state, threshold power is represented by w in watts and tC, tM and tH is set as cold, medium and hot temperatures to establish the HVAC temperature for the office. If office appliances consume power above the threshold power value w, then the HVAC system must function at a medium temperature and the office is partially filled. If
In Eq. (13) to (17), Power consumption is higher in the summer and winter to maintain the work environment in the comfort zone. The overall energy analysis for the summer and winter seasons is analyzed here. The energy savings using this approach for summer EHW and winter ECW were analyzed for T hours in n days for both the summer and winter seasons. SHF plays a vital function. Other seasons’ energy usage, such as spring, autumn, and rain, can be calculated by setting the value of SHF [22].
4.2 Strategy for Light and Plug Load
According to Eqs. (18) and (19), occupancy in offices, power will supply to the lights and plug load. The total energy consumption by light load EL in n hours is written [20]. Fig. 9 depicts the occupancy state. Offices 1 and 2 occupancy pattern is slightly changing than offices 3 and 4.
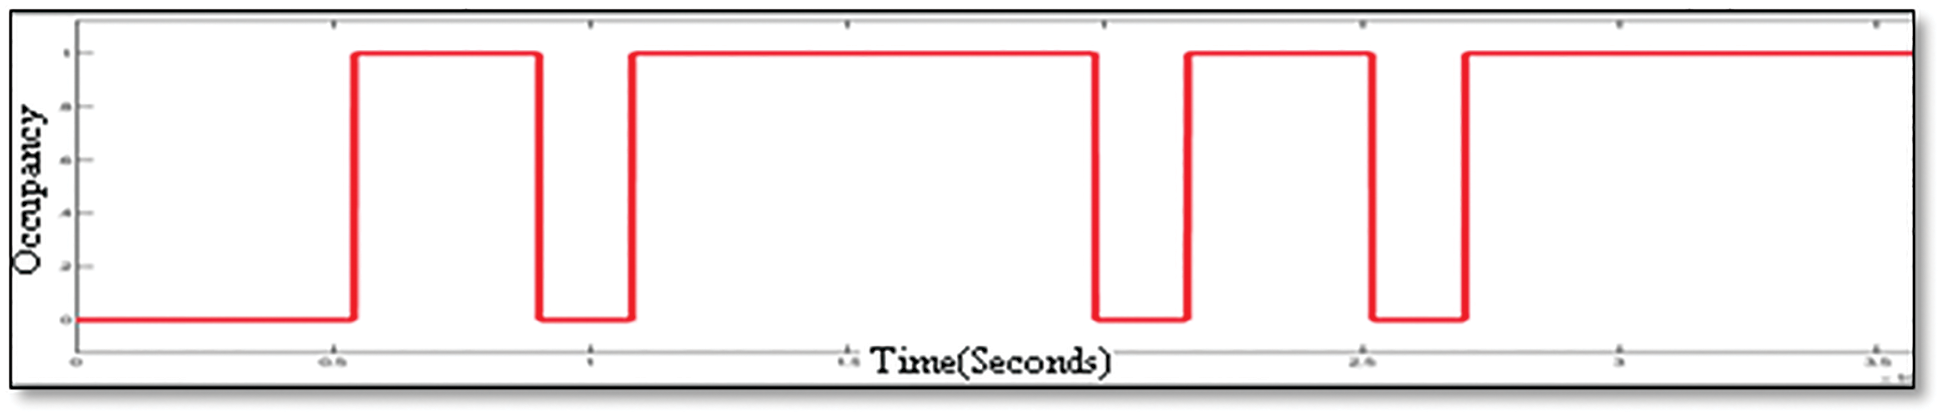
Figure 9: Office occupancy of office 3 and 4
4.3 Strategy for ANN Controller
In Fig. 10, a feed-forward-back propagation neural network with three hidden layers has been used to train the best possible power distribution. Power consumption patterns by equipment’s dataset have been generated—these datasets are used for training and testing of efficient power distribution of power according to load demand patterns.
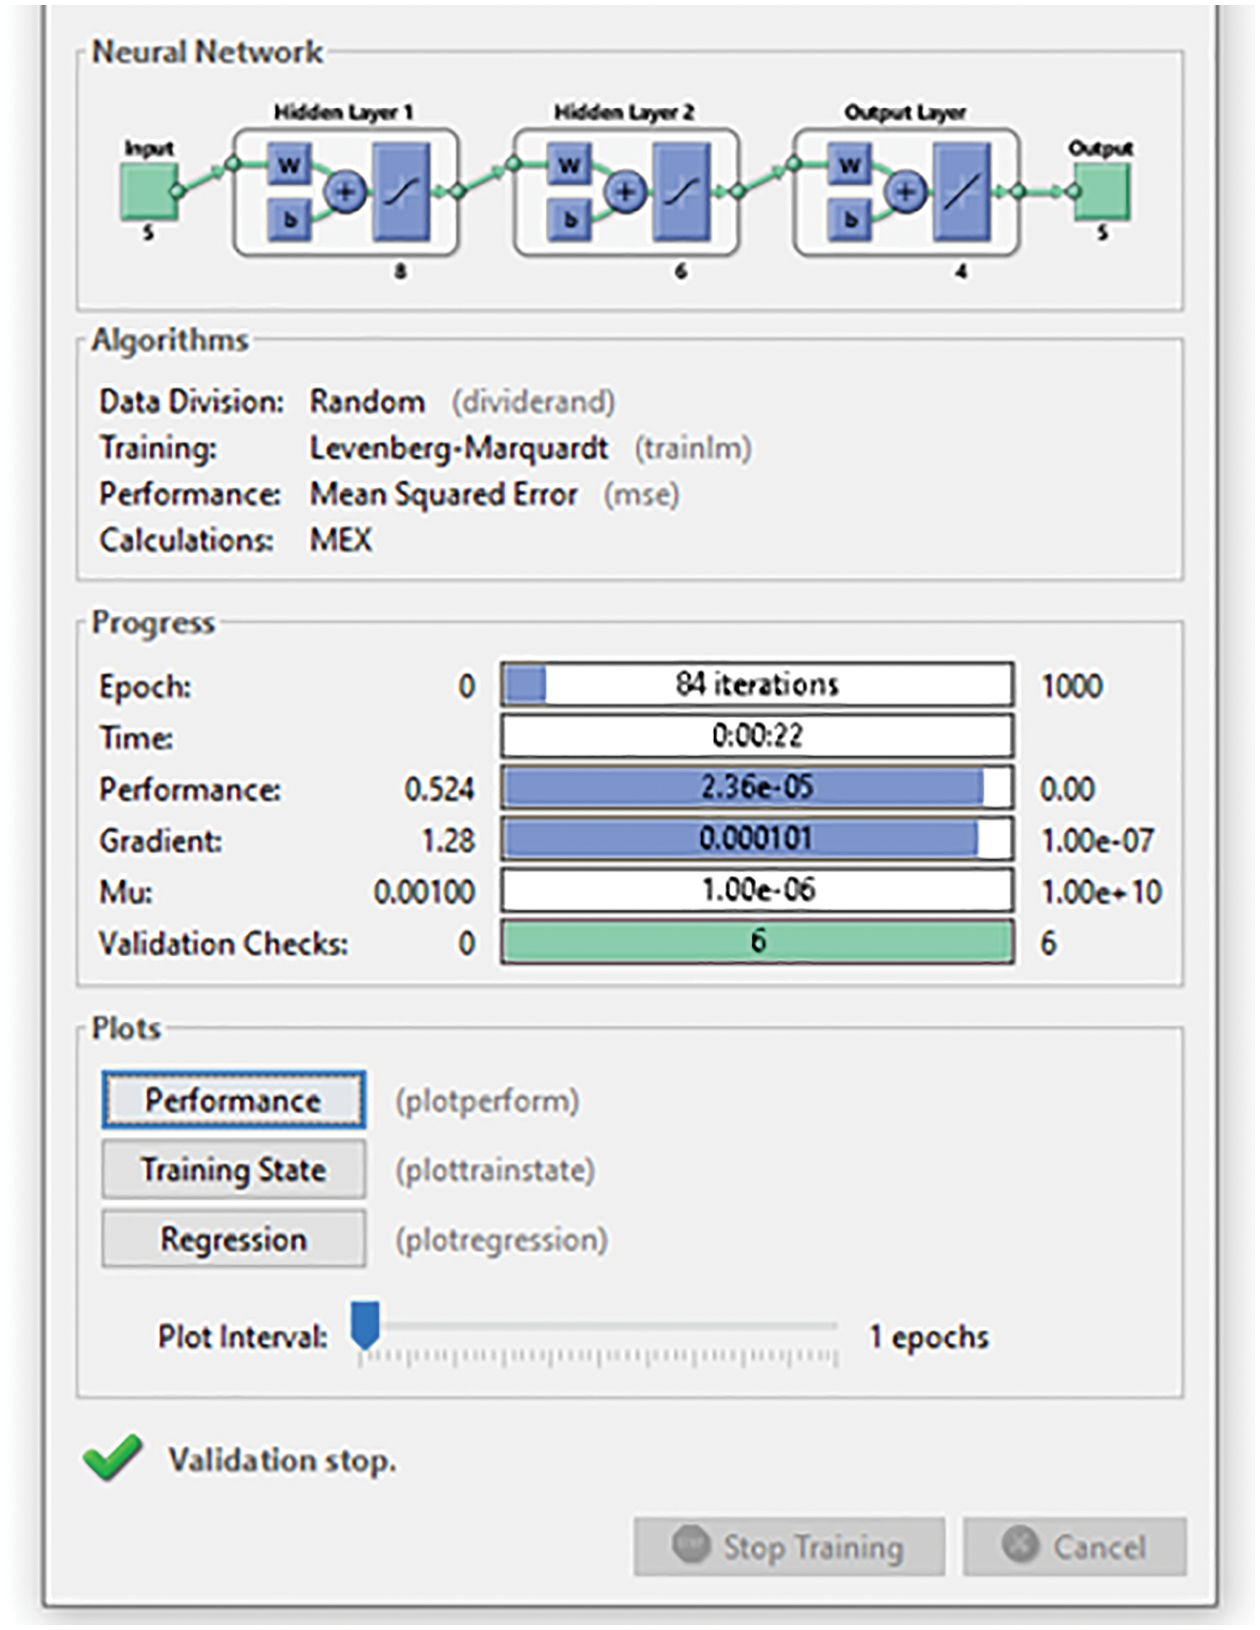
Figure 10: Ann training and testing for performance evaluation
In the proposed ANN, Weight and bias are randomly fed. At 84 epochs, all validations are checked, and the mean square error for performance evaluation is considered. The value of MSE = 0.002 after validation. The performance was achieved in 22 S the evaluation results are shown in Fig. 11.
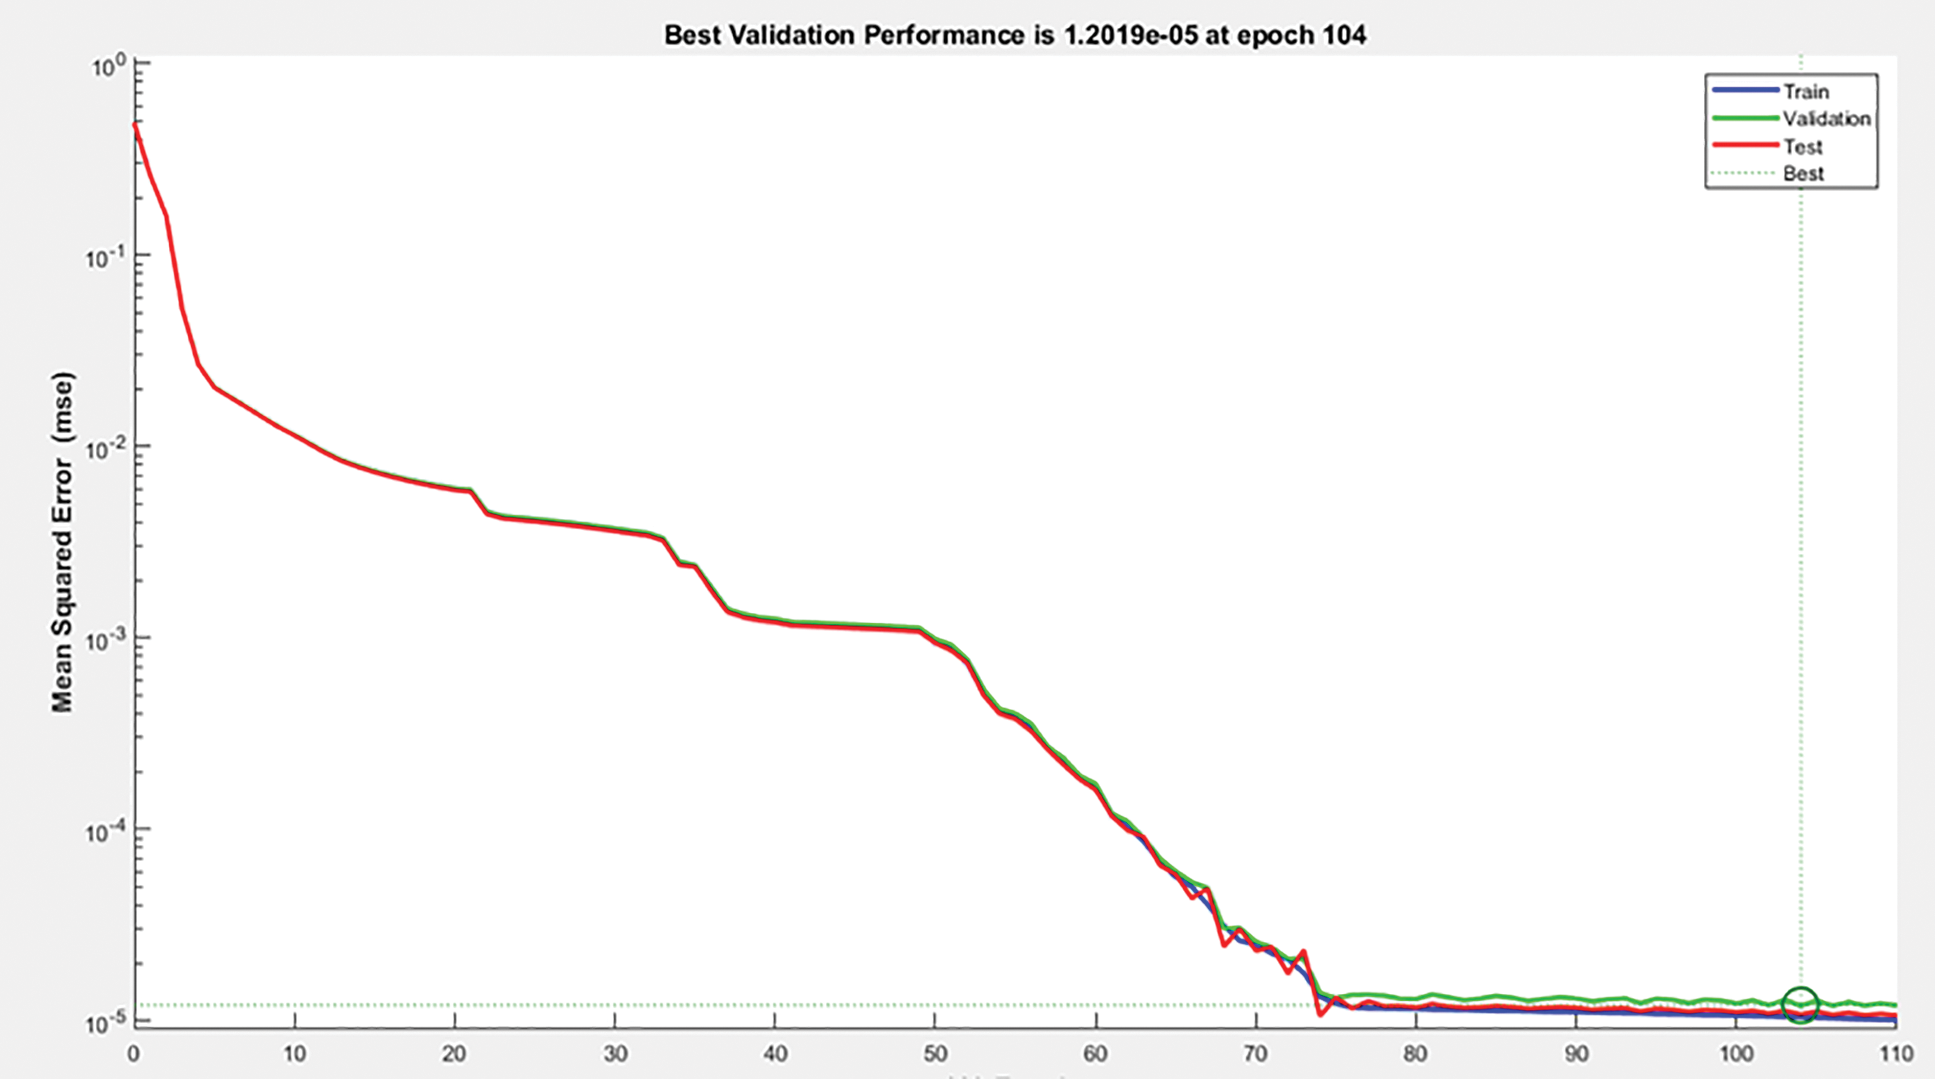
Figure 11: Performance and validation
4.4 Strategy for Power Control Switch
One control switch designed to distribute power comes after the ANN. When the control switch CS is OFF, RES-generated power will not be sufficient to supply office loads. At that point, the electric grid receives RES electricity, and grid power is supplied to office equipment. When CS is ON, the generated power by RES is greater than the power required by office appliances. Supply Priority is defined for the loads. The light loads of all offices will connect to RES If sufficient power is available to serve the light load. After that, it will switch to HVAC Load and the leftover RES-generated power will be supplied to the grid. An offset of 100 w prevents the equipment from switching damage consequences. We are considering distributive load in place of centralizing load.
4.5 Energy Management System Modeling
The Figure depicts the Matlab Simulink model with energy management strategies. First, we simulated HVAC power consumption without using any strategy, as shown in Fig.12. After that, the above-defined strategies, i.e., temperature control, load control, occupancy control and RES with ANN control, were implemented step by step and simulated for power consumption analysis as shown in Figs. 13 and 14.
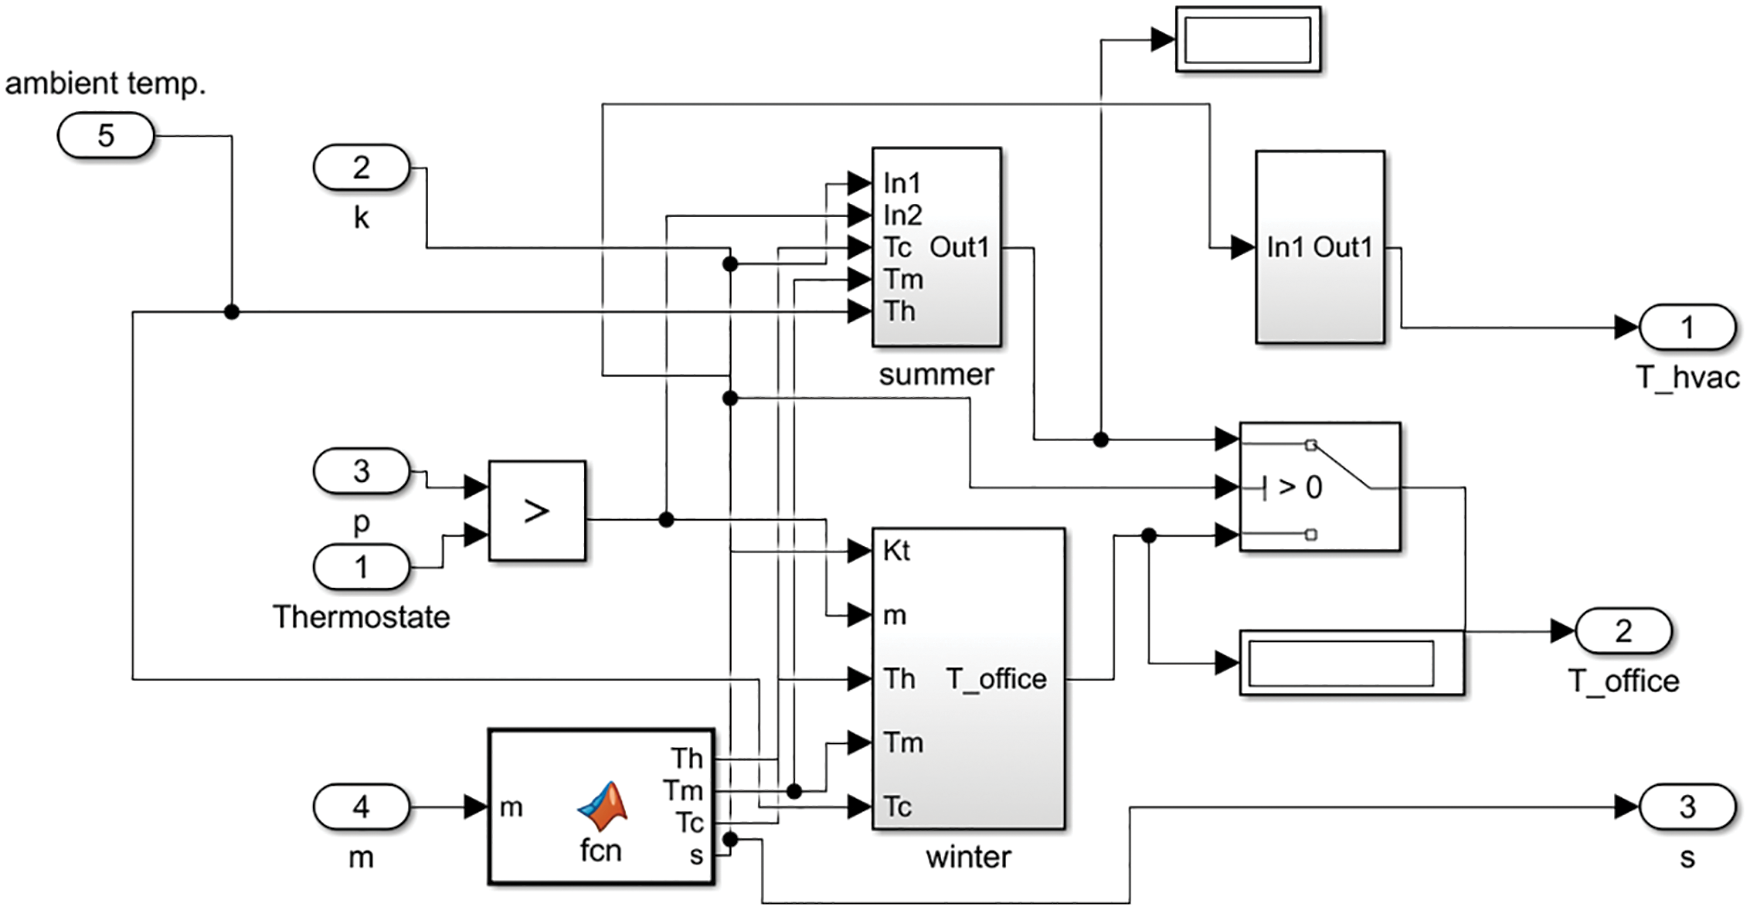
Figure 12: Simulink model for normal temperature setting of HVAC system
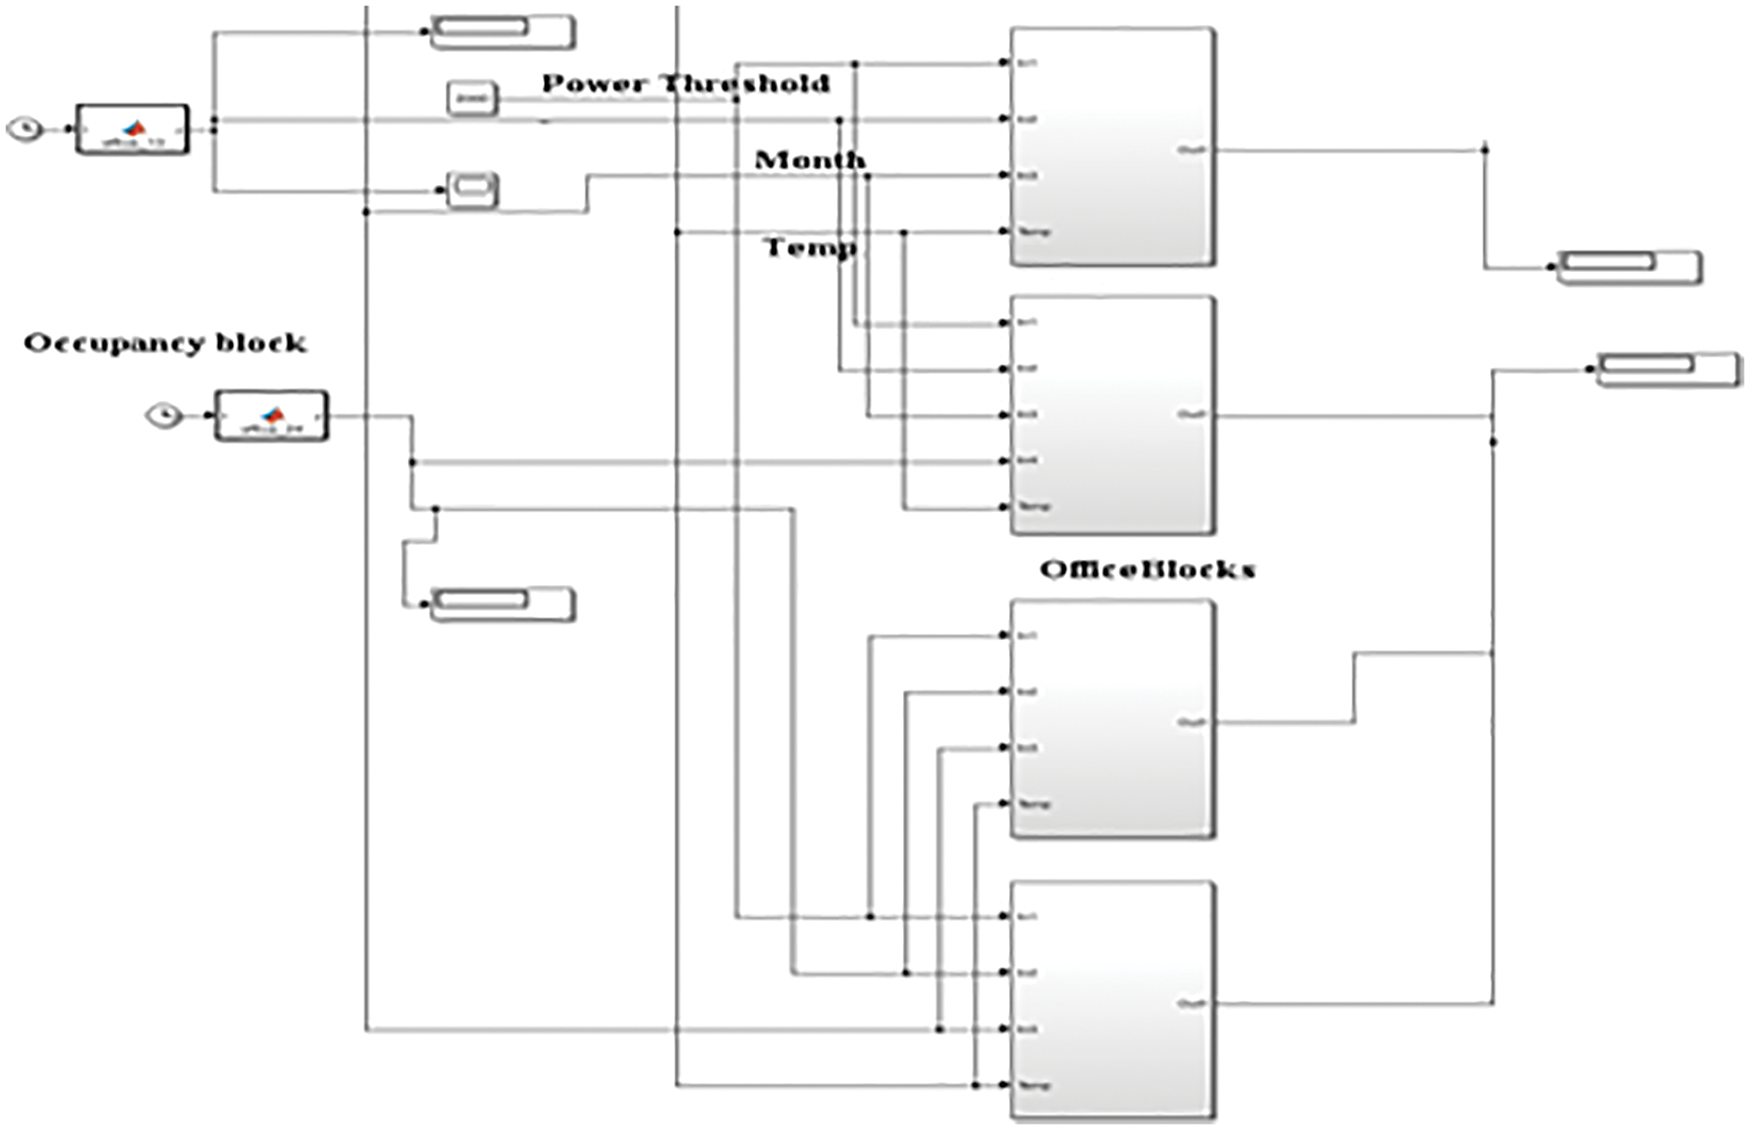
Figure 13: Simulink model after Occupancy control, load control, weather and temperature control
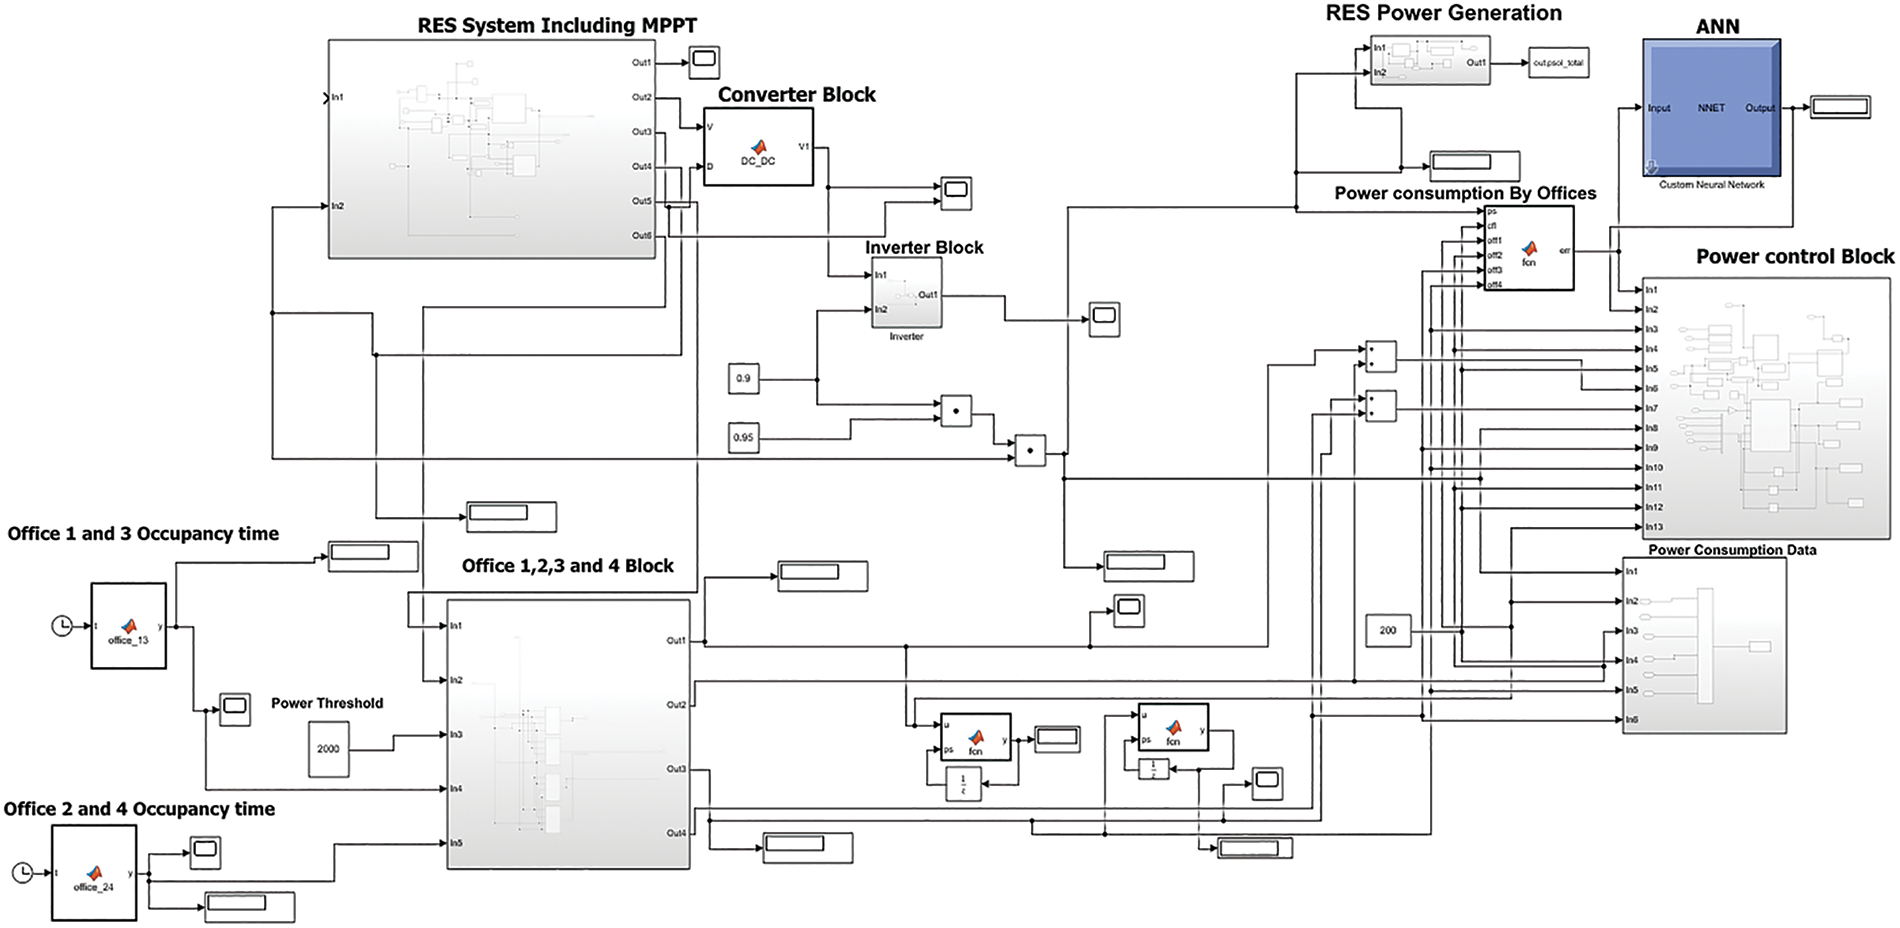
Figure 14: A complete energy management system MATLAB simulink model for office building appliances
Developed strategies are simulated and power distribution results are shown in Fig. 15. Total power generation by a renewable source of the energy system. Variation in solar radiation, cell temperature and weather conditions generated power for every season is shown. After the ANN controller, the distribution of power in office appliances by the RES system and the remaining RES generated power will send back to the utility grid.
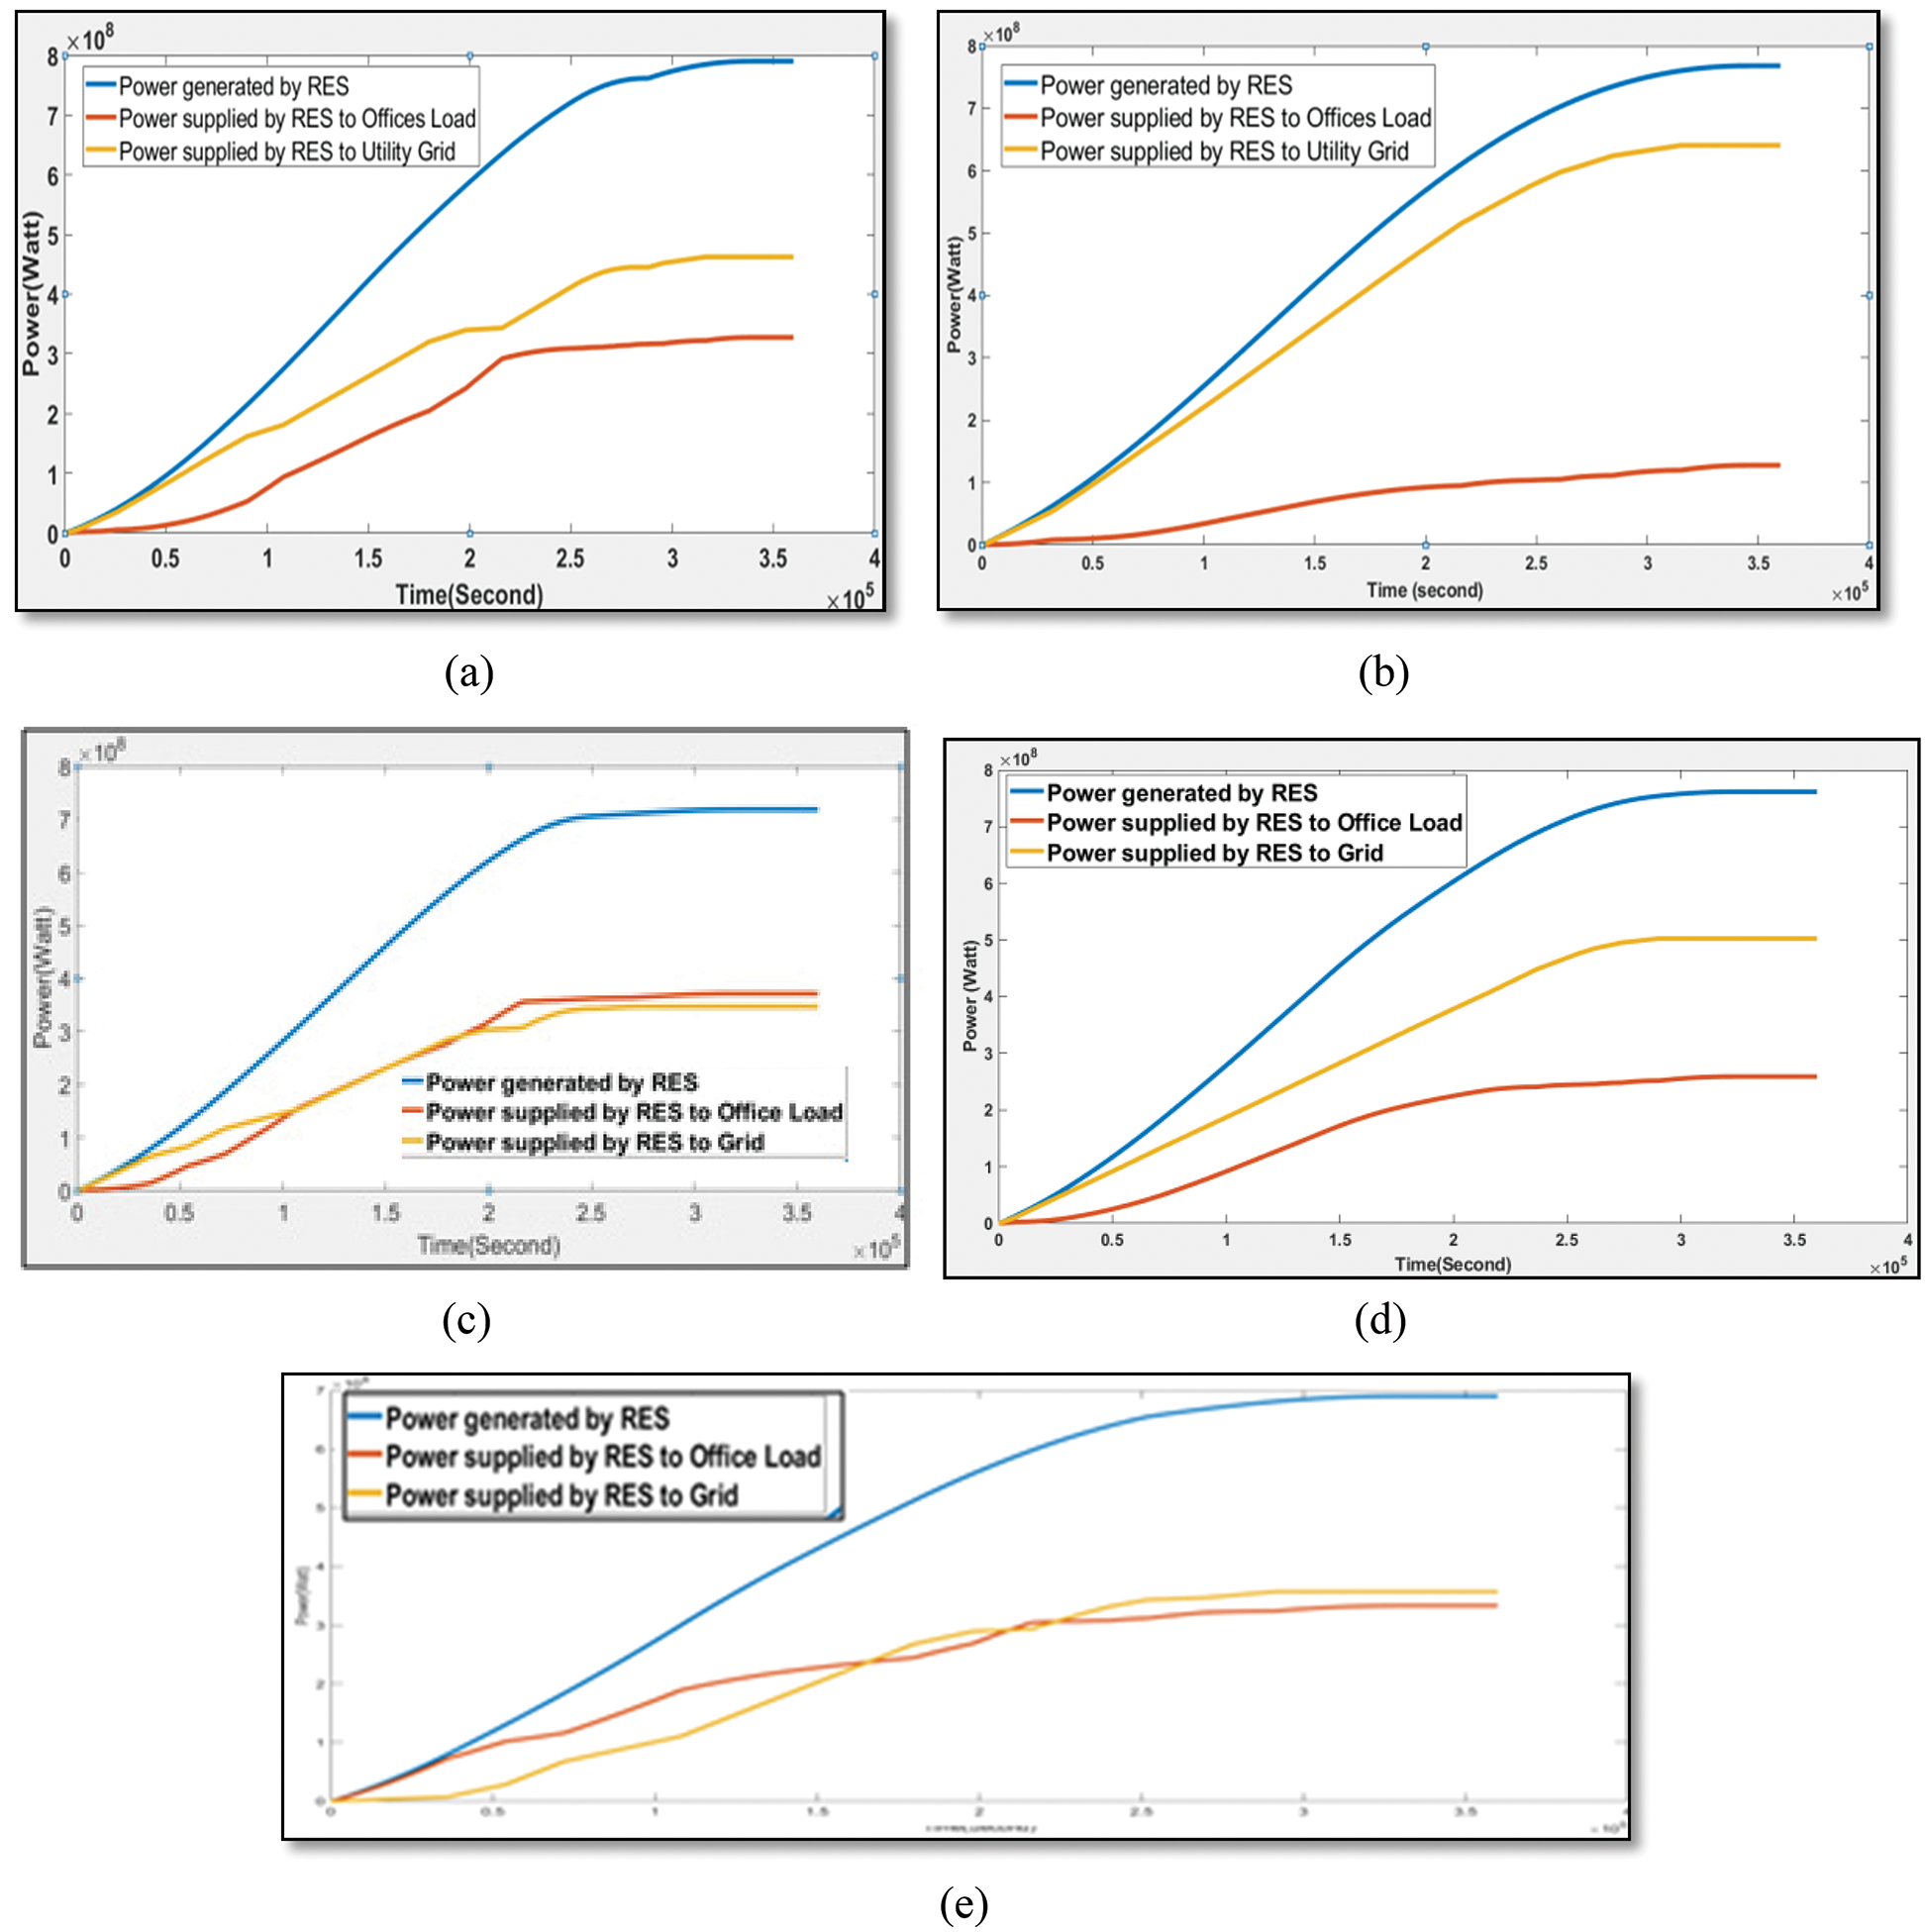
Figure 15: RES system generation and power distribution (kWh/day) (a) spring season, (b) summer season, (c) rainy season, (d) winter season and (e) autumn season
Figs. 16 to 20 depicts the entire power flow from 8:00 a.m. to 6:00 p.m. for winter, summer, spring and rainy seasons. When the electricity generated by the RES system is insufficient, the utility grid supplies power to office appliances based on load. And according to the control switch, if the generated power is sufficient to provide, it will be delivered to light loads first, followed by one offset power delivered to office 1 HVAC load. If power is insufficient, the control switch will be connected to the grid supply to provide power for office appliances. The graph above displays the total power utilized by all offices, the power supplied by the grid, the power supplied by the RES system to the offices and the power provided by the grid for each office time after implementing the complete strategy.
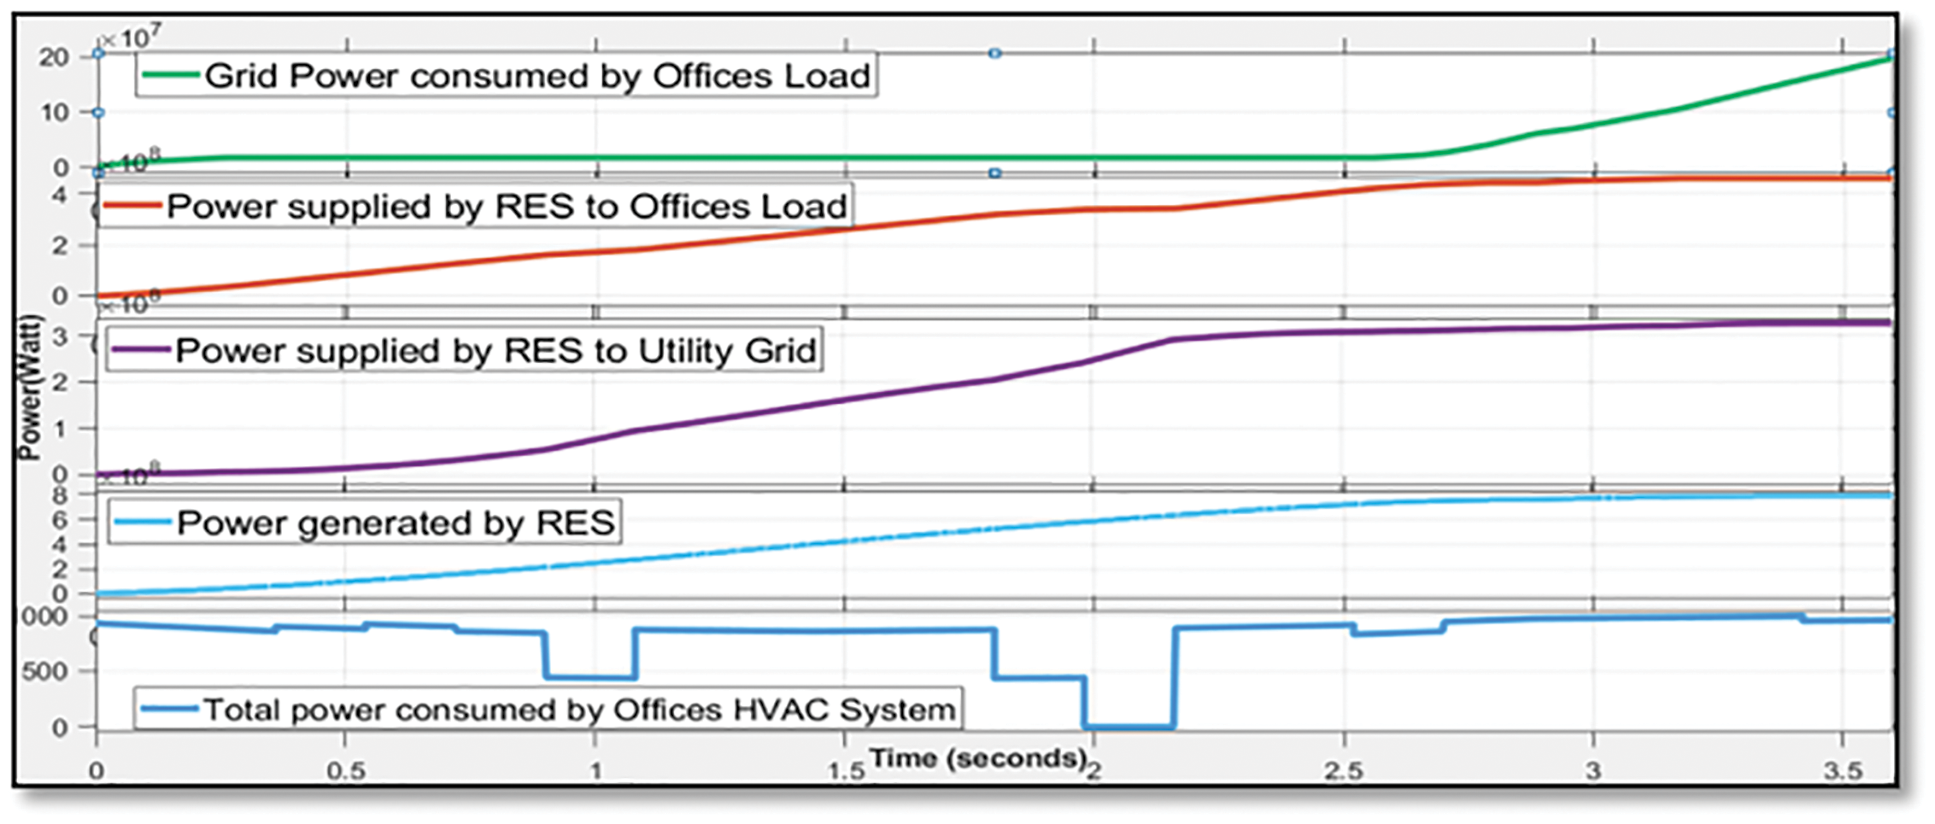
Figure 16: Power generation, consumption and distribution for the spring season
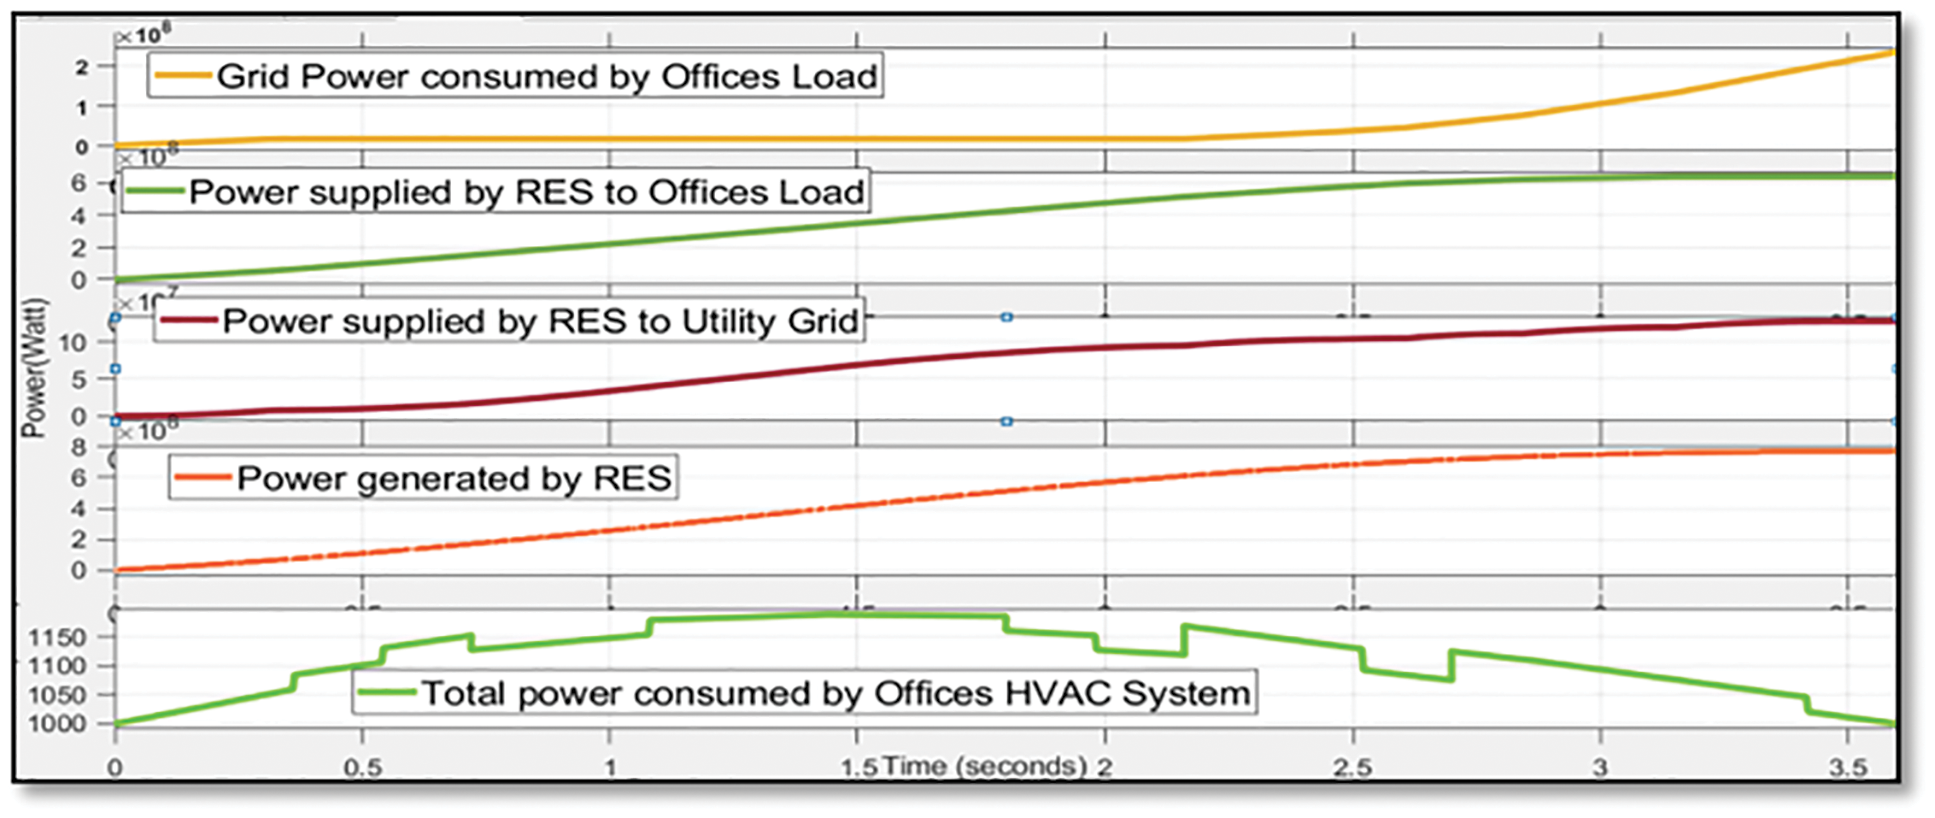
Figure 17: Power generation, consumption and distribution for the summer season
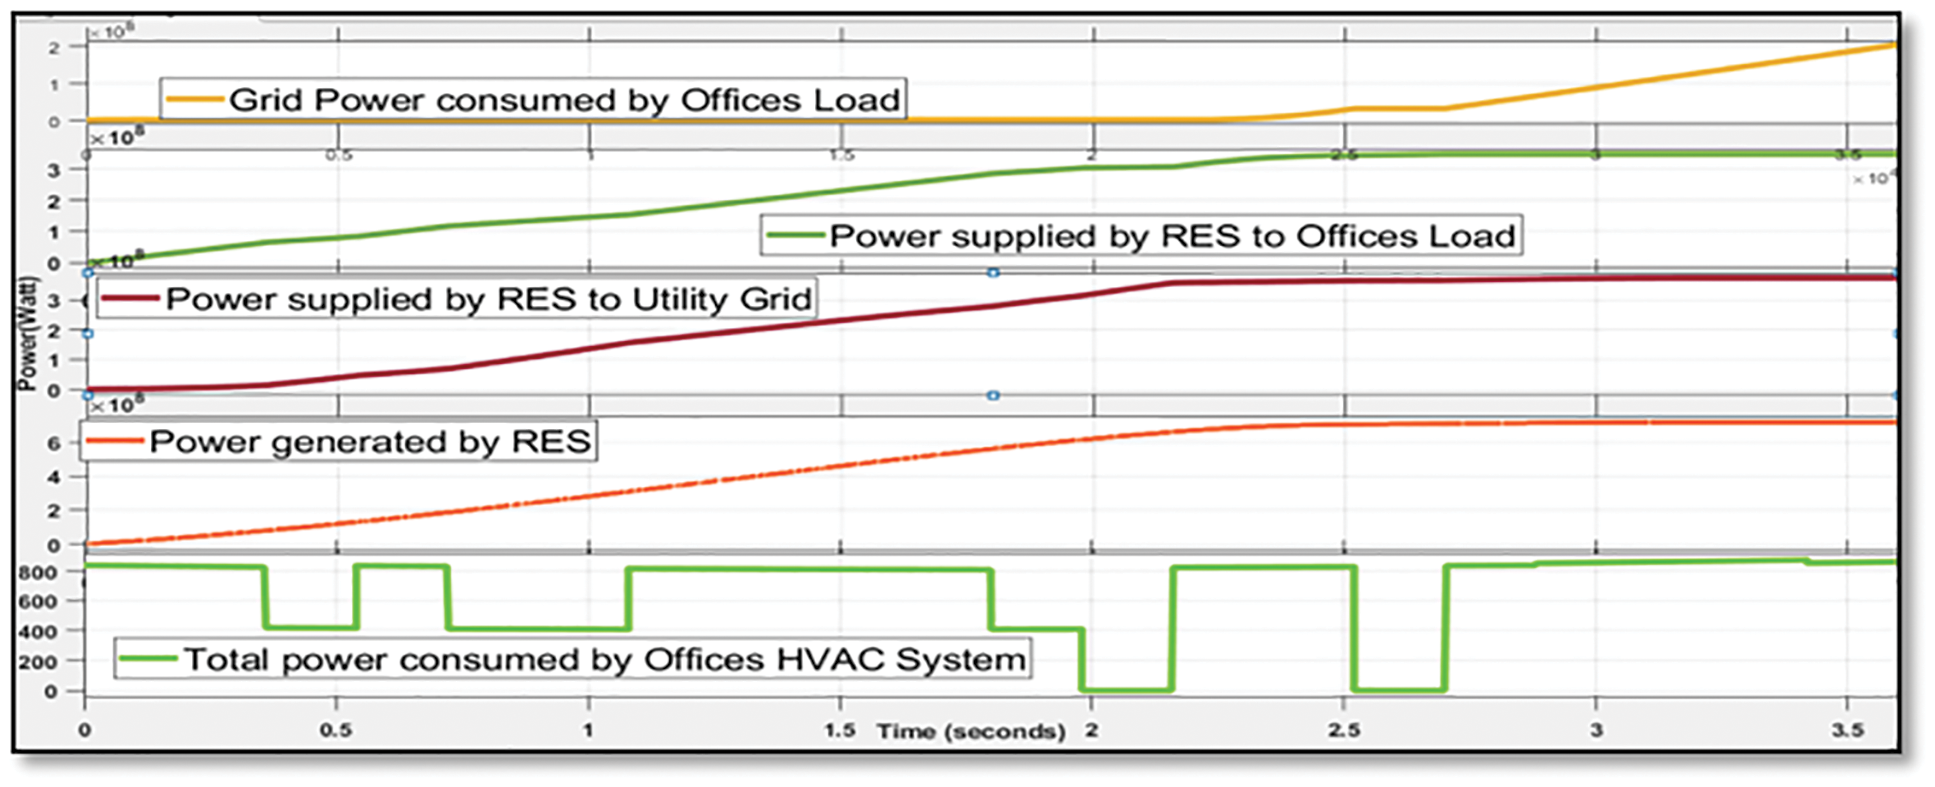
Figure 18: Power generation, consumption and distribution for the rainy season
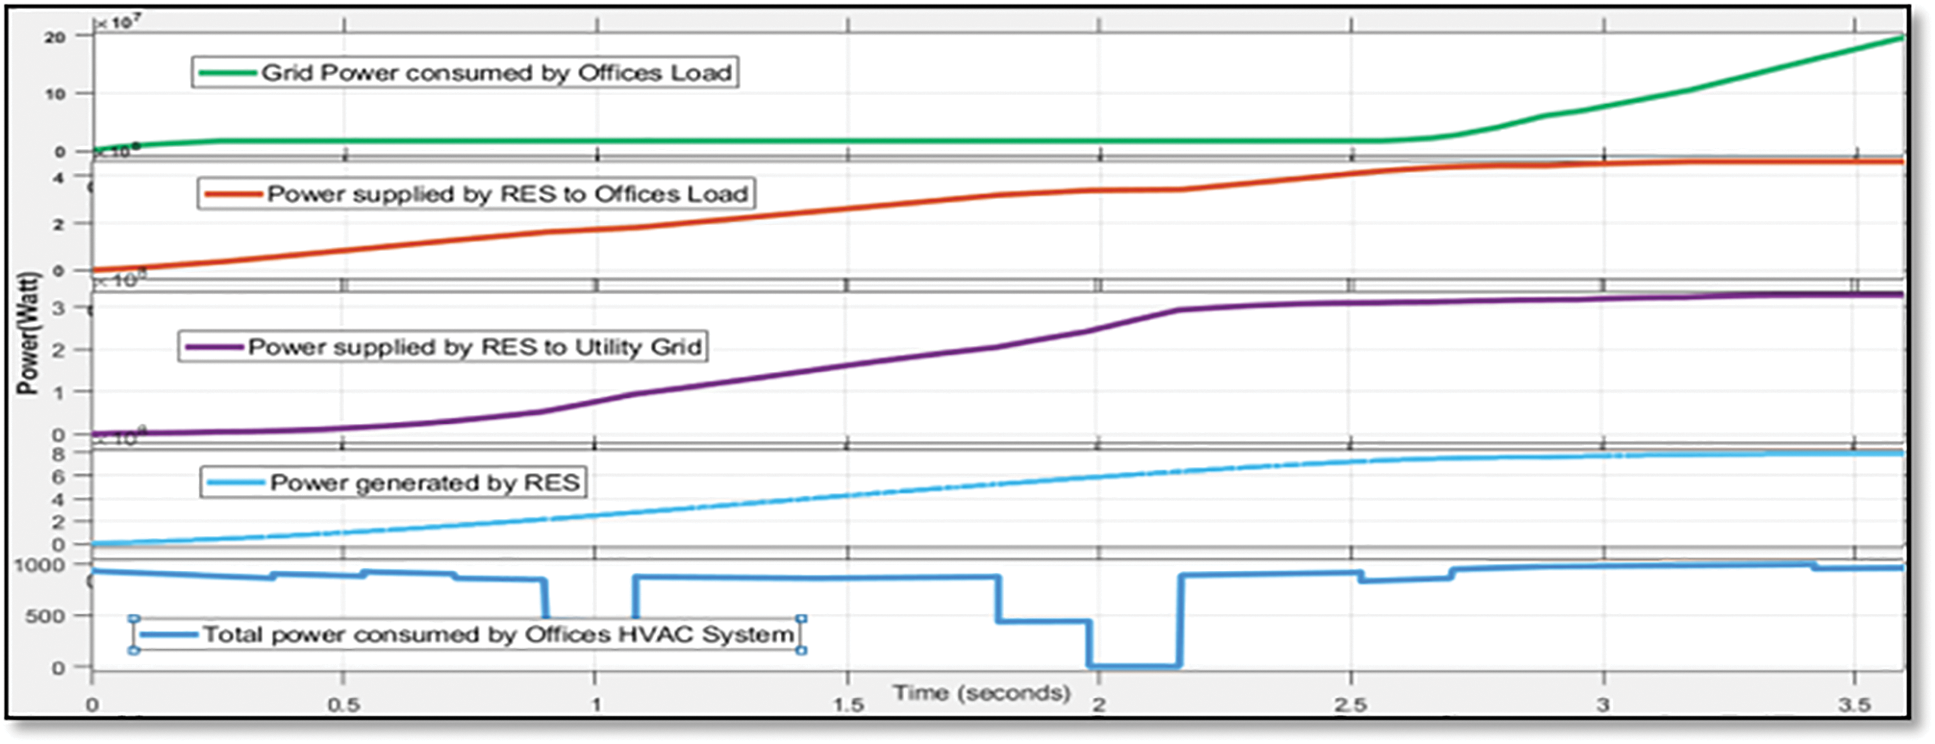
Figure 19: Power generation, consumption and distribution for winter season
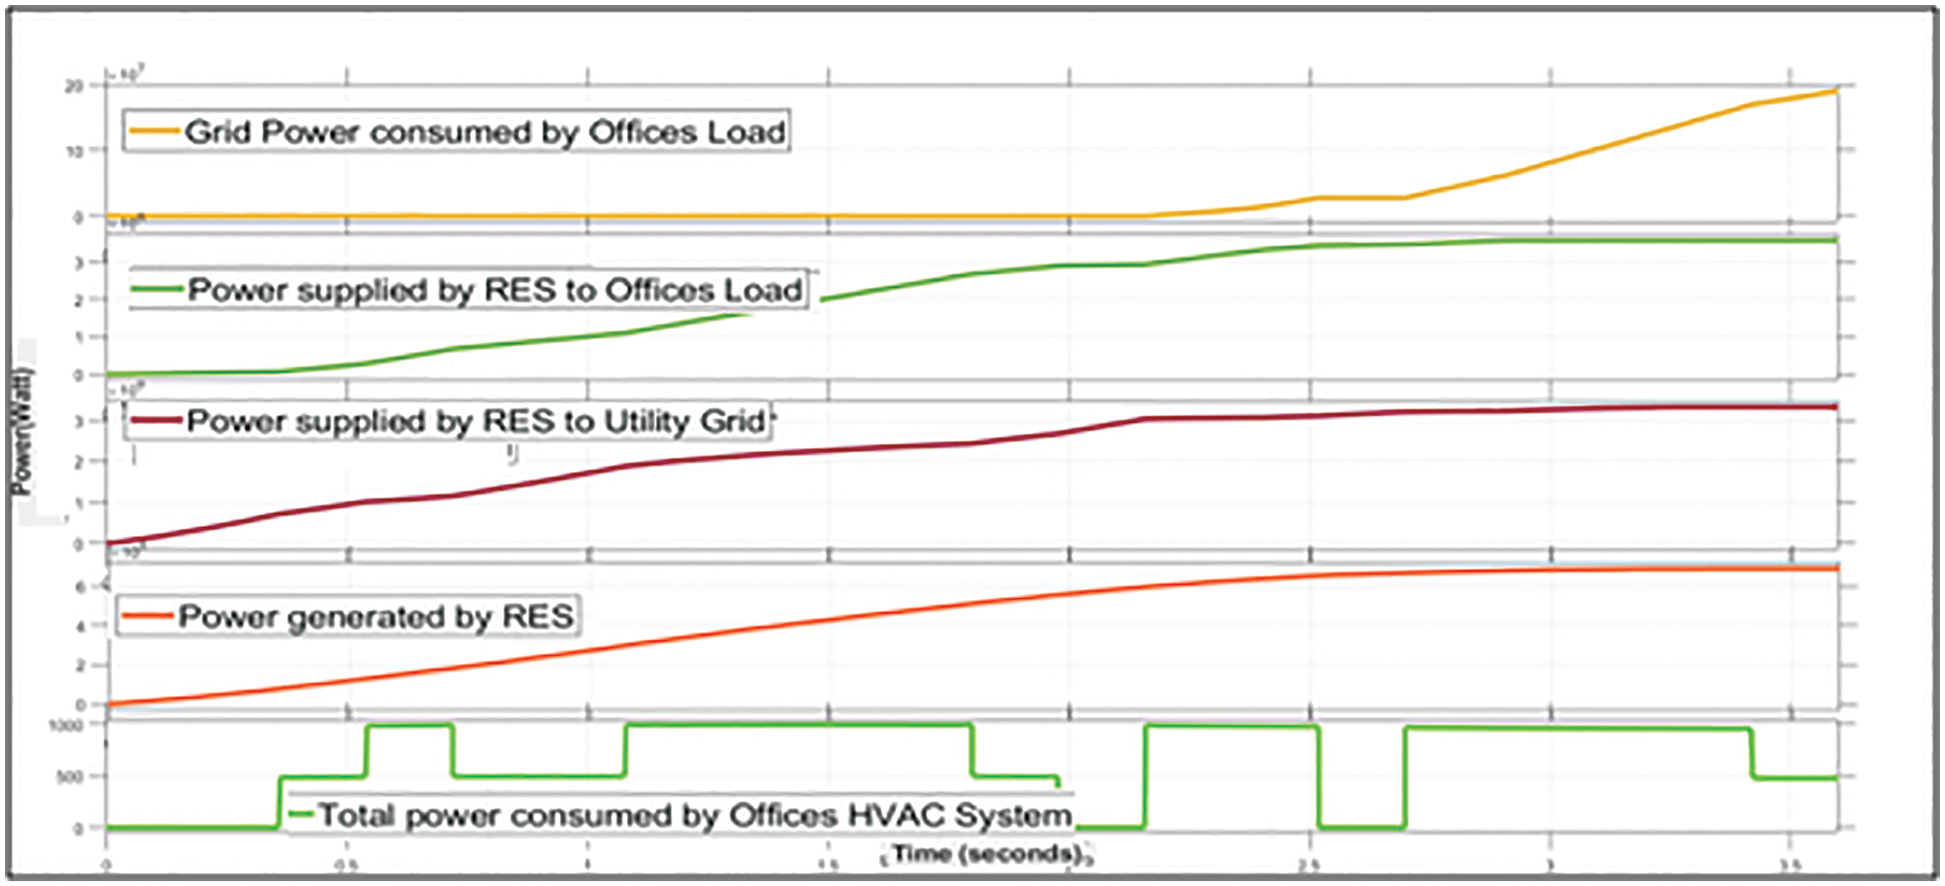
Figure 20: Power generation, consumption and distribution for the autumn season
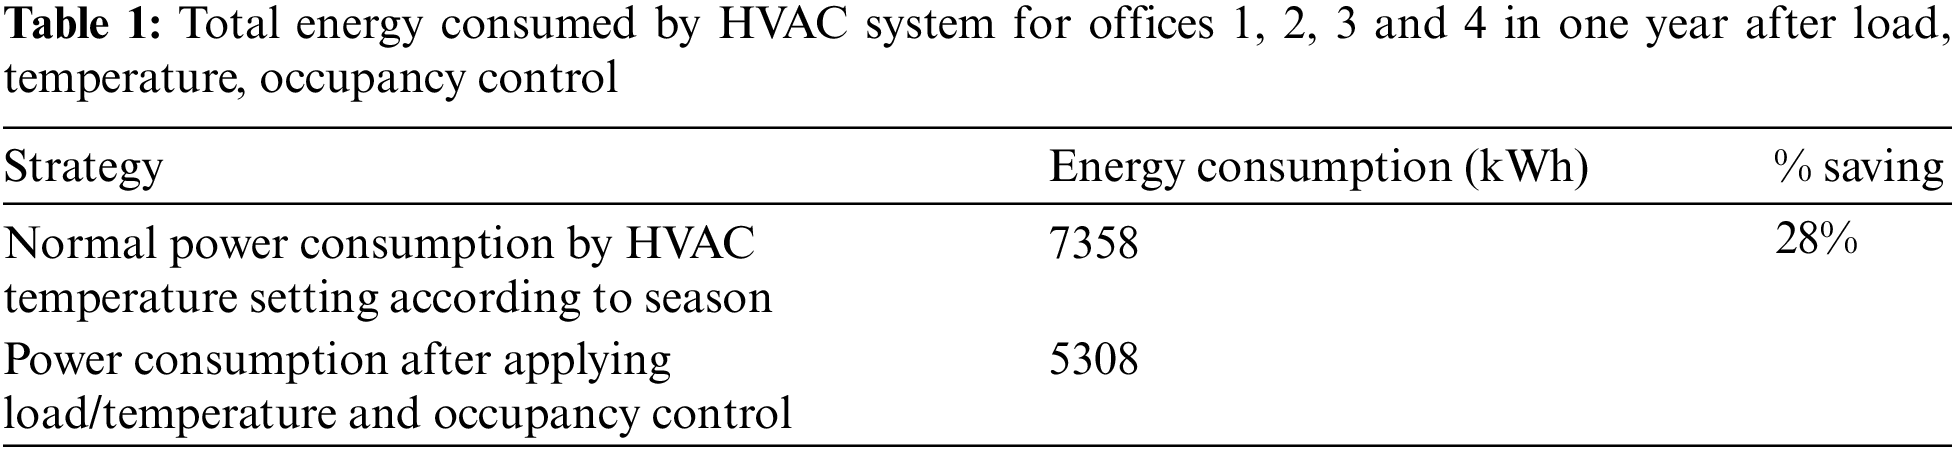
From the above-proposed strategies, the energy consumption by the HVAC system and the light load of the automated office has been calculated in Table 1. The Strategies were based on Indian seasons, including weather conditions, temperature variation, occupancy change and load balancing.
In the last strategy, the ANN system is designed for the best possible power distribution and management. For maximum utilization of RES-generated power during office hours and supply of excessively generated power to the grid are analyzed by simulation for a different season. Table 2 shows the Power consumption of office equipment after automation, season-wise RES power generations, RES power distribution in Distributed office loads and remaining power supplied to the utility grid.
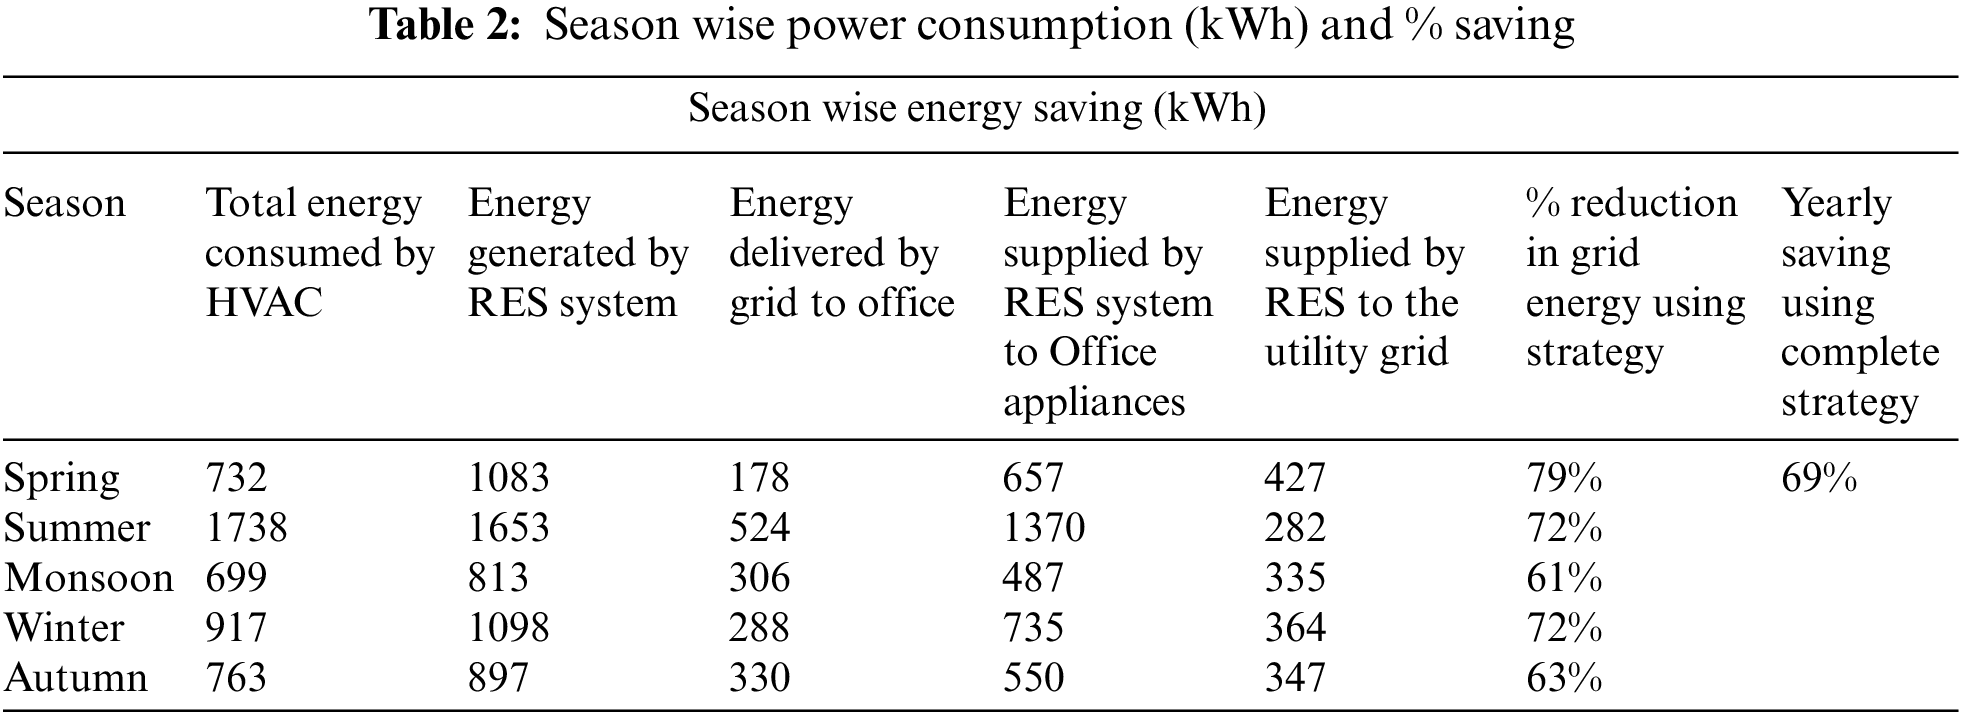
This article presented the study findings, discussions and analysis for the efficient energy management strategy. To reduce power consumption for building appliances and support the utility grid to reduce electricity demand and feed extra power to the grid by power generated from renewable energy sources. Results show a significant saving in electricity use by office appliances. The overall power consumption of HVAC is reduced by 28% using occupancy, load control, weather, and temperature control strategies. After that, the integration of RES provides good exposure to minimize power consumption using a neural network controller. The total energy saving in each season depicts in Table 2. These results are better than previous work presented [17] and overall, yearly energy saving is about 69% observed and power delivered back to the grid from the RES system was 31%.
Acknowledgement: The author appreciates the evaluation and suggestions from the editors and reviewers.
Funding Statement: The authors received no specific funding for this work.
Conflicts of Interest: The authors declare no conflict of interest. The authors have no affiliation with any organization or entity with any financial or non-financial interest in the subject or material discussed in this manuscript.
References
1. M. Santamouris and K. Vasilakopoulou, “Present and future energy consumption of buildings, challenges and opportunities towards decarburization,” Advances in Electrical Engineering, Electronics and Energy, vol. 1, no. 1, pp. 100002, 2021. [Google Scholar]
2. M. S. Aliero, M. Asif, I. Ghani, M. F. Pasha, S. R. Jeong et al., “Review analysis on smart building: Challenges and opportunities,” Sustainability, vol. 14, no. 5, pp. 3009, 2022. [Google Scholar]
3. O. M. Butt, M. Zulqarnain and T. M. Butt, “Recent advancement in smart grid technology: Future prospects in the electrical power network,” Ain Shams Engineering Journal, vol. 12, no. 1, pp. 687–695, 2021. [Google Scholar]
4. S. Sundaram, B. Pakkiraiah and G. D. Sukumar, “Research survey on various MPPT performance issues to improve the solar PV system efficiency,” Journal of Solar Energy, vol. 2016, pp. 20, 2016. [Google Scholar]
5. D. Gielen, F. Boshell, D. Saygin, M. D. Bazilian, N. Wagner et al., “The role of renewable energy in the global energy transformation,” Energy Strategy Reviews, vol. 24, no. 1, pp. 38–50, 2019. [Google Scholar]
6. T. Ahmad, D. Zhang, C. Huang, H. Zhang, N. Dai et al., “Artificial intelligence in sustainable energy industry: Status Quo, challenges and opportunities,” Journal of Cleaner Production, vol. 289, no. 1, pp. 125834, 2021. [Google Scholar]
7. H. Shareef, M. S. Ahmed, A. Mohamed and E. Al Hassan, “Review on home energy management system considering demand responses, smart technologies and intelligent controllers,” IEEE Access, vol. 6, pp. 24498–24509, 2018. [Google Scholar]
8. S. F. Rafique and Z. Jianhua, “Energy management system, generation and demand predictors: A review,” IET Generation Transmission and Distribution, vol. 3, no. 1, pp. 519–530, 2018. [Google Scholar]
9. M. W. Khan, J. Wang, M. Ma, L. Xiong, P. Li et al., “Optimal energy management and control aspects of distributed microgrid using multi-agent systems,” Sustainable Cities and Society, vol. 44, no. 1, pp. 855–870, 2019. [Google Scholar]
10. V. Suresh, J. Przemyslaw, R. Jacek and L. Zbigniew, “Forecasting solar PV output using convolution neural networks with a sliding window algorithm,” Energies, vol. 13, no. 3, pp. 723, 2020. [Google Scholar]
11. R. Sendra-Arranz and A. Gutiérrez, “A long short-term memory artificial neural network to predict daily HVAC consumption in buildings,” Energy and Building, vol. 216, no. 3, pp. 109952, 2020. [Google Scholar]
12. M. Elnour, N. Meskin and A. L. Naemi, “Sensor data validation and fault diagnosis using auto-associative neural network for HVAC systems,” Journal of Building Engineering, vol. 27, pp. 100935, 2020. [Google Scholar]
13. G. Hafeez, K. S. Alimgeer, Z. Wadudat, I. Khan, M. Usman et al., “An innovative optimization strategy for efficient energy management with day-ahead demand response signal and energy consumption forecasting in smart grid using artificial neural network,” IEEE Access, vol. 8, pp. 84415–84433, 2020. [Google Scholar]
14. M. De, G. Das and K. K. Mandal, “Proposing intelligent energy management model for implementing price rate in microgrids using demand response program,” Journal of The Institution of Engineers (IndiaSeries B, vol. 102, no. 3, pp. 27–435, 2021. [Google Scholar]
15. J. Dong, C. Winstead, J. Nutaro and T. Kuruganti, “Occupancy-based HVACs control with short-term occupancy prediction algorithms for energy-efficient building,” Energies, vol. 11, no. 9, pp. 24–27, 2018. [Google Scholar]
16. R. Kalaimani, M. Jain, K. Srinivasan and C. Rosenberg, “On the interaction between personal comfort systems and centralized HVAC systems in office buildings,” Advances in Building Energy Research, vol. 4, no. 1, pp. 129–157, 2018. [Google Scholar]
17. NREL, Solar resources dataset, “National laboratory of the U.S. Department of Energy, Office of Energy Efficiency and Renewable Energy, Operated by the Alliance for Sustainable Energy, LLC9,” 2022. [Online]. Available: https://pvwatts.nrel.gov/pvwatts.php [Google Scholar]
18. Average weather in Indore, Madhya Pradesh, India, 2022. https://weatherspark.com/y/108259/Average-Weather-in-Indore-India-Year-Round [Google Scholar]
19. M. Kong, B. Dong, R. Zhang and Z. O’Neill, “HVAC energy savings, thermal comfort and air quality for occupant-centric control through a side-by-side experimental study,” Applied Energy, vol. 306, no. A, pp. 117987, 2022. [Google Scholar]
20. S. I. Noubissie Tientcheu, S. P. Chowdhury and T. O. Olwal, “Intelligent energy management strategy for automated office buildings,” Energies, vol. 12, no. 22, pp. 4326, 2019. [Google Scholar]
21. D. Kim, J. Lee, S. Do, P. J. Mago, K. H. Lee et al., “Energy modeling and model predictive control for HVAC in buildings: a review of current research trends,” Energies, vol. 15, no. 19, pp. 7231, 2022. [Google Scholar]
22. P. Soni and J. Subhashini, “Development of an efficient energy management strategy to reduce energy consumption of office building equipment,” Wireless Personal Communications, vol. 24, no. 1, pp. 237–259, 2022. [Google Scholar]
23. P. Soni and J. Subhashini, “An effective power improvement analysis of on-grid solar photovoltaic system,” Solid State Technology Journal, vol. 9, no. 2s, pp. 3884–3895, 2020. [Google Scholar]
24. A. O. M. Maka and J. M. Alabid, “Solar energy technology and its roles in sustainable development,” Clean Energy, vol. 6, no. 3, pp. 476–483, 2022. [Google Scholar]
25. P. Soni and J. Subhashini, “Solar photovoltaic system performance analysis and its application for smart city electrification,” Elementary Education Online, vol. 20, no. 1, pp. 2406–2412, 2021. [Google Scholar]
26. Y. Wu, Y. Ma and S. Wan, “Multi-scale relation reasoning for multi-modal visual question answering,” Signal Processing: Image Communication, vol. 96, pp. 116319, 2021. [Google Scholar]
27. A. Montesinos López and J. Crossa, “Fundamentals of artificial neural networks and deep learning,” in: Multivariate Statistical Machine Learning Methods for Genomic Prediction. Cham: Springer, 2021. [Online]. Available at: https://link.springer.com/chapter/10.1007/978-3-030-89010-0 [Google Scholar]
28. H. Huang Lee, Programming and engineering computing with MATLAB2022. USA: SDC Publication, 2018. [Online]. Available at: https://www.sdcpublications.com/Textbooks/Programming-Engineering-Computing-MATLAB2022/ISBN/978-1-63057-546 [Google Scholar]
Cite This Article
 Copyright © 2023 The Author(s). Published by Tech Science Press.
This work is licensed under a Creative Commons Attribution 4.0 International License , which permits unrestricted use, distribution, and reproduction in any medium, provided the original work is properly cited.
 Downloads
 Citation Tools