
 Submit a Paper
 Propose a Special lssue
 Open Access
ARTICLE

Health Monitoring of Dry Clutch System Using Deep Learning Approach
School of Mechanical Engineering, VIT University Chennai Campus, Vandalur-Kelambakkam Road, Keelakottatiyur, Chennai, 600127, India
* Corresponding Author: V. Sugumaran. Email:
Intelligent Automation & Soft Computing 2023, 37(2), 1513-1530. https://doi.org/10.32604/iasc.2023.034597
Received 21 July 2022; Accepted 26 October 2022; Issue published 21 June 2023
 View Full Text
 Download PDF
Abstract
Clutch is one of the most significant components in automobiles. To improve passenger safety, reliability and economy of automobiles, advanced supervision and fault diagnostics are required. Condition Monitoring is one of the key divisions that can be used to track the reliability of clutch and allied components. The state of the clutch elements can be monitored with the help of vibration signals which contain valuable information required for classification. Specific drawbacks of traditional fault diagnosis techniques like high reliability on human intelligence and the requirement of professional expertise, have made researchers look for intelligent fault diagnosis techniques. In this article, the classification performance of the deep learning technique (employing images plotted from vibration signals) is compared with the machine learning technique (using features extracted from vibration signals) to identify the most viable solution for condition monitoring of the clutch system. The overall experimentation is carried out in two phases, namely the deep learning phase and the machine learning phase. Overall, the effectiveness of the pre-trained networks was assessed and compared with machine learning algorithms. Based on the comparative study, the best-performing technique is recommended for real-time application.Keywords
A clutch is a critical component in the transmission system, which transfers power from the driving part to the driven part. The clutch connects the engine to the transmission in automobiles, a well-known and widely used application. The most common transmission type that has been adopted globally is a manual transmission. The primary benefits of dry clutch transmission over wet clutch are reduced emissions, improved fuel economy, quick response, high comfort, extended reliability, improved performance, low maintenance and manufacturing costs. During the clutch engagement, the contact pressure generates heat and pressure between surfaces. At the end of the slipping time, the heat and friction of contact surfaces reach their maximum value and remain constant throughout the engagement time. A great quantity of frictional heat is created at high relative sliding velocity resulting in a significant temperature rise on the surface of the clutch plate. Consequently, thermomechanical issues such as thermoelastic instability and thermal deformations are created inside the clutch system. Such scenarios can result in heat cracking and a rapid rate of wear of clutch components. Owing to the heat generated during sliding, the pressure distribution has a major impact on the working of the friction clutch. Sudden failure of clutch components during transmission mechanism leads to unforeseen vehicle failures that pose threats to human protection, prolonged downtime and high repair costs. Condition monitoring of the clutch is important to mitigate the adverse consequences of these failures. Many methods, including the study of vibration [1], acoustic emissions [2], thermal analysis [3], etc., have been used for classifying a large number of potential malfunctions. The most commonly used approach is vibration analysis since each fault condition can be represented by a unique vibration pattern. The findings of vibration analysis were used to determine the source of the initial error. Due to advancements in monitoring techniques and artificial intelligence-based decision-making, fault diagnosis has improved significantly in recent years. In many engineering applications, reliability enhancement, fault diagnostics and predictive maintenance have become vital. Fault diagnosis is a method that involves real-time observation and measurement to determine the state of a mechanical system. Knowledge-based, Signal-based, mixed and model-based fault detection methods are the four fault diagnosis methods. Basic mechanisms in traditional fault diagnostic approaches include (i) data collection, (ii) feature extraction & selection and (iii) fault classification. Signals like current, temperature, vibration and sound were acquired during data collection. Vibration signals were chosen over the other signals since more intrinsic properties representing the status of mechanical systems are displayed. The most significant features can be selected using various signal processing and Techniques for reducing dimensionalities, such as Neural Networks (NN) [4], Support vector machines (SVM) [5], k-nearest neighbor [6], decision tree [7], Naive Bayes [8], self-organizing maps [9] and other classifiers were used to diagnose and classify the condition of machinery.
The features collected from the acquired signals have a significant influence on the performance of the fault diagnosis technique. To select the best practicable feature extraction technique, a high level of domain expertise and prior information about the specific application is required. Furthermore, during manual feature extraction, the presence of pre-existing features and evaluation criteria reduces the likelihood of discovering new features. Feature extraction approaches are extremely sensitive to mechanical system characteristic changes. Choosing the proper feature extraction technique for a particular application takes time and effort. Traditional fault diagnosis techniques have several drawbacks due to the complexity of mathematical modeling and the difficulty posed by feature extraction techniques. As a result, establishing an advanced and intelligent fault diagnosis technique capable of extracting features from raw vibration data and learning them automatically and adapting to various changes during dynamic operation is regarded timely and meaningful. In recent years, manufacturers and scientists have focused their attention on advances in artificial intelligence (AI) due to the deployment of Industry 4.0 and the Internet of Things (IoT) [10]. Fault diagnosis is emerging as the current research field that has adopted and applied AI to a greater extent. AI-based fault diagnosis has evolved into a formidable tool that has shed light on unknown study fields. AI concepts and theories are used to build modern fault diagnosis tools. Hinton et al. pioneered the use of artificial intelligence (in the form of deep learning strategies) in science, igniting a surge of research in various domains. Deep learning, also known as deep neural networks (DNN), is an AI method that consists of neural layers arranged in a categorized structure capable of extracting a large amount of data through input. The architecture is called “deep” since the raw data information is learned layer-by-layer [11]. With the help of convolution layers, DNN investigates complex dataset structures and automatically learns the most important information from the raw input. Deep learning models have been employed in a wide range of applications such as surveillance and robotics, object detection, language processing and visual inspections due to the advanced non-linear regression capability and automatic feature learning ability [12]. As a result, there is a growing requirement and potential for automated learning ability of DNN in the field of fault diagnosis of a mechanical system.
Based on the complex feature learning capability of DNN, Mechanical system fault detection is applied in two stages, as depicted in Fig. 1. The description of two stages of deep learning application is given as follows:
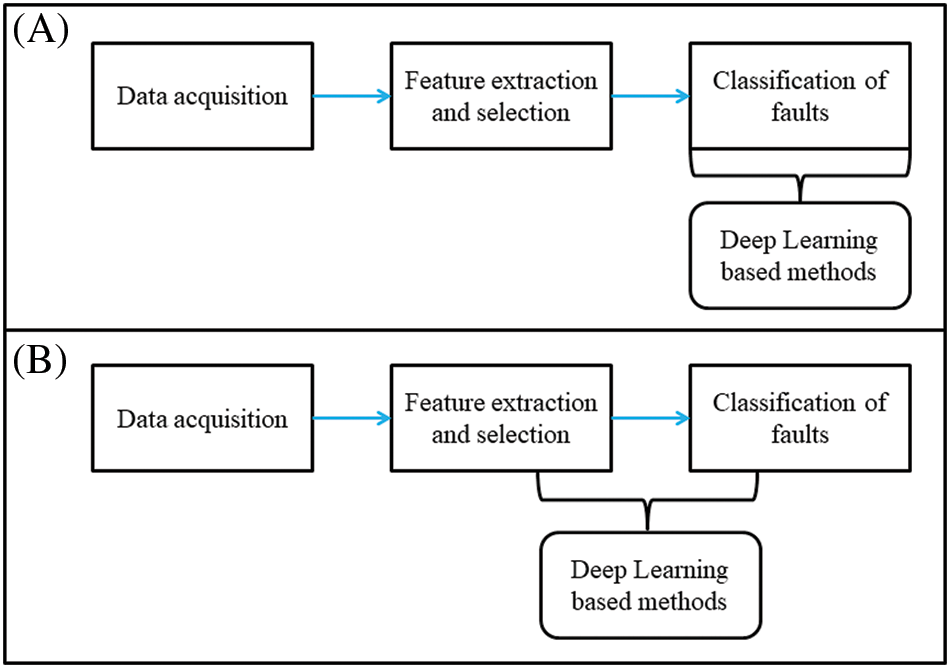
Figure 1: Deep learning stages for mechanical systems
1. During the early days, DNN was utilized by several researchers in the field of fault diagnosis to either implement feature selection or classification that mimics the traditional fault diagnosis techniques. Various feature extraction approaches are used to extract features from various acquired signals. The extracted features from the acquired signals are used to train the DNN that performs the classification task. Several researchers stated on the strategies mentioned above, which are explored below. Li et al. stated that the condition of bearings and gearbox were diagnosed with the help of statistical features extracted from frequency and a deep belief network. The gearbox condition was evaluated from time and frequency features by Chen et al., using a convolutional neural network (CNN). Verma et al. carried out an air compressor fault diagnosis using a sparse autoencoder. Shao et al. employed an improved deep belief network with 18-time characteristics to identify bearing faults. At this point in the diagnostic process, the feature learning capability of DNN is not explored thoroughly and DNN was used only as a replacement for traditional methods (Fig. 1A).
2. Literature suggests that it was only since 2015 that the feature learning capability of DNN was attempted of various fault diagnosis application. In this stage, the DNN performs a combined method consisting of feature classification and extraction on the vibration data (as raw signals or stored in the form of images). Such an approach has limited the time consumption and eliminated the need for domain expertise. An ensemble-based approach using two deep convolutional neural networks (CNN) was attempted by Guo et al. to monitor the condition of roller bearing. One CNN was used for feature extraction and fault pattern identification, while another was used for fault classification. Zhao et al. used a convolutional long short-term memory to monitor tool status. The procedure of intelligent fault diagnosis becomes more effective and automated as a result of the feature learning capabilities of DNN (Fig. 1B).
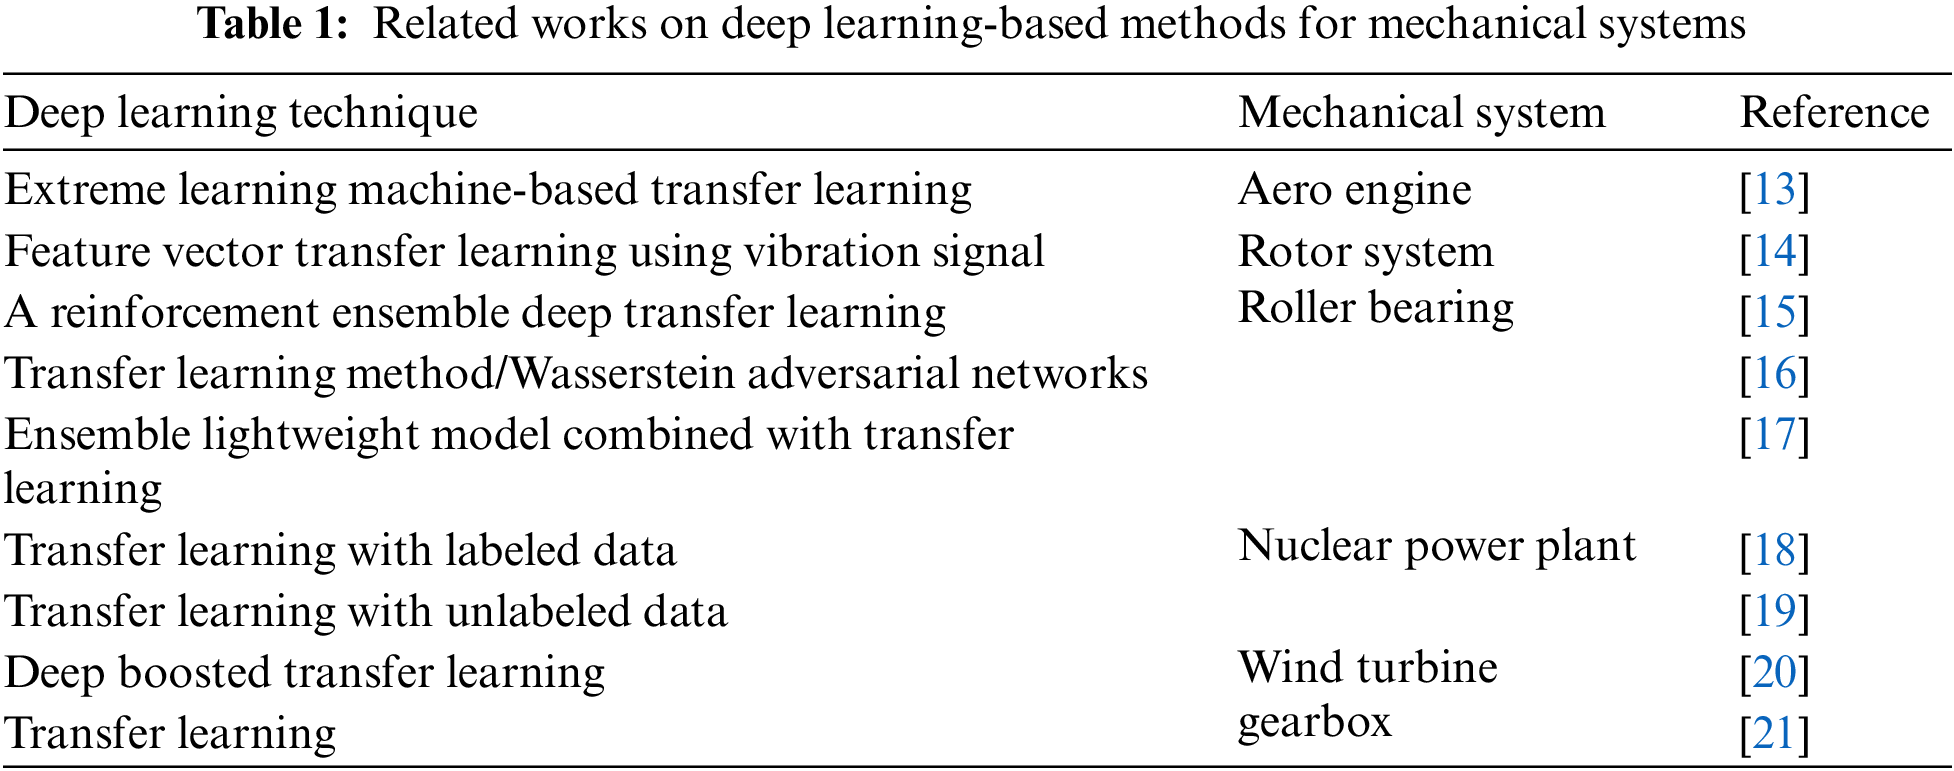
The fundamentals of deep learning are constructed using CNN, which are used to learn complicated features from image data. The application of CNN has spread out widely and is dominant in object detection, speech recognition and fault diagnosis. However, minimal studies have been performed on fault diagnosis of dry friction clutch system. Additionally, using CNN for fault diagnostics in a dry friction clutch system was not attempted. Table 1 shows several relevant papers that demonstrate the use of deep learning in mechanical systems.
The effectiveness of several machine learning classifiers is examined in the present study which includes techniques like the random forest, decision tree (J48), Naïve Bayes, K-Star and ModELM and various pre-trained networks, namely GoogLenet, AlexNet, ResNet-50 and VGG-16. They were evaluated for diagnosing the condition of dry friction clutch system with images produced by vibration signals. On the pre-trained networks, experiments were conducted by adjusting the train-test split ratio and several hyperparameters, including learning rate, batch size, learning rate and solver. The outcomes are tabulated and compared to find the suitable technique for fault diagnosis of dry friction clutch system. The following are the technical contributions to the current study.
• The present study considers five fault conditions (worn diaphragm spring fingers, friction material loss, tangential strip bent, pressure plate worn, and pressure plate broken) and one good condition for dry friction clutch fault diagnosis.
• The raw vibration signals are collected from the test setup of the dry clutch system as the source for statistical characteristics in a machine learning phase.
• The best features are picked by employing the decision tree J48 algorithm, and various classifiers like J48, random forest, SVM, K-Star and ModELM were used to determine the classification accuracy for the dry friction clutch system.
• Vibration signals obtained from the dry friction clutch system were stored as vibration signal plots that can be utilized as input for pre-trained networks in a deep learning.
• Four pre-trained networks GoogLenet, ResNet-50, AlexNet and VGG-16, were examined in the research to perform the classification of dry friction clutch system faults.
• Various hyperparameters like learning rate, batch size, learning rate, train-test split ratio and solver were adjusted, and the effectiveness of the transfer learning is evaluated.
• A comparative study is conducted to identify the best-performing technique among deep learning and machine learning based on the results obtained.
The test rig for the study, data acquisition methods and dry friction clutch fault types investigated in the study are discussed in this section. The experimental setup was devised and built to simulate the real-time operation of dry friction clutch system. To collect vibration data for a healthy state, the accelerometer was initially attached to the dry friction clutch system using the adhesive technique. The exact process is carried out again to obtain the vibration signals of faulty components by replacing the good-condition components with faulty components. Fig. 2 illustrates the methods used in the clutch system fault diagnostic procedure.
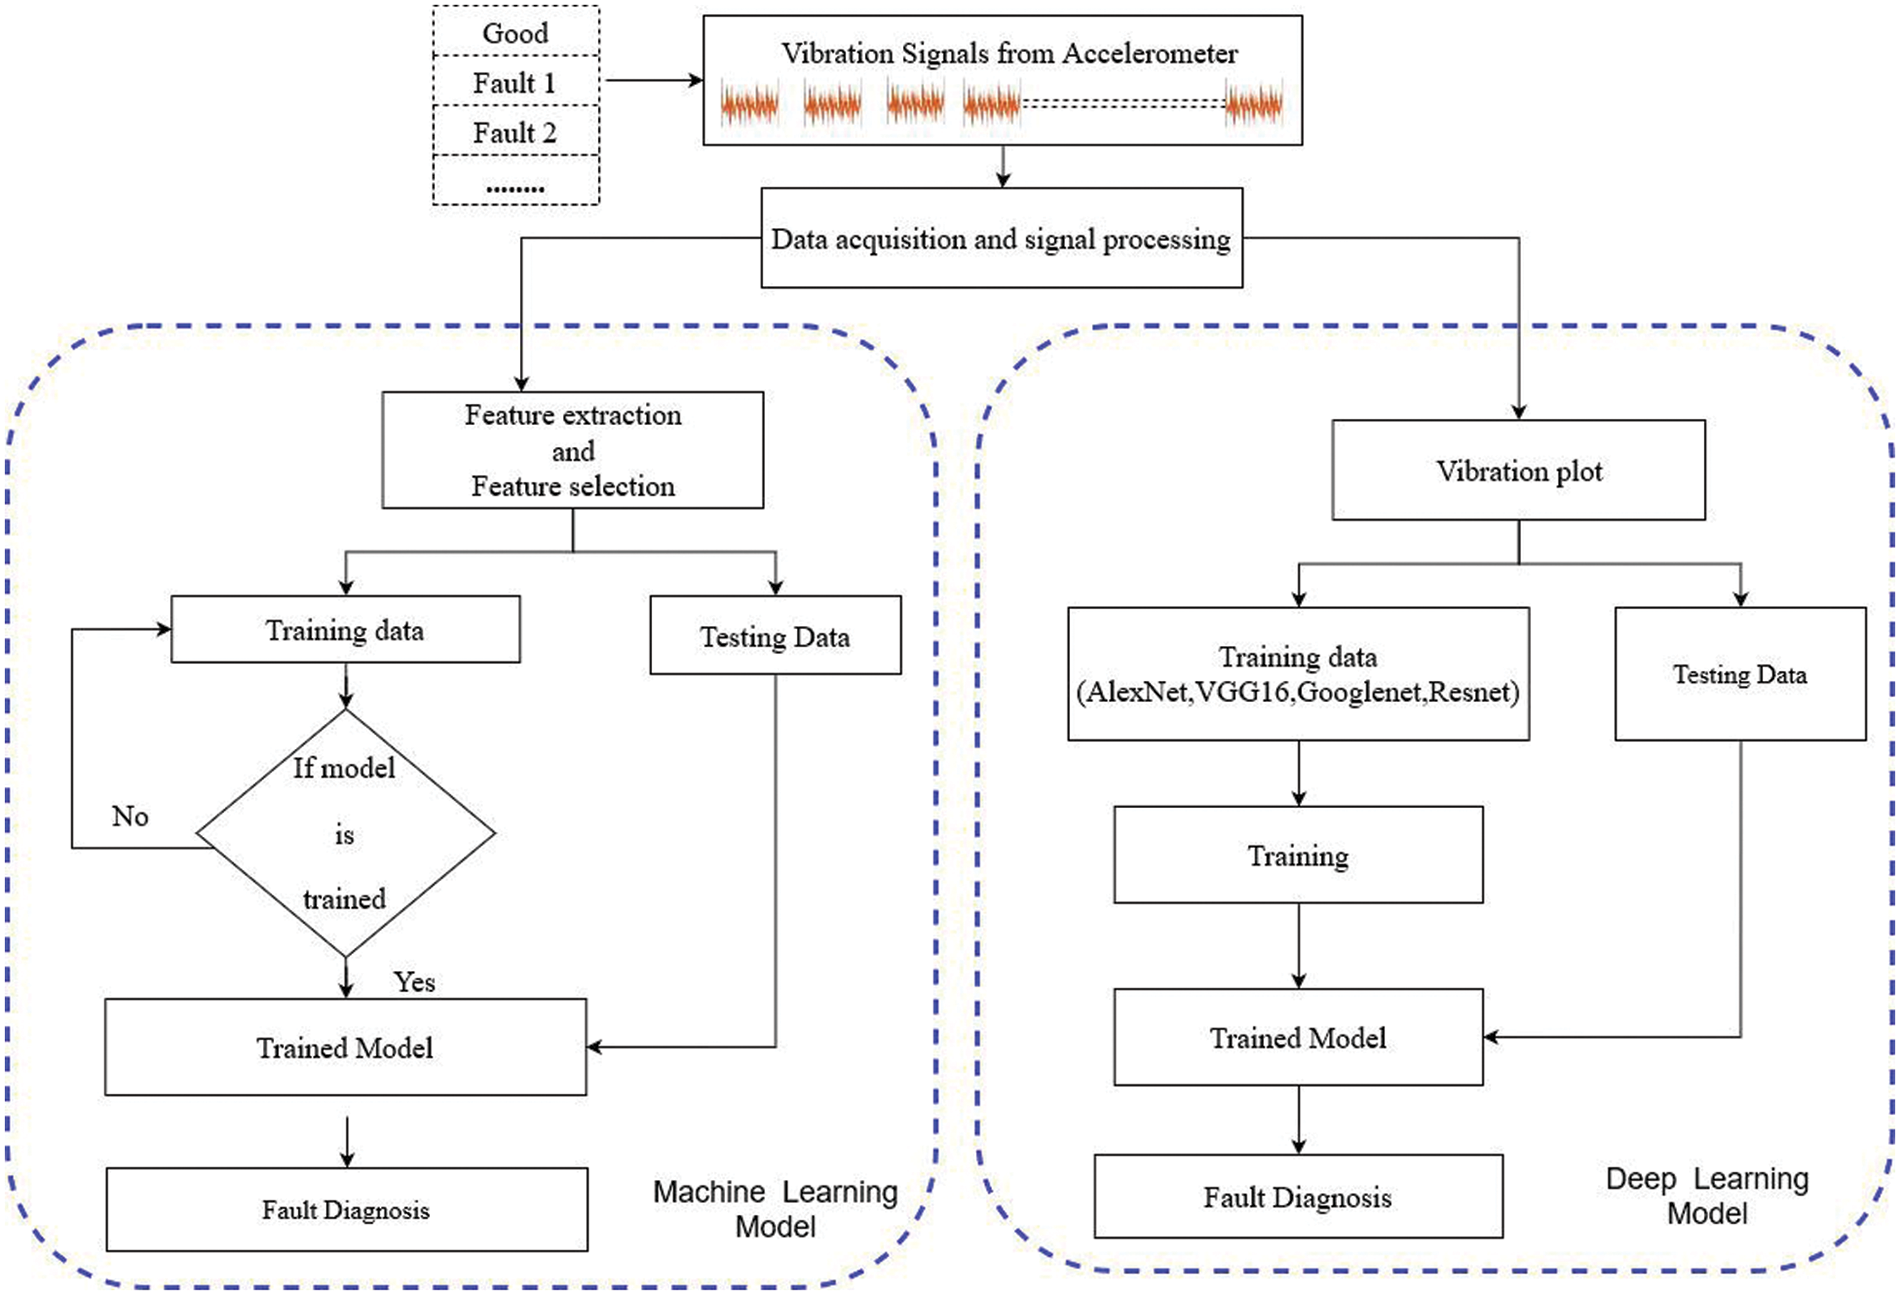
Figure 2: Overall methodology of fault diagnosis of dry friction clutch system
A commercially available single plate dry friction clutch of Maruti Zen is utilized in the fabrication of the test rig in the current study. Fig. 3 represents the fabricated experimental setup used in this study. The fabricated test rig consists of a clutch, an AC motor, a flywheel, one coupling, four bearings and a load cell. An alternating current (AC) motor with a constant rotational speed of 1400 rpm is attached to a flywheel with a shaft of 200 mm length and 25 mm diameter using muff coupling. The flywheel is coupled with clutch assembly using bolts, while bearings are used to support the shafts. A dynamometer consisting of spring balances was used to monitor the amount of load applied to the clutch. Provisions to change the applied load are provided in the form of hand levers attached to the clutch plate using 250 mm long and 25 mm diameter shafts. To acquire vibration signals, a piezo-electric type accelerometer has been used. In condition monitoring, accelerometers are frequently utilized as they can sense vibrations at high frequencies. A uniaxial accelerometer with a sensitivity of 10.26 mV/g was used in this study. Using adhesive glues, the piezo-electric accelerometer is placed on the plane surface (on the bearing) of the experimental setup, which is further connected by a cable to the National Instrument Data Acquisition System (NI-DAQ) system. The DAQ system consists of four analog input channels (A0, A1, A2 and A3). The accelerometer is attached to one end of the cable, and the DAQ system's analog input-output (AIO) port is connected to the other. NI–LabVIEW is interfaced with the transducer signal and the system. A signal conditioning unit is included with the NI DAQ. The signals are routed through an analog to a digital converter and load converter before being stored directly in the storing device.
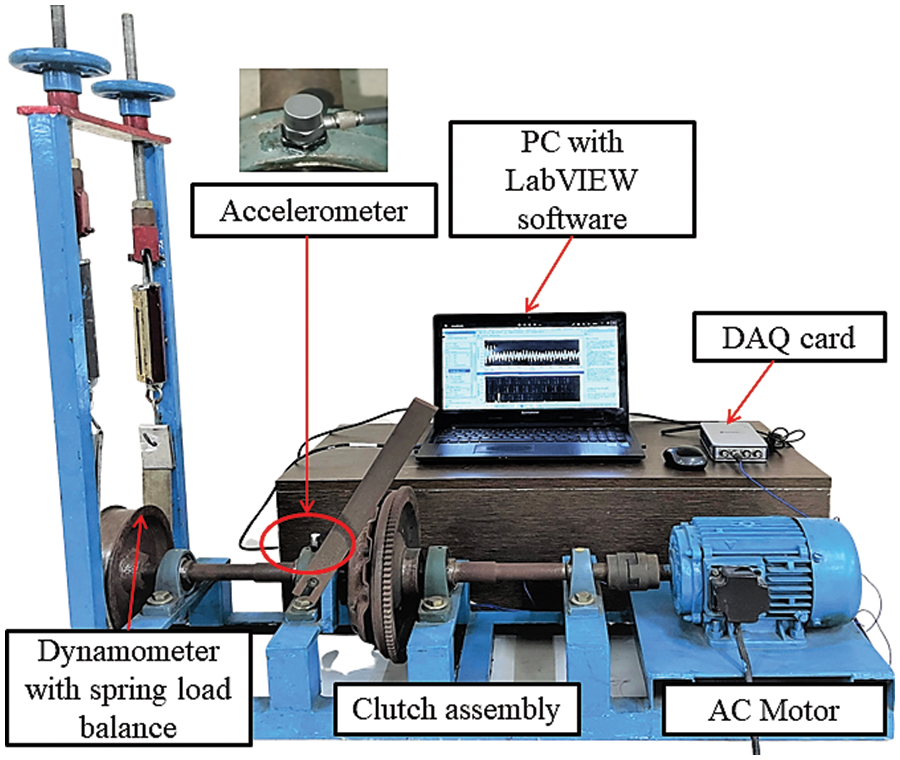
Figure 3: Experimental setup of dry friction clutch system
The creation of digital values from the outside world in order to be viewed, processed, and stored in a computer is known as data acquisition (DAQ). An accelerometer (a piezo-electric sensor with a sensitivity of 10.26 mV/g) is used in the current study to acquire vibration data to diagnose faults in dry friction clutch systems. The sensor is mounted on the bearing of the dry friction clutch system with the help of adhesive. The output of the accelerometer is fed into the NI 9234 DAQ through an USB chassis where the analog vibration signals are converted into digital form after signal conditioning. The DAQ system is supported by the NI LabVIEW software to perform the data collection.
2.3 Faults in Single Plate Dry Clutch System
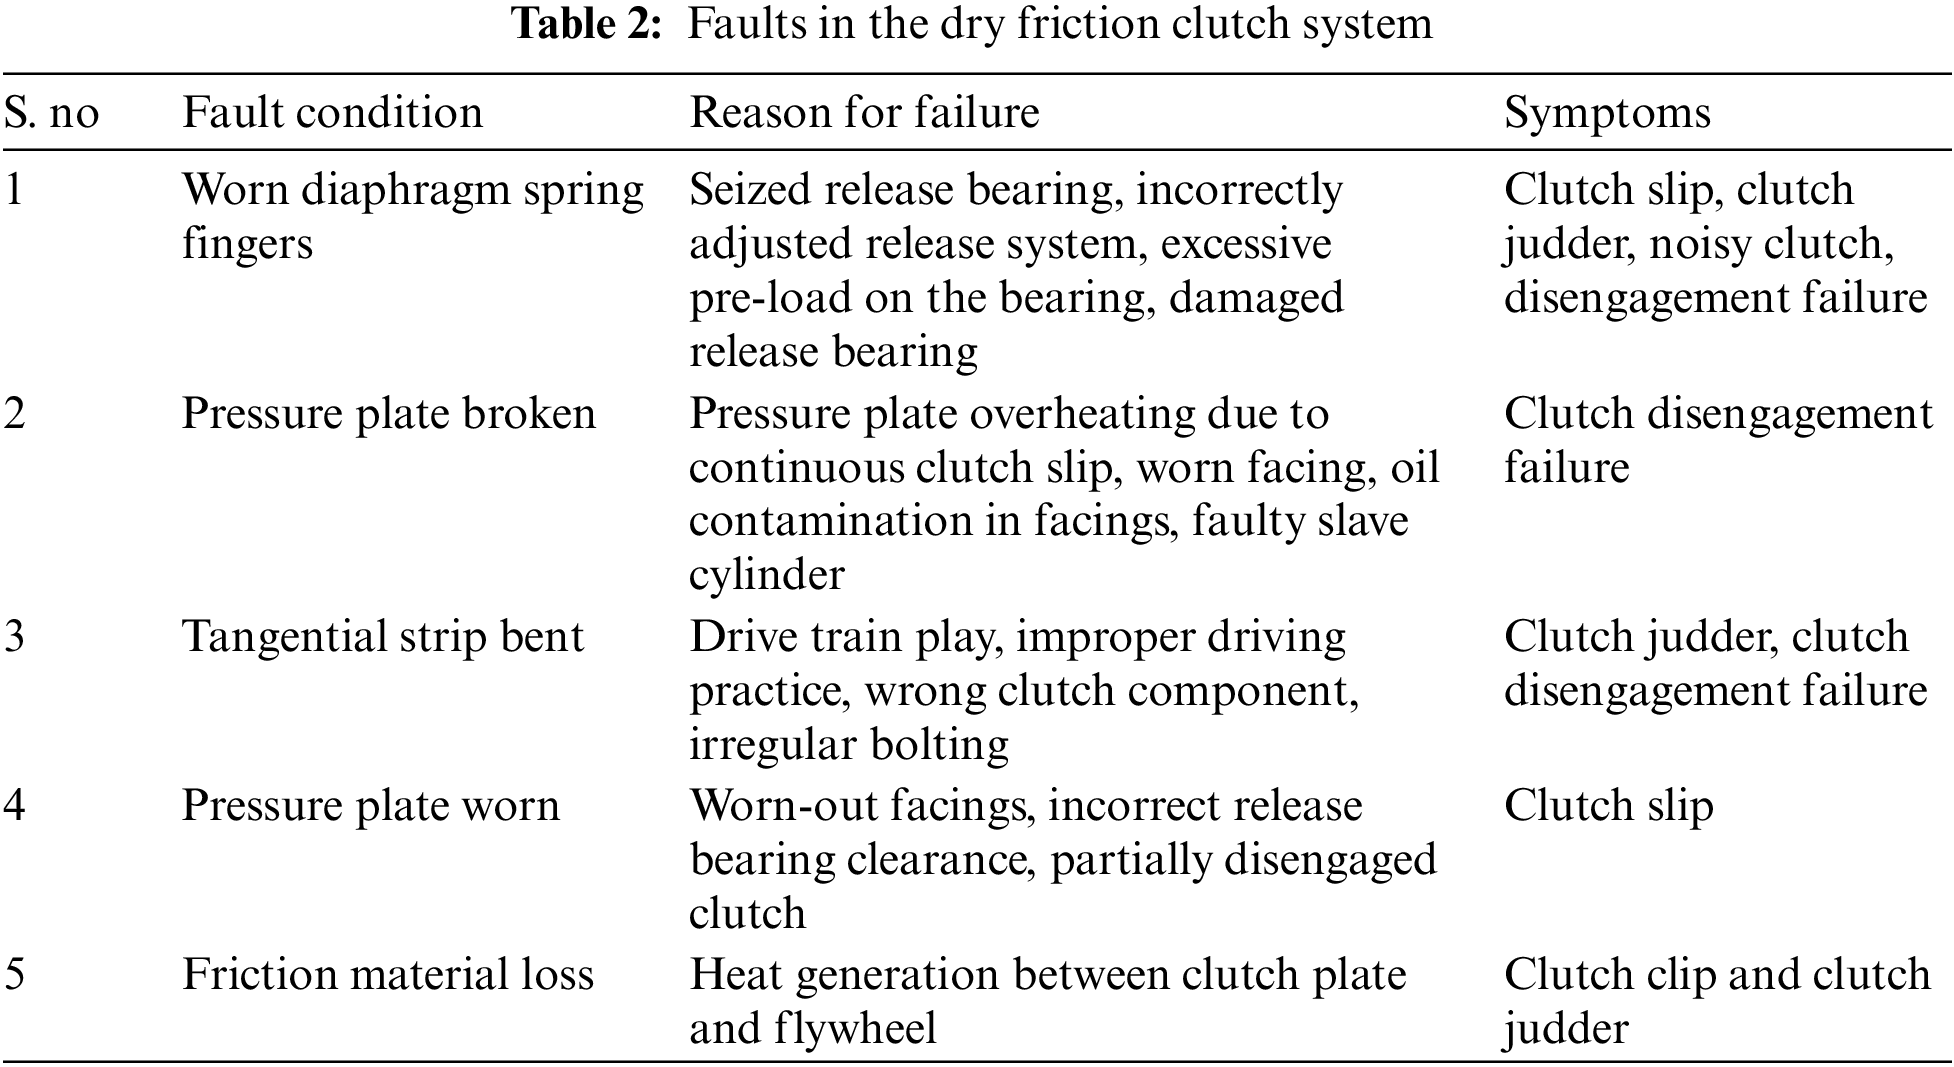
A single plate dry clutch is one of the essential components in the transmission system that channels the power transmission to the wheels from the engine through other transmission components. The pressure plate, friction plate, release fingers, diaphragm spring, release bearing and clutch housing are assembled to form a clutch system. In general, a single plate dry clutch system is subjected to load and thermal stresses throughout its operational lifetime. Additionally, prolonged usage, improper usage, half clutch, degradation of internal components over time, moisture and corrosion can lead to fault occurrences in dry friction clutch and its components. The presence of faults in a dry friction clutch system will hinder the performance, reliability and lifespan of the system. Table 2 depicts the various faults in dry clutch system and reasons to fault occurences.
3 Machine Learning (ML) Approach
The ML technique is built on three phases: feature extraction, selection and classification. Several feature extraction strategies have been studied in the literature, including histogram, statistical and wavelet-based models. In this investigation, statistical characteristics were employed to diagnose faults. Vibration data recorded under various fault circumstances were used to extract the statistical characteristics. Not all statistical characteristics will be suitable for categorization. As a result, the most essential traits that comprise the requisite categorization information must be selected. The section covers the feature extraction, selection and classification methods used in the study.
3.1 Statistical Feature Extraction
The extraction of features reflects the estimation of specific measurements characterizing the vibration signal. The input in this analysis is the vibration signal collected from the clutch system at various load and fault conditions. The input consists of 8192 digital vibration signals, and each input data point is necessary. Handling a large number of data points can be a challenging task if each data point is treated as potential input to the classifier. However, researchers applied various parameters to minimize the number of input data points. The parameters utilized for reducing the input data are termed features. Extracting quality features and selecting significant features are necessary to achieve an enhanced performance of classifiers. In the current study, statistical features like mean, standard deviation, mode, sample variance, standard error, minimum, skewness, range, kurtosis, median, sum and maximum were extracted.
Selection of features is essential in the machine learning process. The method of selecting the features can be used to boost the accuracy of classifiers or to enhance their output in high-dimensional data sets. The training process may be misled by irrelevant input features which tends to increase computational time. Thus, neglecting input features with low output influence can limit the size of the approximation model. A significant factor in predicting the accuracy of classification is the feature selection procedure. The present work involves vast range of statistical measurements. All features do not contribute equally towards classification. However, certain features yield more meaningful information that can increase the classification, and the method of selecting such significant features is termed feature selection. Various techniques, namely Decision tree (J48), PCA etc., were used in selecting significant features. In this study, the feature selection procedure was carried out using the J48 decision tree method. The top node of the decision tree denotes the most significant node, and the order of significance reduces while descending to the bottom. Less discriminatory features will be actively discarded (if the threshold is chosen), which helps in selecting good features.
Random forest (RF) is a classification and regression-based, ensemble model. The decision taken by a random forest model is based on the decision-making group of a variety of decision trees. The term “forest” indicates the collection of several decision trees to form an RF model. The ensemble approach significantly increases the predictive accuracy [22].
A decision tree is a simple classifier that consists of two stages, namely learning and classification. In the learning process, the decision tree discovers the process of building trees with a collection of the graded training datasets. The decision tree produced during the learning process will be used to classify unlabeled data. A decision tree does have a three-part flowchart-like framework: leaf, branch and root nodes. The internal node tests the performance of available trees in which each leaf in the penultimate node stores the categorization groups. To prevent overfitting, the decision tree should be pruned such that the tree layout condenses [23].
SVM is a supervised machine learning algorithm based on the notion of decision planes designed for classification. The main benefit of the SVM algorithm is that it requires less input features in comparison with other machine learning classifiers. In this method, training data is represented as a series of points separated by a hyperplane in the input parameter space. The hyperplane is an imaginary boundary constructed in space that divides and orients two independent groups, resulting in minimum generalization error. The support vectors are the data points closest to the hyperplane used to express the margin. When the input point is given to the SVM algorithm, it tries to map the point into a specific group (class) based on the side it falls from the hyper margin [24].
Stefanowski developed the Modified Learnable Evolution Model rule induction algorithm (ModLEM). The technique uses a sequential covering scheme to generate a minimum set of decision rules for each class. A set of rules like these seeks to cover all positive samples of a notion while avoiding the negative. The fundamental technique for the rule induction scheme starts with generating a first rule by picking the “best” elementary circumstances sequentially based on the defined criteria [25].
Lazy classifiers do not do any actual work until they have been classified. These classifiers compute the Euclidean distance between the training and test examples before assigning the same class to the test instance closest to the training instance. K* is a classifier that works on individual instances, which means that the class of a test example is determined by the class of the training instances in which it is located, as described by some distance function. Its use of entropy-based separation functions distinguishes it from other instance-based learners. Two variables, global blend and missing mode are used in the calculation. The missing mode controls how the classifier handles missing property valuations, which are handled in four ways [26].
4 Fault Diagnosis in Dry Friction Clutch System using Pre-Trained Models
The following section discusses the various pre-trained networks that are used in the study to diagnose faults in dry friction clutch systems. First, the vibration signals are captured and stored as photographs (vibration plots). The photos are pre-processed and downsized to 224 × 224 or 227 × 227 pixels, depending on the needs of the pre-trained model. After that, pre-trained networks such as GoogLenet, ResNet-50, AlexNet, and VGG-16 were used to classify the images and understand the condition of the clutch system. In this study, transfer learning is used to rebuild the original weights of the networks trained on ImageNet. In addition, when applying the networks to a custom dataset, the final output layers are modified with additional layers corresponding to the number of classes selected by the user. The workflow of problem diagnosis in a dry friction clutch system utilizing pre-trained networks is represented in Fig. 4. The pre-trained models employed in the study are summarized below.
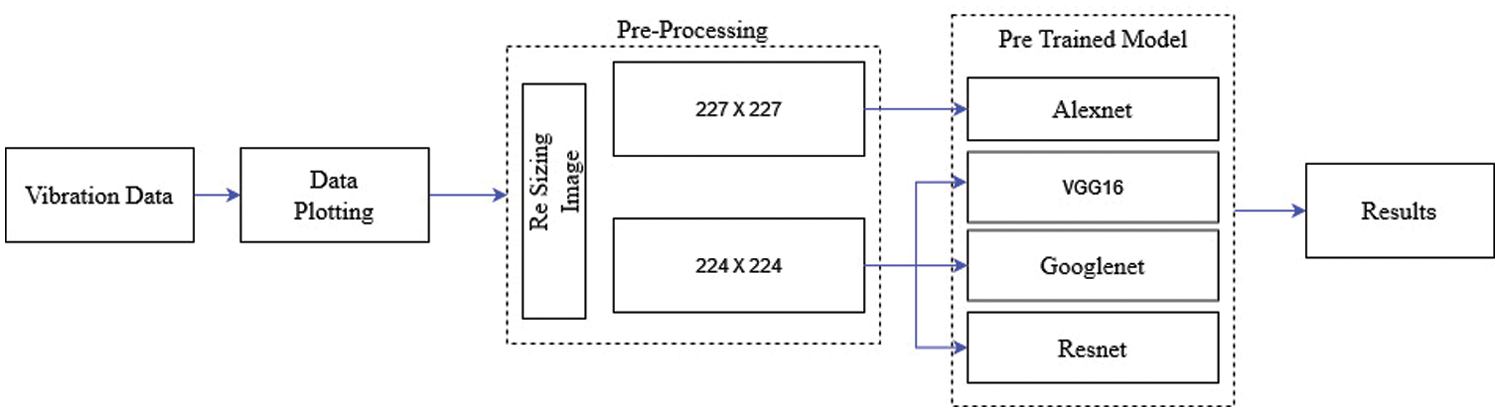
Figure 4: Overall workflow of fault diagnosis in dry friction clutch system using pre-trained networks
4.1 Dataset Formation and Pre-Processing
The vibration signals recorded in this investigation are used to construct a dataset of images, including dry friction clutch system faults. Six test situations are taken into consideration, namely worn diaphragm spring fingers, broken pressure plate, tangential strip bent, pressure plate worn, friction material loss and good condition. The vibration signals are used to create 600 photographs (100 photos for each class). The obtained images were scaled to 224 × 224 or 227 × 227 pixels for the pre-trained network to accept the image as input.
4.2 AlexNet Pre-Trained Network
AlexNet is a tiny network with eight layers that can learn 61 million parameters. The network model was designed to operate with photos with a 227 × 227 input size. While passing through the first convolution layer (which consists of 96 separate 11 × 11 filters), the images are subjected to three operations: convolution, normalization and max pooling, which converge the image to a size of 55 × 55 pixels. The second layer network consists of a 3 × 3 max pooling layer is, followed by 256 receptive filters that decrease the image size to 27 × 27 pixels. While going through the successive convolution layers, the image is further shrunk to a size of 13 × 13 (third, fourth and fifth). After the final convolution layer, two fully connected layers (4096 parameters) are added to convert the matrices to vector form. Finally, to execute the classification of the given problem, an output layer with a softmax layer is provided. To avoid model overfitting, a dropout layer with a ratio of 0.5 is introduced before the fully connected layer [27].
4.3 VGG-16 Pre-Trained Network
VGG16 has three fully connected layers, five max-pooling layers, 13 convolutional layers and a classification layer in its overall design. Convolutional layers are stacked in a specific manner to solve image categorization difficulties. A kernel (of size 3 × 3) with two learnable parameters (B and d) is studied to comprehend the workings of the VGG16 architecture. When an image is passed through the convolution layer, a mathematical action is performed in which the filter moves around the image of z pixels to execute the convolution operation, which results in an output picture y. The working of the convolution operation is represented by the equation y = f (By + d). The earliest layers of VGG16 architecture are dedicated to learning simple features like edges, while the deep layers are used to extract and learn sophisticated feature information [28].
4.4 Google Net Pre-Trained Network
Google Net consists of 22 layers, with applications in facial recognition, robotics, adversarial training and other domains. Nine inception modules are linked to three average pooling, four max-pooling, four convolutions, three softmax and five fully connected layers of the network. Because of the inclusion of inception modules, GoogLeNet can handle any difficulty. The main benefit of employing inception modules is that the module can identify complex characteristics by varying the filter size of convolutional layers. This method can aid in the reduction of dimensional complexity and calculation time. Although the design of GoogLeNet appears to be intense with 22 layers, the volume of trainable parameters is lower than AlexNet [29].
4.5 ResNet Pre-Trained Network
The main advantages of utilizing ResNet are its high convergence and accurate categorization. ResNet designs come in various shapes and sizes, depending on how many leftover units and layers are there (18, 34, 50, 101, 152 and 1202). Identity shortcuts are used when the output identity value closely resembles the identity of the input value, aiding the success of ResNet architectures. ResNet consists of fully connected layers and convolution pooling, just like other networks. The ResNet network architecture is similar to that of the VGG network. The former, on the other hand, is eight times as deep as the final, resulting in a higher number of learnable features. The ResNet-50 architecture used in the study has one fully connected layer and 49 convolution layers [30].
In this section, the performance assessment of deep learning and machine learning approaches are presented in detail. In the machine learning approach, classifiers, namely random forest, SVM, K-star, decision tree and ModLEM were adopted. Similarly, in deep learning, pretrained models like Alex Net, GoogLeNet, VGG16 and ResNet50 were utilized to classify faults in clutch system. We have compared deep learning with the machine learning approaches. The entire experiment was conducted using the desktop versions of WEKA (machine learning) and Matlab 2019b (deep learning). Following is an explanation of the whole experimental study.
5.1 Performance Assessment of Machine Learning Approach
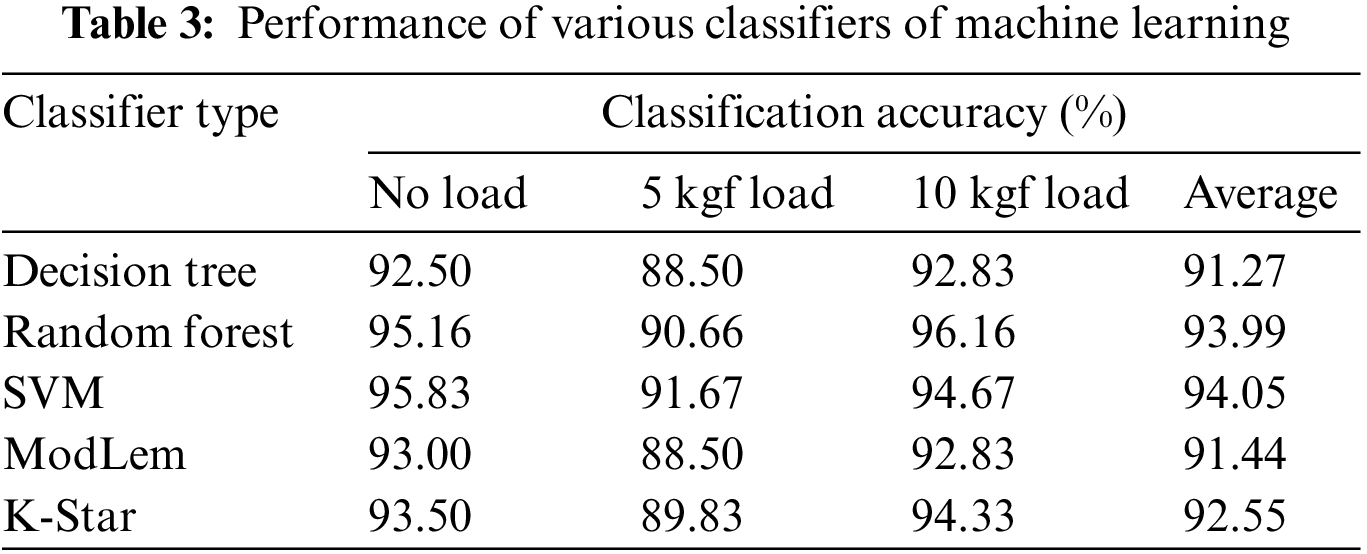
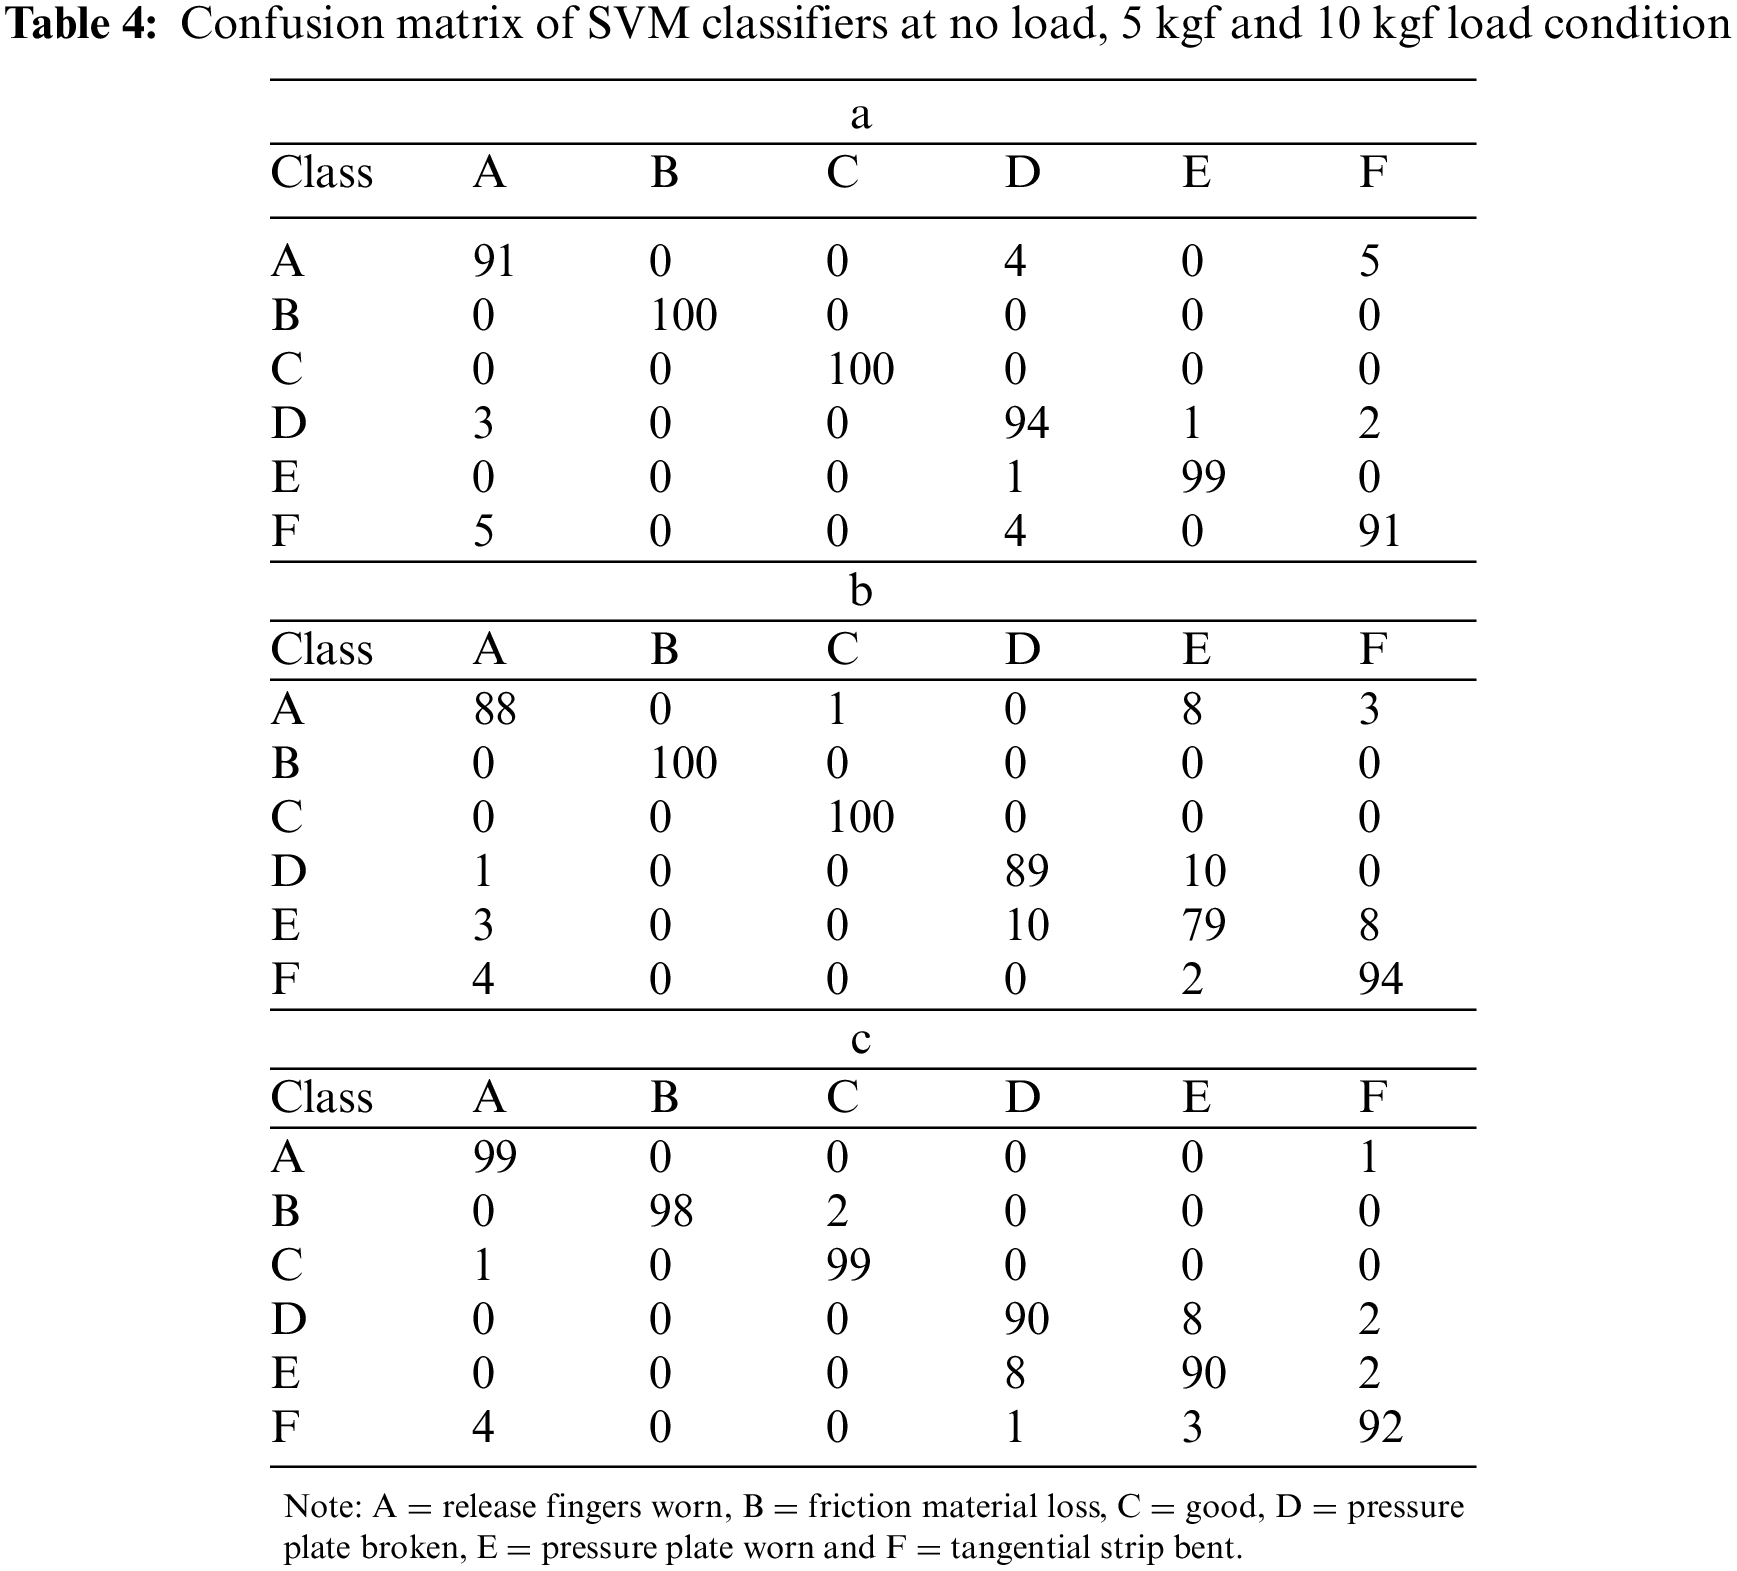
In this section, the performance of machine learning classifiers is evaluated using the obtained signals for various clutch system fault circumstances. The statistical features derived from the obtained vibration signals were then used to pick the most significant features using the J48 decision tree technique. The chosen features were input into several machine learning classifiers to assess the performance of each classifier. The optimum performance of the machine learning algorithms considered in the study is presented in Table 3. From Table 3, one can interpret that the SVM algorithm produces an overall classification accuracy of 94.05%. The corresponding confusion matrix of the SVM algorithm for no load, 5 kgf load and 10 kgf load conditions are given in Tables 4a–4c, respectively. From Table 4a, one can observe that faults such as tangential strip bent, release fingers worn and fault have maximum misclassification of 9, 9 and 6, respectively (out of 100). The probable reason for misclassification can be due to the presence of noise in the signals.
5.2 Performance Assessment of Transfer Learning Approach
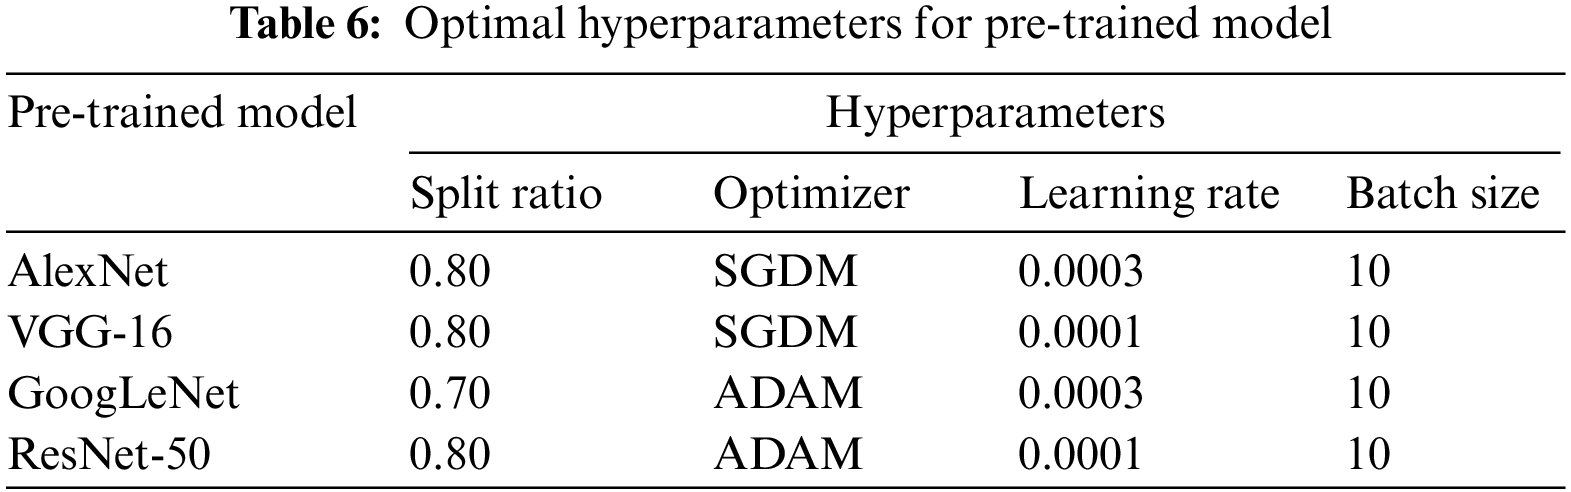
The performance assessment of transfer learning techniques is carried out in the present section. The acquired vibration signals (original signals) are converted in the form of vibration plots of 600 images (100 plots per class). The vibration plots acquired are fed as the input to the different pre-trained CNN models such as Alex Net, GoogLeNet, VGG16 and ResNet50 to assess their image classification capability. The prime advantage of CNN is that no specific feature extraction, selection or classification techniques are necessary, since all the processes are integrated into a single platform. Table 5 indicates that the highest performance was achieved by VGG-16 and ResNet-50 for all the load conditions. Additionally, the time consumed for training VGG-16 and ResNet-50 was 7 min 29 s and 24 min 38 s, respectively. Also, it can be observed that the difference in the overall classification accuracy between all the networks is minimal. However, one may recommend VGG-16 for dry friction clutch fault diagnosis based on the overall classification accuracy, superior classification, and less computing time. Figs. 5a–5c and 6a–6c, respectively, show the training progress and confusion matrix of the best-performing networks for each load condition. Additionally, the best hyperparameters selected for every pretrained network are provided in Table 6.
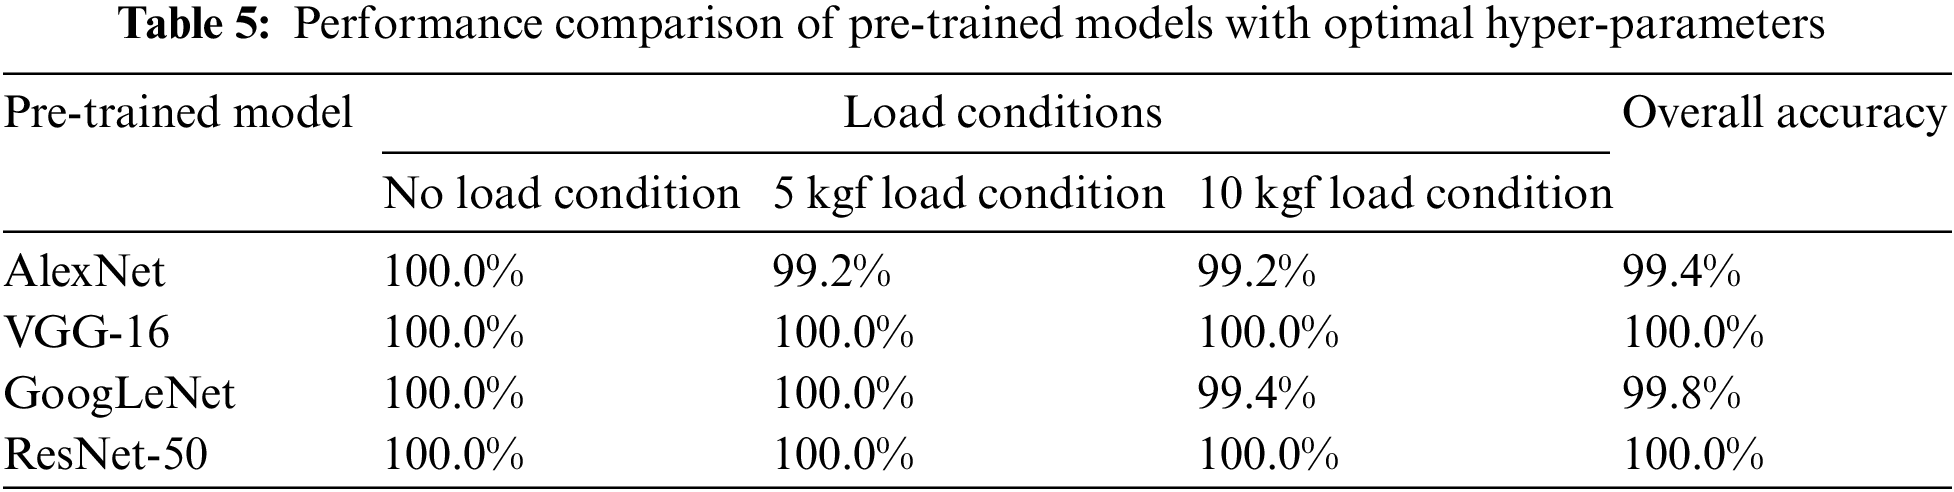
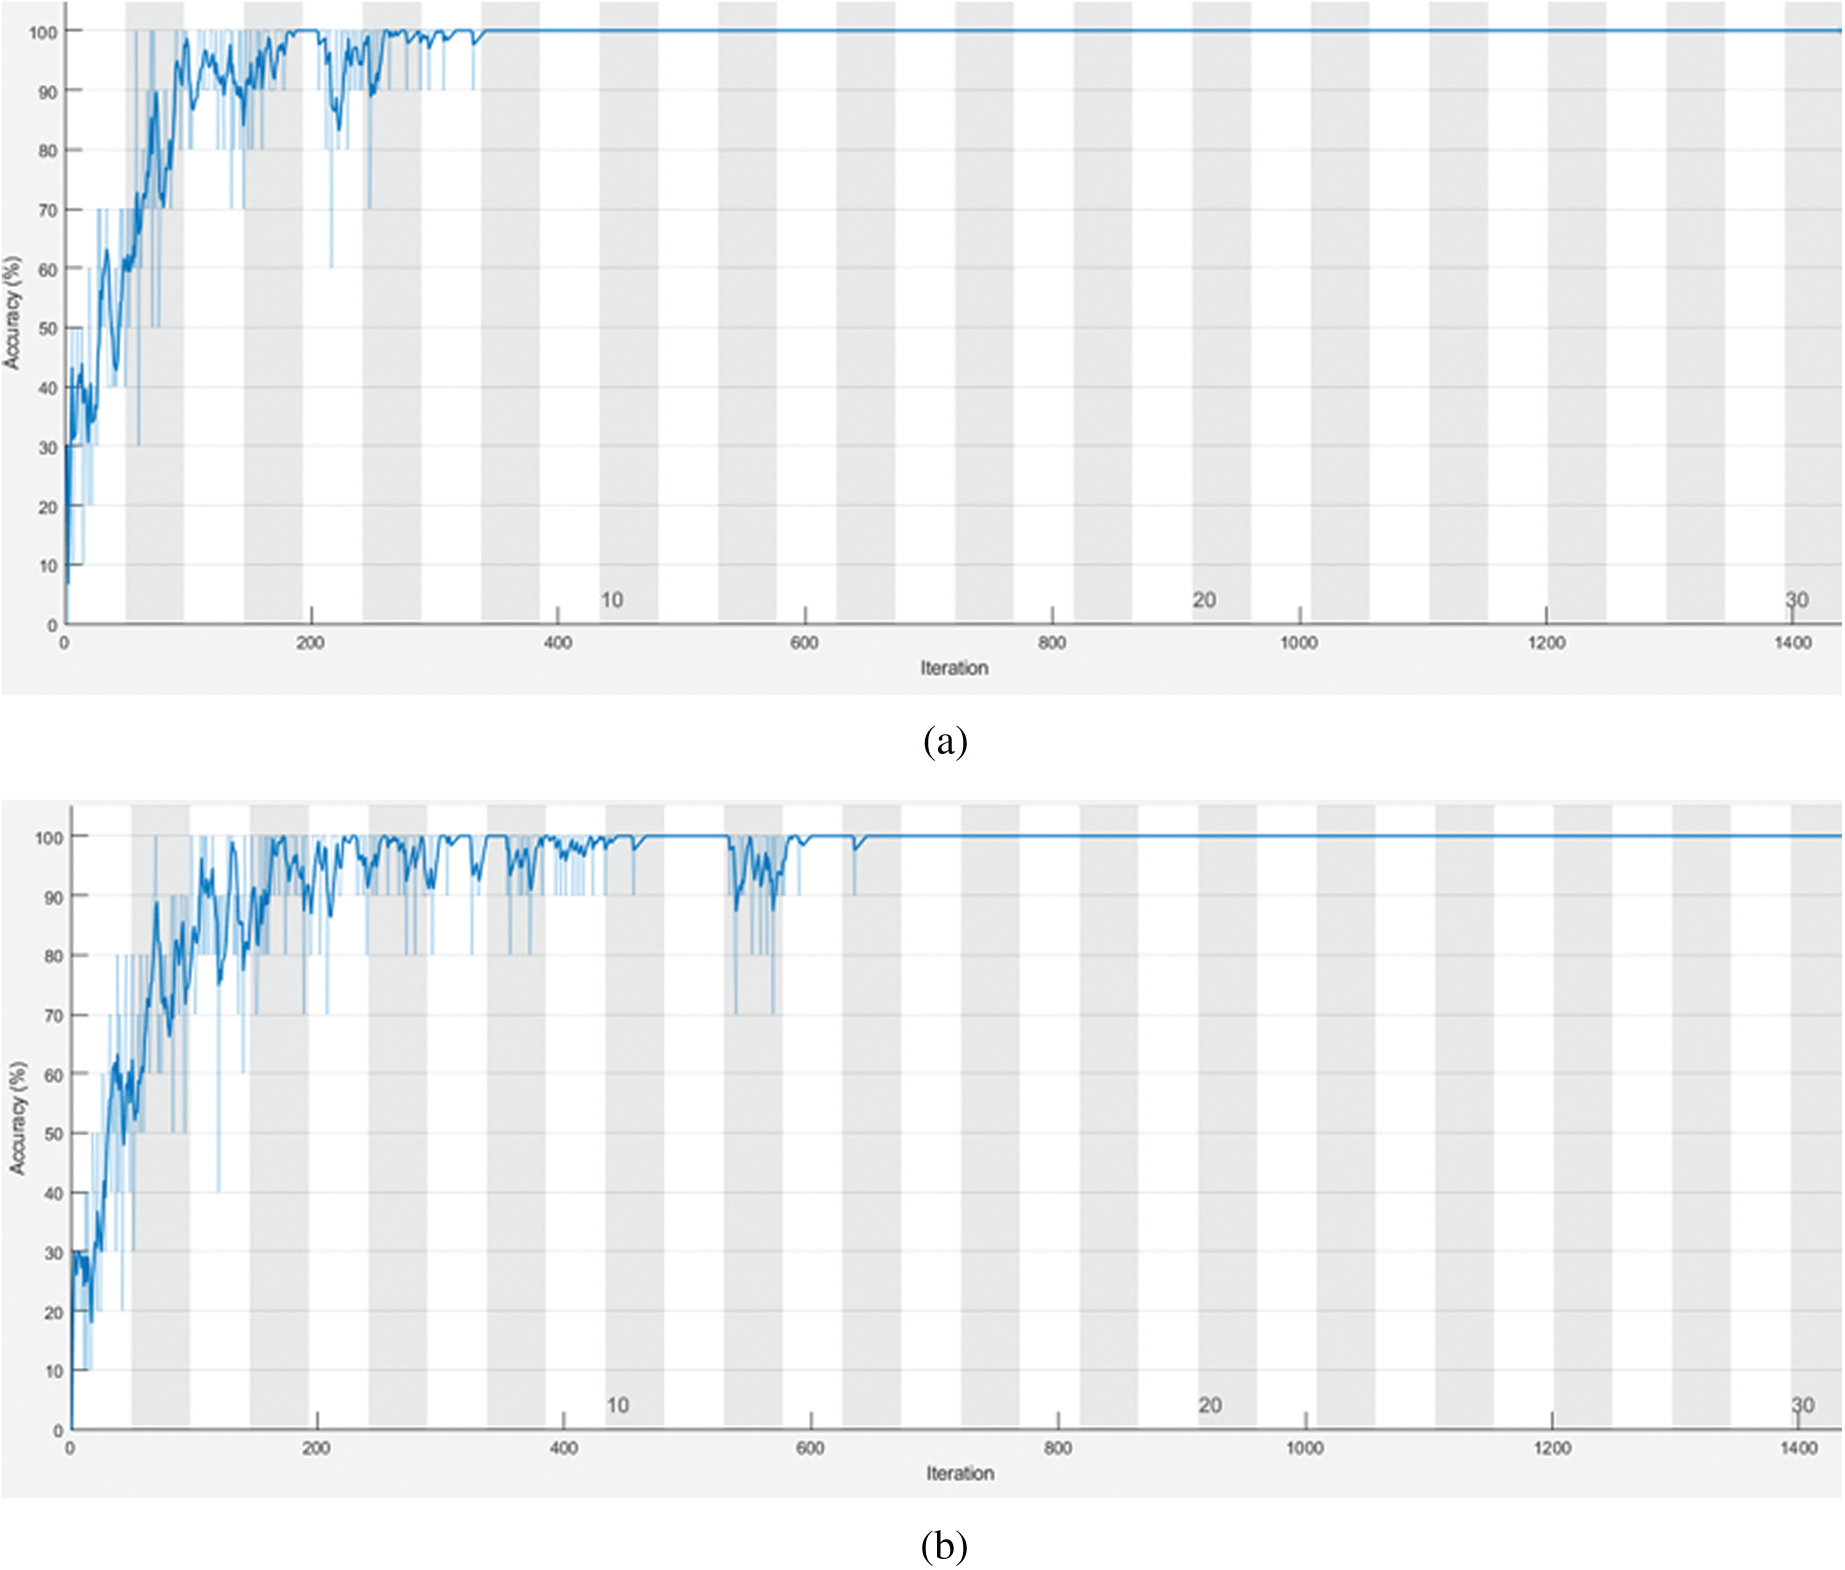
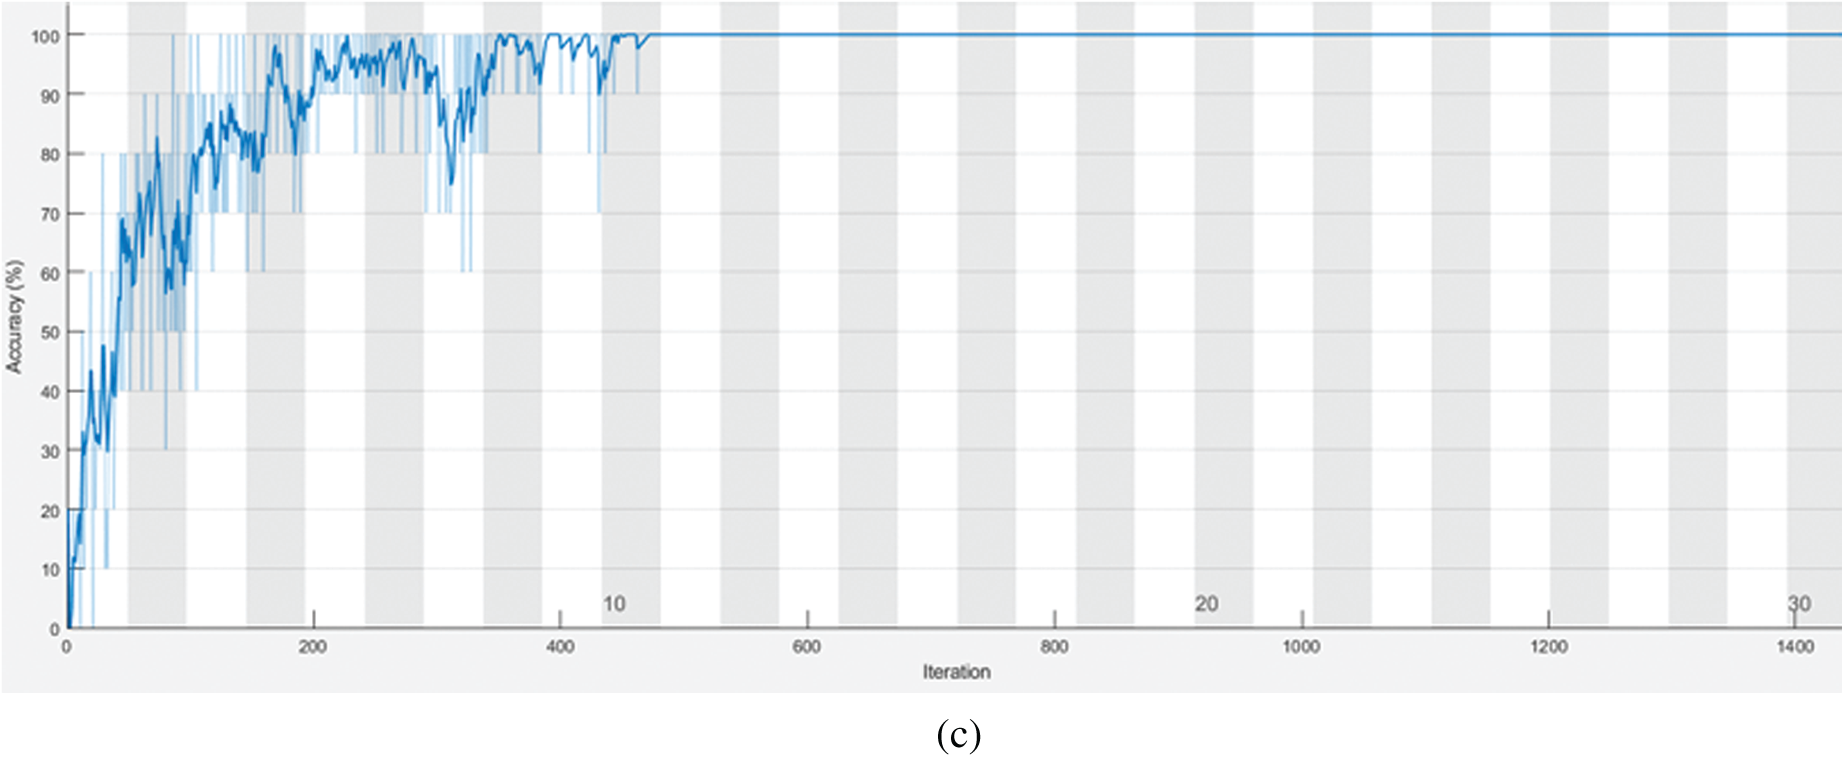
Figure 5: (a) Training progress of VGG-16 network for no load condition. (b) Training progress of VGG-16 network for 5 kgf load condition. (c) Training progress of VGG-16 network for 10 kgf load condition
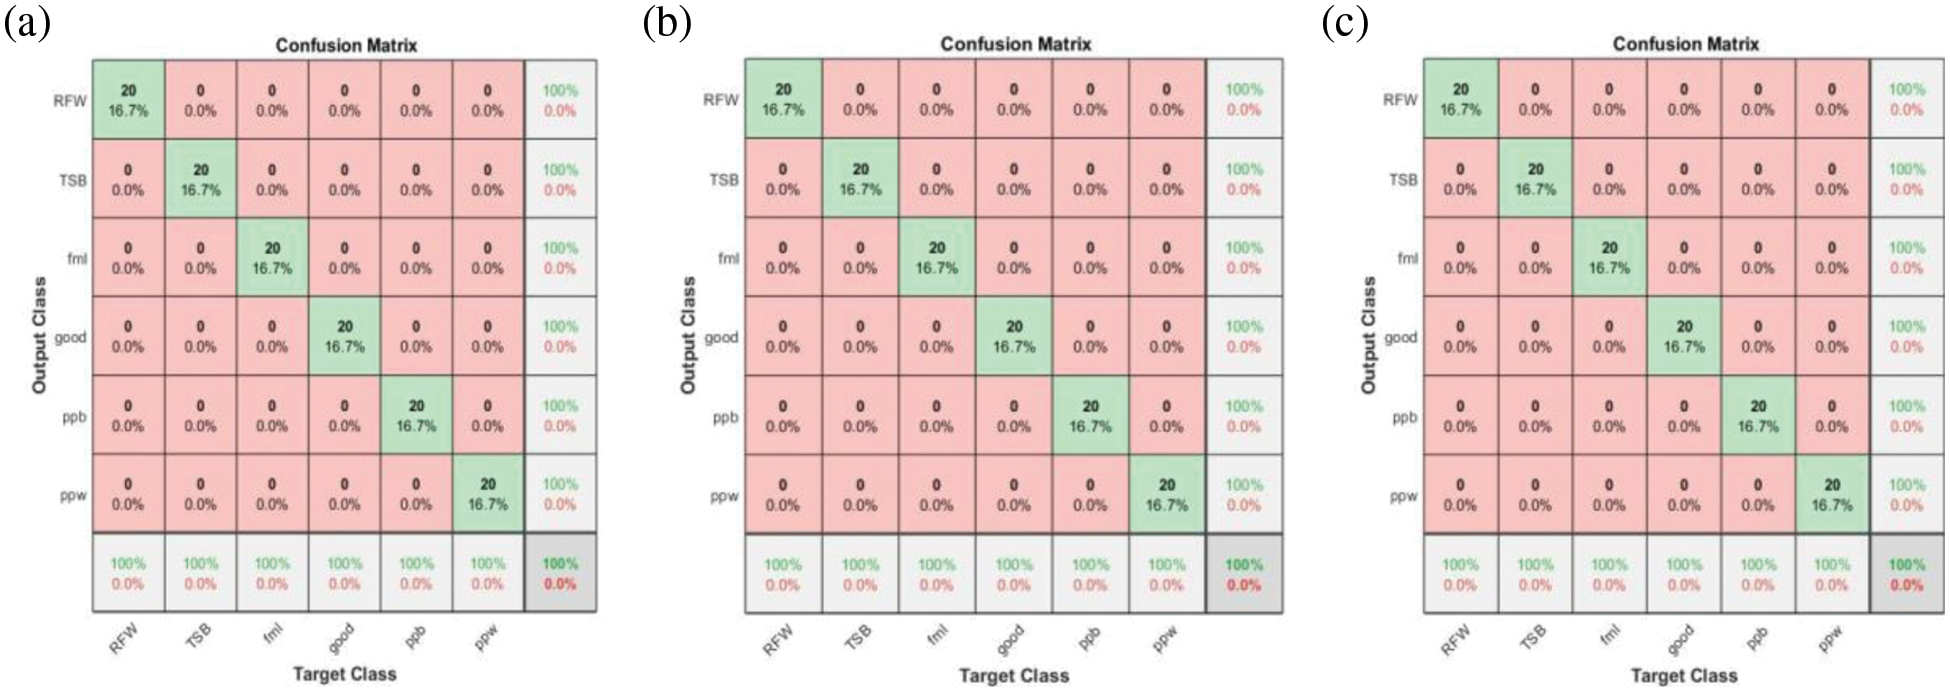
Figure 6: Confusion matrix of VGG-16 network at no load, 5 kgf and 10 kgf condition
One can see that the training process approaches saturation after 12 epochs from the training progressions shown in Figs. 5a–5c. The VGG-16 network has been successfully trained for the provided dry friction clutch system dataset, as shown by the indication of saturation. The selection of the best hyperparameters has significantly decreased the total loss throughout the training process for all networks. Additionally, Figs. 6a–6c depict the confusion matrices of VGG-16 architecture for all the load conditions. The general performance level of a specific model or algorithm is shown by a confusion matrix. Regarding the instances classified in the main diagonal, the confusion matrix evaluation is conducted. The elements on the major diagonal signify instances successfully classified, whereas the other non-diagonal elements denote instances that have been incorrectly classified. The confusion matrix revealed, according to the observations, that the VGG-16 architecture delivered correct classification accuracy for all load circumstances with no misclassifications. The absence of instances of misclassification implies that the network has learned all the characteristics adequately and that the training loss was minimal. As a result of the observation, it is recommended that VGG-16 be used as the best-performing network for diagnosing dry friction clutch faults.
5.3 Comparative Study of Deep Learning and Machine Learning Approaches
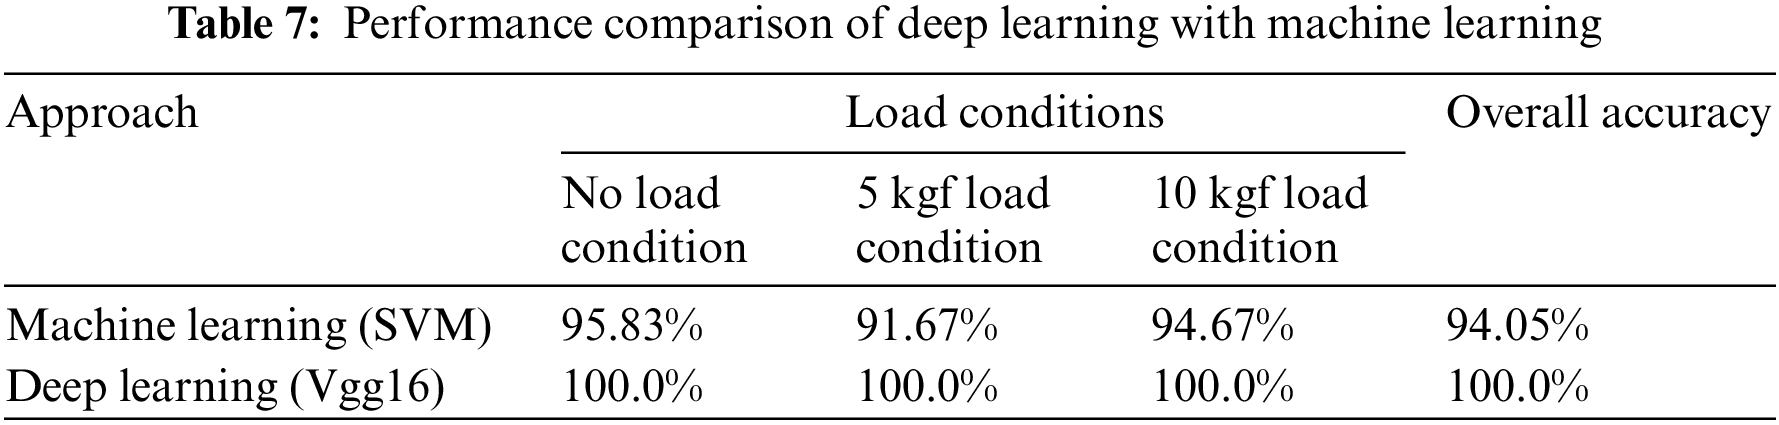
In this study, the performance of the best machine learning classifier (SVM) is compared with the best performing deep learning model (VGG-16). Classification accuracy is considered as the performance evaluating metric in the present study. Table 7 depicts the performance evaluation of machine learning and deep learning algorithms for clutch system fault diagnosis under varying load conditions. Table 7 shows that the performance of VGG16 is significantly higher (100%) than the SVM classifier (94.05%). The performance of CNN based deep learning model is far better than the machine learning algorithms in terms of fault classification accuracy. The time taken for training and testing of the machine learning algorithms is comparatively less than that of deep learning models. The performance of machine learning algorithms for fault diagnosis relies on feature engineering. In general, feature engineering involves extracting features from various feature extraction methods like histogram features, statistical features, factorial features, wavelet features and autoregressive moving average (ARMA) features. Selection of appropriate feature extraction methods requires domain expertise and consumes more time. Additionally, the process of feature selection can be challenging. Machine learning consists of over 50 different classifiers working on different principles. Selecting the best classifier for a specific problem is a time-consuming process and incurs a high risk of manual error. On the other hand, deep learning-based approaches eliminate human interference in the process of feature extraction, selection and classification. Deep learning is an automated approach that integrates the process of feature extraction, selection and classification, thereby reducing the time consumed and eliminating manual error occurrence.
Deep learning-based fault diagnostics are compared with machine learning approaches in this paper. VGG-16, AlexNet, ResNet-50 and GoogLeNet are the four pre-trained deep learning models used to diagnose faults in a dry friction clutch system using vibration plots. Six classifiers were applied in machine learning: decision tree, random forest, SVM, MODLem, Meta classifier and lazy classifiers. The study examined five fault states (worn diaphragm spring fingers, fractured pressure plate, tangential strip bent, pressure plate worn and friction material loss) and one good condition. In this investigation, three different load conditions were used: no load, 5 kgf load and 10 kgf load. The CNN layers of the pre-trained networks provide an integrated strategy of feature extraction, selection and classification, resulting in a machine learning approach. Feature extraction was done using a statistical technique in machine learning, and feature selection was made using the decision (j48) algorithm. The pre-trained networks can interpret vibration graphs and classify them accurately. The results show that the adopted networks have learning capabilities and provide reliable classification results for dry friction clutch failure diagnostics. Various hyperparameters such as the batch size, learning rate and optimizer, train-test split ratio was changed and the best hyperparameters for all of the networks were found. ResNet-50 and VGG-16 were the best-performing networks with 100% accuracy over AlexNet (99.4%) and GoogLeNet (99.8%). In considerations of machine learning, SVM obtains maximum classification accuracy 95.83% 91.67%, 94.67%, respectively, at no load, 5 kgf load and 10 kgf load conditions. Deep learning networks, on the other hand, dominate machine learning techniques regarding classification accuracy. In terms of training time, VGG-16 took 7 min and 29 s, whereas ResNet-50 took 24 min and 38 s. Based on the results of the comparison tests, VGG-16 was chosen as the best performing network among the other networks studied and is recommended for real-time fault diagnosis of dry friction clutch systems.
Funding Statement: The authors received no specific funding for this study.
Conflicts of Interest: The authors declare that they have no conflicts of interest to report regarding the present study.
References
1. T. Hasegawa, M. Saeki, T. Ogawa and T. Nakano, “Vibration-based fault detection for flywheel condition monitoring,” Procedia Structural Integrity, vol. 17, no. 8, pp. 487–494, 2019. [Google Scholar]
2. X. Liu, D. Pei, G. Lodewijks, Z. Zhao and J. Mei, “Acoustic signal based fault detection on belt conveyor idlers using machine learning,” Advanced Powder Technology, vol. 31, no. 7, pp. 2689–2698, 2020. [Google Scholar]
3. K. Ali, K. Niazi, W. Akhtar, H. A. Khan, Y. Yang et al., “Hotspot diagnosis for solar photovoltaic modules using a Naive Bayes classifier,” Solar Energy, vol. 190, no. 9, pp. 34–43, 2019. [Google Scholar]
4. W. Xueyuan, “Fault self-diagnosis system of automatic transmission based on fuzzy BP network,” in 2010 Int. Conf. on Networking and Digital Society, Wenzhou, China, pp. 165–171, 2010. [Google Scholar]
5. S. Natarajan, “Vibration signal analysis using histogram features and support vector machine for gear box fault diagnosis,” International Journal of Systems, Control and Communication, vol. 8, no. 1, pp. 57–71, 2017. [Google Scholar]
6. A. Mehta, D. Goyal, A. Choudhary, B. S. Pabla and S. Belghith, “Machine learning-based fault diagnosis of self-aligning bearings for rotating machinery using infrared thermography,” Mathematical Problems Engineering, vol. 2021, no. 4, pp. 1–15, 2021. [Google Scholar]
7. T. Lan, H. Hu, C. Jiang, G. Yang and Z. Zhao, “A comparative study of decision tree, random forest the convolutional neural network for spread-F identification,” Advances in Space Research, vol. 65, no. 4, pp. 2052–2061, 2020. [Google Scholar]
8. A. Glowacz, R. Tadeusiewicz, S. Legutko, W. Caesarendra, M. Irfan et al., “Fault diagnosis of angle grinders and electric impact drills using acoustic signals,” Applied Acoustics, vol. 179, no. 8, pp. 108070, 2021. [Google Scholar]
9. T. Kohonen, “Exploration of very large databases by self-organizing maps,” in Proc. of Int. Conf. on Neural Network (ICNN’97), Houston, TX, USA, vol. 1, pp. pl1–pl6, 1997. [Google Scholar]
10. Y. Kali and M. Linn, “Science,” International Encyclopedia of Education, vol. 313, no. 7, pp. 468–474, 2010. [Google Scholar]
11. Y. Lecun, Y. Bengio and G. Hinton, “Deep learning,” Nature, vol. 521, no. 7553, pp. 436–444, 2015. [Google Scholar] [PubMed]
12. Z. Chen, X. Zeng, W. Li and G. Liao, “Machine fault classification using deep belief network,” in IEEE Instrumentation and Measurement Technology Conf., Taipei, Taiwan, vol. 2016, pp. 1–6, 2016. [Google Scholar]
13. Y. Zhao and Y. Chen, “Extreme learning machine based transfer learning for aero engine fault diagnosis,” Aerospace Science and Technology, vol. 121, no. 10, pp. 107311, 2022. [Google Scholar]
14. S. Wang, Q. Wang, Y. Xiao, W. Liu and M. Shang, “Research on rotor system fault diagnosis method based on vibration signal feature vector transfer learning,” Engineering Failure Analysis, vol. 139, no. 9, pp. 106424, 2022. [Google Scholar]
15. X. Li, H. Jiang, M. Xie, T. Wang, R. Wang et al., “A reinforcement ensemble deep transfer learning network for rolling bearing fault diagnosis with multi-source domains,” Advanced Engineering Informatics, vol. 51, no. 1, pp. 101480, 2021. [Google Scholar]
16. Y. Zhi, K. Ming, Z. Xuan, G. Fu and Y. Sheng, “Transfer learning method for bearing fault diagnosis based on fully convolutional conditional Wasserstein adversarial networks,” Measurement, vol. 180, no. 8, pp. 109553, 2021. [Google Scholar]
17. H. Zhong, Y. Lv, R. Yuan and D. Yang, “Neurocomputing bearing fault diagnosis using transfer learning and self-attention ensemble lightweight convolutional neural network,” Neurocomputing, vol. 501, no. 8, pp. 765–777, 2022. [Google Scholar]
18. J. Li, M. Lin, Y. Li and X. Wang, “Transfer learning with limited labeled data for fault diagnosis in nuclear power plants,” Nuclear Engineering and Design, vol. 390, no. 4, pp. 111690, 2022. [Google Scholar]
19. J. Li, M. Lin, Y. Li and X. Wang, “Transfer learning network for nuclear power plant fault diagnosis with unlabeled data under varying operating conditions,” Energy, vol. 254, no. 9, pp. 124358, 2022. [Google Scholar]
20. F. Jamil, T. Verstraeten, A. Nowé, C. Peeters and J. Helsen, “A deep boosted transfer learning method for wind turbine gearbox fault detection,” Renewable Energy, vol. 197, no. 9, pp. 331–341, 2022. [Google Scholar]
21. Y. Zhu, C. Zhu, J. Tan, Y. Tan and L. Rao, “Anomaly detection and condition monitoring of wind turbine gearbox based on LSTM-FS and transfer learning,” Renewable Energy, vol. 189, no. 4, pp. 90–103, 2022. [Google Scholar]
22. X. Zhou, P. Lu, Z. Zheng, D. Tolliver, A. Keramati et al., “Accident prediction accuracy assessment for highway-rail grade crossings using random forest algorithm compared with decision tree,” Reliability Engineering and System Safety, vol. 200, no. 8, pp. 106931, 2020. [Google Scholar]
23. A. Joshuva, S. Sivakumar, R. Sathishkumar, G. Deenadayalan and R. Vishnuvardhan, “Fault diagnosis of wind turbine blades using histogram features through nested dichotomy classifiers,” International Journal of Adavnced Technology and Engineering Exploration, vol. 8, no. 9, pp. 193–201, 2019. [Google Scholar]
24. D. Acharya, S. Goel, H. Bhardwaj, A. Sakalle and A. Bhardwaj, “A long short term memory deep learning network for the classification of negative emotions using EEG signals,” in Int. Joint Conf. on Neural Networks (IJCNN) 2020, Glasgow, UK, pp. 1–8, 2020. [Google Scholar]
25. J. Stefanowski, “The bagging and n2-classifiers based on rules induced by MODLEM,” Lecture Notes in Computer Science, vol. 3066, no. 6, pp. 488–497, 2004. [Google Scholar]
26. J. G. Cleary and L. E. Trigg, “K*: An instance-based learner using an entropie distance measure,” in Proc. of the 12th Int. Conf. on Machine Learning 1995, Tahoe City California, USA, pp. 108–114, 1995. [Google Scholar]
27. A. M. Anwar and A. M. Eldeib, “EEG signal classification using convolutional neural networks on combined spatial and temporal dimensions for BCI systems,” in 42nd Annual Int. Conf. of the IEEE Engineering in Medicine & Biology Society (EMBC) 2020, Montreal, QC, Canada, pp. 434–437, 2020. [Google Scholar]
28. Y. Zhang and Y. Shen, “Parallel mechanism of spectral feature-enhanced maps in EEG-based cognitive workload classification,” Sensors, vol. 19, no. 2, pp. 16–19, 2019. [Google Scholar]
29. B. Michalski and M. Plechawska-Wójcik, “Comparison of LeNet-5, AlexNet and GoogLeNet models in handwriting recognition,” Journal of Computer Science Institute, vol. 23, no. 4, pp. 145–151, 2022. [Google Scholar]
30. J. S. Huang, Y. Li, B. Q. Chen, C. Lin and B. Yao, “An intelligent EEG classification methodology based on sparse representation enhanced deep learning networks,” Front Neuroscience, vol. 14, no. 9, pp. 1–8, 2020. [Google Scholar]
Cite This Article
 Copyright © 2023 The Author(s). Published by Tech Science Press.
This work is licensed under a Creative Commons Attribution 4.0 International License , which permits unrestricted use, distribution, and reproduction in any medium, provided the original work is properly cited.
 Downloads
 Citation Tools