
 Submit a Paper
 Propose a Special lssue
 Open Access
ARTICLE

An Automatic Classification Grading of Spinach Seedlings Water Stress Based on N-MobileNetXt
School of Information Technology, Jilin Agricultural University, Changchun, 130118, China
* Corresponding Author: Helong Yu. Email:
Intelligent Automation & Soft Computing 2023, 37(3), 3019-3037. https://doi.org/10.32604/iasc.2023.040330
Received 14 March 2023; Accepted 24 May 2023; Issue published 11 September 2023
 View Full Text
 Download PDF
Abstract
To solve inefficient water stress classification of spinach seedlings under complex background, this study proposed an automatic classification method for the water stress level of spinach seedlings based on the N-MobileNetXt (NCAM+MobileNetXt) network. Firstly, this study reconstructed the Sandglass Block to effectively increase the model accuracy; secondly, this study introduced the group convolution module and a two-dimensional adaptive average pool, which can significantly compress the model parameters and enhance the model robustness separately; finally, this study innovatively proposed the Normalization-based Channel Attention Module (NCAM) to enhance the image features obviously. The experimental results showed that the classification accuracy of N-MobileNetXt model for spinach seedlings under the natural environment reached 90.35%, and the number of parameters was decreased by 66% compared with the original MobileNetXt model. The N-MobileNetXt model was superior to other network models such as ShuffleNet and GhostNet in terms of parameters and accuracy of identification. It can provide a theoretical basis and technical support for automatic irrigation.Keywords
Spinach is in great demand in Chinese market. The shortage of water during the growth period will directly lead to slow growth, aging of leaves, and easily cause downy mildew. High temperature and dry environment will promote organ development and premature wilt. In particular, spinach seedling has a high demand for water. Lack of water will lead to slow growth of seedlings, and even lead to premature death, which is an important factor of spinach losses.
In the process of growing spinach, it is necessary to detect in real time whether spinach seedlings need water, and the automatic irrigation is a good solution. The precondition for the automatic irrigation is to accurately determine whether the crop is short of water or not, which is mainly determined according to the soil water content [1–4]. In 2020, Trinh et al. [5] got the environmental data such as air temperature and humidity through ZigBee network, and calculated the irrigation amount for vegetables in the greenhouse. The vegetables under different growth conditions would be automatically irrigated by opening or closing the solenoid valve. In 2022, Saini et al. [6] obtained soil temperature, light intensity and weather information by a wireless sensor network, achieving automatic irrigation controlled by the Internet of Things system. In 2020, Millán et al. [7] monitored two drippers at each control point under the olive tree, and installed 4 humidity sensors at different depths under each dripper, achieving automatic irrigation for olive trees. In 2020, Roy et al. [8] established a connection network to access rice field information using GPRS (General Packet Radio Service) and remote repository data server. They observed the rice water shortage manually, and irrigation operation would be controlled remotely by GSM and the Internet when rice need watering. In 2022, Li et al. [9] set up a rice field environment monitoring station to observe the water depth or soil humidity manually. When the staff found that the rice field needed to be irrigated, they would send instructions to the inlet gate with an authorized cell phone, and then the water entered the field for irrigation. It is not accurate to judge water shortage by measuring the environmental information such as air temperature, air humidity and light intensity [10,11], or by manual inspection. Detecting soil moisture content by sensors directly has advantage in accuracy [12,13], while it is cumbersome in the process of deploying equipment and has strict requirement for terrain. Both of them are not the best methods for detecting soil water deficiency. The water shortage of crops can be judged by observing the phenotypic changes of plant from images, which is a new research direction for simple operation and high recognition accuracy and recognition efficiency.
At present, the technologies of image processing and deep learning have been widely used in agriculture. In 2017, Kho et al. [14] proposed a system identifying three kinds of ficus plants with similar leaf morphology automatically. They used the neural network and SVM (support vector machine) models for training, respectively. The accuracy of the system in identifying ficus leaf images reached 83.3%. In 2019, Tian et al. [15] proposed an improved model combining YOLOv3 and DenseNet to detect apples in different ripeness under complex situations, and the F1 score of this method achieved 81.7%. In 2020, Pattnaik et al. [16] introduced a transfer learning framework based on pre-trained deep convolutional neural networks. They used the DenseNet169 model to identify tomato pests in 10 classes, with the model accuracy of 88.83%. In 2022, Unal et al. [17] used SqueezeNet to classify 3 different coffee beans by using their images with an accuracy of 87.3%. In 2022, Du et al. [18] proposed a model to detect spikelets needed to be removed from the grape inflorescence. This model is based on improved YOLOV5s and Kmeans under the complex environment, and the mAP achieved 90.0%. In 2023, Gui et al. [19] proposed a recognition model based on the Yolov5 model. Ghost_conv module and BAM were used to identify tea bud, and the model Precision reached 88.72%. In addition, Wang et al. [20] proposed RNN-based method can effectively predict the crack change of the concrete dam. The crack width of the Longyangxia Dam is modeled and tested by using the Gated Recurrent Unit (GRU) and Long Short-Term Memory (LSTM). So, it is feasible to use computer technology for predictive classification of targets. It also proves that the network model used in this study and the above network models are both deep network models, which are able to do the task of the automatic classification grading of spinach seedlings water stress in this study.
The plant features extracted by convolutional neural network have strong generalization ability, so it is feasible to judge the water stress level based on neural network by extracting plant phenotypic changes caused by crop water shortage. At present, there are comparatively few research on identifying crop water loss using neural network technology. In 2020, Zhao et al. [21] introduced a method for diagnosing the water stress degree of tomato leaves in real time. The DenseNet169 model was pre-trained on ImageNet data set to obtain the weights, which were used to the classification model of water stress degree for tomato leaves by transfer learning. The model classification accuracy reached 94.68%. The image data of tomato used in above study were obtained by masking the background with a pure black wooden board and the background of images is simple. However, in the practical applications, the influence of complex background cannot be avoided. In this study, we collected the spinach seedlings images under natural conditions. The image process uses image enhancement techniques. It is implemented based on Weber–Fechner law, Sparse Decomposition and other techniques [22–25]. We used lightweight neural network to automatically classify spinach seedlings based on changes in plant phenotypes caused by different water stress levels, which would provide theoretical basis and technical support for automatic irrigation.
The significant contributions presented in this research are as follows:
• This study proposed an automatic classification method for the water stress level of spinach seedlings based on the N-MobileNetXt network;
• This study reconstructed the Sandglass Block of MobileNetXt model to effectively increase the model accuracy;
• This study innovatively proposed the Normalization-based Channel Attention Module to enhance the image features.
The paper consists of five sections, where Section 1 explains the shortcomings of current methods for determining whether the water shortage of crops. It is proposed that using deep learning methods will achieve better results. Section 2 covers the process of data production and model improvement methods. Section 3 describes the details of the experiments and outcomes. Section 4 provides a discussion of this study. Lastly, Section 5 covers the study conclusions and future prospects.
The overall content of this study consists of four parts. The data production part includes data collection, data filtering, image pre-processing and data set segmentation. The model methods part includes model selection, attention selection and model improvement. The training and testing part includes hyperparameter selection, optimizer selection, and training and testing. The classification results include four water stress classes of spinach seedlings. As shown in Fig. 1.

Figure 1: Experimental flow chart
Spinach is a cash crop that is in great demand, and it is meaningful and valuable to study spinach seedlings as an object. In this study, spinach seedlings used as samples, which planted in long-slot pots. Four long-slot pots corresponded to four water stress levels (non-stress, grade I stress, grade II stress, and grade III stress). The experiment started from the spinach seedling stage and lasted for 14 days. The soil moisture was measured, using a soil multi-element sensor as shown in Fig. 2. The average soil water content of non-stress is 37.5% (field water content is controlled at 75%–85%), the average soil water content of grade I stress is 21.1% (field water content is controlled at 55%–65%), the average soil water content of grade II stress is 10.2% (field water content is controlled at 35%–45%), and the average soil water content of grade III stress is 5.7% (field water content is controlled at 15%–25%). During the experiment, the soil water content was measured at 8:00 a.m. and 18:00 p.m. every day. We will add the water when the soil water content dropped to the lower limit of the set moisture, keeping it within the corresponding water range and ensuring the reliability of the experiment.

Figure 2: Soil multi-element sensor
The research collected image data with a smart phone. During the shooting process, the image scale was set to 1:1 and the size of the images was 3000 × 3000 px in RGB. The collection objects were spinach seedlings with complex backgrounds taken in natural condition, including smooth light, backlight, sufficient sunlight, overcast days, etc. We considered various conditions in the actual growing environment, thereby enhancing robustness of the model. After data filtering, we obtained 1964 images data in total, including 502 images for non-stress, 520 images for grade I stress, 471 images for grade II stress, and 471 images for grade III stress. We enhanced dataset using brightness enhancement, contrast enhancement, rotation, and horizontal flipping, as shown in Fig. 3. There are 9820 images in the final dataset, with 20% used for test and 80% used for training.

Figure 3: Data enhancement on spinach seedling
The MobileNetXt lightweight network model was proposed by Zhou et al. [26] in 2020. This model is a derivative network model of the MobileNet series, fitting for classification task. The MobileNetXt is born to effectively alleviate information loss and gradient confusion on MobileNetV2 [27], and its performance is better than MobileNetV2. Therefore, this study established a classification model for water stress level of spinach seedlings based on MobileNetXt network.
2.3.1 Improvement of Sandglass Block
In 2021, Liu et al. [28] proposed a novel normalization-based attention module called NAM, which was without parameters and can suppress less salient weights. The structure of NAM is shown in Fig. 4, which is composed of channel attention and spatial attention. The main function is to assist deep neural networks to suppress less salient pixels or channels. The structure of channel attention is shown in Fig. 4a. The contributing factors of weights in batch normalization (BN) can further suppress the less salient channels or pixels, which also could improve the attention mechanism. The structure of spatial attention is shown in Fig. 4b. A scaling factor of BN is applied to the spatial dimension for measuring the importance of pixels, which is named pixel normalization.
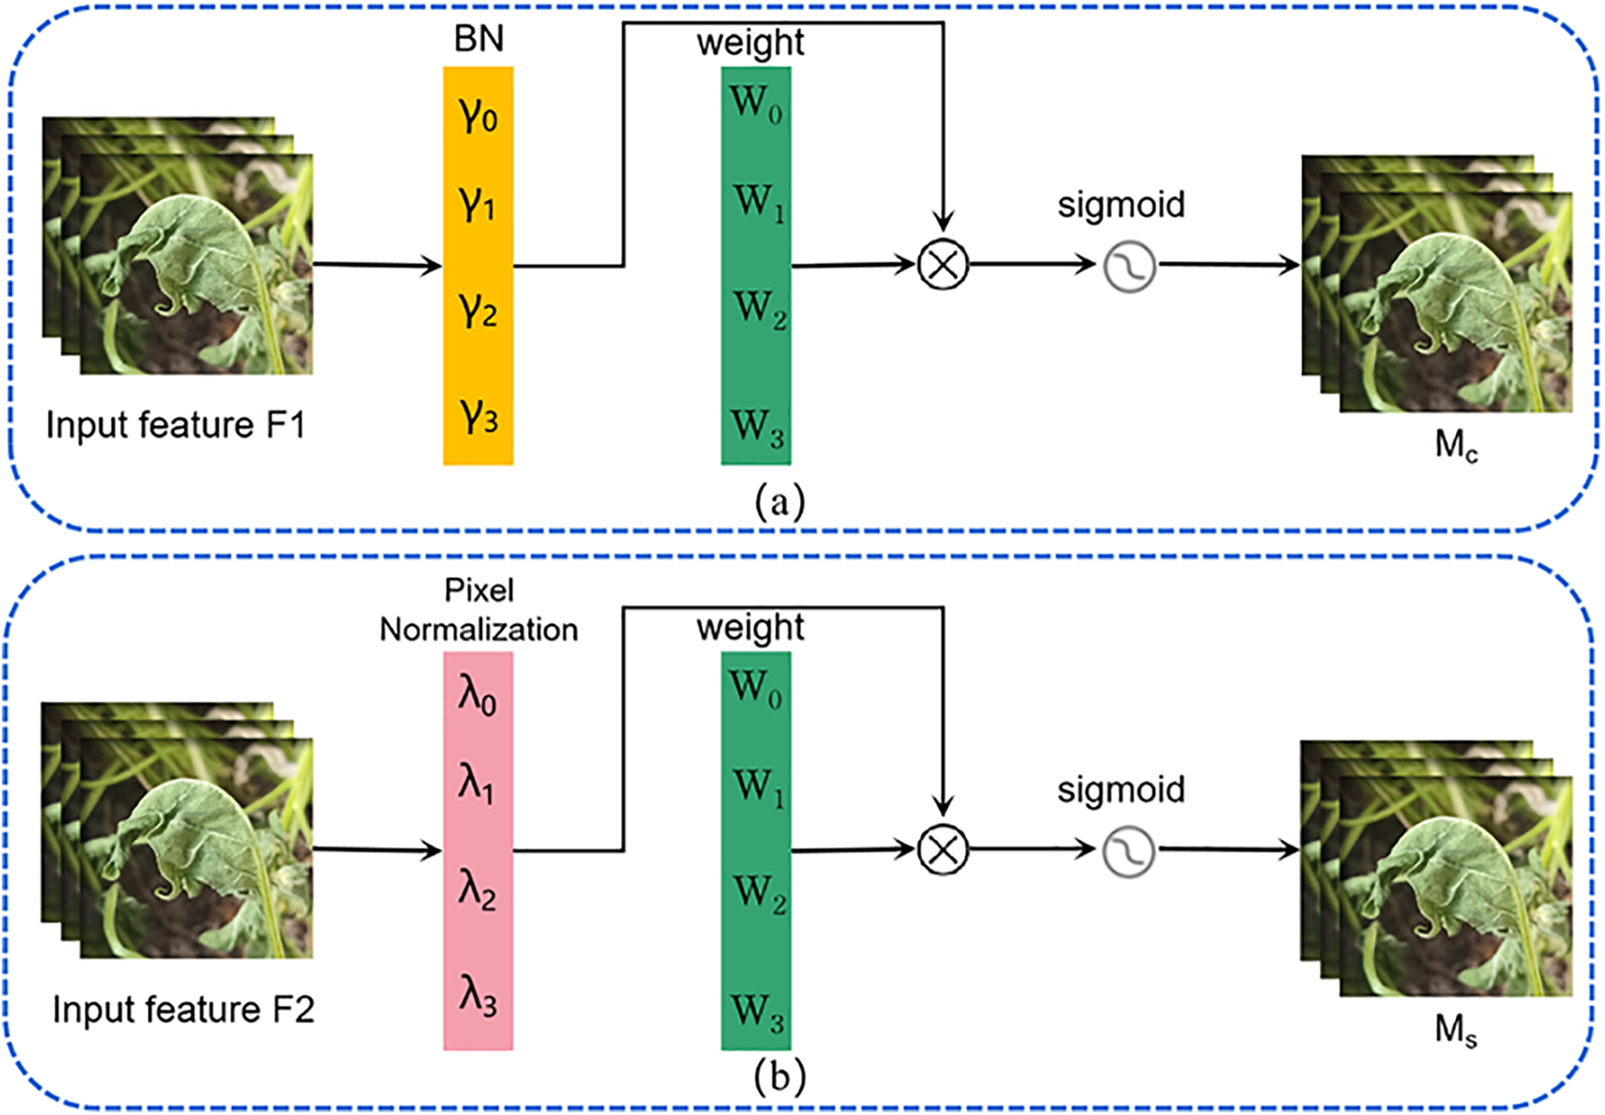
Figure 4: The structure of NAM. (a) Channel attention model; (b) spatial attention model
The MobileNetXt model has proposed a novel Sandglass Block, as shown in Fig. 5a. The Sandglass Block contains two 3 × 3 depth wise convolutions for encoding rich spatial context information. In the middle, two 1 × 1 convolutions are used to change the dimensionality. The “reduction” means channel reduction and the “expansion” means channel expansion. The sandglass block puts shortcut connections outside the bottleneck structure. The Sandglass Block is a generic module that can be easily embedded into existing network architectures and can improve model performance, but its ability of extracting image feature information is still lacking.
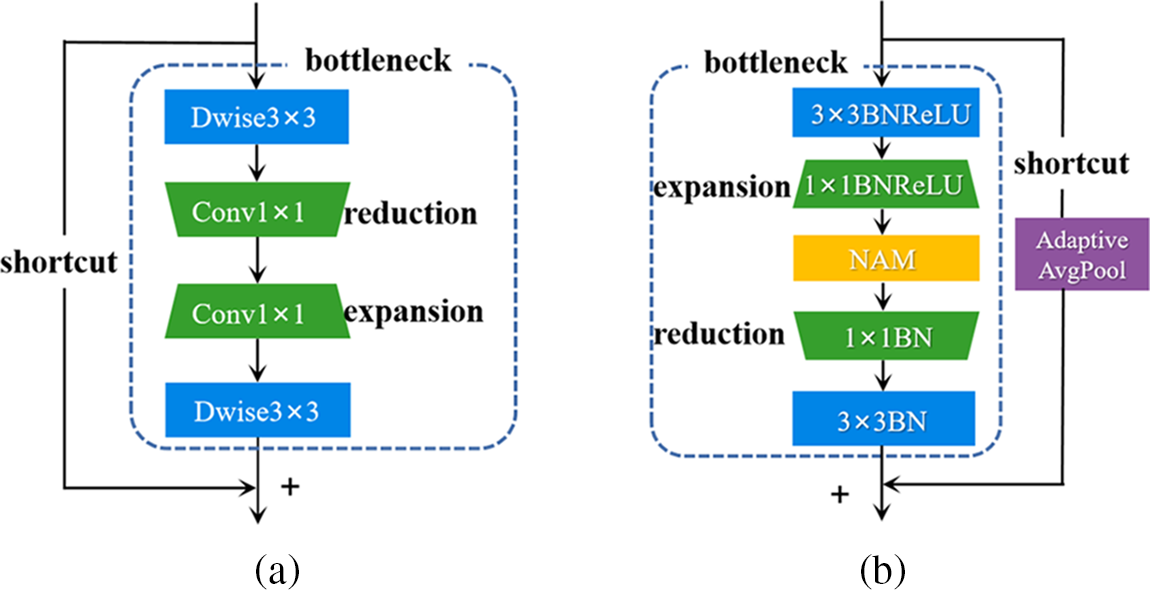
Figure 5: Structure comparison of Sandglass Block. (a) Sandglass Block; (b) improvement Sandglass Block
Therefore, this study introduced NAM to improve the Sandglass Block, as shown in Fig. 5b. This improved module is made up of backbone (bottleneck layer) and shortcut. The structure of bottleneck layer is described as follows. Firstly, a 3 × 3 depth wise convolution is used for encoding rich spatial context information. Secondly, 1 × 1 convolution layer is used to shift the identity mapping from low-dimensional representation to high-dimensional one, since more feature information can be obtained in higher dimensionality. Thirdly, the NAM is introduced to enhance the image features without increasing the number of extra parameters. Fourthly, 1 × 1 convolution layer is used to shift the identity mapping from high-dimensional representation to low-dimensional one. Finally, 3 × 3 deep separable convolution is connected. The shortcut structure is described as follows. The original Sandglass Block may bring poor generalization and a large amount of computation, so a two-dimensional adaptive average pool structure is added to the shortcut, which can improve the robustness of model, further concentrate the data, effectively improve the accuracy of model, and alleviate the large memory pressure of calculation. It should be noted that the shortcut connection will only be triggered when the stride is equal to 1 as well as the same input and output channels. Otherwise, only the bottleneck part will be run.
The improved Sandglass Block uses the expansion layer and projection layer for dimensional changes. The projection layer adopts 1 × 1 convolution network structure to map from low-dimensional representation to high-dimensional one. While the function of extension layer is opposite, 1 × 1 convolution network structure is to map from high-dimensional representation to low-dimensional one. The hyperparameters of the dimensional expansion factor are adjusted according to the complexity of spinach seedling images and the parameter number of the model. The improved model achieved the best performance when the dimension expansion factor was set as 5.
2.3.2 Normalization-Based Channel Attention Module
Classification grading of spinach seedlings water stress is for monitoring the healthy plants and supplementing the missing water timely. The image with single background cannot train the model with good generalization ability. In actual production environments, spinach seedlings are small and dense, while the individual and intact images of spinach seedlings are required in our study. The background of collected image is filled with occluded spinach seedling leaves, which are very similar to the classification target in color and are confused easily. This study proposed the NCAM to realize the classification grading of spinach seedling water stress with complex background. The NCAM innovatively introduced multi-branch parallel structure [29] and greatly improved the accuracy of classification network model using feature enhancement and suppression of less salient image information.
Therefore, we proposed a lightweight attention mechanism based on the CBAM (Convolutional Block Attention Module) [30], named NCAM. Its structure is shown in Fig. 6. This study put NAM, average pooling layer and maximum pooling layer as three parallel branches, which compensates the lack of spatial information extraction and achieves feature enhancement and dimension reduction compression of the feature map. Then the three parallel branches are connected to a shared network (Shared MLP), which composes of multi-layer perceptions. In the shared MLP, the number of channels is compressed by SimConv convolution; the PReLU activation function is connected to SimConv; the number of channels is restored by the SimConv layer. The shared MLP generates three corresponding output feature vectors: nam_out, avg_out, and max_out, which are merged to the output feature vectors using element-wise summation. The output of NCAM is obtained by the sigmoid activation function. NCAM suppresses less salient image information, reduces the number of parameters, and obviously enhances the ability of extracting image feature information for classification model.
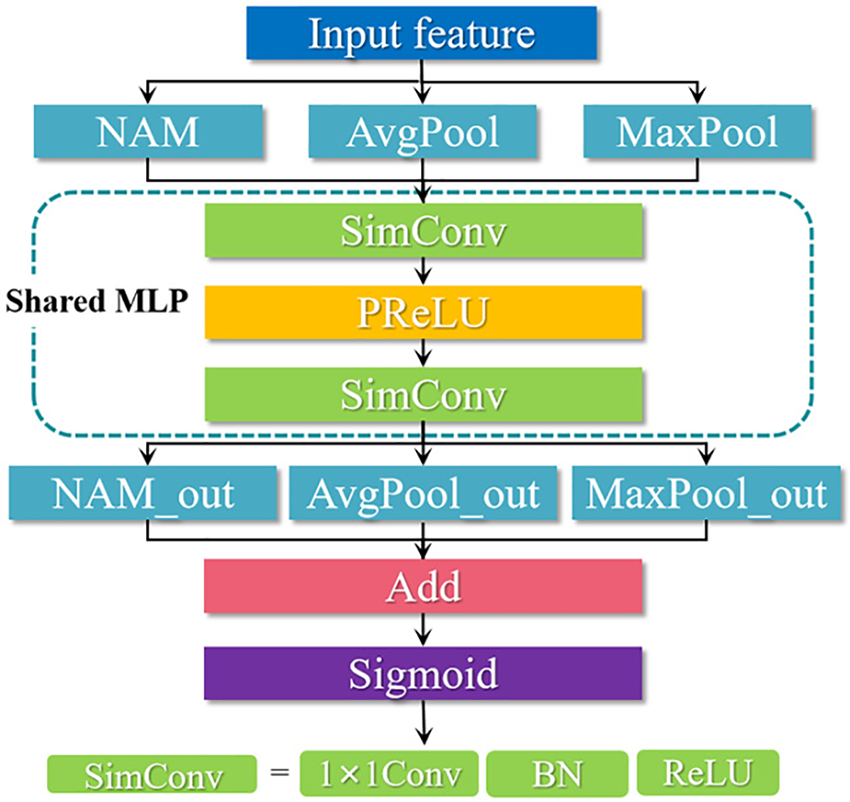
Figure 6: The structure of NCAM
This study introduced the group convolution module as the main structure for layer6 and layer7 to relieve the calculation pressure. The structure of group convolution is shown in Fig. 7. The input feature map is divided into four groups according to channels, and the dimension of each group is
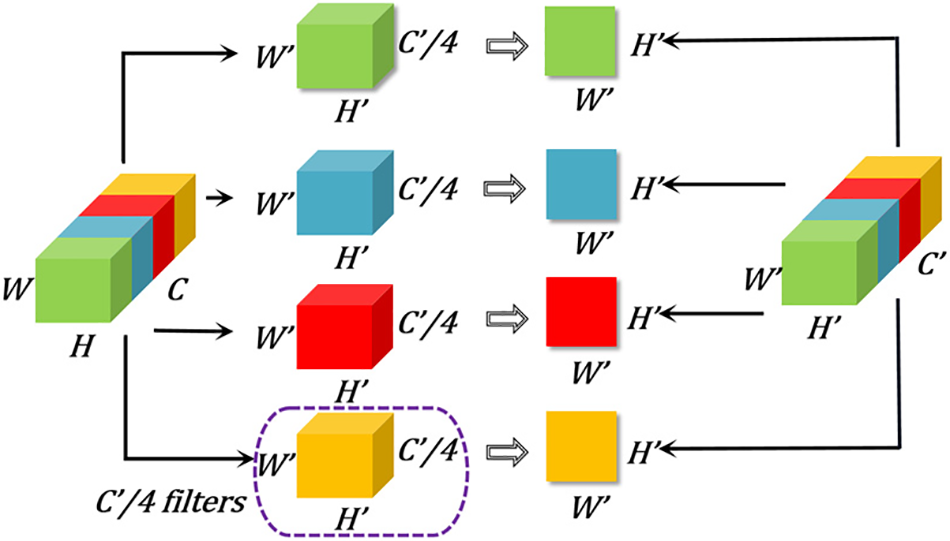
Figure 7: Group convolution module
2.3.4 The Structure of N-MobileNetXt Network
In this study, we proposed an automatic classification model for water stress level of spinach seedlings based on MobileNetXt, solving inefficient water stress classification of spinach seedlings under complex background. The structure of the improved N-MobileNetXt (NCAM+MobileNetXt) network is shown in Fig. 8. This study uses the images of spinach seedlings under complex background as the input for improved model, setting the size as 224 × 224 × 3, and extracts the feature using 3 × 3 convolutional layer, BN and ReLU6 activation function. Kernel size was set to 3 × 3, stride was set to 2 and padding was set to 1 during the convolution extraction process. In the model architecture, the layer1-layer5 and layer8 network layer introduce the reconstructed Sandglass Block for dramatically improving the model recognition accuracy. The group convolution is introduced into layer6 and layer7 network layers to reduce the number of parameters. Each group of convolutions would generate corresponding feature map, which is integrated into a final feature map. For improving the accuracy of the classification model, the novelty NCAM is introduced after layer8 network layer. This module uses a multi-branch design, which can obviously achieve feature enhancement with minimal cost. Two-dimensional adaptive average pooling is used to compress the computation and improve the model robustness. After two-dimensional adaptive average pooling, the dropout layer and the fully connected layer (Linear) are connected to achieve the classification task precisely. The filter is selected as same as the MobileNetXt. This choice leads the model to achieve better accuracy and can extract more effective information of the image.
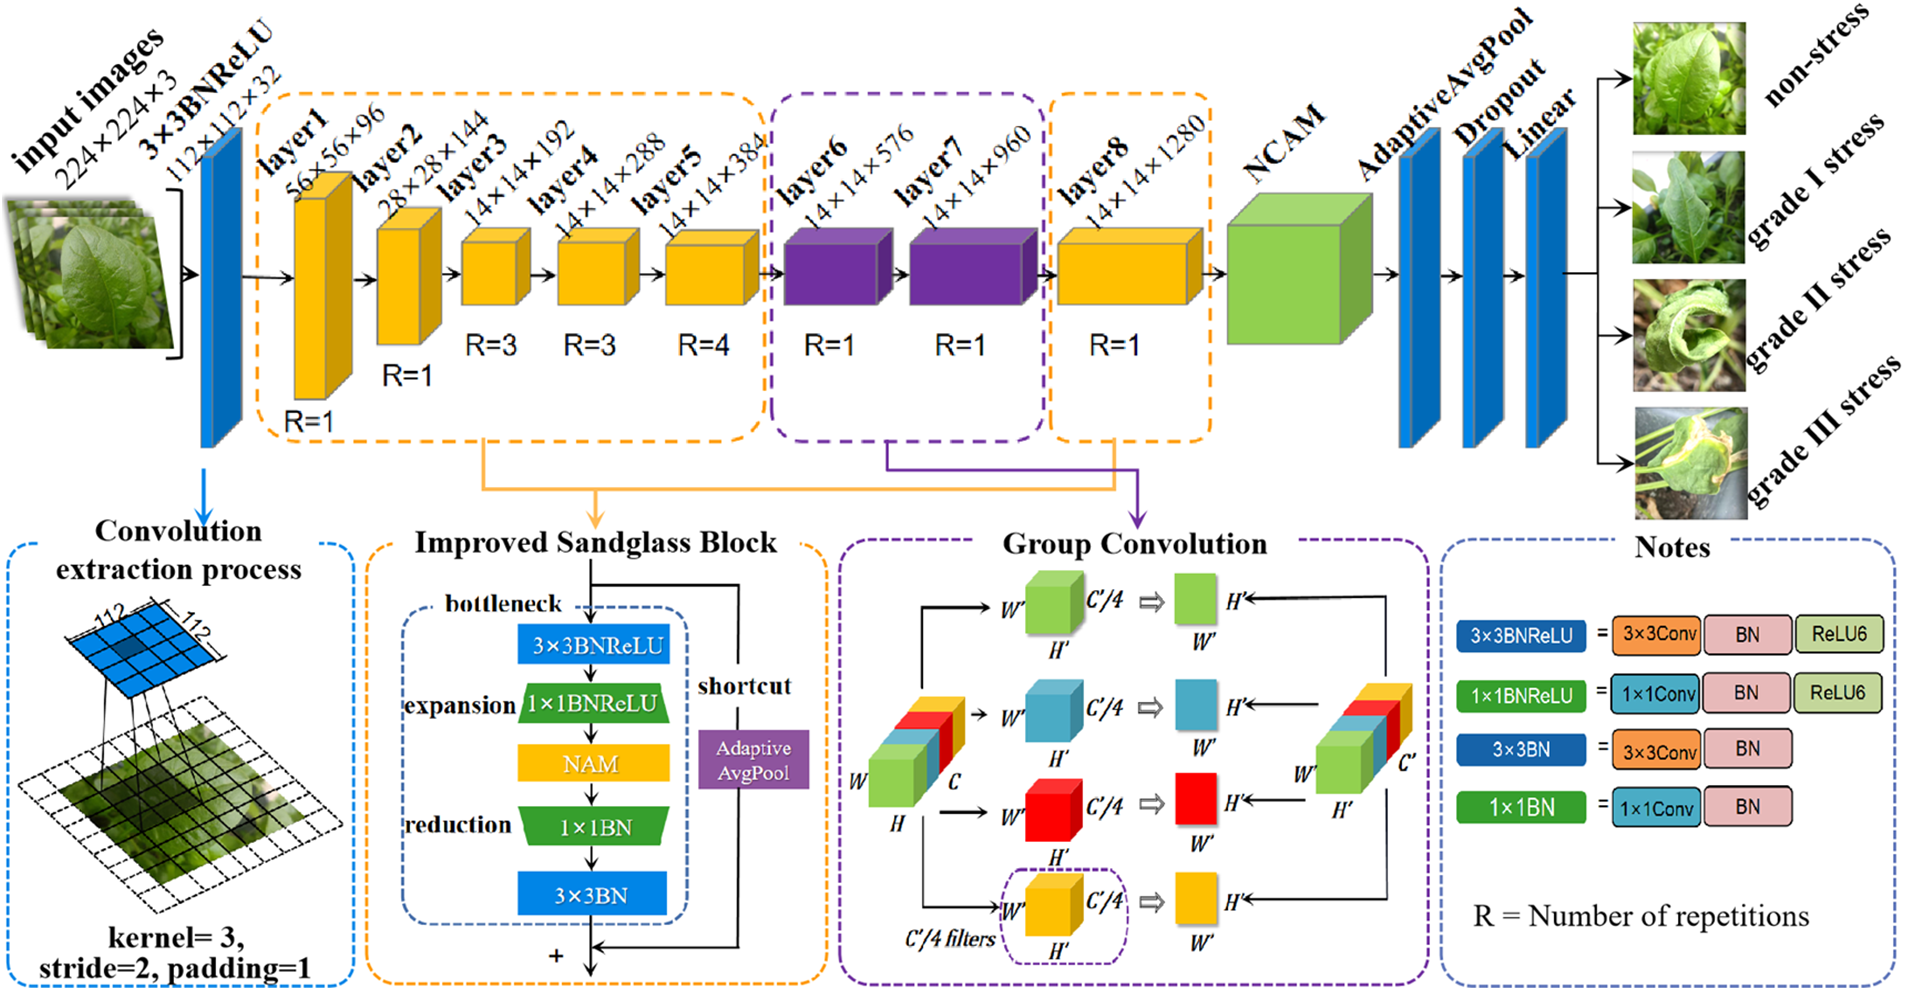
Figure 8: The structure of N-MobileNetXt network
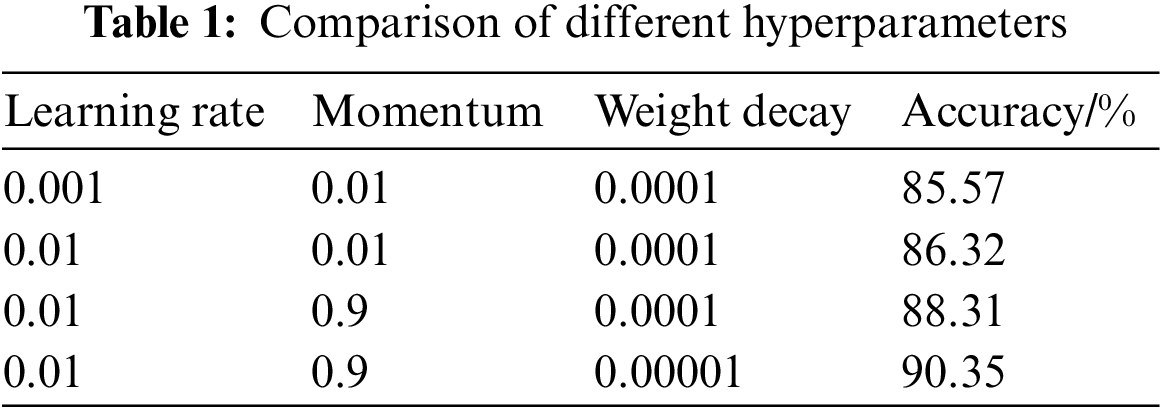
This study used Python 3.9 and Pytorch 1.9.0. as training environment to build the model. The server operating system with Windows 10 version, Intel i7-7820 CPU@3.60 Ghz, two TitanX GPUs, 12.0 G video memory, CUDA 11.0 was used to improve the training speed. Because the accuracy and loss of the model has been maintained at 25 epochs, we trained the model for 50 epochs. To ensure the training results and efficiency, we trained until the 50th epoch. The number of samples selected for each batch of training (batch size) was set as 16. We used the Adam optimizer. As shown in Table 1. After several experiments, we obtained the final hyperparameter values. The learning rate of the Adam optimizer was set as 0.01. The momentum was set as 0.9. The weight decay was set as 0.00001.
3.2 Optimizer Performance Experiments
This study compared the performance of six different optimizers with the same parameters and data to improve the model accuracy and reduce losses by optimizing weights. The experimental results are shown in Fig. 9. It can be seen from the Fig. 9a that the Adam optimizer has the highest accuracy and the fastest converge. It can be seen from Fig. 9b that Adam optimizer has the lowest loss values and more stable curve than the other optimizers. Through several experiments, we chose the Adam as the optimizer for this study, which has the best accuracy and loss value.
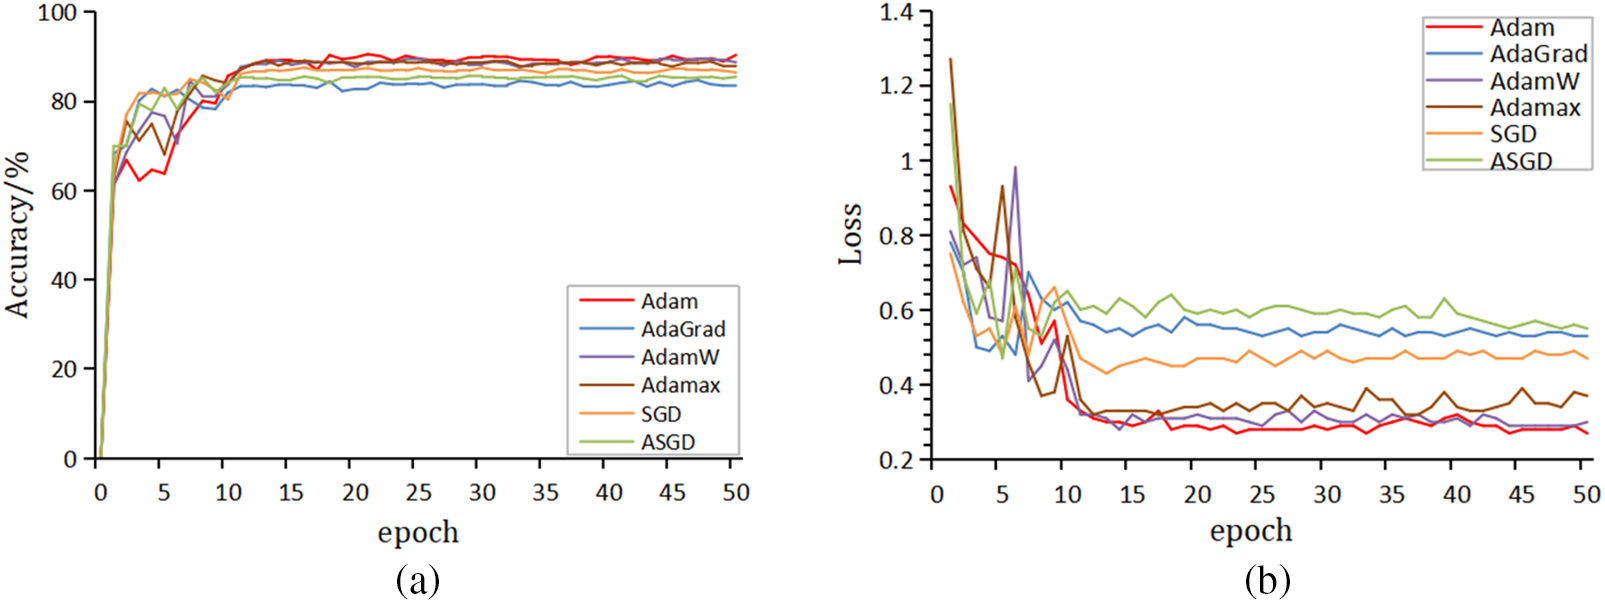
Figure 9: Performance curves of different optimizers. (a) Accuracy of different optimizers; (b) loss vales of different optimizers
This study evaluated the improved model in terms of accuracy, precision, recall, F1 score, parameters, and floating point operations (FLOPs) to validate the viability of this model [31].
Accuracy represents the overall prediction accuracy of a model, including positive and negative samples. It can be defined as the ratio of predicted correct samples to the total number of predicted samples, which is shown in Eq. (1), where TP means true positive, TN means true negative, FP means false positive and FN means false negative. Precision means the probability of the actual positive sample to the all predicted positive samples, which is used for assessing the prediction result, as shown in Eq. (2). Recall is special to the original sample, which represents the ratio of correctly predicted as positive samples to the all positive samples, as shown in Eq. (3). F1 score is the summed average of precision and recall, as shown in Eq. (4).
The number of parameters is mainly used to describe the size of the model, which is similar to the space complexity in the algorithm, as shown in Eq. (5), where H and W represent the height and width of the output feature map,
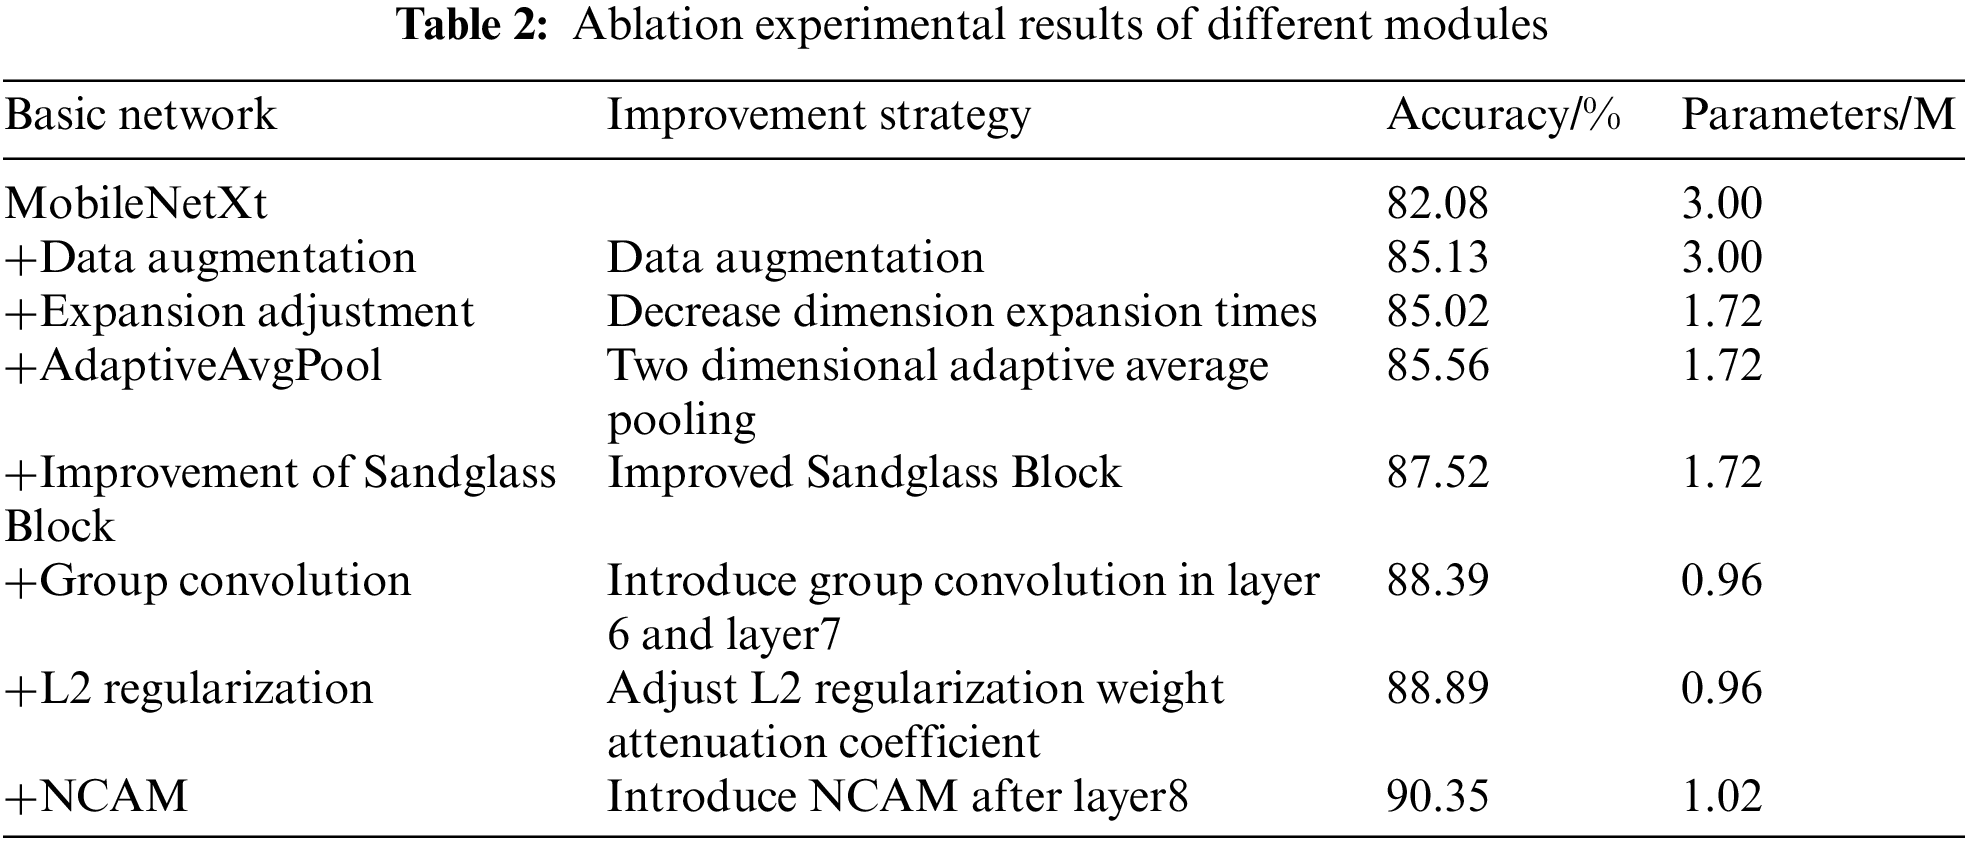
This study conducted the ablation experiment [32] by gradually adding the improved strategies, and compared the accuracy and parameters for verifying the validity of each improvement. The experimental results are shown in Table 2. The basic network column represents an improvement based on the original network for a certain part. It should be especially noted that the operation on each row is based on the previous row. For example, the 3rd row “+Expansion adjustment” indicates to add the “Expansion adjustment” operation is based on the “MobileNetXt” and the “Data Augmentation”, and so on. The column of improvement strategy indicates the specific improved methods for model, which is an explanation for the “Basic network”. Finally, the performance of accuracy and parameters are compared and analyzed. The results show that the network performance is improved after adding each improvement strategy. The accuracy of network increases significantly by data enhancement, improved Sandglass Block and the NCAM. Compared with the previous improvement strategy, the accuracy increases by 3.05%, 1.33% and 1.46%, respectively. The number of parameters is compressed by resetting the expansion dimension of the Sandglass Block and introducing the group convolution into layer6 and layer7, with 1.28 and 0.76 M less than the previous improved strategy, respectively. In summary analysis, the improved classification model in this study has a significant improvement in accuracy and a great decrease in the number of parameters.
3.5 Model Performance Experiments and Results Analysis
3.5.1 Performance Experiments of NCAM
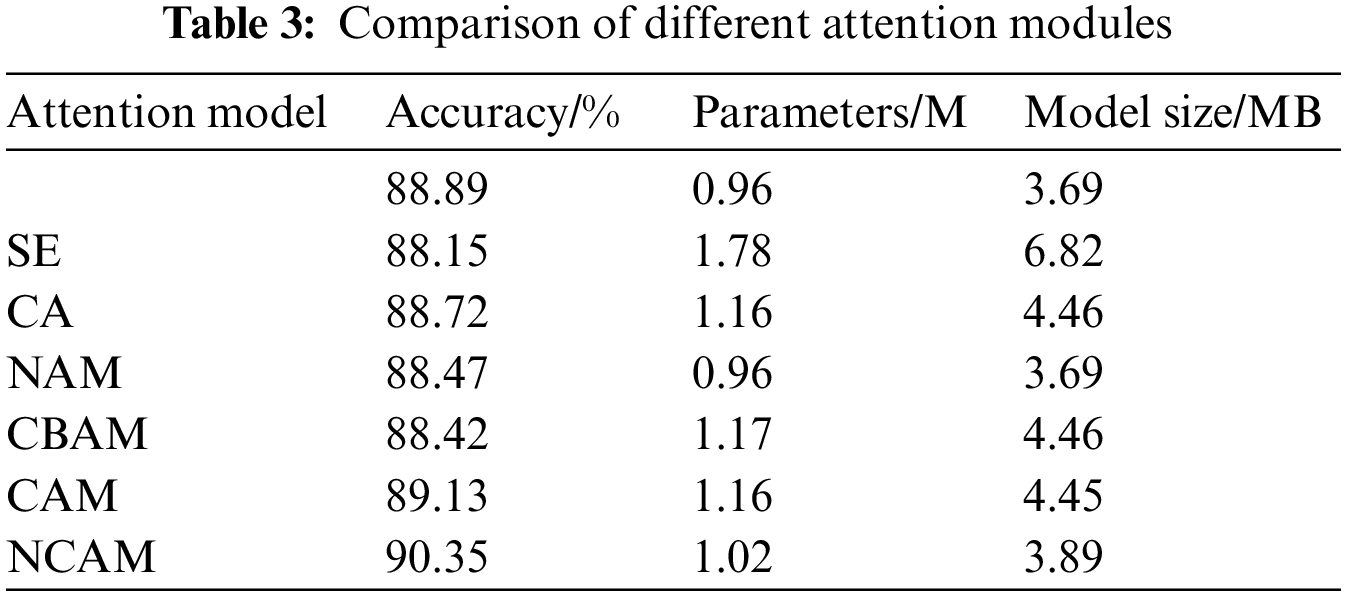
This study introduced the different attention mechanisms into the improved MobileNetXt network and compared the accuracy, parameters, and model size respectively, proving the validity of the NCAM that proposed in this study, as shown in Table 3. From the analysis of the experimental data in the table, it is clear that the classification accuracy decrease and the number of parameters increase after introducing the SE or CA alone. The classification accuracy decreases by 0.42% to add NAM alone, although the number of parameters and model size do not increase. The classification model introduced the CAM alone has higher accuracy than that introduced CBAM, which indicates that the SAM in CBAM does not play an active role during the process of recognition classification. So this study removed the SAM in the process of improving the CBAM. The NCAM compensates the lack of spatial information extraction by introducing NAM, which is made up of channel attention and spatial attention. Compared with the other attention mechanisms, the NCAM has the highest accuracy. Compared with the original model, the NCAM improves the ability of image feature extraction without increasing the additional computation and parameters nearly.
3.5.2 N-MobileNetXt Model Performance Experiments
The classification task in deep learning is generally completed by identifying different target features, so it is an important issue to determine whether the model can accurately focus on the key features of the classification target. Grad-CAM (Gradient-weighted Class Activation Mapping) [33] uses class activation mapping to mark out the important regions in the image, which can help analyze the network’s concerned area of an image. In turn, the concerned area in the network can analyze whether the network has learnt the correct features or information.
This study used Grad-CAM to generate heat maps for four water stress levels. The heat maps are shown in Fig. 10, where red indicates the most salient marked feature area, yellow indicates the relatively salient feature area, and blue indicates the background area. It can be seen from the heat maps that the concerned area of non-stress is the whole fresh leaf; the concerned area of grade I stress is the part of leaf, except for the slightly curled part; the concerned area of grade II stress is the severely curled leaf veins; and the concerned area of grade III stress is the dry and yellow part. The experimental results prove that the improved network can accurately obtain feature information for classification.
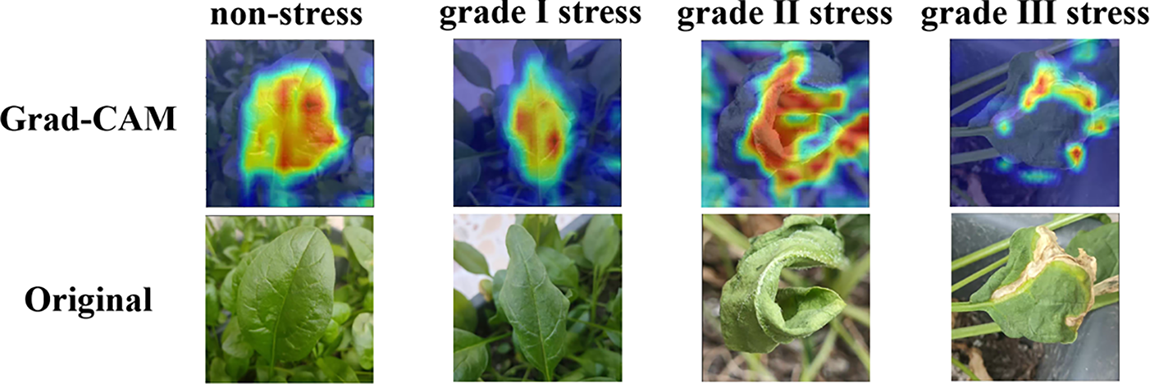
Figure 10: Comparison of four classification Grad-CAM maps
The confusion matrix is used to visualize the model classification results, so that the classification of each category can be clearly observed. This study generated the confusion matrix using the test set, as shown in Fig. 11. The horizontal coordinate indicates the true classification labels (True Labels). The vertical coordinate indicates the predicted classification labels (Predicted Labels). The numbers in the figure indicate the amount of images classified into this category, where 445 out of 465 images are accurately classified as non-stress (level0), 439 out of 505 images are accurately classified as grade I stress (level1), 428 out of 450 images are accurately classified as grade II stress (level2), and 391 out of 450 images are accurately classified as grade III stress (level3).
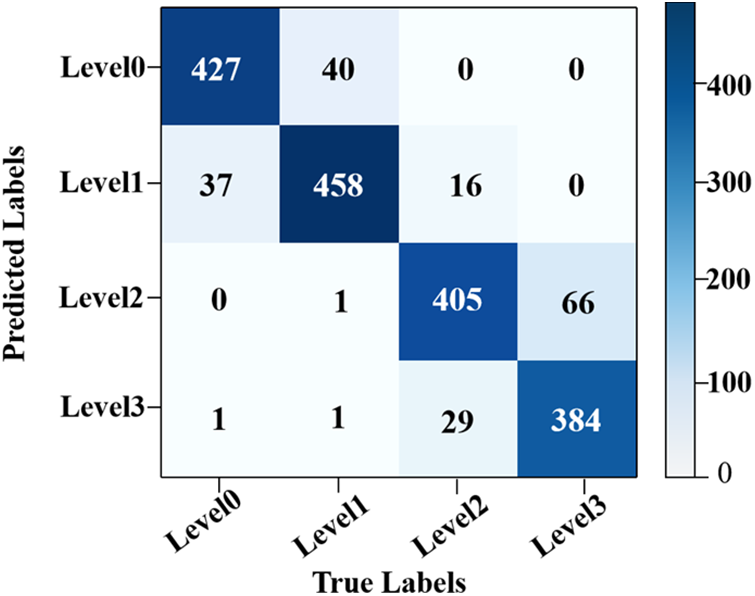
Figure 11: Confusion matrix
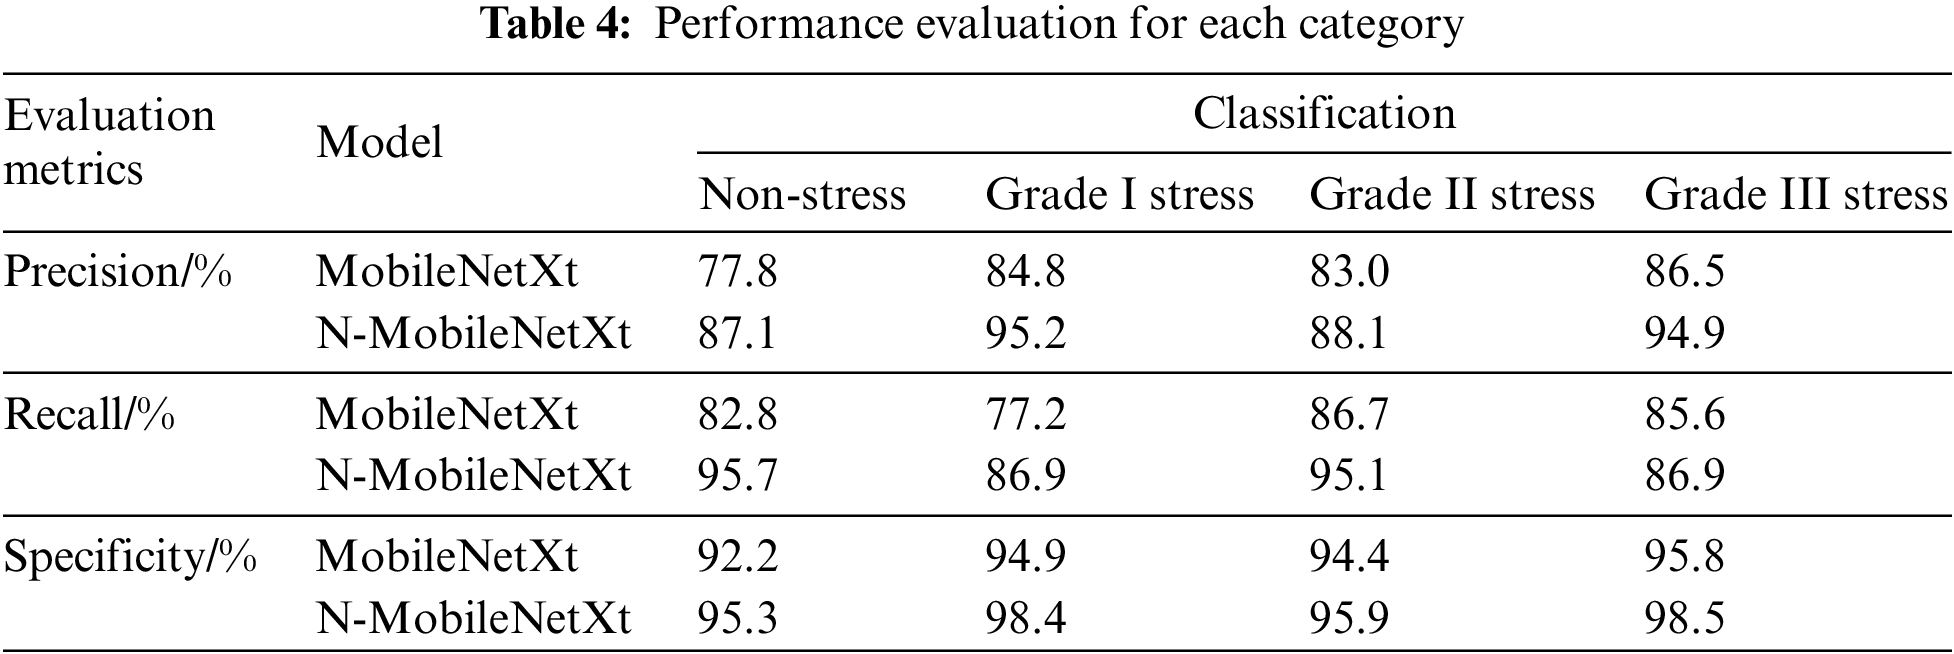
In this study, various metrics were used to assess the classification results of each category, including the precision, recall, and specificity.
The classification performance of each category is shown in Table 4. It can be seen from the table that the highest precision is grade I stress, reaching 95.2%; the highest recall rate is non-stress, reaching 95.7%; the highest specificity is grade III stress, reaching 98.5%. Compared with the MobileNet, the N-MobileNetXt model can obviously improve the performance of all the four stress classes with outstanding advantages and can fully achieve the classification grading of spinach seedlings water stress in practical applications.
For further verifying the proposed network model, this study evaluated the accuracy and loss values of the improved model, as shown in Fig. 12. The experiments compared the change of accuracy and loss values on the training sets and test sets. The accuracy change is shown in Fig. 12a. The loss value change is shown in Fig. 12b. It can be seen from the figure that the improved model tends to stabilize after the 12th epoch. The highest training accuracy is 96.65% and the highest test accuracy is 90.35%, the lowest training loss value is 0.09 and the lowest test loss value is 0.27.
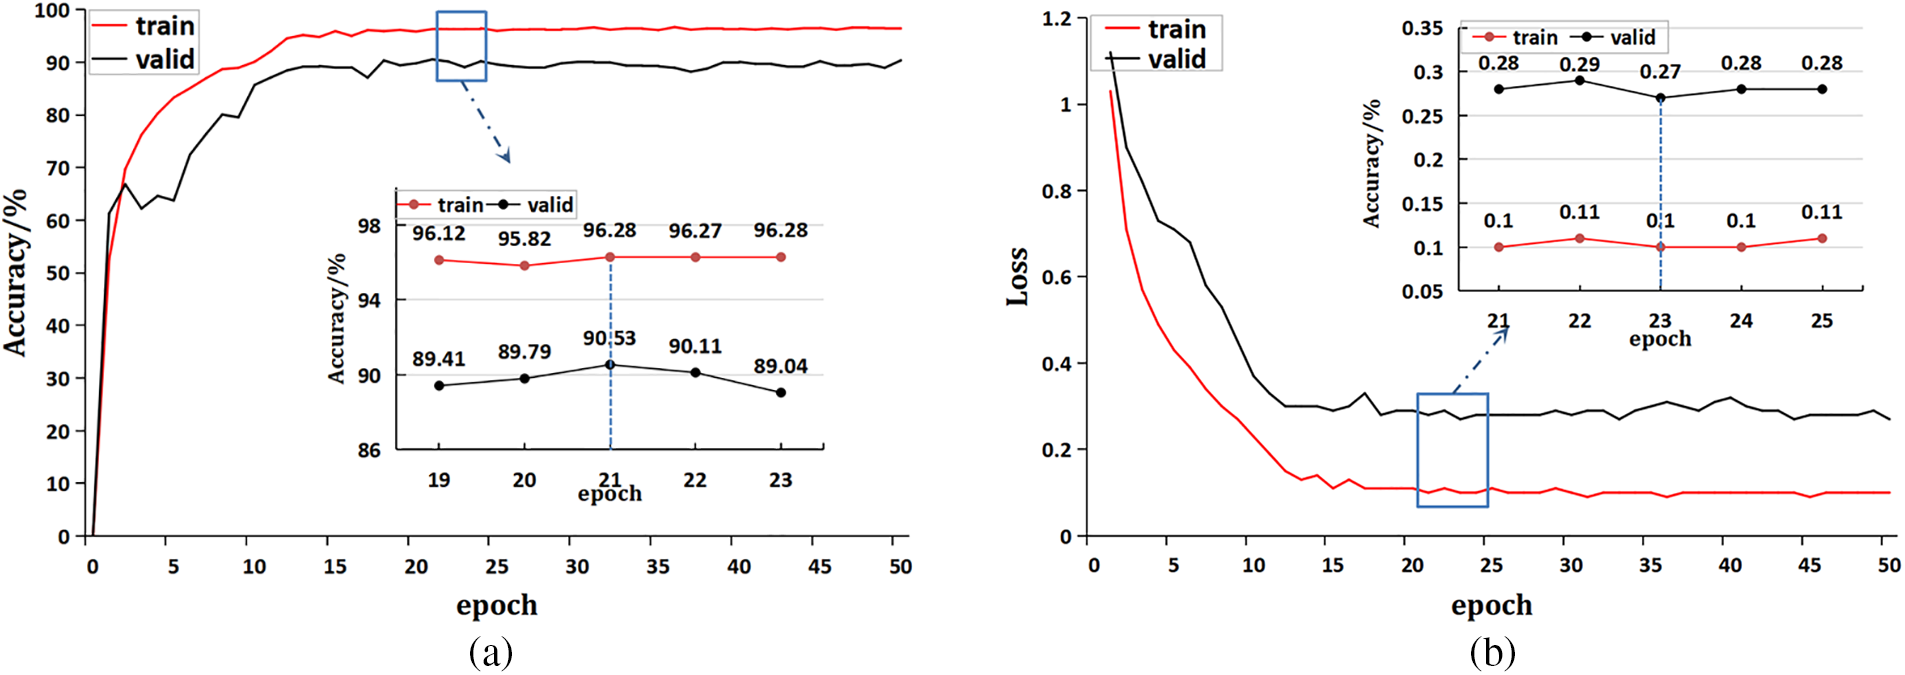
Figure 12: Model accuracy and loss value curve. (a) Accuracy; (b) loss value
3.6 Model Comparison Experiments and Result Analysis
To verify the identification performance, our model is compared with eight different neural networks using the same epoch and dataset. The eight networks include Inceptionv2 [34], Resnet50 [35] traditional models in the recent five years and lightweight network models ShuffleNet [36], GhostNet [37], EfficientNet [38], DenseNet121 [39], MobileNetV2, and MobileNetXt, as shown in Table 5.
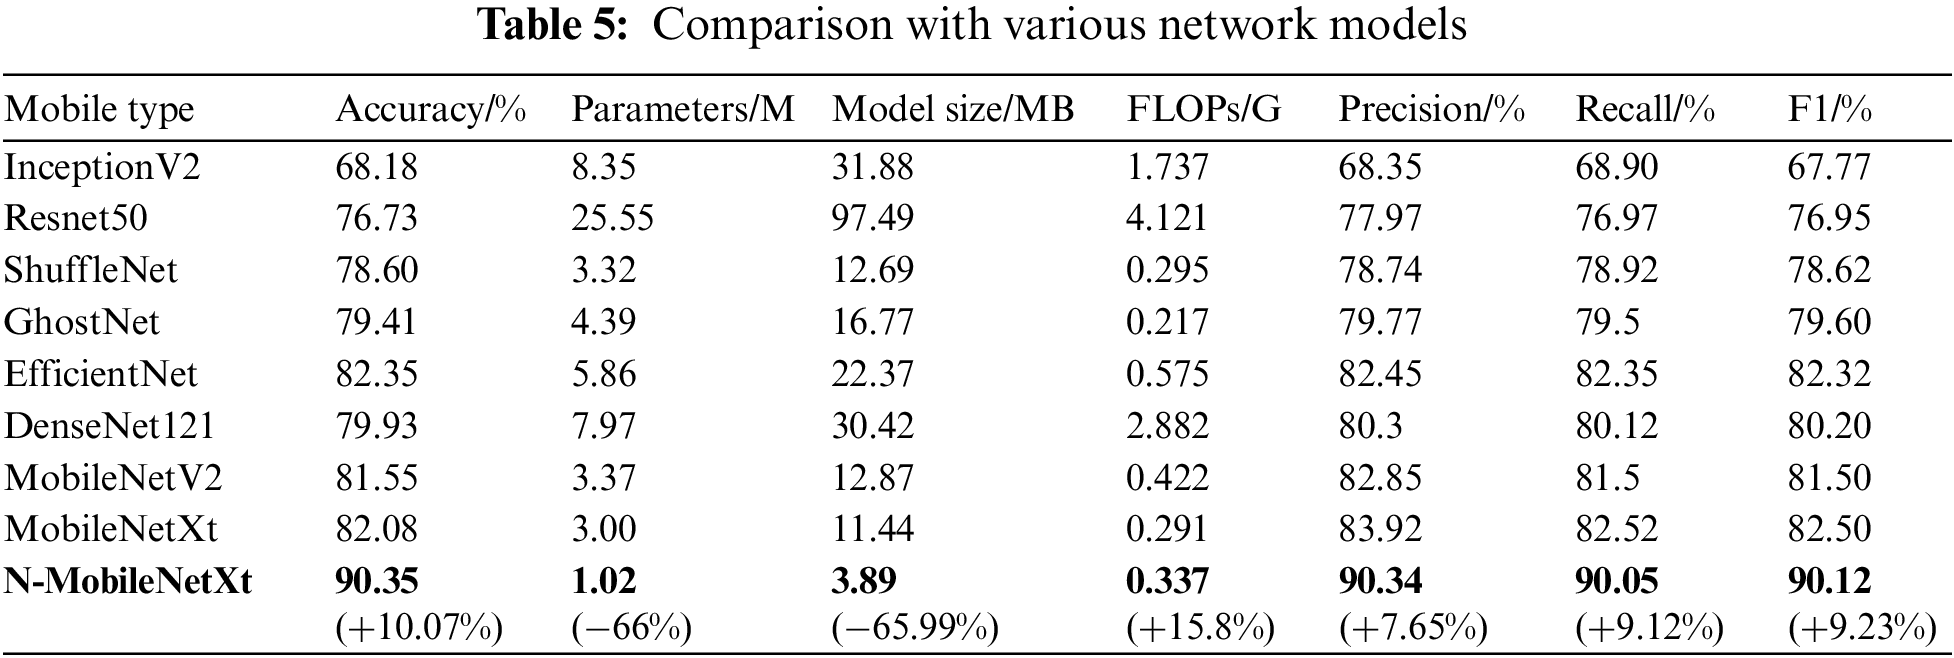
It can be seen from the experimental results that the traditional networks are significantly larger than the lightweight network in terms of the parameters, model size, and floating point operations. The ResNet50 is very typical. Comparing with our model, the number of parameters, model size and floating point operations of ResNet50 increase by 24.53 M, 93.60 M and 3.784 G, respectively, which fully proves that the lightweight network model has many advantages, such as small volume, few parameters and high efficiency. The accuracy is an evaluation for the overall predicted results of network model. The parameters and computation of EfficientNet are larger than that of MobileNetXt, although the accuracy of EfficientNet (82.35%) is higher than that of MobileNetXt (82.08%), so EfficientNet is not suitable for embedded devices. The accuracy of MobileNetXt model reaches 82.08% and the accuracy of our model reaches 90.35%, increasing by 8.27%, which can fully meet the requirement in practical classification tasks. In addition to improved accuracy, the lightweight characteristic of improved model is more obvious. The number of parameters of MobileNetXt network is 3.00 M and the model size is 11.44 MB. The number of parameters of N-MobileNetXt network is 1.02 M and the model size is only 3.89 MB. The model compression effect is extremely obvious and can be easily embedded into the mobile devices [40]. Comparing our model with the MobileNetXt model, the accuracy, recall and F1 score improve by 6.42%, 7.53% and 7.62%, respectively. Comparing with the InceptionV2 traditional network model, the accuracy, recall and F1 score of our model improve by 21.99%, 21.15%, 22.35%, respectively. We also show the percent improvement of this study model compared to MobileNetXt in the last row of the table. Experimental results show that the N-MobileNetXt has very outstanding advantages.
Using the Origin plotting software, this study drew curve chart of accuracy and loss value for different neural networks, as shown in Fig. 13. The curve chart can intuitively compare the differences between the improved network and other neural networks in accuracy and loss values. It can be seen from the figure that the curve of N-MobileNetXt model has higher stability in accuracy and loss value, which would converge after the 12th epoch. The N-MobileNetXt has faster convergence, higher accuracy and lower loss values than other neural networks.
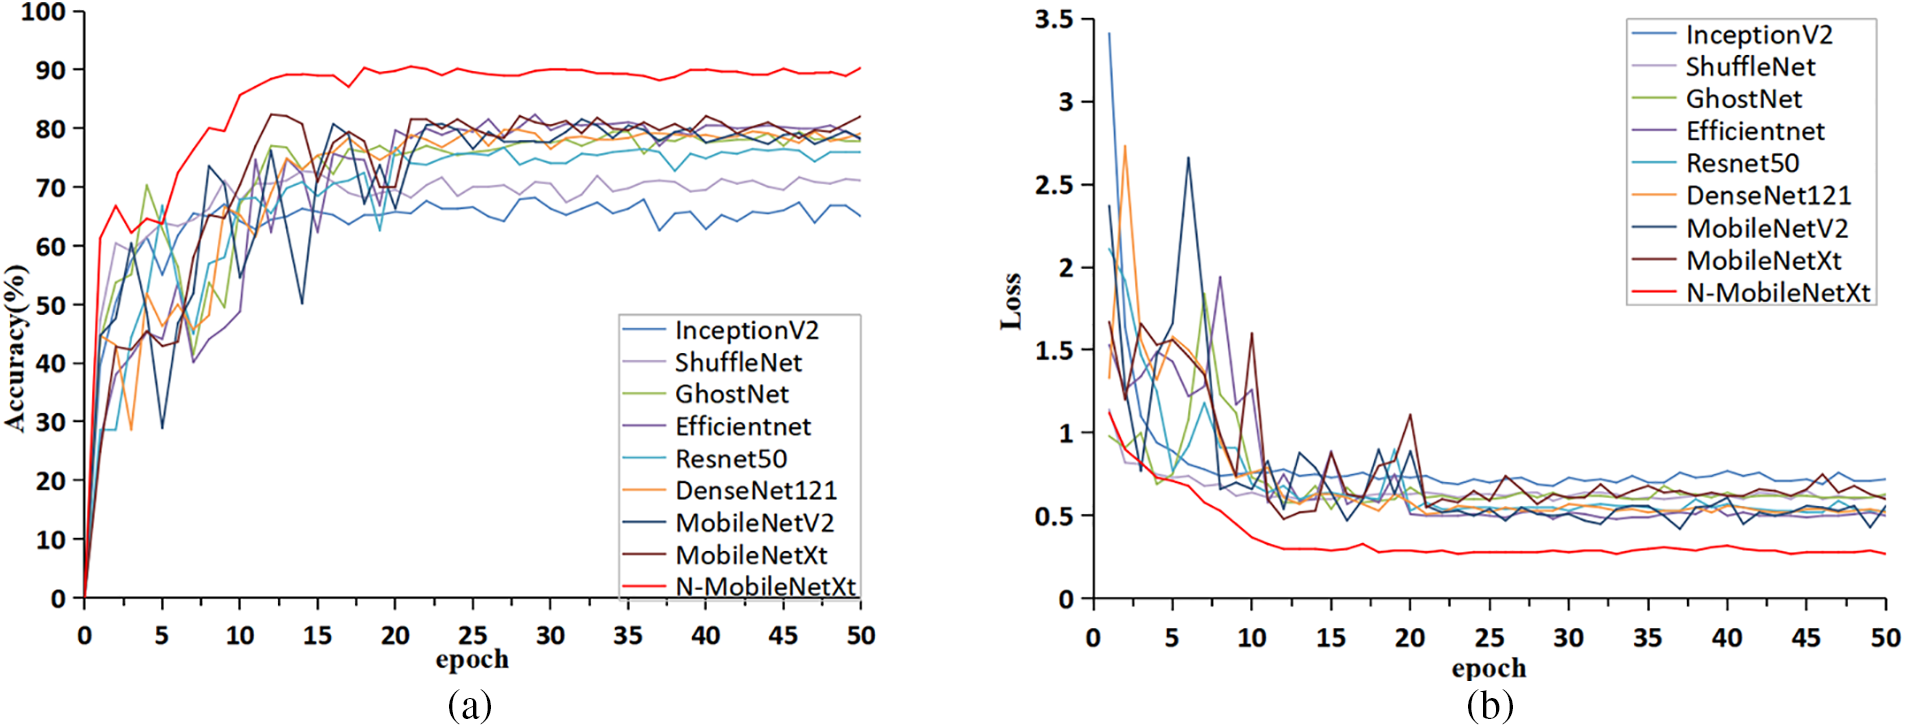
Figure 13: Performance curves of different networks. (a) Accuracy comparison chart; (b) loss value comparison chart
This study achieved the automatic classification of spinach seedlings based on changes in plant phenotypes caused by different water stress levels. The dataset was made up of spinach seedlings with complex backgrounds taken in natural conditions, which can effectively enhance the robustness of the model. MobileNetXt has superior performance, which is suitable for classification tasks. The N-MobileNetXt lightweight network model was proposed by optimizing the MobileNetXt network structure. The optimizations include: the structure of the original Sandglass Block was reconstructed to effectively enhance the recognition accuracy of the model with few parameters; the innovative NCAM was proposed to improve the feature extraction capability of image with minimum cost; the two-dimensional adaptive average pooling was introduced to significantly compress the model parameters and enhance the model robustness, solving the problem of poor generalization ability precisely.
In addition to the improvement in accuracy, this study also performed rich and reasonable optimization on the size of model. The group convolution module was introduced as the main structure for layer6 and layer7 network layers to greatly reduce the number of parameters of the network; the dimensional multiple was reduced in the Sandglass Block. The classification accuracy of the improved model is 90.35%, which can completely meet the classification requirements of different stress levels in practical applications. The improved model size is only 3.89 MB and the number of parameters is 1.02 M, which were decreased by 66% compared with the original MobileNetXt model. This fully proves the advantages of N-MobileNet in lightweight and it is very suitable for embedded devices.
To sum up, the automatic classification method for the water stress level of spinach seedlings based on the N-MobileNetXt network can efficiently and accurately grade the water stress degree of spinach seedlings under complex background. This study provides new ideas and methods for the classification of plant water stress levels, and can be used as a decision-making algorithm for intelligent irrigation. In the subsequent application, we will input images of spinach seedlings taken in the field (untested data), which are not belong to the training and test sets. The training data is spinach seedlings, so the model is applicable to spinach seedlings. The model in this study can also be used for other plant classifications if the data of other plants are trained. We will constantly optimize the algorithm and further improve the classification model performance in accuracy and operation speed. We will deploy the algorithm to the intelligent irrigation machine, so that it can carry out automatic spraying work in the subsequent process of practical application. There will be multiple challenges such as hardware facility placement and algorithm embedding.
Funding Statement: This work is supported in part by the Science and Technology Development Plan Project of Changchun [Grant Number 21ZGN28]; the Jilin Provincial Science and Technology Development Plan Project [Grant Number 20210101157JC]; the Jilin Provincial Science and Technology Development Plan Project [Grant Number 20230202035NC].
Conflicts of Interest: The authors declare that they have no conflicts of interest to report regarding the present study.
References
1. E. Gokulakannan, “DeepQ based automated irrigation systems using deep belief WSN,” Intelligent Automation & Soft Computing, vol. 35, no. 3, pp. 3415–3427, 2023. [Google Scholar]
2. J. Vera, W. Conejero, M. R. Conesa and M. C. Ruiz-Sánchez, “Irrigation factor approach based on soil water content: A nectarine orchard case study,” Water, vol. 11, no. 3, pp. 589, 2019. [Google Scholar]
3. B. Wang, X. Zhang and H. Wu, “A method of ZigBee automatic irrigation,” International Journal of Performability Engineering, vol. 16, no. 4, pp. 639–646, 2020. [Google Scholar]
4. R. Liao, S. Zhang, X. Zhang, M. Wang, H. Wu et al., “Development of smart irrigation systems based on real-time soil moisture data in a greenhouse: Proof of concept,” Agricultural Water Management, vol. 245, no. 28, pp. 106632, 2021. [Google Scholar]
5. D. C. Trinh, T. C. Truvant and T. D. Bui, “Design of automatic irrigation system for greenhouse based on LoRa technology,” in 2018 Int. Conf. On Advanced Technologies for Communications, Ho Chi Minh City, Vietnam, pp. 72–77, 2018. [Google Scholar]
6. S. S. Saini, D. Soni, S. S. Malhi, V. Tiwari and A. Goyal, “Automatic irrigation control system using Internet of Things (IoT),” Journal of Discrete Mathematical Sciences and Cryptography, vol. 25, no. 4, pp. 879–889, 2022. [Google Scholar]
7. S. Millán, C. Campillo, J. Casadesús, J. M. Pérez-Rodríguez and M. H. Prieto, “Automatic irrigation scheduling on a hedgerow olive orchard using an algorithm of water balance readjusted with soil moisture sensors,” Sensors, vol. 20, no. 9, pp. 2526, 2020. [Google Scholar]
8. S. K. Roy, S. Misra, N. S. Raghuwanshi and S. K. Das, “AgriSens: IoT-based dynamic irrigation scheduling system for water management of irrigated crops,” IEEE Internet of Things Journal, vol. 8, no. 6, pp. 5023–5030, 2020. [Google Scholar]
9. B. Li, Y. Xu and M. Li, “Study on automatic control irrigation system of paddy field in cold region of eastern Inner Mongolia,” Journal of Irrigation and Drainage, vol. 41, no. Supp. 1, pp. 66–68, 2022. [Google Scholar]
10. J. Lopez-Jimenez, A. V. Wouwer and N. Quijano, “Dynamic modeling of crop-soil systems to design monitoring and automatic irrigation processes: A review with worked examples,” Water, vol. 14, no. 6, pp. 889, 2022. [Google Scholar]
11. R. N. Rao and B. Sridhar, “IoT based smart crop-field monitoring and automation irrigation system,” in 2018 2nd Int. Conf. on Inventive Systems and Control (ICISC), Coimbatore, India, pp. 478–483, 2018. [Google Scholar]
12. T. W. Rolim, A. O. D. Silva, F. A. U. Neto, J. G. D. A. Lemos and B. R. Costa, Preformance of autonomous irrigation unit via mobile application for arugula yield. Jaboticabal, SP, Brazil: Engenharia Agrícola, 2022. [Online]. Available: https://doi.org/10.1590/1809-4430-Eng.Agric.v42nepe20210143/2022 [Google Scholar] [CrossRef]
13. M. H. J. P. Gunarathna, K. Sakai, T. Nakandakari, M. Kazuro, T. Onodera et al., “Optimized subsurface irrigation system (OPSISBeyond traditional subsurface irrigation,” Water, vol. 9, no. 8, pp. 599, 2017. [Google Scholar]
14. S. J. Kho, S. Manickam, S. Malek, M. Mosleh and S. K. Dhillon, “Automated plant identification using artificial neural network and support vector machine,” Frontiers in Life Science, vol. 10, no. 1, pp. 98–107, 2017. [Google Scholar]
15. Y. Tian, G. Yang, Z. Wang, H. Wang, E. Li et al., “Apple detection during different growth stages in orchards using the improved YOLO-V3 model,” Computers and Electronics in Agriculture, vol. 157, pp. 417–426, 2019. [Google Scholar]
16. G. Pattnaik, V. K. Shrivastava and K. Parvathi, “Transfer learning-based framework for classification of pest in tomato plants,” Applied Artificial Intelligence, vol. 34, no. 13, pp. 981–993, 2020. [Google Scholar]
17. Y. Unal, Y. S. Taspinar, I. Cinar, R. Kursun and M. Koklu, “Application of pre-trained deep convolutional neural networks for coffee beans species detection,” Food Analytical Methods, vol. 15, no. 12, pp. 3232–3243, 2022. [Google Scholar]
18. W. Du, Y. Zhu, S. Li and P. Liu, “Spikelets detection of table grape before thinning based on improved YOLOV5s and Kmeans under the complex environment,” Computers and Electronics in Agriculture, vol. 203, no. 2, pp. 107432, 2022. [Google Scholar]
19. Z. Gui, J. Chen, Y. Li, Z. Chen, C. Wu et al., “A lightweight tea bud detection model based on Yolov5,” Computers and Electronics in Agriculture, vol. 205, no. 33, pp. 107636, 2023. [Google Scholar]
20. J. Wang, Y. Zou, P. Lei, R. S. Sherratt and L. Wang, “Research on recurrent neural network based crack opening prediction of concrete dam,” Journal of Internet Technology, vol. 21, no. 4, pp. 1151–1160, 2020. [Google Scholar]
21. Q. Zhao, L. Li and M. Zhang, “A diagnostic method of water stress in greenhouse tomato leaves based on transfer learning,” Transactions of the Chinese Society for Agricultural Machinery, vol. 51, no. s1, pp. 247–356, 2020. [Google Scholar]
22. W. Wang, Z. Chen and X. Yuan, “Simple low-light image enhancement based on Weber-Fechner law in logarithmic space,” Image Communication, vol. 106, no. 6, pp. 116742, 2022. [Google Scholar]
23. X. Qin, Y. Ban, P. Wu, B. Yang, S. Liu et al., “Improved image fusion method based on sparse decomposition,” Electronics, vol. 11, no. 15, pp. 2321, 2022. [Google Scholar]
24. H. Liu, M. Liu, D. Li, W. Zheng, L. Yin et al., “Recent advances in pulse-coupled neural networks with applications in image processing,” Electronics, vol. 11, no. 20, pp. 3264, 2022. [Google Scholar]
25. S. Li, “Efficient algorithms for scheduling equal-length jobs with processing set restrictions on uniform parallel batch machines,” Mathematical Biosciences and Engineering, vol. 19, no. 11, pp. 10731–10740, 2022 [Google Scholar] [PubMed]
26. D. Zhou, Q. Hou, Y. Chen, J. Feng and S. Yan, “Rethinking bottleneck structure for efficient mobile network design,” in Computer Vision-ECCV 2020: 16th European Conf., Glasgow, UK, pp. 680–697, 2020. [Google Scholar]
27. M. Sandler, A. Howard, M. Zhu, A. Zhmoginov and L. C. Chen, “MobileNetV2: Inverted residuals and linear bottlenecks,” in Proc. of the IEEE Conf. on Computer Vision and Pattern Recognition (CVPR), Salt Lake City, USA, pp. 4510–4520, 2018. [Google Scholar]
28. Y. Liu, Z. Shao, Y. Teng and N. Hoffmann, “NAM: Normalization-based attention module,” in Proc. of the IEEE Conf. on Computer Vision and Pattern Recognition (CVPR), Kuala Lumpur, Malaysia, pp. 12419, 2021. [Google Scholar]
29. D. Novtahaning, H. A. Shah and J. M. Kang, “Deep learning ensemble-based automated and high-performing recognition of coffee leaf disease,” Agriculture, vol. 12, no. 11, pp. 1909, 2022. [Google Scholar]
30. S. Woo, J. Park, J. Y. Lee and I. S. Kweon, “CBAM: Convolutional block attention module,” in Proc. of the European Conf. on Computer Vision (ECCV), Munich, Germany, pp. 3–19, 2018. [Google Scholar]
31. S. F. Qadir, L. Shen, M. Ahmad, S. Qadri, S. S. Zareen et al., “SVseg: Stacked sparse autoencoder-based patch classification modeling for vertebrae segmentation,” Mathematics, vol. 10, no. 5, pp. 796, 2022. [Google Scholar]
32. L. Lu, W. Liu, W. Yang, M. Zhao and T. Jiang, “Lightweight corn seed disease identification method based on improved ShuffleNetV2,” Agriculture, vol. 12, no. 11, pp. 1929, 2022. [Google Scholar]
33. R. R. Selvaraju, M. Cogswell, A. Das, R. Vedantam, D. Parikh et al., “GRAD-CAM: Visual explanations from deep networks via gradient-based localization,” in Proc. of the IEEE Int. Conf. on Computer Vision (ICCV), Venice, Italy, pp. 618–626, 2017. [Google Scholar]
34. S. Ioffe and C. Szegedy, “Batch normalization: Accelerating deep network training by reducing internal covariate shift,” in Proc. of the 32nd Int. Conf. on Machine Learning(ICML), Lile, France, pp. 448–456, 2015. [Google Scholar]
35. K. He, X. Zhang, S. Ren and J. Sun, “Deep residual learning for image recognition,” in Proc. of the IEEE Conf. on Computer Vision and Pattern Recognition (CVPR), Las Vegas, USA, pp. 770–778, 2016. [Google Scholar]
36. X. Zhang, X. Zhou, M. Lin and J. Sun, “ShuffleNet: An extremely efficient convolutional neural network for mobile devices,” in Proc. of the IEEE Conf. on Computer Vision and Pattern Recognition (CVPR), Salt Lake City, USA, pp. 6848–6856, 2018. [Google Scholar]
37. K. Han, Y. Wang, Q. Tian, J. Guo, C. Xu et al., “GhostNet: More features from cheap operations,” in Proc. of the IEEE/CVF Conf. on Computer Vision and Pattern Recognition (CVPR), Seattle, WA, USA, pp. 1580–1589, 2020. [Google Scholar]
38. M. Tan and Q. Le, “EfficientNet: Rethinking model scaling for convolutional neural networks,” in Proc. of the 36th Int. Conf. on Machine Learning(ICML), Long Beach, USA, pp. 6105–6114, 2019. [Google Scholar]
39. G. Huang, Z. Liu, L. V. D. Maaten and K. Q. Weinberger, “Densely connected convolutional networks,” in Proc. of the IEEE Conf. on Computer Vision and Pattern Recognition (CVPR), Hawaii, USA, pp. 4700–4708, 2017. [Google Scholar]
40. F. Zhang, Z. Lv, H. Zhang, J. Guo, J. Wang et al., “Verification of improved YOLOX model in detection of greenhouse crop organs: Considering tomato as example,” Computers and Electronics in Agriculture, vol. 205, no. 4, pp. 107582, 2023. [Google Scholar]
Cite This Article
 Copyright © 2023 The Author(s). Published by Tech Science Press.
This work is licensed under a Creative Commons Attribution 4.0 International License , which permits unrestricted use, distribution, and reproduction in any medium, provided the original work is properly cited.
 Downloads
 Citation Tools