
 Submit a Paper
 Propose a Special lssue
 Open Access
ARTICLE

Process Characterization of the Transesterification of Rapeseed Oil to Biodiesel Using Design of Experiments and Infrared Spectroscopy
1
Lehr-und Forschungszentrum Process Analysis and Technology (PA&T) der Hochschule Reutlingen, Reutlingen, 72762, Germany
2
Department of Process Analytics and Cereal Science, Institute of Food Science and Biotechnology, Universität Hohenheim,
Stuttgart, 70599, Germany
* Corresponding Author: Tobias Drieschner. Email:
(This article belongs to the Special Issue: New Trends in Renewable and Sustainable Materials for Carbon Neutrality)
Journal of Renewable Materials 2023, 11(4), 1643-1660. https://doi.org/10.32604/jrm.2023.024429
Received 02 June 2022; Accepted 29 August 2022; Issue published 01 December 2022
 View Full Text
 Download PDF
Abstract
For optimization of production processes and product quality, often knowledge of the factors influencing the process outcome is compulsory. Thus, process analytical technology (PAT) that allows deeper insight into the process and results in a mathematical description of the process behavior as a simple function based on the most important process factors can help to achieve higher production efficiency and quality. The present study aims at characterizing a well-known industrial process, the transesterification reaction of rapeseed oil with methanol to produce fatty acid methyl esters (FAME) for usage as biodiesel in a continuous micro reactor set-up. To this end, a design of experiment approach is applied, where the effects of two process factors, the molar ratio and the total flow rate of the reactants, are investigated. The optimized process target response is the FAME mass fraction in the purified nonpolar phase of the product as a measure of reaction yield. The quantification is performed using attenuated total reflection infrared spectroscopy in combination with partial least squares regression. The data retrieved during the conduction of the DoE experimental plan were used for statistical analysis. A non-linear model indicating a synergistic interaction between the studied factors describes the reactor behavior with a high coefficient of determination (R²) of 0.9608. Thus, we applied a PAT approach to generate further insight into this established industrial process.Keywords
In the past years, the concerns about climate change have dramatically gained momentum and are very much present in the media and the subject of many public debates. One possible contribution to limiting the effect of climate change is to replace fossil fuels with biofuels to reduce greenhouse gas emissions since biofuels have the potential to fit well into closed-loop processes and CO2-neutral product cycles. Among biofuels, biodiesel is an especially promising candidate and is already widely applied in blends with petroleum diesel in many parts of the world. This is reflected by the large total consumption of biodiesel in the European Union in 2020, which was estimated to be 13 062.2 kt of oil equivalents [1]. Biodiesel consists of fatty acid methyl esters (FAME) derived from plant oils or animal fats and is usually produced by a process called transesterification [2,3]. While oils and fats, that consist of triacylglycerides (IUPAC name: tri-O-acylglycerols) already contain all the chemical energy needed to fuel engines, their viscosity is too high for direct injection in modern diesel engines. Thus, they are commonly processed by transesterification with short-chain monovalent alcohols, especially methanol. Here, the fatty acids, originally linked to the glycerol backbone, are transferred to methanol forming FAMEs showing lower viscosity and improved burning behavior (cetane number) compared to conventional diesel fuel. For transesterification, catalysts are required to achieve reasonable reaction rates. Most commonly used are soluble alkali hydroxides like potassium or sodium hydroxide [4] but other catalysts like acids [5], heterogeneous catalysts [6,7], and enzymes [8] or even catalyst-free supercritical approaches [9] are also described in the literature. The chemical reaction involves three steps that are shown in Fig. 1. Here, the fatty acids are transferred individually from the glycerol. All three reactions involve chemical equilibria. Thus, an extent of the raw material methanol is usually used to shift the reactions to the product side to increase process yield [10].
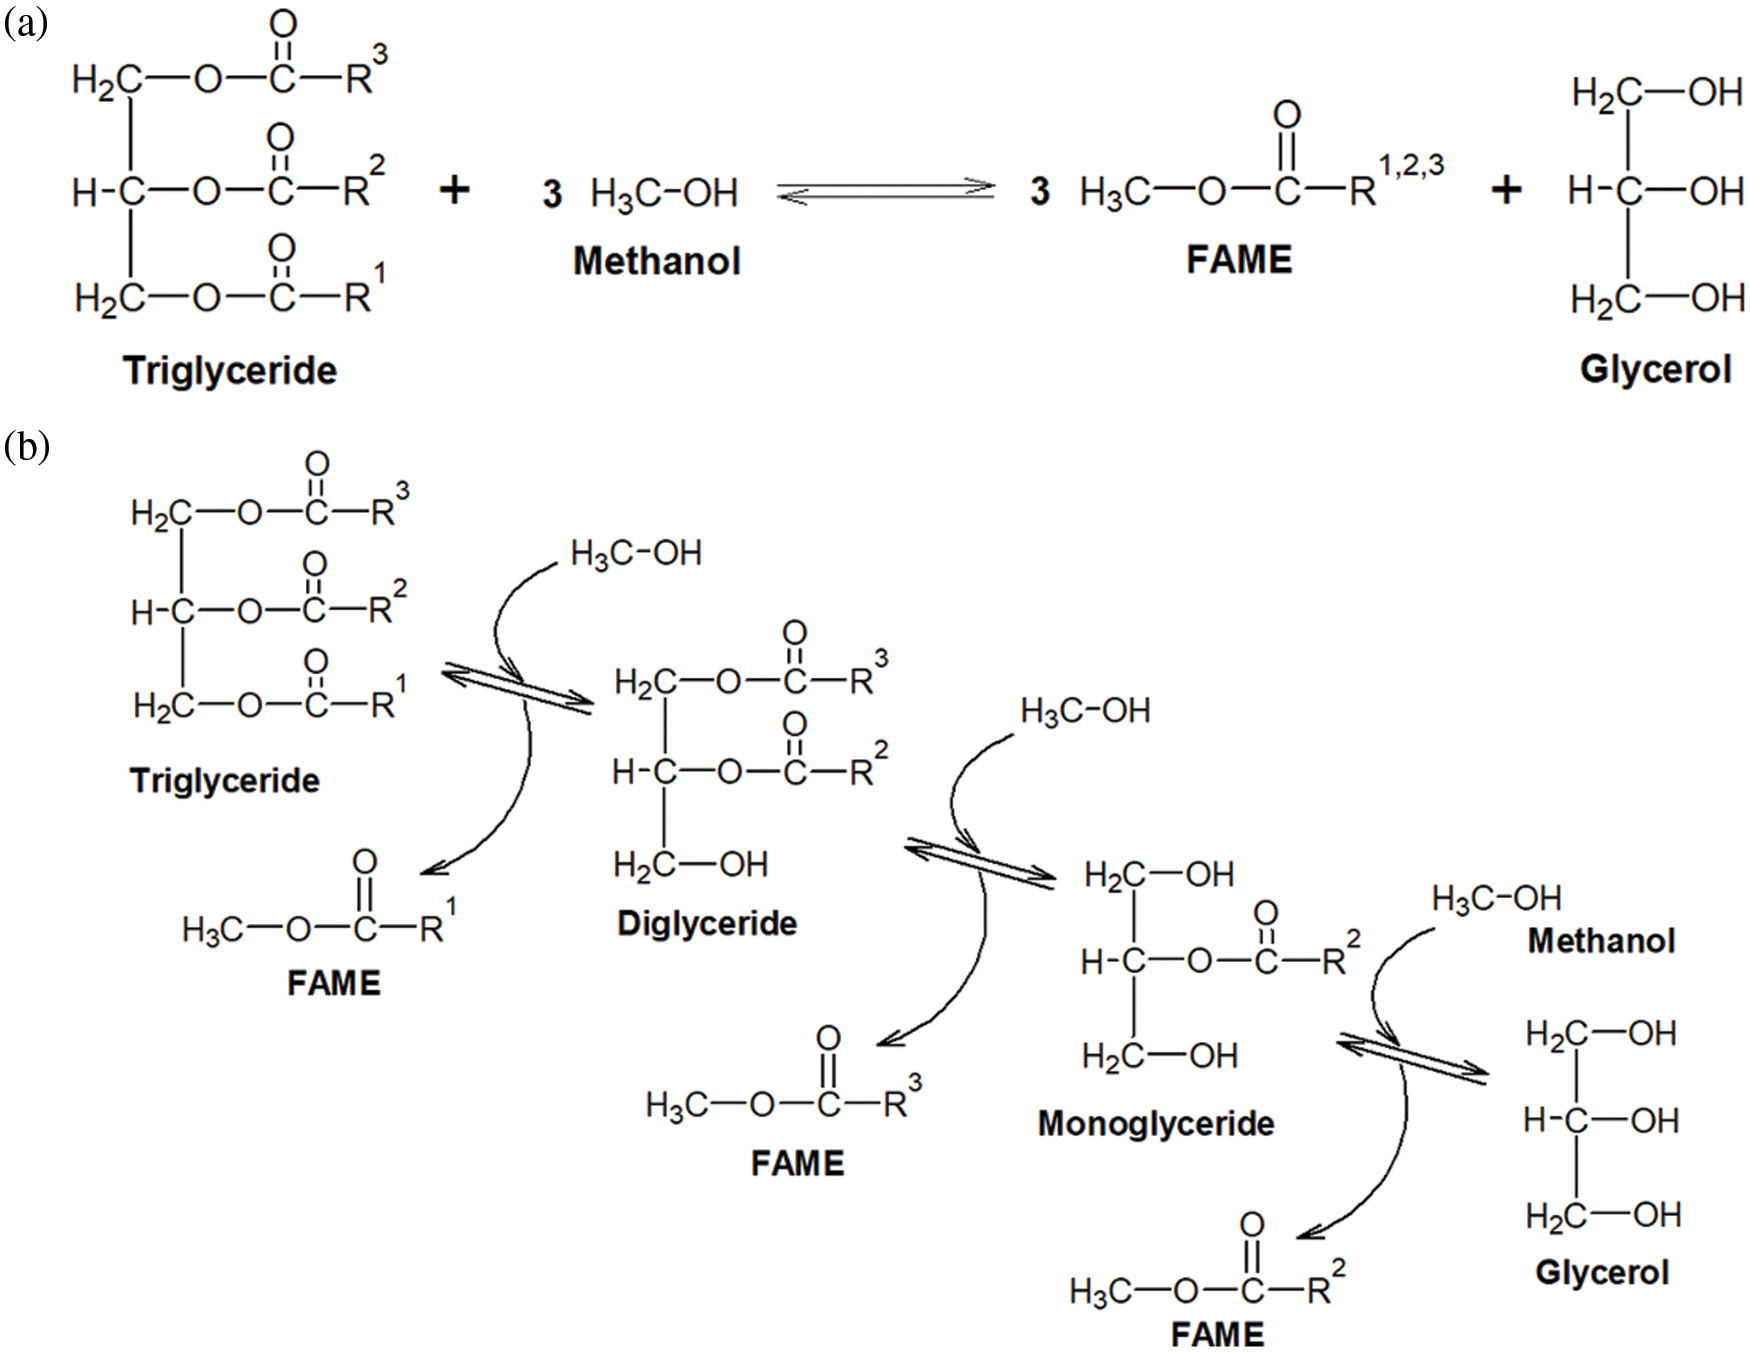
Figure 1: Chemical reaction scheme illustrating the transesterification of plant oils. a) shows the overall reaction, while equation b) depicts the three subsequent steps including the reaction intermediates
Several factors are known to influence the reaction rate of transesterification processes and were studied extensively in the past: type and amount of catalyst [11], reaction temperature [5], and the amount of excessive methanol [5,10]. The latter is usually expressed as molar ratio, methanol to oil, which needs to be at least three moles of methanol to convert one mole of triglycerides according to the reaction stoichiometry. Another important influence derives from the immiscibility of the reactants methanol and oils/fats forming two phases that need to be mixed intensively to increase interphase area and thus the phase transition of active reactants. Also, the products FAME and glycerol are immiscible in each other, while methanol can be dissolved in both phases [12]. Furthermore, some contaminants can have negative impacts on the reaction. E.g., the oils/fats can contain free fatty acids (FFA, these are not bound to glycerol originally) that consume the alkaline catalyst, and also water can decrease reaction rates [5,13].
Thus, many influences can affect the course of transesterification in a technical process. Statistical design of experiment (DoE) is a promising approach to studying these influences in a specific transesterification plant. Here, a series of experiments is described where two process variables, the so-called factors, were changed according to a randomized, systematic experimental plan. The experimental outcome was subjected to statistical testing (ANOVA) to identify and quantify the effects of the varied process factors. The dependence of yield on the process factors was fit by polynomial mathematical models that were based on the statistically significant linear, non-linear and synergistic interaction effects. Thereby, the transesterification process was described by a robust and predictive response surface model. Such a DoE-based approach allows the optimization of a wide variety of processes according to numerous intended goals simultaneously, like optimal yield at minimal cost and minimal hazard risks at moderate experimental effort [14–17]. A series of widely used standard designs is available [18,19] and were already applied to biodiesel processing. For instance, Sun et al. [20] used a full factorial approach to investigate the influence of the reaction temperature, the molar ratio, the residence time, and catalyst concentration on the FAME yield of the transesterification of rapeseed oil with methanol and KOH as a catalyst in a capillary microreactor. Santikunaporn et al. [21] and Bitire et al. [4] used Box-Behnken designs to study the influence of the residence time, molar ratio, and catalyst concentration on the transesterification yield of used frying oil with methanol and KOH in a continuous mesoscale oscillatory baffle reactor and the influence of temperature, reaction time and molar ratio on the transesterification of parsley seed oil using methanol and KOH in a stirred stainless-steel reactor, respectively. Thakkar et al. [22] reported the use of a central composite design to analyze the behavior of the reactive extraction including the transesterification of castor seeds with methanol and potassium hydroxide. The investigated factors were methanol to seeds mass ratio, mass fraction of catalyst, temperature, and reaction time. This emphasizes that DoE is a promising approach for gaining knowledge on a specific process.
In the present study, we investigate the influence of the molar ratio and the total flow rate of the continuous transesterification of biodiesel in a microreactor system. Currently, the industrial production of biodiesel is mainly performed in large-scale batch production [23], and only recently the concept of microreactors was introduced to this field [24]. One of the main advantages of microreactors is that they can be scaled up readily by increasing the number of reactors that are run in parallel [23]. The two selected process factors can readily be manipulated in an automated approach and thus are especially suited for implementing an automated control strategy. The self-built micro reactor set-up consisted of eight reactor segments with carved microchannels. Potassium hydroxide was used as the catalyst, and methanol as the alcohol to process rapeseed oil. A DoE approach with a self-developed, comprehensive design with five levels per factor was defined to examine the complex reaction behavior. For quantification of the reaction product, attenuated total reflection–Fourier transform infrared spectroscopy (ATR-FTIR) in the mid-IR range was applied. The industrial standard for FAME quantification according to European norm EN 14214 [25] is gas chromatography (GC). However, GC involves extensive sample preparation and is rather time-consuming [26]. ATR-FTIR efforts far less time and sample handling. The major drawback of FTIR is that individual sample constituents are not resolved as clearly as by GC during analysis. The raw material plant oil and the desired product FAMEs show very similar spectra, with only a few distinctive absorbance bands that are overlapped by common signals [27]. Thus, the spectral information must be further analyzed by multivariate data analysis. Different procedures were successfully developed by many researchers [26–31], highlighting the feasibility of this method. In our study, we used ATR-FTIR in combination with partial least squares regression (PLS) to quantify the FAME content in the samples generated according to the experimental design. Subsequently, statistical methods were applied to derive a mathematical description of the transesterification process.
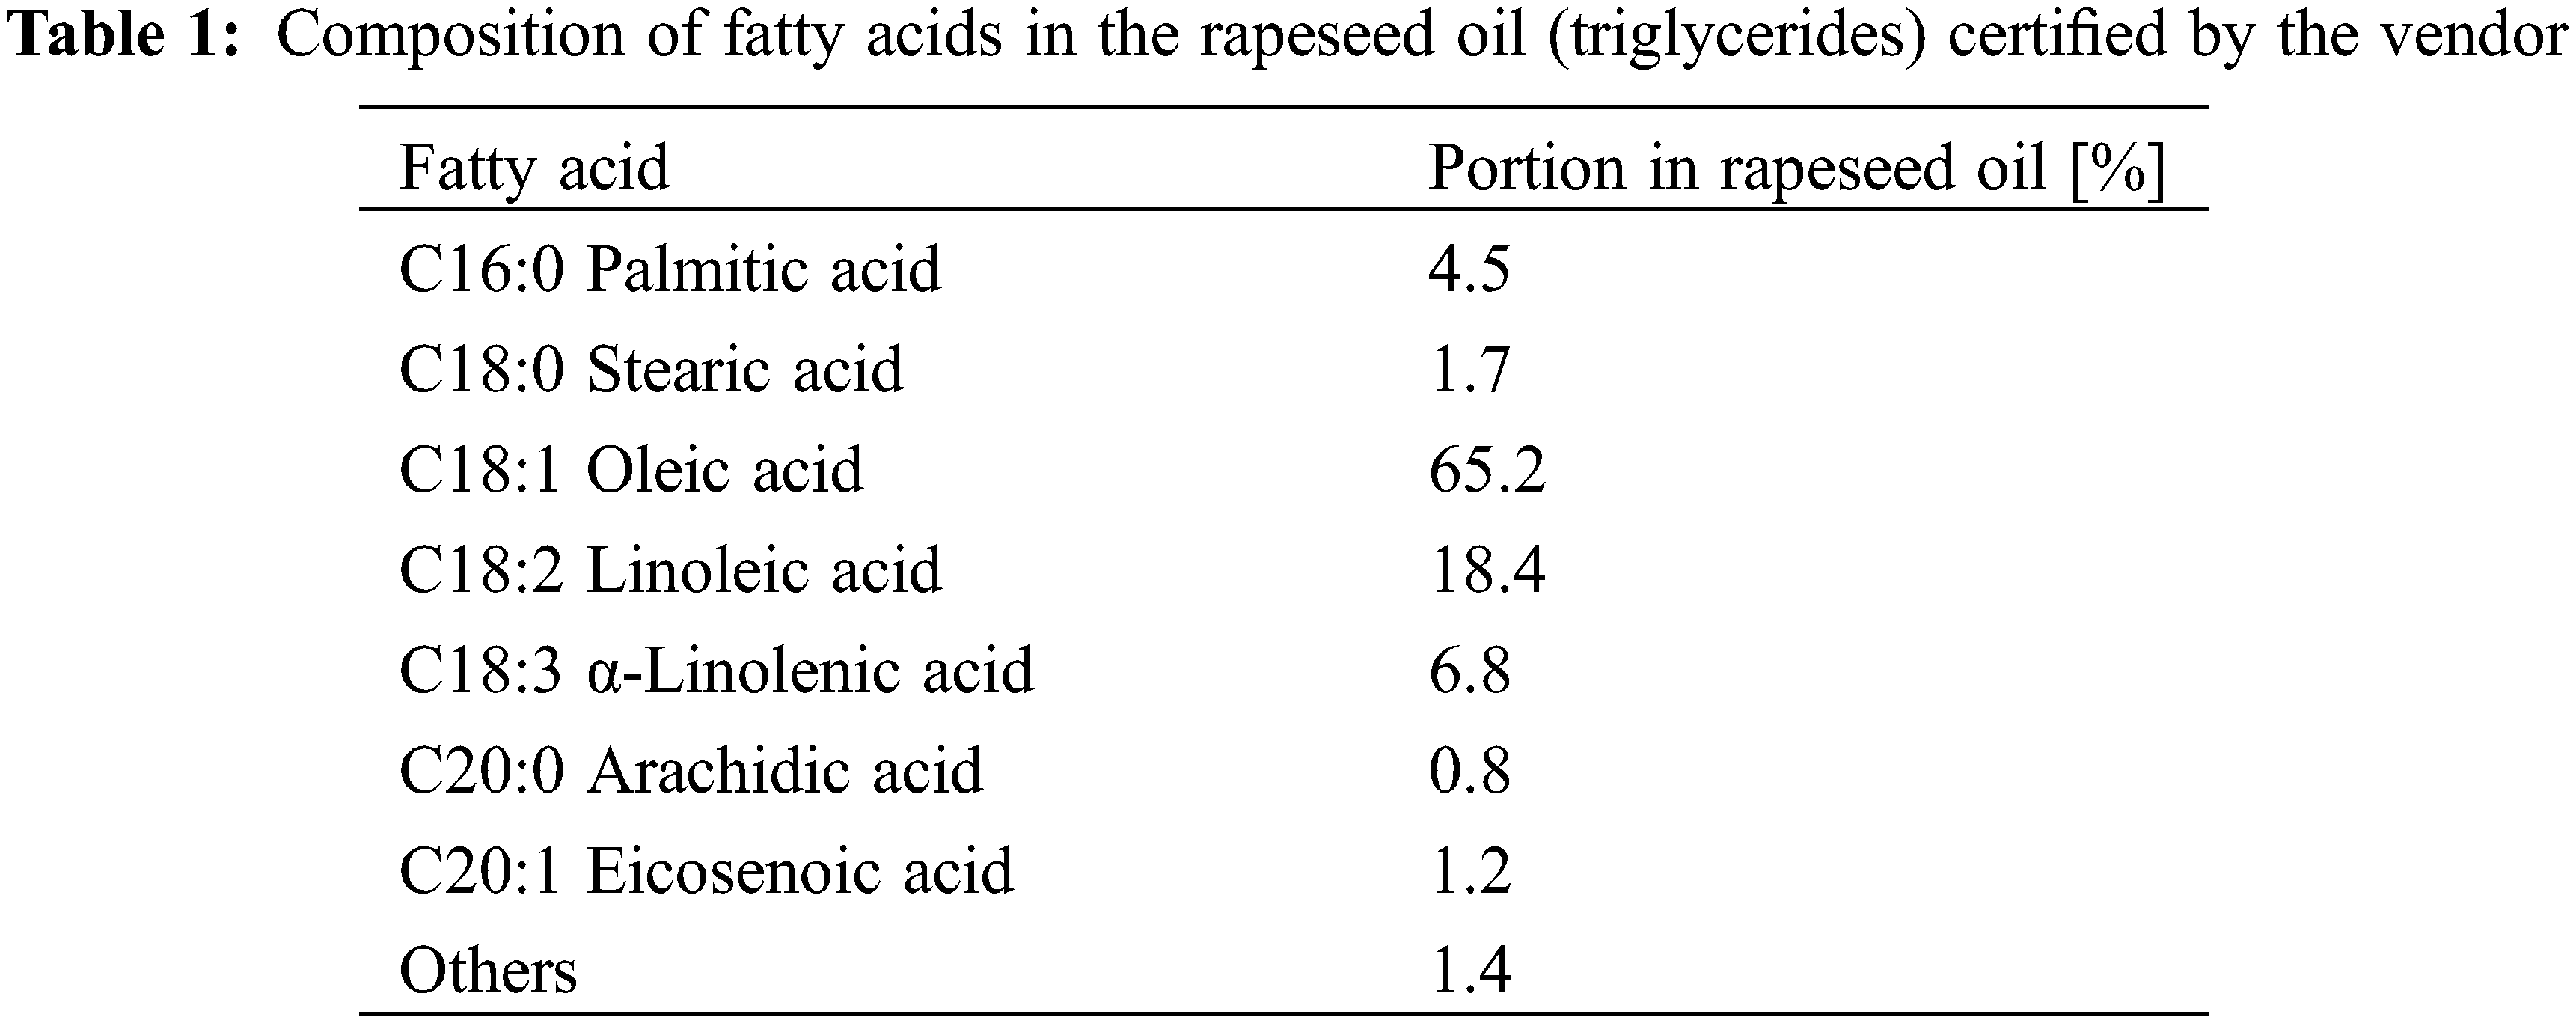
Refined rapeseed oil was obtained from Fauth GmbH & Co. KG (Mannheim, Germany). The composition of fatty acids in this oil is given in Table 1, and the average molar mass of triglycerides in the oil was ca. 881.7 g/mol. Methanol (HPLC grade) was purchased from Fisher Scientific (Loughborough, UK), and potassium hydroxide (KOH, in pellets) was bought from Merk KgaA (Darmstadt, Germany).
2.2 Transesterification Reaction in Micro Reactor
Transesterification was performed in a self-built microreactor system based on individual components supplied by FESTO SE & Co. KG (Esslingen, Germany). A scheme of this set-up is shown in Fig. 2. The reactor itself consists of stainless-steel metal plates in that microchannels were carved. These were stacked on top of each other and connected via perfluoro alkoxy alkane (PFA) tubes (inner diameter: 2 mm). Thereby segments that contain the reaction mixture, and heat-exchanger segments alternate with each other. Via the heat exchange segments, the microreactor was kept at reaction temperature using preheated water supplied by an external thermostat (JULABO GmbH, Seelbach, Germany). For the reactor plates, two types of microchannels were used. One type was designed for intensified mixing by micro mixing chambers (see segment number 6 in Fig. 2). The other type (reactor segments numbers 2, 4, and 8) consisted of long, straight channels to extend the flow path and define a suitable residence time. PTFA plates were used as sealings for the reactor plates. A temperature sensor was implemented in the bottom plate for temperature control.
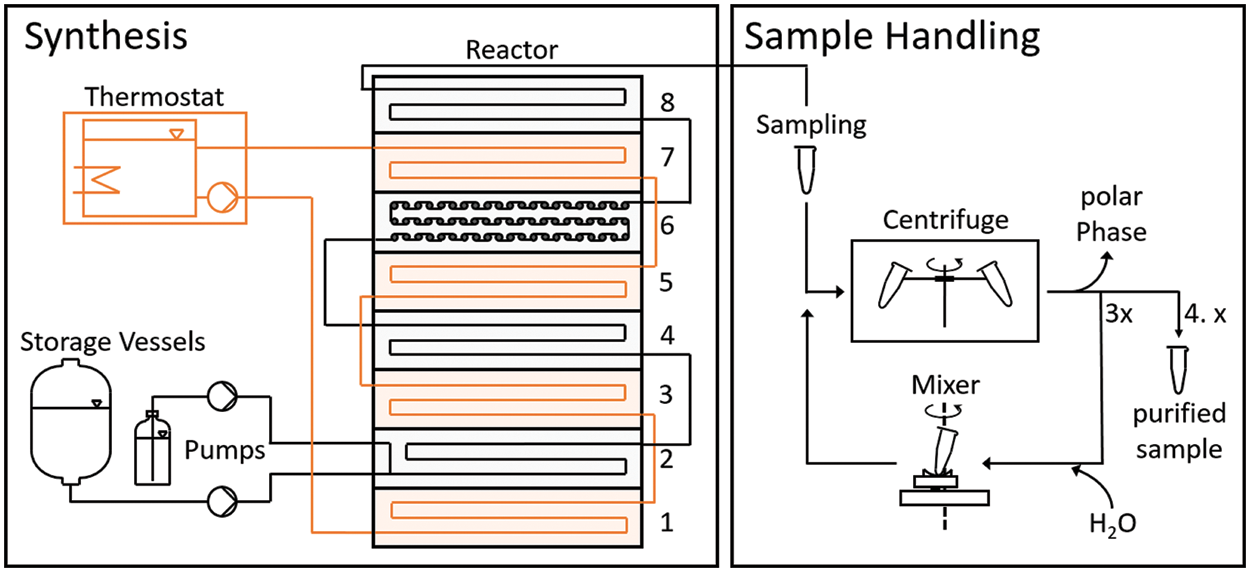
Figure 2: Scheme of the microreactor set up. The reactor consisted of a stack of micro-structured metal plates with suitable engravings. Heat exchanger/thermostat plates (plates 1, 3, 5, and 7) and reaction plates (in plates 2, 4, and 8 straight flow channels and in plate 6 micro mixing chambers were engraved) were placed in alternating order. The reactants were supplied by two HPLC pumps that were controlled by a control unit. A water thermostat was used to keep the reactor temperature constant at 60°C. At the end of the reactor, samples were taken manually and purified directly after sampling by centrifugation, decantation of the polar phase, and repeated rinsing with deionized water
The rapeseed oil and the methanol/catalyst mixture were supplied continuously by two separate HPLC pumps (model: Azura P 4.1S, Knauer Wissenschaftliche Geräte GmbH, Berlin, Germany) from two storage vessels. The flow rate of the reactants and the thermostat were controlled by a control unit (FESTO SE & Co. KG, Esslingen, Germany) consisting of a programmable logic controller, analog I/O devices, and a human-machine interface. The process parameters can be set manually via a touch screen.
The reaction temperature was set to 60°C. To prevent the formation of gas bubbles, a pneumatic valve was placed at the microreactor exit (not shown in Fig. 2) which allowed to increase process pressure. To measure and control the pressure, a pressure sensor unit was installed right before the valve and a pressure controller was part of the control unit. For all experiments, the pressure was set to 500 mbar.
All components of the reactor plant were connected via 2 mm ID PFA tubes.
To characterize the transesterification reaction yield in the microreactor a design of experiment was applied. The effects of two process factors on the FAME mass fraction in the non-polar phase of the reaction product were investigated as a measure of process yield. The first factor was the molar ratio between the reactants, representing a measure of methanol excess in chemical equilibria. The second factor was the total flow rate, which mainly governs residence time and mixing intensity.
For the robust characterization of the reactor behavior during transesterification of rapeseed oil, a custom experimental design was chosen in which the design space was divided into four equivalent quadrants. For each quadrant, a full factorial design with additional center points (performed as duplicates) was conducted. The design space (i.e., the distribution of the experimental settings for all runs) is shown in Fig. 3 in terms of coded and actual experimental levels. Each experiment is assigned a run number representing the randomized run order in which the experiments were performed. Some combinations of experimental settings were performed twice or even four times as indicated in Fig. 3. Overall, each factor was varied on five different levels allowing for quantitative evaluation of non-linear effects.
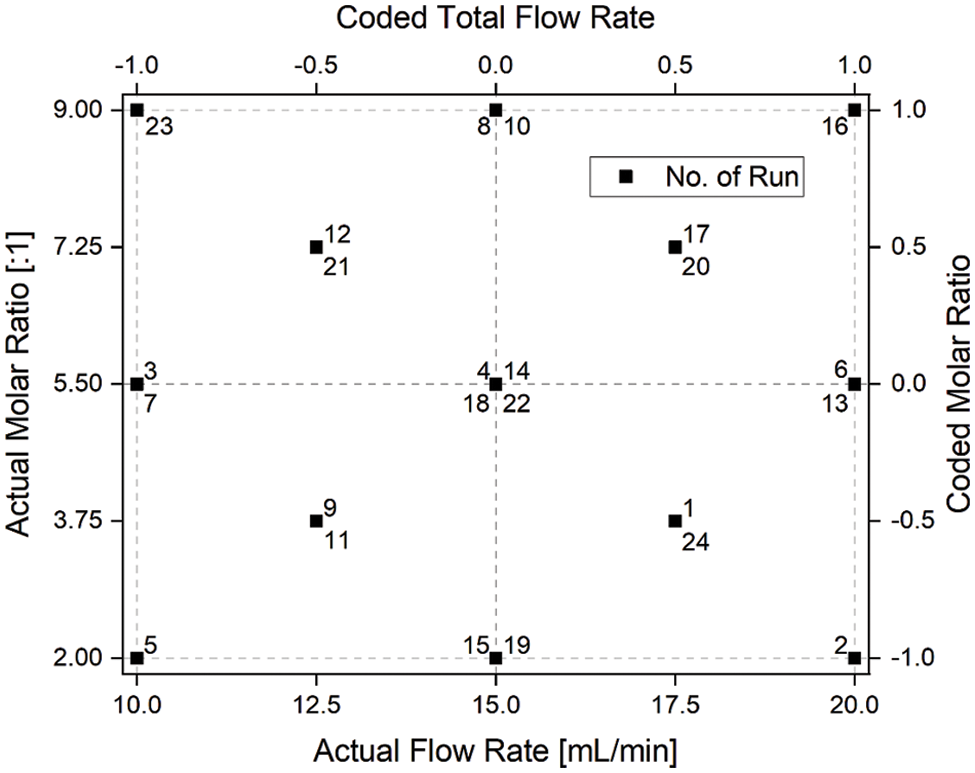
Figure 3: Experimental design applied for the characterization of the transesterification of rapeseed oil in a microreactor set-up. Each factor was varied on five levels. The design space is divided into four equivalent quadrants (as shown by dashed lines) and a full factorial design with replicated center points was conducted for each quarter
The statistical analysis of the results was performed using the software package Design Expert 12 (Stat-Ease, Minneapolis, US). Before analysis, the data were preprocessed using the logit transformation to match the natural boundaries of FAME mass fraction, which are 0% and 100% (m/m).
In addition to the test statistics derived from ANOVA and the regression analysis such as numerical values and statistical significances of factor effects, the error probabilities, and the response surface model coefficients, the parameter errors of the resulting model parameters
The Fisher information matrix was calculated according to
where
The partial derivative of f to one of these parameters results in just the factor to this parameter:
e.g.
In the last step, the parameter estimation errors (square root of the diagonal elements of the inverse of the FIM) were divided by the absolute value of the parameter to receive the relative value as a more intuitive measure of error magnitude.
The parameter errors were calculated by a self-written script using MATLAB R2018b.
2.4 Transesterification Experiments
Before the synthesis, the potassium hydroxide was dissolved in methanol. Here, a concentration was chosen, that results in a mass ratio of 1% (m/m) of KOH in relation to the rapeseed oil during an experiment with a molar ratio of methanol to oil of 6:1. Catalyst concentration was not adjusted during experiments with different molar ratios because only factor effects that can be readily automatically controlled were investigated here.
The experiments were conducted in the randomized run order as depicted in the experimental design plan (Fig. 3). After specifying the factor level settings for each experiment, transesterification was allowed to proceed for 45 min to give the system time to achieve a steady state. Afterward, samples were removed for further analysis and the factor level settings were changed accordingly for the next run. The microreactor rig worked automatically and no further manual actions were needed until one of the raw material storage vessels ran empty. In the end, the system was flushed to prevent corrosion and gum formation. For this, in the first step methanol with dissolved potassium hydroxide was used to remove rapeseed oil and FAME and in the second step, pure methanol was applied to remove traces of potassium hydroxide.
2.5 Sampling, Sample Preparation, and Off-Line FTIR Spectroscopic Analysis
During the runs of the experimental design, samples were taken after the equilibration of the system. Their phases were separated, the non-polar phase was rinsed with deionized water and the mass fraction of FAME in the non-polar phase was determined using an offline ATR-FTIR spectrometer. Samples were taken after 45 min of running the experiment at a specific combination of factor levels. For each experimental setting, two samples were retrieved by collecting two times 1 mL in 1.5 mL tubes at the microreactor outlet. These samples were centrifuged over 2.5 min at 10,000 g directly after sampling to stop the transesterification reaction by phase separation and subsequent removal of the heavier glycerol/methanol/catalyst phase. Furthermore, remnants of catalyst and polar reactants were removed by washing the nonpolar phase with 0.5 mL of deionized water, intense mixing, centrifugation (2.5 min at 10,000 g), and removal of the water phase. This washing step was conducted three times. The resulting samples were stored in glass vials with screw caps to prevent evaporation of FAMEs.
ATR-FTIR absorbance spectra were recorded using an ATR-FTIR spectrometer System 2000 FT-IR (Perkin Elmer, Waltham, USA) equipped with a DuraScope ATR accessory (SensIR Technologies, Danbury, US) in the range of 4000–650 cm−1 with a spectral resolution of 4 cm−1 and averaging 16 scans. Plain air was used as a reference. For quantification, a PLS calibration model based on preliminary experiments was applied. For the calculation of this calibration, model samples had been produced at the microreactor rig. These were analyzed spectroscopically with at-line ATR-FTIR and validated via gas chromatography equipped with a flame ionization detector (GC-FID) at an external lab.
For FAME quantification multivariate PLS regression was used to find a correlation between ATR-FTIR absorbance spectra and FAME mass fraction. Therefore, the software package PLS_Toolbox 8.7 (Eigenvector Research Inc. Manson, US) for MATLAB R2018b (The MathWorks Inc. Natick, US) was used.
Before modeling, the absorbance spectra were preprocessed with baseline correction (Whittaker filter, λ = 10e7, p = 0.001) and mean centering. Furthermore, the spectral regions of 3651–3066 cm−1 and 1055–998 cm−1 were excluded from data analysis, due to interferences by methanol. For calibration samples from former experiments were analyzed by ATR-FITR and GC-FID. The ATR-FTIR data were used as X-data while the FAME mass fractions determined by GC-FID were included as Y-data. The model with two latent variables was used for further investigations because it resulted in a satisfactory explanation of the variance in the data set and the inclusion of further latent variables did not improve model quality any further.
This model was applied to quantify the FAME mass fraction in the samples collected during the runs of the experimental plan. The mean of the two samples taken per run was calculated and used for statistical analysis.
3.1 FAME Quantification with FTIR Spectroscopy
This study aims to investigate the effects of process factors on the yield of the transesterification of rapeseed oil to produce FAMEs (that can be used as biodiesel) in a microreactor set up. Therefore, a series of experiments was conducted according to a factorial design of experiment. During the single runs of the design, physical samples were taken and the mass fraction of FAME in the non-polar phase was determined by the combination of ATR-FTIR spectroscopy with a multivariate PLS regression model based on calibration with GC-FID reference data. The values for the yield were used as the response values for statistical analysis to model the reactor behavior.
The absorbance spectra of the samples are shown in Fig. 4. These are highly similar with only slight variations in their spectroscopic features. In general, some overlapping absorption bands are observed around 2900 cm−1, one separated band at ∼1745 cm−1, and several highly overlapping bands in the fingerprint region below 1500 cm−1. The bands around 2900 cm−1 can be assigned to symmetrical and asymmetrical -CH2 and -CH3 stretching vibrations of the fatty acid chains and alcohols bound together in the esters. The isolated band at 1745 cm−1 results from the carbonyl stretching vibration of the ester groups. In addition, a weak, but broad absorbance band is observed at 3600 cm−1 that might be assigned to -OH vibrations [31].
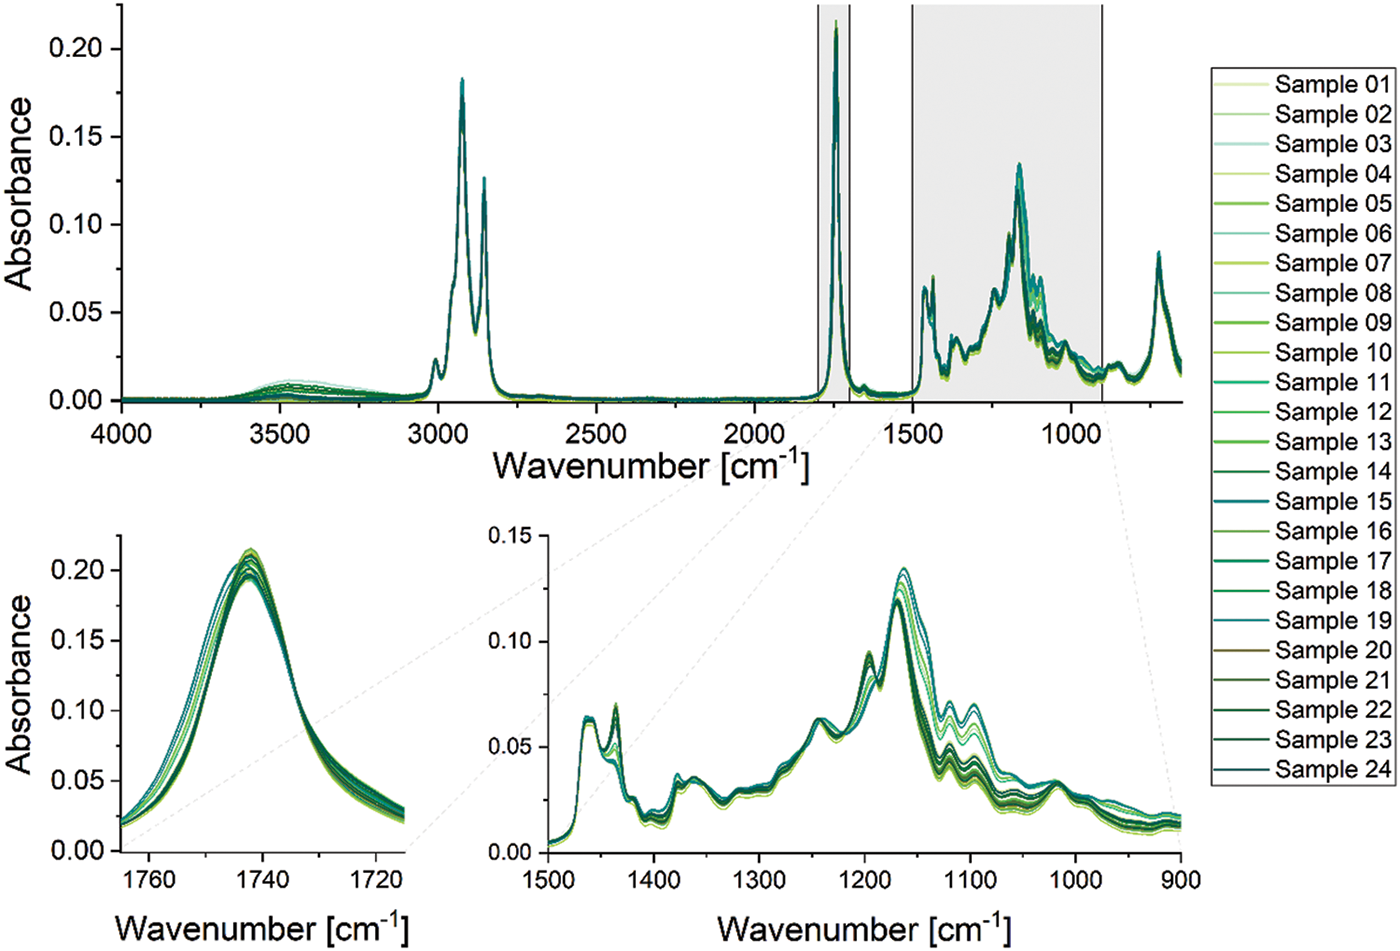
Figure 4: ATR-FTIR absorbance spectra of the non-polar phase of samples taken at the microreactor at the different factor level combinations of the statistical experimental design plan for process characterization of the transesterification of rapeseed oil for biodiesel synthesis. The upper diagram shows the whole spectrum in the region of 4000–650 cm−1. The lower diagrams show relevant sections of the spectrum; on the left, the spectral region from 1770–1710 cm−1 is depicted, which is characteristic for the carbonyl stretching vibration. On the right, the spectral fingerprint region from 1500–900 cm−1 is depicted
From previous experiments it is known, that the non-polar phase of the samples might consist of FAME, unreacted rapeseed oil, and residual mono- and diglyceride intermediates (IUPAC names: mono-O-acylglycerol and di-O-acylglycerol, respectively). The main portion of other reactants (methanol, glycerol, catalyst) is removed during sample purification. Although the amounts of oil and FAME may vary strongly between the samples, most bands in the spectra are nearly identical. Small but distinct differences can be found in the fingerprint region: e.g., the shoulders at 1434 and 1196 cm−1 as well as overlapping bands at 1378, 1120, and 1096 cm−1 (see the bottom-right graph of Fig. 4). The absorbance bands at 1434 and 1196 cm−1 can be assigned to vibrations of methyl -CH3 bound to an oxygen atom and (methyl)carbon–oxygen (H3C-O-) bending vibration, respectively [27,31]. Thus, they are characteristic for the methyl ester group of FAMEs since they are not present in rapeseed oil. The presence of these bands indicates FAME-rich samples. The oil consists of triglycerides, that show -CH-CH2-O and (-CH2)2-CH-O vibrations around 1100 cm−1 that are characteristic for the glycerol backbone. Thus, these signals are much more prominent in the absorbance spectrum of rapeseed oil-rich samples. Furthermore, the carbonyl band shows a slight shift from 1744 cm−1 (oil) to 1742 cm−1 (FAME). This is visible in the lower-left graph of Fig. 4.
Due to the strong overlapping of characteristic bands and only small changes of intensive bands a univariate calibration is prone to noise and interference, e.g., by intermediates or byproducts. In such a case it is advantageous to not only rely on single bands but exploit the spectral information over a wide range of wavelengths. Consequently, a multivariate PLS regression model was applied here. This model was retrieved by regression of ATR-FTIR spectra of samples collected from the microreactor rig with the FAME mass fraction determined by GC-FID (further details are given in Appendix A). The calibration model showed high quality with a coefficient of determination R² of 0.995 and root mean square errors of cross-validation of 1.9% (m/m). The regression vector of this model is shown in Fig. 5. Here the regions 3651–3066 cm−1 and 1055–998 cm−1 were excluded due to spectral interferences with methanol during calibration.
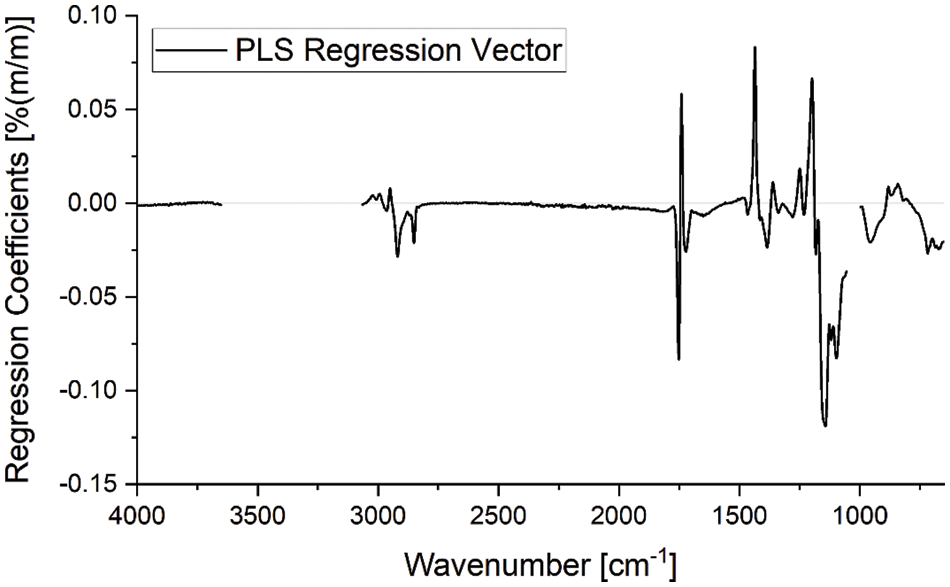
Figure 5: Regression vector of the PLS model with two latent variables used for FAME quantification from ATR-FTIR spectra. Wavelength regions, where strong interference with methanol bands was observed, were not used for the regression model. The regression coefficients show values deviating from zero in wavelength ranges that show absorbance bands specific for the analyzed reactants. Thus, the calibration is based on the spectral features of the analytes
While regression coefficients of or close to zero do not contribute to the quantification, some suggestions about spectral features that are influencing the calculations can be drawn from the regression vector. High values (positive and negative) are observed around 1745, 1435, 1196 cm−1 and in the region between 1170 and 1070 cm−1. These match well with characteristic spectral features of FAME and triglycerides: At 1745 cm−1–the carbonyl stretching vibration shows a strong band shift resulting in the sharp changes between negative to positive regression coefficients; at 1435 and 1196 cm−1 the characteristic methyl ester vibrations appear which are characteristic for FAME; and the region 1170–1070 cm−1, which is characteristic of the glycerol backbone-oxygen (for vibrations of triglycerides). In the wavelength ranges characteristic for FAME, the regression coefficients are positive, while they are negative in the triglyceride-specific ranges. Thus, this quantification method relies on actual spectral features of the analytes, and consequently, robust results can be expected.
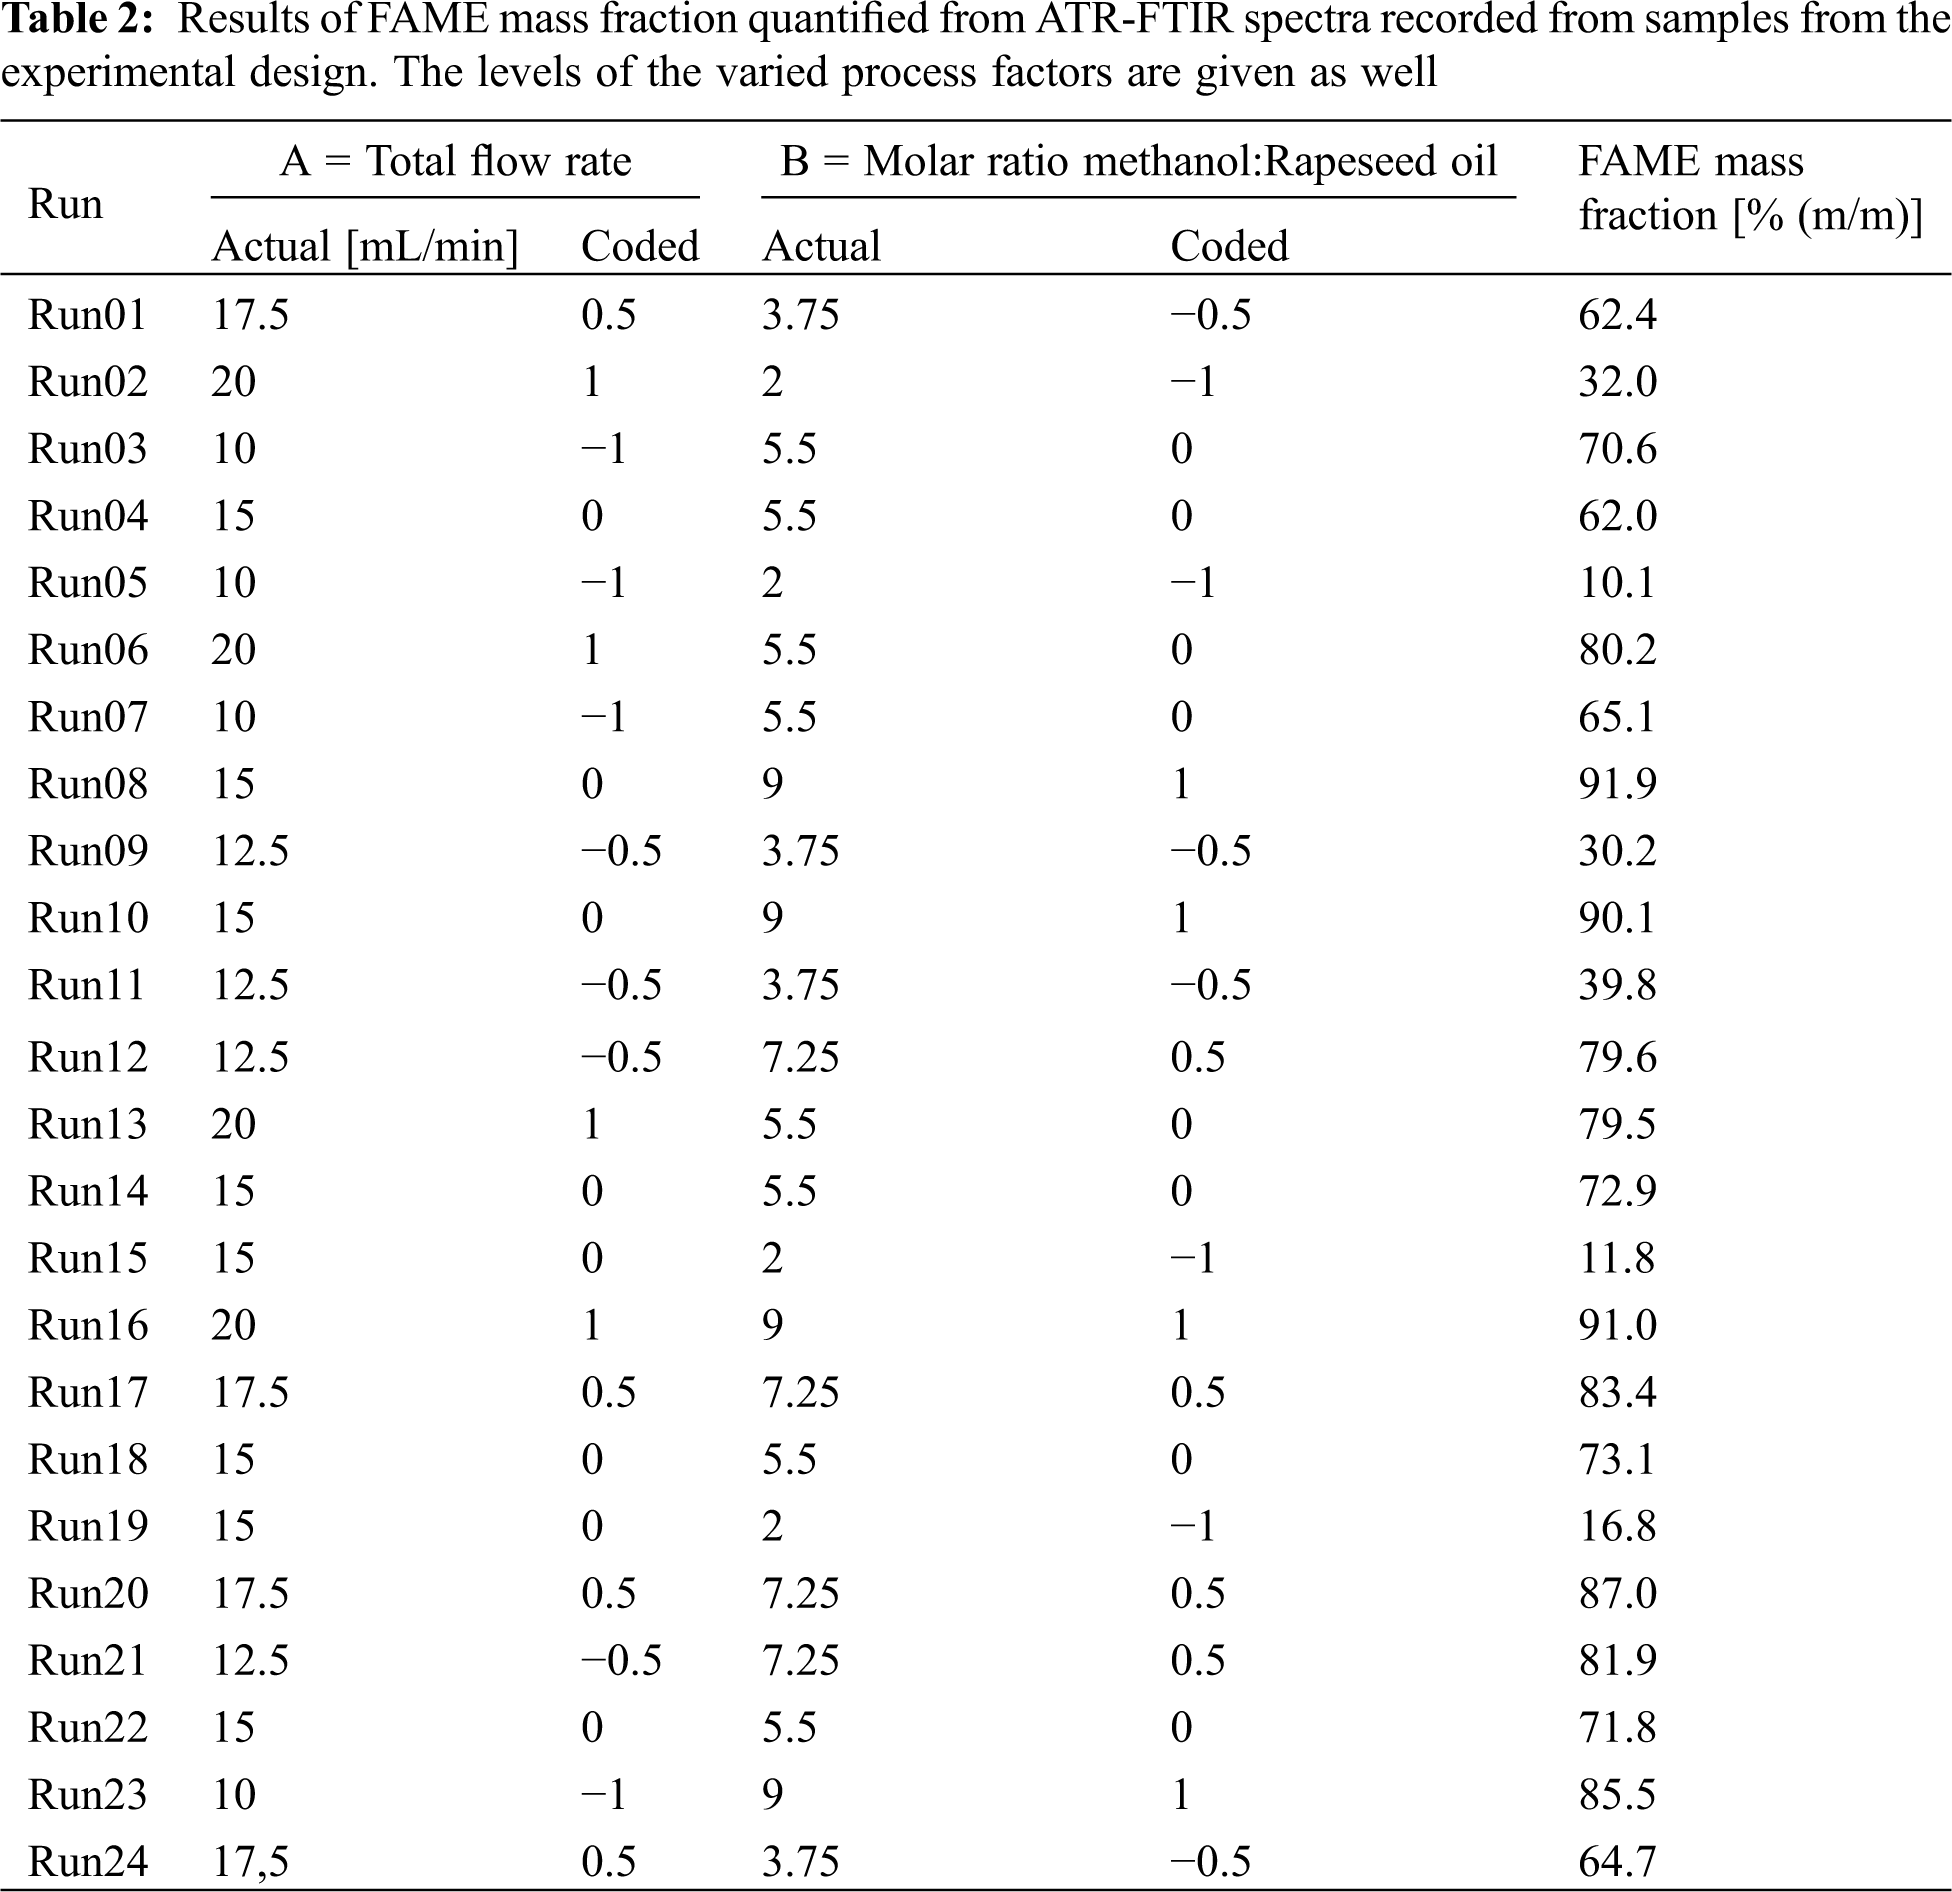
The PLS model was applied to quantify the FAME mass fraction from the ATR-FTIR spectra of the samples collected during the single runs of the experimental plan. The results are given in Table 2. For a low total flow rate and low molar ratio, a minimum FAME mass fraction of 30.2% (m/m) was observed. With increasing total flow rate and molar ratio, the mass fraction increases up to a maximum of 91.9% (m/m) at a high molar ratio and medium total flow rate (91.0% (m/m) for both factor levels high). For proper modeling, a statistical analysis of these results was done.
3.2 Statistical Process Characterization and Modelling
To characterize and eventually model the reactor behavior the results from the FAME quantification were statistically analyzed. According to an experimental plan, two process factors were varied systematically according to Table 2:
1. The total flow rate of the reactants: when the total flow is increased, the residence time of the reactants inside the reactor decreases, which on the one hand might in turn lead to lower degrees of conversion. On the other hand, higher flow rates might also change the flow profile in a way that intensified mixing and increased interphase area via higher turbulence in the microchannels is the result. This would enhance the conversion rate. In the experiments, the total flow rate was varied from 10–20 mL/min.
2. The molar ratio of the reactants: methanol to triglycerides. Because transesterification involves chemical equilibrium reactions (Fig. 1), the process yield can be increased by excessive usage of one reactant. Usually, an excess of methanol is used. In the design space, the molar ratio of methanol to triglyceride was varied from 2–9:1 (mole/mole) starting below the stoichiometric ratio of three and is raised to an excess of three times the stoichiometric value.
Due to the complex structure of the microreactor involving different flow profiles (micromixing chambers, straight rectangular milled channels, round-shaped tubes) and the nature of the reaction involving three reaction steps and chemical equilibria, we expected non-linear behavior. In addition, the reaction mixture tends to form two phases: methanol/glycerol/catalyst as the polar phase and rapeseed oil/FAME as the non-polar one, where methanol shows good solubility in FAME-rich mixtures [12,33]. In addition, the intermediate mono- and diglycerides can act as surfactants that stabilize dispersions.
To approach this complicated system with a sufficiently large number of experiments in a methodically appropriate way, it was decided to perform a customized design of experiments based on a factorial approach with five levels for both factors. The number of experiments (and replicates) and the symmetric distribution of the experimental factor level settings across the design space permits response surface modeling of the process based on non-linear factor effects and synergistic interaction effects. Before statistical analysis the response values were preprocessed by logit-transformation to take into account the natural limits of 0% and 100% (m/m):
This data pre-treatment measure results in an improved model quality as shown by a higher coefficient of determination and a lower F-value in the lack-of-fit test.
The results of the ANOVA are given in Table 3. Only statistically significant (ANOVA p-value < 0.05) linear, non-linear, and interaction effect terms were included in the analysis. Thus, the term with the coefficient A² (Total Flow Rate²) was omitted, because the ANOVA analysis resulted in a p-value of 0.384 (which lies above the significance level of 0.05). This indicates that this term is not required to describe the reactor behavior, i.e., there is no non-linear dependence of FAME yield on the total flow rate.
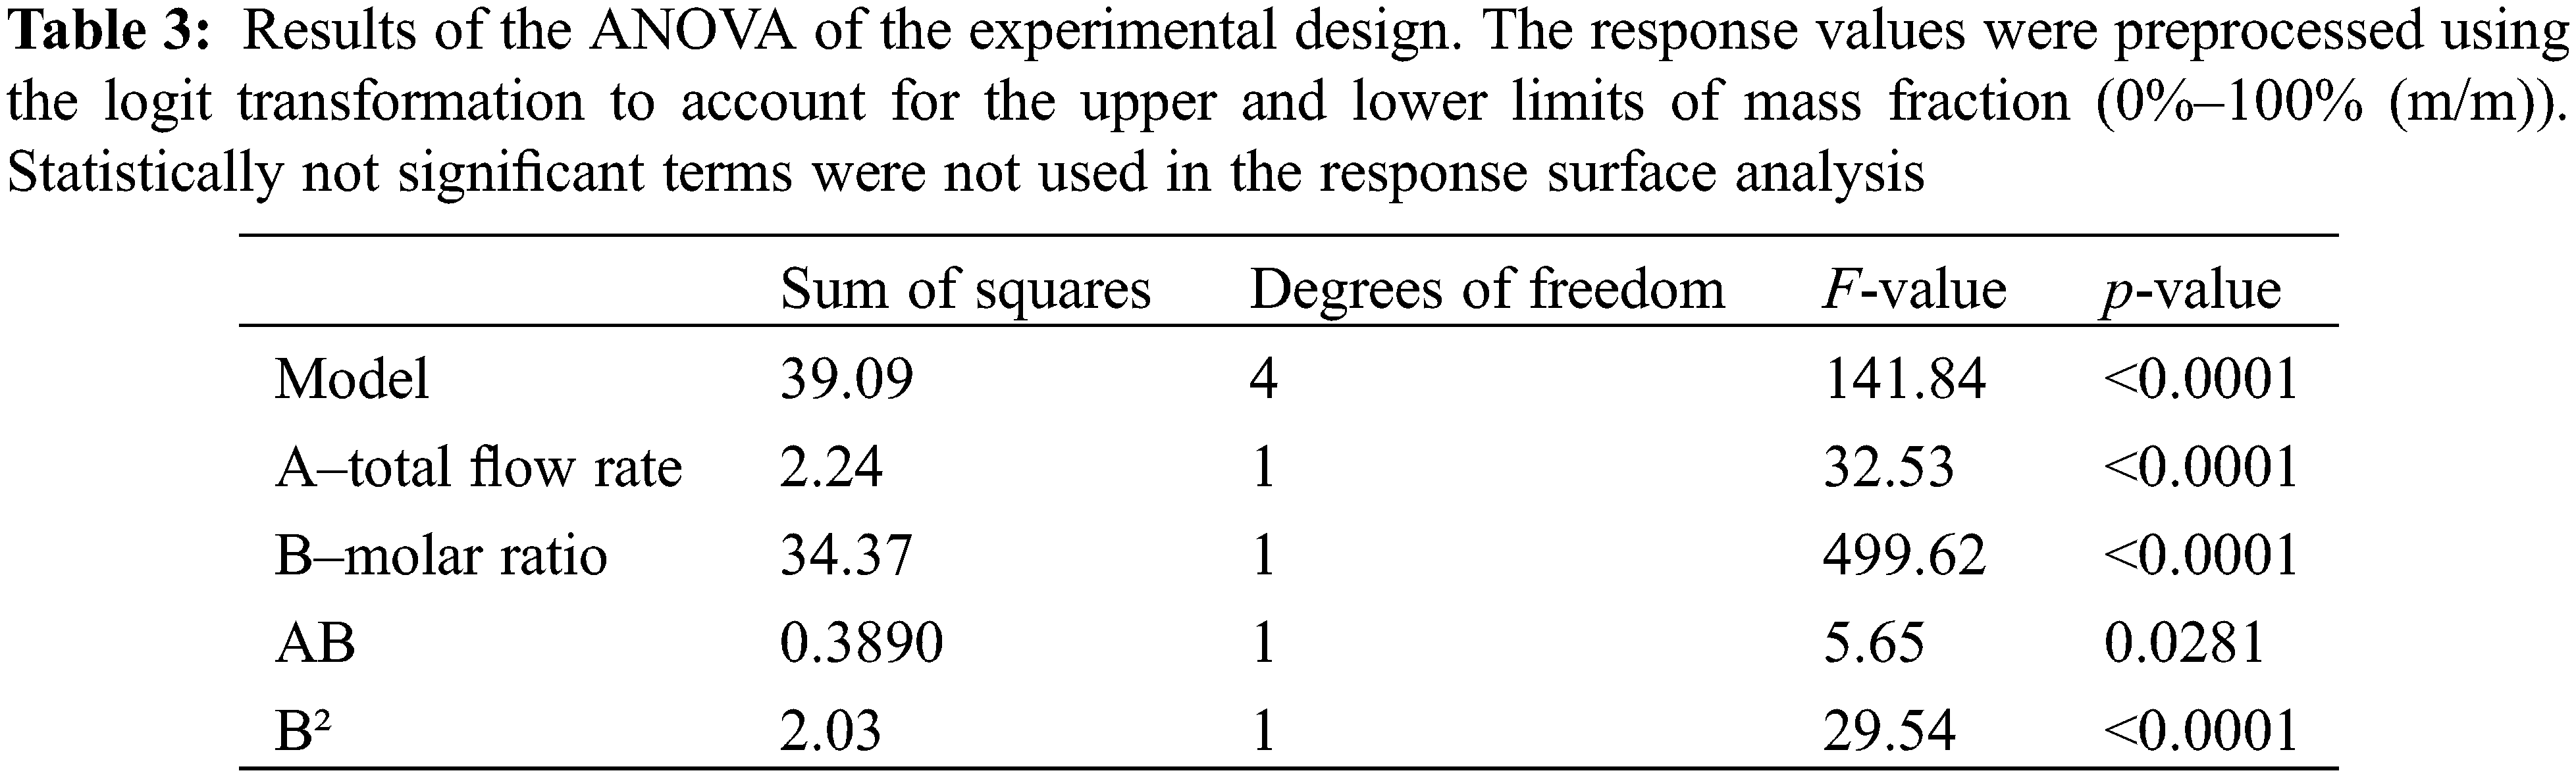
From ANOVA, the following model equation was retrieved to describe the microreactor behavior during the transesterification of rapeseed oil:
Model Equation in terms of coded factors:
The model equation in terms of coded factors allows direct comparison of the relative strength of factor effects. Factor B (the molar ratio) has the strongest effect on the process. It is about 3 times larger than the effect of the flow rate. In addition, there is a strong non-linear component (term
Model Equation in terms of actual values:
The coefficients of determination R²(adj.) = 0.9608 and R²(pred.) = 0.9505 indicate a good and robust fit of the model with the measured values without overfitting. The p-value of 0.0833 in the lack-of-fit test also shows that the non-linear two-factor interaction model is statistically significant. The standard deviation is 0.2623. Fig. 6 shows the FAME mass fraction as predicted by the model for the whole design space visualized by a 3D response surface plot. The measured values (red dots in Fig. 6) are in good agreement with the model. For calculation, the model equation in terms of actual values for the factors was used.
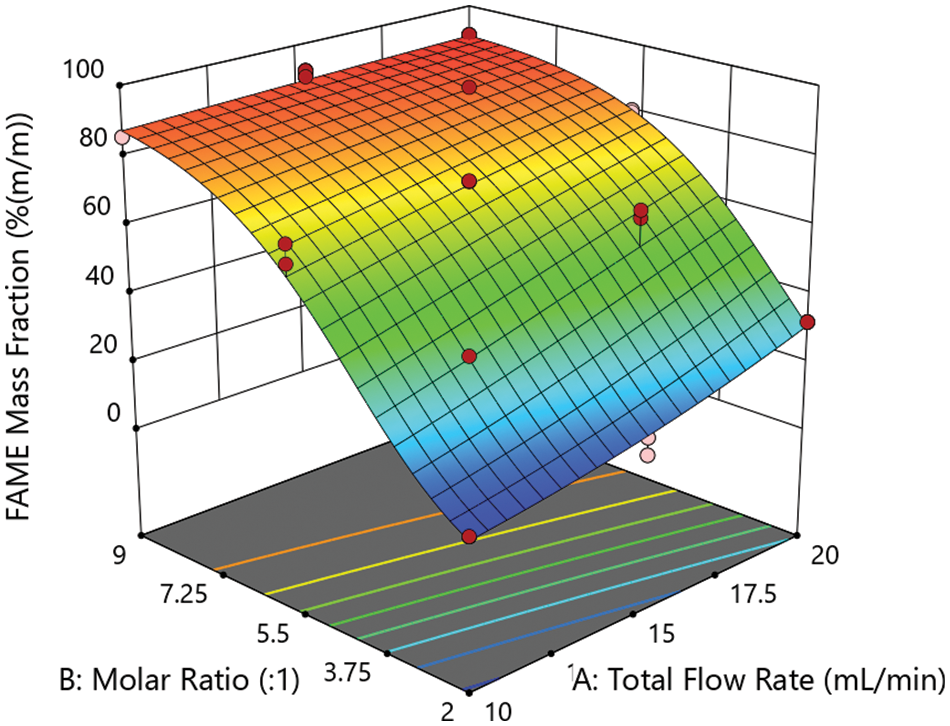
Figure 6: FAME mass fraction of the nonpolar phase produced with the microreactor set-up in dependence on total flow rate and molar ratio as predicted by the response surface model. Red dots in the 3D surface plot indicate the actual experimental values
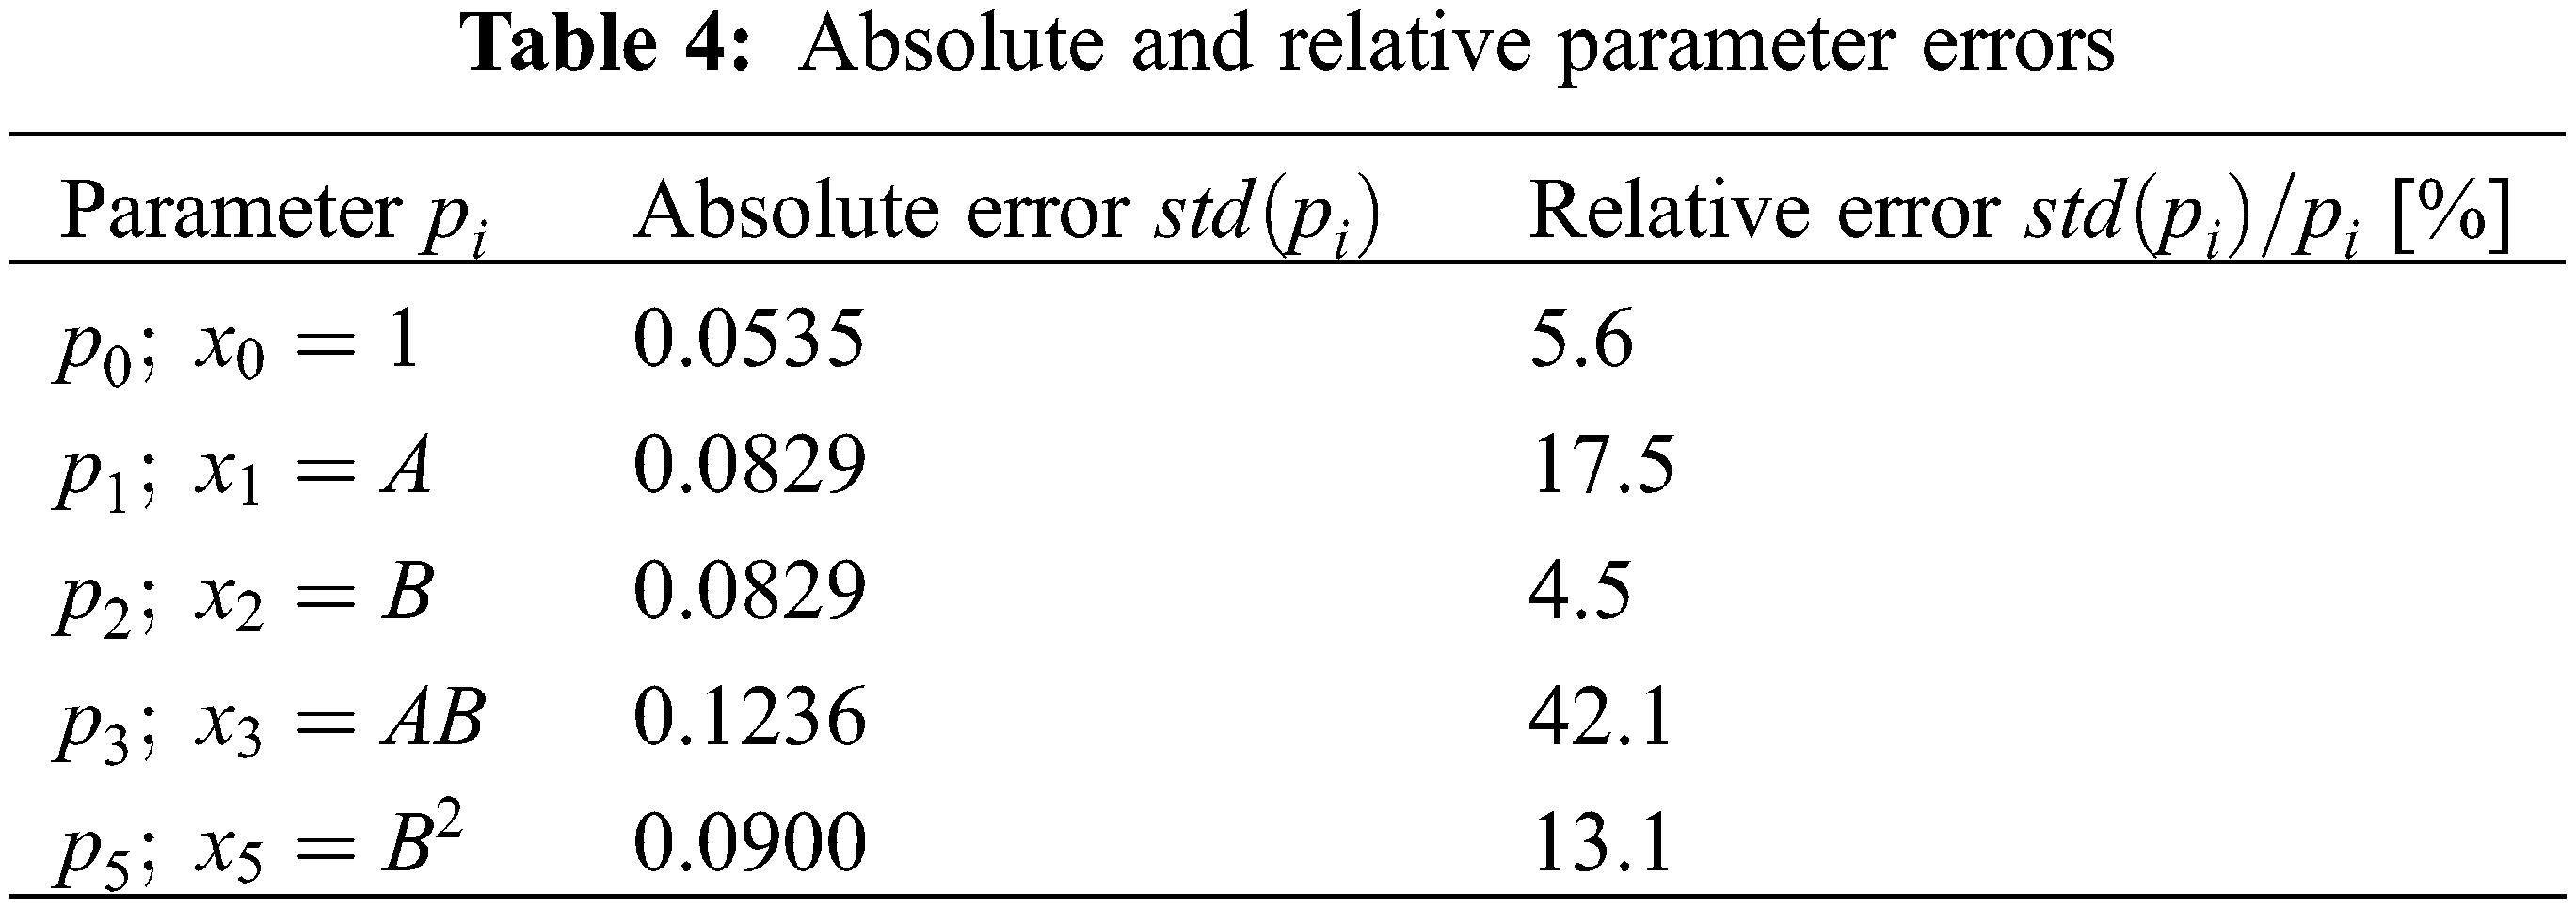
The absolute and relative parameter estimation errors calculated from the square root of the inverse of the Fisher information matrix are given in Table 4. Here, all parameters except
3.3 Influence of the Process Factors
The effects of the investigated process factors on the quality attribute FAME mass fraction are visualized in the perturbation plot shown in Fig. 7. Obviously, with an increase in both molar ratio and flow rate, the FAME mass fraction and consequently the yield increases. Here, at least within the investigated factor level range, the effect of the total flow rate is much smaller than that of the molar ratio of methanol to triglycerides. A higher extent of methanol shifts the chemical equilibria to the product side resulting in higher FAME mass fractions, especially because the –1 level lies below the stoichiometric ratio. At high molar ratios with resulting FAME yields approaching 100% (m/m), this effect diminishes leading to the curved shape of the response behavior. The non-linear characteristic of this factor is best described by the second-order polynomial model equation and logit transformation of the response values.
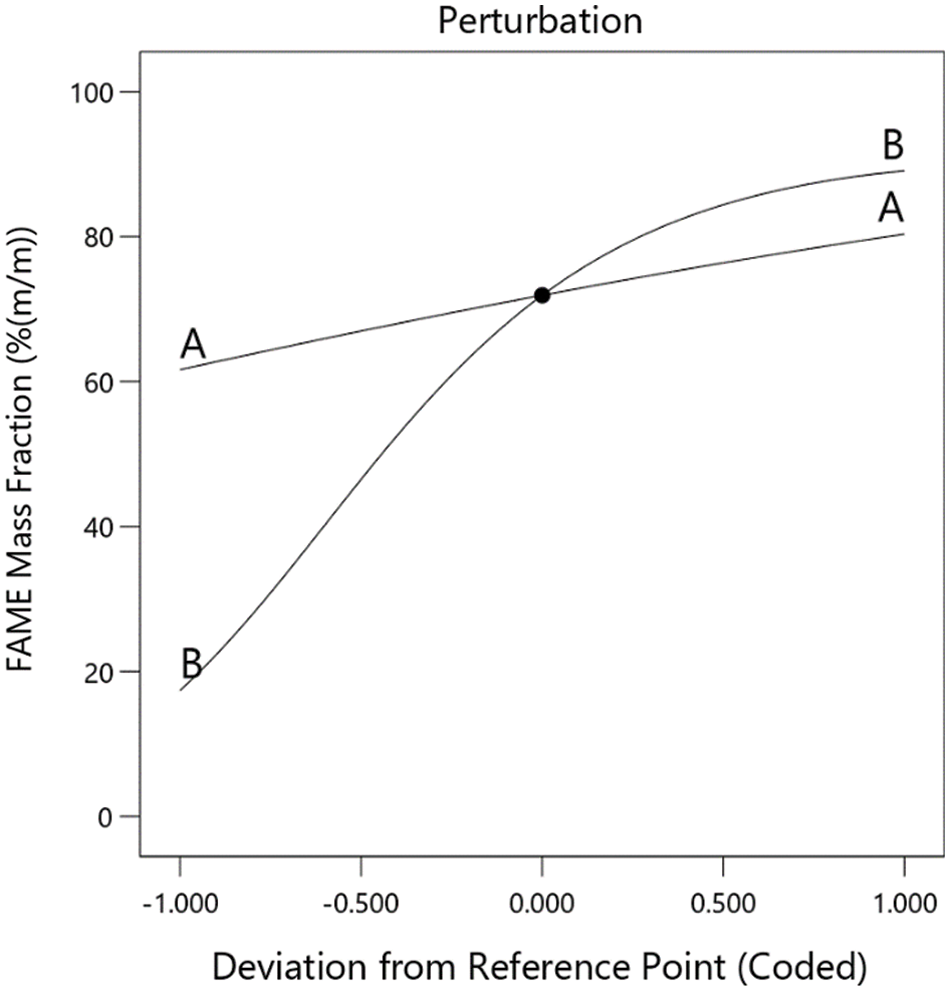
Figure 7: Perturbation plot describing the influence of the process factor A: total flow rate and B: molar ratio on the FAME mass fraction of the nonpolar phase of the reaction product, as a measure of the yield of biodiesel synthesis from rapeseed oil in the microreactor set-up
The increase of FAME mass fraction with increasing factor level setting of the total flow rate (factor A) seems counterintuitive. One might expect that an increase in the flow rate is accompanied by a decrease in residence time. Thus, the yield should be reduced, as was reported, e.g., by Sun et al. [20], who observed an increase in the methyl ester yield when the residence time increases within their microcapillary reactor set-up. Obviously, in the microreactor used in our set-up other effects, probably fluid dynamic phenomena, have a counter-acting effect. Very likely, an increase in the flow rate leads to intensified blending in the micromixing chambers of the reactor. E.g., Boer et al [34] reported, that the flow rate had a crucial impact on the flow regime when they studied the fluid dynamics of later stages of a transesterification process. They observed a stratified flow of the polar glycerol/methanol phase beneath the FAME/rapeseed oil phase at low flow rates that changes to a dispersed flow regime (polar droplets in non-polar bulk phase) with increasing flow rate. Also, Likozar et al. [24] reported some interesting findings in their study with a continuous tubular reactor of a rather high inner diameter in which static mixers were implemented: In contrast to the results reported by us, they observed a decrease in the FAME fraction when increasing the flow rate. This was in agreement with computational simulations involving reaction kinetics, chemical equilibria, and mass transfer. On the other hand, they stated, that higher shear stress could lead to the transition of the heterogeneous (dispersed) system to a pseudo homogeneous operating regime, which they observed during batch-wise transesterification. In the microreactor set-up studied here, low pressure at the reactor inlet was observed during processing. This is a clear hint that internal friction occurred that could cause a transition of the flow regime.
These findings emphasize that the underlying physical and chemical phenomena are more complex than just a simple correlation between residence time and total flow rate. This behavior is also reflected by the presence of the two-factor interaction effect term between both factors investigated here in the response surface model.
In summary, a well-suited virtual process model for biodiesel transesterification in a microreactor set-up was derived for the factors molar ratio of the reactants and flow rate by analyzing the reaction product with ATR-FTIR spectroscopy in combination with PLS regression and consecutive statistical analysis of an experimental plan organized by a customized factorial experiment. A response surface model is presented for the transesterification reaction of rapeseed oil with methanol to synthesize biodiesel in a continuous microreactor set-up by a novel Design of Experiment approach. ATR-FTIR spectroscopy is used for quantification of the reaction product FAME as a fast and reliable analytical technology. Due to the high similarity of the analytes spectra, a multivariate PLS model was used for quantification. This shows high regression coefficients in good accordance with actual absorbance bands that are specific to the analytes and thus relays on actual spectroscopic features highlighting the robustness of the methodology. This technique can be implemented as an inline process analytical technology in the future.
The statistical evaluation of the response showed a complicated behavior that can be described by a second-order polynomial involving two-factor interaction effects of the two investigated factors, reactants molar ratio and total flow rate. These factors can readily be adjusted in a fully automated approach giving the opportunity to carefully control the reactor outcome. Furthermore, process characterization of the microreactor behavior resulted that an increase in reactants’ total flow rate resulted in an increased process yield. This is only scarcely observed in literature and is a consequence of an unusual flow regime. Nonetheless, the methodology of throughout process characterization by varying easy-to-control process variables and FTIR quantification can be transferred to numerous technical transesterification processes.
Acknowledgement: We kindly thank Florian Zieker and Andreas Häck from FESTO Se & Co. KG for supplying the components of the microreactor set up as well as valuable discussions. Furthermore, we want to thank Klaus Tröster from ASG Analytik-Service Gesellschaft mbH for performing GC-FID analysis of transesterification product samples and Martyna Kubik from Fauth GmbH + Co. KG for determining the fatty acid profile of the refined rapeseed oil.
Funding Statement: The authors received no specific funding for this study.
Conflicts of Interest: The authors declare that they have no conflicts of interest to report regarding the present study.
References
1. EurObservER (2021). Renewable energy in transport barometer. https://www.eurobserv-er.org/res-in-transport-barometer-2021/. [Google Scholar]
2. Hoekman, S. K., Broch, A., Robbins, C., Ceniceros, E., Natarajan, M. (2012). Review of biodiesel composition, properties, and specifications. Renewable and Sustainable Energy Reviews, 16(1), 143–169. DOI 10.1016/j.rser.2011.07.143. [Google Scholar] [CrossRef]
3. Hanif, M. A., Nisar, S., Akhtar, M. N., Nisar, N., Rashid, N. (2018). Optimized production and advanced assessment of biodiesel: A review. International Journal of Energy Research, 42(6), 2070–2083. DOI 10.1002/er.3990. [Google Scholar] [CrossRef]
4. Bitire, S. O., Jen, T. C., Belaid, M. (2021). Production and optimization of biodiesel from parsley seed oil using KOH as catalyst for automobiles technology. The International Journal of Advanced Manufacturing Technology, 116(1–2), 315–329. DOI 10.1007/s00170-021-07415-6. [Google Scholar] [CrossRef]
5. Freedman, B., Pryde, E. H., Mounts, T. L. (1984). Variables affecting the yields of fatty esters from transesterified vegetable oils. Journal of the American Oil Chemists’ Society, 61(10), 1638–1643. DOI 10.1007/BF02541649. [Google Scholar] [CrossRef]
6. Mansir, N., Teo, S. H., Mijan, N. A., Taufiq-Yap, Y. H. (2021). Efficient reaction for biodiesel manufacturing using bi-functional oxide catalyst. Catalysis Communications, 149. DOI 10.1016/j.catcom.2020.106201. [Google Scholar] [CrossRef]
7. Kuniyil, M., Shanmukha Kumar, J. V., Adil, S. F., Assal, M. E., Shaik, M. R. et al. (2021). Production of biodiesel from waste cooking oil using ZnCuO/N-doped graphene nanocomposite as an efficient heterogeneous catalyst. Arabian Journal of Chemistry, 14(3). DOI 10.1016/j.arabjc.2020.102982. [Google Scholar] [CrossRef]
8. Touqeer, T., Mumtaz, M. W., Mukhtar, H., Irfan, A., Akram, S. et al. (2020). Fe3O4-PDA-lipase as surface functionalized nano biocatalyst for the production of biodiesel using waste cooking oil as feedstock: Characterization and process optimization. Energies, 13(1), 177–195. DOI 10.3390/en13010177. [Google Scholar] [CrossRef]
9. Son, J., Kim, B., Park, J., Yang, J., Lee, J. W. (2018). Wet in situ transesterification of spent coffee grounds with supercritical methanol for the production of biodiesel. Bioresource Technology, 259, 465–468. DOI 10.1016/j.biortech.2018.03.067. [Google Scholar] [CrossRef]
10. Richard, R., Thiebaud-Roux, S., Prat, L. (2013). Modelling the kinetics of transesterification reaction of sunflower oil with ethanol in microreactors. Chemical Engineering Science, 87, 258–269. DOI 10.1016/j.ces.2012.10.014. [Google Scholar] [CrossRef]
11. Tariq, M., Ali, S., Khalid, N. (2012). Activity of homogeneous and heterogeneous catalysts, spectroscopic and chromatographic characterization of biodiesel: A review. Renewable and Sustainable Energy Reviews, 16(8), 6303–6316. DOI 10.1016/j.rser.2012.07.005. [Google Scholar] [CrossRef]
12. Komers, K., Tichý, J., Skopal, F. (1995). Ternäres phasendiagramm biodiesel-methanol-glyzerin. Journal für die Praktische Chemie Chemiker-Zeitung, 337, 328–331. DOI 10.1002/(ISSN)1521-3897. [Google Scholar] [CrossRef]
13. Kusdiana, D., Saka, S. (2004). Effects of water on biodiesel fuel production by supercritical methanol treatment. Bioresource Technology, 91(3), 289–295. DOI 10.1016/S0960-8524(03)00201-3. [Google Scholar] [CrossRef]
14. Ulitzsch, S., Bäuerle, T., Stefanakis, M., Brecht, M., Chassé, T. et al. (2021). Synthesis of an addition-crosslinkable, silicon-modified polyolefin via reactive extrusion monitored by in-line Raman spectroscopy. Polymers, 13(8). DOI 10.3390/polym13081246. [Google Scholar] [CrossRef]
15. Mrsic, I., Bäuerle, T., Ulitzsch, S., Lorenz, G., Rebner, K. et al. (2021). Oxygen plasma surface treatment of polymer films—Pellethane 55DE and EPR-g-VTMS. Applied Surface Science, 536, 1–11. DOI 10.1016/j.apsusc.2020.147782. [Google Scholar] [CrossRef]
16. Seidl, R., Weiss, S., Zikulnig-Rusch, E. M., Kandelbauer, A. (2021). Response surface optimization for improving the processing behavior of melamine formaldehyde impregnation resins. Journal of Applied Polymer Science, 138(7), 1–17. DOI 10.1002/app.50181. [Google Scholar] [CrossRef]
17. Wahrendorff, P., Stefanakis, M., Steinbach, J. C., Allnoch, D., Zuber, R. et al. (2021). Simultaneous determination of droplet size, pH value and concentration to evaluate the aging behavior of metalworking fluids. Sensors, 21(24). DOI 10.3390/s21248299. [Google Scholar] [CrossRef]
18. Myers, R. M., Montgomery, D. C. (2002). Response surface methodology. process and product optimization using designed experiments. USA: John Wiley & Sons. [Google Scholar]
19. Ryan, T. P. (2007). Modern experimental design. USA: Wiley. [Google Scholar]
20. Sun, J., Ju, J., Ji, L., Zhang, L., Xu, N. (2008). Synthesis of biodiesel in capillary microreactors. Industrial & Engineering Chemistry Research, 47(5), 1398–1403. DOI 10.1021/ie070295q. [Google Scholar] [CrossRef]
21. Santikunaporn, M., Techopittayakul, T., Echaroj, S., Chavadej, S., Chen, Y. H. et al. (2020). Optimization of biodiesel production from waste cooking oil in a continuous mesoscale oscillatory baffled reactor. Engineering Journal, 24(2), 19–28. DOI 10.4186/ej.2020.24.2.19. [Google Scholar] [CrossRef]
22. Thakkar, K., Kachhawaha, S. S., Kodgire, P., Keshav, M. (2021). Effectiveness of RSM based central composite design for optimization of in-situ biodiesel production process from castor seeds. IOP Conference Series: Materials Science and Engineering, 1146(1). DOI 10.1088/1757-899X/1146/1/012008. [Google Scholar] [CrossRef]
23. Qiu, Z., Zhao, L., Weatherley, L. (2010). Process intensification technologies in continuous biodiesel production. Chemical Engineering and Processing: Process Intensification, 49(4), 323–330. DOI 10.1016/j.cep.2010.03.005. [Google Scholar] [CrossRef]
24. Likozar, B., Pohar, A., Levec, J. (2016). Transesterification of oil to biodiesel in a continuous tubular reactor with static mixers: Modelling reaction kinetics, mass transfer, scale-up and optimization considering fatty acid composition. Fuel Processing Technology, 142, 326–336. DOI 10.1016/j.fuproc.2015.10.035. [Google Scholar] [CrossRef]
25. European Committee for Standardization (2019). EN 14214: Liquid petroleum products-Fatty acid methyl esters (FAME) for use in diesel engines and heating applications-Requirements and test methods. [Google Scholar]
26. Yuan, T., Akochi-Koble, E., Pinchuk, D., van de Voort, F. (2014). FTIR on-line monitoring of biodiesel transesterification. International Journal of Renewable Energy and Biofuels, 1–13. DOI 10.5171/2014.178474. [Google Scholar] [CrossRef]
27. Rabelo, S. N., Ferraz, V. P., Oliveira, L. S., Franca, A. S. (2015). FTIR analysis for quantification of fatty acid methyl esters in biodiesel produced by microwave-assisted transesterification. International Journal of Environmental Science and Development, 6(12), 964–969. DOI 10.7763/IJESD.2015.V6.730. [Google Scholar] [CrossRef]
28. Bonato, M., Valério, A., Oliveira, J. V., de Oliveira, D., Bolzan, A. (2018). Midinfrared spectroscopy and partial least-squares model as an analytical method for biodiesel and glycerol monitoring. Industrial & Engineering Chemistry Research, 57(3), 990–996. DOI 10.1021/acs.iecr.7b04074. [Google Scholar] [CrossRef]
29. Rosset, M., Perez-Lopez, O. W. (2019). FTIR spectroscopy analysis for monitoring biodiesel production by heterogeneous catalyst. Vibrational Spectroscopy, 105. DOI 10.1016/j.vibspec.2019.102990. [Google Scholar] [CrossRef]
30. de Lima Furtado, W., Corgozinho, C. N. C., Tauler, R., Sena, M. M. (2021). Monitoring biodiesel and its intermediates in transesterification reactions with multivariate curve resolution alternating least squares calibration models. Fuel, 283(4). DOI 10.1016/j.fuel.2020.119275. [Google Scholar] [CrossRef]
31. Mahamuni, N. N., Adewuyi, Y. G. (2009). Fourier transform infrared spectroscopy (FTIR) method to monitor Soy biodiesel and soybean oil in transesterification reactions, petrodiesel−biodiesel blends, and blend adulteration with soy oil. Energy & Fuels, 23(7), 3773–3782. DOI 10.1021/ef900130m. [Google Scholar] [CrossRef]
32. Paquet-Durand, O., Zettel, V., Hitzmann, B. (2015). Optimal experimental design for parameter estimation of the peleg model. Chemometrics and Intelligent Laboratory Systems, 140, 36–42. DOI 10.1016/j.chemolab.2014.10.006. [Google Scholar] [CrossRef]
33. Zhou, H., Lu, H., Liang, B. (2006). Solubility of multicomponent systems in the biodiesel production by transesterification of Jatropha curcas L. oil with methanol. Journal of Chemical & Engineering Data, 51(3), 1130–1135. DOI 10.1021/je0600294. [Google Scholar] [CrossRef]
34. de Boer, K., Bahri, P. A. (2015). Development and validation of a two phase CFD model for tubular biodiesel reactors. Computers & Chemical Engineering, 82, 129–143. DOI 10.1016/j.compchemeng.2015.06.010. [Google Scholar] [CrossRef]
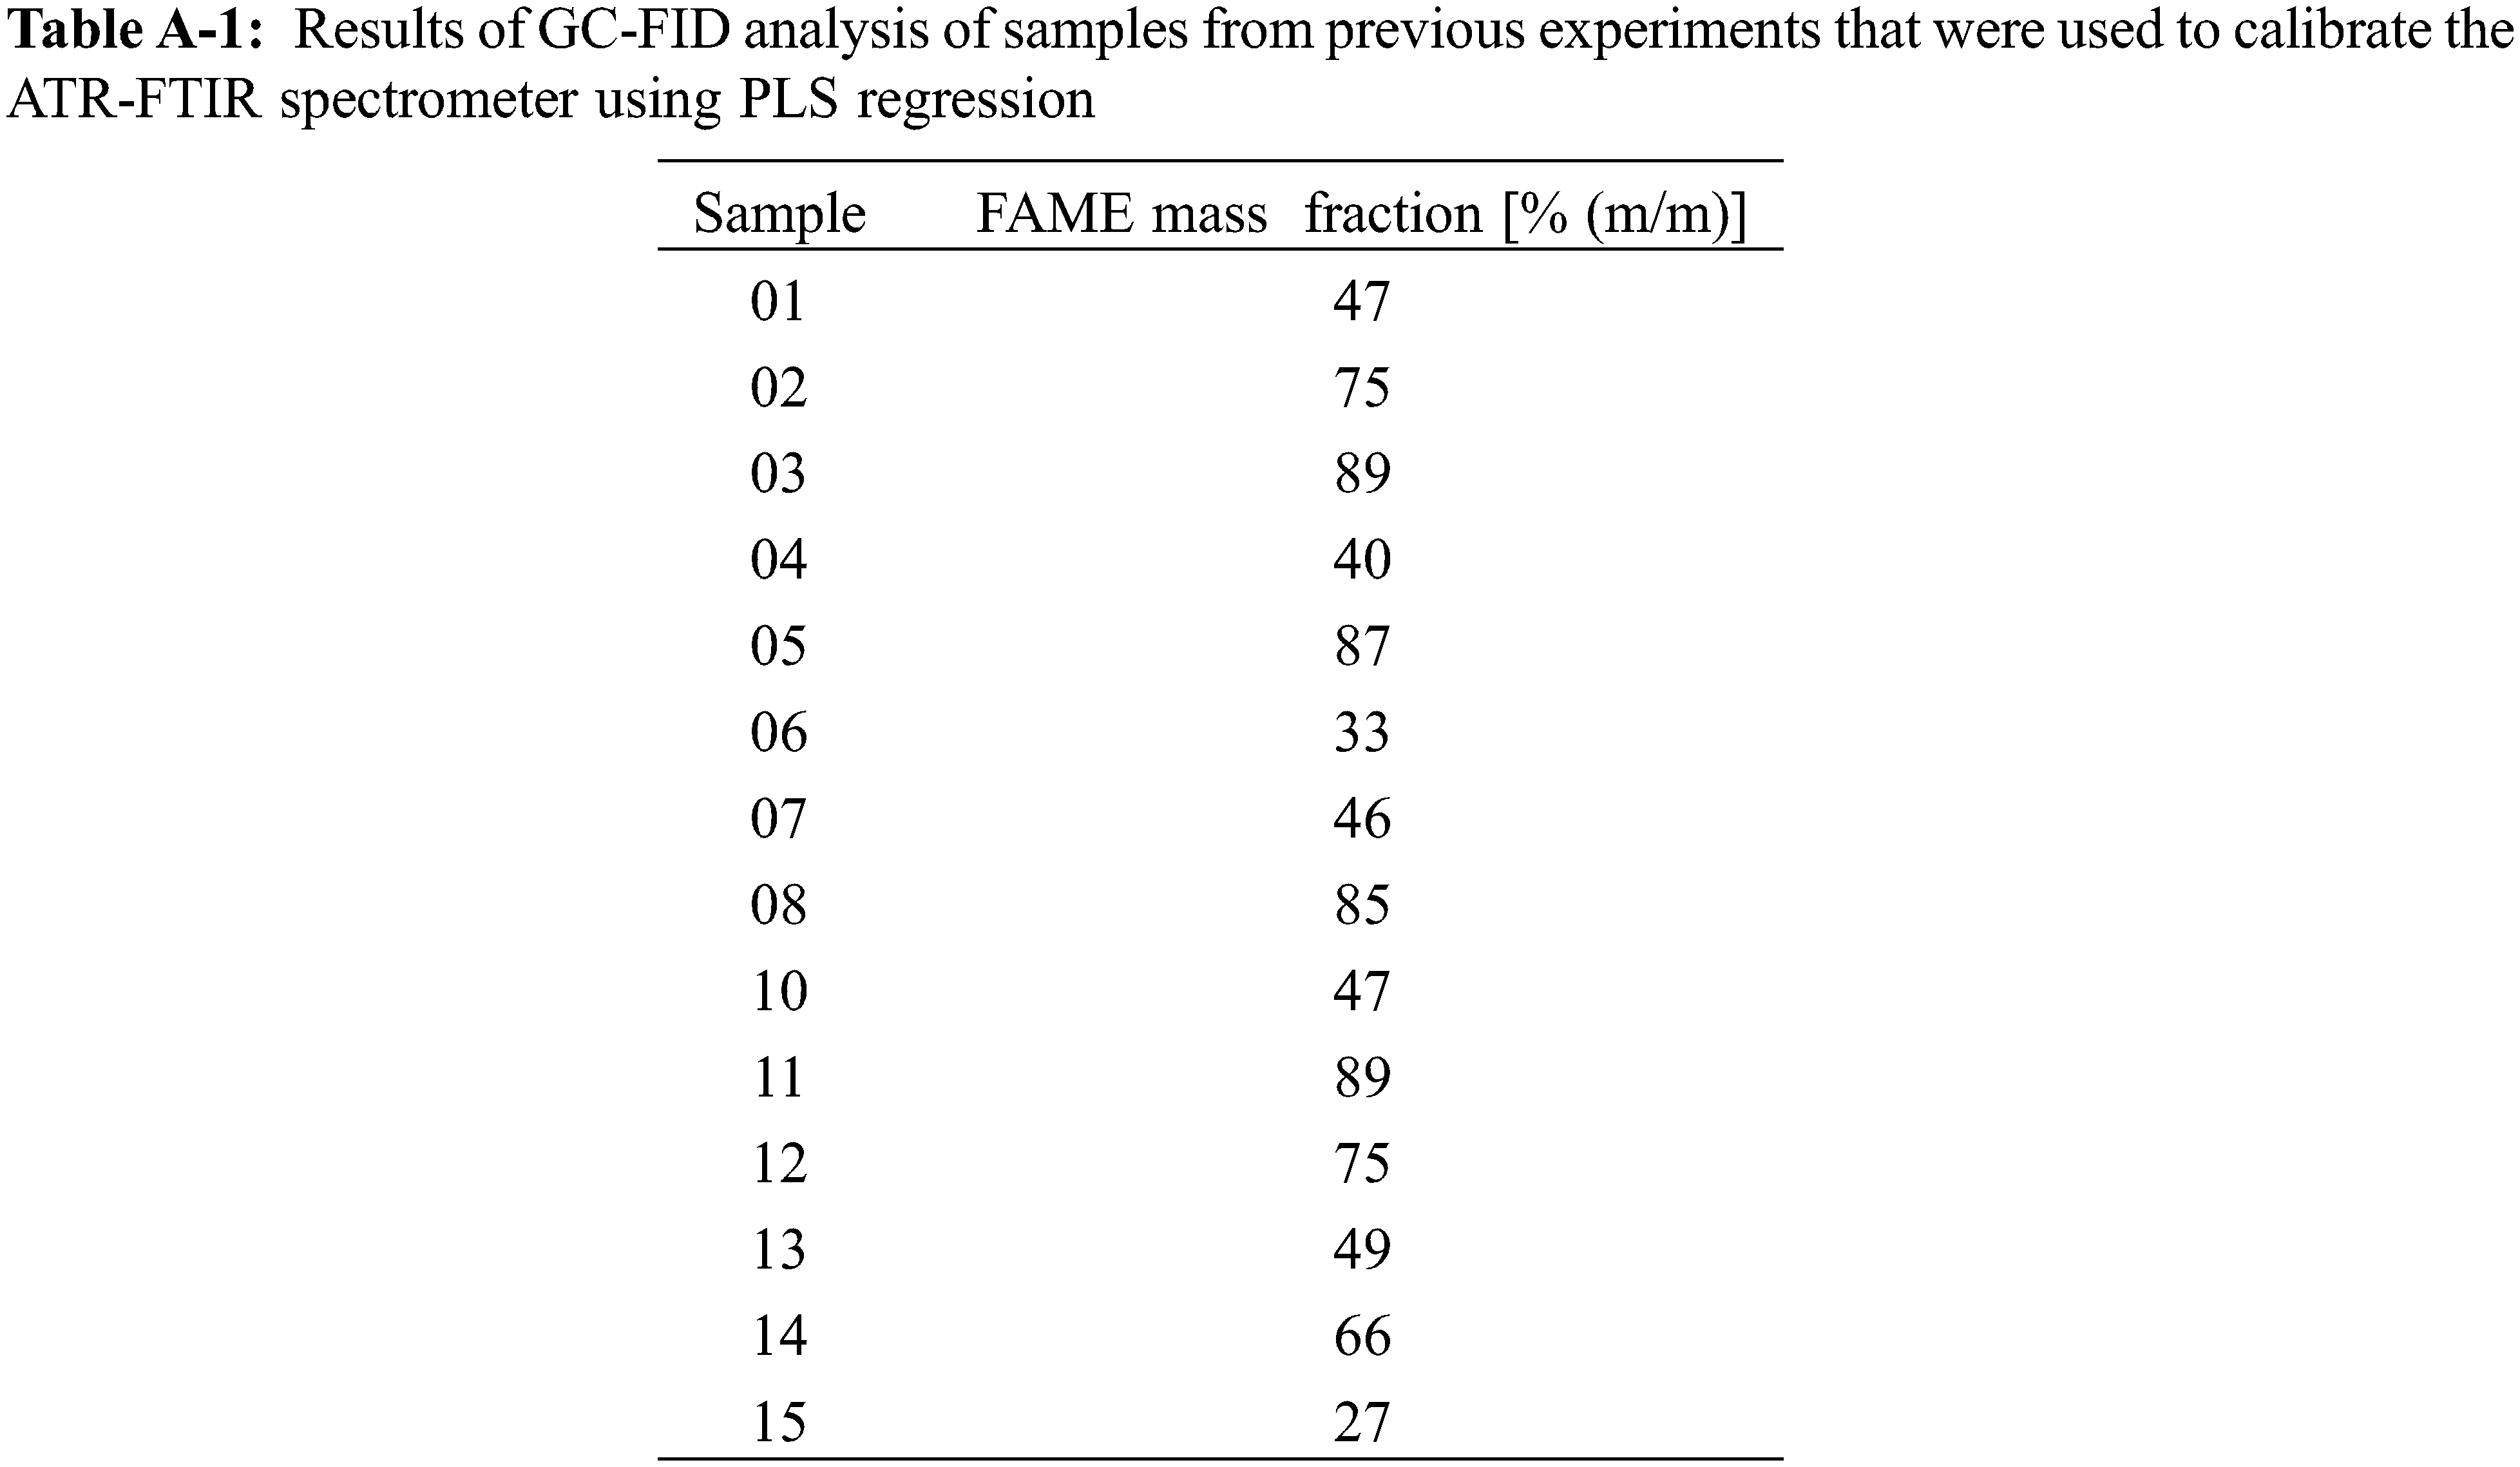
Appendix A Results of ATR-FTIR and GC-FID Analysis
For calibration of the ATR-FTIR spectrometer a data set was used, where ATR-FTIR and GC-FID were used on samples from the same experiments. The ATR-FTIR absorbance spectra and results of GC-FID quantification are given in Fig. A-1 and Table A-1, respectively. During regression exceptional high errors resulted during model validation for prediction of Sample09 in any approach and consecutively, it was treated as an outlier.
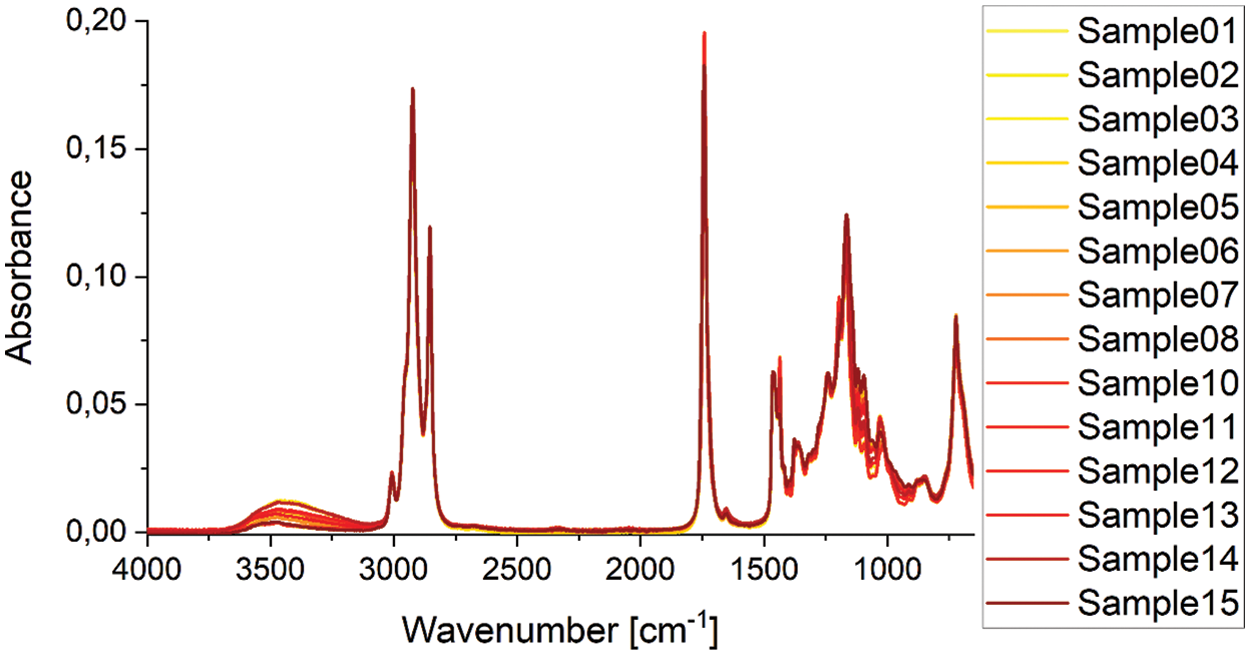
Figure A-1: ATR-FTIR absorbance spectra used for PLS calibration to quantify FAME in the non-polar phase of the transesterification reaction product. Samples from the same experiments were analyzed with GC-FID in parallel at an external laboratory
Cite This Article
 Copyright © 2023 The Author(s). Published by Tech Science Press.
This work is licensed under a Creative Commons Attribution 4.0 International License , which permits unrestricted use, distribution, and reproduction in any medium, provided the original work is properly cited.
 Downloads
 Citation Tools