
 Submit a Paper
 Propose a Special lssue
 Open Access
ARTICLE
Development of Wet Shotcrete with Solid Waste as Aggregate: Strength Optimization and Mix Proportion Design
1
School of Civil and Resource Engineering, University of Science and Technology Beijing, Beijing, 100083, China
2
Key Laboratory of Ministry of Education of China for Efficient Mining and Safety of Metal Mines, University of Science and
Technology Beijing, Beijing, 100083, China
* Corresponding Author: Bin Han. Email:
Journal of Renewable Materials 2023, 11(9), 3463-3484. https://doi.org/10.32604/jrm.2023.027532
Received 03 November 2022; Accepted 09 December 2022; Issue published 20 July 2023
 View Full Text
 Download PDF
Abstract
The super-fine particle size of tailings is its drawback as a recycled resource, which is reflected in the low strength of the new construction and industrial materials formed when it is mixed with cement and other cementitious materials. Therefore, it is crucial to study the effect of tailings particle size and cementitious material on the strength of tailings wet shotcrete (TWSC) and to investigate the optimal mix proportion. In this paper, a multivariate nonlinear response model was constructed by conducting central composite experiments to investigate the effect of different factors on the strength of TWSC. The strength prediction and mix proportion optimization of TWSC are carried out by machine learning techniques. The results show that the response model has R2 > 0.94 and P < 0.01, which indicates that the model has high reliability. Moreover, the strength of TWSC increases with the increase of tailings fineness modulus and decrease of water-binder ratio, while it also increases and then decreases with the increase of replacement rate of slag powder to cement (SRC rate). The extreme learning machine (ELM) constructed in this paper predicts the strength of TWSC with an accuracy of more than 98% and achieves rapid prediction under multi-factor conditions. It is worth mentioning that the ELM combined with the genetic algorithm (ELM-GA) collaboratively solved to obtain the mix proportion for C15 and C20 strength grades of TWSC and the maximum error is verified by experiments to be less than 2%.Keywords
Tailings are the waste discharged from mineral processing plants after grinding the ore finely and selecting the useful components under specific technical conditions, which are the solid mineral wastes that appear along with the development of the mining industry [1–3]. The tailings are extremely productive and their presence on the surface causes heavy damage to the vegetation. The tailings containing heavy metals are exposed to the surface and then carried to the soil and groundwater by rain and wind, thus causing serious damage to the ecological environment [4–8].
In recent years, the recycling of tailings has gradually attracted the attention of academia and industry [9–12]. After scientific research and development, the utilization rate of tailings has gradually improved but is still at a low level. The most common method currently used is to fill the tailings into the underground mining area [13–17]. Take a gold mine in Guizhou, China as an example; its annual tailings production is 1.28 million t and the annual tailings filling capacity is 510,000 t, meaning that the utilization rate of tailings is only 40%. To reduce tailings discharge and improve utilization, this paper presents the idea of developing tailings as aggregate for wet shotcrete (i.e., tailings wet shotcrete, TWSC). Wet shotcrete is mostly used in tunnel support projects, because of its many advantages such as high mechanization of construction and superior mechanical properties. It is gradually introduced into underground support in mines [18–20]. The use of tailings instead of sandstone as aggregate for wet shotcrete can not only improve the utilization rate of tailings but also save material costs. The practice has shown that the tailings’ particle size significantly affects the strength of the cemented filling body [21–23]. Therefore, for wet shotcrete, which is also a cementitious material, it is necessary to study the effect of tailings particle size on strength. Compared with conventional coarse aggregate, the tailings have a finer particle size, which causes the strength of TWSC to be lower when cement is used as cementitious material [24,25].
The addition of solid waste materials to cement to optimize its cementitious properties is also a worthy research task. A series of research has been carried out on this subject. Such as adding the right amount of fly ash, slag powder, or silica powder in the cement, which can improve the mechanical properties of cement as well as concrete [7,26–29]. In addition, machine learning has been introduced into the research related to concrete [30–33]. For example, some scholars use machine learning to predict the strength of concrete. By eventually optimizing the prediction model, the prediction accuracy is improved to more than 90% [34,35]. Others have used machine learning to optimize mix proportion, significantly reducing experimentation and experimental costs [36,37]. The above research not only promotes the development of cementitious materials but also provides important guidance for related engineering practice.
In this study, the strength response model of TWSC is develsoped by conducting central composite experiments and combining response surface methodology. This model studies the effects of tailings particle size, composite cementitious material and water-binder ratio on the strength of TWSC. Further, the microstructural analysis of TWSC is carried out with the support of SEM. Then, the nonlinear relationship between different affecting factors and the strength of TWSC is successfully constructed using ELM and the high-accuracy prediction of strength is achieved. Finally, the ELM-GA model is constructed and the optimal mix proportion of TWSC is achieved. The results of the study have important significance for the recycling of tailings and the low-cost application of wet shotcrete technology in mines.
2.1 Response Surface Methodology
Response Surface Methodology (RSM) is an experimental analysis method that combines a rational experimental design with a multiple regression equation [38,39]. This paper uses a multiple quadratic regression equation to fit the functional relationship between each effect factor and the response value. The principle is to search experimentally for the response surface function y = f(x) between the effect factor x and the measured value y and make y*→y. Commonly used quadratic response surface function equations are as follows:
In Eq. (1), y* is the response value of the measured value; a is a constant term; bj, bkj and bjj are the regression coefficients of the primary, secondary and cross terms, respectively; m is the number of factors.
Extreme learning machine (ELM) has better generalization performance than traditional feed-forward neural networks [40]. While traditional neural networks use gradient descent to optimize the network parameters, ELM can randomly assign the hidden layer’s threshold and the input layer’s weights [41]. As a result, ELM can be trained faster than traditional neural networks. The ELM structure contains 3 parts: input layer, hidden layer and output layer. Each neuron between 2 neighboring layers is connected to each neuron in another layer but each neuron within the same layer is not connected as is shown in Fig. 1.
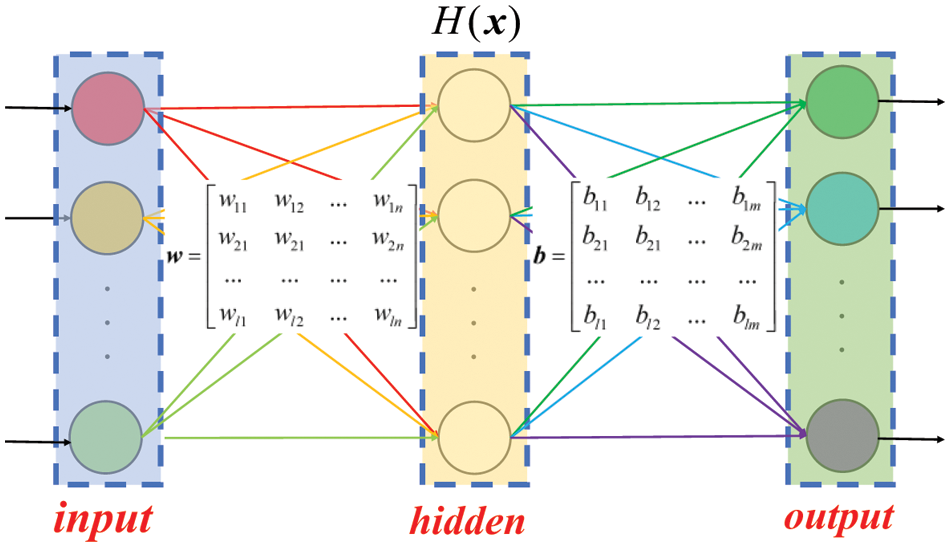
Figure 1: The structure of ELM
where the
where the
The genetic algorithm (GA) is a method to search for the optimal solution by simulating the natural evolutionary process [43,44]. GA converts the problem-solving process into a process similar to the crossover and mutation of chromosomal genes in biological evolution. It can quickly obtain good optimization results when solving more complex combinatorial optimization problems. The optimization process of GA is shown in Fig. 2.
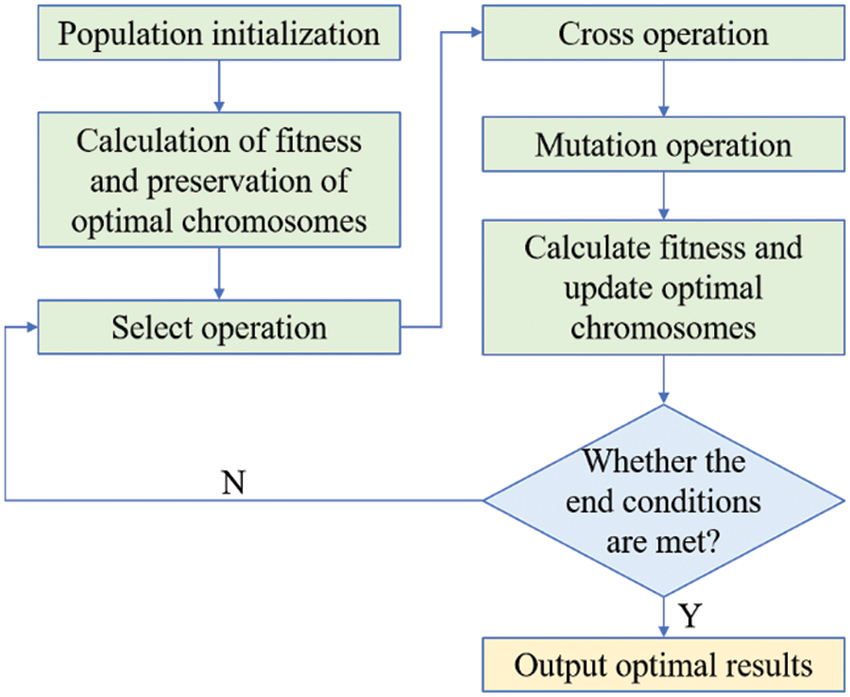
Figure 2: The optimization process of GA
Unlike conventional wet shotcrete using torpedo sandstone as aggregate, this study uses tailings taken from a gold mine in Guizhou Province, China as aggregate. The main chemical composition of the tailings is shown in Table 1. The activity index of the tailings is calculated to be Ma = 0.037, which indicates its suitability for use as an aggregate. The XRD test results of the tailings are shown in Fig. 3a.
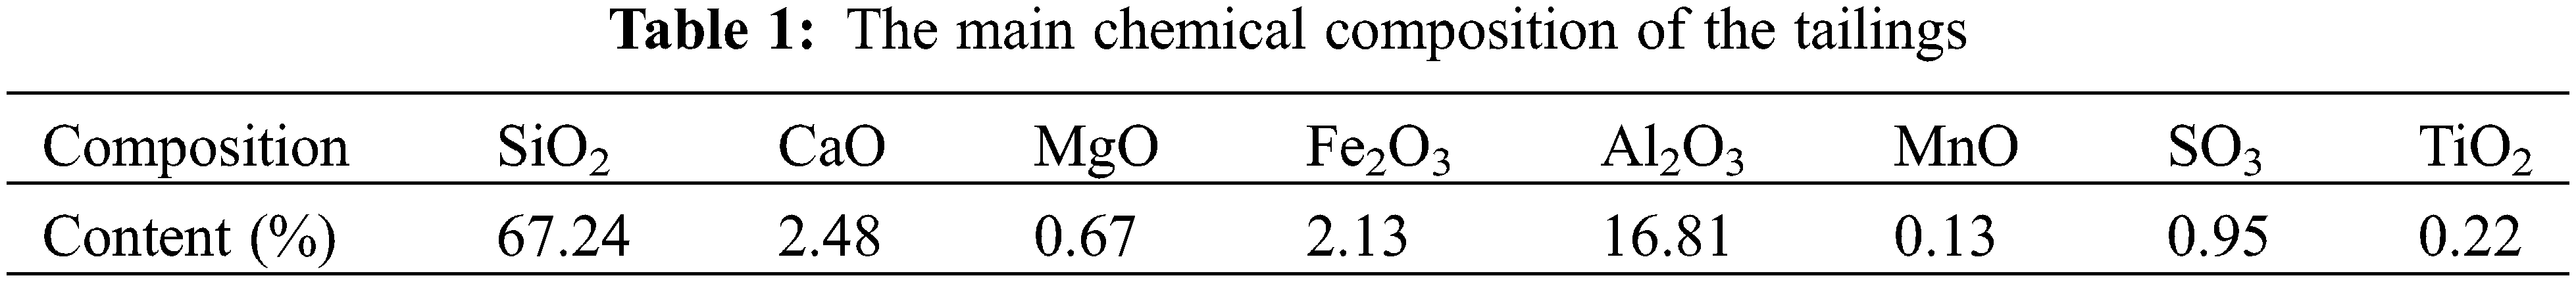
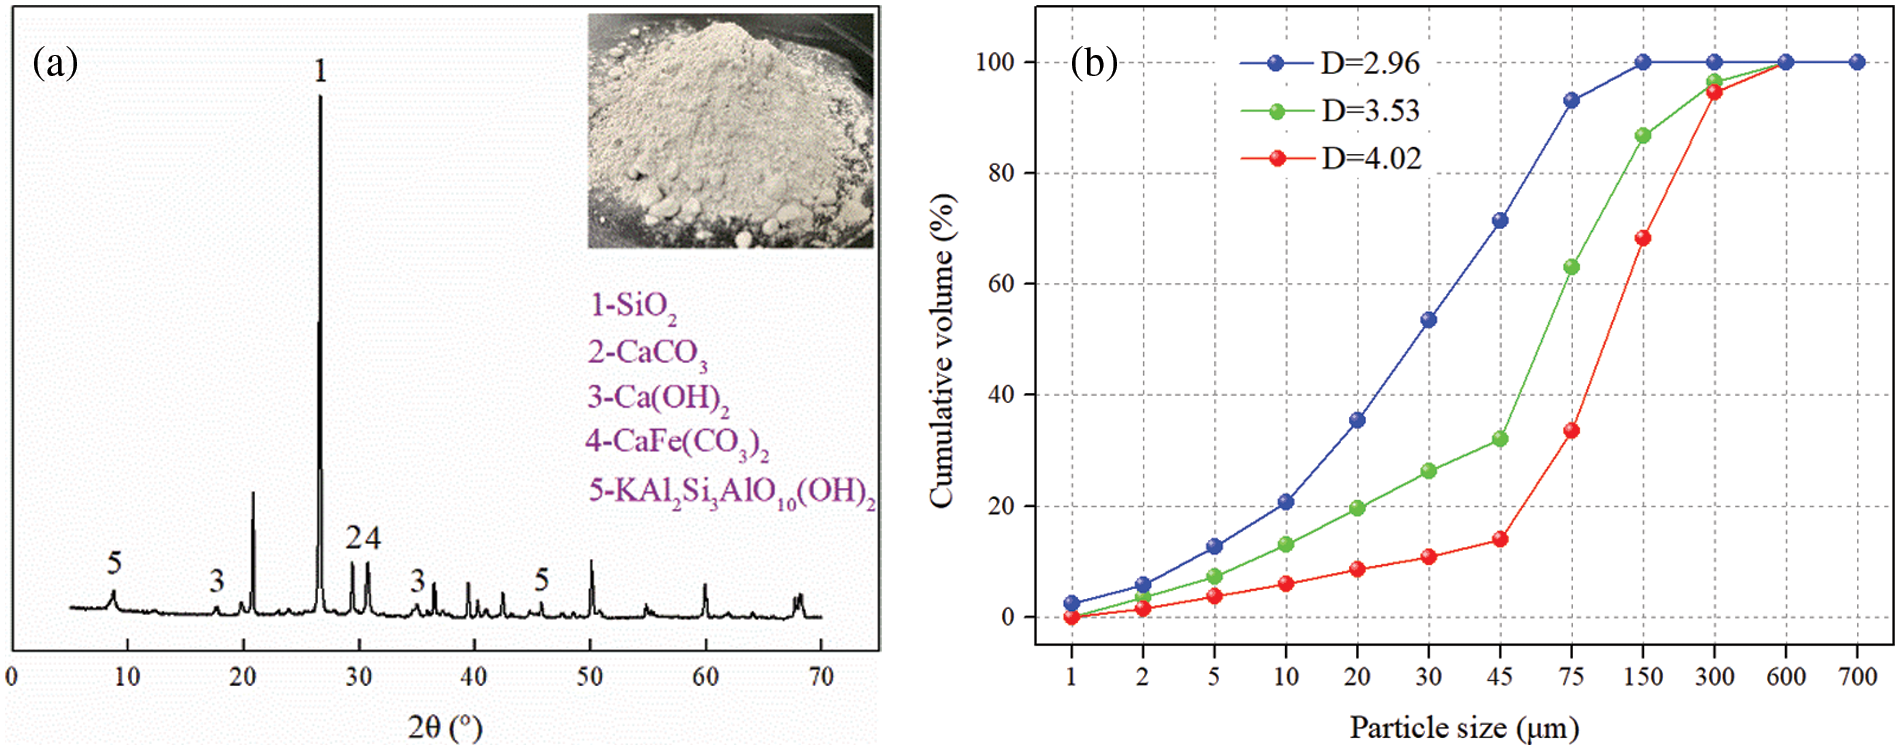
Figure 3: The particle sizes and XRD test results of tailings. (a) particle size; (b) XRD
The particle size of the aggregate has an important effect on the mechanical properties of wet shotcrete. In order to study the effect of different particle size of tailings on the strength of wet shotcrete, the hydraulic cyclone is used to classify the tailings and obtain 3 different grades of graded tailings. To better quantify the particle size distribution of the tailings, the fineness modulus is introduced to quantitatively characterize the coarseness and fineness of the tailings concerning the definitions of the fineness modulus of coarse sand in the relevant industries. Define the fineness modulus of the tailings as follows:
In Eq. (6), Ai is the percentage of sieve residue for standard sieves of 2, 10, 30, 75, 300 and 700 μm; Xx is fineness modulus.
The particle sizes of the tailings measured with the laser granularity analyzer are shown in Fig. 3b. Using Eq. (6), the fineness moduli of the 3 tailings are obtained as 2.96, 3.53, and 4.02, respectively.
Cement is the main cementitious material. Slag powder is selected to replace part of the cement as a supplementary cementitious material. Slag powder is a solid waste. It has a specific surface area of 440 m2/kg and a density of 2.9 g/cm3. In addition, it has an alkalinity coefficient of M0 = 1.17 > 1, a quality coefficient of K = 2.27 > 1.8, and an activity coefficient of Ma = 1.57 [6,7]. This indicates that the slag powder is a highly reactive alkaline slag. From the XRD pattern, it is obvious that the slag powder contains a large amount of glass-phase crystalline reactive material. Therefore, it is difficult to have a hydration reaction under normal conditions, and it needs to be motivated by cement to have certain hydration activities. The chemical and particle size compositions of cement and slag powder are shown in Table 2 and Fig. 4, respectively.
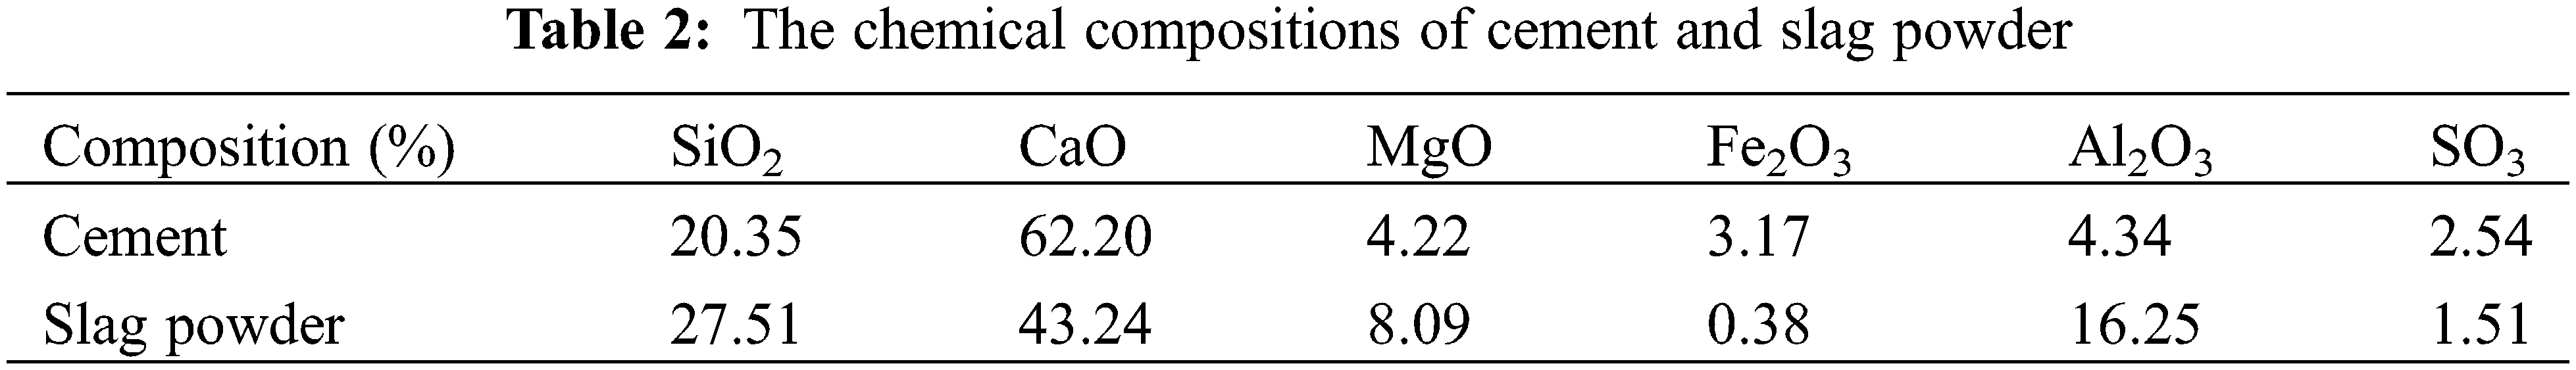
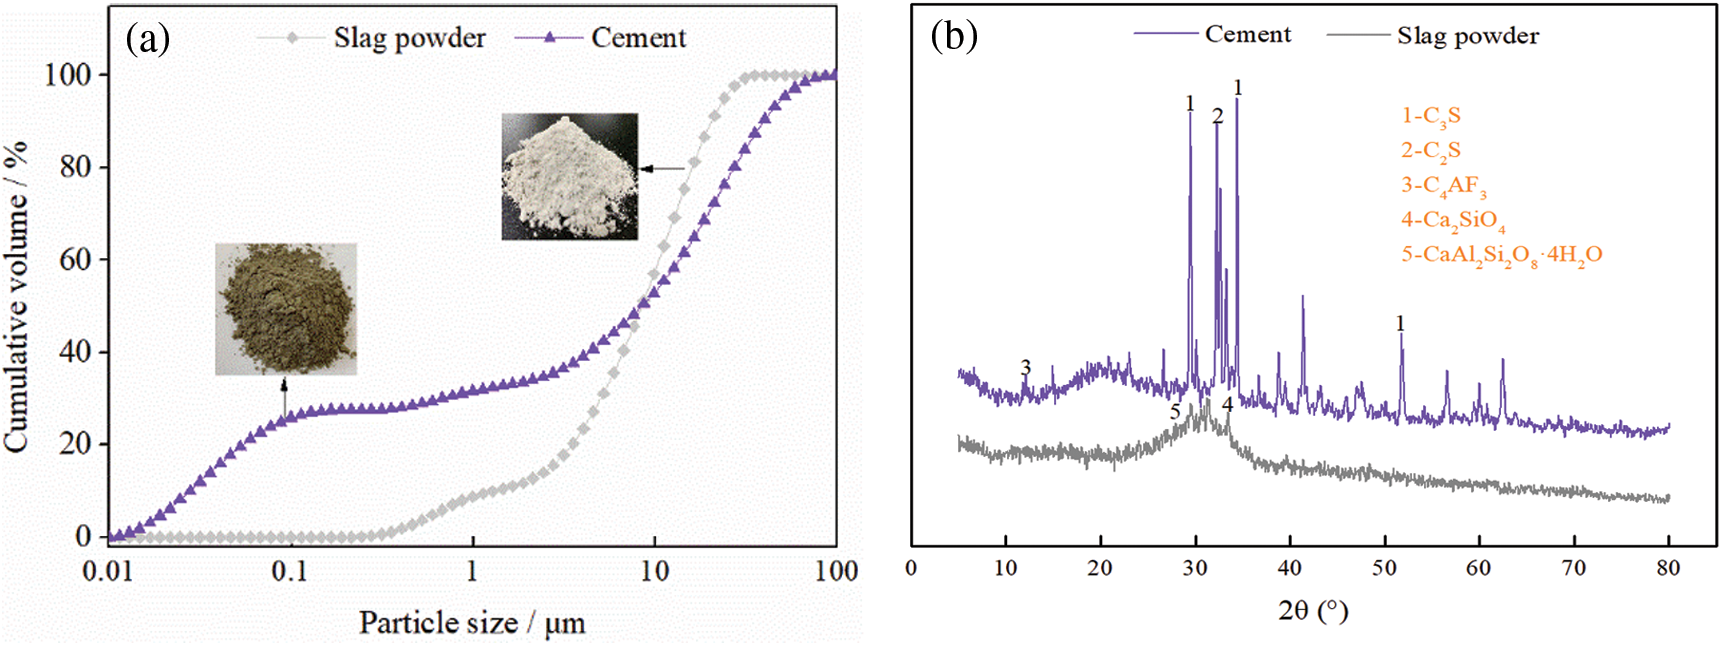
Figure 4: Particle size and XRD test results of cement and slag powder: (a) particle size; (b) XRD
The experimental process is shown in Fig. 5.
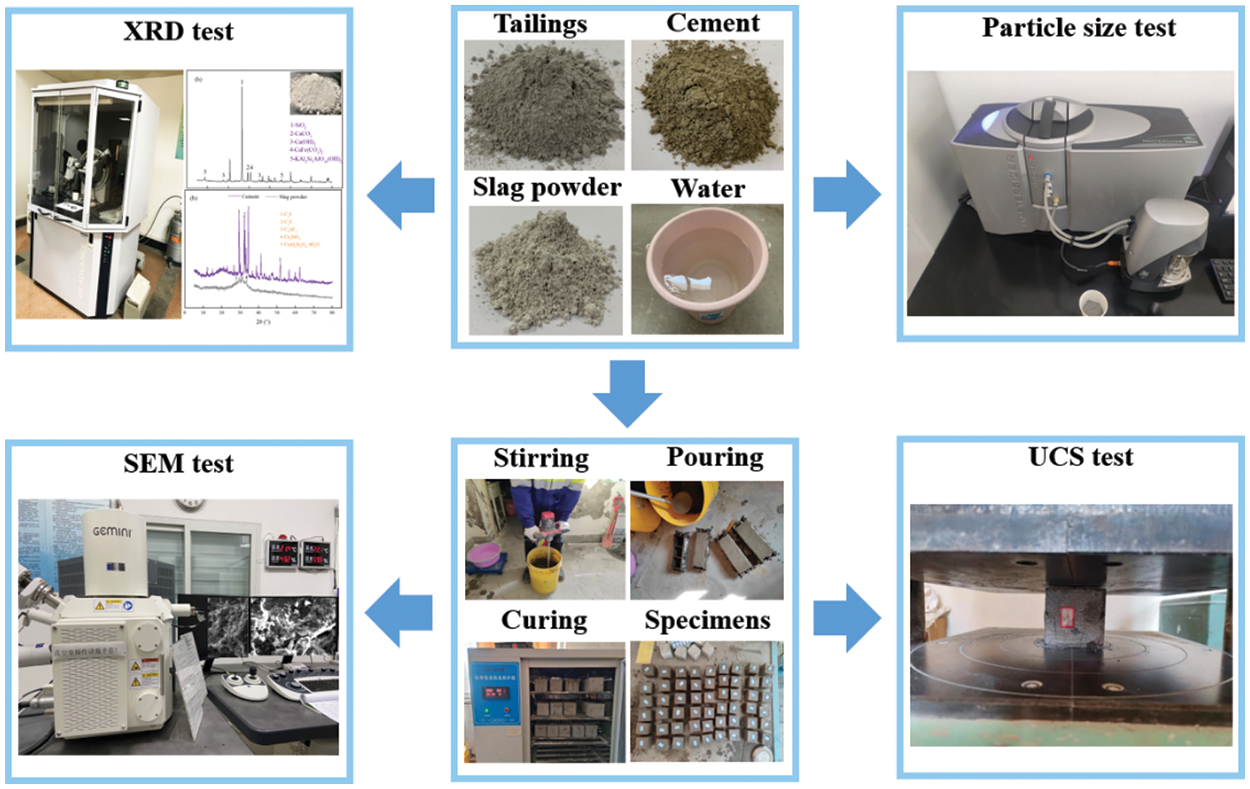
Figure 5: The experimental process
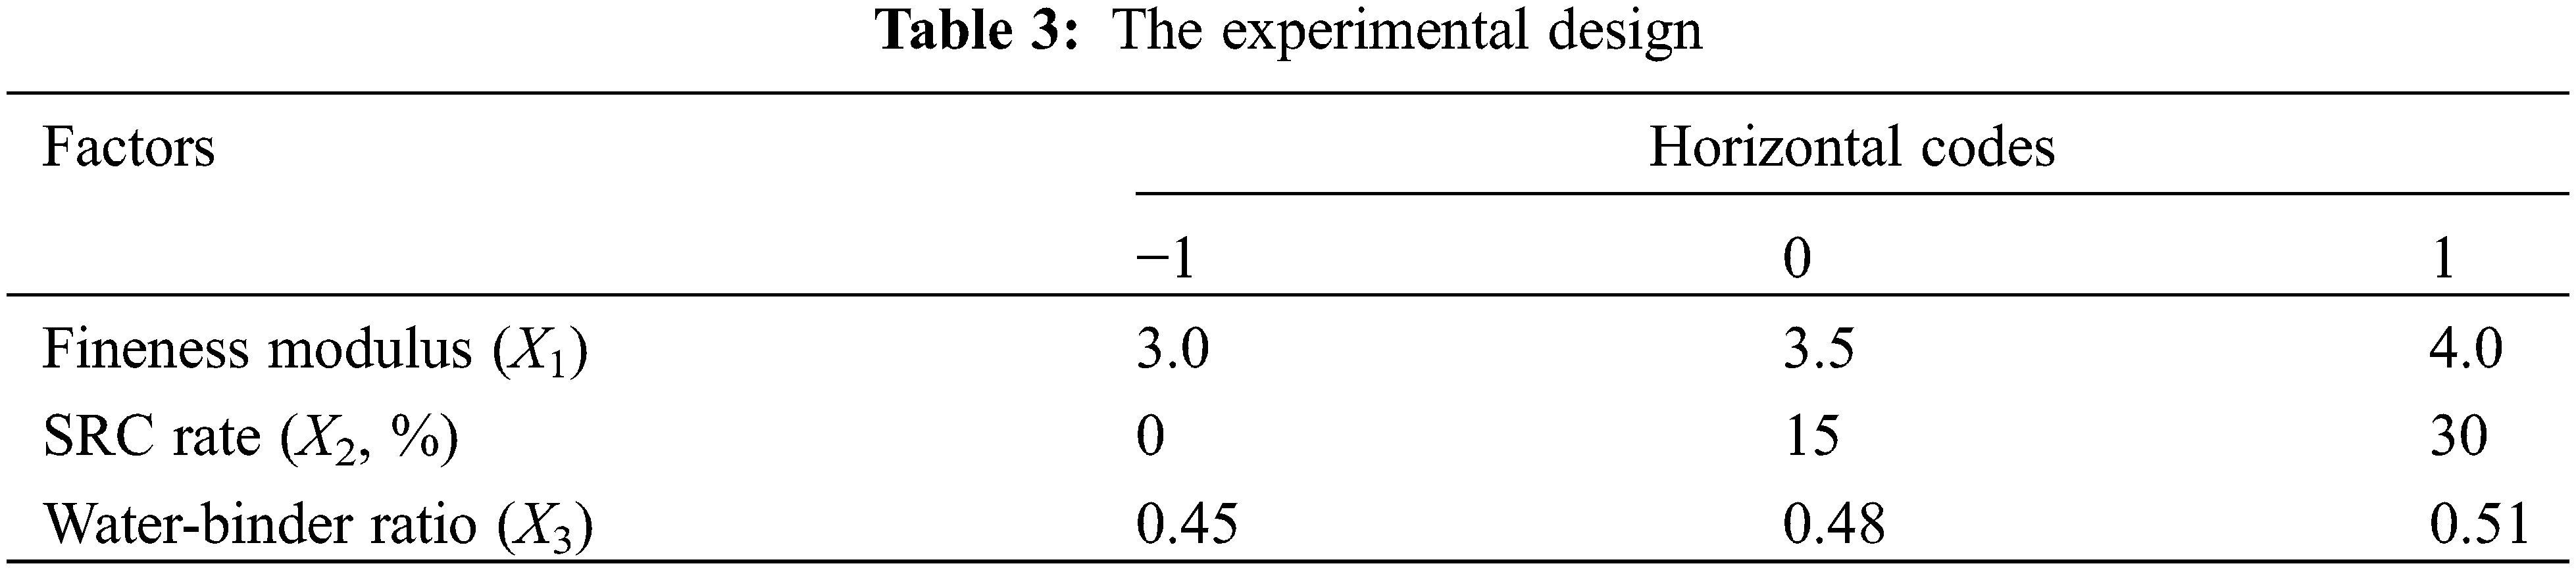
To obtain the variation law of the strength of TWSC under the coupling effect of multiple factors and to effectively improve the experimental efficiency, the RSM in Design-Expert software is used to optimize the experimental design. According to a large number of exploratory experiments, when the cement admixture is 520 kg/m3 and the water-binder ratio is from 0.45 to 0.51, the slurry fluidity of TWSC can be made to reach engineering requirements. RSM experiments are conducted with fineness modulus (3–4), the replacement rate of slag powder to cement (SRC rate, 0%–30%) and water-binder ratio (0.45–0.51) as independent variables. The 7, 14 and 28 d uniaxial compressive strength (UCS) of TWSC are used as the response quantity. The experimental design is shown in Table 3.
UCS is an important mechanical index of TWSC [22,45]. The poured specimens are placed in the curing box and when the specimens are cured to a specific age, UCS tests are carried out using an automatic type press. 3 specimens are tested in each group of experiments, and the average value of these 3 test results is taken as the final UCS value.
Scanning electron microscopy (SEM) can not only detect the microstructure of cement-based materials but also detect the micro products of related materials, which is of great significance for exploring the physical and chemical properties of related materials [46,47]. In this study, SEM is used to observe the type and quantity of hydration products of TWSC under different mix proportions, and then analyze the mechanism of different factors affecting the strength of TWSC.
The results of RSM experiments are shown in Table 4.
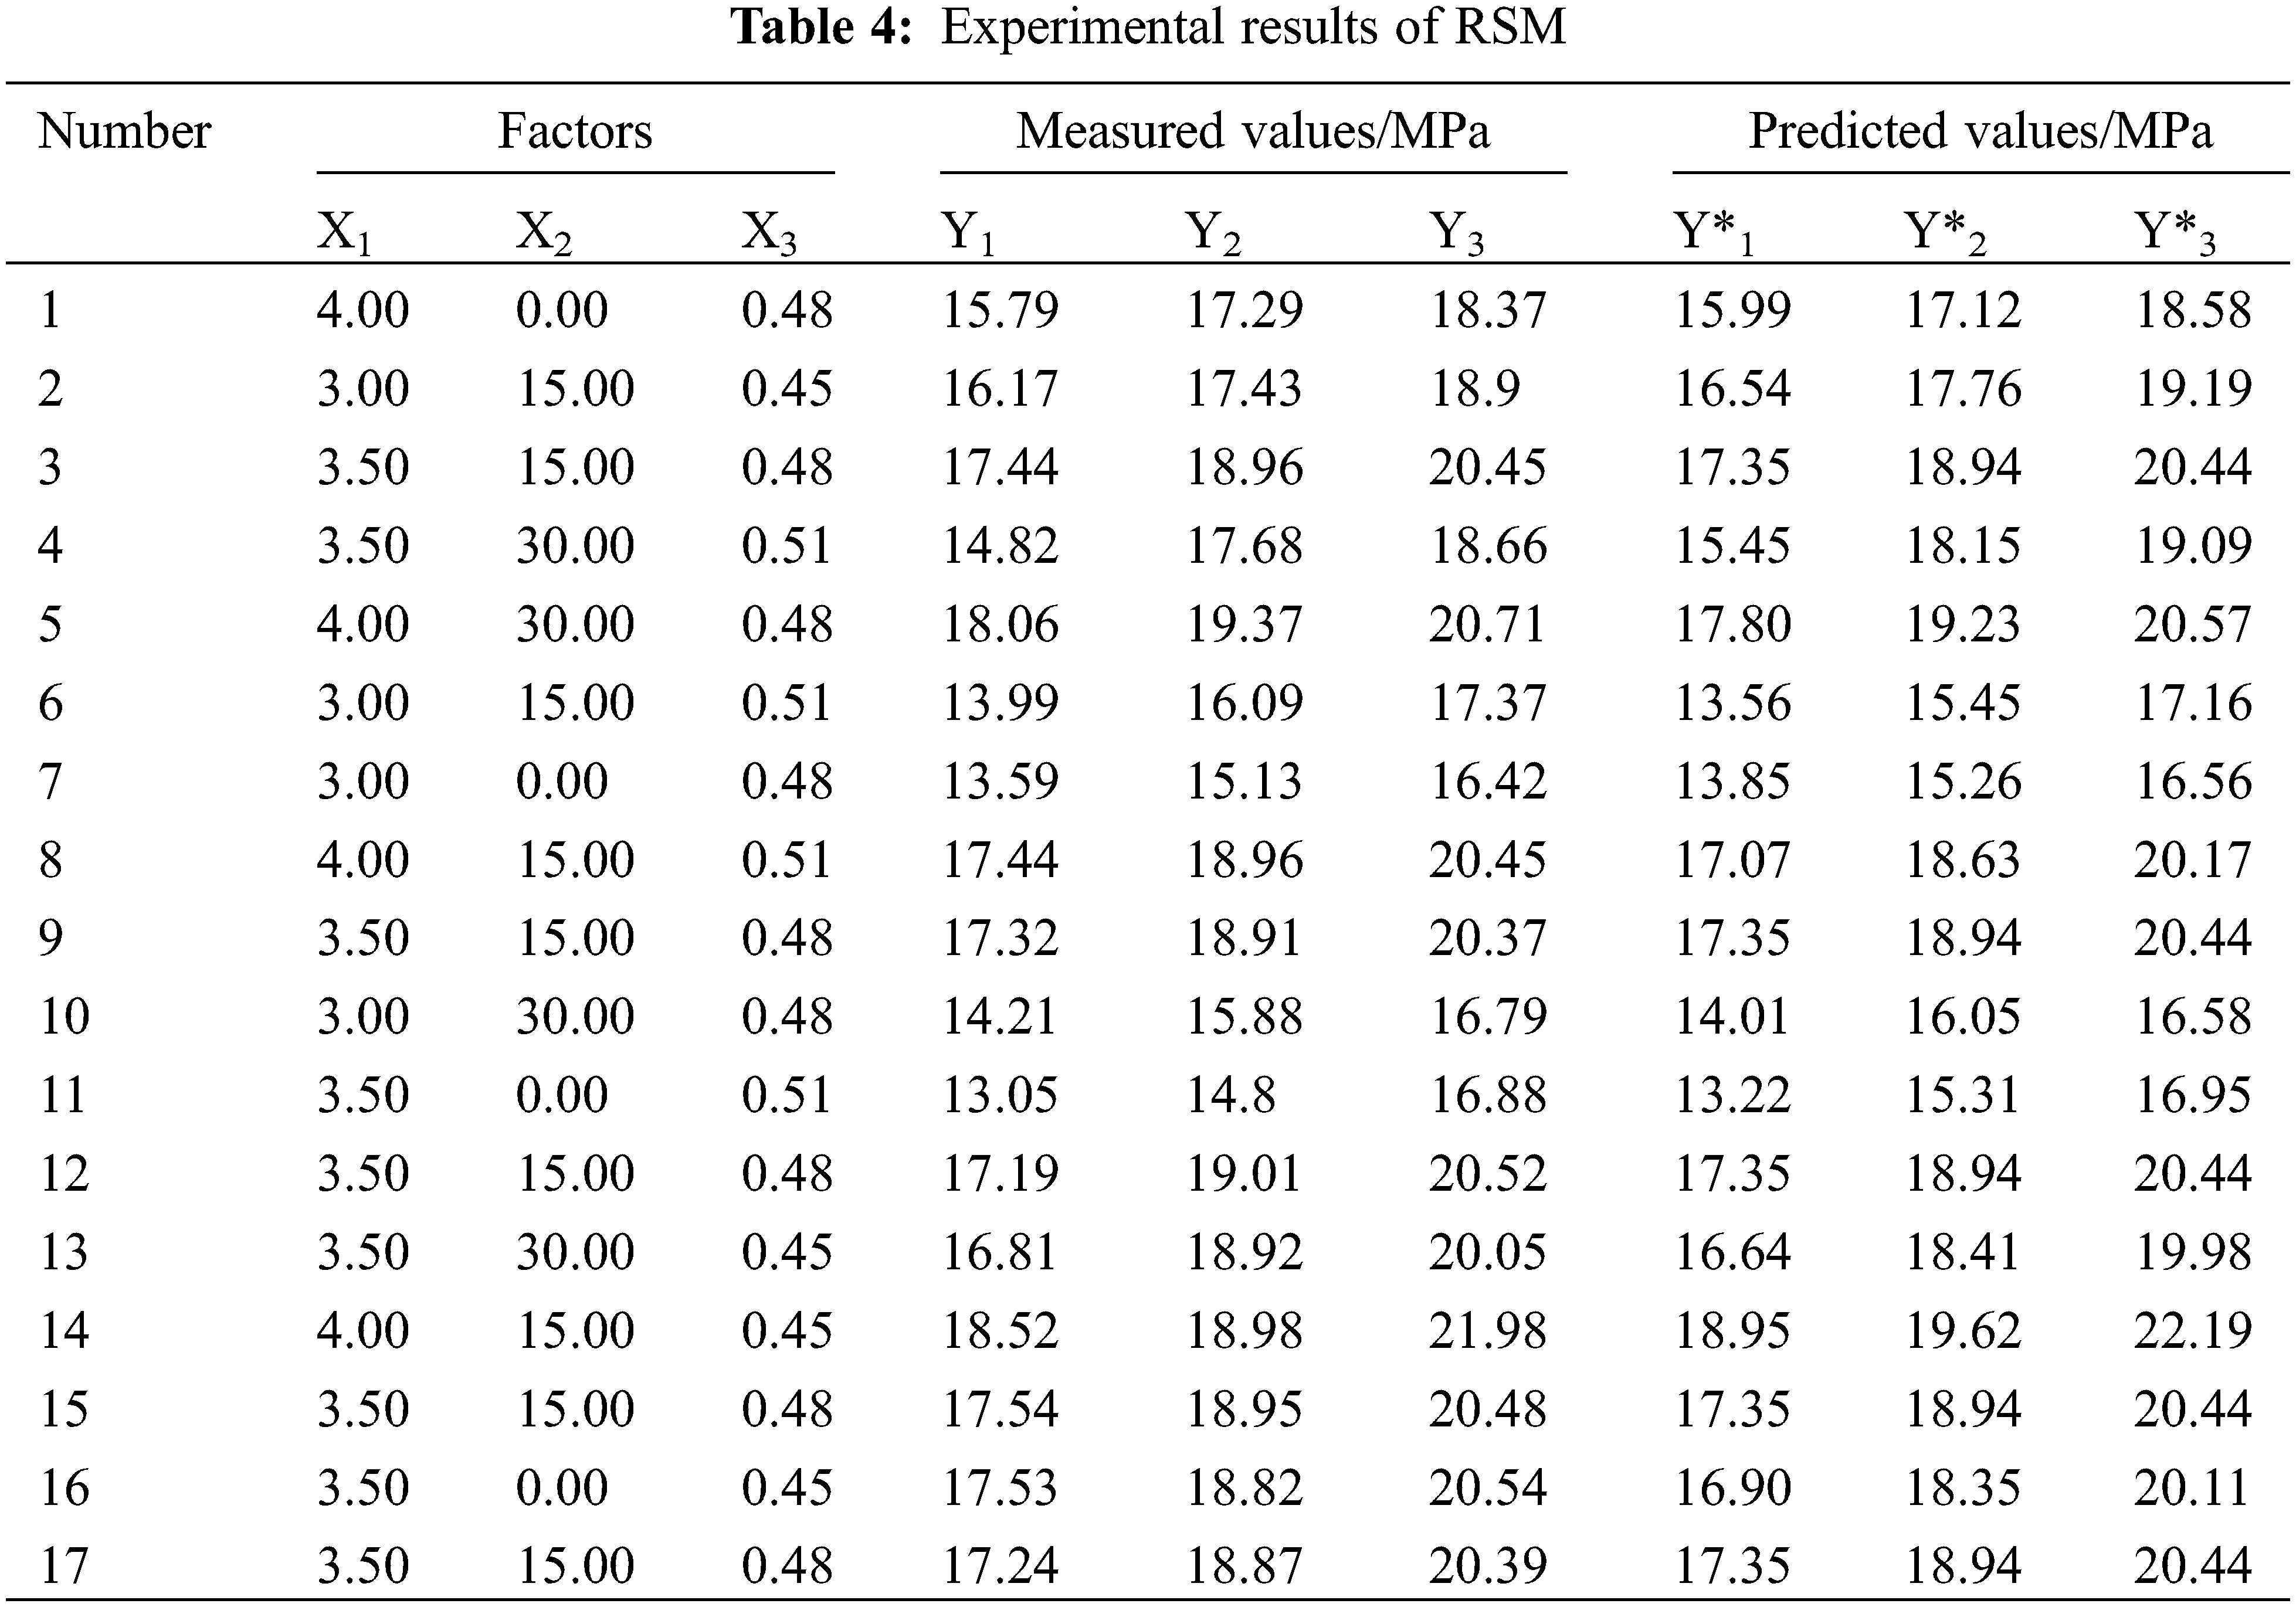
The RSM experimental results are substituted into Eq. (1) and regression models are constructed for the relationship between UCS and fineness modulus, SSC rate, and water-binder ratio, respectively.
The predicted values of UCS of TWSC with different curing ages based on Eqs. (7)–(9) are shown in Table 4 and Fig. 6. The predicted values all lie within the 95% prediction band, indicating that the regression models are reliable. As can be seen from Fig. 6d, the maximum error of the regression models is only 4.3%, indicating that the models have a high prediction accuracy.
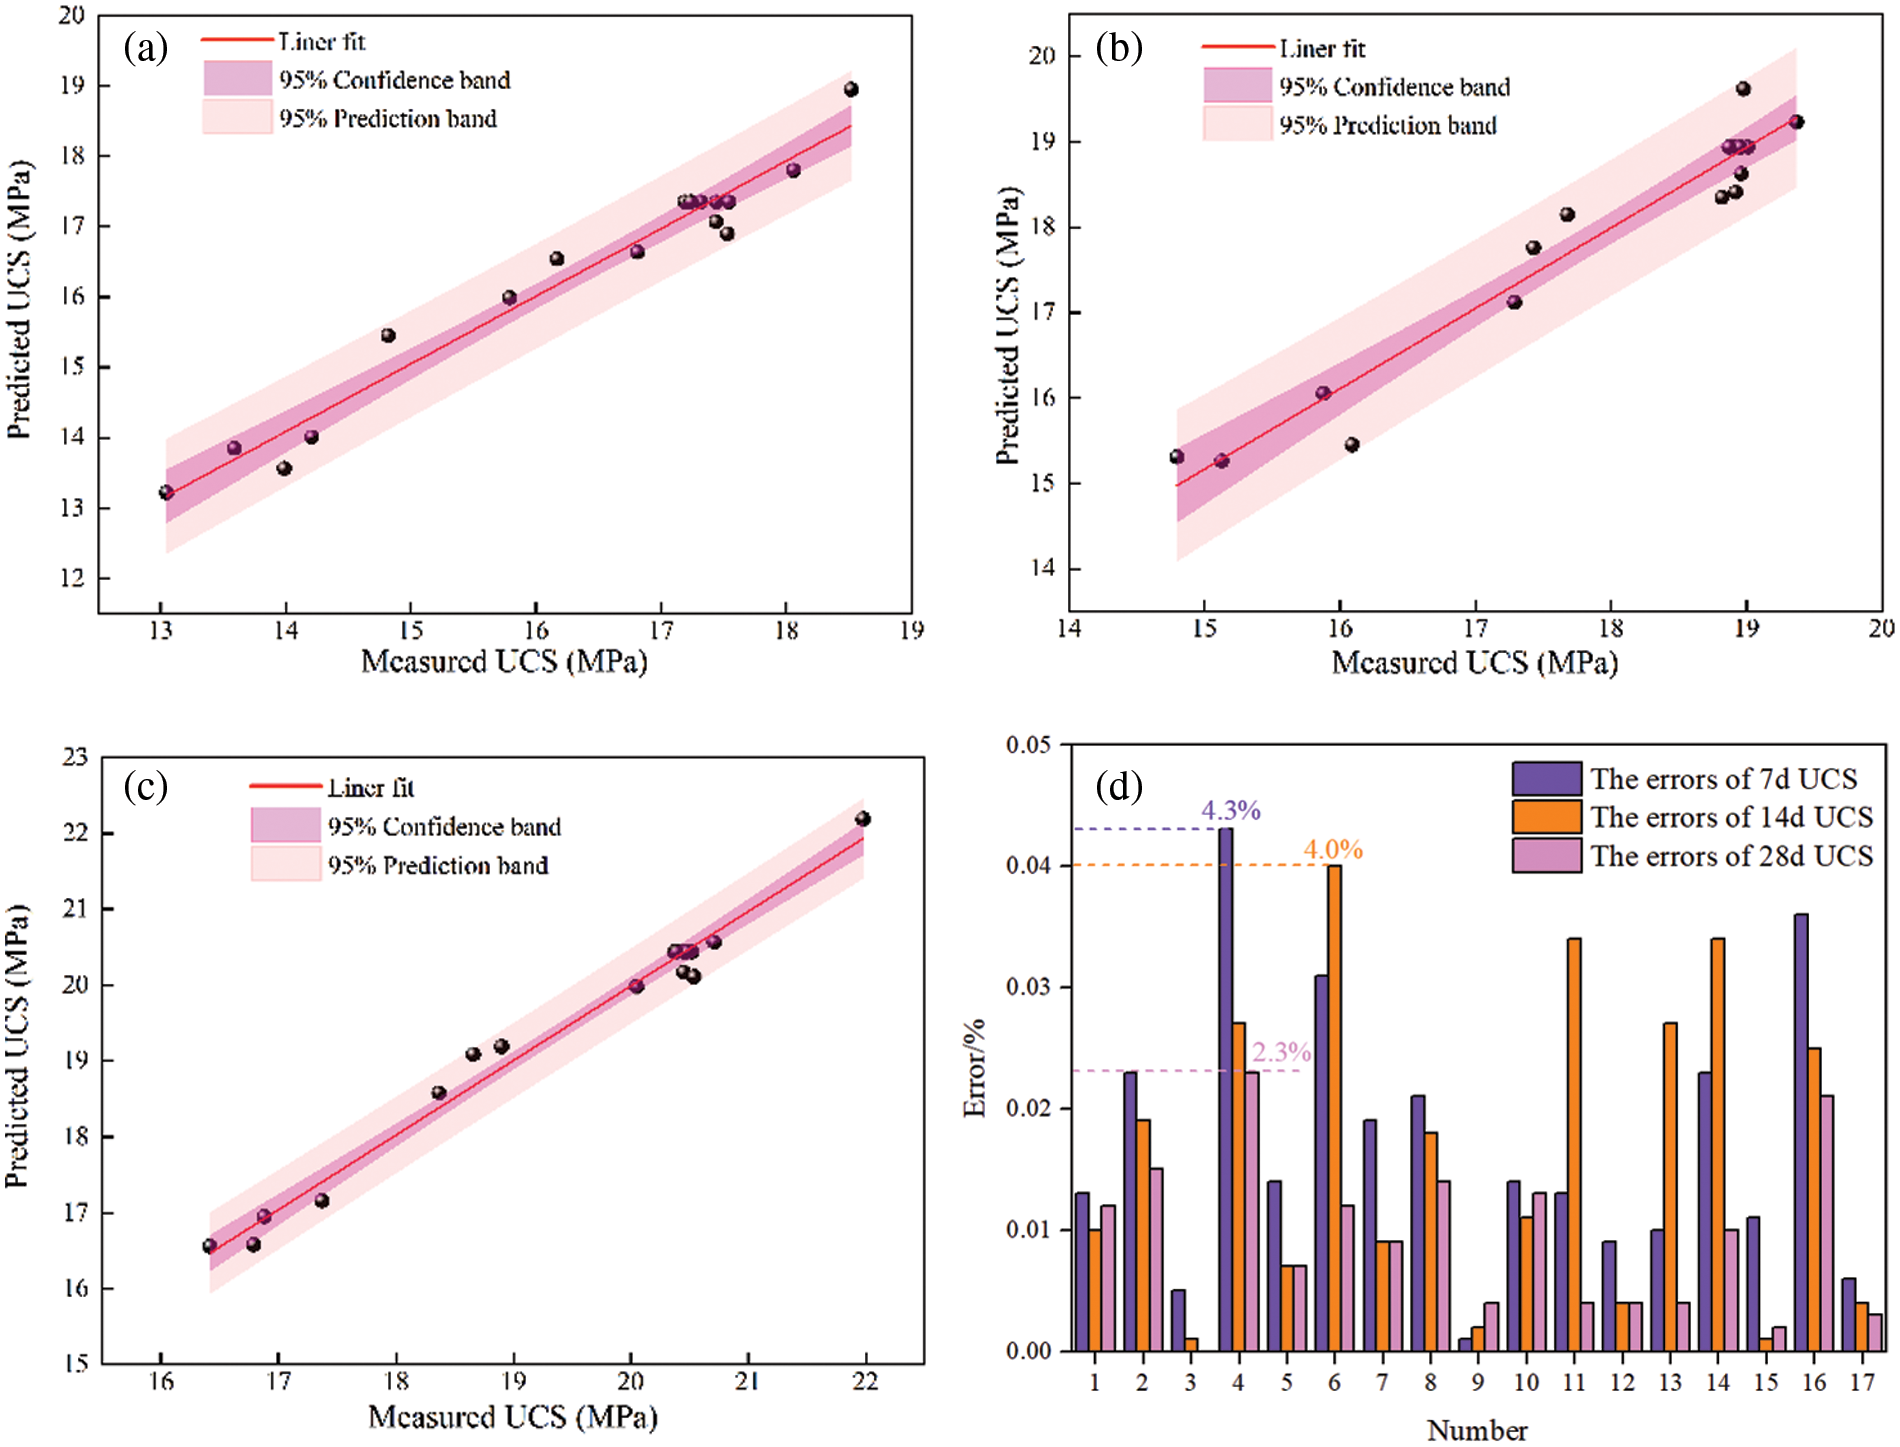
Figure 6: Prediction results and errors of models (a) 7 d UCS (b) 14 d UCS (c) 28 d UCS (d) errors
4.1 Single-Factor Effects on the UCS of TWSC
4.1.1 Effect of Fineness Modulus on the UCS of TWSC
The relationship between the fineness modulus of tailings and the UCS of TWSC is shown in Fig. 7. It can be seen that the correlation coefficients (R) between the fineness modulus and UCS at 7, 14 and 28 d are 0.613, 0.585 and 0.637, respectively, which are greater than 0.5. This indicates a significant linear relationship between the fineness modulus and UCS. From Fig. 7b, it can be seen that with the increase of fineness modulus, UCS shows a gradual increase in trend. When the fineness modulus is increased from 3 to 3.5, the UCS increased by 10.7%, 10.9% and 10.7% at 7, 14 and 28 d, respectively. When the fineness modulus is increased from 3.5 to 4, UCS is increased by 4.1%, 1.0% and 4.3%, respectively. The area of fineness modulus less than 3.5 is the area of the fast growth of UCS and the area of fineness modulus more than 3.5 is the area of the slow growth of UCS.
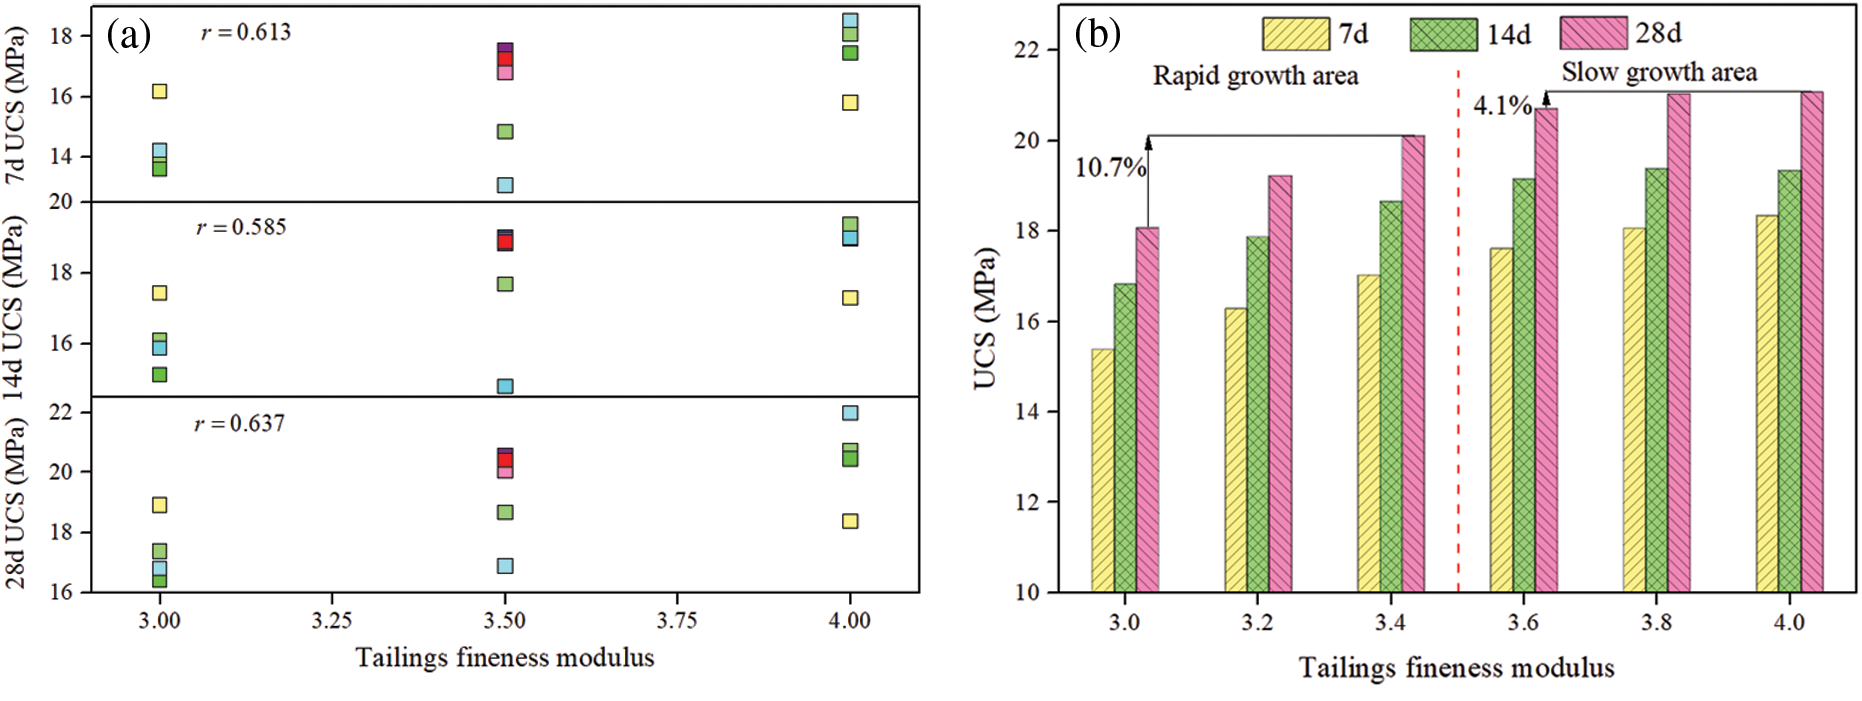
Figure 7: The relationship between fineness modulus and UCS. (a) correlation; (b) influence
4.1.2 Effect of SRC Rate on the UCS of TWSC
The relationship between the SRC rate and the UCS of TWSC is shown in Fig. 8. From Fig. 8a, it can be seen that the distribution of UCS at 7, 14 and 28 d are relatively discrete. The R values of the SRC rate and UCS are 0.204, 0.338 and 0.212, respectively, indicating that there is no linear relationship between SRC rate and UCS. From Fig. 8b, it can be seen that with the increase of SRC rate, the UCS at 7, 14 and 28 d first increase and then decrease. This indicates that there is an optimal SRC rate to make the composite cementitious system composed of slag powder and cement have the best cementitious effect. In this study, the UCS has a maximum value when the SRC rate is 20%. The area where the SRC rate is less than 20% is the strength growth area, and the area where the SRC rate is greater than 20% is the strength reduction area. Slag powder has excellent “potential activity” and the calcium hydroxide in the hydration product plays an important role in activating the “potential activity” of slag powder. When the “potential activity” of slag powder is activated, more CSH gel can be generated, which can enhance the strength of TWSC.
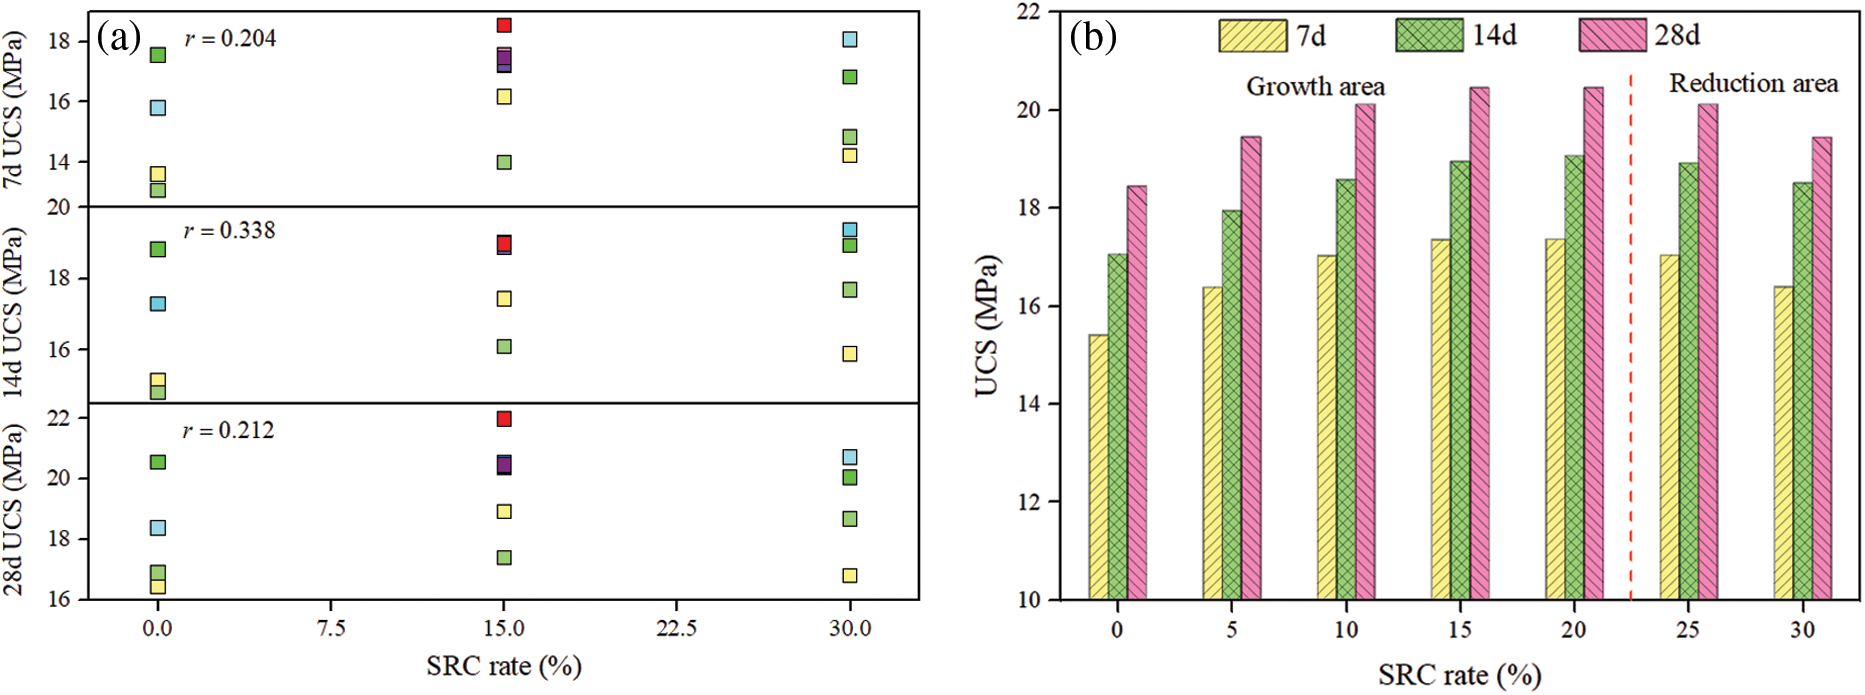
Figure 8: The relationship between SRC rate and UCS. (a) correlation; (b) influence
4.1.3 Effect of Water-Binder Ratio on the UCS of TWSC
The relationship between the water-binder ratio and the UCS of TWSC is shown in Fig. 9. From Fig. 9a, the R values of the water-binder ratio and the UCS at 7, 14 and 28 d are −0.503, −0.385 and −0.429, respectively. Where 0.3<|r|<0.5, indicating a low linear relationship between the water-binder ratio and the UCS. From Fig. 9b, it can be seen that the UCS at 7, 14 and 28 d gradually decreases as the water-binder ratio increases. When the water-binder ratio is increased from 0.45 to 0.51, the UCS at 7, 14 and 28 d are reduced by 13.3%, 8.5% and 9.4%, respectively. The larger water-binder ratio means that the water content of the slurry is larger and the amount of cementitious agent is reduced, which leads to a reduction in the UCS.
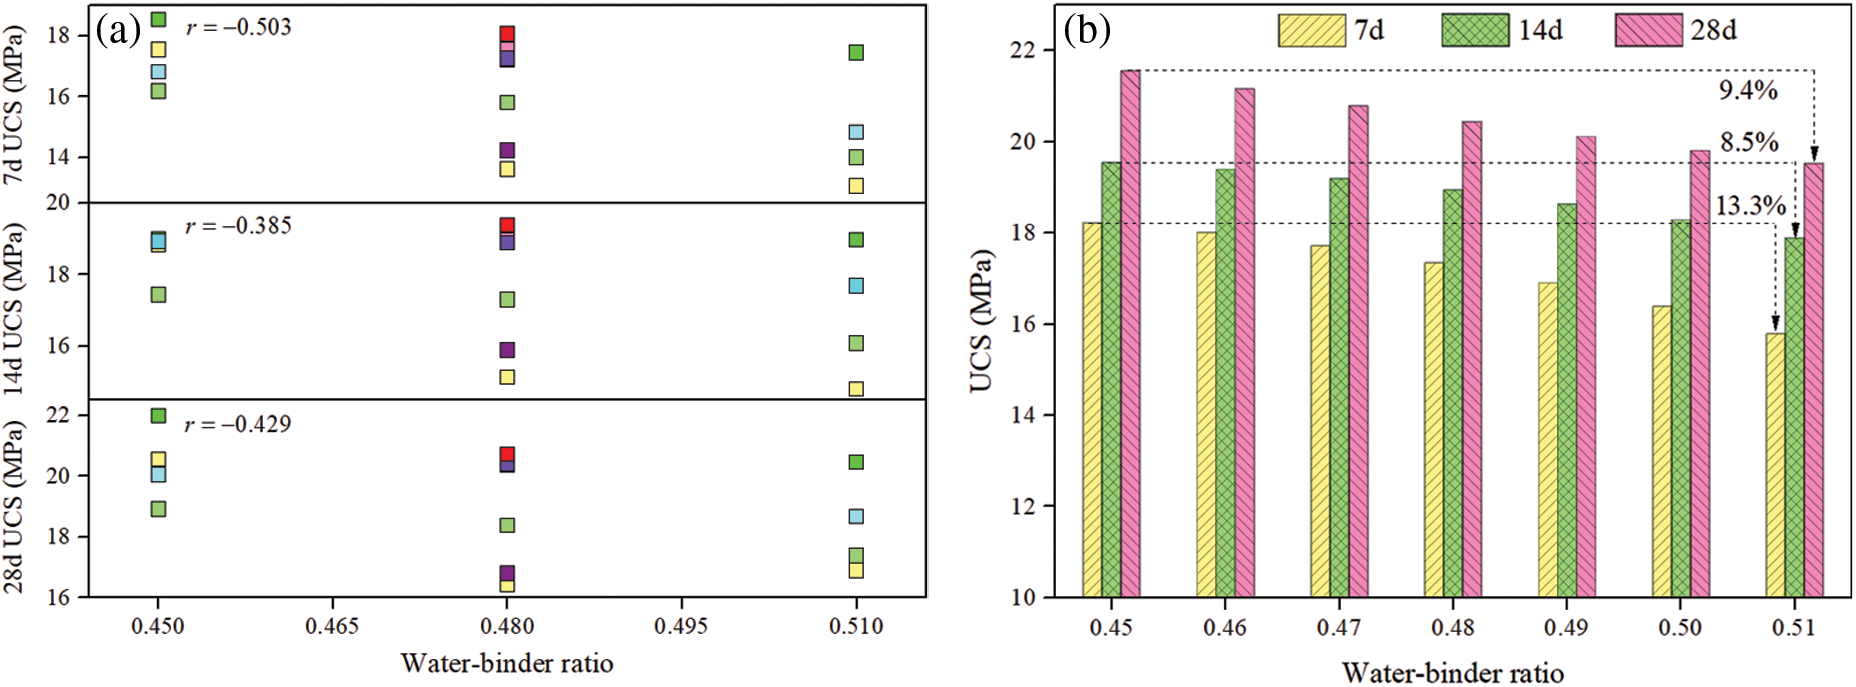
Figure 9: The relationship between the water-binder ratio and UCS. (a) correlation; (b) influence
4.2 Effect of Multifactor Coupling on the UCS of TWSC
4.2.1 Coupling Effect of Fineness Modulus and SRC Rate
The effect of the coupling of fineness modulus and SRC rate on the UCS of TWSC is shown in Fig. 10. When the SRC rate is lower than 10%, the response surface increases and then decreases as the fineness modulus increases. When the SRC rate is higher than 10%, the response surface increases rapidly and then slows down as the fineness modulus increases. Under the coupling effect of fineness modulus and SRC rate, the UCS is maximum when the fineness modulus is 4.0 and the SRC rate is 20%. The UCS is minimized when the fineness modulus is 3.0 and the SRC rate is 0%.
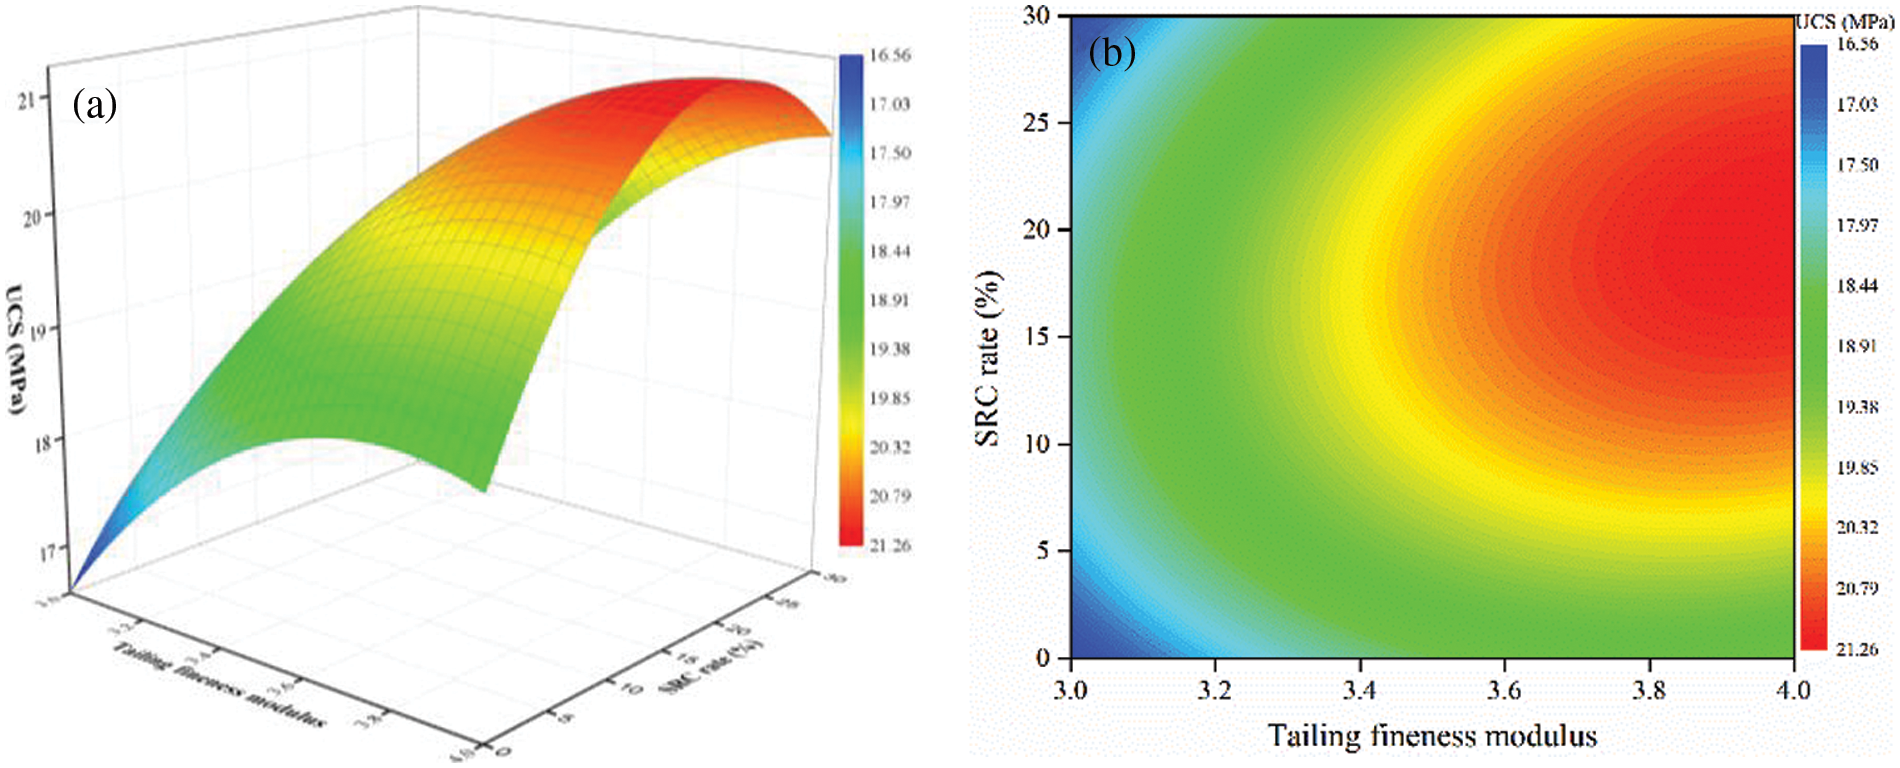
Figure 10: The effect of the coupling of fineness modulus and SRC rate on UCS. (a) response surface; (b) contour
4.2.2 Coupling Effect of Fineness Modulus and Water-Binder Ratio
The effect of the coupling effect of fineness modulus and water-binder ratio on the UCS of TWSC is shown in Fig. 11. The UCS gradually increases with the decrease of the water-binder ratio and the increase of fineness modulus. The UCS has a maximum value of 22.22 MPa when the water-binder ratio is 0.45 and the fineness modulus is 4.0. When the fineness modulus is below 3.4, the trend of the increase of UCS is not significant and the maximum increase is only 9.8% as the water-binder ratio decreases. When the fineness modulus is higher than 3.4, the increase of UCS is larger and the maximum increase is 15.9% as the water-binder ratio decreases.
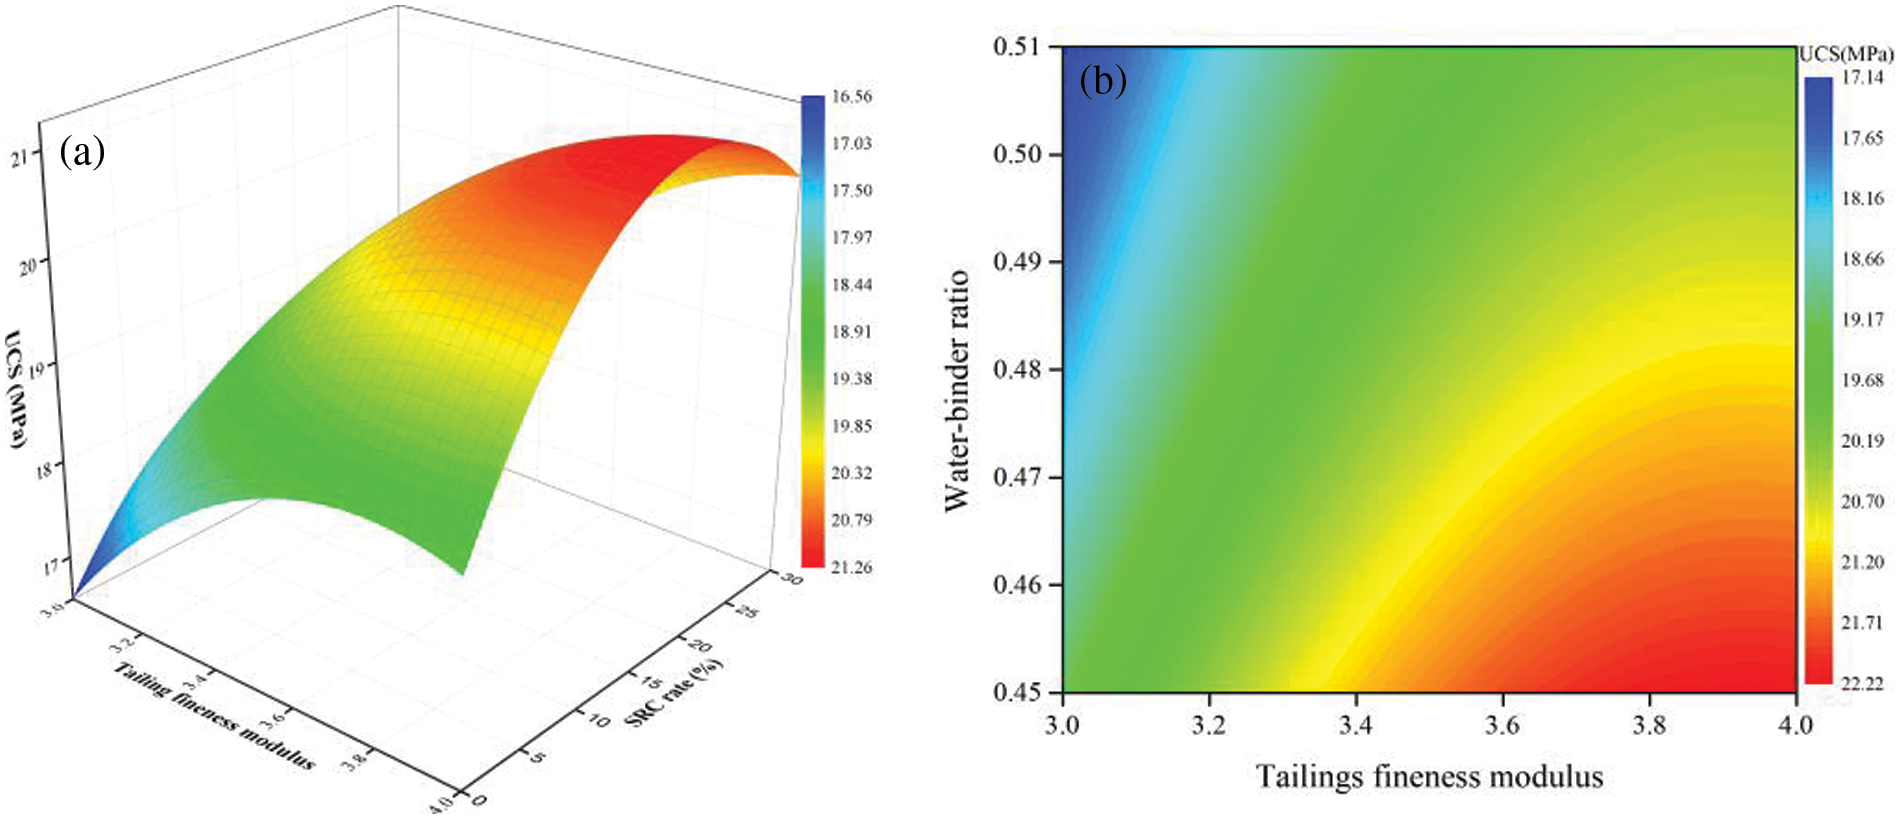
Figure 11: The effect of the coupling of fineness modulus and water-binder ratio on UCS. (a) response surface; (b) contour
4.2.3 Coupling Effect SRC Rate and Water-Binder Ratio
The effect of coupling the SRC rate and water-binder ratio on the UCS of TWSC is shown in Fig. 12. Under the interaction of these two factors, the UCS is highest when the SRC rate is around 15% and the water-binder ratio is 0.45. The lower the water-binder ratio, the greater the variation of the response surface with the SRC rate. The highest point of the response surface gradually shifts toward the positive offset of the scale of the SRC rate as the water-binder ratio increases. This indicates that increasing the SRC rate contributes to enhancing the UCS when the water-binder ratio is relatively high. When the water-binder ratio is relatively low, reducing the SRC rate helps to enhance the UCS.
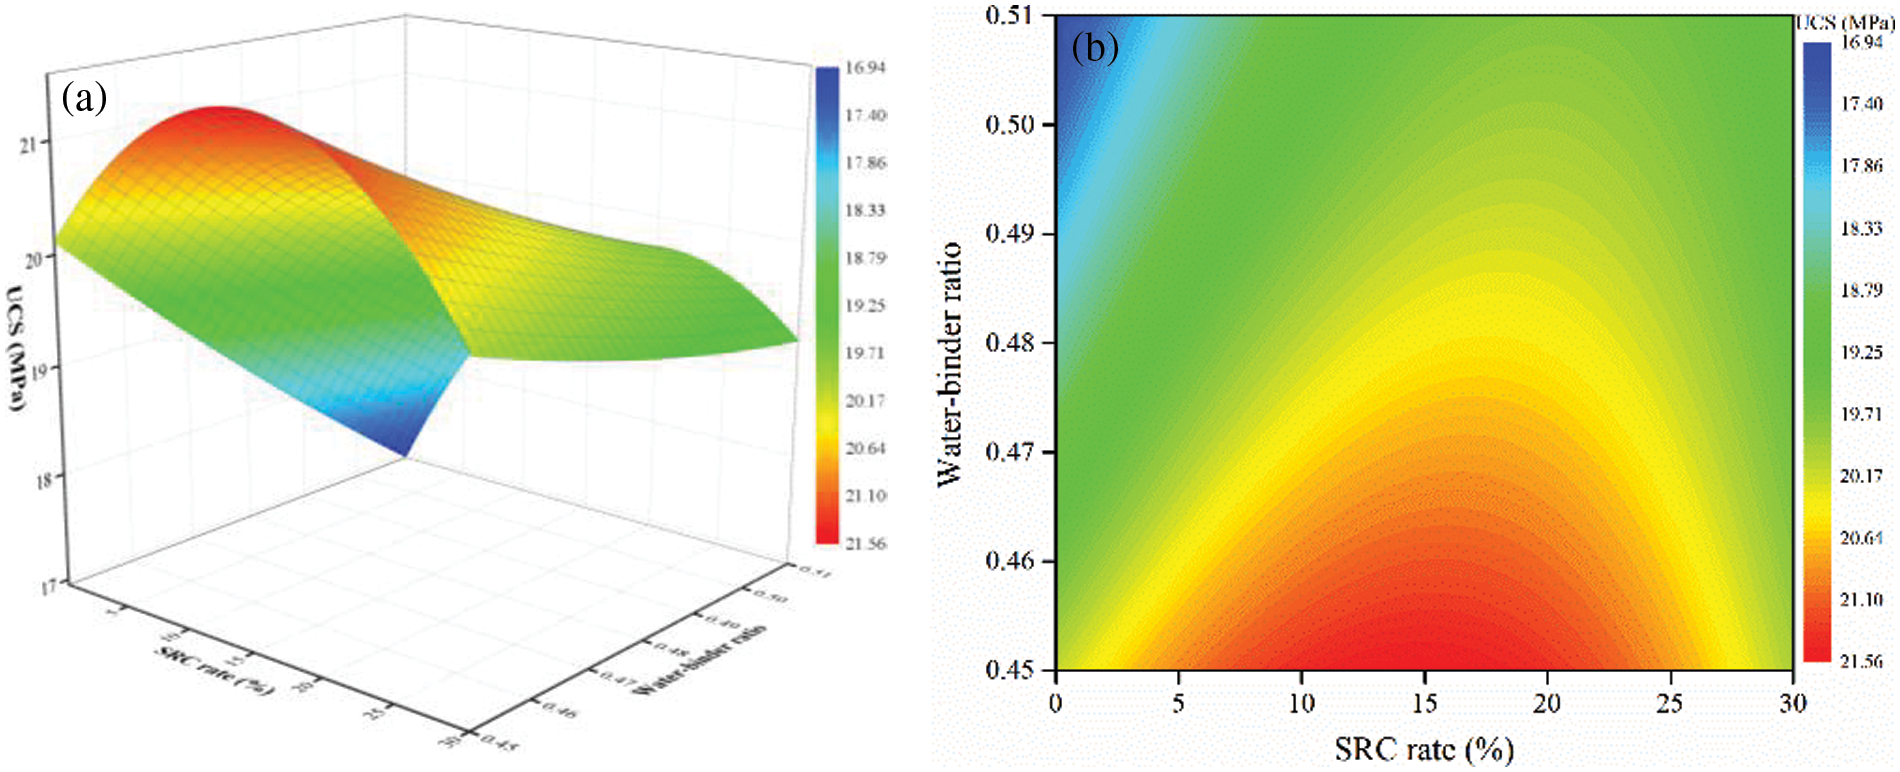
Figure 12: The effect of the coupling of SRC rate and water-binder ratio on UCS. (a) response surface; (b) contour
The representative specimens of group 3 and group 7 are selected from the experimental groups in Table 4 for microstructure analysis, as shown in Fig. 13. From Fig. 13a, it can be seen that the specimens of group 3 formed a dense structure with high strength. The hydration reaction produced a lot of C-S-H and AFt. The Aft crystals crossed each other to form a network structure and the C-S-H gels encapsulated the network structure and filled the pores to form a compact cemented structure. Fig. 13b shows that the specimens of group 7 formed a weaker pore structure. Some AFt crystals are sparsely distributed in the pores of TWSC. The C-S-H gels are produced in smaller amounts and cannot adequately encapsulate the Aft crystals to fill the pores, which results in more pores in TWSC. Comparing the experimental conditions and results of group 3 and group 7, it can be seen that the use of slag powder instead of partial cement as cementitious material and increasing the fineness modulus can improve the internal structure of TWSC and thus enhance the UCS of TWSC.
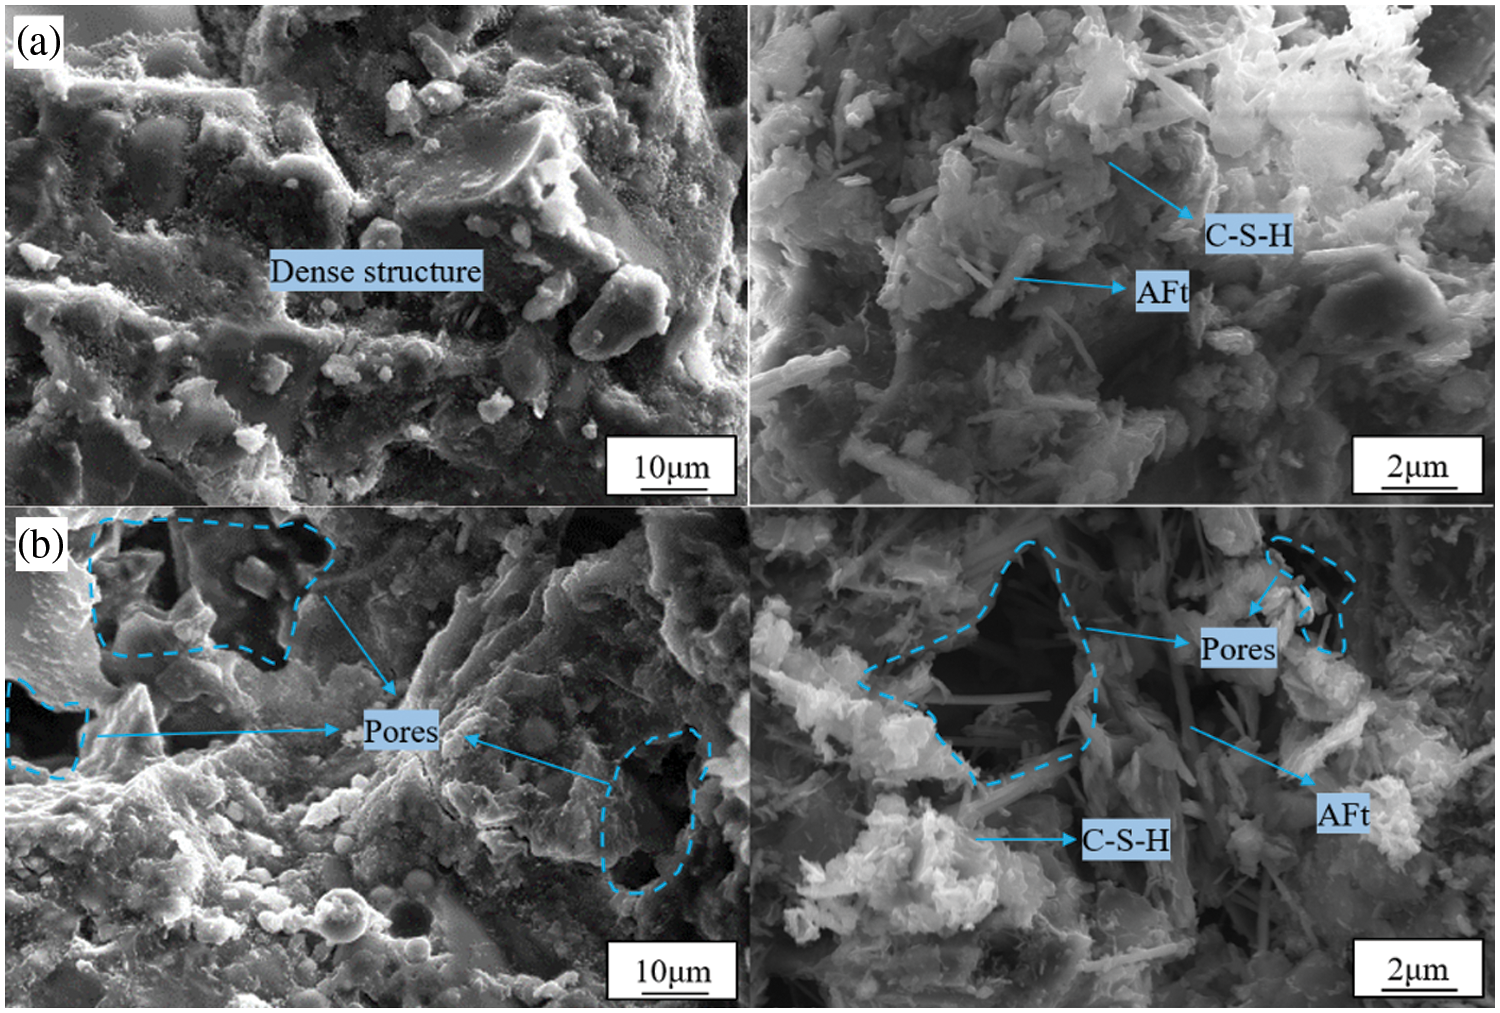
Figure 13: The Microstructures of TWSC specimens. (a) group 3; (b) group 7
5.1 Evaluation Metrics for Prediction Models
To evaluate the prediction performance of different models, root mean square error (RMSE), correlation coefficient (R) and variance account for (VAF) are used to quantify the prediction accuracy of models. The evaluation metrics are as follows [48,49]. The closer the RMSE is to 0, the closer the R is to 1 and the closer the VAR is to 100, the better the model prediction is.
5.2 The Process of ELM Modelling
ELM is constructed to predict the UCS of TWSC and provide a basis for intelligent optimization of mix proportion in this study. 51 sets of data in Table 4 are used as the data set. To better evaluate the prediction performance of the model, the original data are randomly divided into a training set and a validation set in the ratio of 8:2. 41 sets of data from the training set are used to train ELM and 10 sets of data from the validation set are used to evaluate the prediction performance of ELM. Using tailings fineness modulus (TFM, X1), replacement rate of slag powder to cement (SRSPC, X2), binder-water ratio (BWR, X3) and curing time (CT, X4) as input variables and UCS (Y) as output variable. The ELM model for characterizing the nonlinear relationship between X1, X2, X3, X4 and Y is constructed. The technical route of construction for ELM is shown in Fig. 14.
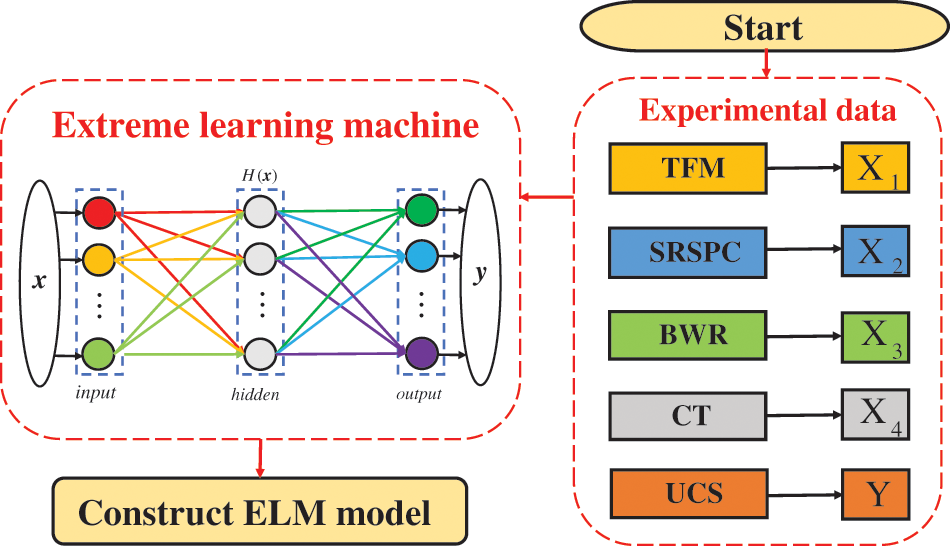
Figure 14: The technical route of construction for ELM
The number of input layers and output layers of ELM is set to 4 and 1 according to the number of input variables and outputs, respectively. Based on the previous research results, the setting of the hidden layer nodes is determined based on the following experience equation [14,33]:
In Eq. (13), m is the number of input layers, n is the number of output layers and l is the adjustable constant on the interval [1,10]. Using the mean absolute error (MAE) of the validation set to measure the ELM performance at different hidden layer nodes. In the process of determining the best hidden layer nodes, the MAE under each condition of hidden layer nodes is calculated 10 times and averaged to ensure the generalization of the results. The MAE of the validation set for ELM at different hidden layer nodes is shown in Fig. 15. It can be seen that when the hidden layer nodes of ELM are 11, the MAE of the validation set obtains the minimum value of 0.7044. Therefore, the hidden layer nodes of the ELM are set to 11.
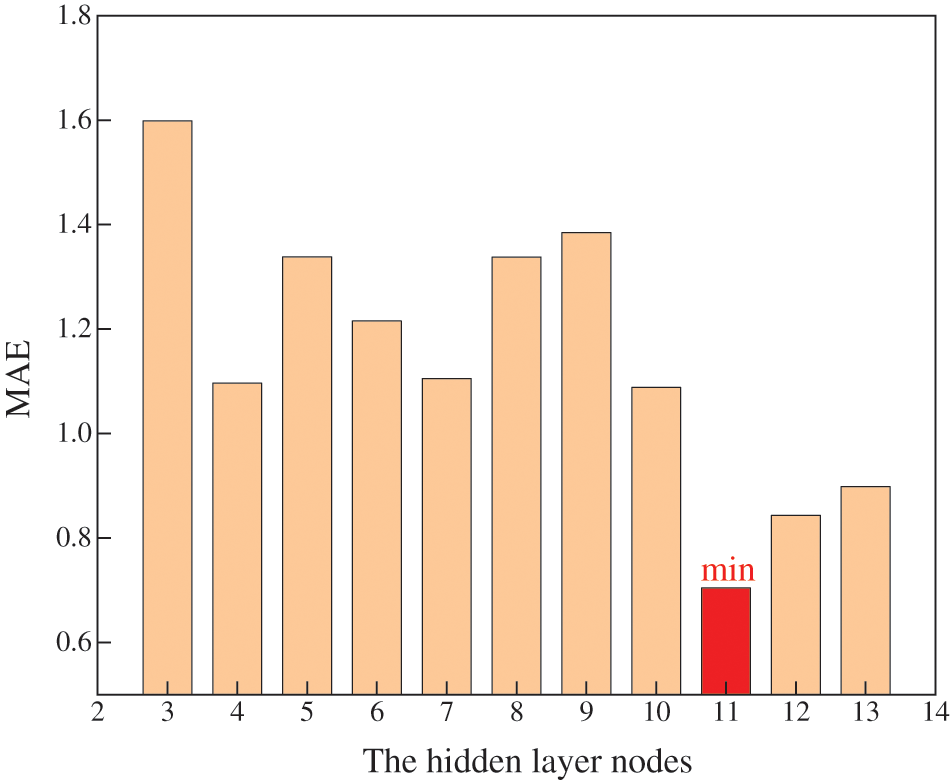
Figure 15: The MAE of the validation set for ELM at different hidden layer nodes
5.3 Analysis of Results for ELM
Fig. 16 shows the prediction results of the training set and validation set of the ELM model. The R of the training set and validation set approaches 1, the VAF approaches 100, and the RMSE approaches 0, indicating that the prediction accuracy of the ELM model is high. In addition, the R, VAF and RMSE of the training set are slightly better than those of the validation set, indicating that the prediction effect of the training set is better than that of the validation set.
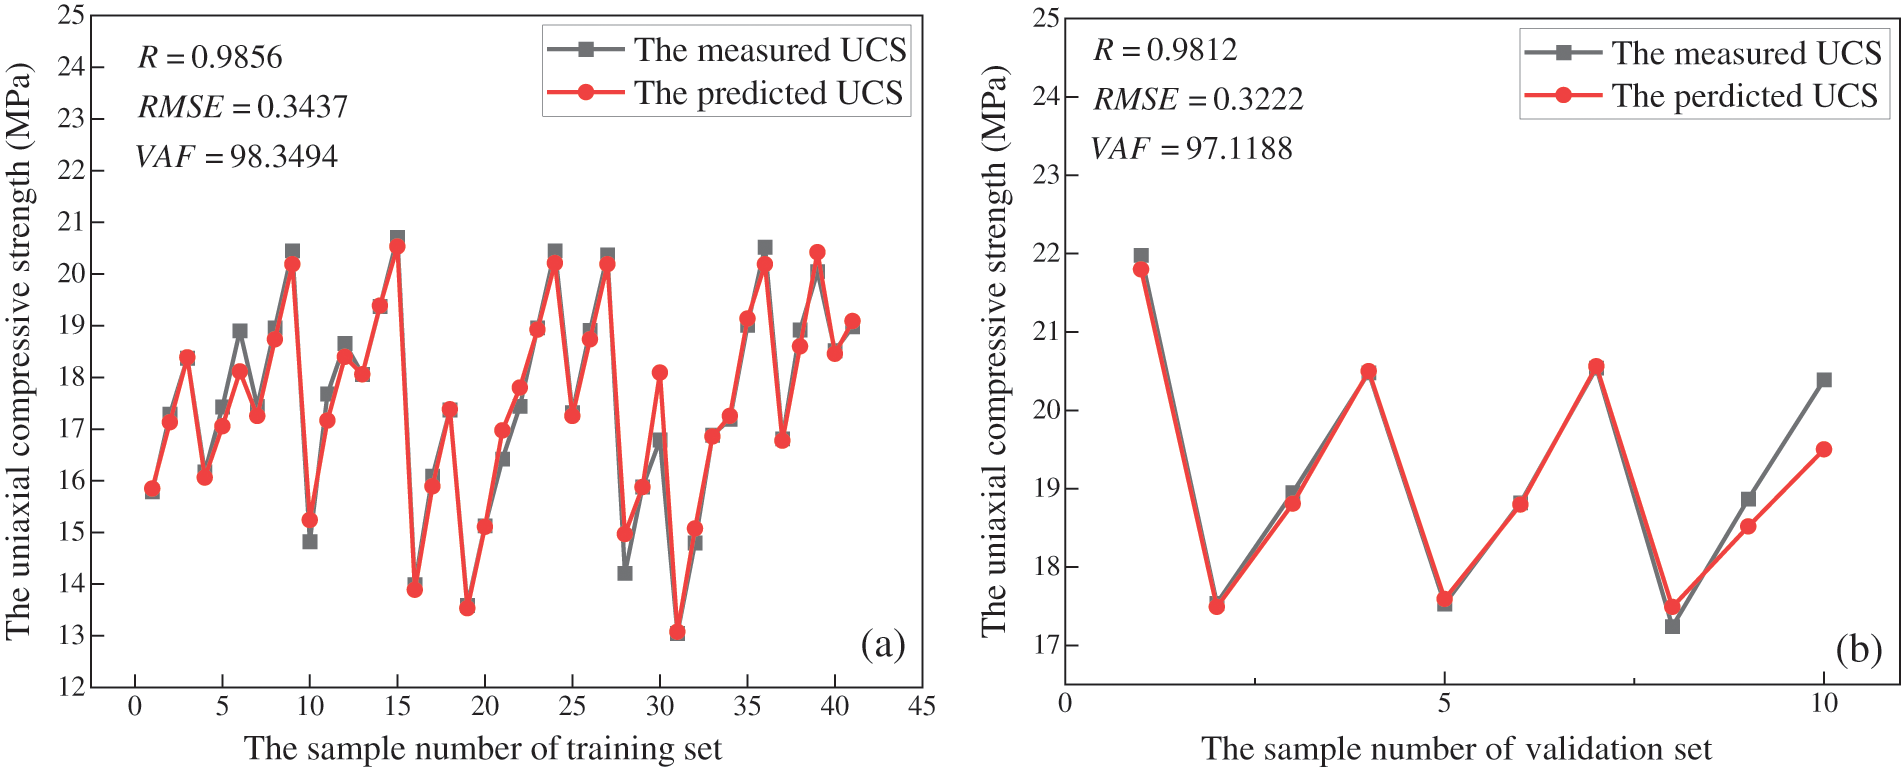
Figure 16: ELM prediction performance. (a) training set; (b) validation set
5.4 Comparisons with Other Models
In this paper, ELM is compared with back proportion neural network (BPNN), radial basis function neural network (RBFNN), and generalized regression neural network (GRNN), which are widely used in engineering practice. Before the comparison of prediction performance, all models are trained and the best structural parameters of each model are obtained.
Fig. 17 shows the marginal histograms of the prediction results of different models. Overall, the prediction results of a training set of ELM and RBFNN are consistent with the actual data, while the prediction results of BPNN and GRNN are relatively poor. The prediction results of the validation set of ELM and GRNN are consistent with the actual data, while the prediction results of BPNN and RBFNN are relatively poor. The above conclusions can be verified on the R value of prediction results of the training set and validation set of different models.
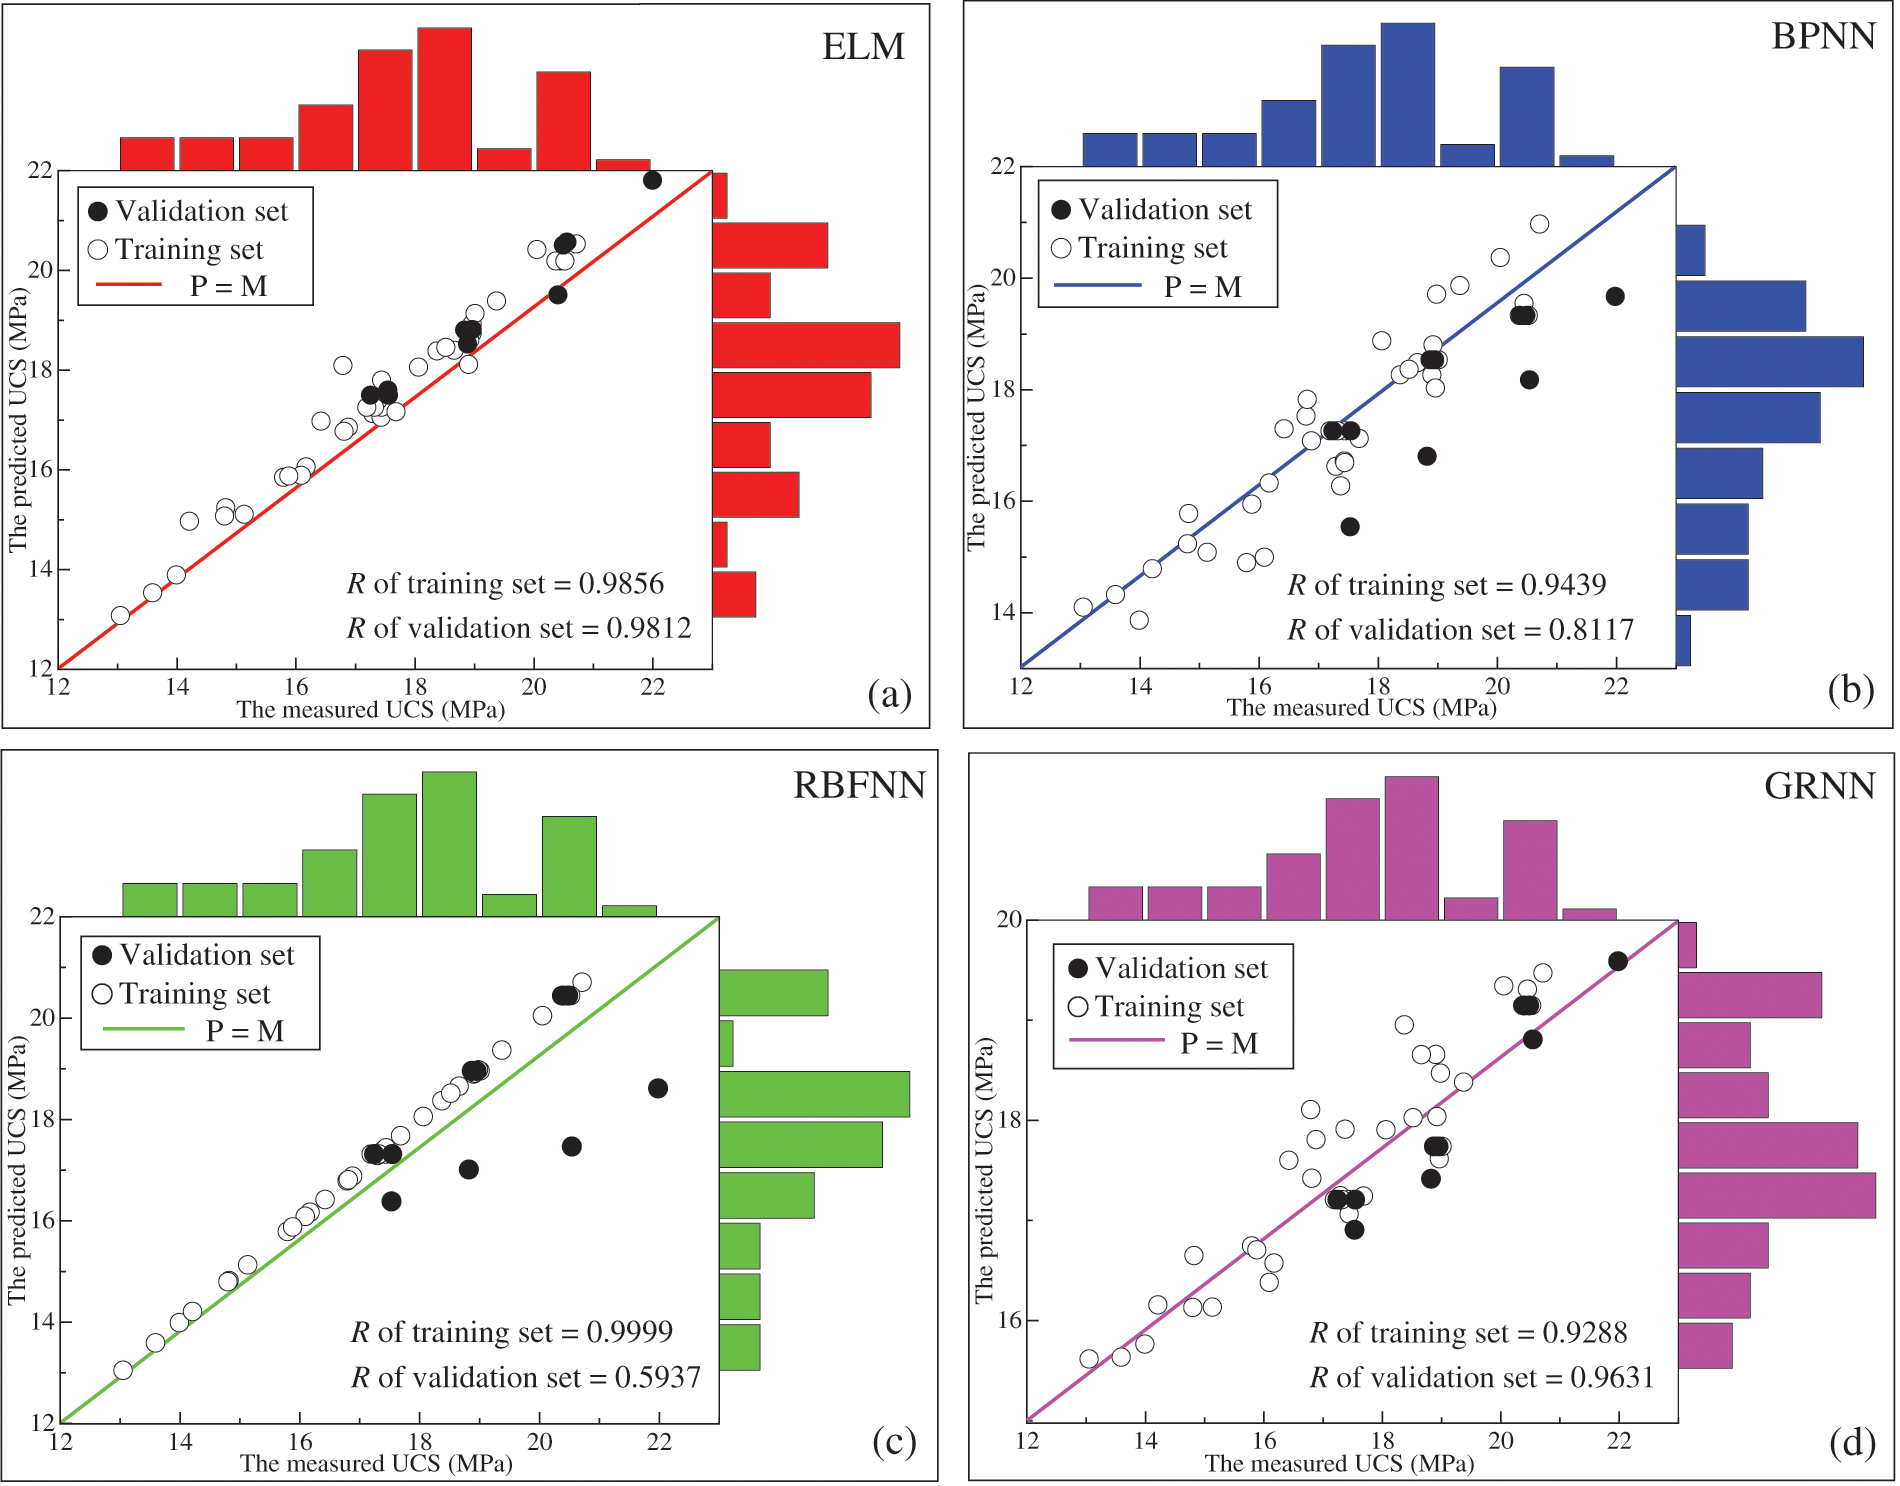
Figure 17: Comparison of prediction effects of different models. (a) ELM; (b) BPNN; (c) RBFNN; (d) GRNN
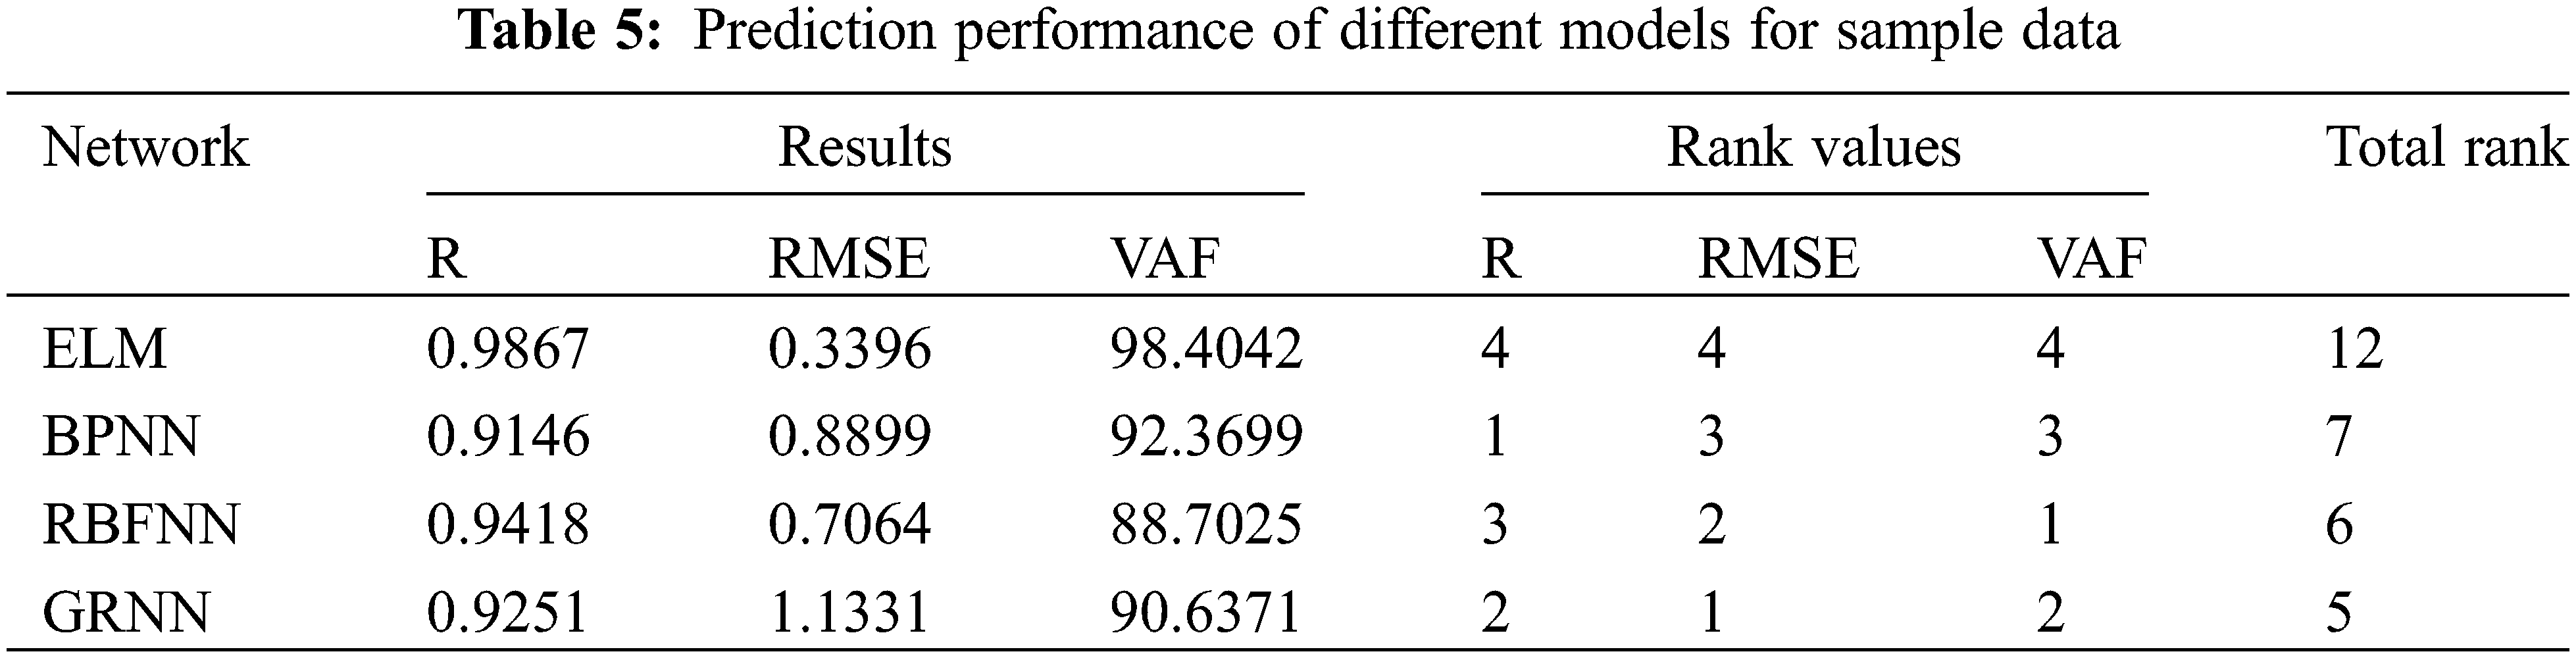
Fig. 18 shows the prediction results of different models on the UCS of TWSC. The R of the ELM model is 0.99, which is 10.88%, 4.77% and 6.66% higher than BPNN, RBFNN and GRNN, respectively. The RMSE of ELM model is 0.34, which is 61.84%, 51.93% and 70.03% lower than BPNN, RBFNN and GRNN, respectively. The VAF of the ELM model is 98.40, which is 6.53%, 10.94% and 7.89% higher than BPNN, RBFNN and GRNN, respectively. The prediction accuracy ranking results (Table 5) of different algorithms based on the Zorlu method show that ELM has the best prediction effect on the UCS of TWSC.
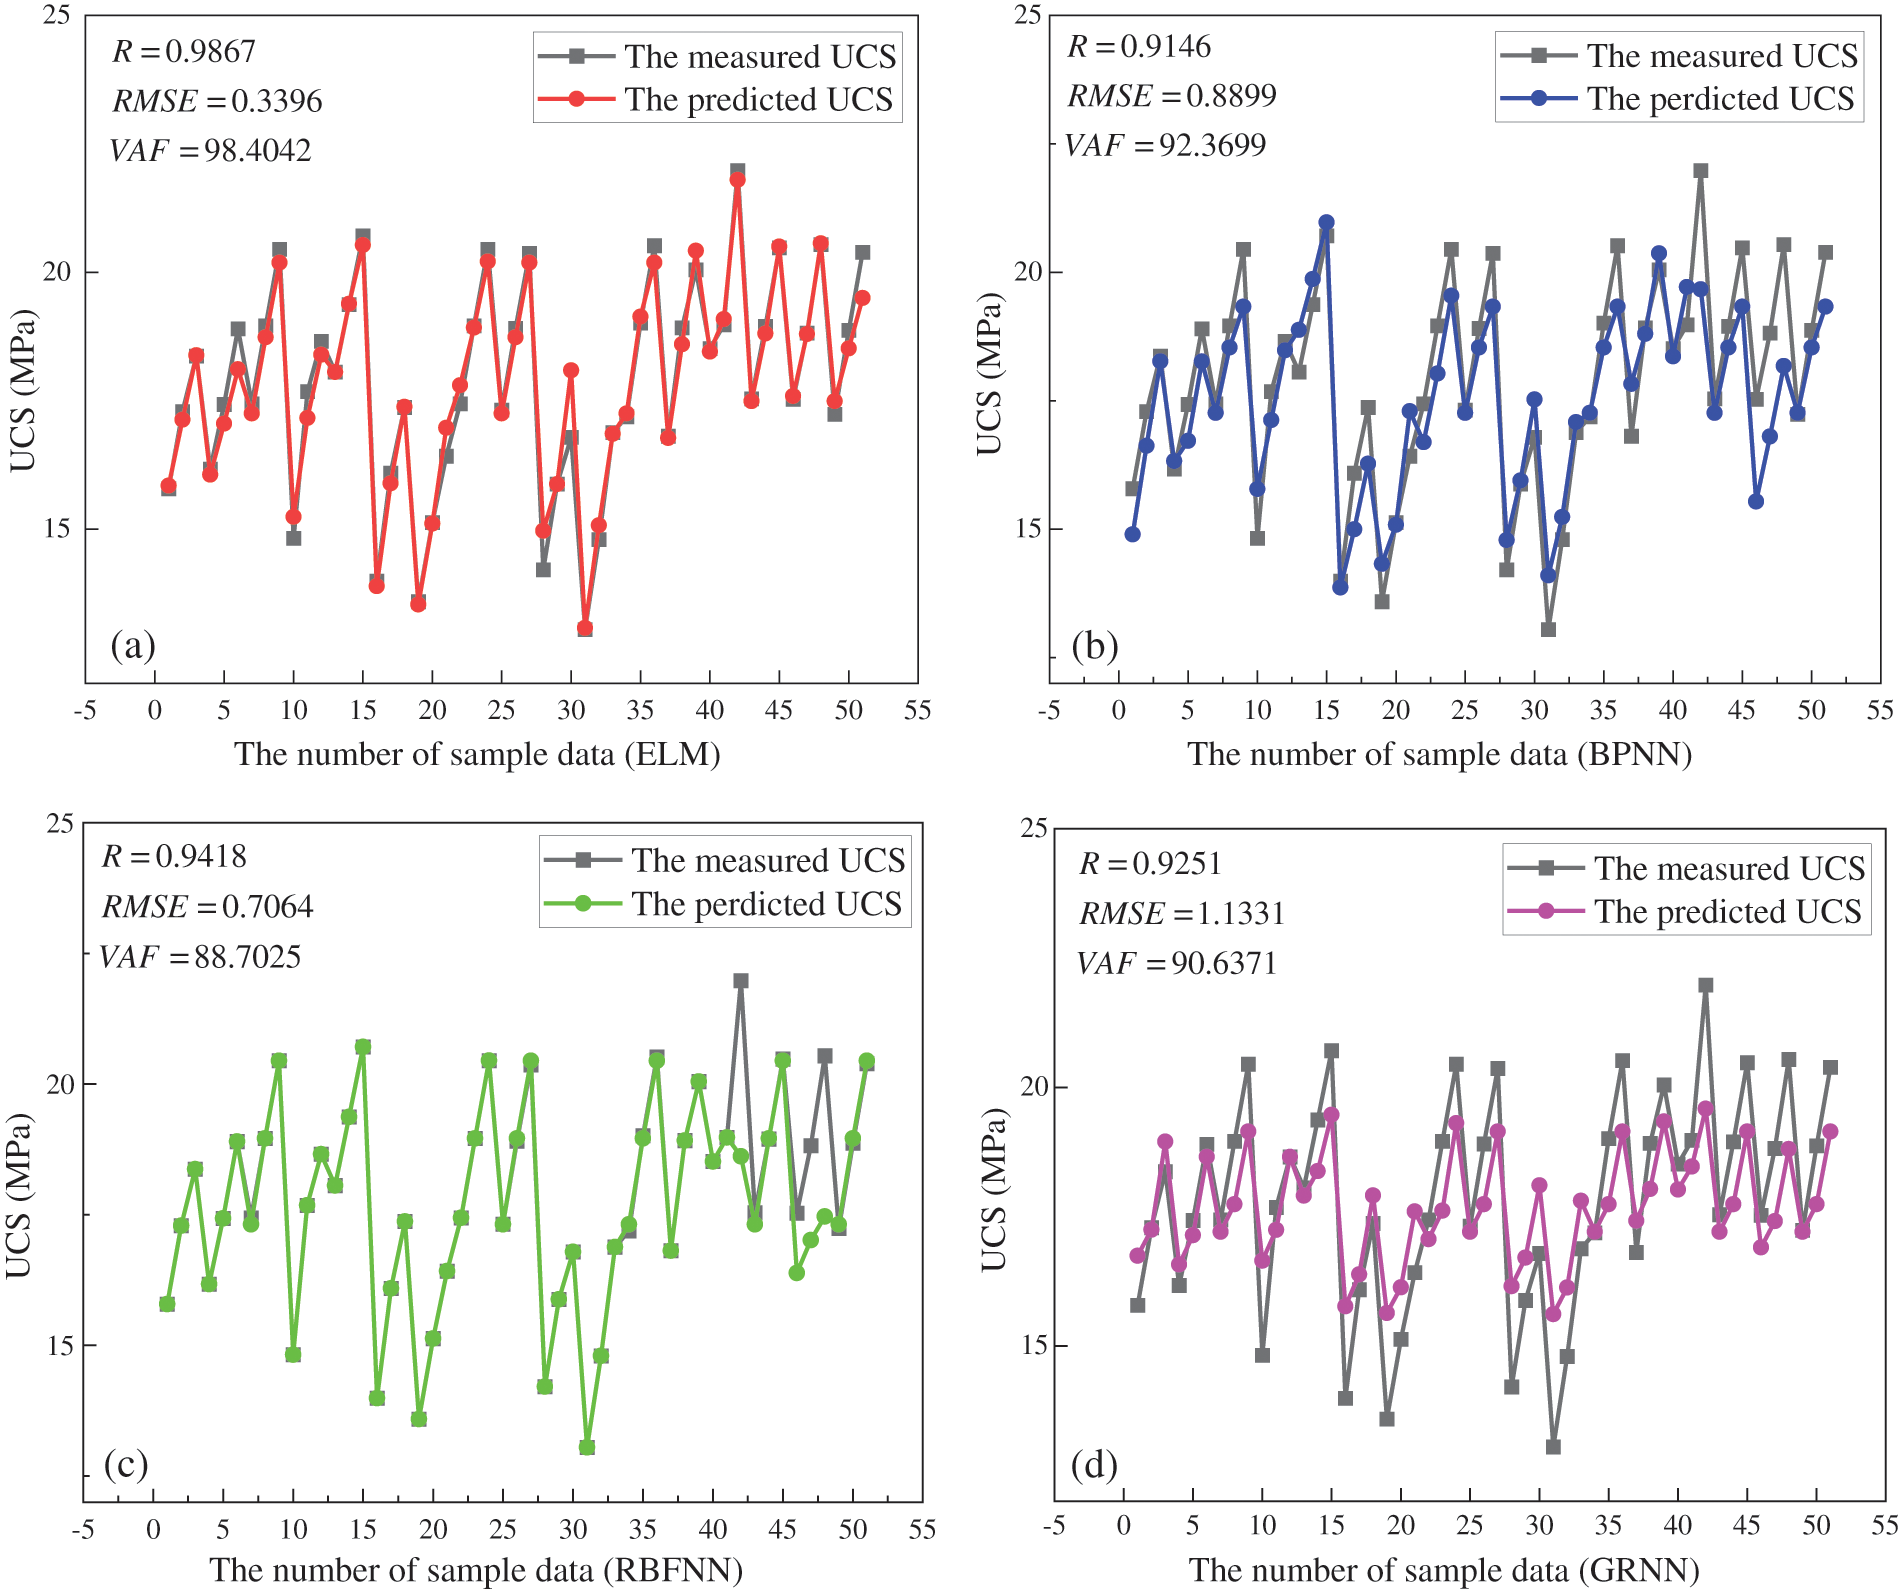
Figure 18: The prediction performance of different models. (a) ELM; (b) BPNN; (c) RBFNN; (d) GRNN
5.5 ELM and GA Combined to Solve for the Optimal Mix Proportion for TWSC
GA is introduced to solve the optimal mix proportion of TWSC at different constraint conditions based on construction of ELM in this study. Firstly, a nonlinear mapping relationship between each affecting factor and UCS is established using ELM (as described in Section 4.2). Secondly, the constructed ELM is considered a nonlinear function fELM for predicting the UCS and adding constraint conditions to fELM for engineering applications (fELM is called the objective function). Finally, the above objective function is used as the fitness function in the GA and the GA is used to search for the minimum value of the fitness function. The minimum value is the optimal solution and the optimum mix proportion corresponding to this optimal solution can be obtained. The specific construction flow of ELM-GA is shown in Fig. 19.
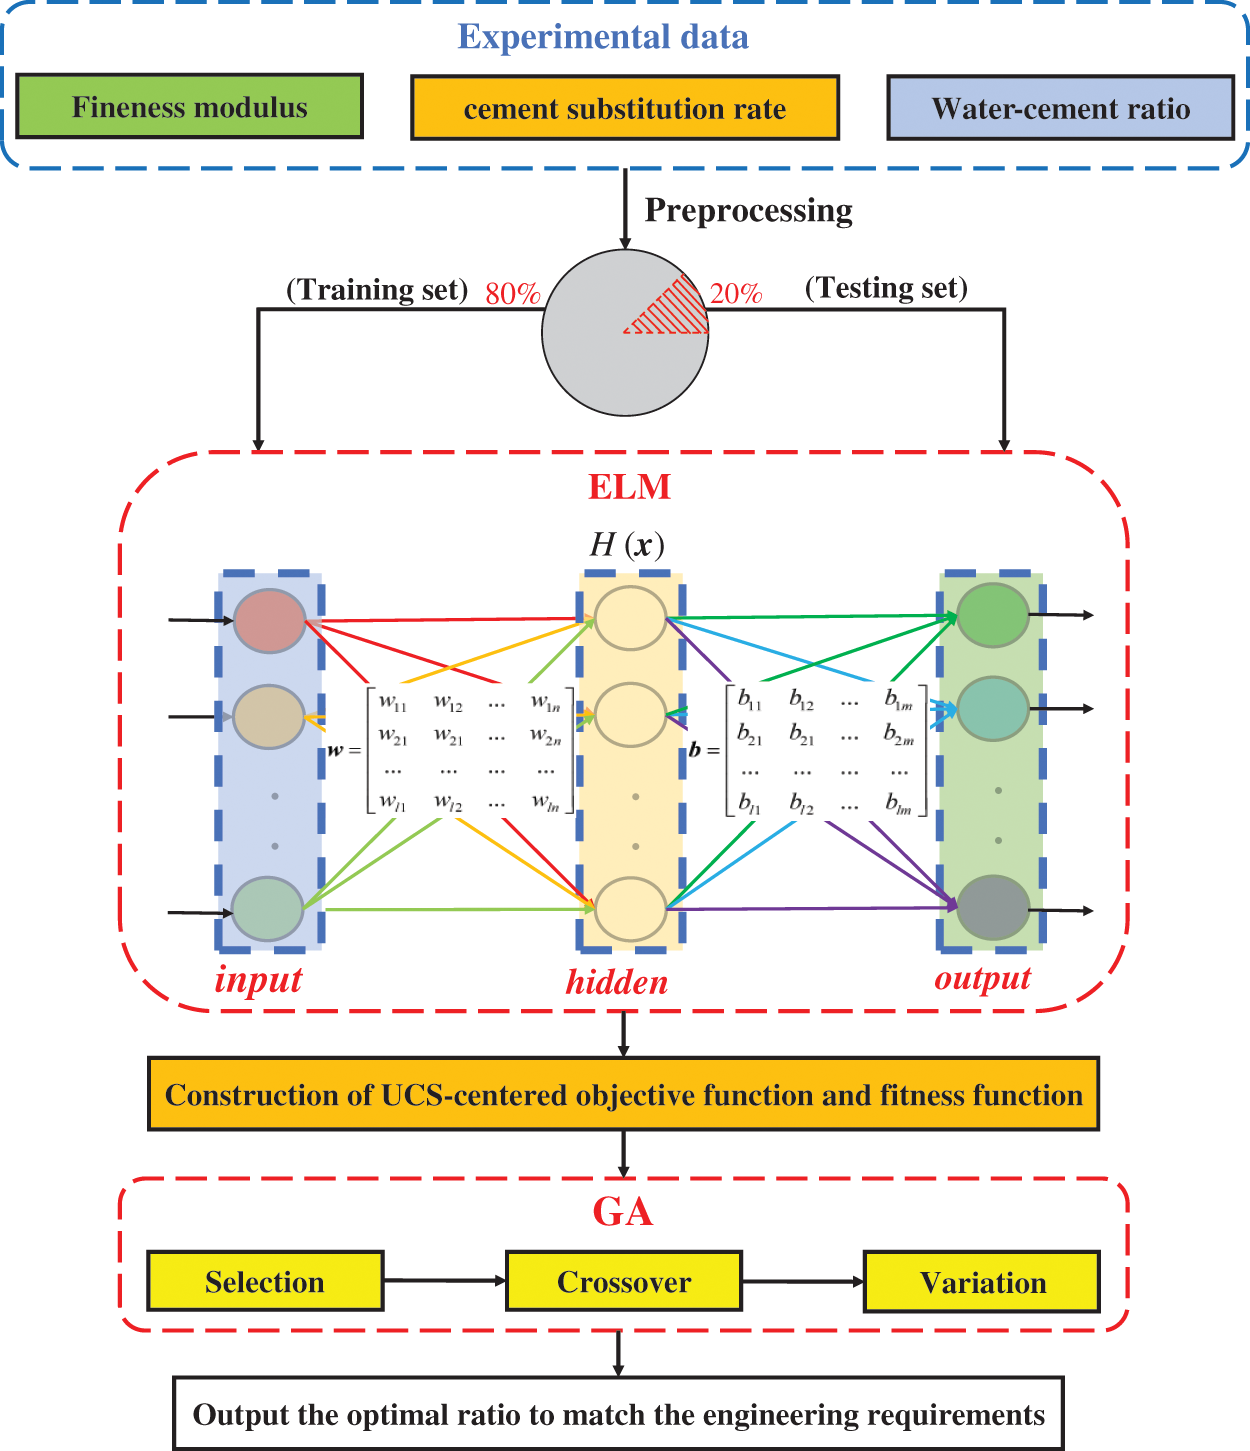
Figure 19: The specific construction flow of ELM-GA
In this paper, the individual coding method of GA uses real numbers and the values of each parameter are as follows. The population size is 100, the max iterations are 100, the crossover probability is 0.4, and the mutation probability is 0.2.
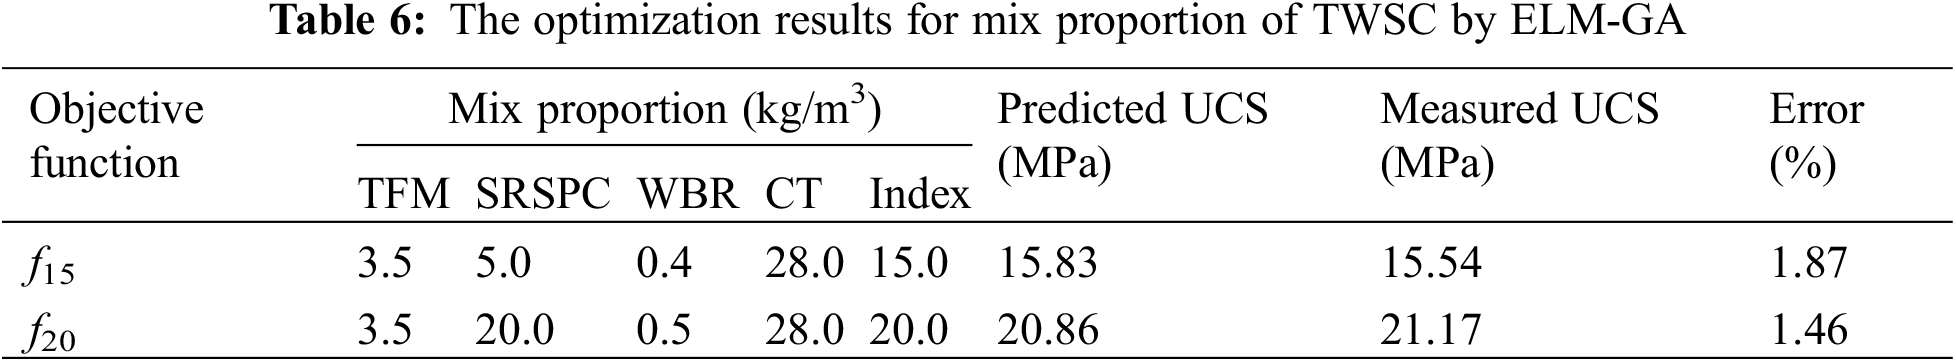
The optimal mix proportions for TWSC with UCS of 15 MPa and 20 MPa (Objective functions are f15 and f20) are solved using ELM-GA. It is also necessary to round off the mix proportion parameters optimized by ELM-GA to convenience for practice engineering. The ELM-GA model can optimize the mix proportions of TWSC in less than 1.5 min. The final optimization results for mix proportions are shown in Table 6. It can be seen that the errors of predicted UCS and measured UCS for the optimized mix proportions with the target strengths of 15 and 20 MPa are 1.87% and 1.46%, respectively. This shows that the ELM-GA model can quickly and accurately realize the mix proportion optimization of TWSC.
In this paper, the strength regression model of TWSC is constructed and the analysis of the effect of different factors on the UCS of TWSC is carried out. The ELM model is constructed to predict the UCS of TWSC and the ELM-GA model is constructed to optimize the mix proportion of TWSC. The results of the study are of great significance for the efficient recycling of tailings and the sustainable development of mines. The main results are as follows:
1. The concept of fineness modulus is proposed to characterize the tailings particle size quantitatively. A larger tailings fineness modulus indicates a coarser particle size.
2. In the strength regression model constructed in this paper for different curing times, R2 > 0.94 and P < 0.01, which indicates a superior fit and a highly significant model.
3. The UCS of TWSC increases with the increase of fineness modulus and the decrease of water-binder ratio, while it increases and then decreases with the increase of SRC rate. The strength development trend under the coupling effect of multiple factors is almost the same as that of a single factor.
4. In the ELM prediction model, R = 0.9867, RMSE = 0.3396 and VAF = 98.4202, which indicates that the ELM model can achieve high-precision prediction of UCS of TWSC.
5. The mix proportion of TWSC with strength grades C15 and C20 is calculated by the ELM-GA model constructed in this paper. The error between the measured results and the predicted results obtained from the indoor experiments using this mix proportion is less than 2%, which proves the reliability of the model.
Funding Statement: This work is funded by the National Key Research and Development Program of China (Grant Nos. 2018YFC1900603, 2018YFC0604604).
Conflicts of Interest: The authors declare that they have no conflicts of interest to report regarding the present study.
References
1. Chen, Q., Tao, Y., Feng, Y., Zhang, Q., Liu, Y. (2021). Utilization of modified copper slag activated by Na2SO4 and CaO for unclassified lead/zinc mine tailings based cemented paste backfill. Journal of Environmental Management, 290, 112608. https://doi.org/10.1016/j.jenvman.2021.112608 [Google Scholar] [PubMed] [CrossRef]
2. Sun, W., Wu, D., Liu, H., Qu, C. (2021). Thermal, mechanical and ultrasonic properties of cemented tailings backfill subjected to microwave radiation. Construction and Building Materials, 313(12), 125535. https://doi.org/10.1016/j.conbuildmat.2021.125535 [Google Scholar] [CrossRef]
3. Chen, Q., Tao, Y., Zhang, Q., Qi, C. (2022). The rheological, mechanical and heavy metal leaching properties of cemented paste backfill under the influence of anionic polyacrylamide. Chemosphere, 286, 131630. https://doi.org/10.1016/j.chemosphere.2021.131630 [Google Scholar] [PubMed] [CrossRef]
4. Zhang, S., Shi, T., Ni, W., Li, K., Gao, W. et al. (2021). The mechanism of hydrating and solidifying green mine fill materials using circulating fluidized bed fly ash-slag-based agent. Journal of Hazardous Materials, 415(51), 125625. https://doi.org/10.1016/j.jhazmat.2021.125625 [Google Scholar] [PubMed] [CrossRef]
5. Cao, S., Xue, G., Song, W., Teng, Q. (2020). Strain rate effect on dynamic mechanical properties and microstructure of cemented tailings composites. Construction and Building Materials, 247(2), 118537. https://doi.org/10.1016/j.conbuildmat.2020.118537 [Google Scholar] [CrossRef]
6. Zhang, M., Li, K., Ni, W., Zhang, S., Liu, Z. et al. (2022). Preparation of mine backfilling from steel slag-based non-clinker combined with ultra-fine tailing. Construction and Building Materials, 320(11), 126248. https://doi.org/10.1016/j.conbuildmat.2021.126248 [Google Scholar] [CrossRef]
7. Wei, X., Ni, W., Zhang, S., Wang, X., Li, J. et al. (2022). Influence of the key factors on the performance of steel slag-desulphurisation gypsum-based hydration-carbonation materials. Journal of Building Engineering, 45(1), 103591. https://doi.org/10.1016/j.jobe.2021.103591 [Google Scholar] [CrossRef]
8. Zhang, Y., Gao, W., Ni, W., Zhang, S., Li, Y. et al. (2020). Influence of calcium hydroxide addition on arsenic leaching and solidification/stabilisation behaviour of metallurgical-slag-based green mining fill. Journal of Hazardous Materials, 390(21), 122161. https://doi.org/10.1016/j.jhazmat.2020.122161 [Google Scholar] [PubMed] [CrossRef]
9. Qi, C., Chen, Q., Dong, X., Zhang, Q., Yaseen, Z. M. (2020). Pressure drops of fresh cemented paste backfills through coupled test loop experiments and machine learning techniques. Powder Technology, 361, 748–758. https://doi.org/10.1016/j.powtec.2019.11.046 [Google Scholar] [CrossRef]
10. Qi, C., Guo, L., Ly, H., Le, H. V., Pham, B. T. (2021). Improving pressure drops estimation of fresh cemented paste backfill slurry using a hybrid machine learning method. Minerals Engineering, 163(2), 106790. https://doi.org/10.1016/j.mineng.2021.106790 [Google Scholar] [CrossRef]
11. Zhang, Q., Hu, G., Wang, X. (2008). Hydraulic calculation of gravity transportation pipeline system for backfill slurry. Journal of Central South University of Technology, 15(5), 645–649. https://doi.org/10.1007/s11771-008-0120-x [Google Scholar] [CrossRef]
12. Xu, C., Ni, W., Li, K., Zhang, S., Li, Y. et al. (2019). Hydration mechanism and orthogonal optimisation of mix proportion for steel slag–slag-based clinker-free prefabricated concrete. Construction and Building Materials, 228, 117036. https://doi.org/10.1016/j.conbuildmat.2019.117036 [Google Scholar] [CrossRef]
13. Wang, C., Li, G., Gao, A., Shi, F., Lu, Z. et al. (2018). Optimal pre-conditioning and support designs of floor heave in deep roadways. Geomechanics and Engineering, 14, 429–437. https://doi.org/10.12989/gae.2018.14.5.429 [Google Scholar] [CrossRef]
14. Qi, C., Fourie, A., Chen, Q. (2018). Neural network and particle swarm optimization for predicting the unconfined compressive strength of cemented paste backfill. Construction and Building Materials, 159(1), 473–478. https://doi.org/10.1016/j.conbuildmat.2017.11.006 [Google Scholar] [CrossRef]
15. Zhao, S., Sui, Q., Cao, C., Wang, X., Wang, C. et al. (2021). Mechanical model of lateral fracture for the overlying hard rock strata along coal mine goaf. Geomechanics and Engineering, 27, 75–85. https://doi.org/10.12989/gae.2021.27.1.075 [Google Scholar] [CrossRef]
16. Wang, C., Liu, L., Elmo, D., Shi, F., Gao, A. et al. (2018). Improved energy balance theory applied to roadway support design in deep mining. Journal of Geophysics and Engineering, 15(4), 1588–1601. https://doi.org/10.1088/1742-2140/aab3a0 [Google Scholar] [CrossRef]
17. Zhao, X., Zhang, H., Zhu, W. (2014). Fracture evolution around pre-existing cylindrical cavities in brittle rocks under uniaxial compression. Transactions of Nonferrous Metals Society of China, 24(3), 806–815. https://doi.org/10.1016/S1003-6326(14)63129-0 [Google Scholar] [CrossRef]
18. Xue, G., Yilmaz, E., Song, W., Cao, S. (2020). Fiber length effect on strength properties of polypropylene fiber reinforced cemented tailings backfill specimens with different sizes. Construction and Building Materials, 241(9), 118113. https://doi.org/10.1016/j.conbuildmat.2020.118113 [Google Scholar] [CrossRef]
19. Yin, S., Shao, Y., Wu, A., Wang, Y., Chen, X. (2018). Expansion and strength properties of cemented backfill using sulphidic mill tailings. Construction and Building Materials, 165(1), 138–148. https://doi.org/10.1016/j.conbuildmat.2018.01.005 [Google Scholar] [CrossRef]
20. Wu, D., Sun, W., Liu, S., Qu, C. (2021). Effect of microwave heating on thermo-mechanical behavior of cemented tailings backfill. Construction and Building Materials, 266(10), 121180. https://doi.org/10.1016/j.conbuildmat.2020.121180 [Google Scholar] [CrossRef]
21. Liu, B., Gao, Y., Jin, A., Wang, X. (2020). Dynamic characteristics of superfine tailings-blast furnace slag backfill featuring filling surface. Construction and Building Materials, 242(2), 118173. https://doi.org/10.1016/j.conbuildmat.2020.118173 [Google Scholar] [CrossRef]
22. Sun, W., Wang, H., Hou, K. (2018). Control of waste rock-tailings paste backfill for active mining subsidence areas. Journal of Cleaner Production, 171, 567–579. https://doi.org/10.1016/j.jclepro.2017.09.253 [Google Scholar] [CrossRef]
23. Qi, C., Fourie, A. (2019). Cemented paste backfill for mineral tailings management: Review and future perspectives. Minerals Engineering, 144, 106025. https://doi.org/10.1016/j.mineng.2019.106025 [Google Scholar] [CrossRef]
24. Carriço, A., Real, S., Bogas, J. A. (2021). Durability performance of thermoactivated recycled cement concrete. Cement and Concrete Composites, 124, 104270. https://doi.org/10.1016/j.cemconcomp.2021.104270 [Google Scholar] [CrossRef]
25. Al-Shmaisani, S., Kalina, R. D., Ferron, R. D., Juenger, M. C. G. (2022). Critical assessment of rapid methods to qualify supplementary cementitious materials for use in concrete. Cement and Concrete Research, 153, 106709. https://doi.org/10.1016/j.cemconres.2021.106709 [Google Scholar] [CrossRef]
26. Bentz, D. P., Ferraris, C. F., Jones, S. Z., Lootens, D., Zunino, F. (2017). Limestone and silica powder replacements for cement: Early-age performance. Cement and Concrete Composites, 78(7), 43–56. https://doi.org/10.1016/j.cemconcomp.2017.01.001 [Google Scholar] [PubMed] [CrossRef]
27. Li, J., Zhang, S., Wang, Q., Ni, W., Li, K. et al. (2020). Feasibility of using fly ash-slag-based binder for mine backfilling and its associated leaching risks. Journal of Hazardous Materials, 400, 123191. https://doi.org/10.1016/j.jhazmat.2020.123191 [Google Scholar] [PubMed] [CrossRef]
28. Kansal, C. M., Goyal, R. (2021). Effect of nano silica, silica fume and steel slag on concrete properties. Materials Today: Proceedings, 45(59), 4535–4540. https://doi.org/10.1016/j.matpr.2020.12.1162 [Google Scholar] [CrossRef]
29. Ali-Boucetta, T., Behim, M., Cassagnabere, F., Mouret, M., Ayat, A. et al. (2021) Durability of self-compacting concrete containing waste bottle glass and granulated slag. Construction and Building Materials, 270, 121133. https://doi.org/10.1016/j.conbuildmat.2020.121133 [Google Scholar] [CrossRef]
30. Yousef, E. A., Mouhcine, B. A., Mounir, Z., Adil, H. A. (2022). Prediction of compressive strength of self-compacting concrete using four machine learning technics. Materials Today: Proceedings, 57(2), 859–866. https://doi.org/10.1016/j.matpr.2022.02.487 [Google Scholar] [CrossRef]
31. Ashraf, M., Iqbal, M. F., Rauf, M., Ashraf, M. U., Ulhaq, A. et al. (2022). Developing a sustainable concrete incorporating bentonite clay and silica fume: Mechanical and durability performance. Journal of Cleaner Production, 337(5), 130315. https://doi.org/10.1016/j.jclepro.2021.130315 [Google Scholar] [CrossRef]
32. Naseri, H., Jahanbakhsh, H., Hosseini, P., Moghadas Nejad, F. (2020). Designing sustainable concrete mixture by developing a new machine learning technique. Journal of Cleaner Production, 258, 120578. https://doi.org/10.1016/j.jclepro.2020.120578 [Google Scholar] [CrossRef]
33. Abuodeh, O. R., Abdalla, J. A., Hawileh, R. A. (2020). Assessment of compressive strength of Ultra-high performance concrete using deep machine learning techniques. Applied Soft Computing, 95(2), 106552. https://doi.org/10.1016/j.asoc.2020.106552 [Google Scholar] [CrossRef]
34. Nilsen, V., Pham, L. T., Hibbard, M., Klager, A., Cramer, S. M. et al. (2019). Prediction of concrete coefficient of thermal expansion and other properties using machine learning. Construction and Building Materials, 220, 587–595. https://doi.org/10.1016/j.conbuildmat.2019.05.006 [Google Scholar] [CrossRef]
35. Liu, T., Wang, Z., Zeng, J., Wang, J. (2021). Machine-learning-based models to predict shear transfer strength of concrete joints. Engineering Structures, 249(2), 113253. https://doi.org/10.1016/j.engstruct.2021.113253 [Google Scholar] [CrossRef]
36. Song, H., Ahmad, A., Farooq, F., Ostrowski, K. A., Maślak, M. et al. (2021). Predicting the compressive strength of concrete with fly ash admixture using machine learning algorithms. Construction and Building Materials, 308, 125021. https://doi.org/10.1016/j.conbuildmat.2021.125021 [Google Scholar] [CrossRef]
37. Ahmadi-Nedushan, B. (2012). An optimized instance based learning algorithm for estimation of compressive strength of concrete. Engineering Applications of Artificial Intelligence, 25(5), 1073–1081. https://doi.org/10.1016/j.engappai.2012.01.012 [Google Scholar] [CrossRef]
38. Abd El-Hay, S. S., El Sheikh, R., Gouda, A. A., Ali, M., El-Sayed, H. M. (2022). Simultaneous estimation of pantoprazole and piroxicam by HPLC: Response surface methodology approach. Microchemical Journal, 176(4), 107247. https://doi.org/10.1016/j.microc.2022.107247 [Google Scholar] [CrossRef]
39. Umar, Z. D., Musa, A., Yunusa, Y. R. (2022). Optimization of diesel biodegrading conditions using response surface methodology based on central composite design. Polycyclic Aromatic Compounds, 166(5), 106216. https://doi.org/10.1080/10406638.2020.1823859 [Google Scholar] [CrossRef]
40. Huang, G., Ding, X., Zhou, H. (2010). Optimization method based extreme learning machine for classification. Neurocomputing, 74(1–3), 155–163. https://doi.org/10.1016/j.neucom.2010.02.019 [Google Scholar] [CrossRef]
41. Ganesan, A., Santhanam, S. M. (2022). A novel feature descriptor based coral image classification using extreme learning machine with ameliorated chimp optimization algorithm. Ecological Informatics, 68(3–4), 101527. https://doi.org/10.1016/j.ecoinf.2021.101527 [Google Scholar] [CrossRef]
42. Ding, L., Zhang, X., Wu, D., Liu, M. (2021). Application of an extreme learning machine network with particle swarm optimization in syndrome classification of primary liver cancer. Journal of Integrative Medicine, 19(5), 395–407. https://doi.org/10.1016/j.joim.2021.08.001 [Google Scholar] [PubMed] [CrossRef]
43. Bhagat, S. K., Tiyasha, T., Kumar, A., Malik, T., Jawad, A. H. et al. (2022). Integrative artificial intelligence models for Australian coastal sediment lead prediction: An investigation of in-situ measurements and meteorological parameters effects. Journal of Environmental Management, 309(5), 114711. https://doi.org/10.1016/j.jenvman.2022.114711 [Google Scholar] [PubMed] [CrossRef]
44. Qi, C., Chen, Q., Fourie, A., Tang, X., Zhang, Q. et al. (2019). Constitutive modelling of cemented paste backfill: A data-mining approach. Construction and Building Materials, 197(1), 262–270. https://doi.org/10.1016/j.conbuildmat.2018.11.142 [Google Scholar] [CrossRef]
45. Mousavi, S. S., Guizani, L., Bhojaraju, C., Ouellet-Plamondon, C. (2021). The effect of air-entraining admixture and superabsorbent polymer on bond behaviour of steel rebar in pre-cracked and self-healed concrete. Construction and Building Materials, 281(9), 122568. https://doi.org/10.1016/j.conbuildmat.2021.122568 [Google Scholar] [CrossRef]
46. Ameri, F., de Brito, J., Madhkhan, M., Taheri, R. A. (2020). Steel fibre-reinforced high-strength concrete incorporating copper slag: Mechanical, gamma-ray shielding, impact resistance, and microstructural characteristics. Journal of Building Engineering, 29, 101118. https://doi.org/10.1016/j.jobe.2019.101118 [Google Scholar] [CrossRef]
47. Li, E., Zhou, J., Shi, X., Jahed Armaghani, D., Yu, Z. et al. (2021). Developing a hybrid model of salp swarm algorithm-based support vector machine to predict the strength of fiber-reinforced cemented paste backfill. Engineering with Computers, 37(4), 3519–3540. https://doi.org/10.1007/s00366-020-01014-x [Google Scholar] [CrossRef]
48. Yu, Z., Shi, X., Chen, X., Zhou, J., Qi, C. et al. (2021). Artificial intelligence model for studying unconfined compressive performance of fiber-reinforced cemented paste backfill. Transactions of Nonferrous Metals Society of China, 31(4), 1087–1102. https://doi.org/10.1016/S1003-6326(21)65563-2 [Google Scholar] [CrossRef]
49. Saidani, I., Ouni, A., Mkaouer, M. W. (2022). Improving the prediction of continuous integration build failures using deep learning. Automated Software Engineering, 29(1), 21. https://doi.org/10.1007/s10515-021-00319-5 [Google Scholar] [CrossRef]
Cite This Article
 Copyright © 2023 The Author(s). Published by Tech Science Press.
This work is licensed under a Creative Commons Attribution 4.0 International License , which permits unrestricted use, distribution, and reproduction in any medium, provided the original work is properly cited.
 Downloads
 Citation Tools