
 Submit a Paper
 Propose a Special lssue
 Open Access
ARTICLE
Synthesis and Application of Activated Charcoal from Indonesian Sugar Palm Bunches (Arenga longipes) as a Potential Absorbent for Heavy Metals
1 Laboratory of Forest Product Technology, Faculty of Forestry, Universitas Sumatera Utara, Kampus 2 USU-Bekala, Deli Serdang, 20353, Indonesia
2 Research Center for Applied Botany, National Research and Innovation Agency, Jalan Raya Jakarta-Bogor KM 46, Cibinong, 16911, Indonesia
3 Research Center for Biomass and Bioproduct, National Research and Innovation Agency, Jalan Raya Jakarta-Bogor KM 46, Cibinong, 16911, Indonesia
4 Faculty of Forest Industry, University of Forestry, Sofia, 1797, Bulgaria
5 Department of Furniture Design, Faculty of Forestry and Wood Technology, Poznan University of Life Sciences, Poznan, 60627, Poland
6 Department of Wood Industry, Faculty of Applied Sciences, Universiti Teknologi MARA (UiTM), Cawangan Pahang, Kampus Jengka, Kuantan, 26400, Malaysia
7 Faculty of Chemical and Energy Engineering, Universiti Teknologi Malaysia, Johor Bahru, Johor, 81310, Malaysia
* Corresponding Author: Luthfi Hakim. Email:
(This article belongs to the Special Issue: Advances in Eco-friendly Wood-Based Composites: Design, Manufacturing, Properties and Applications)
Journal of Renewable Materials 2025, 13(12), 2355-2373. https://doi.org/10.32604/jrm.2025.02025-0078
Received 06 April 2025; Accepted 31 July 2025; Issue published 23 December 2025
 View Full Text
 Download PDF
Abstract
Activated charcoals were synthesized from sugar palm bunches (SPB) of the native tree of Arenga longipes in Indonesia. The synthesized activated charcoal (AC) was characterized, and utilized as an absorbent for heavy metals (lead/Pb and copper/Cu) through thermal activation. The synthesis of AC was accomplished through furnace activation at temperatures of 500°C, 600°C, 700°C, and 800°C. Acid chlorides were blended with the SPB-AC samples at 5% impregnation level and subsequently subjected to washing for activation, resulting in the elimination of volatile substances and ash content, which facilitates the development of a porous structure in the activated charcoal. The proximate analysis results indicated a reduction in weight and moisture content with an increase in activation temperature. The C-O, C=C, O-H stretching chains were not visible in the SPB-AC, indicating that the chains were broken after activation. The treatments at 600°C and 700°C exhibited superior thermal stability relative to the others. Moreover, there was a notable reduction in the signal strength of low-crystallinity amorphous carbon, indicating that the high-temperature treatment substantially altered the structural characteristics of the crystal. The SPB-AC produced at 700°C exhibited a primarily microporous architecture, characterized by a maximal surface area, reduced total pore volume, and small particle size. In conclusion, elevating the activation temperature to 700°C leads to notable improvement in the adsorption of Pb (91.61%) and Cu (95.19%) metals.Keywords
Clean air and water are fundamental necessities for human health in the modern world. Nonetheless, water quality frequently deteriorates in city regions because of contamination from dust and heavy metal contaminants, including lead (Pb), copper (Cu), zinc (Zn), iron (Fe), and magnesium (Mg) [1]. This is attributable mainly to the heightened levels of industrial activities, transportation, and energy production in these regions [2,3]. Numerous studies indicate that the industrial and transportation sectors are the primary sources of urban air, water, and particulate pollution, as emissions result from the combustion of fossil fuels containing lead and iron [4,5]. This signifies the necessity of designing alternate methods to address this issue.
Water contamination resulting from heavy metals, such as lead (Pb) and copper (Cu), has incurred significant detrimental effects on ecosystems and human health. The presence of lead (Pb) can induce toxicity, respiratory disorders, and cancer [6]. Recent reports indicate that more than 3000 cities globally are impacted by water contamination, primarily owing to pollutants detrimental to human health. Lead (Pb) and copper (Cu) are extremely carcinogenic and can induce dysfunction in various organs, including the lungs, kidneys, brain, liver, reproductive system, and nervous system. Consequently, the elimination of heavy metals is imperative because of their negative effects on the environment and human health. Lead adversely affects terrestrial biological systems, particularly impacting insects and fauna residing in forested areas [7].
Various treatment procedures, including coagulation, flocculation, biodegradation, adsorption, and oxidation, have been devised to mitigate water pollution by decreasing pollutant levels [8]. Nonetheless, none of these techniques achieve 100% efficiency, with adsorption regarded as the most effective among them [9,10]. Adsorption offers notable advantages, including low initial expenses and straightforward recovery of both adsorbent and adsorbate components [11,12]. Various adsorbents are frequently employed in this process, with activated charcoal (AC) being favored for its extensive surface area and economical raw ingredients. Plant waste materials provide an economical source for the production of activated carbon, which effectively eliminates various organic and inorganic contaminants, including lead and copper [13].
Previous research has indicated that activated carbon (AC) can be generated via numerous activation techniques, including both physical and chemical processes. The most straightforward physical activation involves high temperatures, which increase the surface area and porosity of the material, resulting in an improved adsorption rate [14]. Numerous studies frequently employ CO2 and other gases in the process; however, there is scant information on the utilization of activation at elevated temperatures without the incorporation of gases.
Consistent with these findings, the Indonesian sugar palm (Arenga longipes) is a species commonly located throughout the Southeast Asia, notably in Indonesia, Malaysia, Thailand, Vietnam, and other global locations [15]. The plant offers numerous advantages, including the use of sap as a raw source for sugar and traditional beverages, wood for buildings (flooring), and fruit as a carbohydrate-rich food element [16,17]. The fundamental woody components of the plant are sugar palm bunches (SPB), measuring 50–120 cm in length and 1–4 cm in diameter, with a composition of 71.8% holocellulose and 23.5% lignin [18]. Currently, there is a dearth of research on the use of sugar palm bunches as activated carbon, especially concerning the analysis of the surface properties of activated carbon obtained from sugar palm bunches. This work addresses the deficiency in understanding the surface characteristics of activated carbon and their influence on heavy metal adsorption capacity. This work aims to synthesize, characterize and utilize activated charcoal from Indonesian sugar palm bark as an adsorbent for lead and copper removal through a high-temperature activation process.
2.1 Raw Material Preparation and Carbonization
This study utilized sugar palm bunches (SPB) obtained from community plantations maintained under agroforestry in North Sumatera, Indonesia. SPBs were collected from sugar palm tree approximately 8–10 years old and manually harvested at a height of 5 cm from the main stem. The bunches were severed to a length of approximately 4–5 cm and thereafter air-dried under sunlight for two weeks until a moisture content of 7%–9% was achieved. The pyrolysis procedure was used to carbonize the bunches without oxygen at an increasing rate of 15°C per minute until it reached a maximum temperature of 350°C and maintained for 3 h. Furthermore, room temperature conditioning was carried out for 8 h until the charcoal reached room temperature. Additionally, the powdered charcoals were generated and sieved through a 100 mesh before being activated at elevated temperatures. Elevated treatment activation was performed by heating to temperatures of 500°C, 600°C, 700°C, and 800°C, which were maintained at each temperature for 1 h. The activated charcoal (AC) was washed with 5% HCl and filtered to effectively remove residual ash and contaminants from the sample surface.
2.2 Weight Loss and Proximate Analysis
The determination of sample weight alterations postactivation involves contrasting the quantity of sample diminished after activation (W2) with the initial weight of the sample (W1). Weight loss calculation was performed via Eq. (1).
The moisture content was assessed in accordance with the ASTM D3173-03 standard [19]. The porcelain crucible contained 1 g of activated charcoal (a), which was subsequently heated in an oven at 103 ± 2°C for 60 min. The conditioning process took place in a desiccator for 15 min, with the sample being weighed multiple times until a stable weight was reached (b). The moisture content of SPB-AC was determined through the application of Eq. (2).
The ash content was assessed following the ASTM D3174-03 standard [20]. One gram of activated charcoal was placed in a porcelain crucible and heated at 900°C for four hours in a furnace. The measurement of boiler ash (b) facilitates the analysis of its ash composition. The ash content of SPB-AC was determined through the application of Eq. (3):
The determination of volatile matter was conducted in accordance with the ASTM D3175-07 standard [21]. One gram of activated charcoal (W1) was heated at 950°C for 7 min, followed by a conditioning period of ten minutes in a desiccator, after which it was weighed (W2). The weight reduction of SPB-AC was determined through the application of Eq. (4). Additionally, the determination of volatile matter in SPB-AC was conducted via Eq. (5):
In this context, W1 represents the initial weight, W2 represents the weight loss after the furnace treatment, W3 represents the weight loss, and W4 represents the moisture content of the sample.
The determination of the fixed carbon content was conducted in accordance with ASTM 3172-03 [22]. The determination of the fixed carbon content is based on a complete reduction in the sum of the moisture content, ash content, and volatile matter. The determination of fixed carbon in SPB-AC is conducted via Eq. (6).
2.3 Fourier Transform Infrared Analysis
The SPB charcoal and AC samples underwent a sequence of treatments comprising washing with 5% HCl, conditioning in room temperature water for 1 h, drying at 35 ± 5°C for 12 h, and grinding into a powder with a 100-mesh size. FTIR spectroscopy was conducted at around 25°C, utilizing an FTIR-4200 spectrophotometer (8201PC-Shimadzu, Tokyo, Japan) and employing the KBr disc method. The spectroscopy resolution established in this study was 12 cm−1. The aim of the experiment was to determine the particular functional groups linked to the observed absorbance bands.
2.4 Thermogravimetric Analysis (TGA)
The thermal stability and mass change rate of the modified SPB charcoal and AC were examined through thermogravimetric analysis via an Ekstar SIII-Type 7300 instrument (Hitachi, Tokyo, Japan). For this investigation, materials weighing 10 mg were incrementally heated in an alumina crucible, beginning at ambient temperature and reaching 600°C at a rate of 10°C per minute. Nitrogen was constantly led into the apparatus at a flow rate of 30 mL per minute throughout the experiment.
2.5 X-Ray Diffraction Analysis (XRD)
The crystallinity index (Cr-I) of SPB-AC was assessed by analyzing the areas of crystalline and amorphous cellulose. The crystalline cellulose was identified at a 2θ peak in the reflection plane position (I002), with a maximum intensity between 22.5° and 23°. In contrast, amorphous cellulose (Iam), which lies between 18° and 19°, was observed at the minimum-intensity position. Additionally, the diffraction pattern was collected at ambient temperature (ranging from 20°C to 22°C) via radiation produced by a Maximax X-ray Diffractometer-7000 (Shimadzu, Kyoto, Japan). The measurements were performed at 40 kV and 20 mA, utilizing a detector set within a 2θ range from 5° to 70° at a scanning speed of 2°/min. The percentage crystallinity index (% CI) of the cellulose was subsequently determined via the formula shown in Eq. (7) [23].
The maximal peak intensity was observed at a 2θ angle of approximately 22° to 23°, designated I002, whereas the minimum peak intensity, corresponding to the amorphous region, was noted at a 2θ angle of approximately 18° to 19°, referred to as Iam.
The specific surface area, pore volume, and pore size distribution of the AC were assessed from the adsorption isotherms via the BET surface area quanta chrome nova 4200e instrument through BET methods [24]. Next, the cross-sectional area of a nitrogen molecule was 0.162 nm. This study utilized the Dubinin–Radushkevich (DR) equation to determine the micropore volume. The total pore volume was determined by measuring the liquid volume of the adsorbate (N2) at a relative pressure of 0.985. Moreover, the pore size distribution was assessed via the BJH model [25]. The average pore diameter was determined by multiplying the total pore volume by four and dividing that by the BET surface area.
2.7 Surface Morphology Analysis and Scanning Electron Microscopy-Energy Dispersive X-Ray Spectroscopy (SEM-EDX)
The samples were subjected to morphological studies by scanning electron microscopy (SEM, Leica Cambridge S-360, Wetzlar, Germany). The samples were affixed to an SEM holder via double-sided carbon adhesive tabs, which were electrically conductive to protect the surface of the samples during exposure to the electron beam. The samples were subsequently coated with a 20 nm thick layer of gold via a Polaron Equipment Limited model E500 (Hertfordshire, UK). The equipment was configured at a voltage of 1.2 kV (10 mA), and a vacuum of 20 Pa was maintained for 10 min.
2.8 Atomic Absorption Spectrophotometry (AAS) Analysis
Absorption analysis was conducted utilizing atomic absorption spectroscopy (AAS) (Shimadzu AAS-9000, Tokyo, Japan). The capacity absorption analysis was performed using Langmuir equations. The experiment adheres to the methodology established by Piccirillo et al. [26]. The placement of 0.010 g of each SPB-activated charcoal powder into 5 mL of a solution containing lead (Pb(II)) or Cuprum (Cu), within a 100 mL Erlenmeyer flask. The mixture was stirred at 70 rpm and maintained at 30°C. Upon completion of the experiment, the solution underwent centrifugation at 15,000 rpm to effectively separate the solids from the supernatant. The supernatants underwent sequential analysis to ascertain the final concentration of the pollutants. The maximum adsorption capacity of each material was determined by dissolving various concentrations of pollutants over a consistent duration of 5 h. The influence of pH on adsorption was examined through multiple experiments by setting the pH to 8, utilizing a Tris-HCl buffer at a concentration of 10 mM. Further experiments were carried out to investigate the desorption of pollutants from activated charcoal powder, along with the sorption kinetics. At the conclusion of the sorption test lasting 5 h, the activated charcoal powder was extracted from the solution and allowed to dry at room temperature. The powder was subsequently resuspended in 5 mL of water and permitted to stir at 30°C for a duration of 5 h. Subsequently, the solution was isolated from the solid and characterized as outlined in the previous experiments. In the kinetic studies, solutions with predetermined concentrations of pollutants (2.1 g/L Pb (II) and Cu) were utilized, and various contact durations were examined ranging from 20 min to 5 h.
According to the adsorption isotherm, temperature and adsorbate concentration determine how much adsorbate the adsorbent can absorb. Solubility, molecular weight, molecular structure, polarity, and hydrocarbon saturation are among the adsorbate’s properties. The adsorption properties of SPB-activated carbon employed in the treatment of water and wastewater are typically demonstrated by the Langmuir isoterm formulas (Eq. (8)).
where Ce denotes the concentration of the pollutant in solution at equilibrium (mg/L), while qe signifies the quantity of pollutant adsorbed per unit mass of material at equilibrium (mg/g). In the Langmuir model, Xm represents the maximum adsorption capacity of the material for a certain pollutant (mg/g), whereas K is a parameter associated with the affinity between the pollutant and the adsorbent material. Xm can be determined by the linear regression of Ce/qe against Ce.
3.1 Weight Loss and Proximate Analysis
The reduction in mass following the heating of charcoal is illustrated in Table 1. The initiation of elevated temperatures resulted in a reduction in the mass of the charcoal. The results of this study demonstrated a relationship between elevated heating temperatures and weight reduction. Increasing the temperature during carbon activation treatment can lead to a decrease in weight by reducing the oxygen content and improving the porosity of the material [27]. Simultaneously, under conditions of elevated carbonization temperature, the surface may experience accelerated deterioration, leading to an increase in the outer surface. The reduction in weight observed during the high-temperature heating process correspondingly resulted in a decrease in moisture content. Furthermore, the moisture content decreased during the heating process at 500°C; however, at 600°C, 700°C, and 800°C, there was no significant change in the loss of moisture content. The reduction in moisture content at 500°C indicates that residual water remained following the carbonization process. Nonetheless, at temperatures ranging from 600°C to 800°C, no moisture content was observed. Zhang et al. [28] reported that water molecules may completely disappear when subjected to a temperature of 500°C. Any additional increase in temperature may trigger the disintegration phase of the material.
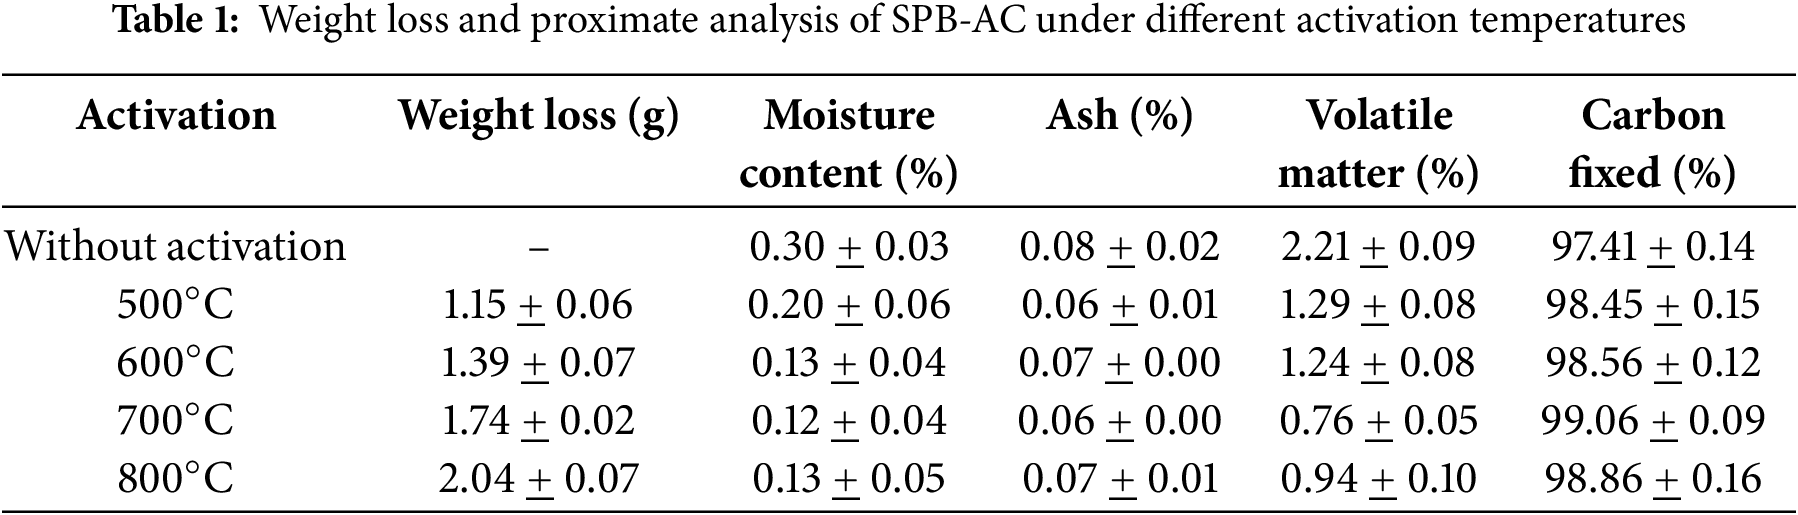
No notable variations were observed in the changes in ash content throughout the heat treatments. Table 1 also shows that the inorganic components in both materials exhibited a high degree of consistency, even when exposed to different temperatures. During the activation process, the ash content exhibited a slight beneficial effect. The entire ash present in the raw material was incorporated into the activated carbon (AC), leading to a reduction in the fixed carbon content. The presence of inorganic compounds, including K, Na, Ca, Mg, Fe, Al, P, and S, resulted in a reduction in the adsorption capacity of the activated carbon. Furthermore, the presence of ash in activated carbon blocked specific openings, and removing the ash could create additional pores, especially micropores. The application of heat at temperatures of 500°C and 700°C led to a decrease in ash content in comparison to the ash content of the samples subjected to the treatments conducted at 600°C and 800°C. This phenomenon was linked to the occurrence of additional combustion at temperatures of 600°C and 800°C, exceeding those that occurred at 500°C and 700°C. As a result, a considerable quantity of ash content was generated.
Furthermore, Table 1 clearly shows that increasing the carbonization temperature from no activation treatment to 700°C resulted in a reduction in the volatile matter content from 2.21% to 0.76%. Ge et al. [29] reported that the amount of volatile organic compounds was affected by the carbonization temperature. Raising this temperature may result in a greater quantity of wasted materials and a reduction in the volatile matter content. The presence of volatile compounds adhered to carbon can influence carbon absorption. As these compounds increase, more chemicals covering the carbon evaporate, leading to the opening of previously sealed carbon pore surfaces and enhancing the absorption capacity. Moreover, at 600°C, the concentration of volatile compounds increased as a result of the onset of decomposition. An increase in temperature from 700°C to 800°C resulted in a higher activation energy, which led to a slight increase in volatile matter and an increase in the carbonization process. Additionally, Table 1 shows that increasing the carbonization temperature from no activation treatment to 700°C resulted in an increase in the fixed carbon content from 97.41% to 99.06%. The fixed carbon content of activated carbon is significantly affected by the carbon content of the raw materials utilized, alongside the influences of moisture content, ash content, and volatile matter [30]. Nonetheless, various additional factors affect the level of AC, including the activation method, activation temperature, cellulose content, and lignin present in the raw material.
3.2 Functional Groups in SPB-AC
The FTIR spectra for evaluating activated carbon from both untreated sugar palm bunches (SPBs) and those subjected to high-temperature treatments (500°C, 600°C, 700°C, and 800°C) are presented in Fig. 1. A broad band was observed between 3615 and 3861 cm−1 in the sample of nonactivated SPB charcoal. This suggests the presence of O-H stretching, which is associated with water molecules, alcohols, and carboxylic acids on the surface of SPB charcoal without activation. The disappearance of this peak following the activation process at elevated temperatures suggests that O-H bonds were disrupted, resulting in the elimination of water, alcohol, and carboxylic acid molecules from the surface of activated carbon [31]. All samples, regardless of whether they underwent activation or high-temperature treatment, exhibited stretching of the -CH aldehyde group, which was identified as a reducing group derived from the carbohydrate structure in the activated charcoal at a wavelength of 2661 cm−1. The observation of O=C=O stretching at a wavelength of 2325 cm−1 was particularly noteworthy, as it suggested the occurrence of oxygen removal, which intensified with increasing activation temperature. The peak observed at 2117 cm−1 is noteworthy, as it correlates with the stretching of the aromatic C=C bond within the phenyl group [32].
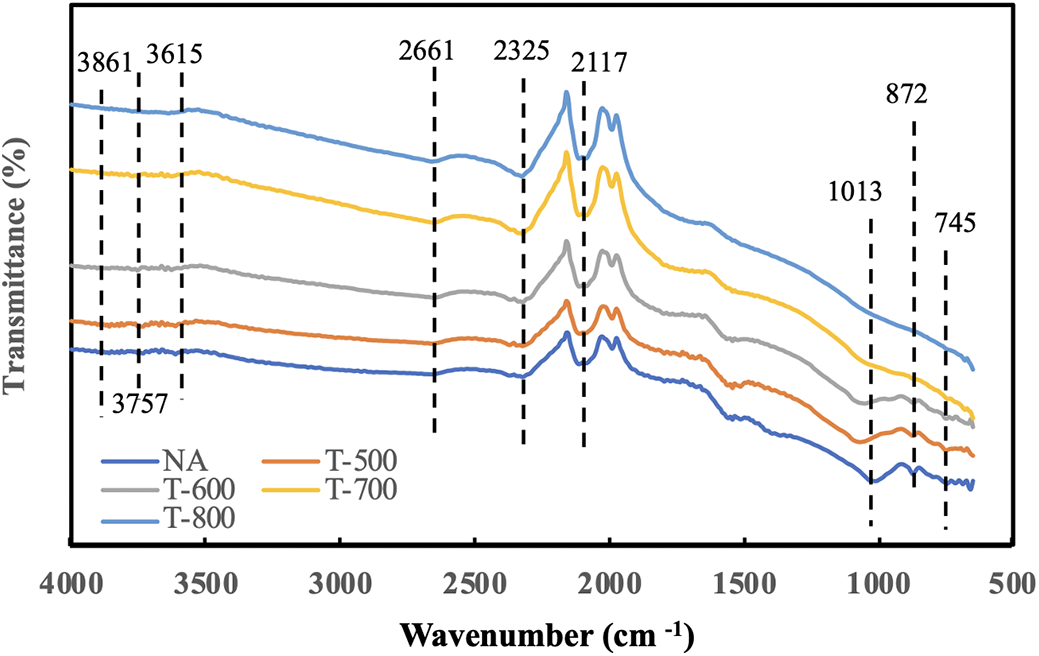
Figure 1: FTIR spectra of SPB activated carbon under different activation temperatures
The untreated samples showed significant stretching of C-O in phenol at a wavelength of 1013 cm−1, which was absent in the high-temperature activation treatment. The interruption of the CO stretching process above 500°C was unforeseen. Intense C=C bending was observed at a wavelength of 872 cm−1 under both nonactivated and activated conditions at 500°C. The application of temperatures exceeding 600°C ceased to yield peaks, suggesting that the elevated temperature may have disrupted the C=C bonds. Similarly, the peak at 745 cm−1 was observed in the nonactivated treatment but was absent in the high-temperature activated treatment. The peak at 745 cm−1 was associated with strong CH bending in the sample, both without activation and at 500°C, and was entirely disrupted at activation temperatures exceeding 600°C.
In the analysis of the spectra of the SPB AC collected prior to and following thermal treatment at 700°C, a significant band at approximately 872 cm−1 was noted. The existence of a band at this location can be attributed solely to methylene groups. Moreover, the detection of a band in the 3000–3100 cm−1 range offered further validation for the hypothesis that this compound is classified as an alkene [33]. In general, for wavelengths ranging from 1500–4000 cm−1, minimal variations were observed among the peaks. However, for wavelengths below 1500 cm−1, the differences among the samples were clearly evident. The observed phenomenon leads to a progressive reduction in the number of oxygen-containing chemical groups as the activation temperature increases, thereby increasing the effectiveness and efficiency of activated carbon absorption.
3.3 Thermal Degradation of SPB-AC
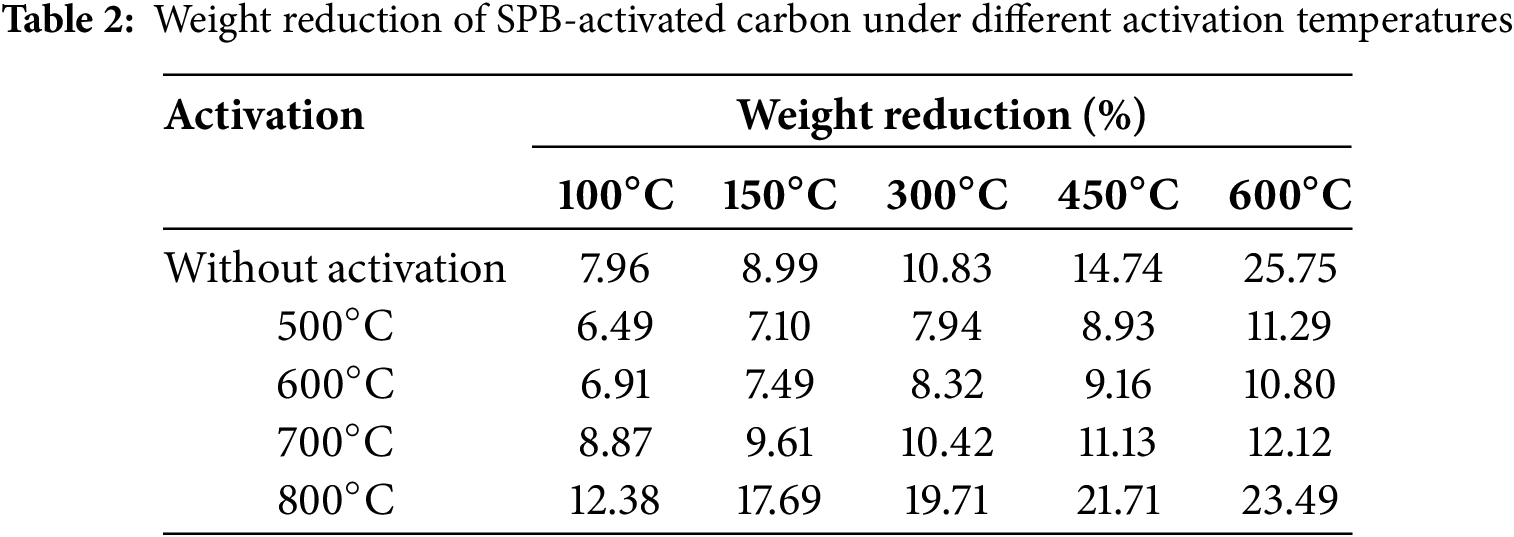
The thermogravimetry graph presented in Fig. 2A illustrates the weight reduction of sugar palm bunch-activated carbon (SPB-AC). The thermal degradation process can be categorized into four distinct phases: water evaporation occurring below 150°C, molecular pyrolysis occurring between 150°C and 260°C, degradation of the majority of physically adsorbed substances from 260°C to 600°C, and degradation of chemically adsorbed pollutants at temperatures exceeding 600°C (Fig. 2B). A report from another study team indicated that temperatures between 40°C and 200°C were linked to the desorption of weakly bound water molecules that had been adsorbed on the adsorbent [34]. At temperatures ranging from 250°C to 350°C, the oxidation and/or decomposition of chemically adsorbed compounds within small pores took place. Consequently, the desorption temperature exhibited minor variations depending on the specific adsorbates involved. Table 2 illustrates the final degradation process of SPB-AC. The data indicate that, compared with the temperature activation treatment, the nonactivation treatment resulted in more rapid degradation between 450°C and 600°C. This phenomenon demonstrated that temperature treatment has the potential to increase the thermal stability of SPB-AC. At treatment temperatures of 500°C and 600°C, the weight reduction observed was not significantly different, indicating that the thermal stability between the two treatments was comparable. de Fatima Salgado et al. [35] reported that heating above 700°C could lead to a significant increase in ash content, which in turn impacts the absorption process. These findings indicated that at 800°C, the degradation of SPB-AC was more significant than that in the other treatments.
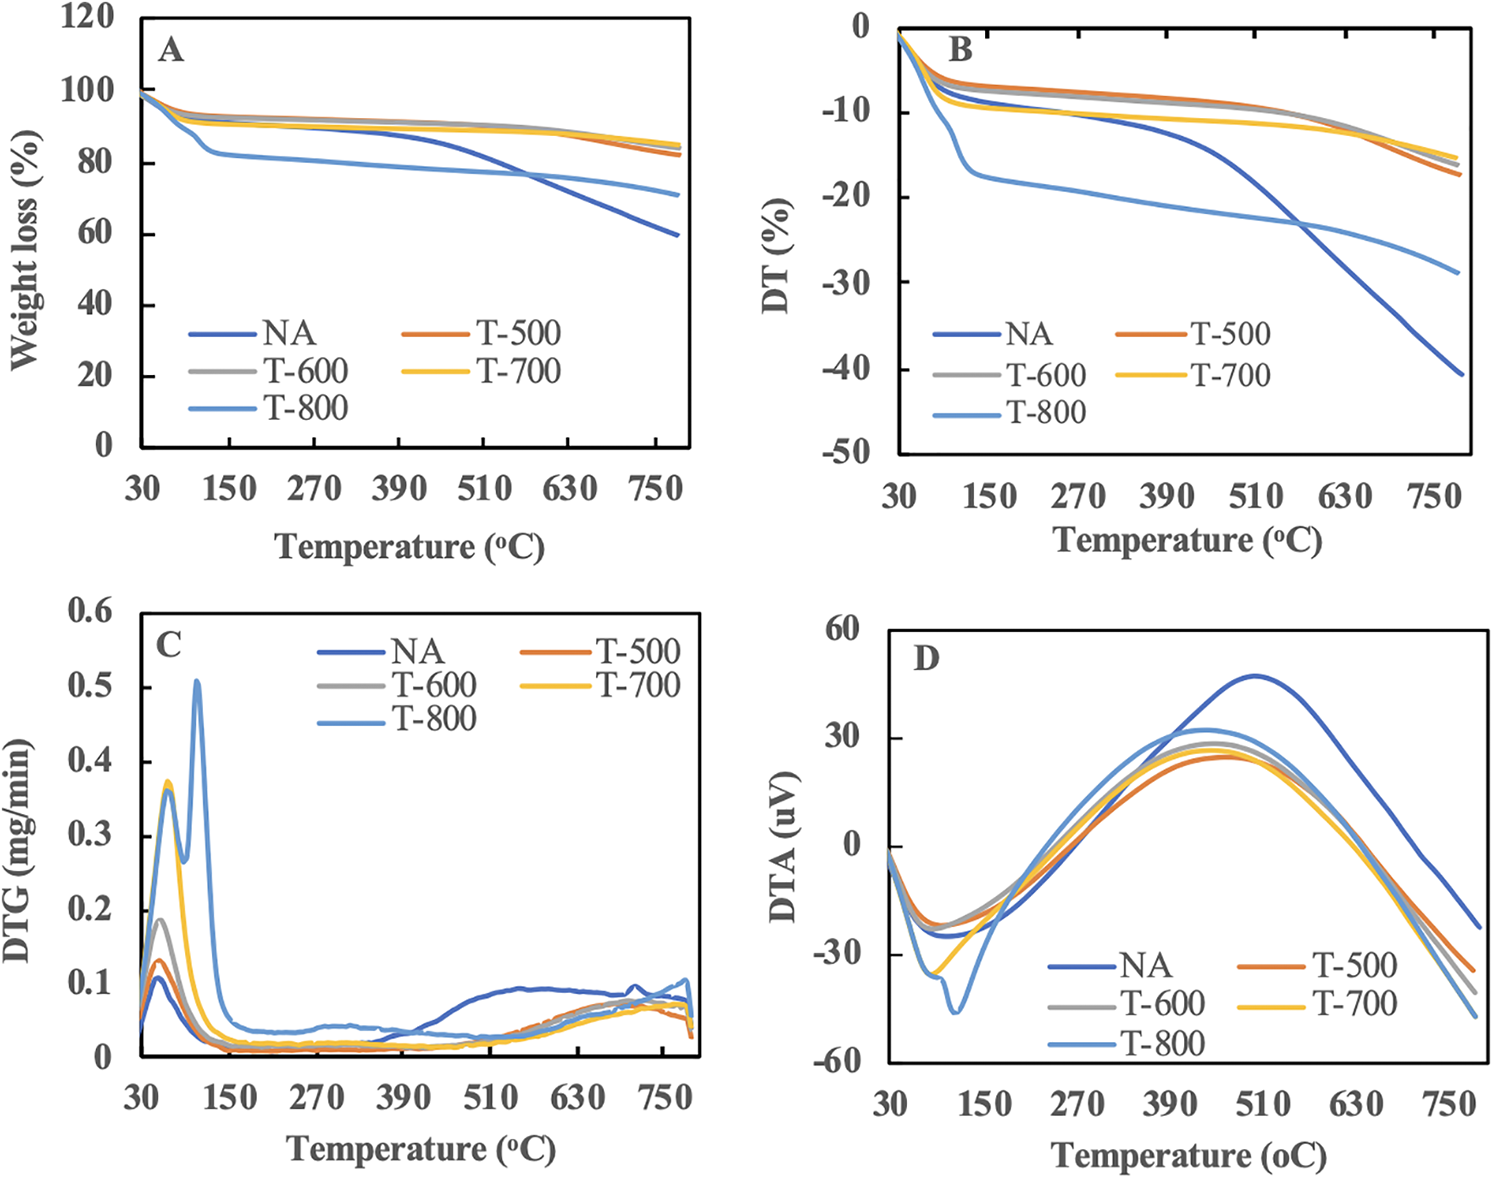
Figure 2: Thermograph of SPB activated carbon under different activation temperatures. (A) Weight loss graph; (B) differential thermal graph; (C) differential thermogravimetry; (D) differential thermal analysis graph
The results presented in Fig. 2C revealed a notable variation in the DTG curve, illustrating the three stages of degradation in SPB-AC. The initial phase occurred within the temperature range of 30°C–150°C, indicating the occurrence of water evaporation along with the release of certain low-molecular-weight materials. The second stage took place at a temperature range of 150°C–400°C, during which minimal degradation was observed, as the material under examination had transformed into charcoal. At this stage, when the material is lignocellulosic, degradation can occur in the cellulose, hemicellulose, lignin, and wax components. In relation to the DTG curve at 600°C, a peak was observed at 260°C. Nonetheless, in the DTG curve corresponding to a thermal treatment at 700°C, a distinct peak was absent. The emission of water vapor or the breakdown of other volatile compounds in the SPB led to this phenomenon. A separate study indicated that the wide peak observed at temperatures exceeding 650°C may result from the decomposition of surface functions [36]. Fig. 2D shows the differential thermal analysis (DTA) of SPB-AC at various temperature activation levels. The endothermic reaction observed without activation treatment took place between 30°C and 150°C, suggesting a greater presence of water molecules than with temperature activation [37]. Additionally, the exothermic reaction took place within the temperature range of 150°C to 450°C.
3.4 Crystallinity Index of SPB-AC
XRD analysis was performed to examine the crystal structure of both nonactivated and activated charcoal, with the findings documented in Fig. 3. The XRD peak of nonactivated charcoal was compared with that of activated charcoal. In all the samples, the XRD diffraction peak at an intensity of I002 at 26.5° confirmed a graphite structure for the carbon material, whereas the peak at 23.1° suggested the presence of amorphous carbon derivatives influenced by silica [38]. The unactivated charcoal exhibited a broad signal with a relatively high intensity at 26.5° but a lower intensity at 39.5°, which corresponds to the overlapping graphite plane. Following high-temperature treatment, there was a notable reduction in the overlap of the graphite layers, suggesting that the carbon graphite structure may have been somewhat compromised by these treatments. Moreover, the findings indicated that the signal intensity from low-crystallinity amorphous carbon diminished, implying that the high-temperature treatment process modified the structural properties of the resulting carbon crystal to a lesser extent.
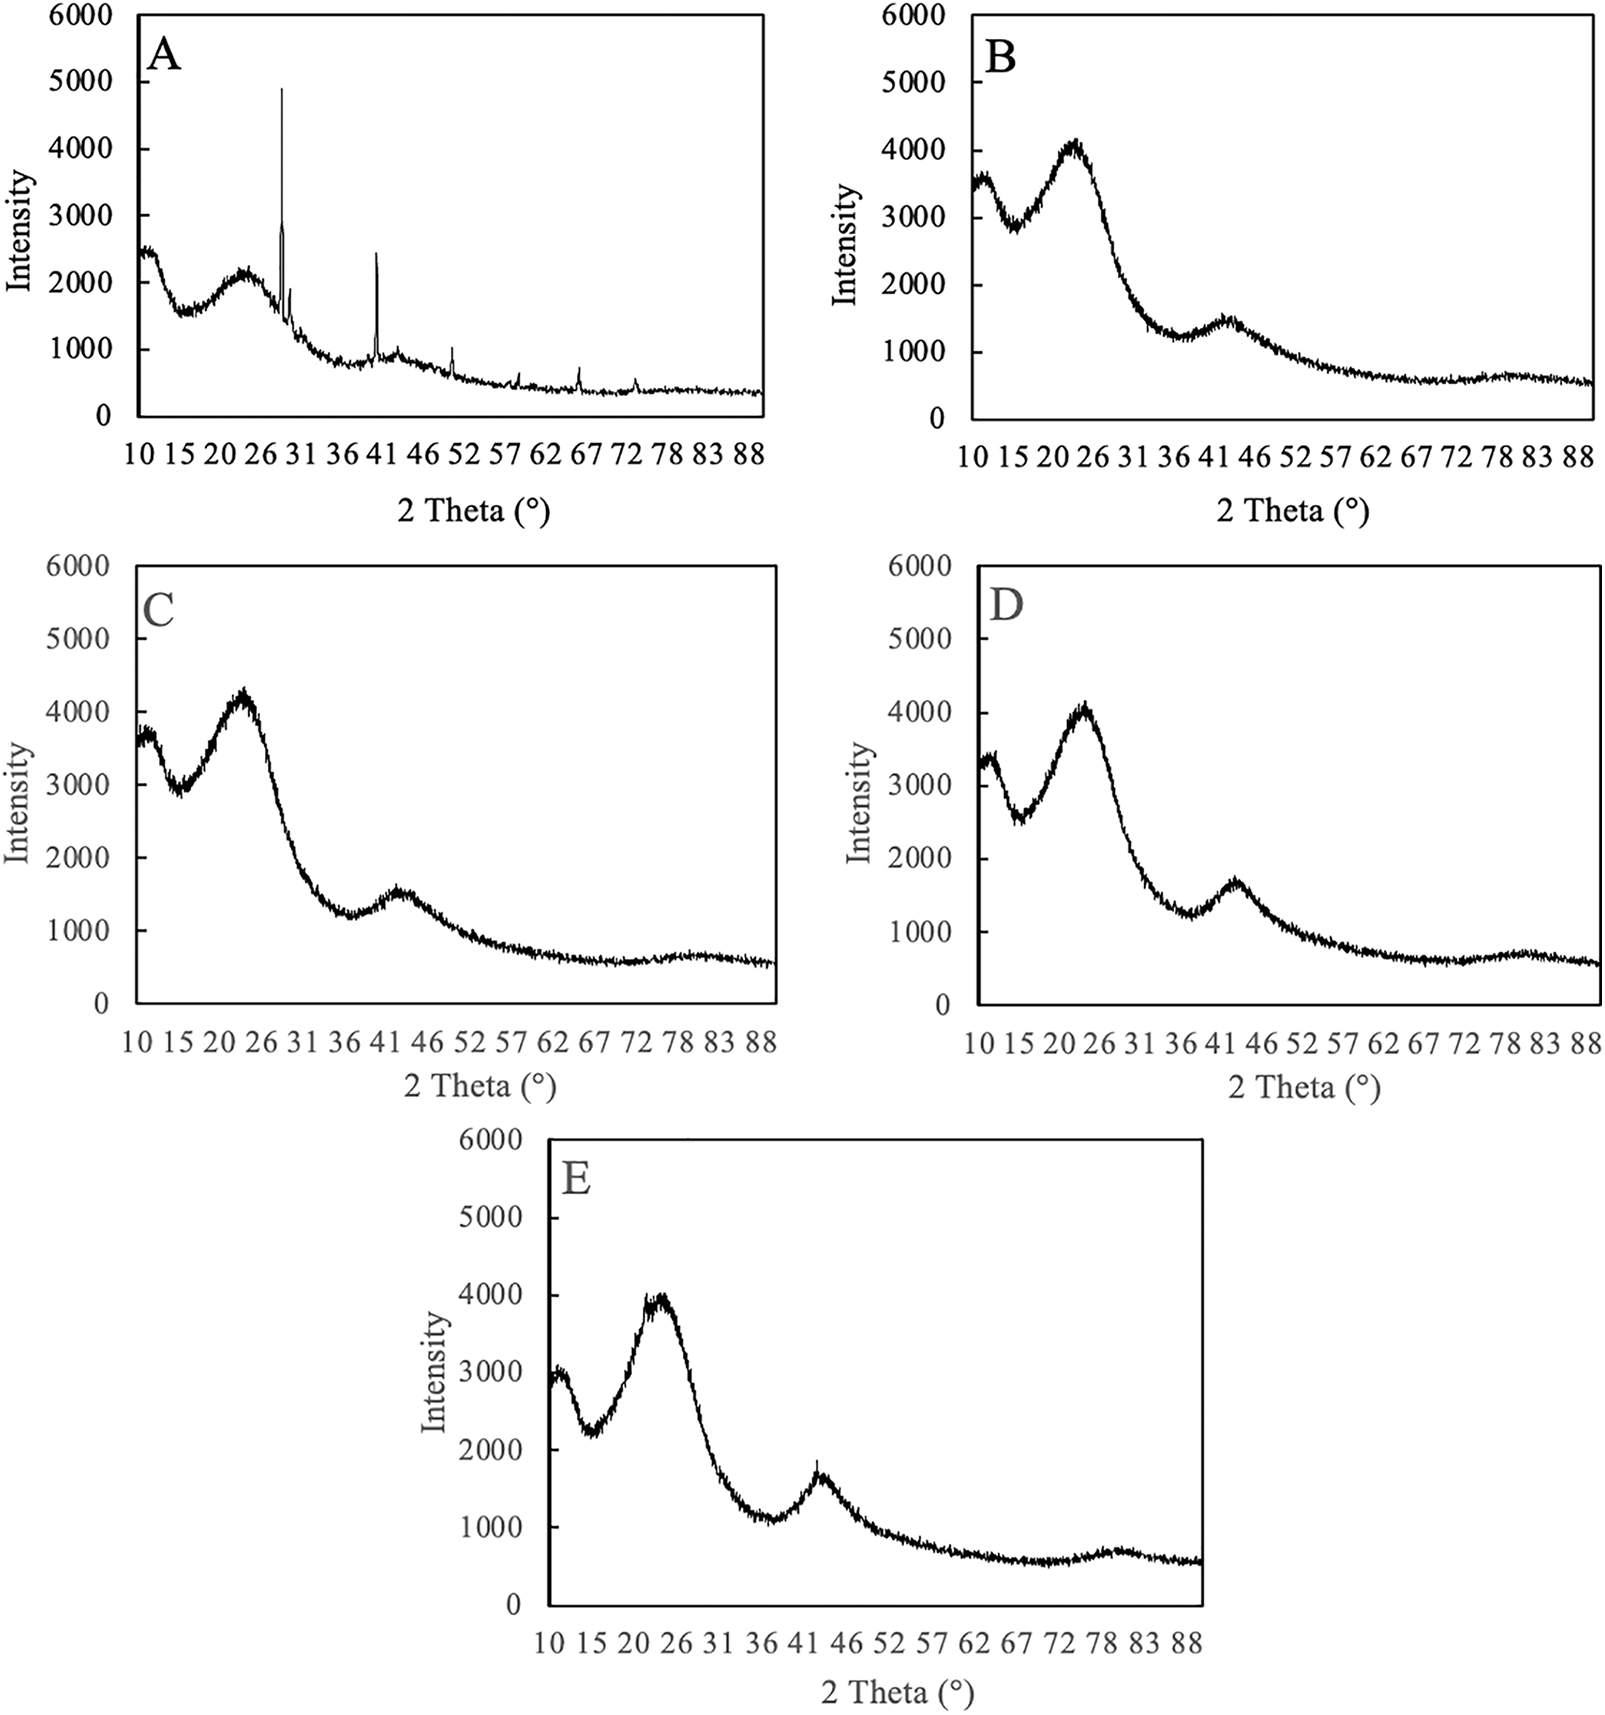
Figure 3: Diffractogram of SPB-AC under different activation temperatures. (A) No activation; (B) 500°C activation; (C) 600°C activation; (D) 700°C activation; and (E) 800°C activation
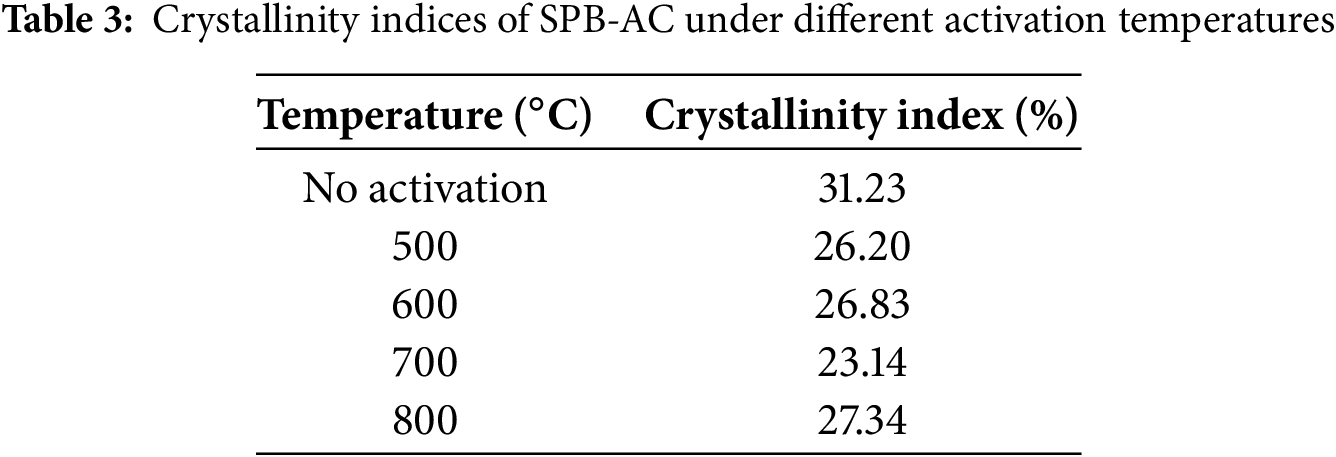
The crystallinity index of the material had an impact on the absorption properties of AC. Table 3 presents the crystallinity index (Cr-I) of SPB-AC. The Cr-I of SPB-AC increased from the 500°C treatment to the 800°C treatment, with the exception of the 700°C activation. Notably, the no-activation treatment resulted in a higher value of Cr-I than did all the other activation treatments. The analysis of the crystallinity index of SPB-AC indicates that a lower crystallinity index is correlated with enhanced predicted absorption properties. This happened as a result of the breakdown of crystalline components, such as cellulose, hemicellulose, and lignin, through high-temperature treatment. The degradation of the crystalline component may extend into the amorphous region, which is attributed to its enhanced absorption capacity [39]. The degree of graphitization in SPB-AC exceeded that in non-AC exposed to elevated temperatures. The decrease in microcrystalline strength led to increased AC activity. The data indicated a distinct trend in the activation of the SPB-AC from without activation treatment to activation occurs at 700°C, followed by a decrease at 800°C.
3.5 Surface Morphology of SPB-AC
SEM images reveal various alterations in surface morphology among different types of unactivated charcoal compared with activated charcoal. The untreated SPB charcoal image exhibited thick cell walls (Fig. 4A), whereas the high-temperature treatment resulted in signs of surface disintegration, leading to thinner cell walls (Fig. 4B–E). This phenomenon emerged as a result of the breakdown of the SPB cell walls induced by this treatment. The emergence of fissures in specific cell walls and valleys may be linked to the significant cavitation phenomenon induced by this treatment. Additionally, Fig. 4B,C shows increasing amounts of impurities, it was assumed that residual ash and other impurities resulted from the byproducts of material combustion due to high-temperature processing (500°C–600°C treatment) [40]. However, in the 700°C treatment there was a reduction in ash and impurities due to perfect combustion occurring on the impurities on the surface (Fig. 4D), then the impurities reappeared at a temperature of 800°C as a result of the high temperature which again degraded the surface leaving impurities (Fig. 4E). The variations in pore size and shape seen on the surface of SPB-AC resulted from depolymerization and emission of volatile compounds from organic molecules during the high-temperature activation process. The breakdown of cell walls, which leads to the expansion of micropores and a decrease in ash and impurity contents, may increase the absorption rate [41].
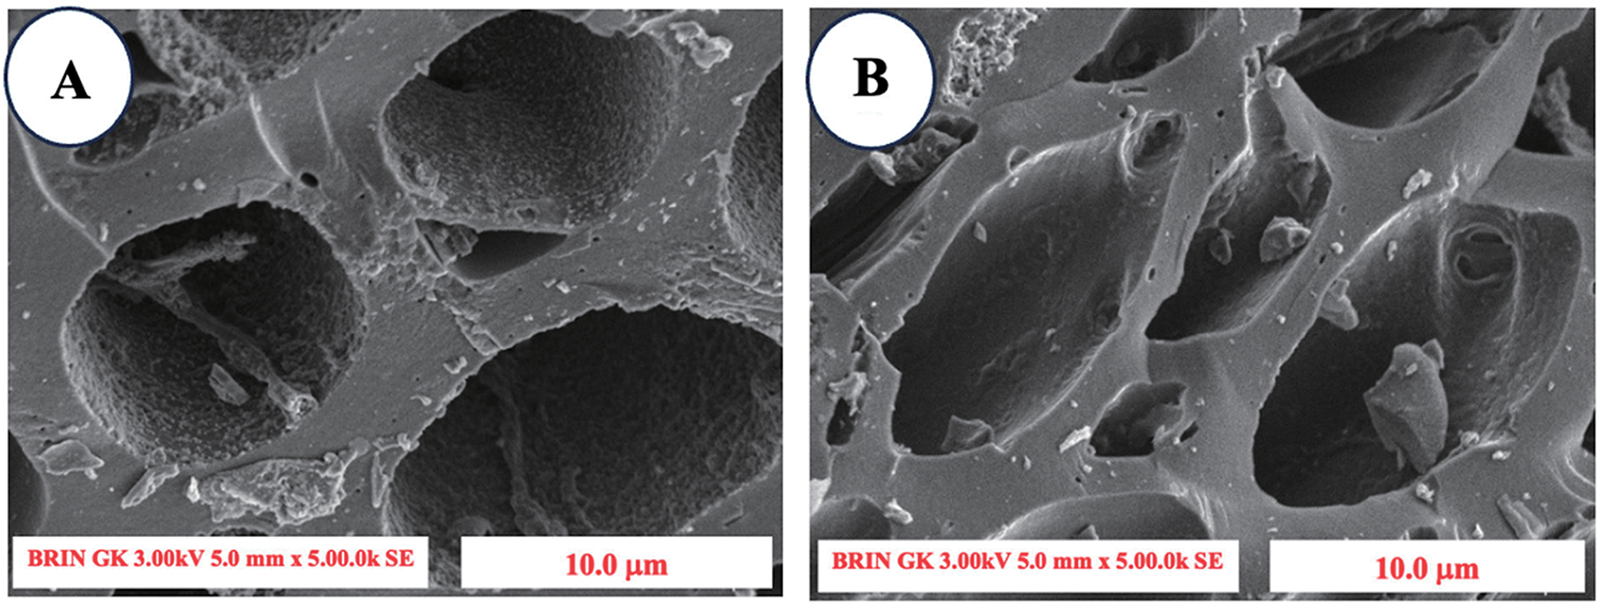
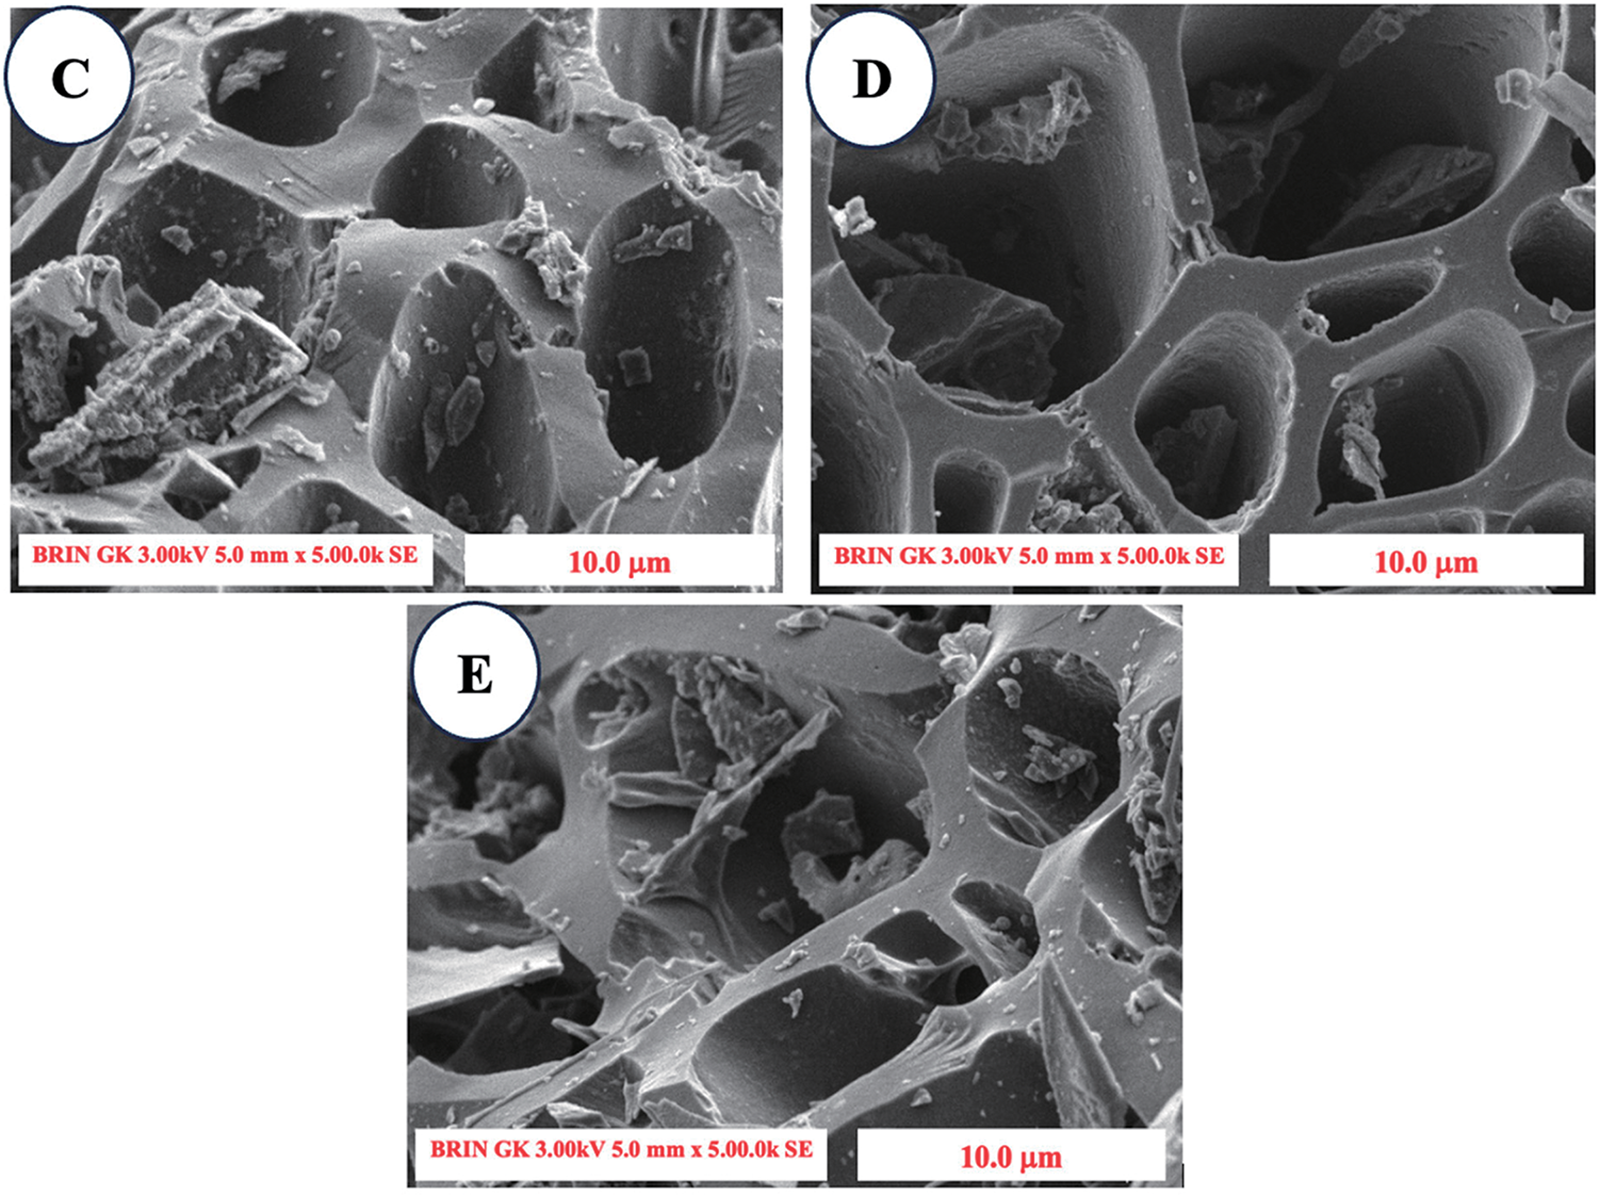
Figure 4: SEM image of the surface morphology of SPB-AC at 300× magnification. (A) No activation; (B) 500°C activation; (C) 600°C activation; (D) 700°C activation; and (E) 800°C activation
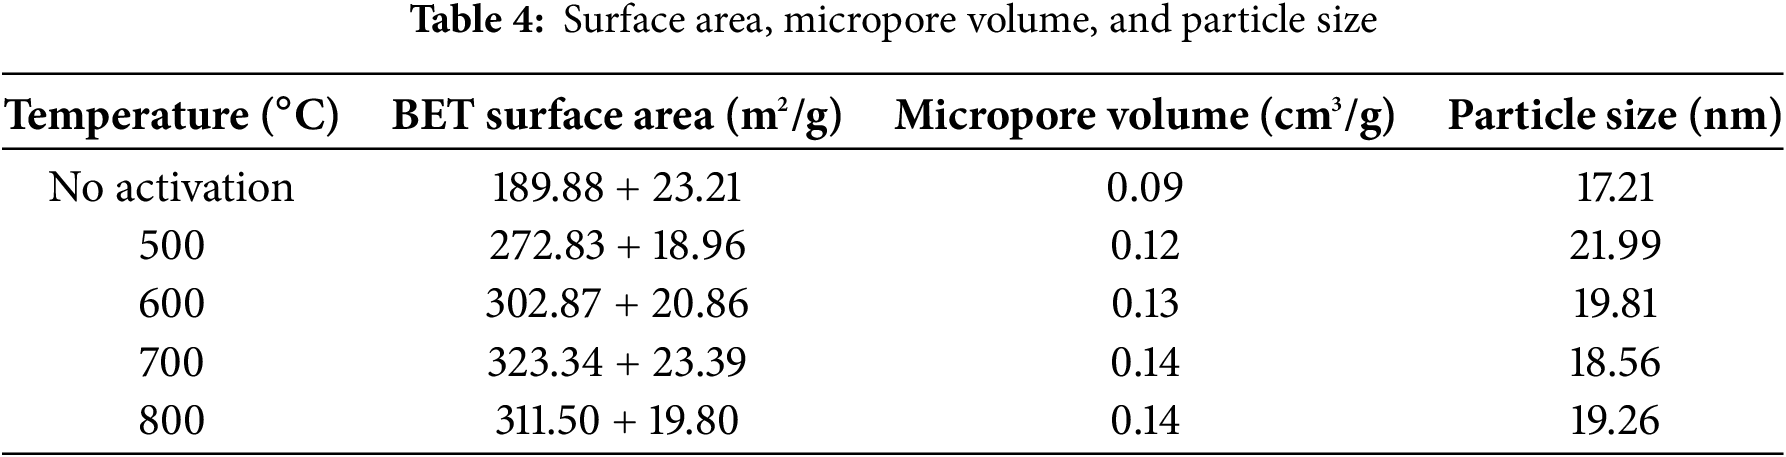
Table 4 shows a notable increase in the BET surface area and micropore volume, alongside a decrease in the particle size of SPB-AC after high-temperature treatment to 700°C. Additionally, the surface area at 700°C reached 323.34 ± 23.39 m2/g, which was the highest value across all the treatments, surpassing even the treatment at 800°C. The surface area in the 800°C treatment decreased, indicating that some smaller particles underwent complete combustion, resulting in larger particles remaining. The evidence lies in the observation that the average particle size in the 800°C treatment exceeds that of the 700°C treatment. Moreover, the micropore volume was consistent between the 700°C and 800°C treatments (0.14 cm3/g), with the 700°C treatment demonstrating greater energy utilization efficiency. This finding showed that applying a treatment at 700°C produced the most favorable outcomes regarding the increase in surface area. Furthermore, this finding was supported by empirical evidence showing that the particle size at 700°C was relatively small (18.56 nm) in comparison with the particle size noted in other treatments. The decrease in particle size resulted in an increase in the material’s surface area. This finding showed that applying high-temperature treatment to carbon could increase its surface area, increase the number of micropores, and reduce the particle size. With a reduction in particle size, there was a corresponding increase in surface area, leading to a greater volume of micropores. This resulted in a better absorption rate [42].
The adsorption–desorption isotherms of N2 for the SPB-ACs synthesized at 500°C, 600°C, 700°C, and 800°C are shown in Fig. 5. The carbon generated at 500°C displayed a broad and level area within the moderate to high relative pressure range, indicating its microporous characteristics. With increasing carbonization temperature, the isotherms displayed a wider knee and a more confined plateau, suggesting an enlargement of the pores. Consequently, the material heated to 700°C displayed a hysteresis loop, indicating the existence of a well-defined nano porosity. Nonetheless, at 800°C, a decline in the isotherms was observed. The adsorption curves for N2 on high-temperature-treated AC show a swift increase in the relative pressure environment (P/P0) within the range of 0–0.2, suggesting the adsorption of a single molecular layer in the micropores. Upon exceeding a P/P0 value of 0.3, varying retention rates were noted, indicating the emergence of greater quantities of microporous structured materials at elevated temperatures. A small amount of mesopores was also observed. Posttreatment, the adsorption isotherms at 500°C, 600°C, and 700°C exhibit an upward shift, which is followed by a decline at 800°C. Following high-temperature heat treatment, the adsorption capacity of AC increases. The observed phenomenon can be attributed to an increase in the quantity of micropores and mesopores, subsequently resulting in an increase in the specific surface area and pore capacity of the activated carbon [43,44].
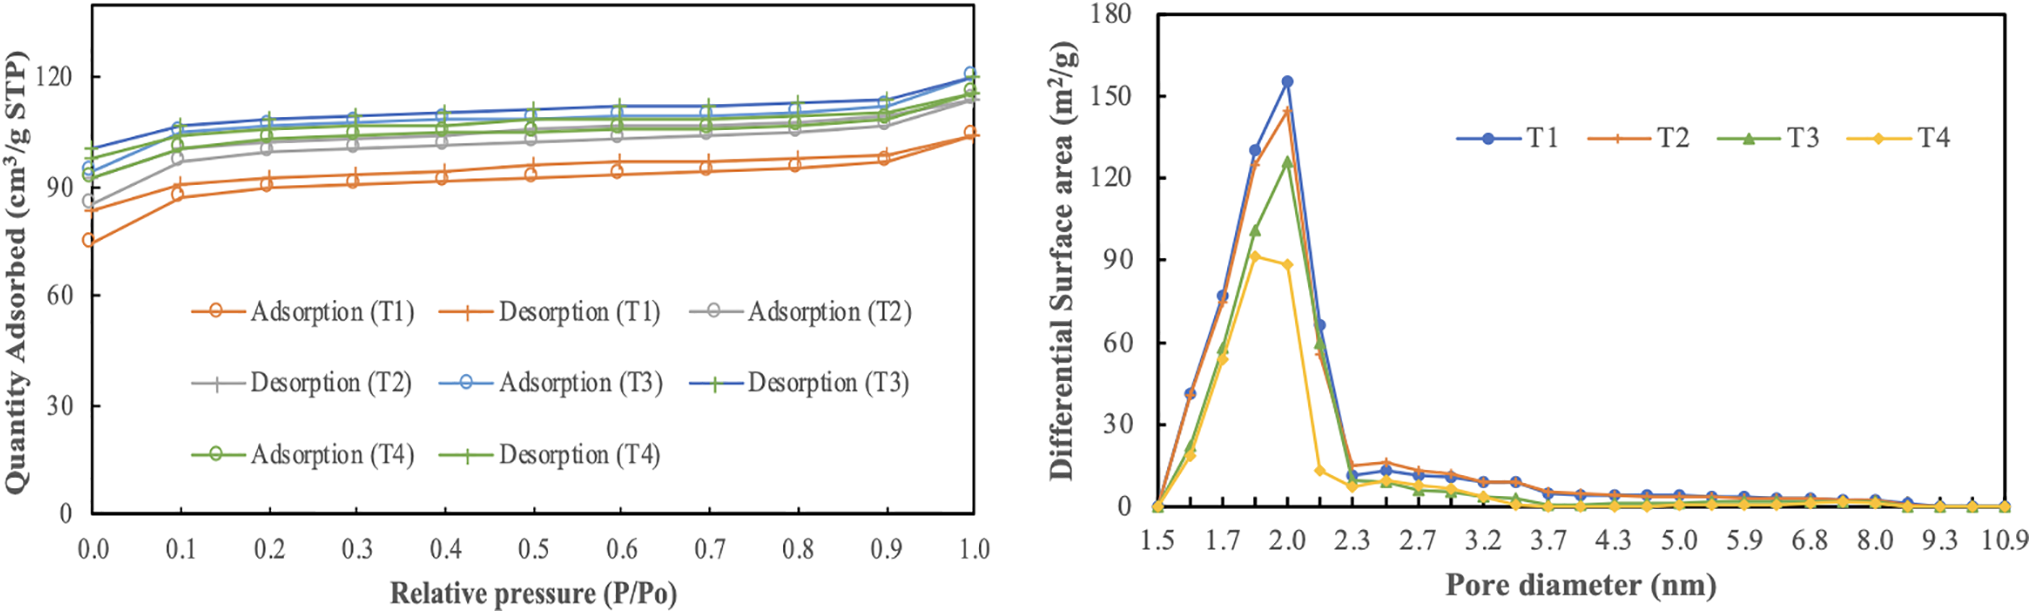
Figure 5: Adsorption–desorption isotherms of nitrogen in SPB-AC after each temperature treatment and the pore size distribution of SPB-AC at each temperature. T1: 500°C; T2: 600°C; T3: 700°C; and T4: 800°C
Fig. 5 also shows the distribution of pore sizes in the SPB-AC samples subjected to high-temperature treatment. This study demonstrated that with increasing temperature, the aperture distribution of SPB-AC significantly changed, with the pore diameter ranging from 1.5–2.3 nm initially increasing before subsequently decreasing. Additionally, the activated carbon generated at 500°C presented the greatest pore volume within the range of 1.5–2.3 nm. Compared with that of the sample heated at 500°C, the pore diameter of the high-temperature samples heated at 700°C and 800°C notably increased, falling within the range of 1.7–2 nm. This finding indicates that SPB-AC undergoes different levels of pore expansion when subjected to higher temperatures [45].
3.7 Scanning Electron Microcopy–Energy Dispersive X-Ray Spectroscopy (SEM-EDX) Analysis
The EDX analysis presented in Fig. 6 indicates the presence of carbon (C) and oxygen (O) in both nonactivated charcoal and charcoal that has undergone high-temperature activation. The data corresponded with the fixed carbon content illustrated in Fig. 6E, demonstrating that the treatment at 700°C resulted in the highest carbon content. The carbon content in untreated charcoal was measured at 72.6%, which increased to 91.5% following treatment at 700°C. At 800°C, there was a significant reduction in the carbon content, which decreased by 87.2%. The observed carbon content notably increased, reaching a remarkably high level, indicating the effective activation of the process through the application of elevated temperatures. Compared with that of the untreated charcoal, the oxygen content of the treated charcoal was 16.4% lower. A modest increase of 6.9% was subsequently observed at the high-temperature treatment of 700°C, which further increased to 9.2% with activation at 800°C. The findings indicated that the ideal oxygen concentration in activated charcoal at elevated temperatures was attained at 700°C. The inorganic content, comprising Mg, K, and Ca, was remarkably low, remaining below 1% across all the treatments. SEM-EDX analysis revealed that additional elements, such as Si, P, S, and Cl, were present in quantities less than 1%. A highly efficient absorbent material features a surface characterized by a uniform hexagonal crystal structure [46]. This investigation revealed that applying high temperatures to a material can result in the development of uniformly distributed hexagonal crystals composed of carbon. The dimensions of these crystals steadily expanded with increasing temperature, ultimately peaking at 700°C.
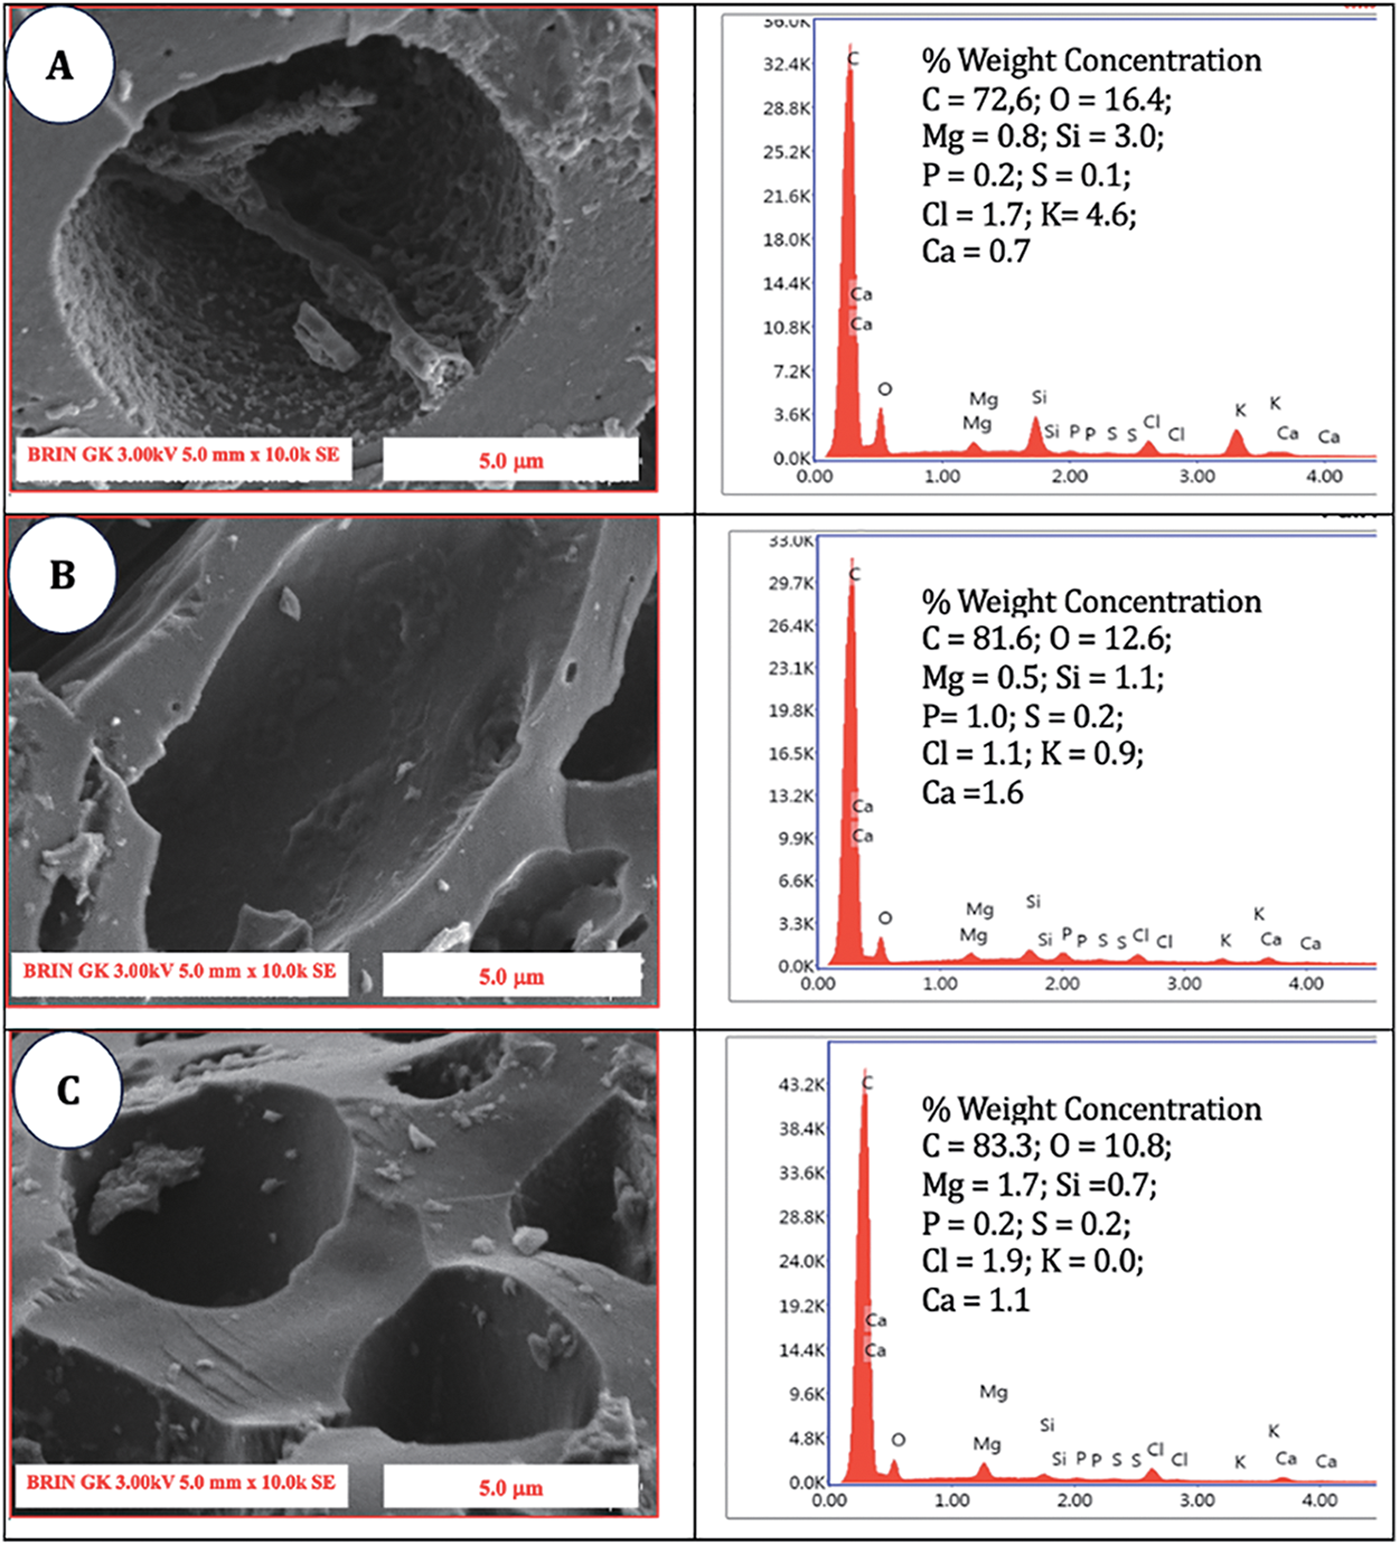
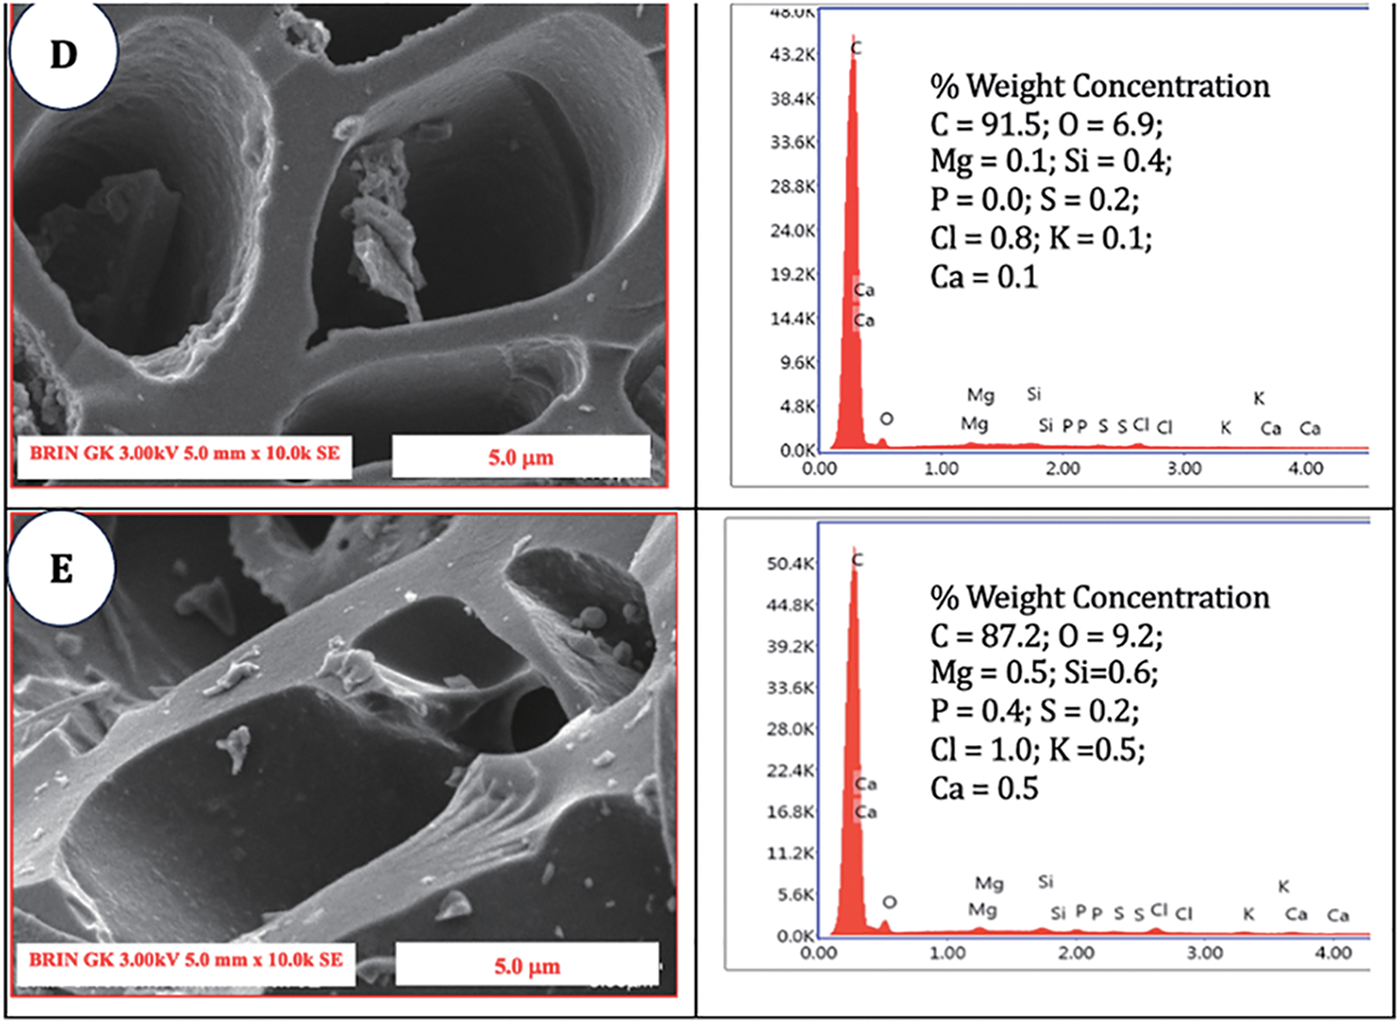
Figure 6: SEM micrographs and EDX analysis of (A) SPB charcoal without activation; (B) SPB-AC at 500°C; (C) SPB-AC at 600°C; (D) SPB activated carbon at 700°C; and (E) SPB-AC at 800°C
3.8 Adsorption Capacity of SPB-AC
Experiments were conducted to investigate the adsorption capacities of various materials over a specified duration of 5 h, utilizing different quantities of pollutants. The findings from these experiments are illustrated in Fig. 7. Some graphs illustrate the adsorption isotherms, showing the amount of compound adsorbed per unit of material in relation to the equilibrium concentration, while others demonstrate the efficiency of pollutant adsorption concerning the initial concentration.
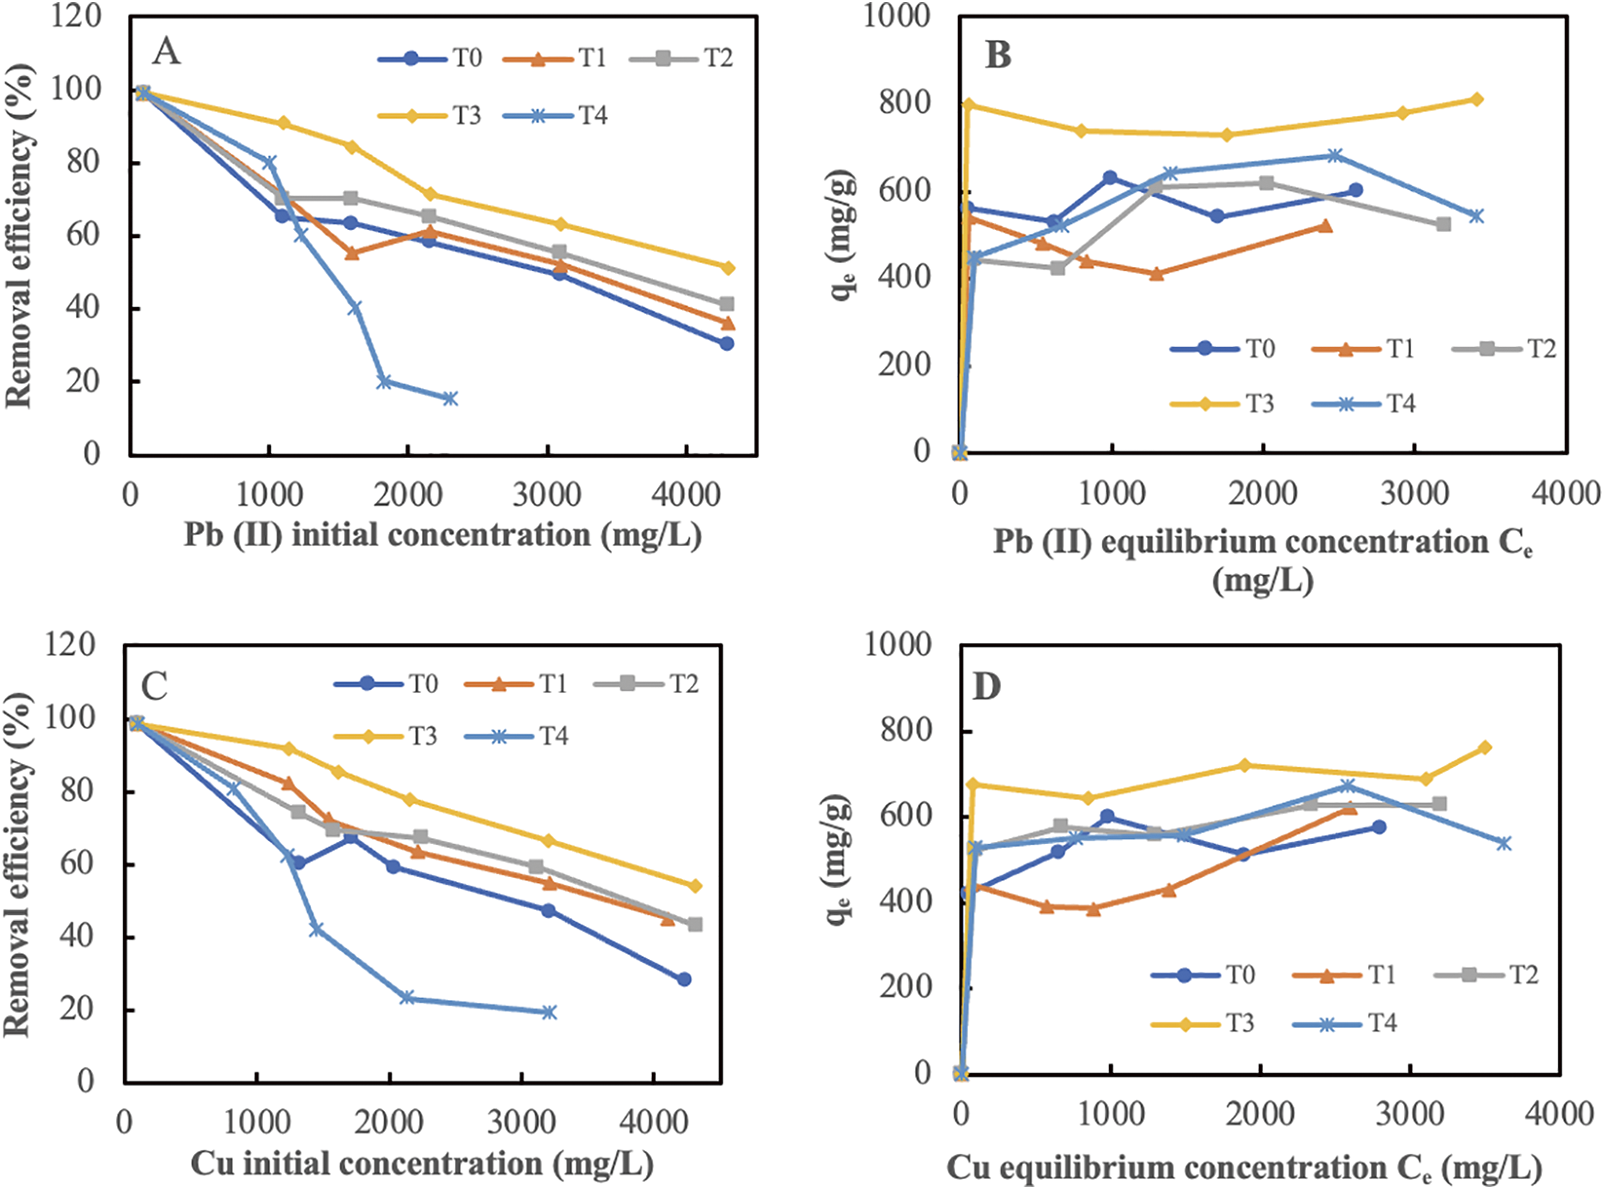
Figure 7: Adsorption isoterm and removal efficiency. Pb(II) (A, B), and Cu (C, D), respectively. T0: no activation; T1: 500°C; T2: 600°C; T3: 700°C; and T4: 800°C
The analysis indicated that the adsorption capacity was affected by the temperature of activation. The data illustrated the adsorption capacity (Xm) achieved for each activation for Pb and Cu. Table 5 presents a comprehensive analysis of how varying the activation temperature, specifically between 500°C and 800°C, influenced the adsorption ability. At an activation temperature of 700°C, a notable increase in absorption was observed (Xm), specifically 759.40 mg/g for Pb and 789.09 mg/g for Cu, respectively. The data suggest that materials prepared at a temperature of 700°C may exhibit enhanced characteristics for the removal of heavy metals. Moreover, a significant variation was observed in the change in absorbance across different temperatures. The observed variations in pore diameter sizes at 500°C, 600°C, 700°C, and 800°C are detailed in Table 4. Furthermore, the performance in terms of heavy metals absorption demonstrates both effectiveness and efficiency, as evidenced by the reduction in the amount of oxygen with increasing temperature, as illustrated in Fig. 6.
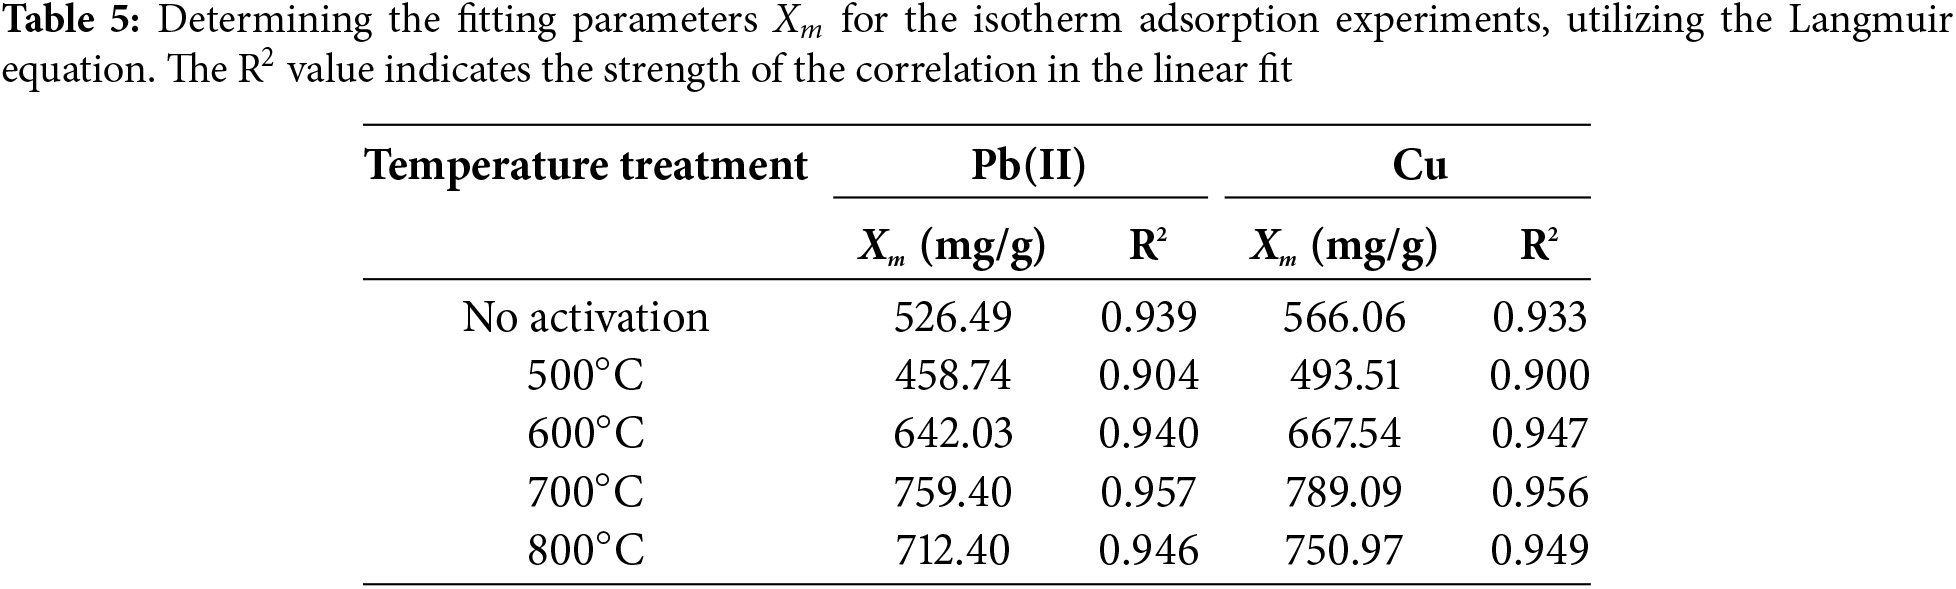
Table 5 further demonstrated that elevating the activation temperature from 700°C led to a significant enhancement in the absorption of the Pb and Cu metals. The feasibility of this was attributed to the increase in activation, which resulted in the formation of notably larger pores, as outlined in Table 4. Another study yielded comparable findings, suggesting that increasing the activation temperature to 700°C improved the adsorption capacity of activated charcoal [37]. At 800°C, there was a noticeable decrease in adsorption capacity, likely due to changes in the micropore composition, leading to their transformation into larger openings that reduced the overall ability to adsorb. The investigation revealed that the decrease in surface activity affected the adsorption capacity of sugar palm bunch-activated charcoal for more exothermic metals, including Pb and Cu. Consequently, it can be deduced that the temperature at which the activation took place influenced the structural characteristics of the pore surfaces and their capacity to adsorb substances from a liquid solution.
In summary, the detailed investigation demonstrated that as the activation temperature increased, both the weight and water content of activated carbon (AC) decreased. The decomposition of carbohydrate components occurred at 650°C. The XRD analysis revealed a reduction in the signal intensity of low-crystallinity amorphous carbon, indicating that the high-temperature treatment method produced notable changes in the structural properties of the resulting carbon crystals. The EDX analysis revealed that the initial carbon content in the untreated charcoal was 72.6%, which significantly increased to 91.5% following treatment at 700°C. An analysis of the absorption capacity of activated carbon derived from sugar palm bunches (SPB-AC) through AAS indicated that raising the activation temperature to 700°C markedly enhanced the absorption of lead (Pb) and copper (Cu) metals. The temperature at which effects were activated had an impact on the adsorption capacity of the Pb and Cu metals, along with the surface structure of the SPB-AC. The results of this study demonstrated that the AC derived from SPB has significant potential as an effective adsorbent for the removal of Pb and Cu from contaminated water.
Acknowledgement: The authors acknowledge the Government Collaboration Research Grant, Scheme of the TALENTA of Universitas Sumatera Utara Grant. The authors also acknowledge the facilities and scientific and technical support from Advanced Characterization Laboratories Bandung, Yogyakarta, and Serpong, National Research and Innovation Agency (BRIN) through the E-Layanan Sains (ELSA).
Funding Statement: This study was funded by the Government Collaboration Research Scheme of the TALENTA Grant of Universitas Sumatera Utara, No. 41/UN5.2.3.1/PPM/KP-TALENTA/R/2023, 29 August 2023.
Author Contributions: The authors confirm the contributions to the paper as follows: study conception and design: Luthfi Hakim; Apri Heri Iswanto; Yunida Syafriani Lubis; Harisyah Manurung; data collection: Luthfi Hakim; Yunida Syafriani Lubis; Harisyah Manurung; analysis and interpretation of results: Luthfi Hakim; Yunida Syafriani Lubis; Apri Heri Iswanto; draft manuscript preparation: Luthfi Hakim; Yunida Syafriani Lubis; Harisyah Manurung; Petar Antov; Tomasz Rogoziński; Lee Seng Hua; Widya Fatriasari; Jayusman; Nur Izyan Wan Azelee. All the authors reviewed the results and approved the final version of the manuscript.
Availability of Data and Materials: The data that support the findings of this study are available from the corresponding author upon reasonable request.
Ethics Approval: Not applicable.
Conflicts of Interest: The authors declare no conflicts of interest to report regarding the present study.
References
1. Aguilera A, Cortés JL, Delgado C, Aguilar Y, Aguilar D, Cejudo R, et al. Heavy metal contamination (Cu, Pb, Zn, Fe, and Mn) in urban dust and its possible ecological and human health risk in Mexican cities. Front Environ Sci. 2022;10:854460. doi:10.3389/fenvs.2022.854460. [Google Scholar] [CrossRef]
2. Chandra Voumik L, Sultana T. Impact of urbanization, industrialization, electrification and renewable energy on the environment in BRICS: fresh evidence from novel CS-ARDL model. Heliyon. 2022;8(11):e11457. doi:10.1016/j.heliyon.2022.e11457. [Google Scholar] [PubMed] [CrossRef]
3. Kovár F, Smutná K, Hruška A, Koutník I, Vráblová M. Adsorption and permeability of heavy metals (Fe, Cu, Pb, Zn, Cr, and Cd) onto the adaxial cuticle of Ficus elastica leaf. Sci Hortic. 2023;321:112315. doi:10.1016/j.scienta.2023.112315. [Google Scholar] [CrossRef]
4. Briffa J, Sinagra E, Blundell R. Heavy metal pollution in the environment and their toxicological effects on humans. Heliyon. 2020;6(9):e04691. doi:10.1016/j.heliyon.2020.e04691. [Google Scholar] [PubMed] [CrossRef]
5. Hao C, Chen B, Sánchez de la Campa AM, de la Rosa JD. Increased industry contribution and atmospheric heavy metals from economic recovery in Spain. J Clean Prod. 2020;246:119024. doi:10.1016/j.jclepro.2019.119024. [Google Scholar] [CrossRef]
6. Nag R, Cummins E. Human health risk assessment of lead (Pb) through the environmental-food pathway. Sci Total Environ. 2022;810:151168. doi:10.1016/j.scitotenv.2021.151168. [Google Scholar] [PubMed] [CrossRef]
7. Moshchenko D, Kolesnikov S, Kuzina A, Kazeev K, Minkina T, Mezhenkov A, et al. Comparative assessment of the resistance to lead (Pb) pollution of forest, forest-steppe, steppe, and mountain-meadow soils of the Central Ciscaucasia and the Caucasus regions. Forests. 2022;13(10):1528. doi:10.3390/f13101528. [Google Scholar] [CrossRef]
8. Jadoun S, Fuentes JP, Urbano BF, Yáñez J. A review on adsorption of heavy metals from wastewater using conducting polymer-based materials. J Environ Chem Eng. 2023;11(1):109226. doi:10.1016/j.jece.2022.109226. [Google Scholar] [CrossRef]
9. Waly SM, El-Wakil AM, Abou El-Maaty WM, Awad FS. Efficient removal of Pb(II) and Hg(II) ions from aqueous solution by amine and thiol modified activated carbon. J Saudi Chem Soc. 2021;25(8):101296. doi:10.1016/j.jscs.2021.101296. [Google Scholar] [CrossRef]
10. Somyanonthanakun W, Ahmed R, Krongtong V, Thongmee S. Studies on the adsorption of Pb(II) from aqueous solutions using sugarcane bagasse-based modified activated carbon with nitric acid: kinetic, isotherm and desorption. Chem Phys Impact. 2023;6(3):100181. doi:10.1016/j.chphi.2023.100181. [Google Scholar] [CrossRef]
11. Abd El-wahaab B, El-Shwiniy WH, Alrowais R, Nasef BM, Said N. Adsorption of lead (Pb(II)) from contaminated water onto activated carbon: kinetics, isotherms, thermodynamics, and modeling by artificial intelligence. Sustainability. 2025;17(5):2131. doi:10.3390/su17052131. [Google Scholar] [CrossRef]
12. Patil SA, Suryawanshi UP, Harale NS, Patil SK, Vadiyar MM, Luwang MN, et al. Adsorption of toxic Pb(II) on activated carbon derived from agriculture waste (Mahogany fruit shellisotherm, kinetic and thermodynamic study. Int J Environ Anal Chem. 2022;102(19):8270–86. doi:10.1080/03067319.2020.1849648. [Google Scholar] [CrossRef]
13. Dikobe PI, Tekere M, Masindi V, Foteinis S. Removal of contaminants of emerging concern from drinking water using bio-based activated carbon. J Water Process Eng. 2024;68:106313. doi:10.1016/j.jwpe.2024.106313. [Google Scholar] [CrossRef]
14. Hendrawan Y, Sajidah N, Umam C, Fauzy MR, Wibisono Y, Hawa LC. Effect of carbonization temperature variations and activator agent types on activated carbon characteristics of sengon wood waste (Paraserianthes falcataria (L.) Nielsen). IOP Conf Ser Earth Environ Sci. 2019;239(1):012006. doi:10.1088/1755-1315/239/1/012006. [Google Scholar] [CrossRef]
15. Mogea JP. Four new species of Arenga (Palmae) from Indonesia. Reinwardtia. 2004;12(2):181–9. [Google Scholar]
16. Nuryawan A, Tarigan A, Hakim L. The feasibility of sugar palm (Arenga pinnata) trunk for raw material of parquet (wood flooring). IOP Conf Ser Mater Sci Eng. 2017;180:012017. doi:10.1088/1757-899x/180/1/012017. [Google Scholar] [CrossRef]
17. Hakim L, Iswanto AH, Herawati E, Batubara R, Lubis YS, Aini EN. Characterization of Indonesian sugar palm bunch (Arenga longipes Mogea) properties for various utilization purposes. Forests. 2024;15(2):239. doi:10.3390/f15020239. [Google Scholar] [CrossRef]
18. Sahari J, Sapuan SM, Ismarrubie ZN, Rahman MZA. Physical and chemical properties of different morphology part of sugar palm fibers. Fibers Text East Eur. 2012;2(91):23–6. [Google Scholar]
19. ASTM D 3173-03. Standard test method for moisture. West Conshocken, PA, USA: ASTM International; 2008. [Google Scholar]
20. ASTM D 3174-02. Standard test method for ash. West Conshocken, PA, USA: ASTM International; 2002. [Google Scholar]
21. ASTM D 3175-05. Standard test method for volatile matter. West Conshocken, PA, USA: ASTM International; 2017. [Google Scholar]
22. ASTM D 3172-89. Standard test method for proximate analysis. West Conshocken, PA, USA: ASTM International; 2002. [Google Scholar]
23. Segal L, Creely JJ, Martin AEJr, Conrad CM. An empirical method for estimating the degree of crystallinity of native cellulose using the X-ray diffractometer. Text Res J. 1959;29(10):786–94. doi:10.1177/004051755902901003. [Google Scholar] [CrossRef]
24. Brunauer S, Emmett PH, Teller E. Adsorption of gases in multimolecular layers. J Am Chem Soc. 1938;60(2):309–19. doi:10.1021/ja01269a023. [Google Scholar] [CrossRef]
25. Barrett EP, Joyner LG, Halenda PP. The determination of pore volume and area distributions in porous substances. I. Computations from nitrogen isotherms. J Am Chem Soc. 1951;73(1):373–80. doi:10.1021/ja01145a126. [Google Scholar] [CrossRef]
26. Piccirillo C, Moreira IS, Novais RM, Fernandes AJS, Pullar RC, Castro PML. Biphasic apatite-carbon materials derived from pyrolysed fish bones for effective adsorption of persistent pollutants and heavy metals. J Environ Chem Eng. 2017;5(5):4884–94. doi:10.1016/j.jece.2017.09.010. [Google Scholar] [CrossRef]
27. Shokry H, Elkady M, Hamad H. Nano activated carbon from industrial mine coal as adsorbents for removal of dye from simulated textile wastewater: operational parameters and mechanism study. J Mater Res Technol. 2019;8(5):4477–88. doi:10.1016/j.jmrt.2019.07.061. [Google Scholar] [CrossRef]
28. Zhang T, Yang Y, Li X, Zhou Z, Wei B. Ultrasonic–thermal regeneration of spent powdered activated carbon. Sustainability. 2023;15(11):9060. doi:10.3390/su15119060. [Google Scholar] [CrossRef]
29. Ge L, Zhao C, Chen S, Li Q, Zhou T, Jiang H, et al. An analysis of the carbonization process and volatile-release characteristics of coal-based activated carbon. Energy. 2022;257(2):124779. doi:10.1016/j.energy.2022.124779. [Google Scholar] [CrossRef]
30. Aulia, Aprilianda, Arsyad FS, Johan A. Temperature carbonization effect on the quality of activated carbon based on rubber seed shell. J Phys Conf Ser. 2019;1282(1):012043. doi:10.1088/1742-6596/1282/1/012043. [Google Scholar] [CrossRef]
31. Ali R, Aslam Z, Shawabkeh RA, Asghar A, Hussein IA. BET, FTIR, and RAMAN characterizations of activated carbon from waste oil fly ash. Turk J Chem. 2020;44(2):279–95. doi:10.3906/kim-1909-20. [Google Scholar] [PubMed] [CrossRef]
32. Hussain OA, Hathout AS, Abdel-Mobdy YE, Rashed MM, Abdel Rahim EA, Fouzy AM. Preparation and characterization of activated carbon from agricultural wastes and their ability to remove chlorpyrifos from water. Toxicol Rep. 2023;10(3):146–54. doi:10.1016/j.toxrep.2023.01.011. [Google Scholar] [PubMed] [CrossRef]
33. Şencan A, Kılıç M. Investigation of the changes in surface area and FT-IR spectra of activated carbons obtained from hazelnut shells by physicochemical treatment methods. J Chem. 2015;2015(10):651651. doi:10.1155/2015/651651. [Google Scholar] [CrossRef]
34. Dittmann D, Saal L, Zietzschmann F, Mai M, Altmann K, Al-Sabbagh D, et al. Characterization of activated carbons for water treatment using TGA-FTIR for analysis of oxygen-containing functional groups. Appl Water Sci. 2022;12(8):203. doi:10.1007/s13201-022-01723-2. [Google Scholar] [CrossRef]
35. de Fatima Salgado M, Abioye AM, Junoh MM, Santos JAP, Ani FN. Preparation of activated carbon from babassu endocarpunder microwave radiation by physical activation. IOP Conf Ser Earth Environ Sci. 2018;105(1):012116. doi:10.1088/1755-1315/105/1/012116. [Google Scholar] [CrossRef]
36. Nyamful A, Nyogbe EK, Mohammed L, Zainudeen MN, Darkwa SA, Phiri I, et al. Processing and characterization of activated carbon from coconut shell and palm kernel shell waste by H3PO4 activation. Ghana J Sci. 2021;61(2):91–104. doi:10.4314/gjs.v61i2.9. [Google Scholar] [CrossRef]
37. Adrianto N, Mongkito VHR, Fayanto S, Anas M, Eso R. Characterization of activated charcoal from sugar palm bunches (Arengga pinnata (Wurmb) Merr) and the application as adsorbent lead (Pbcopper (Cu) and chrome (Cr) in solution. J Phys Conf Ser. 2019;1321(2):022002. doi:10.1088/1742-6596/1321/2/022002. [Google Scholar] [CrossRef]
38. Yerdauletov MS, Nazarov K, Mukhametuly B, Yeleuov MA, Daulbayev C, Abdulkarimova R, et al. Characterization of activated carbon from rice husk for enhanced energy storage devices. Molecules. 2023;28(15):5818. doi:10.3390/molecules28155818. [Google Scholar] [PubMed] [CrossRef]
39. Yan L, Zhang Y, Zhang Y, Ying P, Liu C, Jiang J, et al. Utilizing distinctive crystalline/amorphous nano-domains to facilitate multi-polarization behavior for broadband electromagnetic wave absorption. Acta Mater. 2025;294:121154. doi:10.1016/j.actamat.2025.121154. [Google Scholar] [CrossRef]
40. Kunusa WR, Iyabu H, Abdullah R. FTIR, SEM and XRD analysis of activated carbon from sago wastes using acid modification. J Phys Conf Ser. 2021;1968(1):012014. doi:10.1088/1742-6596/1968/1/012014. [Google Scholar] [CrossRef]
41. Nisreen AJ, Sirhan MM. Comparative study of removal pollutants (heavy metals) by agricultural wastes and other chemical from the aqueous solutions. Iraqi J Agric Sci. 2021;52(2):392–402. doi:10.36103/ijas.v52i2.1300. [Google Scholar] [CrossRef]
42. Ahmed AS, Alsultan M, Sabah AA, Swiegers GF. Carbon dioxide adsorption by a high-surface-area activated charcoal. J Compos Sci. 2023;7(5):179. doi:10.3390/jcs7050179. [Google Scholar] [CrossRef]
43. Tao H, Song S. Study on the effect of high temperature heat treatment of H2 on the pore structure of activated carbon. J Phys Conf Ser. 2023;2539(1):012003. doi:10.1088/1742-6596/2539/1/012003. [Google Scholar] [CrossRef]
44. Lawtae P, Tangsathitkulchai C. The use of high surface area mesoporous-activated carbon from Longan seed biomass for increasing capacity and kinetics of methylene blue adsorption from aqueous solution. Molecules. 2021;26(21):6521. doi:10.3390/molecules26216521. [Google Scholar] [PubMed] [CrossRef]
45. Chen W, He F, Zhang S, Xv H, Xv Z. Development of porosity and surface chemistry of textile waste jute-based activated carbon by physical activation. Environ Sci Pollut Res Int. 2018;25(10):9840–8. doi:10.1007/s11356-018-1335-5. [Google Scholar] [PubMed] [CrossRef]
46. Al-Juboury MF, Abdul-Hameed HM. Using of activated carbon derived from agriculture waste coating by layered double hydroxide for copper adsorption. Iraqi J Agric Sci. 2019;50(5):1446–54. doi:10.36103/ijas.v50i5.813. [Google Scholar] [CrossRef]
Cite This Article
 Copyright © 2025 The Author(s). Published by Tech Science Press.
This work is licensed under a Creative Commons Attribution 4.0 International License , which permits unrestricted use, distribution, and reproduction in any medium, provided the original work is properly cited.
 Downloads
 Citation Tools