
 Login
Login Register
 Submit a Paper
 Propose a Special lssue
 Open Access
ARTICLE
Valorization of Sugarcane Bagasse Ash for the Production of Sustainable Biobased Trays
Department of Chemistry, Faculty of Philosophy, Sciences and Letters of Ribeirão Preto, Ribeirão Preto, São Paulo, Brasil
* Corresponding Author: Delia Rita Tapia-Blácido. Email:
Journal of Renewable Materials 2026, 14(8), 1 https://doi.org/10.32604/jrm.2026.02026-0029
Received 25 February 2026; Accepted 28 May 2026; Issue published 26 August 2026
 View Full Text
 Download PDF
Abstract
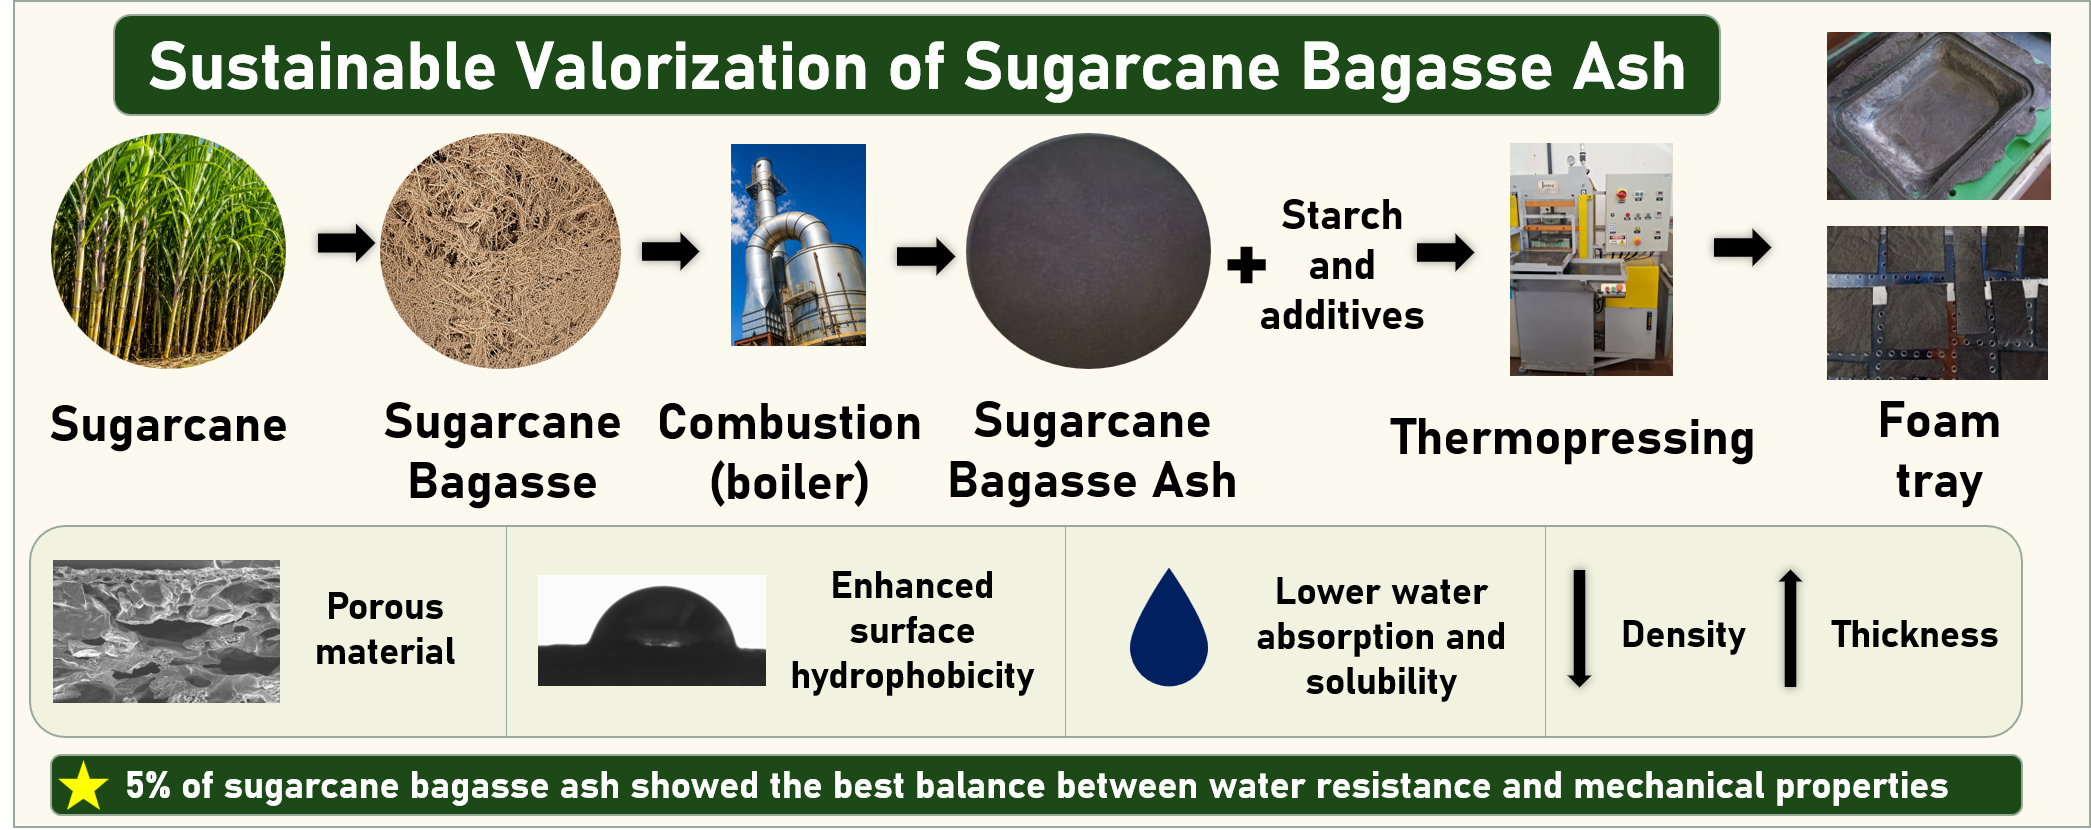
The search for sustainable alternatives to expanded polystyrene (EPS) has led to the development of starch-based foams reinforced with agro-industrial by-product. This study aimed to evaluate the effect of sugarcane bagasse ash (SBA) content on the physical, mechanical, and water-interaction properties of cassava starch foam trays, and to determine the maximum feasible ash content that could be incorporated. Sugarcane bagasse ash was collected from the boiler air preheater. Foam trays were prepared by thermopressing using cassava starch, guar gum, magnesium stearate, glycerol, and SBA at 0%, 2%, 5%, 8%, and 11%. The trays were characterized in terms of their thickness, apparent density, moisture content, water solubility, water absorption, surface wettability, mechanical properties, color, chemical structure, morphology, and thermal stability. The results show that increasing the SBA content from 0% to 11% reduced both water solubility (from 11.39% to 8.81%) and water absorption after 240 min (from 1199.38% to 799.45%). Adding 11% SBA significantly increased the contact angle (from 45.80° with 2% SBA to 70.20°), indicating enhanced surface hydrophobicity of the foam tray. However, the mechanical properties decreased with higher ash content: the tensile strength dropped from 2.06 MPa (2% SBA) to 0.62 MPa (11% SBA) and the Young’s modulus decreased from 354.32 to 112.90 MPa. The trays became progressively darker (L* decreased from 70.06 to 22.79) as the ash content increased. SBA proved to be a promising agro-industrial residue for producing sustainable starch composite foam trays, as it effectively improved water resistance and thermal stability. While the mechanical strength decreased with higher ash loadings, the 5% formulation offered the optimal balance of hydrophobicity and processability, demonstrating its potential as a bio-based alternative to EPS trays.Graphic Abstract
Keywords
Expanded polystyrene (EPS), commercially known as Styrofoam, is an ultra-low-density material composed of approximately 95% to 98% air. Due to its light weight, low cost, and high thermal insulation capacity, EPS is widely used in food packaging, such as trays and fast-food containers, which help maintain food temperature [1]. Despite these functional advantages, EPS presents serious environmental limitations, since it is petroleum-derived and its recycling is economically unfeasible. This is mainly due to its low specific weight, which makes transportation costly, and its large volume, which hinders storage and reprocessing [2].
In this context, there is a growing interest in alternative and more sustainable materials, particularly those derived from biopolymers and agro-industrial residues. Among these alternatives, starch-based packaging stands out as one of the most widely studied solutions for sustainable material applications. Between 2013 and 2018, starch accounted for 17.84% of all polymer mentions, and between 2019 and 2024 it accounted for 15.48%. This confirms its ongoing importance in the development of biodegradable materials [3]. Cassava, potato, and corn starch are the most commonly used to produce biodegradable foam trays. However, its hydrophilic characteristic limits its practical applications [4–6].
To overcome these drawbacks, starch is commonly combined with other additives to produce foam trays, including derivatives of agro-industrial by-product, to enhance its strength and improve its water resistance [3,7]. Among the agro-industrial by-products researched in foam tray production can be mentioned malt bagasse, orange bagasse, corn husks, potato peels, and mango integuments [8–10]. Using these residues reduces production costs and increases the value of discarded materials. It also improves the properties of the resulting composites, particularly their water resistance. This contributes to the circular economy and reduces the environmental impact of traditional packaging [3,9].
The sugarcane processing industry seeks to fully utilize biomass by transforming residues into value-added products, enhancing sustainability. For example, blackstrap and other low grades of cane molasses (syrup remaining after sugar is crystallized out of cane), initially considered waste or a by-product, are now used for ethanol fermentation, with ethanol regarded as a co-product rather than a by-product, while the remaining vinasse is reused as fertilizer [11]. Another important by-product is sugarcane bagasse, widely used as a renewable biofuel for steam and energy generation. Combustion of bagasse produces sugarcane bagasse ash, a grayish residue rich in carbon and minerals such as calcium, potassium, and silicon. This residue has traditionally been used as an eco-friendly soil amendment or concrete additive. However, its potential for producing starch-based composite foam trays has not yet been studied [12].
Despite extensive research into starch-based composites reinforced with various agro-industrial residues, no study has yet examined the use of sugarcane bagasse ash (SBA) as a filler in foam trays. The influence of SBA content on the physical, mechanical, water-interaction, thermal and structural properties of cassava starch foam trays is particularly unknown [3,10,13]. This study aims to systematically evaluate the effect of incorporating sugarcane bagasse ash (SBA) at concentrations of 0–11% by mass on the physical, chemical, and thermal properties of starch-based foam trays produced by thermopressing. The main advantage of this approach is that it makes use of a by-product of the Brazilian sugar and alcohol industry that is not currently used, thus contributing to the principles of the circular economy. However, it is important to emphasize that the findings at this stage are limited to laboratory-scale production. Further studies are required to assess scalability and industrial applicability.
Sugarcane bagasse ash (collected from the boiler air preheater) was obtained from the combustion process at Tereos Açúcar e Energia Brasil—Andrade Unit (Pitangueiras, São Paulo, Brazil). The material was ground in a domestic blender (RI2244, Philips Walita, Brazil) for approximately 2 min or until a fine and homogeneous powder was obtained, and then sieved through a 35- and 45-mesh (Bertel, Brazil) to standardize particle size. The fraction that passed through the 45-mesh sieve was collected, stored, and subsequently used in the preparation of the trays.
Glycerol (99.5%), ethanol (99.8%), and magnesium stearate (99.8% were purchased from Dinâmica (Brazil). Guar gum and cassava starch, with a purity of 88.0% and a moisture content of 10.5%, were acquired from Ingredients Online (Brazil). The release agent, composed of edible vegetable oil, polyglycerol polyricinoleate, and water, was purchased from Rff Alimentos (Brazil).
The trays were prepared using a basic formulation consisting of 1 g of guar gum, 3 g of magnesium stearate, 7.5 g of glycerol, and 100 g of a starch–ash mixture. Four formulations were prepared with different ash-to-starch mass ratios: 0:100 (Control), 2:98, 5:95, 8:92, and 11:89, corresponding to trays referred to as 2%, 5%, 8%, and 11%, respectively. Preliminary tests showed that the porous, carbonaceous structure of sugarcane bagasse ash gives it a low bulk density. Therefore, an ash content of more than 11% (by mass) resulted in an excessive volume fraction, compromising dough cohesion and preventing uniform tray formation under thermopressing conditions. Thus, the selected levels (2%, 5%, 8%, and 11%) were defined to cover a progressive range, from a minimal addition to the maximum feasible incorporation.
The mixture was homogenized using a planetary mixer (PHP 500, Philco, Brazil), while deionized water was gradually added until a homogeneous and workable dough was obtained, requiring 90 g of deionized water. This amount was standardized for all formulations. Mixing was performed for about 10 min, with brief interruptions for manual stirring to ensure uniformity. Subsequently, 140 g of the dough were evenly spread in a Teflon mold (27 cm × 20 cm × 25 mm) and pressed in a hydraulic thermo-press (PHB200-P4201, Jomaq, Brazil) at 140°C and 80 bar for 4 min. The mold was previously prepared with a thin layer of release agent. The trays were then removed from the mold, cooled to room temperature, and conditioned at 25°C and 58% relative humidity for 48 h prior to characterization (Fig. 1) [14].

Figure 1: Preparation of the trays at different stages.
2.3 Thickness and Apparent Density of Foam Tray
The thickness of the trays was measured using a digital sheet metal micrometer (ZAAS Precision, Brazil). Measurements were taken at a minimum of 20 randomly selected points across the surface of each tray to ensure representativeness. The apparent density (g/cm3) was calculated based on the average thickness, a known tray area (100 mm × 25 mm), and the corresponding mass. Reported values represent the mean of at least six independent determinations [15].
2.4 Mechanical Properties of Foam Tray
Tensile and puncture tests were performed to evaluate the mechanical properties of the foam trays. Elongation at break, tensile strength, and Young’s modulus were determined using a Texture Analyzer (TA.XT Plus, TA Instruments, USA). Tensile tests were carried out on foam tray strips measuring 100 mm × 6 mm, with an initial grip separation of 80 mm and a crosshead speed of 2 mm/s. The procedure followed ASTM D882-12, as adapted and described by Mello and Mali (2012) [16]. Puncture tests were performed using 25 mm × 25 mm foam tray specimens. A spherical probe (P/5S) was applied at a constant speed of 2 mm/s until sample rupture. The maximum puncture force, distance to break, and puncture force per thickness were calculated according to the method described by Aguilar et al. (2025) [15]. All measurements were performed on at least six replicates for each tray formulation.
2.5 Moisture and Solubility in Water
The moisture content was assessed based on the ASTM D644-99 procedure, with minor adjustments [17]. Around 2.00 g of small foam tray fragments were placed in pre-dried and pre-weighed Petri dishes and oven-dried (Q314M, QUIMIS, Brazil) at 105°C for 24 h, until a constant mass was achieved. Following drying, the samples were cooled in a desiccator to room temperature to avoid moisture uptake before being reweighed. The moisture percentage was determined from the difference between the initial and final sample weights [4].
The water solubility of the trays was analyzed according to the method of Gontard et al. (1992), with modifications [18]. Specimens (12.5 mm × 50 mm) were weighed and immersed in 100 mL of deionized water at 25°C under constant stirring (200 rpm) for 24 h using a shaker (SL222, SOLAB, Brazil). The remaining insoluble portion was collected by filtration, oven-dried at 105°C to constant weight, and weighed. Solubility was calculated as the proportion of dissolved dry matter relative to the original dry mass of the sample. Triplicate measurements were performed for each tray formulation to ensure reproducibility.
2.6 Water Absorption and Wettability
The water absorption of the trays was determined according to the adapted method from Vercelheze et al. (2012) [19]. Foam tray samples measuring 25 mm × 50 mm were weighed and then immersed in distilled water at 25 ± 1°C for 5, 10, 30, 60, and 240 min. At each predetermined time, the samples were carefully removed, and excess surface water was gently blotted with absorbent paper before reweighing. The water absorption was calculated as the difference between the wet and initial dry masses, expressed as the mass of absorbed water per unit of the original sample mass. All measurements were performed in quintuplicate.
The wettability of the foam trays was assessed by measuring the water contact angle using a goniometer (OCA-20, Dataphysics, Germany). Measurements were performed under ambient temperature and pressure, and images were recorded over a 1-min period. The contact angle, expressed in degrees, represents the angle formed between the tangent to the water droplet and the tray surface. Lower contact angles indicate higher surface hydrophilicity, whereas larger angles are associated with more hydrophobic characteristics [15].
2.7 Morphology by Scanning Electron Microscopy (SEM) and Thermogravimetric Analysis
The morphology of the ash and foam trays was examined using Scanning Electron Microscope (EVO-50 model, ZEISS, Germany). Before imaging, each sample was coated with a thin layer of gold using a sputter coater (SCD 050, Bal-Tec, Liechtenstein) to improve surface conductivity. Micrographs were obtained at an accelerating voltage of 20 kV. This analysis aimed to observe the surface microstructure and fracture characteristics of the samples, providing insights into the material’s homogeneity and interaction between components. Energy-Dispersive X-ray Spectroscopy was employed to determine the elemental composition of the ash samples, enabling the identification and semi-quantitative quantification of major elements present. The thermal behavior of the ash and foam trays was evaluated using a thermogravimetric analyzer (TGA-Q500, TA Instruments, USA). Approximately 10 mg of each sample was placed in a platinum pan and heated from 10°C to 700°C at a constant rate of 10°C/min under a nitrogen atmosphere. The mass loss was continuously monitored as a function of temperature to assess the thermal stability and decomposition profile of the materials [15].
The optical properties of the ash and foam trays were evaluated using a portable colorimeter (MiniScan XE, HunterLab, Reston, VA, USA). The CIELAB color coordinates (L*, a*, and b*) and the total color difference (ΔE*) of the foam trays were determined. The ΔE* values were calculated with reference to a white standard background (L* = 93.49, a* = 0.77, b* = 1.40).
2.9 Fourier-Transform Infrared Spectroscopy (FTIR)
Initially, the film samples were conditioned over silica gel for a minimum of seven days. Infrared spectra were then collected using a FTIR spectrophotometer (Perkin Elmer, Spectrum One model, USA) equipped with an ATR accessory. Each spectrum was recorded with 20 scans at a resolution of 4 cm−1, covering the range from 550 to 4000 cm−1. The resulting spectra were processed using SpectraGryph software (version 1.2). FTIR measurements were carried out with one replicate per sample.
Statistical analyses were performed using the Statistica 7.0 software package (StatSoft®, USA). Analysis of variance (ANOVA) was conducted at a 95% confidence level to assess differences among the foam tray formulations. When significant effects were observed, Tukey’s post-hoc test was applied to compare mean values, considering a significance threshold of p < 0.05.
The semiquantitative elemental composition of ashes determined by Energy-Dispersive X-ray Spectroscopy (EDS) revealed that the ash was mainly composed of carbon (74.76%) and oxygen (13.05%). This predominance of carbon suggests the presence of unburned organic matter or charcoal residues, rather than a purely inorganic composition. This high carbon content gives the ash a predominantly organic–carbonaceous character, which influences properties such as color, hydrophobicity, and interaction with the starch matrix. Among the inorganic elements, silicon (Si) shows the highest concentration (1.892%), being a common component in agricultural biomass ash, often in the form of amorphous or crystalline silica. Other metallic elements in smaller amounts, such as potassium (K—0.625%), calcium (Ca—0.166%), magnesium (Mg—0.322%), and aluminum (Al—0.339%), are typical of plant ashes and can act as property modifiers, influencing thermal stability, color during burning, and rheological behavior during processing. Phosphorus (P—0.131%) and sulfur (S—0.120%) were present in low concentrations. Sugarcane bagasse ash typically contains silicon, aluminum, iron, calcium, magnesium, and potassium oxides (SiO2, Al2O3, Fe2O3, CaO, MgO, and K2O) as the main inorganic constituents. Nonetheless, the relative proportions of these oxides may vary considerably depending on factors such as crop variety, cultivation practices, combustion conditions, and geographical origin [20,21].
The SEM analysis revealed the presence of fibrous structures that were not completely decomposed during the combustion process in the boiler (Fig. 2). Particles with a broad size distribution were observed, ranging from approximately 450 µm to less than 5 µm. The ash exhibits remnants of partially carbonized sugarcane bagasse fibers, indicating incomplete thermal degradation [22].

Figure 2: Scanning electron microscopy images of sugarcane bagasse ash (50×, 500×, 1000×).
The cross-section micrographs reveal a “sandwich-type” structure. The surface layer exhibited smaller and more compact pores, while the inner region presented larger and more irregular voids (Fig. 3A,B). This gradient in porosity indicates a denser outer layer and a lighter internal core, consistent with the typical behavior of foamed starch-based materials. The formation of a thinner and more compact surface layer than that reported by other authors suggests differences in drying kinetics and bubble stabilization during processing [15,23,24]. This phenomenon is strongly influenced by factors such as ambient humidity, water activity, vapor pressure, and matrix mobility along the transition from the tray surface to its core [15]. The surfaces of the trays (Fig. 3C) exhibited a more irregular and less defined structure, a characteristic that may be attributed to the application of the release agent during the molding process.

Figure 3: SEM micrographs of fracture cross-sections (A: 100×, B: 500×) and surfaces (C: 500×) of trays formulated with 0% (Control), 2%, 5%, 8%, and 11% ash.
The moisture content values were in the range from 10.82% to 11.40% (Table 1). The Control tray exhibited a moisture content of 11.27%, a value typical of starch-based matrices [14,24–26]. With the incorporation of SBA, a gradual and progressive reduction in moisture was observed. Formulations containing 2%, 5%, and 8% SBA showed values close to the control (11.40%, 11.18% and 10.95%, respectively), with no statistically significant differences. In contrast, sample 11% SBA presented significantly lower moisture content (10.82%). This behavior can be attributed to the predominantly inorganic composition of the ash, which is rich in silica and other mineral components with hydrophobic characteristics. Consequently, the partial replacement of starch—a hydrophilic polysaccharide—by ash reduces the water retention capacity of the matrix, resulting in materials with lower moisture content. This characteristic is advantageous for packaging applications, as lower moisture levels are associated with reduced susceptibility to microbial growth and premature material degradation [27]. The moisture contents obtained in this study are consistent with values reported in the literature for similar starch-based trays. For example, trays made from starch and turmeric extraction residue showed a moisture content of 10.4% [15], while those reinforced with Ceiba, coffee, and cocoa fibers presented 8.84% [24]. Similarly, trays incorporating sorghum by-products had 12% [28], and banana bunch stalks coated with beeswax exhibited 9.08% [29].

A similar trend was observed for the solubility in water of the trays, with a progressive decrease as the ash content increased. The control tray exhibited a solubility of 11.39%. Formulations containing 2% and 5% SBA did not differ statistically from the control, with values of 11.08% and 10.01%, respectively. However, films with 8% and 11% SBA showed significantly lower solubility (9.06% and 8.81%). This reduction can also be directly related to the predominantly inorganic and hydrophobic nature of the ash, which limits the water–matrix interaction. Comparable reductions in solubility were also reported in other studies, such as in trays containing Ceiba, coffee, and cocoa fibers (from 35.02% to 28.23%) [24] and in corn starch composites with banana bunch stalks (from 36% to 15%) [29].
A significant decrease in density and a corresponding increase in thickness were observed with the progressive addition of ash to the tray formulations (Table 2). The 0% tray presented a thickness of 1.37 mm and a density of 0.86 g/cm3. The tray containing 2% ash did not show a statistically significant difference compared to the control (0%), whereas those containing 8% (2.10 mm) and 11% ash (2.45 mm) exhibited the highest thickness values. This behavior can be attributed to the particulate and inorganic nature of the ash, which, when incorporated into the starch matrix, alters the rheology of the mixture and possibly affects compaction during the thermopressing process [30,31]. The ash particles act as fillers, increasing the overall volume of the matrix and potentially reducing its compaction under the same pressure and temperature conditions, resulting in progressively thicker trays. In contrast, the apparent density of the trays showed an opposite trend, decreasing with increasing ash content. The formulations containing 0% and 2% ash exhibited the highest density, with no statistically significant difference between them, while the 11% sample showed the lowest density (0.59 g/cm3). This reduction in density, combined with the increase in thickness, suggests the formation of a less compact internal structure. A comparable effect was observed for foams incorporating orange bagasse (density: 0.21 to 0.12 g/cm3; thickness: 3.96 to 3.57 mm) and cornhusk residues (density: 0.21 to 0.19 g/cm3; thickness: 3.96 to 3.51 mm). Cassava fiber–reinforced foams exhibited a pronounced reduction in density from 1.87 to 0.84 g/cm3, highlighting the influence of fibrous reinforcement on the material’s expansion behavior [8,32,33].

The water absorption capacity of foam trays is presented in Table 3. In general, adding 11% ash was found to be the most effective way of significantly reducing water absorbability. During the initial 5-min immersion period, the trays containing 0% and 2% ash exhibited the highest absorption rates (59.56% and 56.66%, respectively), with no statistically significant difference between them. Meanwhile, the formulations with higher ash content demonstrated reduced water absorption. As the immersion time increased from 10 to 60 min, the tray containing 2% ash exhibited a significant reduction in water absorption compared to the 0% formulation. This followed the same trend whereby the addition of ash promotes a decrease in absorption of water.

After 240 min (4 h) of testing, the absorption values reached high levels (>799%), as expected for starch-based materials given their highly hydrophilic nature. After 240 min of immersion, the Control film absorbed 1199.38% of water. All SBA-containing formulations demonstrated significantly reduced water absorption compared to the Control. The tray containing 11% ash had the lowest absorption value (799.45%), which was significantly lower than those of the other trays. The ashes are rich in hydrophobic compounds, which explains why water absorption reduces with increasing ash content. This effect can be attributed to the SBA high carbon content (74.76%), which makes the composite surface more hydrophobic, as evidenced by the increased contact angle at 11% SBA.
The SBA has a predominantly carbonaceous and mineral composition, which makes the composite more hydrophobic and reduces its overall affinity for water. In addition, partially substituting the starch matrix, which is rich in hydroxyl groups, with ash decreases the number of sites available for hydrogen bonding with water molecules. Furthermore, the dispersed SBA particles may form physical barriers within the matrix, hindering water diffusion and restricting how far water can penetrate the internal structure of the trays. Changes in the microstructure, such as reduced pore connectivity or an altered distribution of pore sizes, may also be responsible for the observed decrease in water uptake [15,24,25]. Similar reductions in water absorption capacity have been widely reported for starch-based foam trays reinforced with agro-industrial residues. For example, cassava starch trays containing 6% Ceiba, coffee and cocoa fibres exhibited a reduction in water absorption from around 750% to 460%, 450% and 550%, respectively after 25 min of immersion [24]. Similarly, trays containing turmeric pigment extraction residue showed a significant decrease in water absorption, dropping from 1233.5% (control) to 399.3% after 240 min with 30% residue [15]. Another study found that corn starch-based foam containers containing kimchi cabbage by-product had a significantly lower water absorption capacity (81.42%–109.07%) than the control sample (127.56%) after 30 min of immersion [25]. These results consistently demonstrate that incorporating agro-industrial residues reduces water absorption, primarily due to decreased matrix hydrophilicity and changes to the material’s internal structure.
However, it is important to emphasize that a reduction in water absorption does not mean that the material becomes fully hydrophobic. Although the SBA increases the surface hydrophobicity of the trays, as confirmed by the contact angle measurements presented in the following section, they still exhibit high water uptake due to their porous structure and the inherently hydrophilic nature of the starch-based matrix. Therefore, water absorption is governed not only by surface wettability, but also by internal factors such as porosity, pore connectivity and the presence of hydrophilic groups within the material itself [9,11,13,33].
3.6 Surface Wettability by Contact Angle
Fig. 4 shows the surface wettability behavior of the trays as determined by the contact angle measurements. The Control tray exhibited a contact angle of 41.02°, while the tray containing 2% ash showed a significantly higher value of 45.80°, indicating a moderately hydrophilic surface for both. This effect is consistent with the hydrophobic nature of SBA. As the ash content increased to 5% and 8%, slight variations were observed (47.95° and 47.33°, respectively); however, these differences were not statistically significant when compared with the 2% tray. In contrast, the tray containing 11% ash showed a significant increase in contact angle to 70.20°, indicating a moderately hydrophobic surface. This marked change in wettability suggests a fundamental alteration in the surface microstructure, where ash particles—intrinsically hydrophobic due to their mineral composition—become more dominant on the material’s surface. Consequently, the surface topography changes in a way that reduces wettability. The presence of silicon in the ash can be associated with increased rigidity and a possible reduction in hydrophilicity, which corroborates the contact angle results indicating greater hydrophobicity in formulations with higher ash content [21]. Although an increase in contact angle indicates enhanced surface hydrophobicity, this parameter alone is not enough to fully describe the material’s overall water resistance. Contact angle measurements capture interfacial phenomena. In contrast, water absorption is governed by mass transport within the porous structure and the hydrophilic nature of the polymer matrix. Therefore, substantial water uptake persists despite increased surface hydrophobicity [9,11,13,33].

Figure 4: Contact angle measurements of trays containing 0% (Control), 2%, 5%, 8%, and 11% ash. Different letters (a–c) indicate a significant difference between the means of the trays as revealed by Tukey’s test (p < 0.05).
Table 4 presents the mechanical properties of the trays produced. The tensile strength results showed a general decreasing trend with increasing ash content. The Control tray exhibited a tensile strength of 2.02 MPa, similar to the formulations containing 2% (2.06 MPa) and 5% (2.57 MPa), with no statistically significant difference between them. However, as the ash content increased, a progressive reduction was observed, with the 11% formulation reaching only 0.62 MPa, representing a decrease of approximately 70% compared to the Control. This progressive decrease can be attributed to the discontinuities introduced into the polymeric matrix by the ash particles, which act as weak points in the structure.

Regarding elongation at break, no statistically significant differences were observed among the formulations, with values ranging from 0.63% to 1.20%. This indicates that the incorporation of ash did not substantially affect the extensibility of the material under tensile loading. However, when analyzing the elongation in the puncture test, a distinct behavior was observed: the 11% ash formulation exhibited significantly higher deformation (2.17 mm) compared to the others, especially the 2% formulation (1.37 mm).
The Control tray presented a modulus of 322.30 MPa, comparable to the 2% formulation (354.32 MPa), with no significant difference between them. However, Young’s modulus showed a progressive and statistically significant reduction with increasing ash content, decreasing from 354.32 to 112.90 MPa between the 2% and 11% formulations. This approximately 68% reduction in stiffness indicates that the incorporation of ash makes the trays progressively more flexible and less rigid. This behavior was expected, as ash particles, being predominantly inorganic, do not form a cohesive structure with the starch matrix, resulting in a material with lower elastic resistance.
The puncture test results corroborate the trends observed in the tensile tests. The control tray exhibited a maximum penetration force (MPF) of 37.38 N, statistically similar to the 2% formulation (36.09 N). In contrast, formulations with higher ash contents showed significantly lower values, ranging from 24 to 32 N, indicating reduced resistance to penetration. When normalized by thickness, the same trend observed for the maximum penetration force was maintained, with the control (29.57 N/mm) and the 2% formulation (28.78 N/mm) showing the highest values, without significant differences between them. In contrast, formulations with higher ash contents exhibited significantly lower values (approximately 12–14 N/mm), confirming that the addition of ash above 2% markedly reduces the resistance of the trays to puncture. These results confirm that the addition of ash above 2% significantly reduces the mechanical resistance of the trays to penetration—a critical property for packaging applications that may be subjected to such mechanical stresses during handling and transportation [34–36].
A similar reduction in mechanical performance with the incorporation of agro-industrial residues has been reported. For example, trays reinforced with brewer’s malt bagasse showed a decrease in tensile strength from 2.27 ± 0.56 MPa to 0.85 ± 0.14 MPa, accompanied by a drop in elongation at break from 1.64% to 0.59% [32]. Likewise, trays prepared with banana bunch stalk fibers exhibited a tensile strength decrease from 3.7 to 2.4 MPa, while elongation decreased from 5.5% to 3.5% [28]. Similarly, the incorporation of turmeric pigment extraction residues resulted in a tensile strength reduction from 2.7 to 2.0 MPa, and elongation from 1.5% to 0.6% [15]. The incorporation of agro-industrial residues into starch-based matrices can significantly enhance hydrophobicity and barrier properties, mainly by reducing water–matrix interactions and altering the surface characteristics of the material. However, this improvement may be accompanied by a decline in mechanical performance, primarily due to weak interfacial adhesion between the continuous polymeric phase and the dispersed inorganic or fibrous particles. This poor compatibility leads to the formation of structural discontinuities and stress concentration points, which act as preferential sites for crack initiation and propagation under mechanical loading [26,37]. As a result, the overall mechanical integrity of the material is compromised. Therefore, careful optimization of residue content is essential to achieve an appropriate balance between enhanced barrier functionality and the preservation of sufficient mechanical strength for practical applications [8,9,38].
Fig. 5 presents the CIELAB color parameters (L, a, and b*) and the total color difference (ΔE). The last column also includes representative colors corresponding to each tray formulation and the ash sample. The Control tray presented higher luminosity (L* = 70.07), confirming its lighter appearance compared to the ash-containing trays. The tray containing 2% ash recorded an L* value of 31.49, whereas those with 5%, 8%, and 11% ash showed values of 26.09, 22.85, and 22.79, respectively. This decrease is directly related to the characteristic gray coloration of sugarcane bagasse ash, which presented an L* value of only 16.88. As the proportion of this residue in the starch matrix increases, originally expected to yield a lighter material, a gradual darkening of the trays occurs, resulting in visually more opaque products with lower reflectance.

Figure 5: Color parameters of trays containing 0% (Control), 2%, 5%, 8%, and 11% ash, as well as sugarcane bagasse ash. Different letters (a–e) indicate a significant difference between the means of the trays as revealed by Tukey’s test (p < 0.05).
For Control, the chromatic coordinates (a* = −0.06 and b* = 2.90) indicate a slightly yellowish and near-neutral tone. Regarding the chromaticity coordinates for trays with SBA, a* values (green–red axis) remained consistently negative across all formulations, ranging from –0.24 to –0.37, indicating a slight predominance of greenish tones. Similarly, b* values (blue–yellow axis) were also predominantly negative or close to zero, except for the pure ash, which presented a positive value of 0.74. This behavior suggests that the trays tend toward neutral or slightly bluish–green hues, with a general trend toward darker shades closer to gray or black.
For Control, the ΔE* value of 23.49 was significantly lower than those observed for the formulations containing ash, indicating a smaller color deviation relative to the white reference standard. The color difference (ΔE*) of the trays 2%, 5%, 8% and 11% exhibited very high ΔE* values, ranging from 62.05 for the 2% ash tray to 76.63 for the pure ash. These values indicate easily perceptible color differences, reflecting the contrast between the light reference material and the darker, ash-containing trays.
A trend of increasing ΔE* was observed with higher ash proportions, from 62.05 (2%) to approximately 70–71 (8%–11%), reaching 76.63 for the bagasse ash itself. Lightness (L*) was the main parameter responsible for this behavior, while the chromatic components (a* and b*) showed only small variations, without statistically significant differences among the trays. Therefore, the darkening of the trays is the primary factor contributing to the perceived color difference, with lightness being the dominant factor.
The chromaticity coordinates (a* and b*) remained close to zero for all formulations, indicating neutral tones without significant tendencies toward red/green or yellow/blue regions. This neutrality classifies the trays as achromatic materials, composed essentially of shades of gray, ranging from light to dark [39,40]. From an application standpoint, the grayish tone of the trays can represent a potential aesthetic advantage depending on the target product. In packaging design, color is the most influential visual cue in consumer perception, responsible for approximately 62% to 90% of purchasing decisions [40,41]. Neutral colors such as black, white, and gray lack hue and saturation but convey a refined visual sensation, often associated with elegance, sophistication, and minimalism [39,41]. Therefore, the darker tones of the trays produced with higher ash content could be particularly suitable for packaging premium or natural products, where such visual cues reinforce quality and sustainability perceptions.
3.9 Thermogravimetric Analysis
The thermogravimetric analysis (TGA) of the trays and ash is presented in Fig. 6. It can be observed that the final residue after thermal decomposition was 11.12% for the sugarcane bagasse ash, while the trays showed progressively higher values with increasing ash content: 0.42%, 0.92%, 2.17%, 2.82%, and 3.20% for the formulations containing 0%, 2%, 5%, 8%, and 11% ash, respectively. The relatively low residual mass of the ash after thermal decomposition indicates that the material is rich in unburned organic matter that was not completely combusted in the boiler [42].

Figure 6: Thermal stability evaluation by variation in mass and derivative of the mass over time of ash and trays containing 0% (Control), 2%, 5%, 8%, and 11% SBA.
For the ash, two main decomposition events were observed: one between 45°C and 95°C, associated with the loss of highly volatile compounds, and a second, broader one between 350°C and 550°C. The organic fraction is primarily derived from the partial pyrolysis of cellulose, hemicellulose, and lignin components that remain after burning. During heating, these compounds decompose and release a variety of organic molecules, such as levoglucosan, acetone, hexane, hydroxyacetaldehyde, hydroxyactone, pyruvic aldehyde, glyceraldehyde, 5-hydroxymethylfurfural, furfural, and 1,6-anhydro-β-glucofuranose [42,43]. These products are typical intermediates of biomass pyrolysis, and among them, some are more volatile, which may explain the mass loss observed between 45°C and 95°C. Furthermore, it is noteworthy that this stage may be associated with the release of surface and free water, a physical process known as the release stage of shallow and free water. The subsequent event between 350°C and 550°C represents the complete breakdown of the remaining cellulose, hemicellulose, lignin, and their derived compounds that persisted after the initial combustion phase [42,44,45].
The thermal degradation profile of the starch–ash composite trays exhibited three distinct stages of mass loss, primarily associated with the decomposition of the starch-based matrix. The first event, occurring between 80°C and 140°C, is attributed to the evaporation of free and physically adsorbed water within the polymer network. The major mass loss occurred between 250°C and 350°C, corresponding to the main thermal degradation of organic components, particularly the molecular scission of starch chains and the decomposition of plasticizing glycerol [15]. A final, less pronounced event was detected at higher temperatures (450°C–500°C), likely related to the oxidative decomposition of residual carbonaceous matter and the breakdown of thermally stable degradation products formed during starch pyrolysis [46]. The increase in SBA content had a direct influence on the thermal behavior of the trays, particularly with regard to residual mass and stability at high temperatures. As the ash content increased from 0% to 11%, the amount of final residue rose from 0.42% to 3.20%. Although the main degradation stages remained essentially unchanged, indicating that SBA does not alter the fundamental thermal decomposition mechanism of the starch matrix, its incorporation contributed to an increase in thermal resistance at elevated temperatures. This effect is associated with the presence of mineral compounds (e.g., silica) and carbonaceous structures in the ash, which are more resistant to thermal degradation [37,42]. Furthermore, the ash may act as a physical barrier, limiting heat transfer and slowing the decomposition of the organic matrix at later stages [43].
3.10 Fourier-Transform Infrared Spectroscopy (FTIR)
Fig. 7 shows the FTIR spectra of the foam trays and the SBA. Foam trays incorporating SBA showed spectra similar to the control tray. These trays exhibited a band in the 3200–3400 cm−1 region, which corresponds to the vibrational stretching of hydroxyl (–OH) groups [32,47]. This indicates the formation of hydrogen bonds with the starch and other hydrophilic compounds present in the foam trays [32]. This band was not observed in the SBA sample, suggesting that the material does not contain any O-H groups and suggesting reduced availability of hydrophilic functional groups. The peaks at 2917 and 2850 cm−1 in the starch-based foam tray and the SBA sample are assigned to the symmetric stretching vibration of methylene (CH2), methyl (CH3) or aromatic methoxyl groups. These groups could be related to the presence of lipids in the starch or lignin in the SBA sample. The band at around 1631 cm−1 is only present in the foam trays and corresponds to O–H bending. This may indicate the presence of adsorbed water [48], which demonstrates the hydrophilic nature of these materials [32]. The region from 1200 to 800 cm−1 is known as the starch fingerprint region. The peak at 1151 cm−1 is associated with C–O and C–C bonds, while the peak at 994 cm−1 is associated with C–O–H bending [49]. Only the foam trays displayed a band at 607 cm−1, which is indicative of C–OH bending [48]. For the SBA, the band at 1459 cm−1 may indicate a carbonate group [50], and the band near 1049 cm−1 may suggest the presence of Si–O–Si bonds [51]. The band at 678 cm−1 can be attributed to the Si–O bonds of quartz, and the peak at 501 cm−1 may suggest the presence of Al–OH groups [52].

Figure 7: FTIR spectra of ash and trays containing 0% (Control), 2%, 5%, 8%, and 11% SBA.
This study demonstrates that sugarcane bagasse ash—a by-product of burning sugarcane bagasse—can be successfully incorporated into cassava starch to create composite foam trays that improved water resistance, although the materials still exhibit high water absorption due to their porous structure and starch-rich structure. It was also demonstrated that increasing SBA from 0% to 11% progressively reduced moisture content (from 11.27% to 10.82%), water solubility (from 11.39% to 8.81%) and water absorption after 240 min (from 1199.38% to 799.45%). Meanwhile, the contact angle increased from 45.80° to 70.20°, indicating enhanced surface hydrophobicity. However, higher concentrations of SBA can disrupt the formation of the foam matrix, resulting in a decrease in the mechanical resistance of the composite foam tray. The maximum tensile strength dropped from 2.06 MPa (2% SBA) to 0.62 MPa (11% SBA), and Young’s modulus decreased from 354.32 to 112.90 MPa. Therefore, the 5% SBA formulation offered the most balanced combination of water resistance, mechanical strength and elongation at break. This highlights its potential as a sustainable alternative to expanded polystyrene trays. Future studies should employ an experimental design and response surface methodology tools to optimize the temperature, degassing time and water content conditions for producing starch/SBA composite foam trays with improved mechanical and functional properties. The effect of high concentrations of SBA (>11%) could also be evaluated under different temperature, degassing time and water content conditions.
Acknowledgement: The authors thank the Faculty of Animal Science and Food Engineering (FZEA/USP) for performing the color analyses, and the Faculty of Philosophy, Sciences and Letters of Ribeirão Preto (FFCLRP/USP) for administrative support.
Funding Statement: This study was partially funded by the Coordenação de Aperfeiçoamento de Pessoal de Nível Superior (CAPES), Brazil (Finance Code 001; Process No. 88887.213868/2025-00), and by the São Paulo Research Foundation (FAPESP), Brazil (Process No. 2019/06329-0).
Author Contributions: The authors confirm contribution to the paper as follows: conceptualization, Guilherme José Aguilar, Larissa Rodrigues Beitum, Ana Laura Garcia, Delia Rita Tapia-Blácido; methodology, Guilherme José Aguilar, Larissa Rodrigues Beitum, Ana Laura Garcia, Delia Rita Tapia-Blácido; validation, Guilherme José Aguilar, Larissa Rodrigues Beitum, Ana Laura Garcia, Delia Rita Tapia-Blácido; formal analysis, Guilherme José Aguilar, Larissa Rodrigues Beitum, Ana Laura Garcia, Delia Rita Tapia-Blácido; investigation, Guilherme José Aguilar, Larissa Rodrigues Beitum, Ana Laura Garcia, Delia Rita Tapia-Blácido; resources, Delia Rita Tapia-Blácido; data curation, Guilherme José Aguilar, Larissa Rodrigues Beitum, Ana Laura Garcia, Delia Rita Tapia-Blácido; writing—original draft, Guilherme José Aguilar, Larissa Rodrigues Beitum, Ana Laura Garcia, Delia Rita Tapia-Blácido; writing—review & editing, Guilherme José Aguilar, Larissa Rodrigues Beitum, Ana Laura Garcia, Delia Rita Tapia-Blácido; visualization, Guilherme José Aguilar, Larissa Rodrigues Beitum, Ana Laura Garcia, Delia Rita Tapia-Blácido; supervision, Delia Rita Tapia-Blácido; project administration, Delia Rita Tapia-Blácido; funding acquisition, Delia Rita Tapia-Blácido. All authors reviewed and approved the final version of the manuscript.
Availability of Data and Materials: The data that support the findings of this study are available from the Corresponding Author, [Delia Rita Tapia-Blácido], upon reasonable request.
Ethics Approval: Not applicable.
Conflicts of Interest: The authors declare no conflicts of interest.
Abbreviations
| EPS | Expanded polystyrene |
| SBA | Sugarcane bagasse ash |
| SEM | Scanning electron microscopy |
| EDS | Energy-dispersive X-ray spectroscopy |
| TGA | Thermogravimetric analysis |
| CIELAB | Commission Internationale de l’Éclairage Lab* color space |
| ΔE* | Total color difference |
| MTS | Maximum tensile strength |
| MPF | Maximum penetration force |
| MPF/T | Maximum penetration force/Thickness |
| MDR | Maximum penetration distance |
References
1. Zoungrana A, Hausner G, Yuan Q. Sustainability assessment of mycelium bio-foam packaging compared to expanded polystyrene through environmental impact assessment. Discov Sustain. 2025;6(1):1119. doi:10.1007/s43621-025-02025-8. [Google Scholar] [CrossRef]
2. Hernández-García E, Pacheco-Romeralo M, Zomeño P, Viscusi G, Malvano F, Gorrasi G, et al. Development and characterization of thermoformed bilayer trays of paper and renewable succinic acid derived biopolyester blends and their application to preserve fresh pasta. Materials. 2023;16(10):3872. doi:10.3390/ma16103872. [Google Scholar] [PubMed] [CrossRef]
3. Aguilar GJ, de Oliveira AM, Augusto PED, Tapia-Blácido DR. Advances in eco-friendly materials for sustainable packaging and single-use utensils: a decade of innovation in preparation, characterization, and applications. ACS Appl Mater Interfaces. 2025;17(43):59032–50. doi:10.1021/acsami.5c16814. [Google Scholar] [PubMed] [CrossRef]
4. Iquiapaza IYC, Aguilar GJ, Zitei-Baptista LF, de Souza NO, da Ferreira MES, Tapia-Blácido DR. Development of Andean potato starch active films containing Brazilian green propolis extract for preserving virgin olive oil against photo-oxidation. Starch-Stärke. 2025;77(9):e70085. doi:10.1002/star.70085. [Google Scholar] [CrossRef]
5. Ochoa-Yepes O, Ceballos RL, Famá L. Effect of wheat and oat bran on the physicochemical properties of edible starch-based films obtained by extrusion for food packaging applications. Starch-Stärke. 2023;75(1–2):2200087. doi:10.1002/star.202200087. [Google Scholar] [CrossRef]
6. Bergel BF, da Luz LM, Santana RMC. Comparative study of the influence of chitosan as coating of thermoplastic starch foam from potato, cassava and corn starch. Prog Org Coat. 2017;106:27–32. doi:10.1016/j.porgcoat.2017.02.010. [Google Scholar] [CrossRef]
7. Datta D, Patra M, Pamanji D, Ravindiran G, Das B. A sustainable approach to enhance biodegradability of recycled LDPE with starch biofillers derived from potato peels and rice husk ash. Indian Chem Eng. 2025;67(1):49–68. doi:10.1080/00194506.2024.2422339. [Google Scholar] [CrossRef]
8. Ferreira DCM, Molina G, Pelissari FM. Biodegradable trays based on cassava starch blended with agroindustrial residues. Compos B Eng. 2020;183:107682. doi:10.1016/j.compositesb.2019.107682. [Google Scholar] [CrossRef]
9. Vieira AF, Pereira TRR, da Silva LPFR, Rodrigues TJA, de Almeida RD, Santos NC, et al. Mechanical, antimicrobial and morphological properties of biodegradable trays based on cassava starch and agroindustrial processing residues. Packag Technol Sci. 2025;38(3):195–210. doi:10.1002/pts.2866. [Google Scholar] [CrossRef]
10. Phiriyawirut M, Wachararuangroong K, Wongsaroj M, Arompijit N. Bio-based foams from agricultural waste: optimizing corn starch-corn husk composites with xanthan gum for cushioning applications. J Renew Mater. 2026;14(3):1–10. doi:10.32604/jrm.2026.02025-0227. [Google Scholar] [CrossRef]
11. Jamir L, Kumar V, Kaur J, Kumar S, Singh H. Composition, valorization and therapeutical potential of molasses: a critical review. Environ Technol Rev. 2021;10(1):131–42. doi:10.1080/21622515.2021.1892203. [Google Scholar] [CrossRef]
12. Yogitha B, Karthikeyan M, Muni Reddy MG. Progress of sugarcane bagasse ash applications in production of eco-friendly concrete—review. Mater Today Proc. 2020;33(9):695–9. doi:10.1016/j.matpr.2020.05.814. [Google Scholar] [CrossRef]
13. Gao K, Li S, Niu Q, Zhang X. Research progress on bio-based biodegradable barrier materials. J Renew Mater. 2025;13(12):2309–53. doi:10.32604/jrm.2025.02025-0108. [Google Scholar] [CrossRef]
14. Aguilar GJ, Tapia-Blácido DR. Use of annatto dye extraction residue as additive in the cassava starch composite foam tray. J Vinyl Addit Technol. 2023;29(6):1093–108. doi:10.1002/vnl.22037. [Google Scholar] [CrossRef]
15. Aguilar GJ, da Silva YF, Augusto PED, Perré P, Tapia-Blácido DR. Morphological, structural, and functional properties of biobased cassava starch foam trays added with turmeric pigment extraction residue. J Clean Prod. 2025;515(6):145827. doi:10.1016/j.jclepro.2025.145827. [Google Scholar] [CrossRef]
16. Mello LRPF, Mali S. Use of malt bagasse to produce biodegradable baked foams made from cassava starch. Ind Crops Prod. 2014;55:187–93. doi:10.1016/j.indcrop.2014.02.015. [Google Scholar] [CrossRef]
17. D 664-94. Standard test method for measure content of paper and paperboard by oven drying. West Conshohocken, PA, USA: American Society for Testing and Materials—ASTM; 1994. [Google Scholar]
18. Gontard N, Guilbert S, Cuq J-L. Edible wheat gluten films: influence of the main process variables on film properties using response surface methodology. J Food Sci. 1992;57(1):190–5. doi:10.1111/j.1365-2621.1992.tb05453.x. [Google Scholar] [CrossRef]
19. Vercelheze AES, Fakhouri FM, Dall’Antônia LH, Urbano A, Youssef EY, Yamashita F, et al. Properties of baked foams based on cassava starch, sugarcane bagasse fibers and montmorillonite. Carbohydr Polym. 2012;87(2):1302–10. doi:10.1016/j.carbpol.2011.09.016. [Google Scholar] [CrossRef]
20. Bahurudeen A, Wani K, Basit MA, Santhanam M. Assesment of pozzolanic performance of sugarcane bagasse ash. J Mater Civ Eng. 2016;28(2):1361. doi:10.1061/(ASCE)MT.1943-5533.0001361. [Google Scholar] [CrossRef]
21. Singh Rawat S, Sharma A. Sugarcane bagasse ash—the future composite material: a literature review. Mater Today Proc. 2023;15(2):5648187. doi:10.1016/j.matpr.2023.07.272. [Google Scholar] [CrossRef]
22. Driemeier C, Oliveira MM, Mendes FM, Gómez EO. Characterization of sugarcane bagasse powders. Powder Technol. 2011;214(1):111–6. doi:10.1016/j.powtec.2011.07.043. [Google Scholar] [CrossRef]
23. Ferreira AM, Martins J, Carvalho LH, Magalhães FD. Biosourced disposable trays made of brewer’s spent grain and potato starch. Polymers. 2019;11(5):923. doi:10.3390/polym11050923. [Google Scholar] [CrossRef]
24. Quispe-Sanchez L, Chuquilín-Goicochea R, Figueroa-Avalos HM, Chavez SG, Yoplac I, Mori S, et al. Biodegradable trays of cassava starch reinforced with Ceiba, coffee and cocoa fibers: a sustainable alternative to plastics. Appl Food Res. 2025;5(2):101277. doi:10.1016/j.afres.2025.101277. [Google Scholar] [CrossRef]
25. Yun S-M, Kang M, Park SY, Eun J-B, Chun HH. Characterization of biodegradable corn starch-based foam container incorporating kimchi cabbage (Brassica rapa L. pekinensis) by-product. LWT. 2023;188(10):115432. doi:10.1016/j.lwt.2023.115432. [Google Scholar] [CrossRef]
26. Daw S, Das A, Das SK. Effect of nano alumina on the poly (vinyl alcohol)/rice husk ash nanocomposite films—properties and application. Catal Today. 2025;459(1526):115420. doi:10.1016/j.cattod.2025.115420. [Google Scholar] [CrossRef]
27. Purwar R, Verma A, Batra R. Antimicrobial gelatin/sericin/clay films for packaging of hygiene products. J Polym Eng. 2019;39(8):744–51. doi:10.1515/polyeng-2018-0406. [Google Scholar] [CrossRef]
28. Luna P, Darniadi S, Chatzifragkou A, Charalampopoulos D. Biodegradable foams based on extracted fractions from sorghum by-products. IOP Conf Ser Earth Environ Sci. 2021;749(1):12057. doi:10.1088/1755-1315/749/1/012057. [Google Scholar] [CrossRef]
29. Marimuthu S, Saikumar A, Badwaik LS. Development and characterization of biodegradable foam plates from corn starch and banana bunch stalks coated with beeswax. Biomass Convers Biorefin. 2024;15(5):7763–77. doi:10.1007/s13399-024-05782-0. [Google Scholar] [CrossRef]
30. Garcia-Arteaga N, Quispe-Sanchez L, Medina-Bocanegra D, Hernandez-Diaz E, Yoplac I, Mena-Chacon LM, et al. Active biodegradable packaging based on potato starch and purple corn by-products (Zea mays L.) for postharvest preservation of Spondias purpurea. J Agric Food Res. 2026;27:102829. doi:10.1016/j.jafr.2026.102829. [Google Scholar] [CrossRef]
31. Dalla Nora FB, Marczak LDF, Carvalho LF, Menegalli FC. Recycling rice husk ash as a filler on biodegradable cassava starch-based foams. Sci Rep. 2022;12:18477. doi:10.1038/s41598-022-22981-0. [Google Scholar] [CrossRef]
32. Vásquez-Bacilio EF, Mejia-Llontop CI, Tirado-Rodríguez CE, MdeF Arévalo-Oliva, Hurtado-Soria BZ, Villanueva E, et al. Development of biodegradable foam trays from brewer’s malt bagasse and potato residues from agricultural crops. Polymers. 2025;17(15):2146. doi:10.3390/polym17152146. [Google Scholar] [CrossRef]
33. Rodrigues NHP, de Souza JT, Rodrigues RL, Canteri MHG, Tramontin SMK, de Francisco AC. Starch-based foam packaging developed from a by-product of potato industrialization (Solanum tuberosum L.). Appl Sci. 2020;10(7):2235. doi:10.3390/app10072235. [Google Scholar] [CrossRef]
34. Fatima S, Khan MR, Ahmad I, Sadiq MB. Recent advances in modified starch based biodegradable food packaging: a review. Heliyon. 2024;10(6):e27453. doi:10.1016/j.heliyon.2024.e27453. [Google Scholar] [PubMed] [CrossRef]
35. Hassan B, Chatha SAS, Hussain AI, Zia KM, Akhtar N. Recent advances on polysaccharides, lipids and protein based edible films and coatings: a review. Int J Biol Macromol. 2018;109(4):1095–107. doi:10.1016/J.IJBIOMAC.2017.11.097. [Google Scholar] [PubMed] [CrossRef]
36. Naghib SM, Khorasani MA, Sharifianjazi F, Tavamaishvili K. Polysaccharide-based nanocomposites in alcohol-responsive food packaging: an overview on emerging trends and future strategies. Food Packag Shelf Life. 2026;53(1):101684. doi:10.1016/j.fpsl.2025.101684. [Google Scholar] [CrossRef]
37. Wasti S, Clarkson C, Johnston E, Pu Y, Bhagia S, Tekinalp H, et al. Sizing of discontinuous natural fibers: effect of sizing approach and sizing concentration on composite properties. Compos Part A Appl Sci Manuf. 2025;197:109029. doi:10.1016/j.compositesa.2025.109029. [Google Scholar] [CrossRef]
38. Pongsa U, Sangrayub P, Saengkhiao P, Lumsakul P, Kaweegitbundit P, Kasemsiri P, et al. Properties of biodegradable foam composites made from coconut residue as a function of the reinforcing phase of cassava starch. Eng Appl Sci Res. 2023;50:270–7. doi:10.14456/easr.2023.30. [Google Scholar] [CrossRef]
39. Pereira C. O preto como signo de qualidade e distinção na comunicação da embalagem de alimentos. Rev FAMECOS. 2017;24(1):ID23706. doi:10.15448/1980-3729.2017.1.23706. [Google Scholar] [CrossRef]
40. Singh S. Impact of color on marketing. Manag Decis. 2006;44(6):783–9. doi:10.1108/00251740610673332. [Google Scholar] [CrossRef]
41. He XF, Lv XG. From the color composition to the color psychology: soft drink packaging in warm colors, and spirits packaging in dark colors. Color Res Appl. 2022;47(3):758–70. doi:10.1002/col.22748. [Google Scholar] [CrossRef]
42. Mohomane SM, Motaung TE, Revaprasadu N. Thermal degradation kinetics of sugarcane bagasse and soft wood cellulose. Materials. 2017;10(11):1246. doi:10.3390/ma10111246. [Google Scholar] [PubMed] [CrossRef]
43. Shen DK, Gu S. The mechanism for thermal decomposition of cellulose and its main products. Bioresour Technol. 2009;100(24):6496–504. doi:10.1016/j.biortech.2009.06.095. [Google Scholar] [PubMed] [CrossRef]
44. Zhang S, Dong Y, Qi G. TG-GC-MS study of pyrolysis characteristics and kinetic analysis during different kinds of biomass. Int J Hydrogen Energy. 2023;48(30):11171–9. doi:10.1016/j.ijhydene.2022.11.333. [Google Scholar] [CrossRef]
45. Zhang S, Gao Y, Tong H, Dong Y, Qi G, Wang P. The pyrolysis characteristics of bagasse were studied by TG-MS-FTIR. Processes. 2024;12(11):2494. doi:10.3390/pr12112494. [Google Scholar] [CrossRef]
46. Reis MO, Olivato JB, Bilck AP, Zanela J, Grossmann MVE, Yamashita F. Biodegradable trays of thermoplastic starch/poly (lactic acid) coated with beeswax. Ind Crops Prod. 2018;112(1):481–7. doi:10.1016/j.indcrop.2017.12.045. [Google Scholar] [CrossRef]
47. Mena-Chacon LM, Quispe-Sanchez L, Chicana F, Oblitas R, Huaman-Pilco AF, Mori S, et al. Biopolymers extracted from agro-industrial wastes of lucuma, avocado and rice for production of biodegradable trays. J Agric Food Res. 2025;23(2):102231. doi:10.1016/j.jafr.2025.102231. [Google Scholar] [CrossRef]
48. Fernanda Sierra Montes L, Andrea Melaj M, Cecilia Lorenzo M, Ribba L, Alejandra Garcia M. Biodegradable composite materials based on cassava starch and reinforced with topinambur (Helianthus tuberosus) aerial part fiber. Sustain Polym Energy. 2024;2(2):10004. doi:10.35534/spe.2024.10004. [Google Scholar] [CrossRef]
49. Koester DL, Gomes LM, Dresch AP, Matsuo TT, dos Santos DF, Bender JP, et al. Biodegradable starch foams reinforced by food-chain side streams. Int J Biol Macromol. 2024;275(9):133386. doi:10.1016/j.ijbiomac.2024.133386. [Google Scholar] [PubMed] [CrossRef]
50. Frías M, Villar E, Savastano H. Brazilian sugar cane bagasse ashes from the cogeneration industry as active pozzolans for cement manufacture. Cem Concr Compos. 2011;33(4):490–6. doi:10.1016/j.cemconcomp.2011.02.003. [Google Scholar] [CrossRef]
51. Garcia-Perez T, Ortiz-Ulloa JA, Jara-Cobos LE, Pelaez-Samaniego MR. Adding value to sugarcane bagasse ash: potential integration of biogas scrubbing with vinasse anaerobic digestion. Sustainability. 2023;15(21):15218. doi:10.3390/su152115218. [Google Scholar] [CrossRef]
52. Sai Pradeep P, Mayakrishnan M. Microstructural characterization of lime modified bagasse ash blended expansive clays using digital image analysis. Environ Earth Sci. 2023;82(7):158. doi:10.1007/s12665-023-10848-9. [Google Scholar] [CrossRef]
Cite This Article
 Copyright © 2026 The Author(s). Published by Tech Science Press.
This work is licensed under a Creative Commons Attribution 4.0 International License , which permits unrestricted use, distribution, and reproduction in any medium, provided the original work is properly cited.
 Downloads
 Citation Tools
