
 Submit a Paper
 Propose a Special lssue
 Open Access
ARTICLE

A genetic variant study of bortezomib-induced peripheral neuropathy in Chinese multiple myeloma patients
Department of Hematology, The First Affiliated Hospital of China Medical University, Shenyang, 110001, China
* Corresponding Author: LIJUN ZHANG. Email:
Oncology Research 2024, 32(5), 955-963. https://doi.org/10.32604/or.2023.043922
Received 16 July 2023; Accepted 05 December 2023; Issue published 23 April 2024
 View Full Text
 Download PDF
Abstract
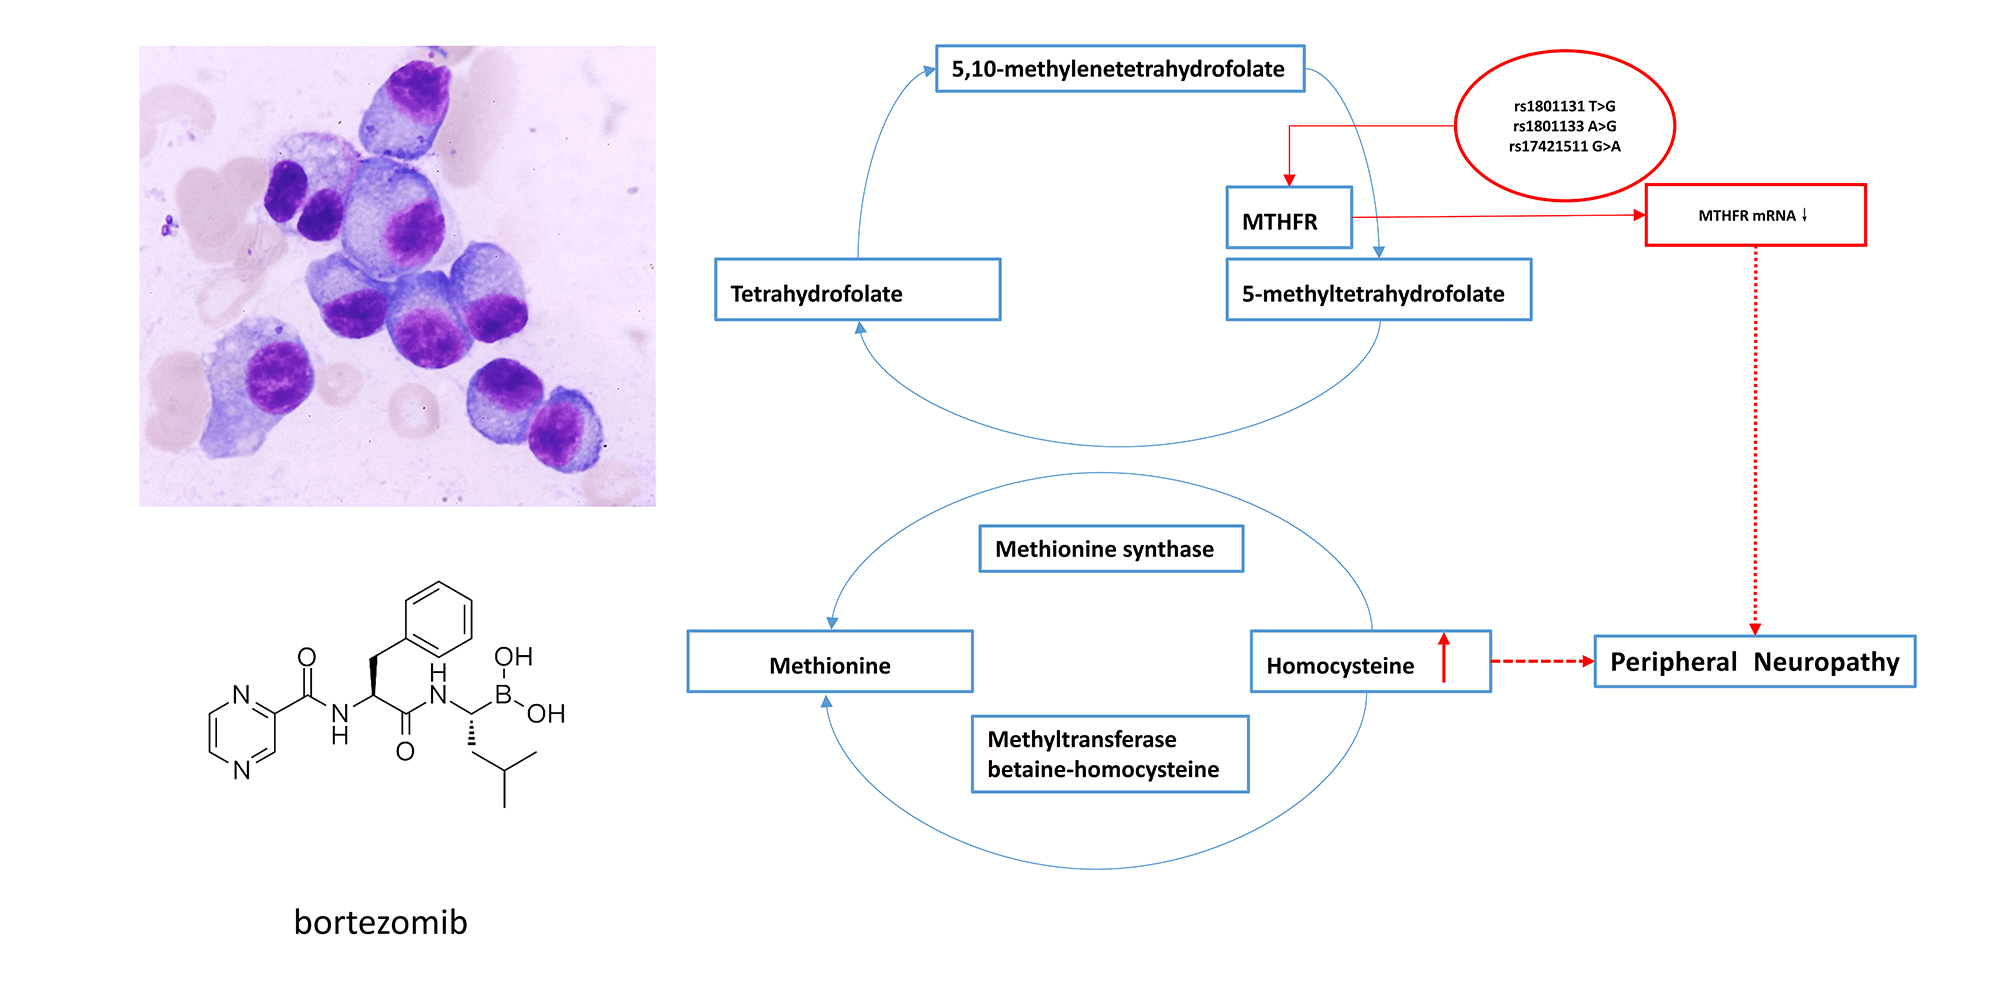
Background: Bortezomib results in peripheral neuropathy (PN) in approximately 50% of patients, during multiple myeloma (MM) treatment, a complication known as Bortezomib-induced peripheral neuropathy (BIPN). The drug response varies among individuals. Genetic factor may play an important role in BIPN. Methods: A next-generation sequencing (NGS) panel containing 1659 targets from 233 genes was used to identify risk variants for developing BIPN in 204 MM patients who received bortezomib therapy. mRNA expression of MTHFR and ALDH1A1 in 62 peripheral blood samples was detected by real-time quantitative PCR (RT-qPCR). Serum homocysteine (Hcy) levels were detected in 40 samples by chemiluminescent microparticle immunoassay (CMIA). Results: Compared with the non-BIPN group (n = 89), a total of 8 significantly associated single nucleotide polymorphisms (SNPs) were identified in the BIPN group (n = 115): MTHFR (rs1801131, rs1801133, rs17421511), EPHX1 (rs1051740), MME (rs2016848), ALDH1A1 (rs6151031), HTR7 (rs1935349) and CYP2A6 (rs8192720). The mRNA expression level of MTHFR in newly diagnosed patients with peripheral neuritis after treatment (NP group) was lower than that of newly diagnosed patients without peripheral neuritis after treatment (NnP group) (1.70 ± 0.77 vs. 2.81 ± 0.97, p = 0.009). Serum Hcy levels were significantly higher in BIPN group than in non-BIPN group (11.66 ± 1.79 μmol/L vs. 8.52 ± 3.29 μmol/L, p = 0.016) and healthy controls (11.66 ± 1.79 μmol/L vs. 8.55 ± 2.13 μmol/L, p ≤ 0.001). Conclusion: CYP2A6, EPHX1, MTHFR, ALDH1A1, HTR7, MME and BIPN are linked in Chinese MM patients. BIPN is more likely to occur in patients with lower MTHFR mRNA expression, which might result in higher serum Hcy levels.Graphic Abstract
Keywords
Supplementary Material
Supplementary Material FileMultiple myeloma (MM) is a hematological malignancy caused by malignant proliferation of plasma cells, and currently ranks second in hematological disease incidence [1]. Bortezomib is a proteasome inhibitor, that mainly inhibits Nuclear factor κB (NF-κB) signaling [2], downregulates growth factor receptors, suppresses adhesion molecule expression and inhibits angiogenesis [3]. It is the first proteasome inhibitor approved for the market. In 2003, bortezomib was approved by the US Food and Drug Administration (FDA) for treatment of MM. It can effectively inhibit proliferation of myeloma cells and promote apoptosis of myeloma cells, offering new hope for treatment of MM. At present, bortezomib (B) and lenalidomide (R) combined with dexamethasone (D) are widely used in China, and this regimen is currently the first choice of standard therapy for MM patients [4].
Although, patients with MM benefit greatly with use of bortezomib with respect to symptoms, patients receiving bortezomib have some common adverse effects, including peripheral neuropathy, gastrointestinal symptoms, thrombocytopenia, and postural hypotension. Among the adverse effects, bortezomib-induced peripheral neuropathy (BIPN) is the most serious, with a high incidence of approximately 50% [5–7], and has attracted the attention of clinicians. BIPN mainly develops as limb numbness or pain, typically manifesting as glove and sock type sensory disorders [8]. Patients with severe peripheral neuropathy need to have a reduced dose of bortezomib or stop its use, which might have adverse effects on prognosis and quality of life. Despite the established dose and clinical risk factors for BIPN, interindividual variation and susceptibility have been observed to be associated with the development of drug-related adverse events under similar treatment plans. It has been reported that this unpredictability is partly attributable to genetic differences [9] Single nucleotide polymorphisms (SNPs) and gene expression profiles may play an important role in BIPN. Studies on genetic variant correlations with BIPN have been reported in Western countries. Several studies have identified genes with variant SNPs involved in different functions, such as bortezomib metabolism (CYP1A1, CYP1A2, CYP1B1, CYP2C19, and CYP2S1) [10–13], protein transport (ABCC1 and ABCC6) [14], nervous system development, structure and function (TCF4, ABI3BP BASP1, NRN1, TMEM107, POGZ, EDN1, ANKRD45, PRKG1, and KCNA5), proteasome function and proteolytic process (BTRC PSMB1, PSMB4, F2) [11,14,15], regulation of RNA transcription (MALAT1, EGR1, FMR1, PKNOX1), protein, steroid, and lipid synthesis (CYP17A1, HK2 TDO2, and CBS) [16,17] and inflammatory and immune responses (CTLA4, HIST1H2BC, CX3CR1, ERAP2, CFH, MX2, FCRL3, FCRL2, C1orf106NEB, IL17RD, IL10RA, and NFATC4) [11,14,15]. However, there have been no similar genetic studies in Chinese MM patients.
Moreover, there are no suitable clinical predictors or biomarkers to identify patients at high risk of developing BIPN. We propose that genotyping MM patients for the SNPs examined in this study will help in identifying which genotypes are susceptible to BIPN and explore the possible mechanism of BIPN.
From May 2019 to December 2021, 204 Chinese MM patients who received bortezomib therapy at the Department of Hematology in the First Affiliated Hospital of China Medical University were recruited. This study was approved by the Ethics Committee of the First Affiliated Hospital of China Medical University, the Ethical Committee process number is [2023] 523. Written inform consent was obtained from all participants involved in the study.
Inclusion criteria: (1) Chinese patients from northeast China, and of Han ethnicity; (2) diagnosed with MM without other hematological diseases or peripheral nerve-related diseases before treatment; and (3) receiving treatment with bortezomib (standard dose of 1.3 mg/m2) ≥3 cycles or less than 3 cycles of treatment because of BIPN intolerance.
The patients received induction therapy with bortezomib-dexamethasone (BD), bortezomib-thalidomide-dexamethasone (BTD) or bortezomib-lenalidomide -dexamethasone (BRD). No other chemotherapy drugs were used during follow-up. The grade of peripheral neuritis after bortezomib treatment was determined according to the National Cancer Institute Common Terminology Criteria for Adverse Events version 5.0 [18].
Genomic DNA was isolated from peripheral blood nucleated cells using QIAamp DNA Blood Kit (Qiagen, Hilden,Germany) according to the manufacturer’s instructions. Quantification of the DNA concentration was performed using Qubit® dsDNA HS Assay Kit (Yeasen, Shanghai, China) according the manufacturer’s protocol. The NGS panel, which contains 1659 targets from 233 drug metabolism-related genes, including drug-metabolizing enzymes, drug transporters, gene expression regulators, and additional genes of potential pharmacological interest (shown in Suppl. Table S1), was amplified with 1659 pairs of custom-designed primers. Genotyping was performed using MultipSeq® Custom Panel Kit (IGMU228XV1) (iGeneTech, Beijing, China). Protocols were carried out according to the manufacturer’s recommendations. High-quality sequencing reads were specifically captured using the amplicon sequencing method (E-Seq Mecidal, Beijing, China) and sequenced using an Illumina HiSeq X ten (Illumina, Inc., CA, USA) at high depth with 150 bp paired-end reads. Burrows Wheeler Aligner (BWA-Version: 0.7.5a-r405) was used for alignment (GRCh38; hg38). Genome Analysis Toolkit (GATK, version 4.1) was used for indel realignment, quality score recalibration, variant calling, and genotyping (using Haplotype Caller). The operating system is linux.
Total RNA was isolated from the peripheral blood of MM patients using TRIzol reagent (Invitrogen), according to the manufacturer’s instructions. Total RNA was reverse transcribed to cDNA using Prime-Script RT Master Mix (Invitrogen). For detection of MTHFR and ALDH1A1 levels in the peripheral bloodof patients and controls, RT-qPCR was conducted using SYBR Green Master Mix (TaKaRa) and an ABI 7500 Real-Time PCR system (Applied Biosystems). The following conditions were used: one cycle of 95°C for 30 s, followed by 40 cycles of a two-step cycling program (95°C for 5 s, 60°C for 34 s). mRNA expression of target genes was calculated by the 2−ΔΔCt method and normalized to GAPDH mRNA expression. The primers for the MTHFR gene were as follows: forward:5′-TCACCATCAACTCACAGCCC-3′; reverse:5′-AGAAGTGCTTCCGCTGTCTC-3′. The primers for the ALTH1A1 gene were as follows: forward:5′-AGTGCCCCTTTGGTGGATTC-3′; reverse:5′-AAGAGCTTCTCTCCACTCTTG-3′. The primers for the GAPDH gene were as follows: forward:5′-GTCTCCTCTGACTTCAACAGCG-30; reverse: 50-ACCACCCTGTTGCTGTAGCCAA-3′.
Detection of serum homocysteine (Hcy)
Serum Hcy levels were detected by chemiluminescent microparticle immunoassay (CMIA). The reagents were purchased from Abbott Germany Biotechnology Co., Ltd. (Germany), and the operations were carried out in strict accordance with the Homocysteine Reagent kit instructions.
Quantitative differences between groups were compared using t-test or Mann-Whitney u-test (Hb, LDH, Cr, ß2-MG, Ca) depends on whether the date conforms to a normal distribution, and chi-square (χ2) test was used for count date with SPSS 22.0 software. Sequencing data were sorted and analyzed by R version 3.4, and the required text processing was performed using Perl language. The machine learning method of R software was used to calculate the variation frequency (the number of variant bases (or the number of variant genotypes)/the total number of bases (the total number of genotypes)). Minor allele frequency (MAF) <0.05 was not considered to meet the research criteria and not included. Variant analysis between the BIPN group and the non-BIPN group was performed using R statistical software version 3.4 to estimate odds ratios (ORs) and p values. Results with a p value < 0.05 were considered statistically significant and selected for subsequent analysis. Variants with OR > 1 and p ≤ 0.01 from the above results were selected as SNPs most related to BIPN. A binary logistic model was used for multivariate analysis with SPSS 22.0 software, and p < 0.05 was considered statistically significant.
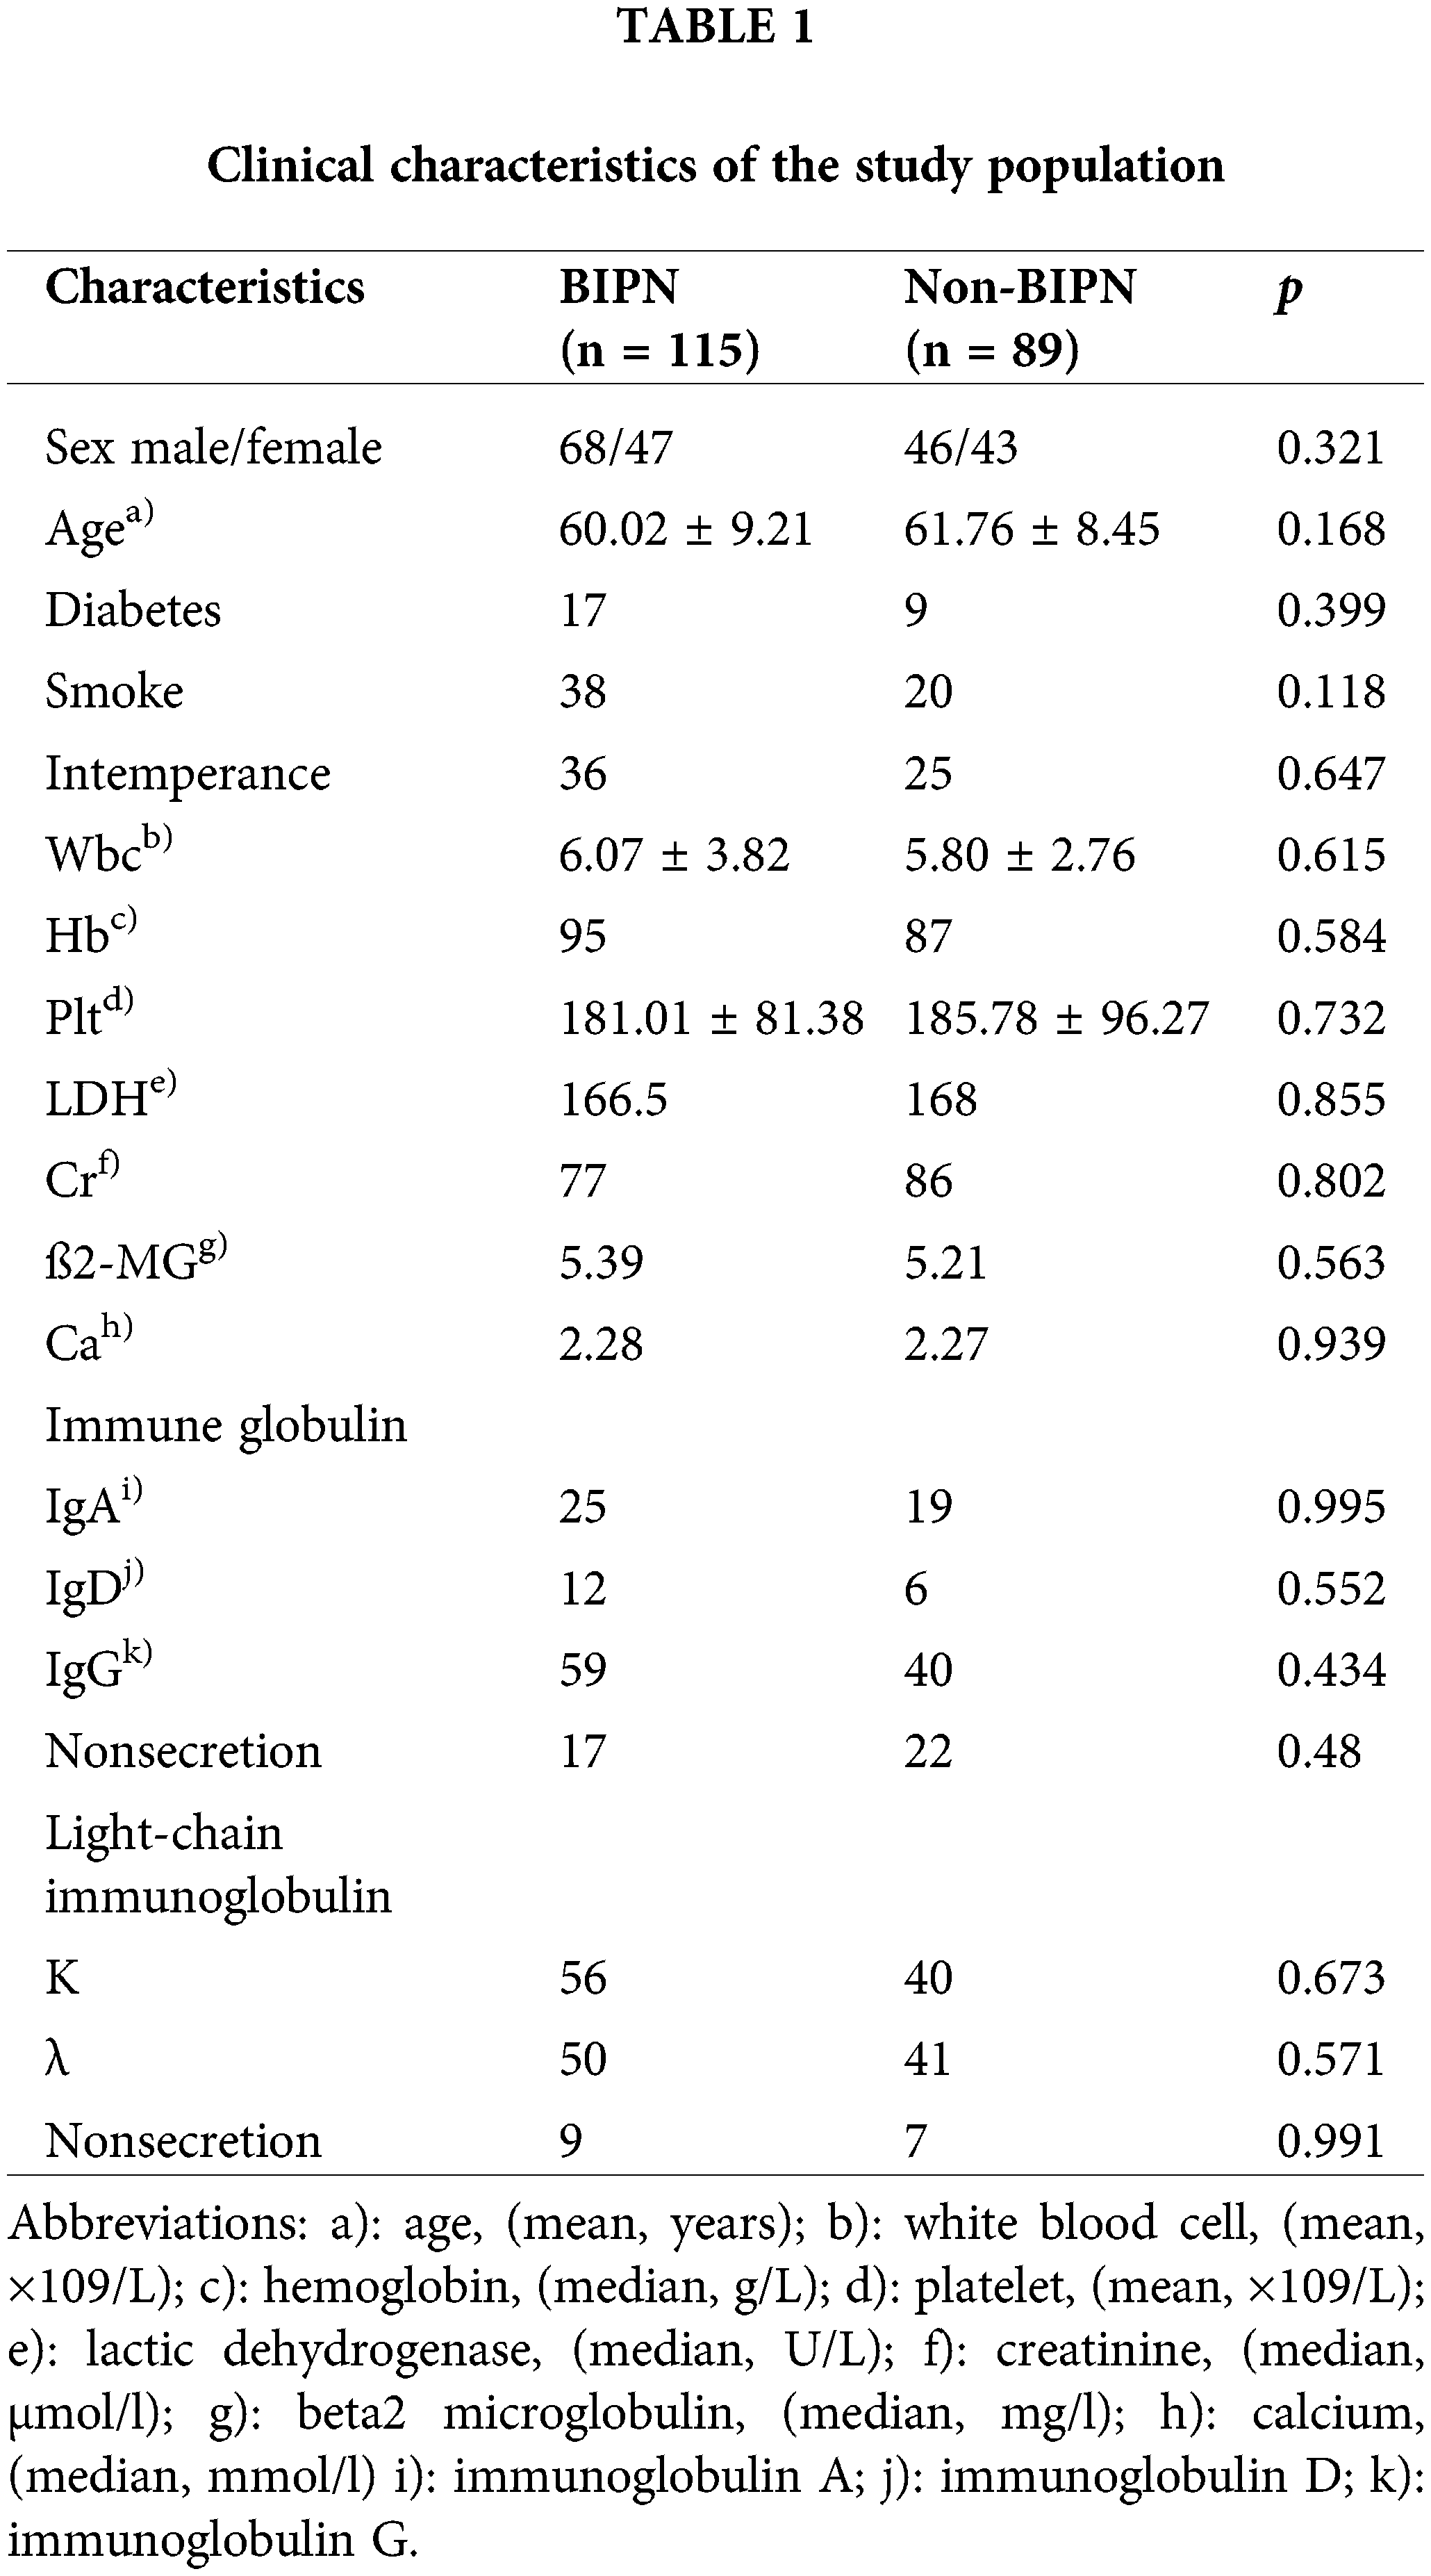
A total of 204 MM patients who met the inclusion criteria and for whom sequencing was successful were enrolled in this study, including 115 patients with BIPN and 89 patients without BIPN. There was no significant difference in clinical information, such as sex and age, between the BIPN group and the non-BIPN group (p > 0.05). The information is shown in Table 1.
Sequencing analysis was performed for 204 MM samples (115 BIPN and 89 non-BIPN). Eighty-six differential records with a p value < 0.05 were found, corresponding to 44 SNPs. The information is shown in Suppl. Table S2. OR values of the above 86 records were calculated, and 37 records with both p value < 0.05 and OR > 1 were obtained, corresponding to 13 genes. The information is shown in Suppl. Table S3.
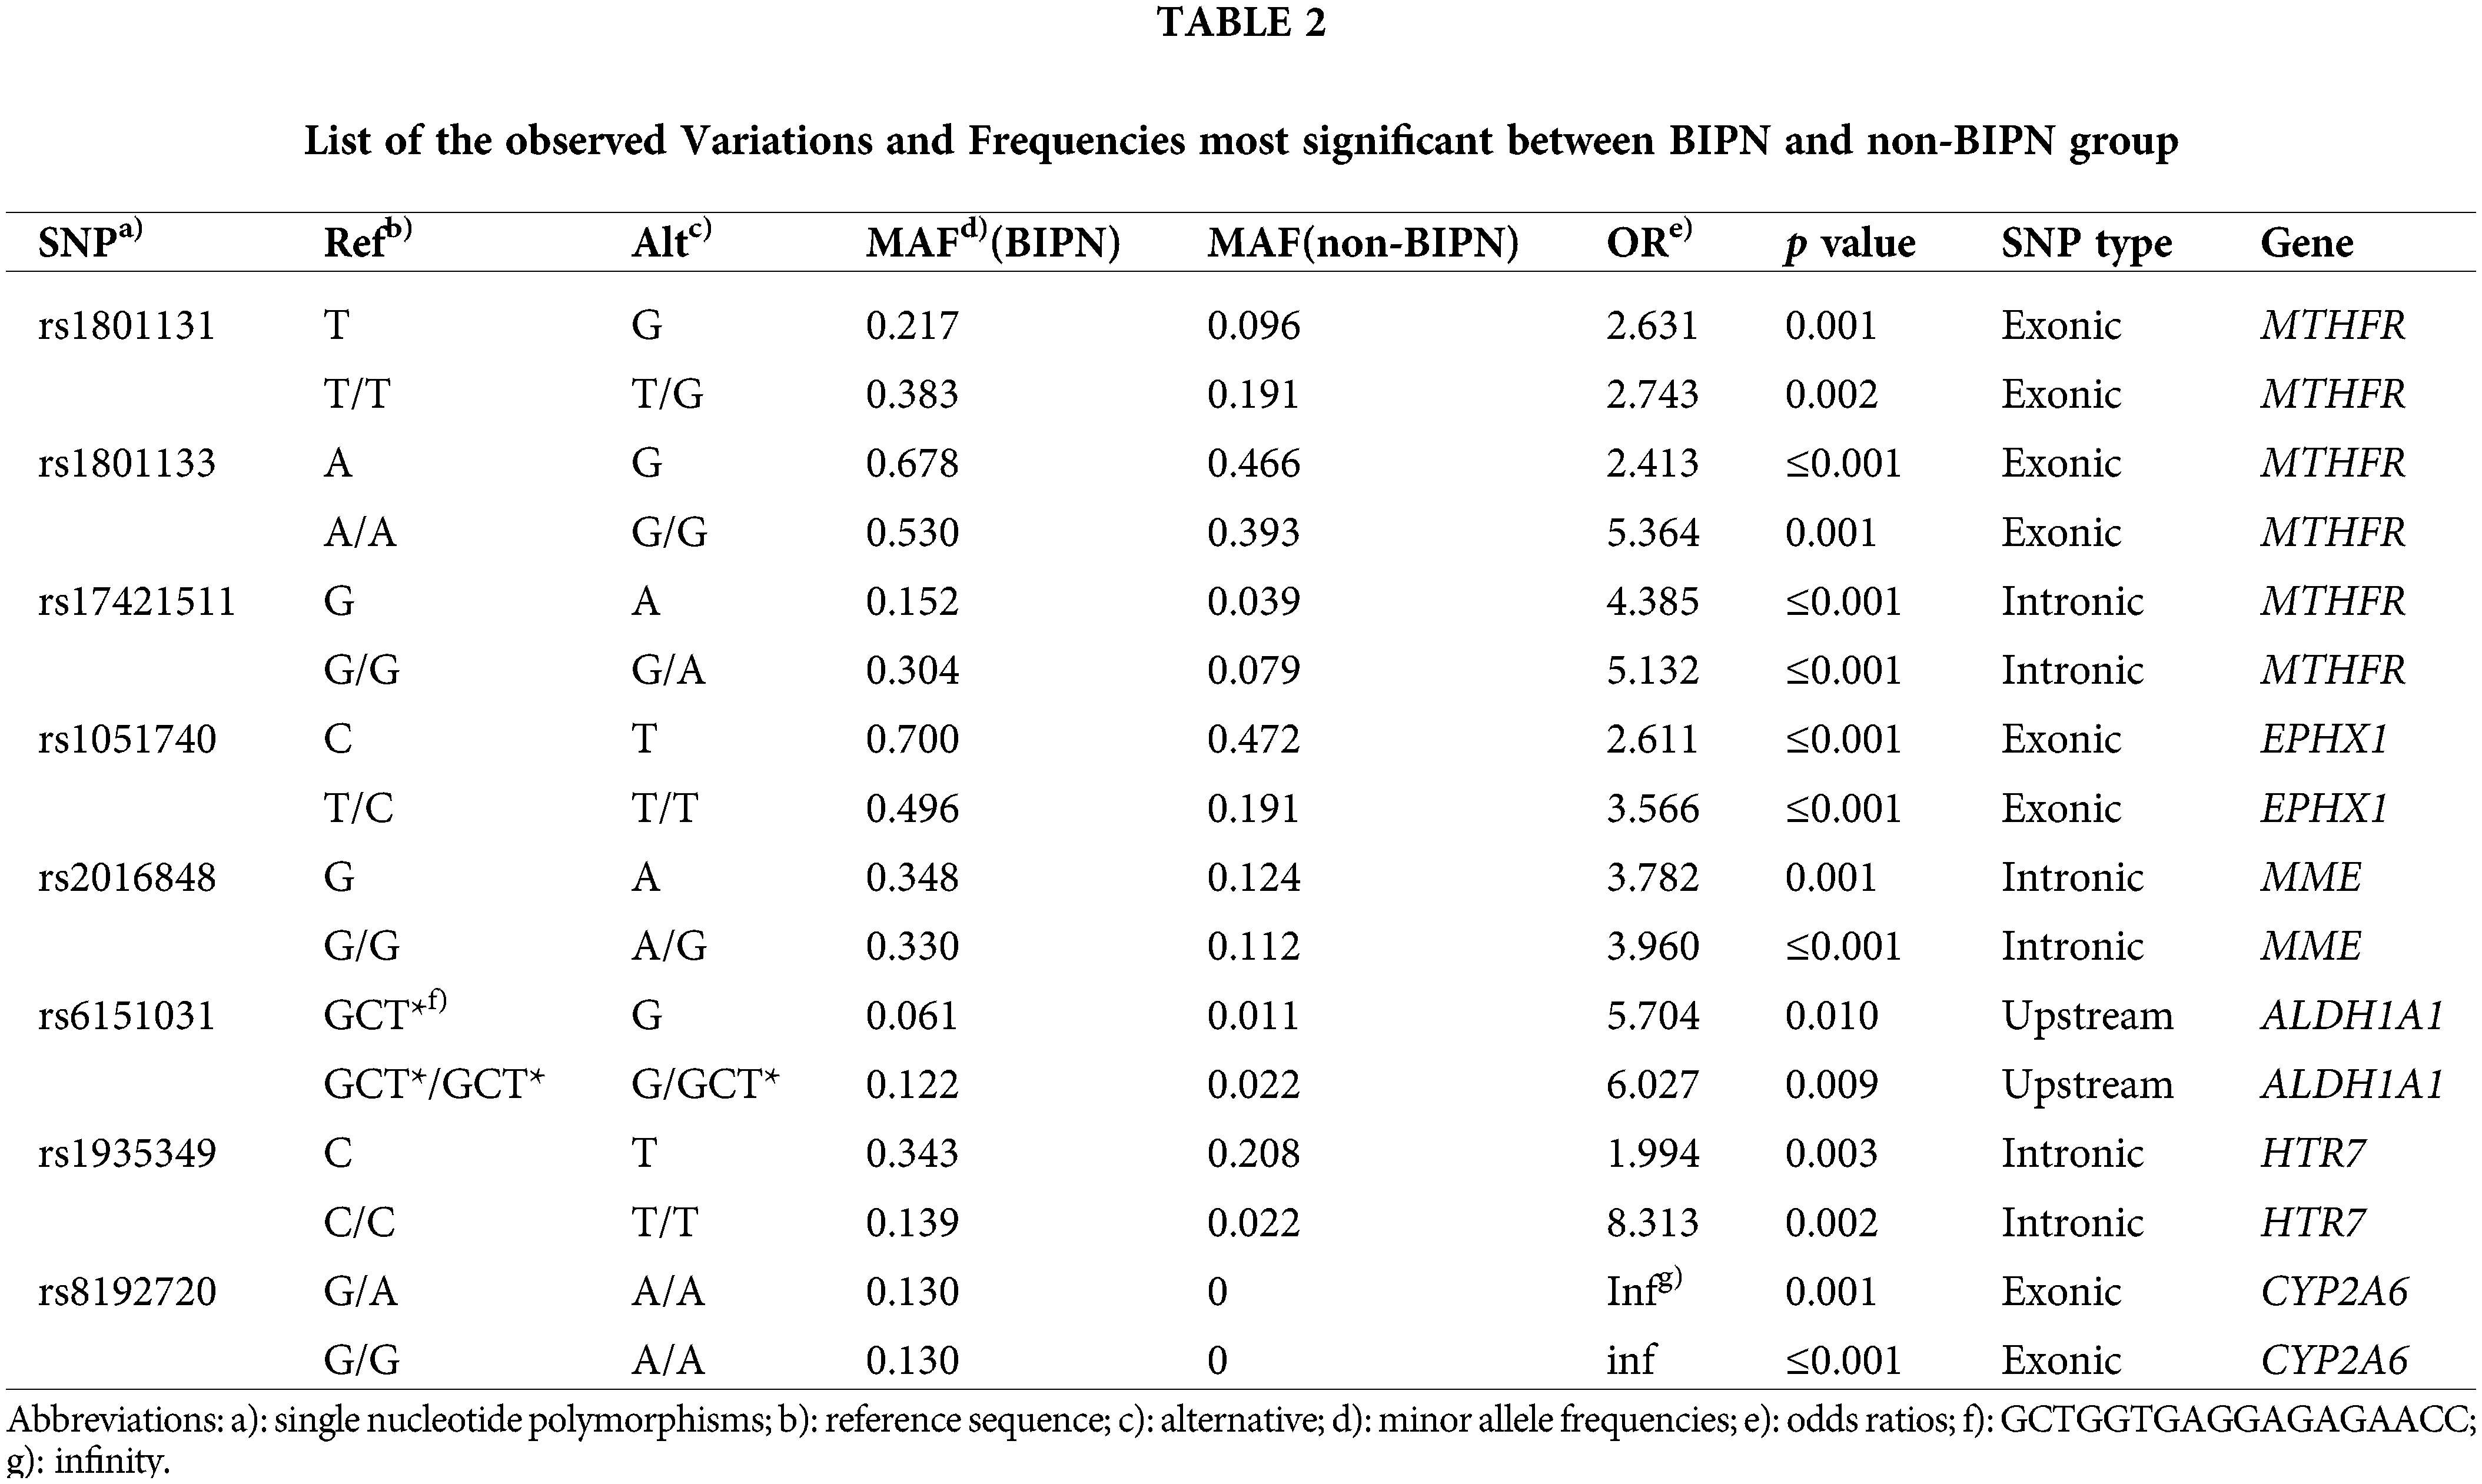
The most significantly different SNPs between the BIPN group and non-BIPN group were detected by the cutoff value of p ≤ 0.01 and OR > 1, among the 37 records. Finally, 16 records most related to BIPN were obtained, involving 8 SNPs and 6 genes. The variation information and genotype variation frequency of the two groups are shown in Table 2. The results were as follows: rs1801131 in MTHFR (T > G, AF: 0.217 (BIPN) vs. 0.096 (non-BIPN), OR = 2.631, p = 0.001; T/T > T/G, AF: 0.383 vs. 0.191, OR = 2.743, p = 0.002); rs1801133 in MTHFR (A > G, AF: 0.678 vs. 0.466, OR = 2.413, p ≤ 0.001; A/A > G/G, AF: 0.530 vs. 0.393, OR = 5.364, p = 0.001); rs17421511 in MTHFR (G > A, AF: 0.152 vs. 0.039, OR = 4.385, p ≤ 0.001; G/G > G/A, AF: 0.304 vs. 0.079, OR = 5.132, p ≤ 0.001); rs1051740 in EPHX1 (C > T, AF: 0.700 vs. 0.472, OR = 2.611, p ≤ 0.001;T/C > T/T, AF: 0.496 vs. 0.191, OR = 3.566, p ≤ 0.001); rs2016848 in MME (G > A, AF: 0.348 vs. 0.124, OR = 3.782, p = 0.001; G/G > A/G, AF: 0.330 vs. 0.112, OR = 3.960, p ≤ 0.001); rs6151031 in ALDH1A1 (GCTGGTGAGGAGAGAACC > G, AF: 0.061 vs. 0.011, OR = 5.704, p = 0.010; GCTGGTGAGGAGAGAACC/GCTGGTGAGGAGAGAACC > G/GCTGGTGAGGAGAGAACC, AF: 0.122 vs. 0.022, OR = 6.027, p = 0.009); rs1935349 in HTR7 (C > T, AF: 0.343 vs. 0.208, OR = 1.994, p = 0.003; C/C > T/T, AF: 0.139 vs. 0.022, OR = 8.313, p = 0.002); rs8192720 in CYP2A6 (G/A > A/A, AF: 0.130 vs. 0, OR infinity, p = 0.001; G/G > A/A, AF: 0.130 vs. 0, OR infinity, p ≤ 0.001) (associated variant sites are shown in Suppl. Figs. S1 (A–H).
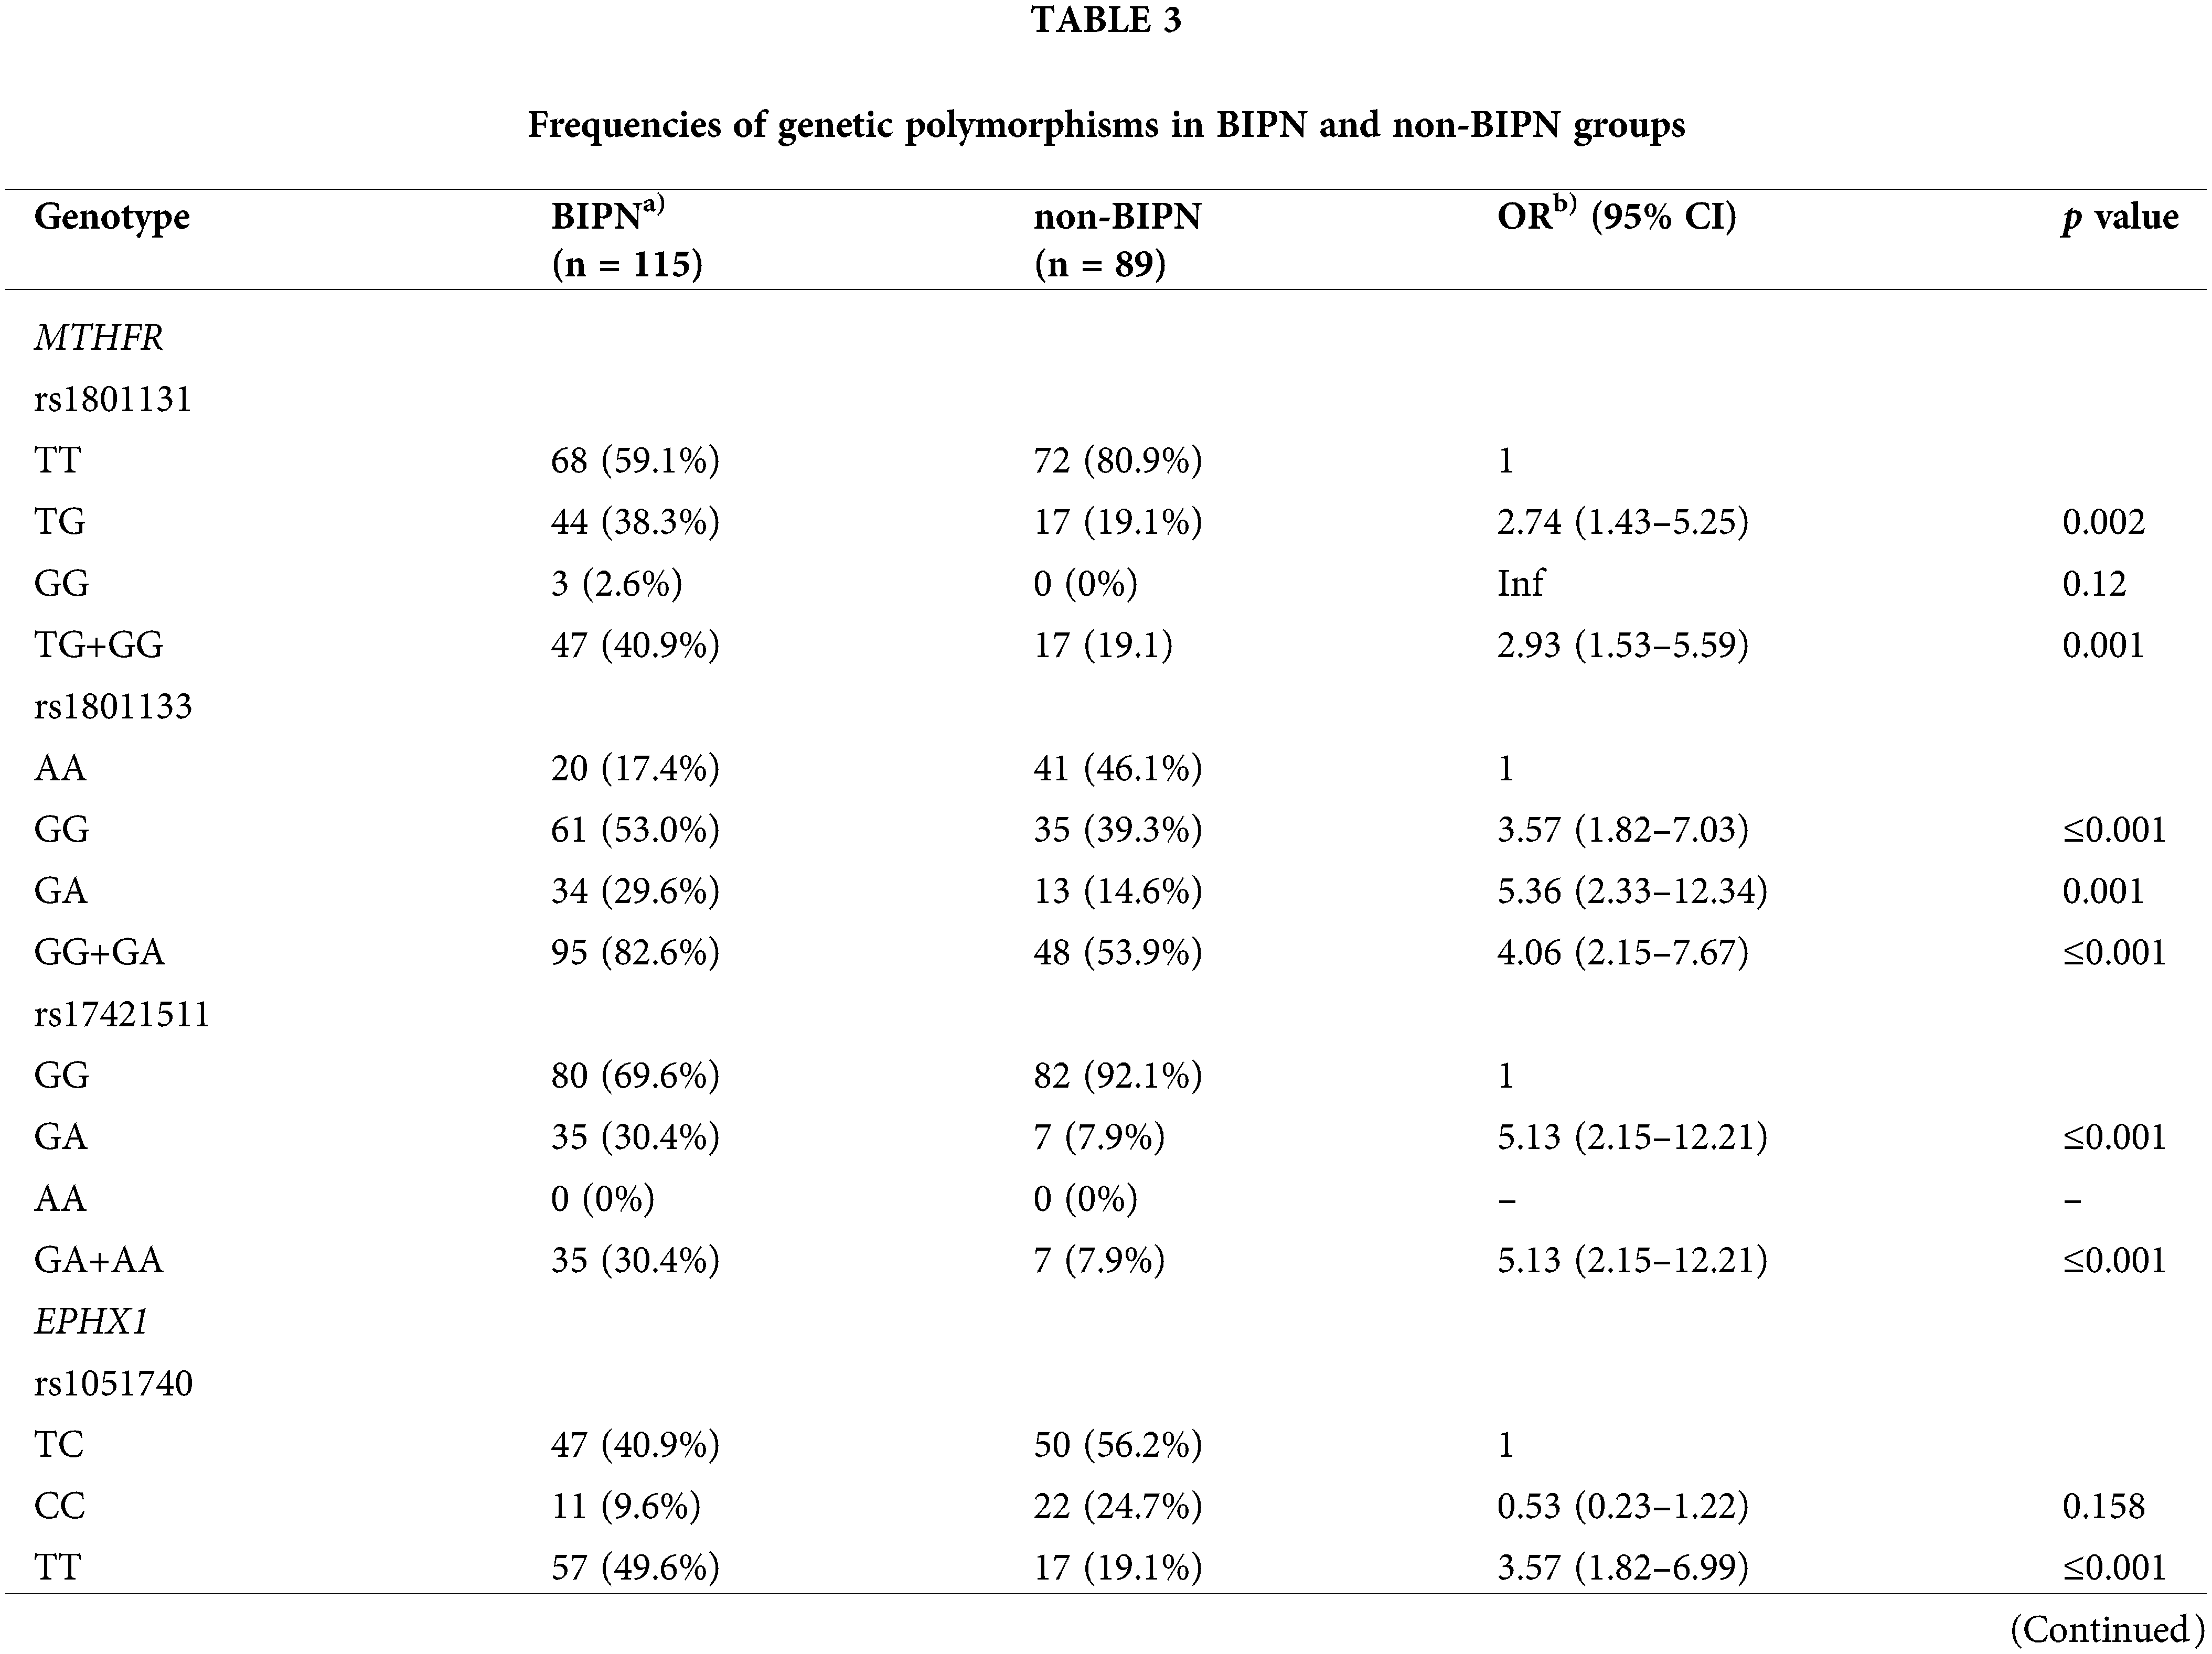
To evaluate the association between genetic polymorphisms and BIPN, we compared the genotype distribution of the BIPN group and non-BIPN group. The genotype analysis between the two groups were shown in Table 3. The variant genotypes in the BIPN group (rs1801131, T/G, n = 44 (38.3%); rs1801133, G/G, n = 61 (53.0%); rs1801133, G/A, n = 34 (29.6%); rs17421511, G/A, n = 35 (30.4%); rs1051740, T/T, n = 57 (49.6%); rs2016848, A/G, n = 38 (33.0%); rs6151031, GCTGGTGAGGAGAGAACC/G, n = 14 (12.2%); rs1935349, T/T, n = 16 (13.9%); rs8192720, AA, n = 15 (13.1%)) were higher than those in the non-BIPN group, and all of these genotypes might be risk genotypes for BIPN.
A multivariate logistic regression model was used to analyze the above eight SNPs of each genotype. It was found that the risk of BIPN for the G/A genotype at rs17421511 was 9.578 times that of the G/G genotype (p = 0.002, OR = 9.578 (95% CI 2.296–39.955)), the T/T genotype at rs1051740 was 6.030 times that of the T/C genotype (p = 0.001,OR = 6.030 (95% CI 2.000–18.181)), A/A genotype at rs2016848 was 4.925 times that of the G/G genotype (p = 0.026, OR = 4.925 (95% CI 1.213–19.996)), and the GCTGGTGAGGAGAGAACC/G genotype at rs6151031 was 7.377 times that of the GCTGGTGAGGAGAGAACC/GCTGGTGAGGAGAGAACC genotype (p = 0.046, OR = 7.377 (95% CI 1.778–39.978)). A logistic regression model forest diagram is shown in Fig. 1.
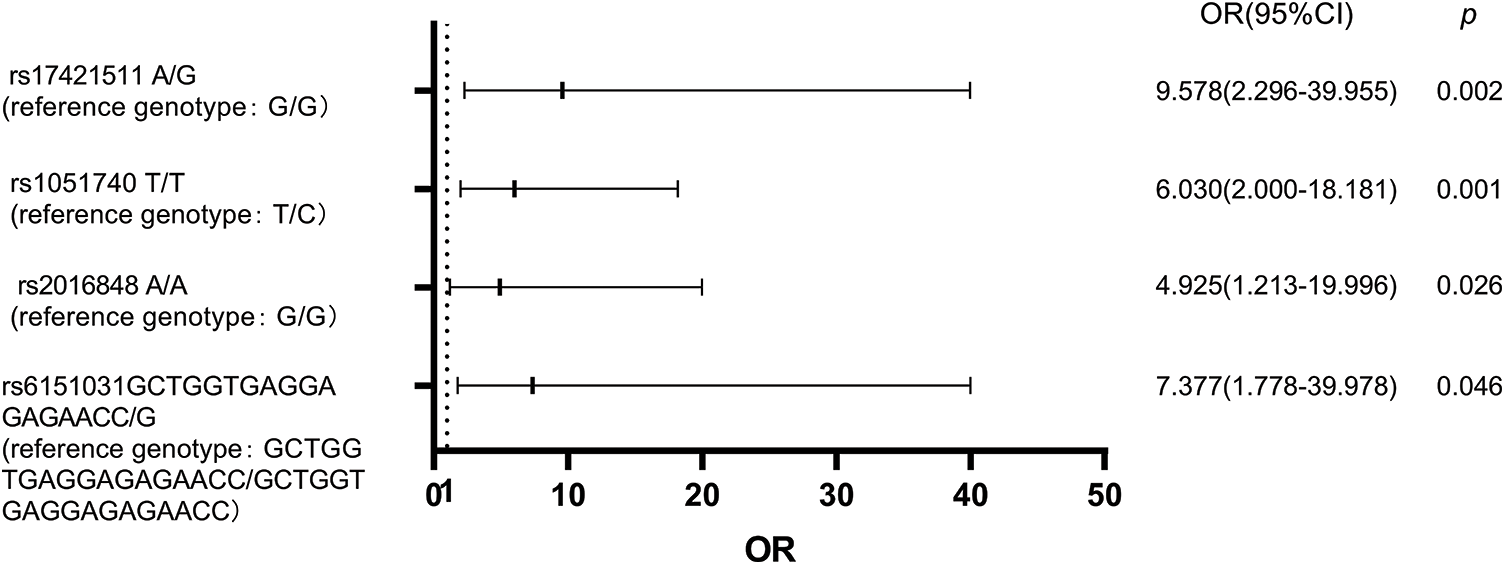
Figure 1: Logistic regression model forest diagram showing the risk of BIPN according to combined genotypes of genetic variants.
MTHFR and ALDH1A1 mRNA expression
mRNA expression of MTHFR and ALDH1A1 in 62 peripheral blood samples was detected by RT-PCR. Among the 6 genes with BIPN-related SNPs detected by panel sequencing, these two genes were expressed in peripheral blood, whereas the other 4 genes had expression levels that were low and not detectable. Among the 62 samples, there were 26 cases among the newly diagnosed untreated MM patients (N group), 19 cases among the retreated patients who were treated after bortezomib (R group) and 17 cases among the healthy persons as the control group (C group). Among the 26 patients in the N group, 8 developed peripheral neuritis after bortezomib treatment (NP group); the other 18 did not develop peripheral neuritis after bortezomib treatment (NnP group). Of the 19 patients in the R group, 12 developed peripheral neuritis after bortezomib treatment (RP group), and the other 7 did not (RnP group).
(1) There was no significant difference in the expression level of MTHFR mRNA in the N group compared with the C group (2.55 ± 1.02 vs. 1.95 ± 0.92, p = 0.050). The mRNA expression level of MTHFR in the R group was higher than that in the C group (3.02 ± 1.89 vs. 1.95 ± 0.92, p = 0.041), and the difference was statistically significant. The mRNA expression level of MTHFR in the N group was similar to that in the R group (2.55 ± 1.0 vs. 3.02 ± 1.89, p = 0.264). The mRNA expression level of MTHFR in the NP group was lower than that in the NnP group (1.70 ± 0.77 vs. 2.81 ± 0.97, p = 0.009), and the difference was statistically significant. There was no difference in the mRNA expression level of MTHFR between the RP group and RnP group (3.30 ± 2.31 vs. 2.56 ± 0.78, p = 0.426). The results are shown in Fig. 2.
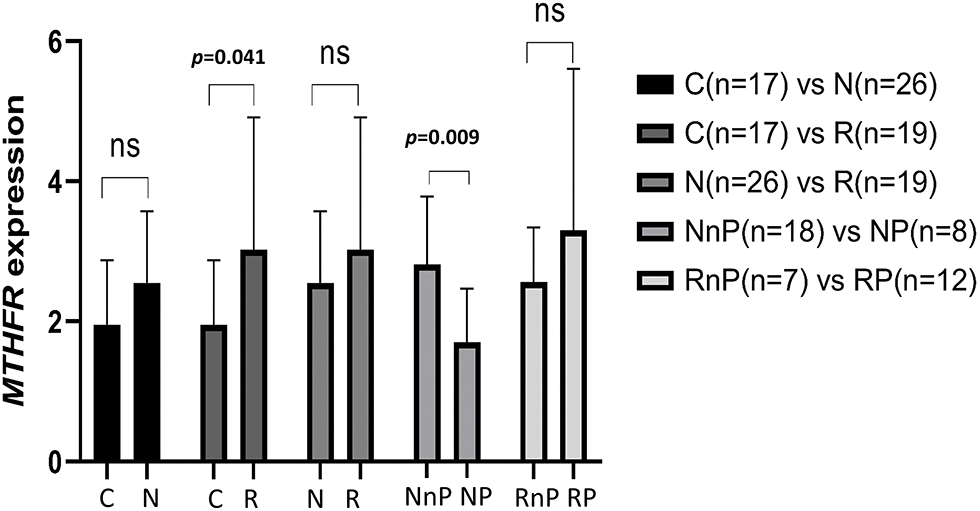
Figure 2: Comparison of MTHFR expression in different group. N group: newly diagnosed untreated MM patients; R group: retreated patients who treated after bortezomib; C group: the healthy persons as control group; NP group: N group developed peripheral neuritis after bortezomib treatment; NnP group: N group did not develop peripheral neuritis after bortezomib treatment; RP group: R group developed peripheral neuritis after bortezomib treatment; RnP group: R group without peripheral neuritis after bortezomib treatment.
(2) The mRNA expression level of ALDH1A1 in the N group was not different from that in the C group (6.74 ± 4.76 vs. 4.63 ± 5.67, p = 0.182); the mRNA expression level of ALDH1A1 in the R group was higher than that in the C group (11.15 ± 11.92 vs. 4.63 ± 5.67, p = 0.048), and the difference was statistically significant. However, there was no difference in the mRNA expression level of ALDH1A1 between the N group and R group (6.74 ± 4.76 vs. 11.15 ± 11.92, p = 0.080). The mRNA expression level of ALDH1A1 in the NP group was not different from that in the NnP group (5.15 ± 2.26 vs. 6.92 ± 5.27, p = 0.375); the mRNA expression level of ALDH1A1 in the RP and RnP groups did not differ (8.15 ± 6.67 vs. 16.24 ± 17.23, p = 0.159).
Forty samples were assessed for serum Hcy, including from 10 BIPN patients, 10 non-BIPN patients and 20 healthy subjects. All subjects had normal renal function and no cardiovascular or cerebrovascular disease. Serum Hcy levels of the BIPN group were higher than those of the non-BIPN group, and the difference was statistically significant (11.66 ± 1.79 μmol/L vs. 8.52 ± 3.29 μmol/L, p = 0.016). Compared with healthy subjects, serum Hcy levels of BIPN patients were higher (11.66 ± 1.79 μmol/L vs. 8.55 ± 2.13 μmol/L, p ≤ 0.001), but there was no statistically significant difference between the non-BIPN group and healthy subjects (8.52 ± 3.29 μmol/L vs. 8.55 ± 2.13 μmol/L, p = 0.969). The results are shown in Fig. 3.
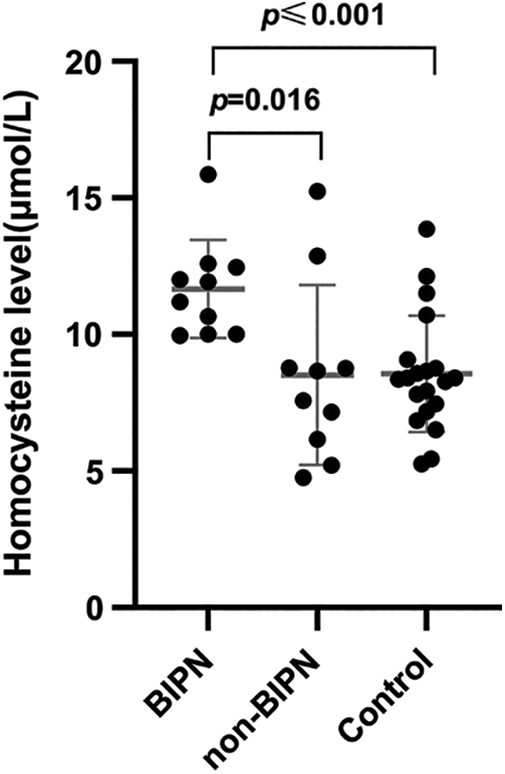
Figure 3: Comparison of HCY levels among different groups. The serum Hcy levels in the BIPN group were dramatically higher than non-BIPN group and control group.
Peripheral neurotoxicity is the most common nonhematologic toxicity in clinical chemotherapy and can caused by proteasome inhibitors such as bortezomib [19]. BIPN is considered to be one of the most serious and unpredictable long-term side effects of chemotherapy for multiple myeloma, with adverse effects on patient quality of life [20,21]. Some patients develop peripheral neuropathy (PN) while others do not, despite the same dose of bortezomib and the same regimen according to the body surface area; hence, individual differences in BIPN development exist. At present, such individual differences are believed to be related to genetic factors and unpredictability [9]. Statistically, 15% to 30% of the variation in drug response is attributed to differences in genotype or SNP [22]. How to identify patients who may develop severe side effects caused by individual genetic differences, which are not related to drug dosage, is a clinical difficulty and challenge.
Genetic studies have been reported in other countries. A study including 139 blood samples from MM patients treated with bortezomib identified rs4553808, which is located in the CTLA4 gene, as being associated with BIPN [15]. Broyl et al. [23] used a panel composed of 3404 SNPs to analyze 186 MM patients treated with bortezomib induction therapy and found that RHOBTB2 an enzyme-encoding gene involved in drug-induced apoptosis, the CPT1C gene involved in mitochondrial function, and the SOX8 gene involved in peripheral nervous system development are associated with early-onset BIPN. The authors suggested that specific gene expression profiles may be associated with risk of BIPN as well as its severity. To identify susceptibility sites related to BIPN, Magrangeas et al. [17] conducted a genome-wide study of 583 MM patients and found that specific sites of PKNOX1 and CBS related to nerve pain are associated with peripheral neuritis. Azoulay et al. [24] conducted genetic studies on peripheral neuritis in 45 patients with multiple myeloma treated with bortezemib and concluded that SNPs of the BDNF gene are associated with peripheral neuritis caused by chemotherapy. Campo et al. [25] identified bortezomib-induced peripheral neuritis in association with 4q34.3 (rs6552496), 5q14.1 (rs12521798), 16q23.3 (rs8060632) and 18q21.2 (rs17748074) in 646 MM patients, and all of these loci are involved in nervous system development and signal transduction. García-Sanz et al. [10] analyzed exon single nucleotide polymorphisms in 172 MM patients treated with bortezomib and thalidomide and observed development of chemotherapy complications in patients under similar treatment conditions, and the results showed that PLCG2 rs45443101 may be associated with adverse drug reactions. These studies have demonstrated the genetic basis of neurotoxicity and identified SNPs in genes or adjacent genes that affect the development and function of the nervous system.
In this study, three SNPs located in the MTHFR gene (rs17421511, rs1801131, rs1801133) were found to be associated with BIPN. Gene polymorphism can affect or inhibit the function of downstream transcription factors, genes or proteins in a variety of ways [26]. The change in MTHFR activity can cause disturbance of methionine synthesis, reducing the level of S-adenosine methionine, which can cause nerve myelin damage and change the level of serum Hcy [27–29]. Increased serum Hcy level has a direct cytotoxic effect on the nervous system, which leads to neuropathy [30]. This study found that the T/G genotype of rs1801131, G/G genotype of rs1801133 and G/A genotype of rs17421511 may be risk genotypes for BIPN. We also found that BIPN was more likely to occur in patients with lower levels of MTHFR mRNA before bortezomib treatment. Furthermore, levels of serum Hcy were higher in BIPN than non-BIPN patients. Our previous experiments found that patients with abnormal renal function had higher serum Hcy levels and Kumar et al. [31] summarized that patients with cardiovascular or cerebrovascular diseases or end-stage renal disease might have abnormal Hcy levels. To reduce study bias, we enrolled MM patients with normal renal function and no cardiovascular or cerebrovascular disease for Hcy level detection. BIPN patients might show increased serum Hcy levels through abnormal MTHFR function in the above mechanisms compared with non-BIPN, which might be one of the factors leading to BIPN.
Gene variation might affect the treatment of bortezomib in tumors such as MM through different kinds of mechanisms. Treatment with bortezomib induces the expression of proteins related with the endoplasmic reticulum secretory pathway, the activation of caspase and Ca2+ homeostasis,which leads to cell death [32]. The aforementioned variation of MTHFR can affect MTHFR activity to affect the process or speed of methionine conversion metabolism, which can increase the level of Hcy and also promote Ca2+ homeostasis disorder caused by bortezomib [27–29,33]. The variation of ALDH1A1 affects its regulatory function in the RA-RARα signaling pathway [34], which might weaken the repairment of injured nerves after bortezomib treatment. CYP2A6 catalyzes many reactions in drug metabolism and lipid metabolism [35]. The variation of EPHX1 may participate in the oxidative stress response caused by mitochondrial damage after bortezomib treatment [36]. The variations of HTR7 and MME have not been reported on the mechanism related to bortezomib, but have been verified to be associated with neurological diseases [37,38].
As clinical information and examinations cannot determine whether patients will develop BIPN, it is important to find new methods to predict BIPN. Such as genetic factors. PN is a disease with complex mechanisms, and multiple genes are involved. BIPN is related to the accumulated dose of bortezomib, the duration of treatment, and combined drugs such as thalidomide [20]. In our study, the patients enrolled were all of Han ethnicity in Northeast China, which is the majority ethnic group in China, and none had neuropathy before, as patients with neuropathy were excluded. These patients were treated with a unified dose of bortezomib (1.3 mg/m2) in accordance with Chinese guidelines for myeloma treatment [4] to minimize the bias caused by different doses. Some patients with thalidomide treatment might also experience the occurrence or aggravation of PN, which might affect the results of this study. However, for the different time points and cycles between bortezomib and thalidomide, we selected patients with PN who were more inclined to be caused by bortezomib to minimize bias. Samples for which it could not be distinguished whether PN was caused by bortezomib or thalidomide were excluded from the study. However, it cannot be denied that use of thalidomide can aggravate the grade of BIPN, which is a shortcoming of this study. The SNPs that were discovered in this study have not been reported in other studies related to BIPN. The reason may be that the gene and SNP compositions of panel sequencing used by scholars in other countries are different from ours. In addition, differences in treatment plan and drug dosage in different countries might have led to differences in the results of the studies. More importantly, there are ethnic genetic differences between the Chinese populations in Asia and populations in Europe and America.
To our knowledge, this is the first study to describe the association between BIPN and gene polymorphisms in Chinese MM patients in an Asian context, and our study reveals a possible mechanism related to BIPN and MTHFR. But our research also has some limitations. We did not do further SNP functional analysis; not all BIPN associated genes were expressed in peripheral blood, but in liver or other tissues, so we could not obtain samples for detection; the sample size of MTHFR mRNA, ALDH1A1 mRNA and serum Hcy are relatively small, and we will expand the sample size and do functional analysis for further study in the future. It may provide an experimental basis for research in this field, and offer a reference for evaluating pharmacogenomic data based on Asians for further research.
Our study reported 8 genetic variants most related to BIPN in Chinese MM patients. And BIPN is more likely to occur in patients with lower MTHFR mRNA expression, which might result in higher serum Hcy levels. It may provide a screening measure to predict BIPN in MM patients before treatment.
Acknowledgement: The authors thank all the staff for their contributions.
Funding Statement: This work was supported by the “GZ Hematologic Malignancy MARKER GHROMOS of Education Department of Liaoning Province” Grant (Grant Number: 07102).
Author Contributions: LJZ and YZ contributed to conception and design of the study; YZ contributed date or analysis tools, performed the analysis and wrote original draft; HYZ, JW, XW, YQ and FX aided in the collection of the materials; LJZ revised this manuscript and provided fund support; all authors contributed to manuscript read and approved the submitted version.
Availability of Data and Materials: The datasets used and/or analyzed during the current study are available from the corresponding author on reasonable request.
Ethics Approval: This study was approved by the Ethics Committee of the First Affiliated Hospital of China Medical University, the Ethical Committee process number is [2023]523. Written inform consent was obtained from all participants involved in the study.
Conflicts of Interest: The authors declare that they have no conflicts of interest to report regarding the present study.
Supplementary Materials: The supplementary material is available online at https://doi.org/10.32604/or.2023.043922.
References
1. van de Donk, N., Pawlyn, C., Yong, K. L. (2021). Multiple myeloma. Lancet, 397(10272), 410–427. https://doi.org/10.1016/S0140-6736(21)00135-5 [Google Scholar] [PubMed] [CrossRef]
2. Cai, K., Na, W., Guo, M., Xu, R., Wang, X. et al. (2019). Targeting the cross-talk between the hedgehog and NF-κB signaling pathways in multiple myeloma. Leukemia & Lymphoma, 60(3), 772–781. https://doi.org/10.1080/10428194.2018.1493727 [Google Scholar] [PubMed] [CrossRef]
3. Gandolfi, S., Laubach, J. P., Hideshima, T., Chauhan, D., Anderson, K. C. et al. (2017). The proteasome and proteasome inhibitors in multiple myeloma. Cancer Metastasis Reviews, 36(4), 561–584. https://doi.org/10.1007/s10555-017-9707-8 [Google Scholar] [PubMed] [CrossRef]
4. Chinese Hematology Association, Chinese Society of Hematology, Chinese Myeloma Committee-Chinese Hematology Association (2020). The guidelines for the diagnosis and management of multiple myeloma in China (2020 revision). Chinese Journal of Internal Medicine, 59(5), 341–346 (In Chinese). https://doi.org/10.3760/cma.j.cn112138-20200304-00179 [Google Scholar] [PubMed] [CrossRef]
5. Bechakra, M., Nieuwenhoff, M. D., van Rosmalen, J., Groeneveld, G. J., Scheltens-de Boer, M. et al. (2018). Clinical, electrophysiological, and cutaneous innervation changes in patients with bortezomib-induced peripheral neuropathy reveal insight into mechanisms of neuropathic pain. Molecular Pain, 14, 1744806918797042. https://doi.org/10.1177/1744806918797042 [Google Scholar] [PubMed] [CrossRef]
6. Velasco, R., Petit, J., Clapés, V., Verdú, E., Navarro, X. et al. (2010). Neurological monitoring reduces the incidence of bortezomib-induced peripheral neuropathy in multiple myeloma patients. Journal of the Peripheral Nervous System, 15(1), 17–25. https://doi.org/10.1111/j.1529-8027.2010.00248.x [Google Scholar] [PubMed] [CrossRef]
7. Lakshman, A., Modi, M., Prakash, G., Malhotra, P., Khadwal, A. et al. (2017). Evaluation of bortezomib-induced neuropathy using total neuropathy score (reduced and clinical versions) and NCI CTCAE v4.0 in newly diagnosed patients with multiple myeloma receiving Bortezomib-based induction. Clinical Lymphoma, Myeloma & Leukemia, 17(8), 513–519.E1. https://doi.org/10.1016/j.clml.2017.06.035 [Google Scholar] [PubMed] [CrossRef]
8. Kerckhove, N., Collin, A., Condé, S., Chaleteix, C., Pezet, D. et al. (2018). Neuropathies périphériques chimio-induites: Symptomatologie et épidémiologie. Bulletin du Cancer, 105(11), 1020–1032. https://doi.org/10.1016/j.bulcan.2018.07.009 [Google Scholar] [CrossRef]
9. Chang, W. C., Tanoshima, R., Ross, C., Carleton, B. C. (2021). Challenges and opportunities in implementing pharmacogenetic testing in clinical settings. Annual Review of Pharmacology and Toxicology, 61, 65–84. https://doi.org/10.1146/annurev-pharmtox-030920-025745 [Google Scholar] [PubMed] [CrossRef]
10. García-Sanz, R., Corchete, L. A., Alcoceba, M., Chillon, M. C., Jiménez, C. et al. (2017). Prediction of peripheral neuropathy in multiple myeloma patients receiving bortezomib and thalidomide: A genetic study based on a single nucleotide polymorphism array. Hematological Oncology, 35(4), 746–751. https://doi.org/10.1002/hon.2337 [Google Scholar] [PubMed] [CrossRef]
11. Velasco, R., Alberti, P., Bruna, J., Psimaras, D., Argyriou, A. A. (2019). Bortezomib and other proteosome inhibitors-induced peripheral neurotoxicity: From pathogenesis to treatment. Journal of the Peripheral Nervous System, 24(S2), S52–S62. https://doi.org/10.1111/jns.12338 [Google Scholar] [PubMed] [CrossRef]
12. Zhou, W., An, G., Jian, Y., Guo, H., Chen, W. (2015). Effect of CYP2C19 and CYP3A4 gene polymorphisms on the efficacy of bortezomib-based regimens in patients with multiple myeloma. Oncology Letters, 10(2), 1171–1175. https://doi.org/10.3892/ol.2015.3294 [Google Scholar] [PubMed] [CrossRef]
13. Vangsted, A. J., Søeby, K., Klausen, T. W., Abildgaard, N., Andersen, N. F. et al. (2010). No influence of the polymorphisms CYP2C19 and CYP2D6 on the efficacy of cyclophosphamide, thalidomide, and bortezomib in patients with Multiple Myeloma. BMC Cancer, 10, 404. https://doi.org/10.1186/1471-2407-10-404 [Google Scholar] [PubMed] [CrossRef]
14. Campo, C., Da Silva Filho, M. I., Weinhold, N., Goldschmidt, H., Hemminki, K. et al. (2017). Genetic susceptibility to bortezomib-induced peripheral neuroropathy: Replication of the reported candidate susceptibility loci. Neurochemical Research, 42(3), 925–931. https://doi.org/10.1007/s11064-016-2007-9 [Google Scholar] [PubMed] [CrossRef]
15. Favis, R., Sun, Y., van de Velde, H., Broderick, E., Levey, L. et al. (2011). Genetic variation associated with bortezomib-induced peripheral neuropathy. Pharmacogenetics and Genomics, 21(3), 121–129. https://doi.org/10.1097/FPC.0b013e3283436b45 [Google Scholar] [PubMed] [CrossRef]
16. Corthals, S. L., Kuiper, R., Johnson, D. C., Sonneveld, P., Hajek, R. et al. (2011). Genetic factors underlying the risk of bortezomib induced peripheral neuropathy in multiple myeloma patients. Haematologica, 96(11), 1728–1732. https://doi.org/10.3324/haematol.2011.041434 [Google Scholar] [PubMed] [CrossRef]
17. Magrangeas, F., Kuiper, R., Avet-Loiseau, H., Gouraud, W., Guérin-Charbonnel, C. et al. (2016). A Genome-wide association study identifies a novel locus for bortezomib-induced peripheral neuropathy in european patients with multiple myeloma. Clinical Cancer Research, 22(17), 4350–4355. https://doi.org/10.1158/1078-0432.CCR-15-3163 [Google Scholar] [PubMed] [CrossRef]
18. Common Terminology Criteria for Adverse Events (CTCAE) (2017). CTCAE_v5_Quick_Reference_5x7. pdf. https://ctep.cancer.gov/protocoldevelopment/electronic_applications/ctc.htm (accessed on 01/05/2019) [Google Scholar]
19. Sioka, C., Kyritsis, A. P. (2009). Central and peripheral nervous system toxicity of common chemotherapeutic agents. Cancer Chemotherapy and Pharmacology, 63(5), 761–767. https://doi.org/10.1007/s00280-008-0876-6 [Google Scholar] [PubMed] [CrossRef]
20. Argyriou, A. A., Iconomou, G., Kalofonos, H. P. (2008). Bortezomib-induced peripheral neuropathy in multiple myeloma: A comprehensive review of the literature. Blood, 112(5), 1593–1599. https://doi.org/10.1182/blood-2008-04-149385 [Google Scholar] [PubMed] [CrossRef]
21. Argyriou, A. A., Zolota, V., Kyriakopoulou, O., Kalofonos, H. P. (2010). Toxic peripheral neuropathy associated with commonly used chemotherapeutic agents. Journal of BUON, 15(3), 435–446. [Google Scholar] [PubMed]
22. Eichelbaum, M., Ingelman-Sundberg, M., Evans, W. E. (2006). Pharmacogenomics and individualized drug therapy. Annual Review of Medicine, 57, 119–137. https://doi.org/10.1146/annurev.med.56.082103.104724 [Google Scholar] [PubMed] [CrossRef]
23. Broyl, A., Corthals, S. L., Jongen, J. L., van der Holt, B., Kuiper, R. et al. (2010). Mechanisms of peripheral neuropathy associated with bortezomib and vincristine in patients with newly diagnosed multiple myeloma: A prospective analysis of data from the HOVON-65/GMMG-HD4 trial. The Lancet Oncology, 11(11), 1057–1065. https://doi.org/10.1016/S1470-2045(10)70206-0 [Google Scholar] [PubMed] [CrossRef]
24. Azoulay, D., Giryes, S., Nasser, R., Sharon, R., Horowitz, N. A. (2019). Prediction of chemotherapy-induced peripheral neuropathy in patients with lymphoma and myeloma: The roles of brain-derived neurotropic factor protein levels and a gene polymorphism. Journal of Clinical Neurology, 15(4), 511–516. https://doi.org/10.3988/jcn.2019.15.4.511 [Google Scholar] [PubMed] [CrossRef]
25. Campo, C., da Silva Filho, M. I., Weinhold, N., Mahmoudpour, S. H., Goldschmidt, H. et al. (2018). Bortezomib-induced peripheral neuropathy: A genome-wide association study on multiple myeloma patients. Hematological Oncology, 36(1), 232–237. https://doi.org/10.1002/hon.2391 [Google Scholar] [PubMed] [CrossRef]
26. Pang, G. S., Wang, J., Wang, Z., Lee, C. G. (2009). Predicting potentially functional SNPs in drug-response genes. Pharmacogenomics, 10(4), 639–653. https://doi.org/10.2217/pgs.09.12 [Google Scholar] [PubMed] [CrossRef]
27. Khalighi, K., Cheng, G., Mirabbasi, S., Khalighi, B., Wu, Y. et al. (2018). Opposite impact of methylene tetrahydrofolate reductase C677T and Methylene tetrahydrofolate reductase A1298C gene polymorphisms on systemic inflammation. Journal of Clinical Laboratory Analysis, 32(5), e22401. https://doi.org/10.1002/jcla.22401 [Google Scholar] [PubMed] [CrossRef]
28. Zeng, Q., Li, F., Xiang, T., Wang, W., Ma, C. et al. (2017). Influence of food groups on plasma total homocysteine for specific MTHFR C677T genotypes in Chinese population. Molecular Nutrition & Food Research, 61(2), 1600351. https://doi.org/10.1002/mnfr.201600351 [Google Scholar] [PubMed] [CrossRef]
29. Renard, D., Dutray, A., Remy, A., Castelnovo, G., Labauge, P. (2009). Subacute combined degeneration of the spinal cord caused by nitrous oxide anaesthesia. Neurological Sciences, 30(1), 75–76. https://doi.org/10.1007/s10072-009-0013-2 [Google Scholar] [PubMed] [CrossRef]
30. Ala, O. A., Akintunde, A. A., Ikem, R. T., Kolawole, B. A., Ala, O. O. et al. (2017). Association between insulin resistance and total plasma homocysteine levels in type 2 diabetes mellitus patients in south west Nigeria. Diabetes & Metabolic Syndrome, 11, S803–S809. https://doi.org/10.1016/j.dsx.2017.06.002 [Google Scholar] [PubMed] [CrossRef]
31. Kumar, A., Palfrey, H. A., Pathak, R., Kadowitz, P. J., Gettys, T. W. et al. (2017). The metabolism and significance of homocysteine in nutrition and health. Nutrition & Metabolism, 14, 78. https://doi.org/10.1186/s12986-017-0233-z [Google Scholar] [PubMed] [CrossRef]
32. Landowski, T. H., Megli, C. J., Nullmeyer, K. D., Lynch, R. M., Dorr, R. T. (2005). Mitochondrial-mediated disregulation of Ca2+ is a critical determinant of Velcade (PS-341/bortezomib) cytotoxicity in myeloma cell lines. Cancer Research, 65(9), 3828–3836. https://doi.org/10.1158/0008-5472.CAN-04-3684 [Google Scholar] [PubMed] [CrossRef]
33. Ji, X. W., Lyu, H. J., Zhou, G. H., Wu, B., Zhu, Y. Y. et al. (2021). Physcion, a tetra-substituted 9,10-anthraquinone, prevents homocysteine-induced endothelial dysfunction by activating Ca2+- and Akt-eNOS-NO signaling pathways. Phytomedicine, 81, 153410. https://doi.org/10.1016/j.phymed.2020.153410 [Google Scholar] [PubMed] [CrossRef]
34. Kumar, S., Duester, G. (2011). SnapShot: Retinoic acid signaling. Cell, 147(6), 1422–1422.e1. https://doi.org/10.1016/j.cell.2011.11.034 [Google Scholar] [PubMed] [CrossRef]
35. Hoffman, S. M., Nelson, D. R., Keeney, D. S. (2001). Organization, structure and evolution of the CYP2 gene cluster on human chromosome 19. Pharmacogenetics, 11(8), 687–698. https://doi.org/10.1097/00008571-200111000-00007 [Google Scholar] [PubMed] [CrossRef]
36. Gautheron, J., Jéru, I. (2020). The multifaceted role of epoxide hydrolases in human health and disease. International Journal of Molecular Sciences, 22(1), 13. https://doi.org/10.3390/ijms22010013 [Google Scholar] [PubMed] [CrossRef]
37. Crispino, M., Volpicelli, F., Perrone-Capano, C. (2020). Role of the serotonin receptor 7 in brain plasticity: From development to disease. International Journal of Molecular Sciences, 21(2), 505. https://doi.org/10.3390/ijms21020505 [Google Scholar] [PubMed] [CrossRef]
38. Hong, D., Fang, P., Yao, S., Chen, J., Zhang, X. et al. (2019). Variants in MME are associated with autosomal-recessive distal hereditary motor neuropathy. Annals of Clinical and Translational Neurology, 6(9), 1728–1738. https://doi.org/10.1002/acn3.50868 [Google Scholar] [PubMed] [CrossRef]
Supplementary Materials
Supplementary Figure 1. The most significantly different SNPs associated variant sites between the BIPN group and non-BIPN group. A: variation in rs1801131 (T>G) of MTHFR; B: variation in rs1801133(A>G) of MTHFR; C: variation in rs17421511(G>A) of MTHFR; D: variation in rs1051740(C>T) of EPHX1. E: variation in rs2016848 (G>A) of MME; F: variation in rs6151031(GCTGGTGAGGAGAGAACC>G) of ALDH1A1; G: variation in rs1935349(C>T) of HTR7; H: variation in rs8192720 (G>A) of CYP2A6.
Cite This Article
 Copyright © 2024 The Author(s). Published by Tech Science Press.
This work is licensed under a Creative Commons Attribution 4.0 International License , which permits unrestricted use, distribution, and reproduction in any medium, provided the original work is properly cited.
 Downloads
 Citation Tools