
 Submit a Paper
 Propose a Special lssue
 Open Access
ARTICLE
BHLHE40 Is a Transcriptional Regulatory Target of NFE2L3 in Triple-Negative Breast Cancer
Department of Pharmaceutical Sciences, Massachusetts College of Pharmacy and Health Sciences, Worcester, MA 01608, USA
* Corresponding Authors: Terrick Andey. Email: ; George Acquaah-Mensah. Email:
(This article belongs to the Special Issue: Identification of potential targets and biomarkers for cancers and the exploration of novel molecular mechanisms of tumorigenesis and metastasis)
Oncology Research 2026, 34(2), 14 https://doi.org/10.32604/or.2025.070793
Received 24 July 2025; Accepted 19 December 2025; Issue published 19 January 2026
 View Full Text
 Download PDF
Abstract
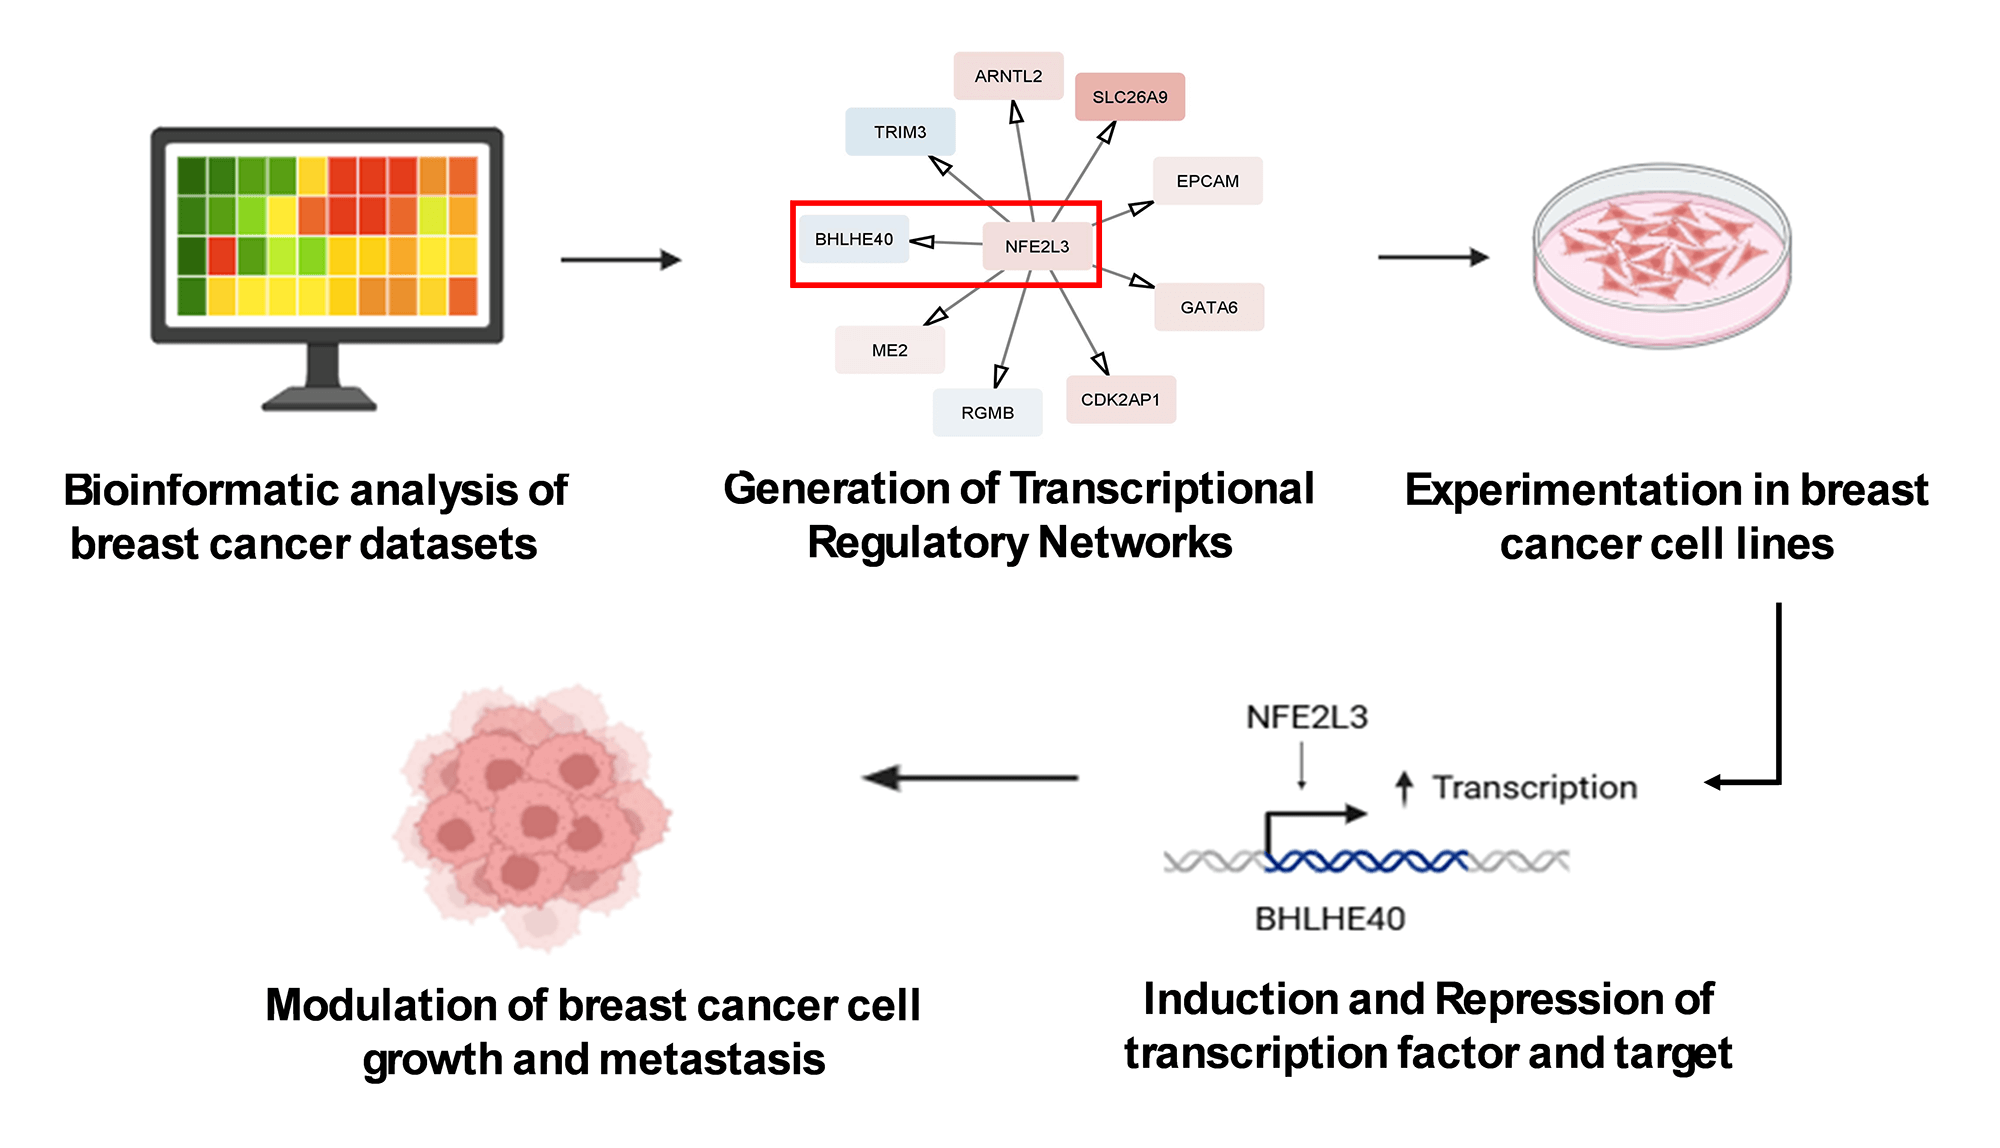
Objectives: The current treatment options and therapeutic targets for triple-negative breast cancer (TNBC), an aggressive subtype of breast cancer (BrCA), are limited. This study aimed to identify novel biomarkers and transcriptional regulatory networks (TRN) inherent in TNBC samples. Methods: We analyzed pan-cancer BrCA datasets from The Cancer Genome Atlas (TCGA) to compare triple-positive breast cancer (TPBC) with TNBC. TRN algorithms and virtual inference of protein-enriched regulon (VIPER) were used to identify master regulators and their target genes. Utilizing TNBC cells (MDA-MB-231 and MDA-MB-468), we validated the relationship of nuclear factor erythroid 2-like 3 (NFE2L3) and basic helix-loop-helix family member E 40 (BHLHE40) by performing a luciferase assay. The expression levels of these targets were measured after transfections with plasmid and siRNA via qRT-PCR and western blots. The effect of these genes on cell proliferation and migration was studied using phenotypic assays. Results: Using computational approaches, we identified NFE2L3 as a master regulator with BHLHE40 as its target gene. NFE2L3 protein binds to the promoter region of BHLHE40 and regulates its transcriptional activity. Additionally, silencing and overexpressing NFE2L3 and BHLHE40 in TNBC cell lines MDA-MB-231 and MDA-MB-468 showed that NFE2L3 directly regulates BHLHE40 at both transcriptional and translational levels. We found that BHLHE40 requires NFE2L3 for cell proliferation and migration in TNBC. Conclusion: These findings underscore the significance of NFE2L3 and BHLHE40 in TNBC, highlighting NFE2L3’s role in regulating the oncogenic activity of BHLHE40 in TNBC cells.Graphic Abstract
Keywords
Cancer is characterized by complex interactions among genetic, epigenetic, and environmental factors that perturb cellular homeostasis and drive malignant transformation. Cancer treatment has evolved from non-selective therapies to targeted and immunomodulatory approaches that intervene at specific molecular nodes of tumor progression [1]. Advances in molecular oncology have enabled a deeper understanding of how perturbations in signaling and transcriptional programs can shape cancer phenotypes, paving the way for precision medicine.
Breast cancer (BrCA) is one of the three leading causes of cancer mortality in women worldwide, along with lung cancer and colorectal cancer [2]. According to a report by the American Cancer Society, approximately 2 million breast cancer cases will be diagnosed in 2024, and an estimated 611,720 deaths are expected in the United States of America [3]. Triple-negative breast cancer (TNBC) is one of the most aggressive types of breast cancer that accounts for 15%–20% of breast cancer cases [4]. Compared to other types of breast cancer, various challenges are associated with the effective management of TNBC. First, cells from TNBC samples lack the expression of estrogen receptor (ER), progesterone receptor (PR), and lack of overexpression of human epidermal growth factor 2 (HER2) receptor, which limits the use of hormonal therapy or molecularly targeted therapy agents such as tamoxifen, anastrozole, and trastuzumab [5,6]. Secondly, treatment of TNBC involving the use of chemotherapeutic agents is associated with unwanted side effects and the development of resistant phenotypes [7]. Additionally, TNBC has high recurrence and poor overall survival rates [8]. Further, there is a dearth of suitable molecular targets and target-based therapies for the effective treatment of TNBC [9].
Over the years, there has been an exponential growth in biological datasets, with repositories of sequencing data for RNA, DNA, proteins, and epigenetic modifications [10]. These big datasets are useful in addressing various biological concerns, such as phenotyping of patients, drug repurposing, and discovery of biomarkers [11]. Computational methods to identify biomarkers are plenty; however, we focused on the use of transcriptional regulatory network (TRNs) algorithms, such as Algorithm for the Reconstruction of Accurate Cellular Networks (ARACNe), Gene Network Inference with Ensemble of Trees (GENEI3), and the Inferelator, and detect aberrant protein activity using Virtual Inference of Protein-activity by Enriched Regulon analysis (VIPER). The approaches of all three algorithms for creating a TRN are different. ARACNe uses the data processing inequality (DPI) theorem, which determines a mutual information (MI) threshold and ranks the genes based on the MI score for every transcription factor/target [12]. GENEI3 uses a machine learning approach, called random forests, to rank-sort the transcription factor/targets and create a regulatory network [13]. Similarly, the Inferelator uses regression models for inferring the regulatory method [14]. These networks are used by VIPER to predict master regulators, which are the top genes in their hierarchy, based on the differential expression patterns of target genes and the score assigned to them [15,16]. VIPER-based analyses have been instrumental in studies of glioblastoma [17], immune signaling [18] and breast cancer [19]. As demonstrated previously by our lab VIPER, along with ARACNe, led to the identification of differentially expressed patterns in genes between black/African-American and Caucasian patients with breast cancer [20].
To address the above challenges, this study aimed to identify novel biomarkers and transcriptional regulatory networks within TNBC biology by using publicly available datasets to delineate genes and their molecular associates implicated in TNBC development. We investigated TNBC biology and identified several master regulators along with their target genes. One such master regulator was the nuclear factor erythroid 2-related factor 3 (NFE2L3/NRF3), a member of the Cap ‘n’ Collar family of proteins that are linked to several types of cancers, including cancers of the colon, thyroid, pancreas, and kidney [21]. The study hypothesized that NFE2L3 regulates the expression of basic helix-loop-helix family member e40 (BHLHE40), a key member in the regulation of the circadian rhythm, which plays an important role in the development of breast cancer, along with other cancers. We characterized the regulatory relationship between NFE2L3 and BHLHE40 and its impact on cell proliferation and migration in TNBC.
2.1 Data Source and Acquisition
The RNA-seq 2016 pan-cancer breast cancer dataset from The Cancer Genome Atlas (TCGA) was downloaded from www.isb-cgc.appspot.com [22]. Expression and phenotype data were accessed and processed using Bioconductor R (Version 4.3.1) packages (‘BigRquery’ [Version 1.5.1] and ‘tidyverse’ [Version 2.0]). Based on the phenotype (immunohistochemistry) data, associated patient samples were divided into two groups: triple-positive breast cancer (TPBC) and TNBC, and corresponding gene expression data were processed. A list of transcription factors that were used as part of the process to reverse-engineer TRNs were identified using annotations from the Gene Ontology (http://geneontology.org/) [23].
2.2 Differentially Expressed Genes (DEGs) and Enrichment Analysis
An analysis was performed using a Bioconductor package in R, ‘DESeq2’ (Version 1.48.2), to identify genes expressed differently between the TNBC and TPBC groups as previously described [24,25]. The false discovery rate (FDR) cutoff was set at 5%. The DEGs were represented as a heatmap using the tool, a Bioconductor package in R, ‘ggplot2’ (Version 3.5.2). The DEGs obtained were analyzed for over-represented pathways using a comprehensive R archive network (CRAN) package in R, ‘EnrichR’ (Version 3.4) [26]. Four databases accessed from within EnrichR were used to analyze these DEGs: “GO_biological_process_2021” [23], “KEGG_2021” [27], “Reactome_2022” [28], and “Wikipathways_2021” [29].
2.3 Identification of Master Regulators
TRNs were reverse-engineered from the gene expression compendium using ARACNe [12], GENIE3 [13] and the Inferelator algorithm [14]. Regulons were identified using the resulting TRNs. Those regulons subsequently served as input for the Virtual Inference of Protein-activity by Enriched Regulon analysis (VIPER) [15]. VIPER (Version 1.42) was used to infer protein activity and assign a score based on the differential expression of the target genes within the regulon, thus identifying master regulators of regulons driving the differences in gene expression between the TNBC and TPBC groups [20]. Validation of the target genes was performed using Harmonizome 3.0 (https://maayanlab.cloud/Harmonizome). Within Harmonizome, databases such as JASPAR position weighted matrix (PWMs), Encyclopedia of DNA Elements (ENCODE), and ChIP-X Enrichment Analysis (ChEA) were used to validate the TF-target relationships.
Survival analyses were investigated using Bioconductor packages in R, survival (Version 3.8), and survminer (Version 0.5.1). Patients were classified based on high expression and low expression of the gene at the level. Mean gene expression levels across patients, along with standard deviations, were calculated. Genes with “high expression” had expression levels higher than the mean by at least 0.5 times the standard deviation. Genes with “low expression” had expression levels lower than the mean by at least 0.5 times the standard deviation.
2.5 Visualization of Complex Networks
Cytoscape (Version 3.8.0, Cytoscape Consortium, USA) is an open-source graph (network) visualization tool useful for analyzing molecular interaction networks. We mapped the networks generated from ARACNe, GENIE3, and the Inferelator on Cytoscape and visualized the interactions between each regulator gene and its target genes [30].
2.6 Cell Culture and Transfection
MDA-MB-231 (#HTB-26) and MDA-MB-468 (#HTB-132) triple-negative breast cancer cell lines were purchased from American Type Culture Collection (ATCC; Manassas, VA, USA), which were authenticated and free of mycoplasma contamination. These cells were cultured in DMEM/F12 high glucose medium (#A4192102 Thermo Fisher Scientific, Waltham, MA, USA) supplemented with 10% fetal bovine serum (FBS) (#FBS001 Neuromics, Edina, MN, USA), 2% antibiotic-antimycotic solution (#15640055 penicillin (10–12 mg/mL)/streptomycin (10,000–12,000 U/mL)/amphotericin (25–30 μg/mL) and 500 μL of Fungin (#NC9326704 Thermo Fisher Scientific), and were maintained at 37°C in a humidified incubator containing 5% CO2. Expression plasmids for NFE2L3 and BHLHE40 were synthesized using the pcDNA3.1(+) vector and purchased from Genscript Biotech (Piscataway, NJ, USA). Additionally, the BHLHE40 vector was conjugated with the Nanoluc vector and purchased from GenScript Biotech (Piscataway). siRNA for silencing of NFE2L3 (#sc-38107) and BHLHE40 (#sc-106769), along with control siRNA-A (#sc-37007), were purchased from Santa Cruz Biotechnologies (Dallas, TX, USA). Lipofectamine 3000 and p3000 (#L3000015), which were used for transient transfection, were purchased from Thermo Fisher Scientific.
2.7 RNA Interference of NFE2L3 and BHLHE40
Three flasks (siControl, NFE2L3 siRNA, and BHLHE40 siRNA) of TNBC cells were cultured in 75 cc flasks and incubated until they attained a confluency of 80%. Each of the lyophilized siRNA NFE2L3 and siRNA BHLHE40 was diluted in 330 μL of RNase-free water to yield a 10 μM concentration. Control siRNA-A was diluted in 66 μL of RNAse-free water to yield a 10 μM concentration. For each group, solution A was prepared by mixing 40 μL of either control siRNA-A (siControl), NFE2L3 siRNA (siNFE2L3), or BHLHE40 siRNA (siBHLHE40) with 650 μL of the siRNA transfection medium. Solution B for each group was prepared by mixing 50 μL of Lipofectamine 3000 (Thermo Fisher Scientific) with an siRNA transfection medium (SantaCruz Biotechnology, Dallas, TX, USA). Solution A (siRNA concentration 0.58 μM) was added to solution B, and the mixture was allowed to sit at room temperature for 45 min. The cells were washed with 2 mL of siRNA transfection medium and aspirated. The mixture was added to the flasks along with 5 mL of siRNA transfection medium with a final concentration of siRNA of 0.063 μM. The mixture was gently spread over the cells, and the flasks were incubated for 6 h in an incubator. After 6 h, the solution in the flasks was aspirated and replaced with fresh medium for 48 h. Experiments were performed in three biological triplicates and were used for subsequent assays.
2.8 Overexpression of NFE2L3 and BHLHE40
TNBC Cells were cultured in 25 cc flasks until they reached a confluency of 80%. Two tubes containing 125 μL of plasmid transfection medium were diluted with 10 μL of Lipofectamine 3000 reagent (Solution A). A 10 μg quantity of lyophilized control, NFE2L3, or BHLHE40 plasmids was resuspended in 50 μL of RNAse-free water (Thermo Fisher Scientific), giving a concentration of 0.2 μg/μL. In a separate tube, 10 μg of the plasmid, along with 250 μL of plasmid transfection medium and 15 μL of p3000 (Thermo Fisher Scientific), were mixed (Solution B), diluting the concentration of plasmid to 0.032 μg/μL. A 1:1 ratio of solution A and solution B was mixed, yielding a final concentration of plasmid as 0.016 μg/μL, which was then incubated at room temperature for 15 min. The mixture was spread over the cells and incubated for 3 days. Experiments were performed in three biological triplicates and used for subsequent assays.
2.9 RNA Extraction and Quantitative Reverse Transcriptase Polymerase Chain Reaction (qRT-PCR)
Expressions of genes NFE2L3 and BHLHE40 following RNA interference and induction of gene expression (as described above) were measured using qRT-PCR. Total RNA from each cell line was extracted using the RNeasy Plus Mini Kit (#74134 Qiagen, Germantown, MD, USA) using the manufacturer’s protocol. The RNA was checked for purity and quantified using NanovVue Plus (#30196 GE Healthcare, Chicago, IL, USA). Using the QuantiTect SYBR Green RT-PCR kits (# 204243, Qiagen, Germantown, MD, USA), cDNA was amplified and measured in real-time using Mastercycler Realplex2 (#5345/6300 Eppendorf, Enfield, CT, USA). Primers were purchased from Origene Technologies (Rockville, MD, USA), and the forward and reverse primer sequences for NFE2L3 (#HP207626), BHLHE40 (#HP207148), and GAPDH (#HP205798) are listed below. The expression levels of NFE2L3 and BHLHE40 were normalized with GAPDH values, and fold change was calculated using the 2−ΔΔCt method.
NFE2L3: 5′-CCAGTTGCTTTCATCACAGCCTG-3′, 3′-CACATCCTGACTTATAGCCTGGC-5′ BHLHE40: 5′-TAAAGCGGAGCGAGGACAGCAA-3′, 3′-ATGTTCGGGTAGGAGATCCTTC-5′ GAPDH: 5′-GTCTCCTCTGACTTCAACAGCG-3′, 3′-ACCACCCTGTTGCTGTAGCCAA-5′.
Protein expressions of NFE2L3 and BHLHE40 were measured using Western blot as previously described [31] following RNA interference and induction of gene expression (as described above). Briefly, whole-cell protein lysates were prepared using RIPA Lysis Buffer [62.5 mM Tris-HCl (pH 6.8), 2% SDS, and 10% glycerol] with protease inhibitor according to the manufacturer’s protocol (Thermo Fisher Scientific). Protein concentrations were measured using PierceTM Bicinchoninic Acid Protein Assay Kit (#23225 Thermo Fisher Scientific) according to the manufacturer’s protocol, and 12.5 μg per lane of total protein was loaded onto an AnyKD Mini-PROTEAN TGX Precast Protein Gel (#4569033 Bio-Rad, Hercules, CA, USA) and separated by SDS-PAGE. Subsequently, proteins were transferred to 0.2 μM nitrocellulose membranes (#1620112 Bio-Rad Laboratories), and the membranes were blocked with 3% Bovine Serum Albumin (BSA; #AC611910100 Fischer Scientific) solution in phosphate-buffered saline with 0.1% Tween-20 (PBST) overnight whilst shaking. The membranes were washed with PBST solution for 5 min three times, and then incubated with primary antibodies against NFE2L3 (rabbit polyclonal antibody; #A09888, Boster Bio, Pleasanton, CA, USA), BHLHE40 (rabbit polyclonal antibody; #ABN1737, Millipore-Sigma, Burlington, MA), and GAPDH (rabbit monoclonal antibody; #2118, Cell Signaling Technology, Danvers, MA, USA), were diluted in blocking solution at 4°C overnight. All primary antibodies were used at dilutions of 1:1000. The membranes were then washed for 5 min three times and incubated with Anti-rabbit IgG secondary antibody (goat monoclonal antibody; #7074, Cell Signaling Technology) at dilutions of 1:2000 at room temperature for 2 h. The membranes were then exposed to a working solution of SuperSignal West Pico PLUS Chemiluminescent Substrate reagent (#34580 Thermo Fisher Scientific) according to the manufacturer’s protocol, and the protein bands were visualized using ImageQuantTM LAS 4000 (GE Healthcare, Chicago, IL, USA). The bands were quantified using ImageJ (Version 1.53k, National Institutes of Health, Bethesda, MD, USA) software and normalized using respective controls.
2.11 Dual-Luciferase Reporter Assay
MDA-MB-231 and MDA-MB-468 cells were seeded in a 96-well white opaque plate (1 × 10⁴ cells per well) and incubated overnight. A pGL4.54[luc2/TK] plasmid (Promega Corp, Madison, WI, USA) was used as an internal control as a normalizer for transfection efficiency. Along with the internal control, the cells were transfected with the BHLHE40 plasmid conjugated with the NanoLuc luciferase plasmid. Similarly, to assess the effects of NFE2L3, another set of cells was co-transfected with the NFE2L3 plasmid along with the internal control and the BHLHE40 plasmid conjugated with the NanoLuc luciferase plasmid. The cells were then incubated for 72 h. Luciferase activity was measured using a Nano-Glo Dual-Luciferase reporter assay system (#N1541, Promega), which contained One-Glo EX Luciferase reagent and NanoDLR Stop and Glo reagent according to the manufacturer. The cells were treated with One-Glo EX Luciferase reagent. The plate was incubated on an orbital shaker at 100 RPM for 5 min, and luminescence was measured using a Synergy H1 plate reader (Agilent, Santa Clara, CA, USA). The cells were then treated with NanoDLR Stop and Glo reagent and placed on an orbital shaker for 10 min. The luminescence was measured using a cell plate reader at an integration time of 1 s. The luciferase activity was measured by normalizing the values obtained from the luciferase activity with values obtained from the Stop and Glo Reagent.
2.12 Co-Immunoprecipitation Assay
Co-immunoprecipitation (Co-IP) assay was performed as per the manufacturer’s protocol [32]. Total protein was extracted from each cell line using RIPA lysis buffer (#87788 Thermo Fisher Scientific) and was incubated with specific primary antibodies (NFE2L3 (#A09888, 1:1000, Boster Bio), BHLHE40 (#ABN1737, 1:1000, Millipore-Sigma) overnight at 4°C. The protein mixture was mixed with Protein A magnetic beads (#73778, Cell Signaling Technology) and incubated at room temperature with rotation for 20 min on a rotary shaker (VWR, Radnor, PA, USA) at 200 RPM. The mixture was washed using the lysis buffer five times while keeping on ice between washes. The mixture was resuspended with SDS sample buffer, followed by vortexing at high speed and heating at 95°C–100°C for 5 min to separate the magnetic beads from the immunocomplex. The mixtures were separated using a magnetic rack, which pulled the magnetic beads to the bottom while retaining the analytes (immunocomplexes) in the supernatant. The supernatant was collected and loaded on AnyKD Mini-PROTEAN TGX Precast Protein Gel (Bio-Rad) and subjected to immunoblotting as described under Section 2.7.
The phenotypic studies were conducted in MDA-MB-231 cells to assess the effect of genes on cell proliferation and migration. Cells were treated with siRNA of NFE2L3 (siNFE2L3) followed by the addition of NFE2L3 plasmid or BHLHE40 plasmid. Similarly, cells were treated with siRNA of BHLHE40 (siBHLHE40) followed by the addition of NFE2L3 plasmid and BHLHE40 plasmid. A total of nine (9) groups were evaluated for the phenotypic studies, namely, Control, siNFE2L3, siNFE2L3 + NFE2L3 plasmid, siNFE2L3 + BHLHE40 plasmid, siBHLHE40, siBHLHE40 + NFE2L3 plasmid, siBHLHE40 + BHLHE40, NFE2L3 plasmid, and BHLHE40 plasmid. The cells were harvested in 25 cc flasks, and the respective siRNA and plasmid treatments were performed based on the group as previously described.
Following treatment of MDA-MB-231 with the treatment groups as mentioned above, 1 × 10⁴ cells per well were seeded in a 96-well plate format and incubated for 24, 48, and 72 h. The cells were then washed with 1× PBS (pH 7.4), stained with 0.01% Alamar blue (#R7017-1G, Millipore-Sigma), and incubated for 2 h at 37°C. Fluorescence readings were taken using a BioTek Synergy H1 Multimode Reader (Santa Clara) at 530/590 nm. Results were computed as mean ± SD of cell proliferation as a percentage of control.
Following treatment of MDA-MB-231 with the treatment groups as mentioned above, 5 × 10⁴ cells per well were seeded in a 24-well plate overnight to achieve a cell monolayer formation. A scratch/wound was created across the length of the cell monolayer using a 200 mL pipette tip. The media was removed and replenished with 5% FBS-supplemented media. Brightfield light micrographs of the scratch/wound were acquired using an EVOS M7000 (Invitrogen, Waltham, MA, USA) microscope at an initial time point (0 h), and the cells were incubated for 24, 48, and 72 h. The cells were washed with 1× PBS (pH 7.4) and fixed with 70% ethanol for 15 mins, followed by staining with 1% crystal violet solution. Brightfield images of the scratch/wounds were acquired following the crystal violet staining at the respective time points. The area of the scratch was measured using ImageJ (Version 1.54k, National Institutes of Health), and the wound closure rate was calculated as follows: ([initial scratch area − final scratch area]/initial scratch area) × 100. Results were presented as light micrographs and graphs of mean ± standard deviation (SD) of wound closure rate as a percent of baseline.
All experiments were repeated three times independently, and Prism 8.0 (GraphPad Software, San Diego, CA, USA) was used for data analysis. Welch’s t-test was employed for the analysis of basal protein expression and luciferase assay. Cell Proliferation, cell migration, gene expression, and protein expression results were analyzed using one-way ANOVA followed by a post-hoc Tukey’s test. A p-value less than 0.05 was considered statistically significant.
3.1 The Cell Cycle Processes Were the Overrepresented Pathway for the DEGs between the TNBC and TPBC Groups
The workflow of the entire study is depicted in Fig. 1. The study used the RNA-seq 2016 pan-cancer breast cancer dataset from TCGA and found approximately 12,000 genes differentially expressed (DEGs) between TPBC and TNBC groups at a False Discovery Rate (FDR) of 5%. Out of the DEGs, 5020 genes were downregulated (log2FC < −1, padj < 0.05), and 6923 genes were upregulated (log2FC > 1, padj < 0.05) in TNBC compared to TPBC. The patterns of expression are depicted in a heatmap (Fig. 2A). A negative log2fold change indicated genes that were down-regulated in the TNBC group compared to the TPBC group, while a positive value indicated genes that were up-regulated in the TNBC group compared to the TPBC group. These DEGs were analyzed using four databases within EnrichR for over-represented pathways. All these resulting gene sets had the Cell cycle and related processes as the top-enriched pathway with the lowest significant p-value and a substantial number of genes (Fig. 2B–E). The DEG list included most of those involved in the cell cycle pathway, either during mitosis or G1, or S phase. Additionally, there were several other pathways, such as the “Wnt signaling pathway”, “NK/NF-kB signaling”, “DNA replication”, “T-cell signaling”, and “DNA mismatch and repair”, in the DEGs that participated across all the datasets. All these pathways contribute to or are connected to cancer cell survival, cell proliferation, and metastasis.
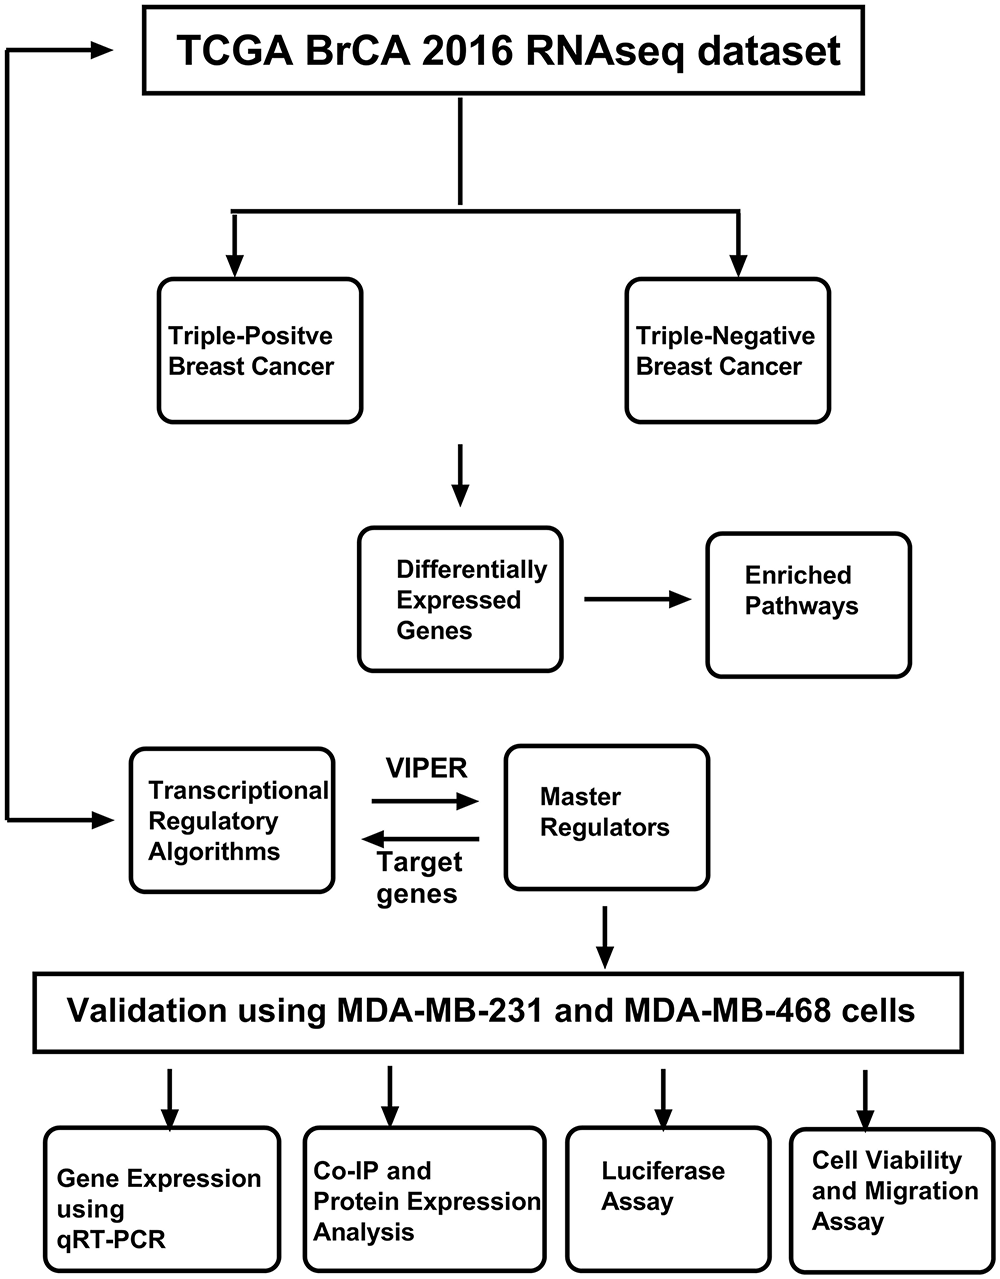
Figure 1: Workflow of the study. The study uses The Cancer Genome Atlas (TCGA) Breast Cancer (BrCA) RNAseq dataset, which was used to identify master regulators using various computational approaches. The identified master regulator and transcriptional regulatory network (TRN) were validated using breast cancer cell lines and cell-based assays. Abb: VIPER: Virtual Inference of Protein-activity by Enriched Regulon analysis; qRT-PCR: Quantitative Reverse Transcription Polymerase Chain Reaction; Co-IP: Co-Immunoprecipitation
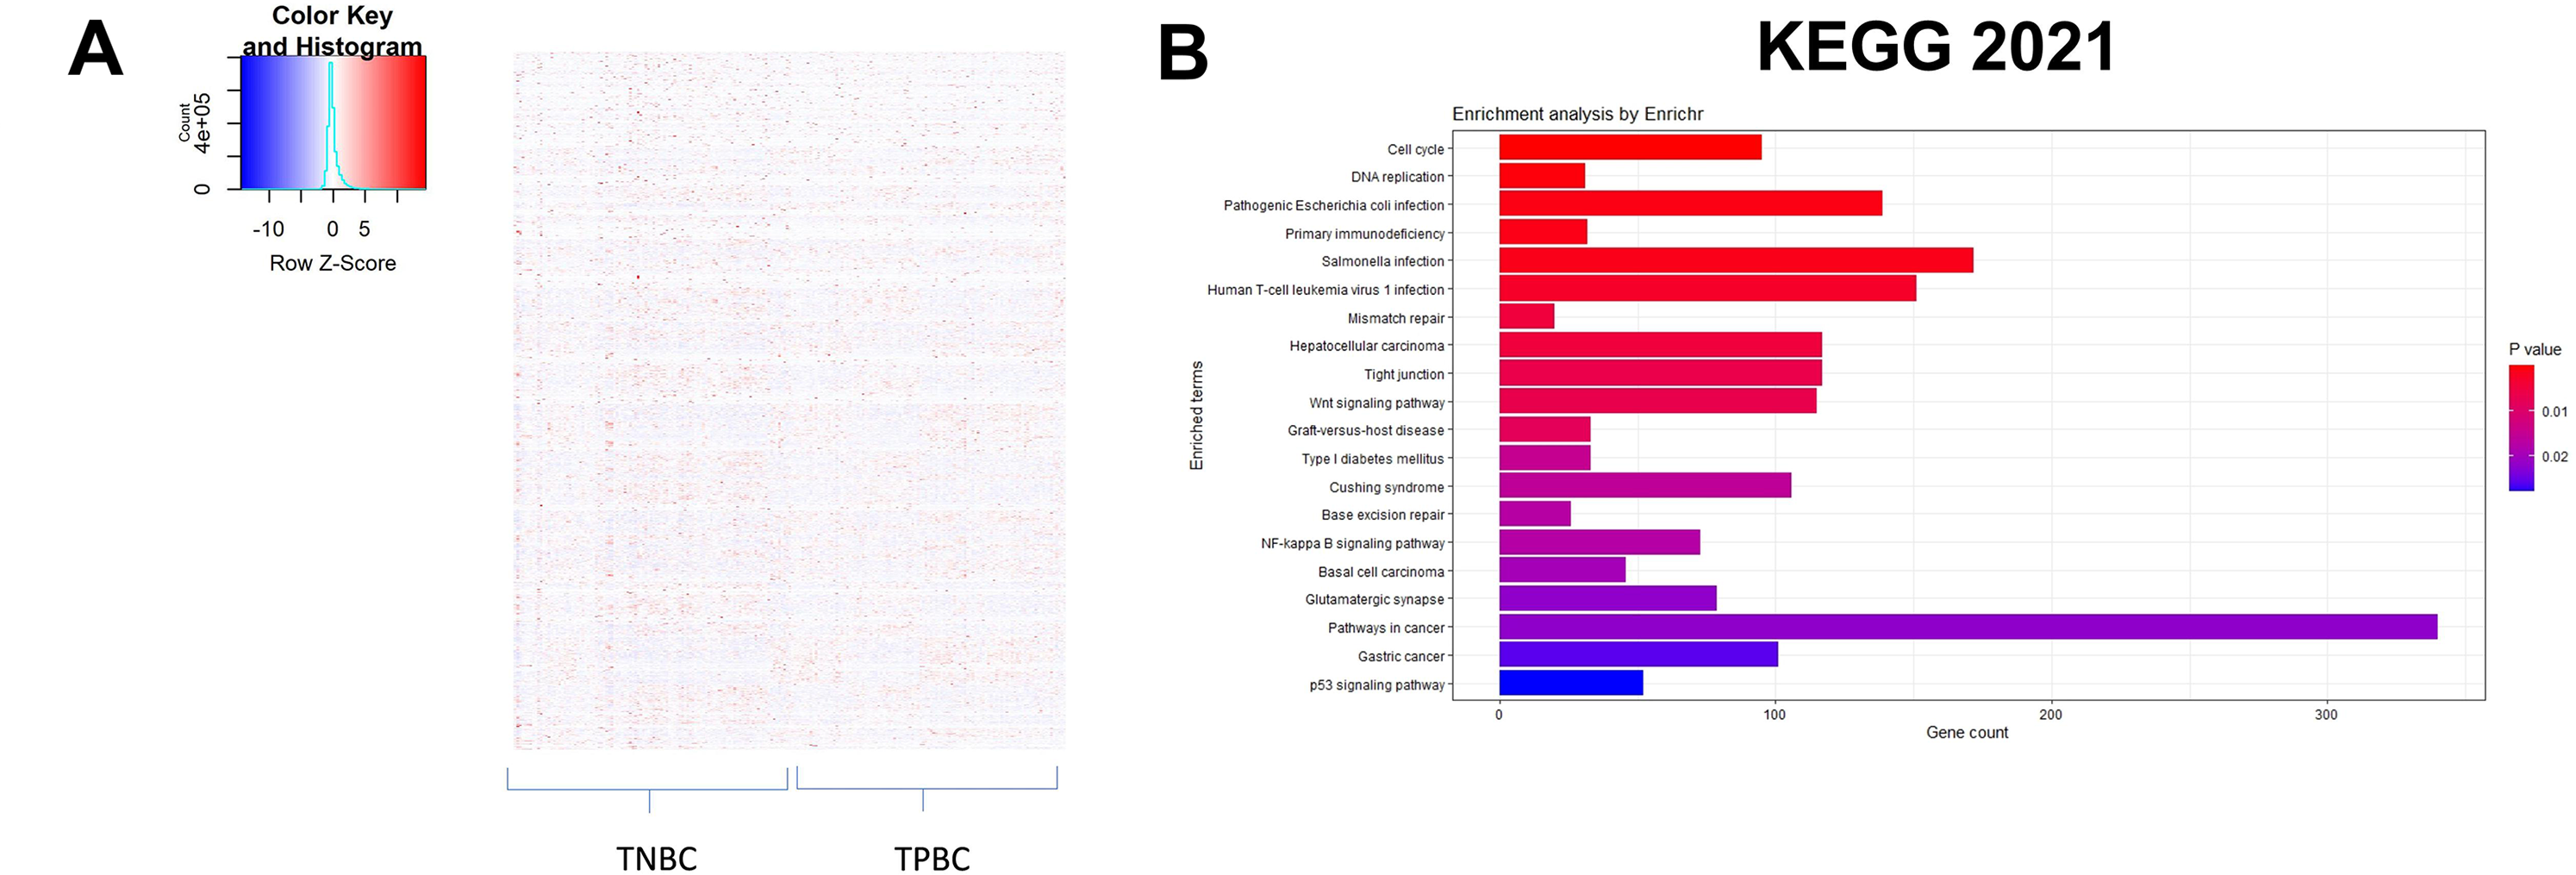
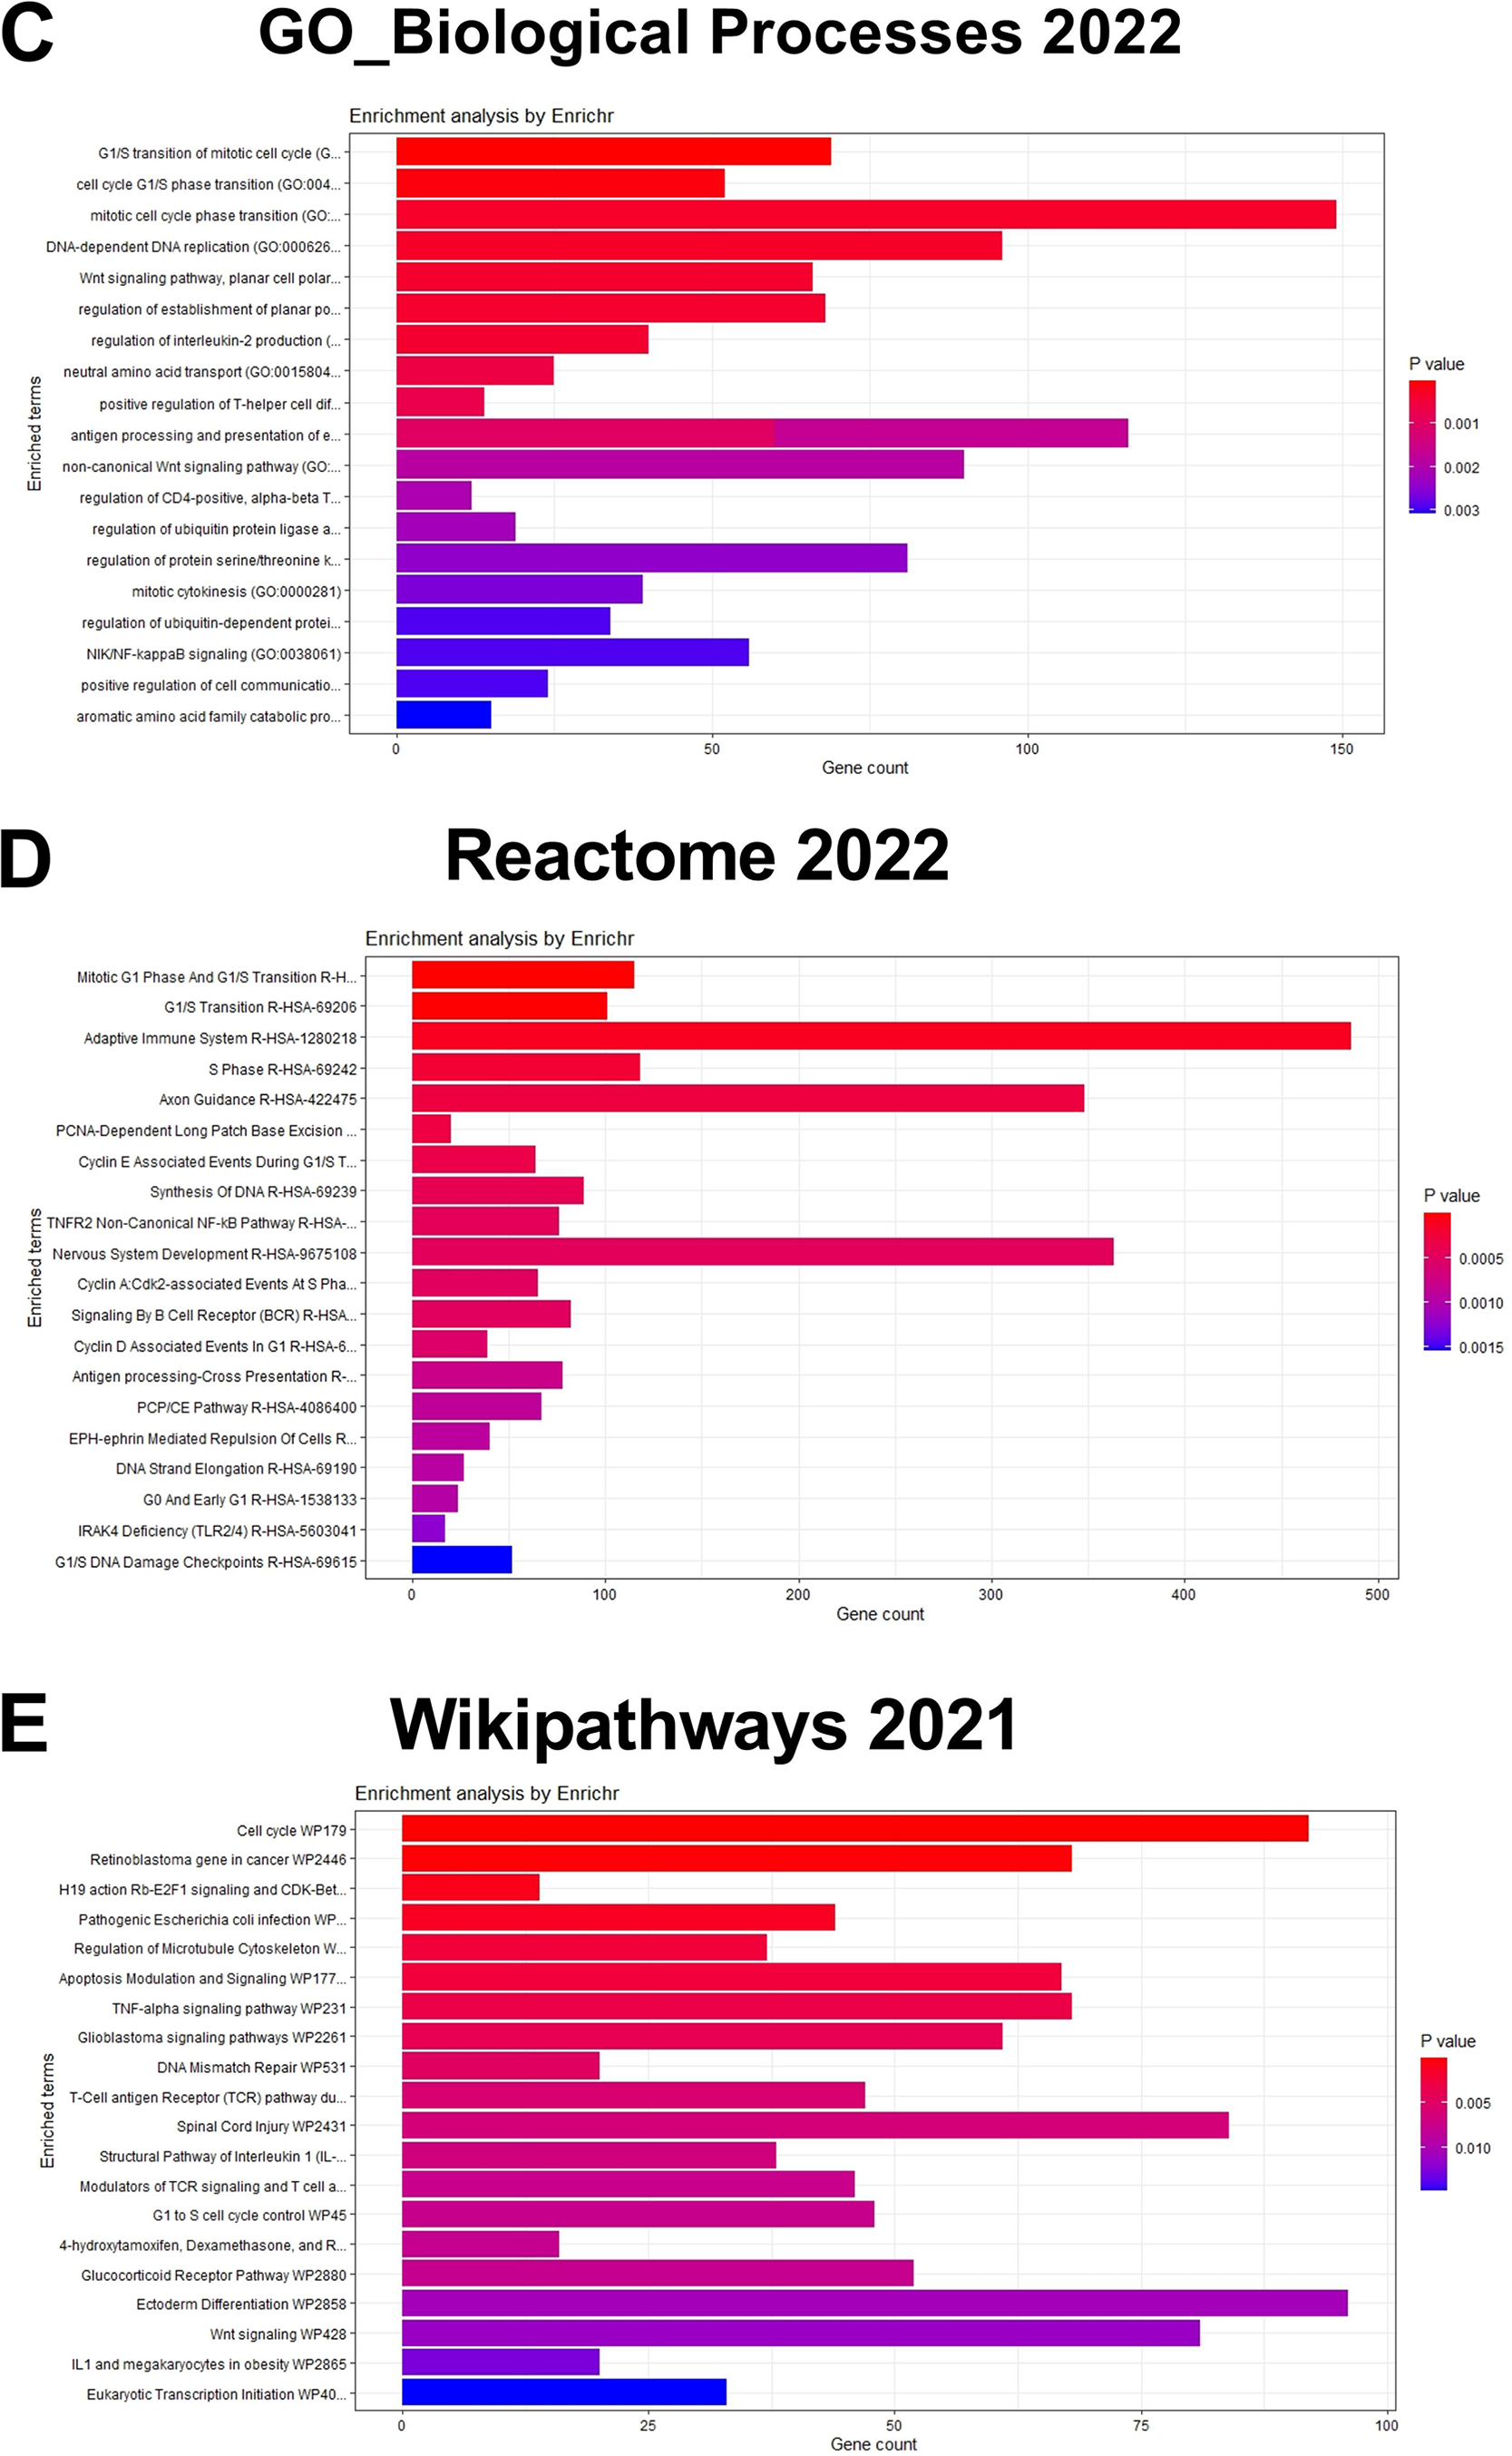
Figure 2: Identification of differentially expressed genes and enriched pathways. (A) Heatmap illustrating patterns of differential gene expression between triple-negative breast cancer (TNBC) and triple-positive breast cancer (TPBC) groups. The color key in the top-left corner ranges from blue to red, indicating low to high values. Red boxes indicate proteins that are up-regulated in TNBC compared to TPBC, while blue boxes indicate proteins that are down-regulated in TNBC compared to TPBC. Enrichment plots showing enriched pathways on genes differentially expressed between TPBC and TNBC groups generated using EnrichR using different databases, (B) KEGG_2021_human, (C) GO_Biological_Process 2022, (D) Wikipathway_2021, and (E) Reactome_2022. The color coding is based on the p-values (key on the right side); red indicates the lowest p-value and blue indicates the highest p-value. Abbv: KEGG: Kyoto Encyclopedia of Genes and Genomes; GO_Biological_process: Gene Ontology Biological Process
3.2 Identification of Master Regulators
Three different transcriptional regulatory algorithms were employed to construct regulatory networks, namely, the Algorithm for the Reconstruction of Accurate Cellular Networks (ARACNe), Gene Network Inference with an Ensemble of Trees (GENIE3), and the Inferelator. The network generated by each algorithm, along with the expression file and the list of transcription factors, was analyzed using Virtual Inference of Protein Activity by Enriched-Regulon analysis (VIPER). VIPER calculates a score based on the protein regulon and the differential expression of the target genes between the TNBC and TPBC groups. The top twenty master regulators obtained from each algorithm are depicted in Fig. 3A–C. An intersection of these master regulators is depicted in a Venn Diagram (Fig. 3D). Six consensus master regulators were identified from the three networks: HMGA1, AFF3, XBP1, PBX1, FOXA1, and AR. Identification of master regulators using ARACNe-derived regulatory networks has been validated and well-documented [15]. In this study, we identified master regulators from regulatory networks derived using ARACNe, GENIE3, and the Inferelator. To validate the common targets of the master regulators, we employed a feature of Harmonizome, a collection of experimentally determined transcription factor datasets such as JASPAR PWMs, ENCODE, and ChEA [33]. These datasets have lists of transcriptional regulators and their corresponding gene targets that are validated using ChIP-seq analysis. Table 1 contains the target genes of FOXA1 that are validated by the JASPAR PWM and ENCODE transcription factor database. Out of the 83 target genes, 55 target genes are reported or validated, leaving 23 target genes that were previously not established as FOXA1 targets. The target genes may thus be deemed novel regulatory targets of FOXA1. Similarly, the regulatory targets of HMGA1, AR, AFF3, XBP1, and PBX1 are reported in Tables 2–6. The molecular networks are also depicted in Fig. 4.
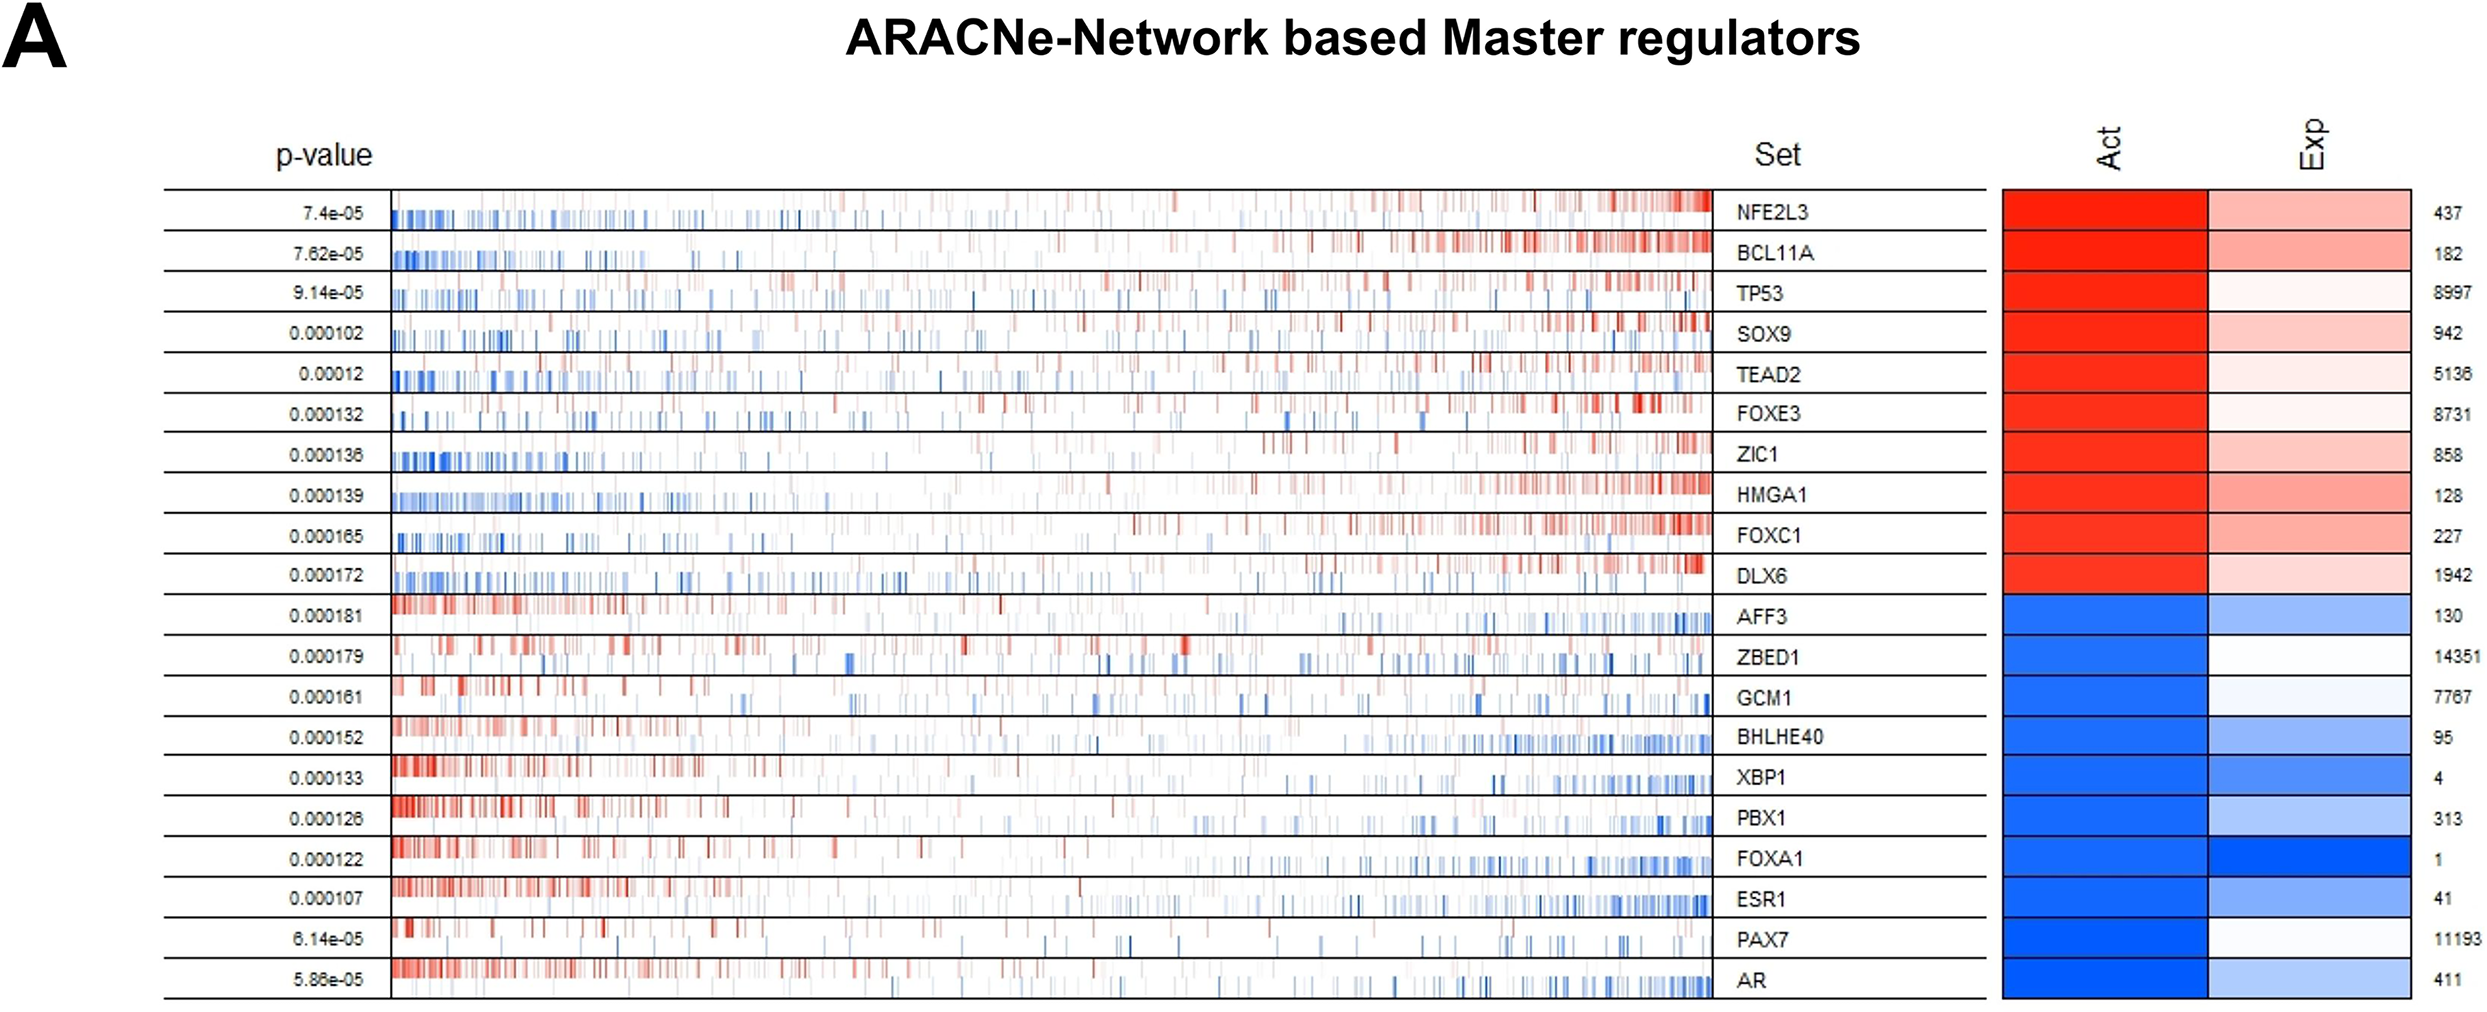
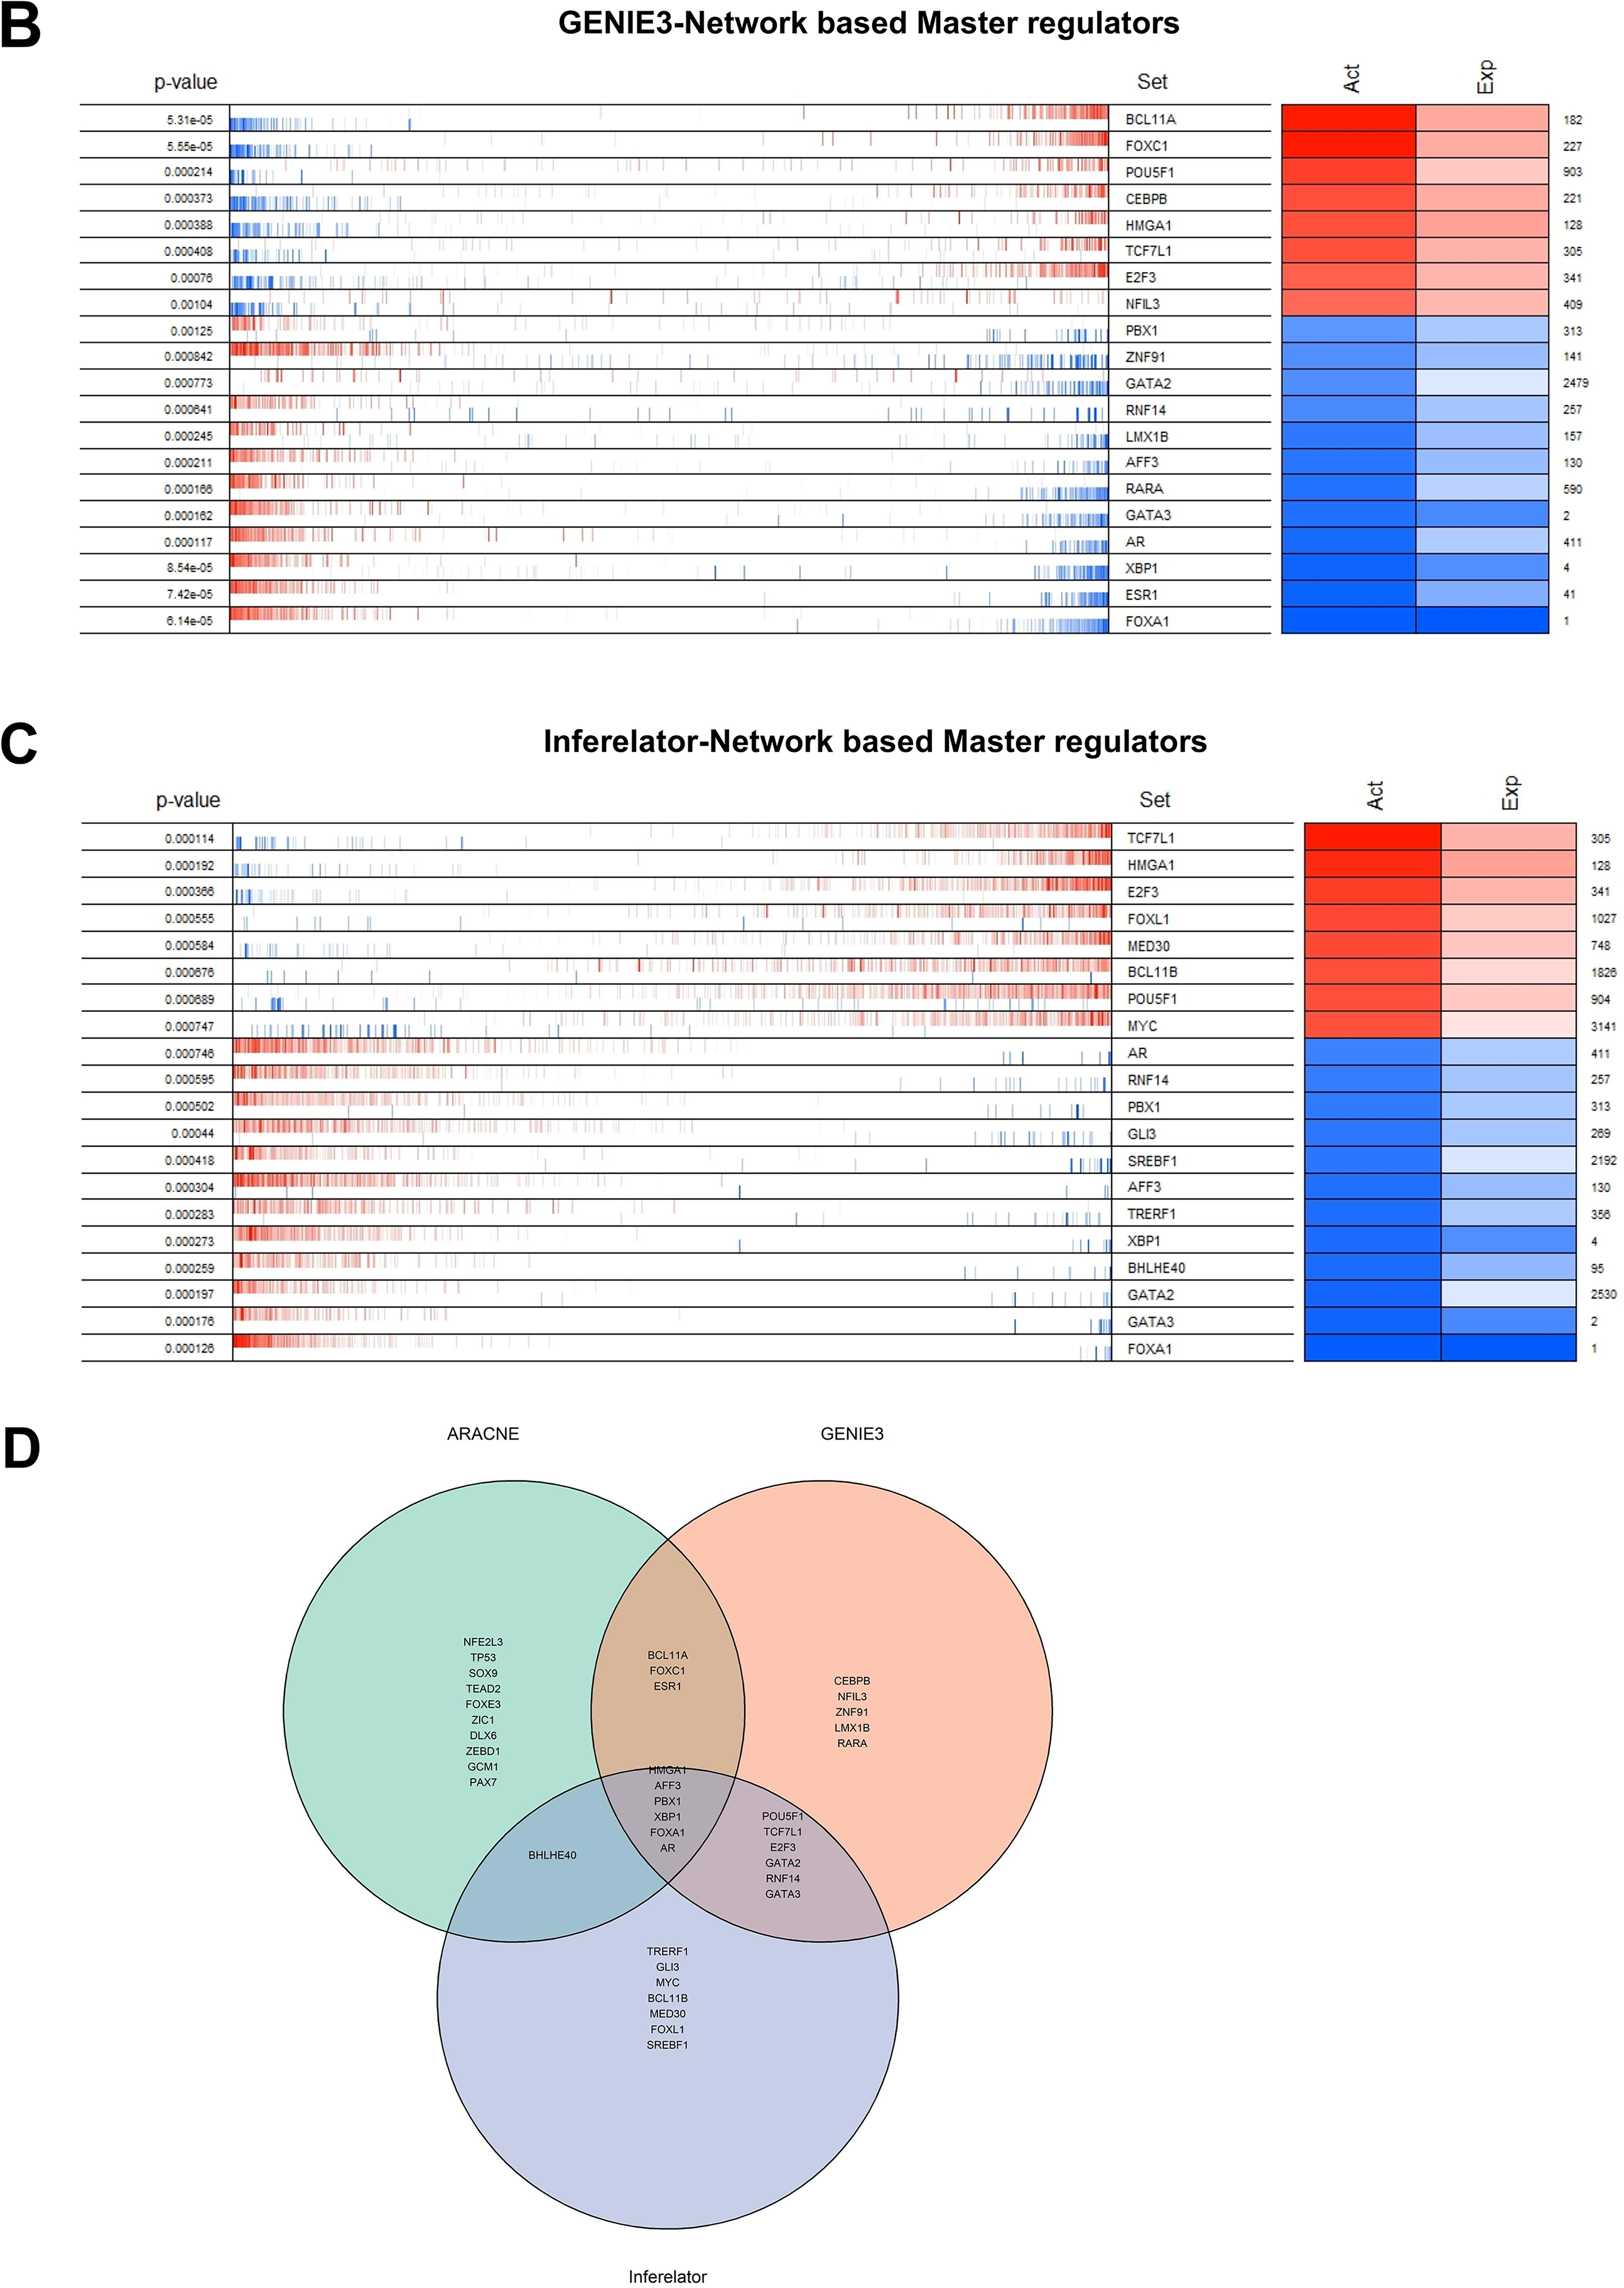
Figure 3: Identification of master regulators. The top twenty differentially active transcription regulators, along with their corresponding regulons enriched (aggregated at the ends of the list of genes ranked by their levels of expression) between TNBC and TPBC groups. (A) ARACNe-Network Based master regulators, (B) GENIE3 Network Based master regulators, (C) The Inferelator Network Based master regulators. In the second column, the genes are rank-sorted (left to right) from the most downregulated in the TNBC group (relative to the TPBC group) to the most upregulated, and vertical bars represent targets of the transcription regulators (named in the third column) in the TRNs. Red bars and boxes represent increased expression; blue bars and boxes represent suppressed expression. The fourth and fifth columns represent inferred differential protein activity and gene expression, respectively. (D) Venn Diagram depicting common master regulators from the three networks
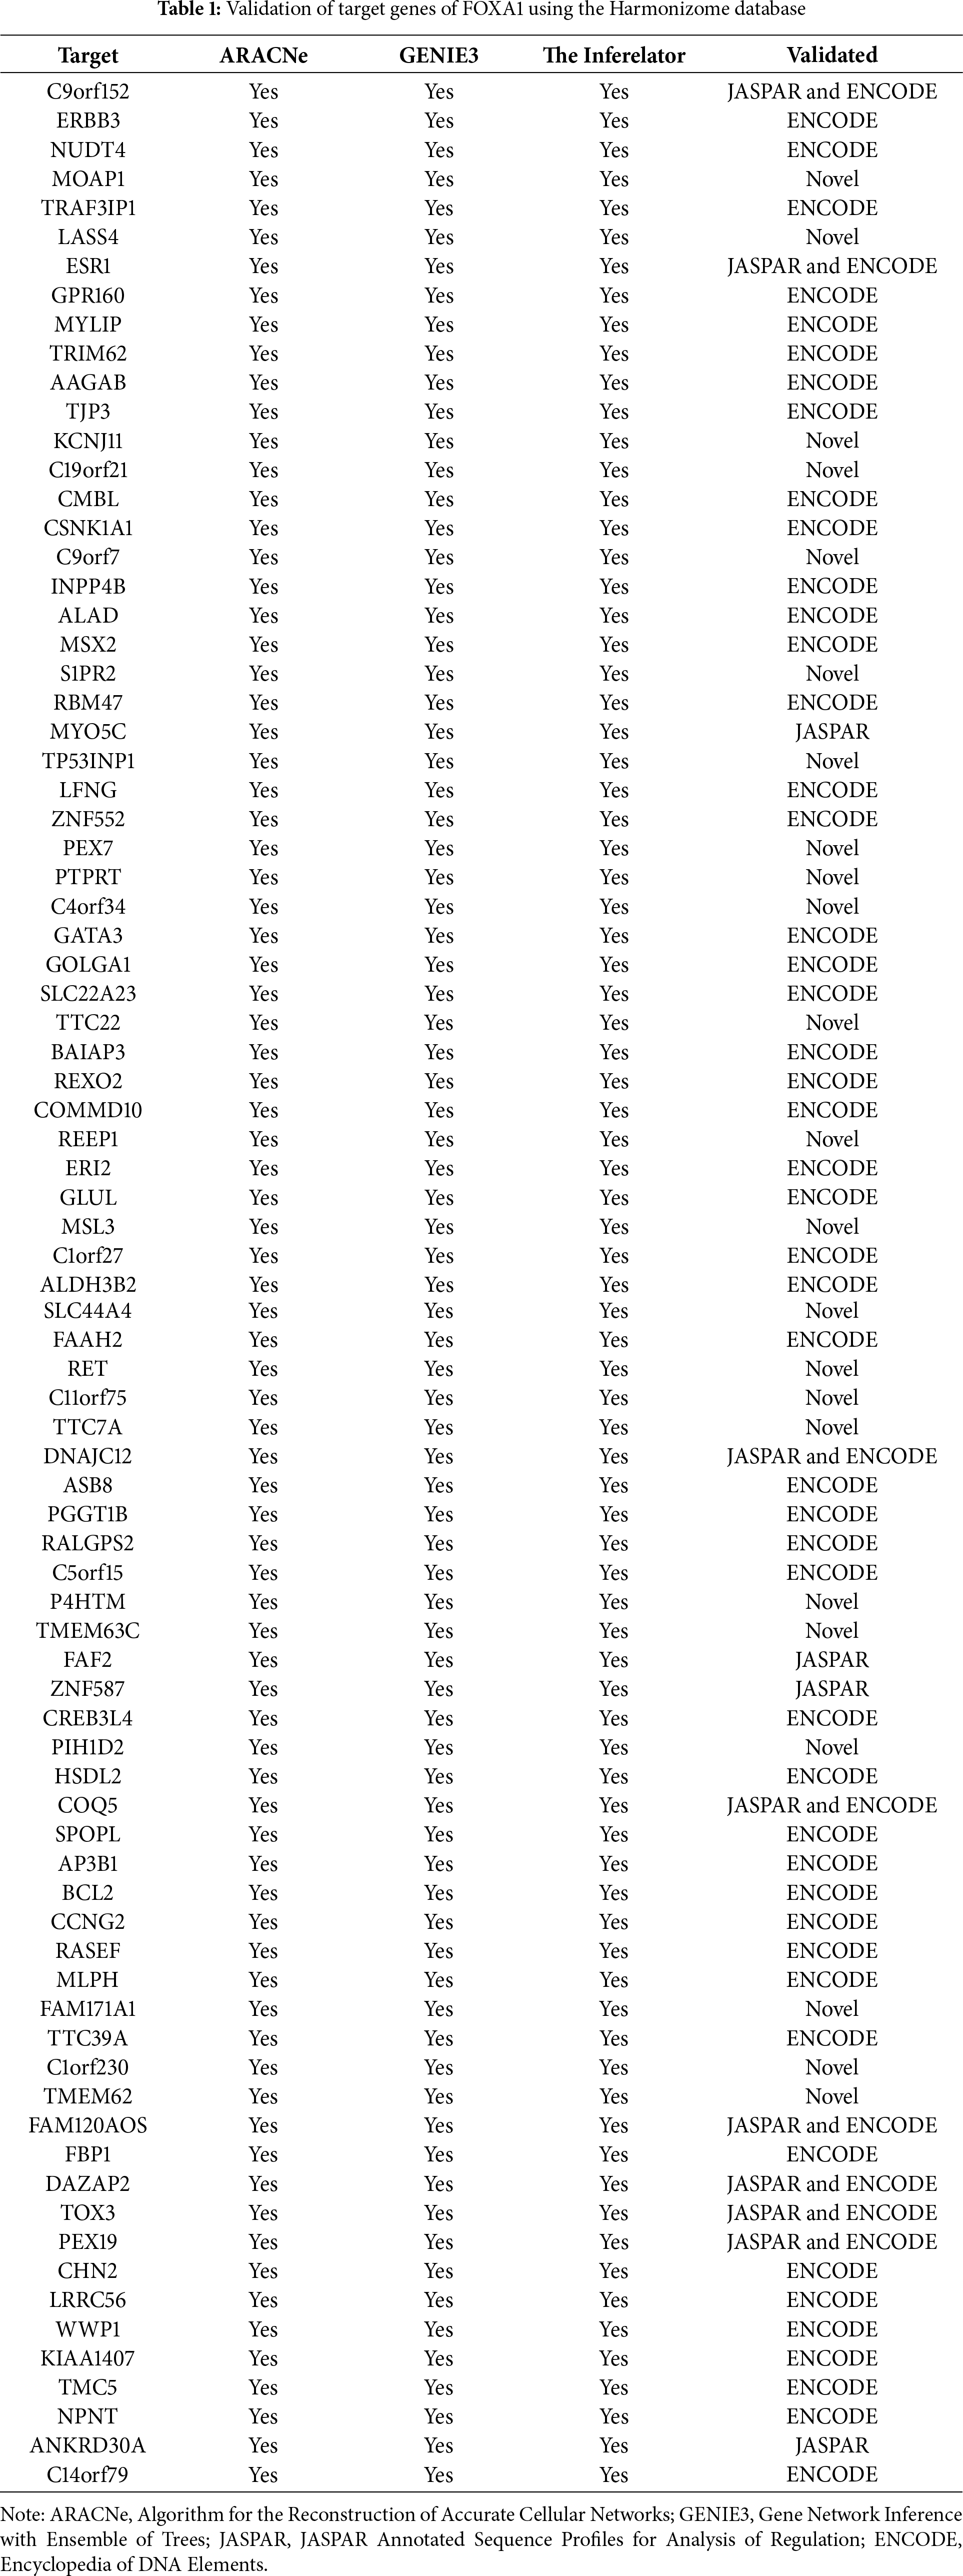
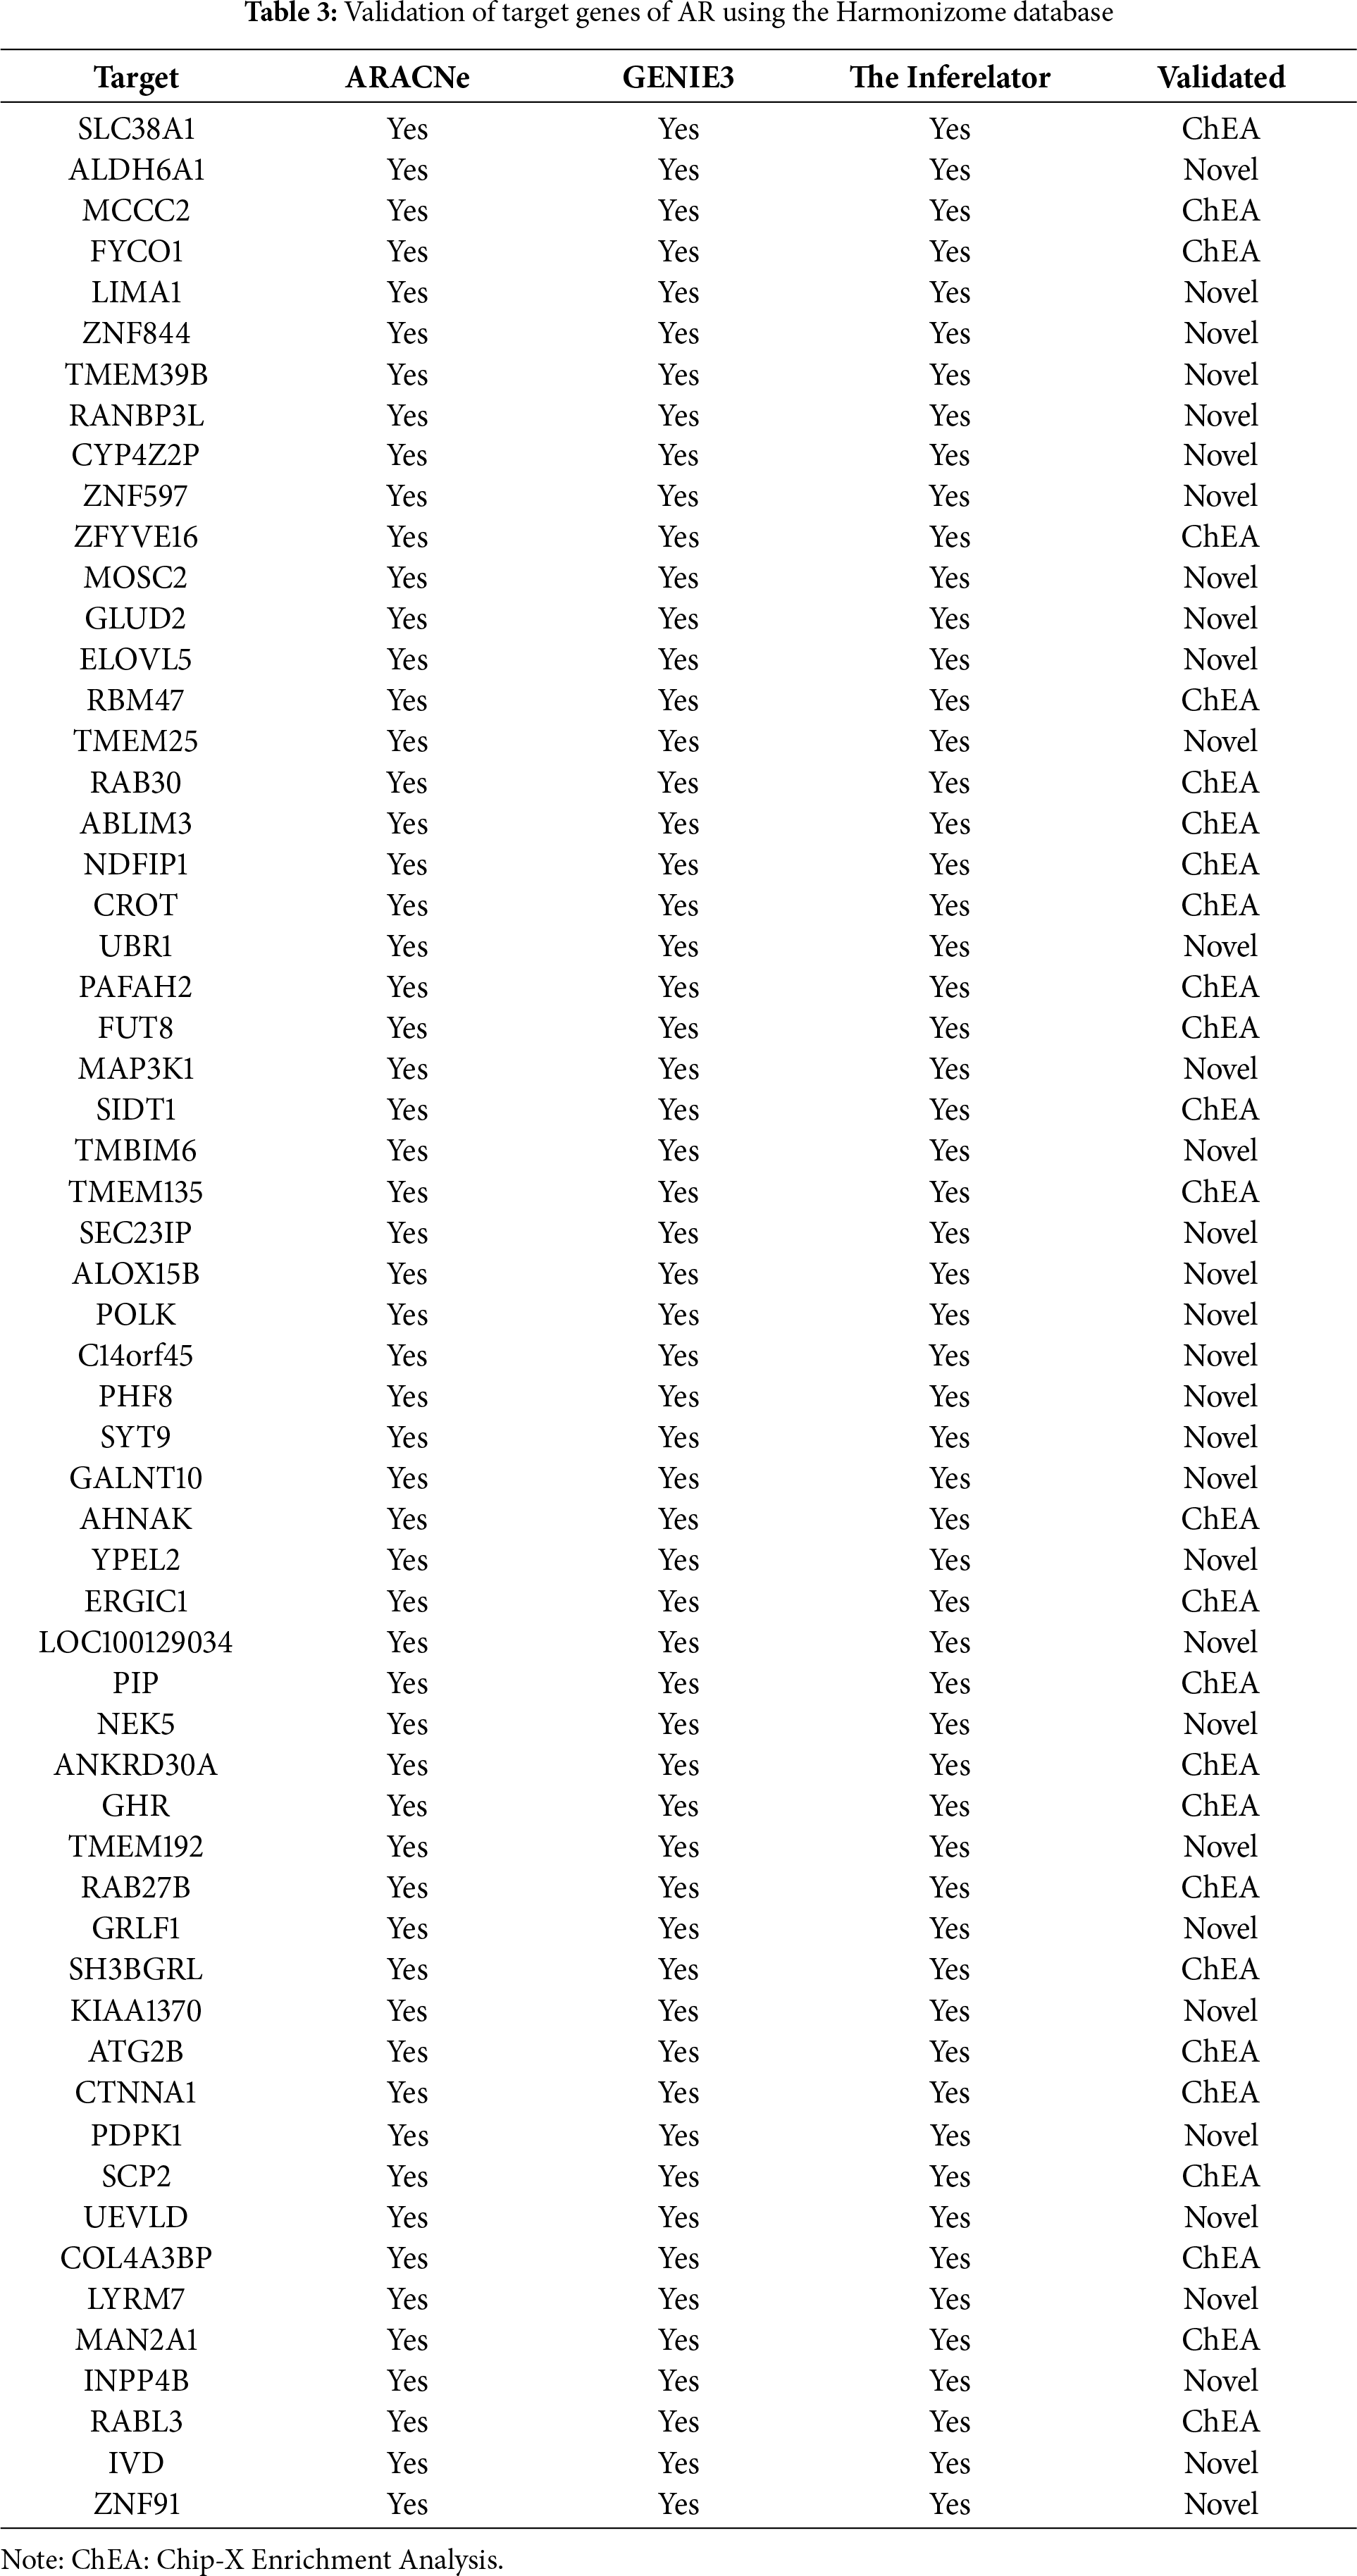
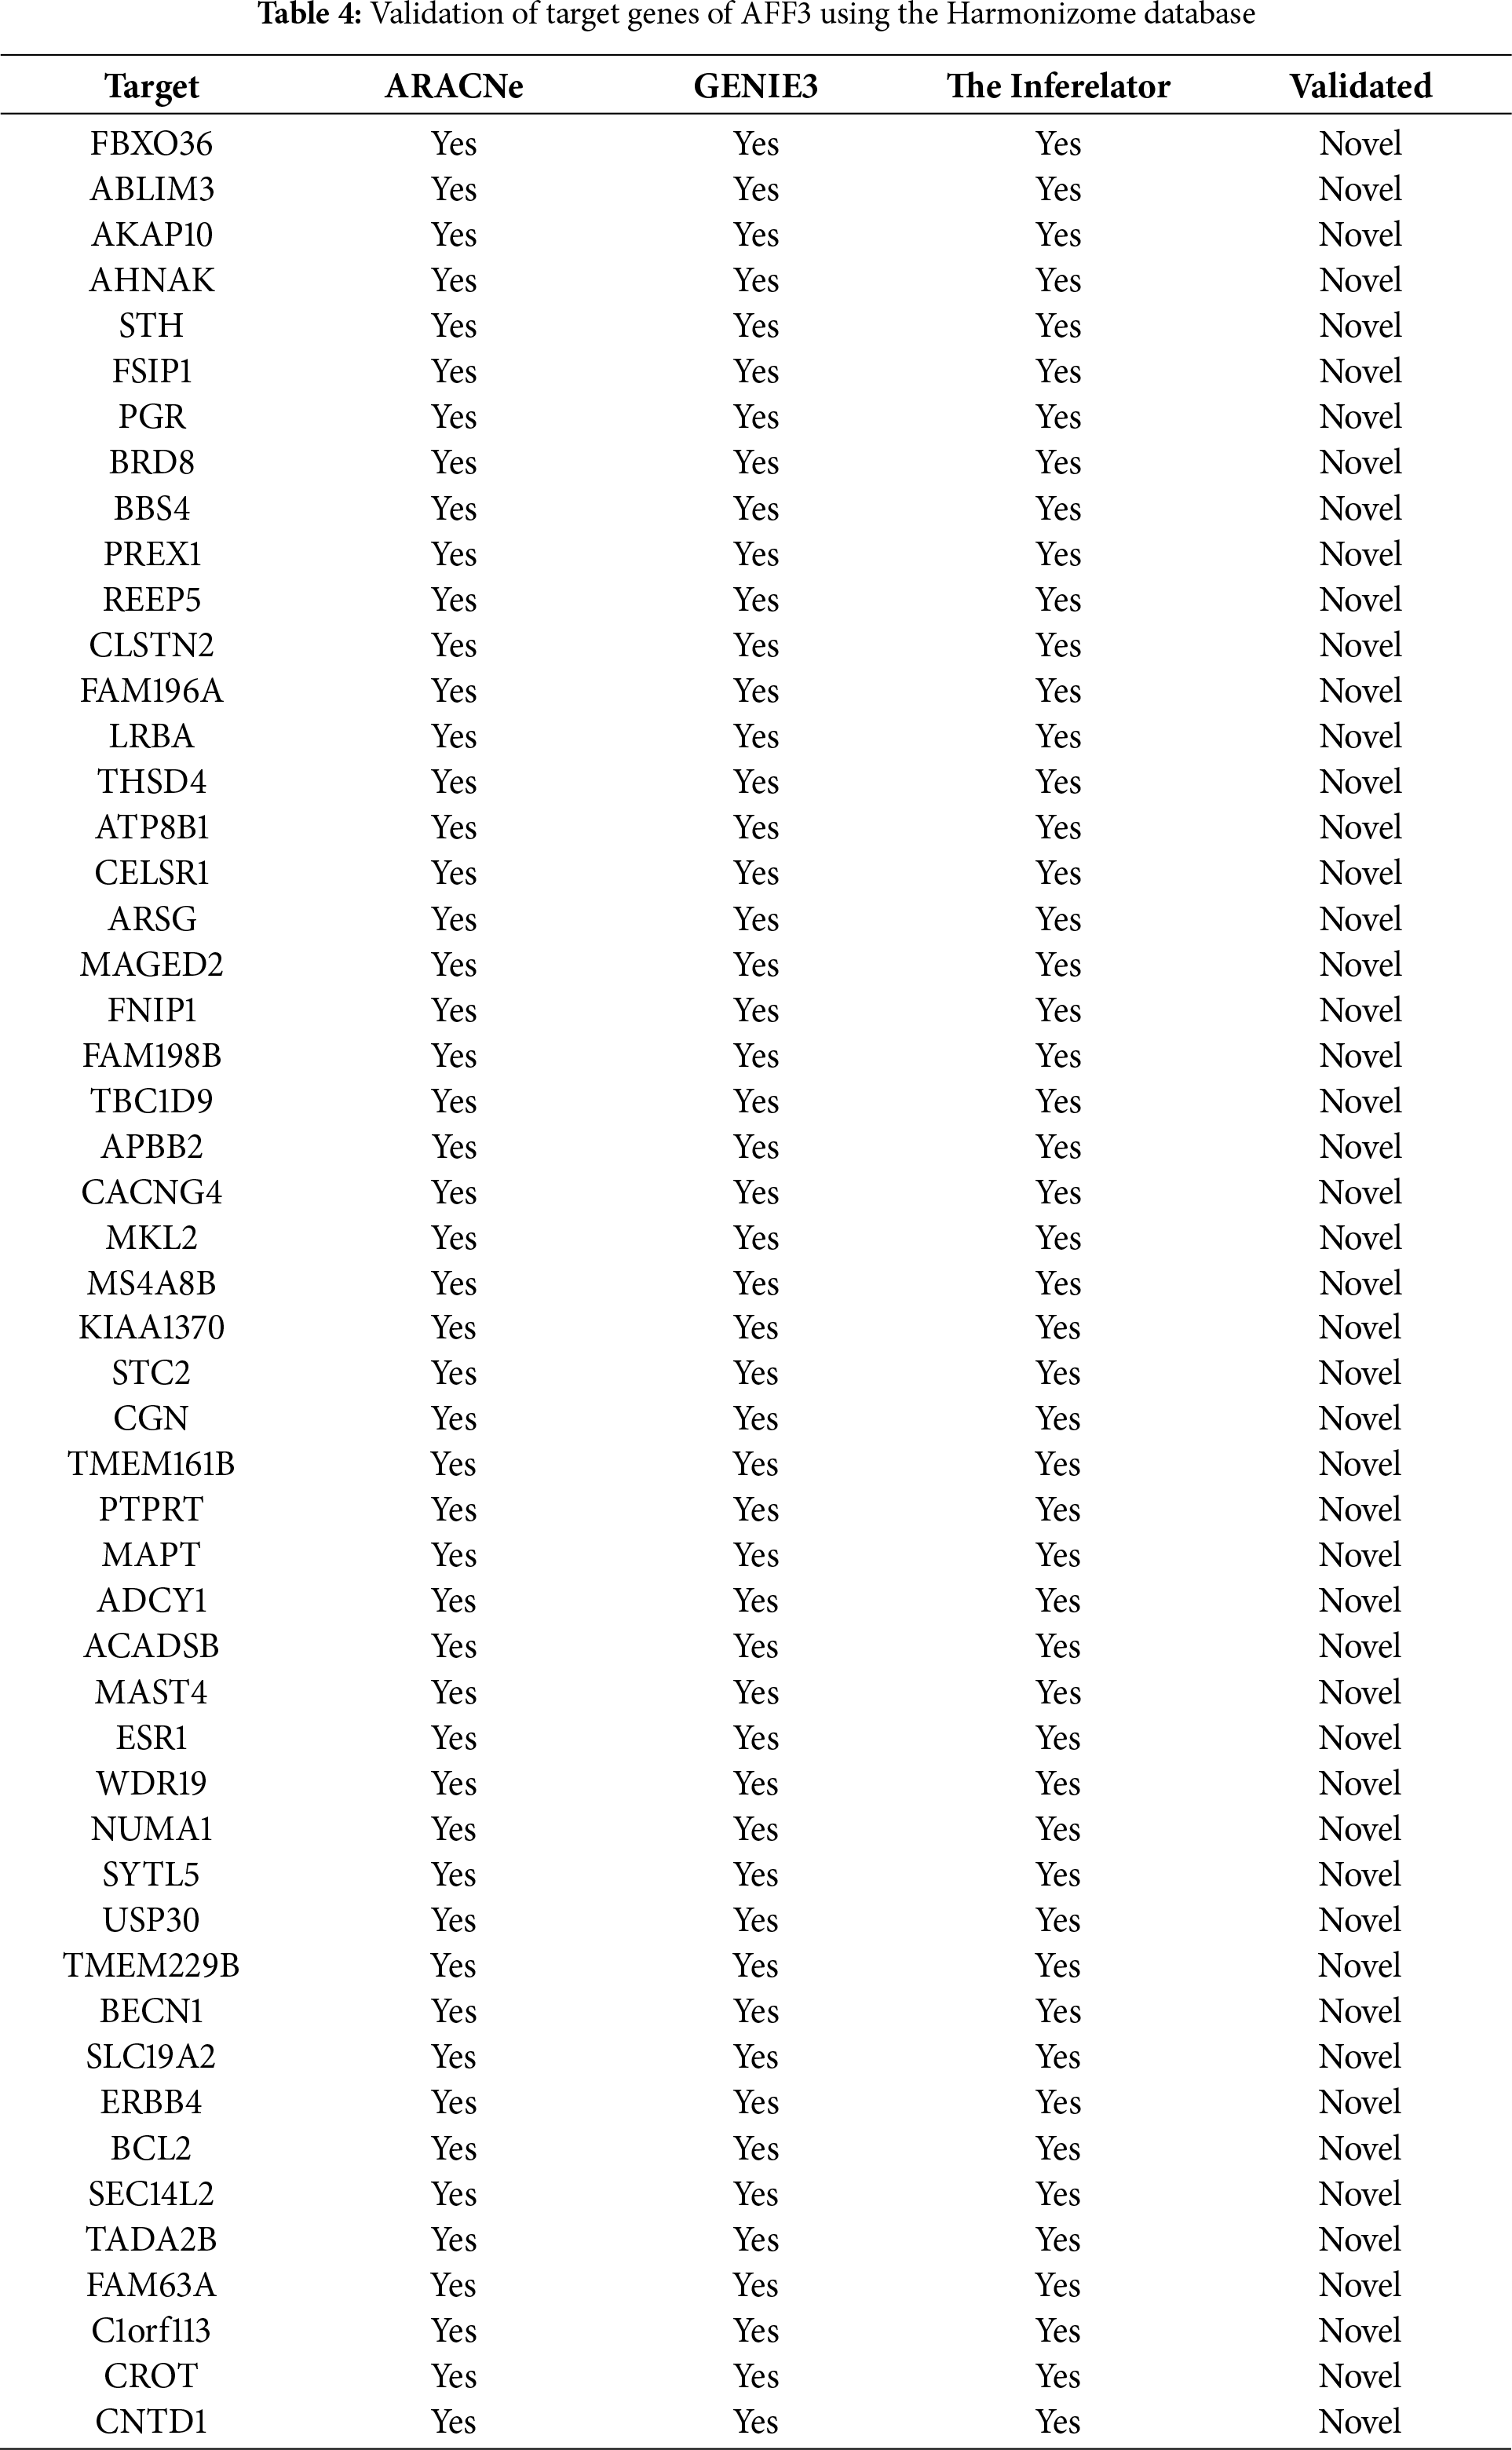
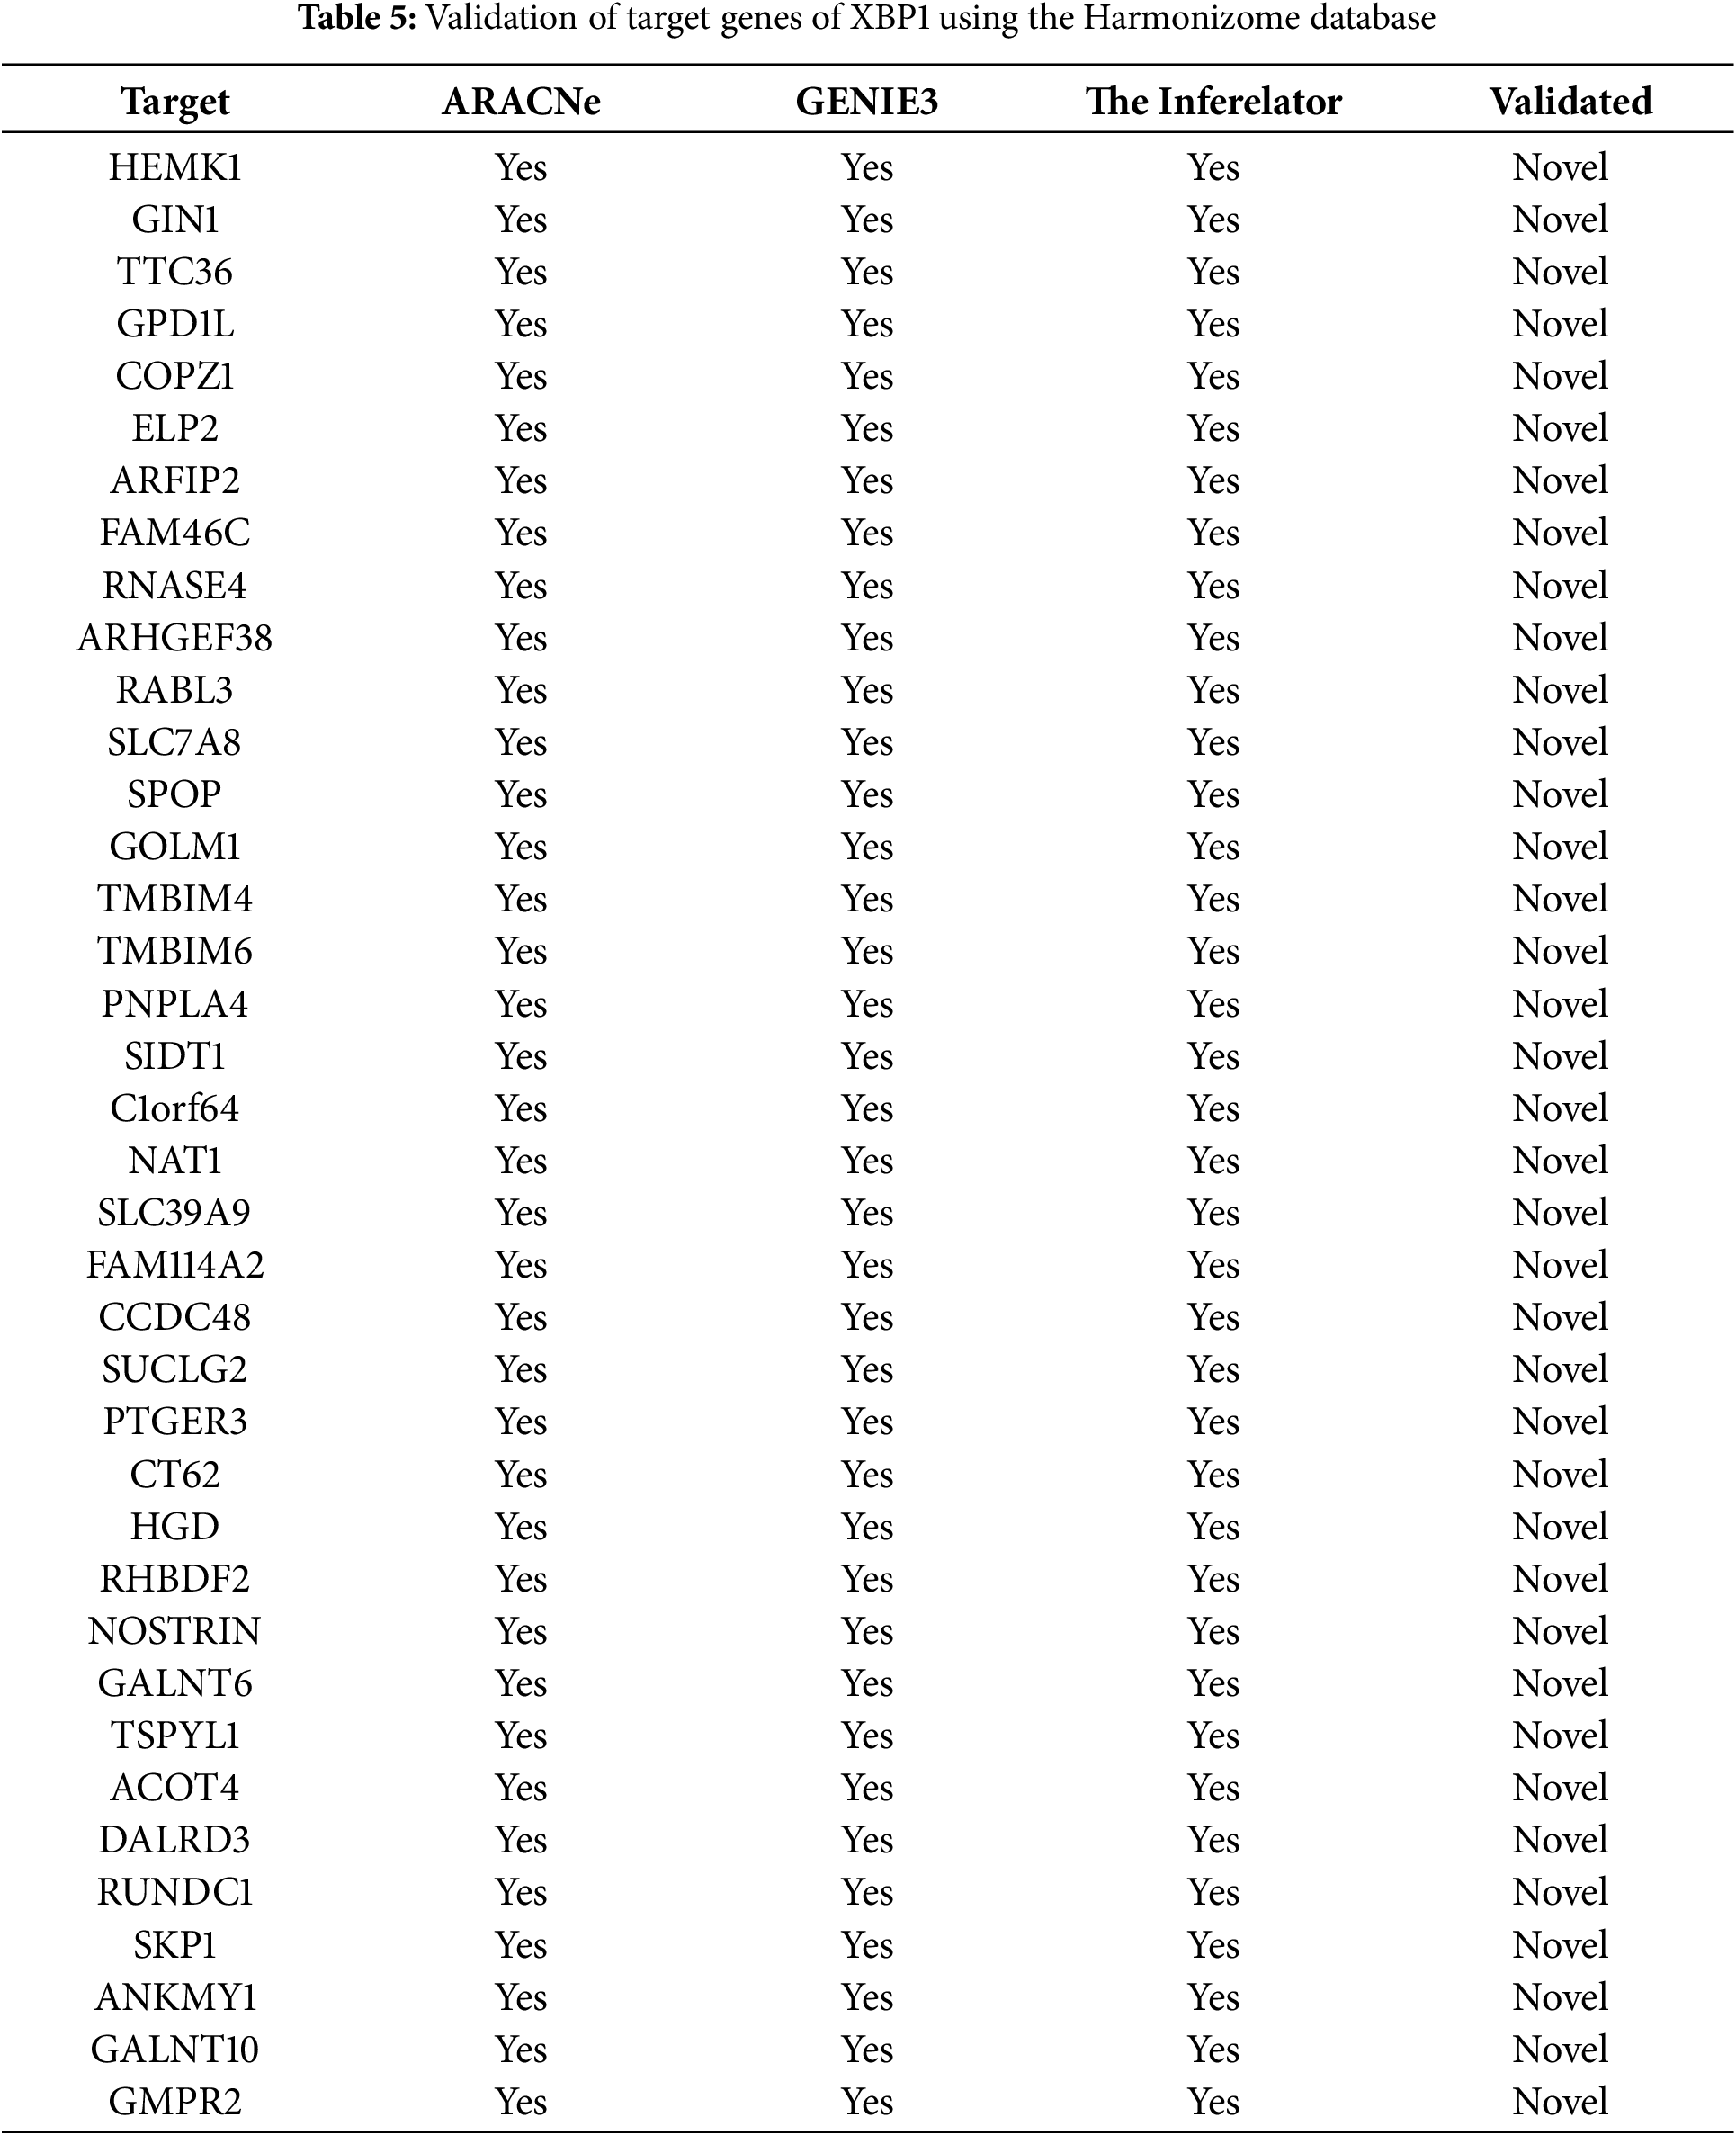
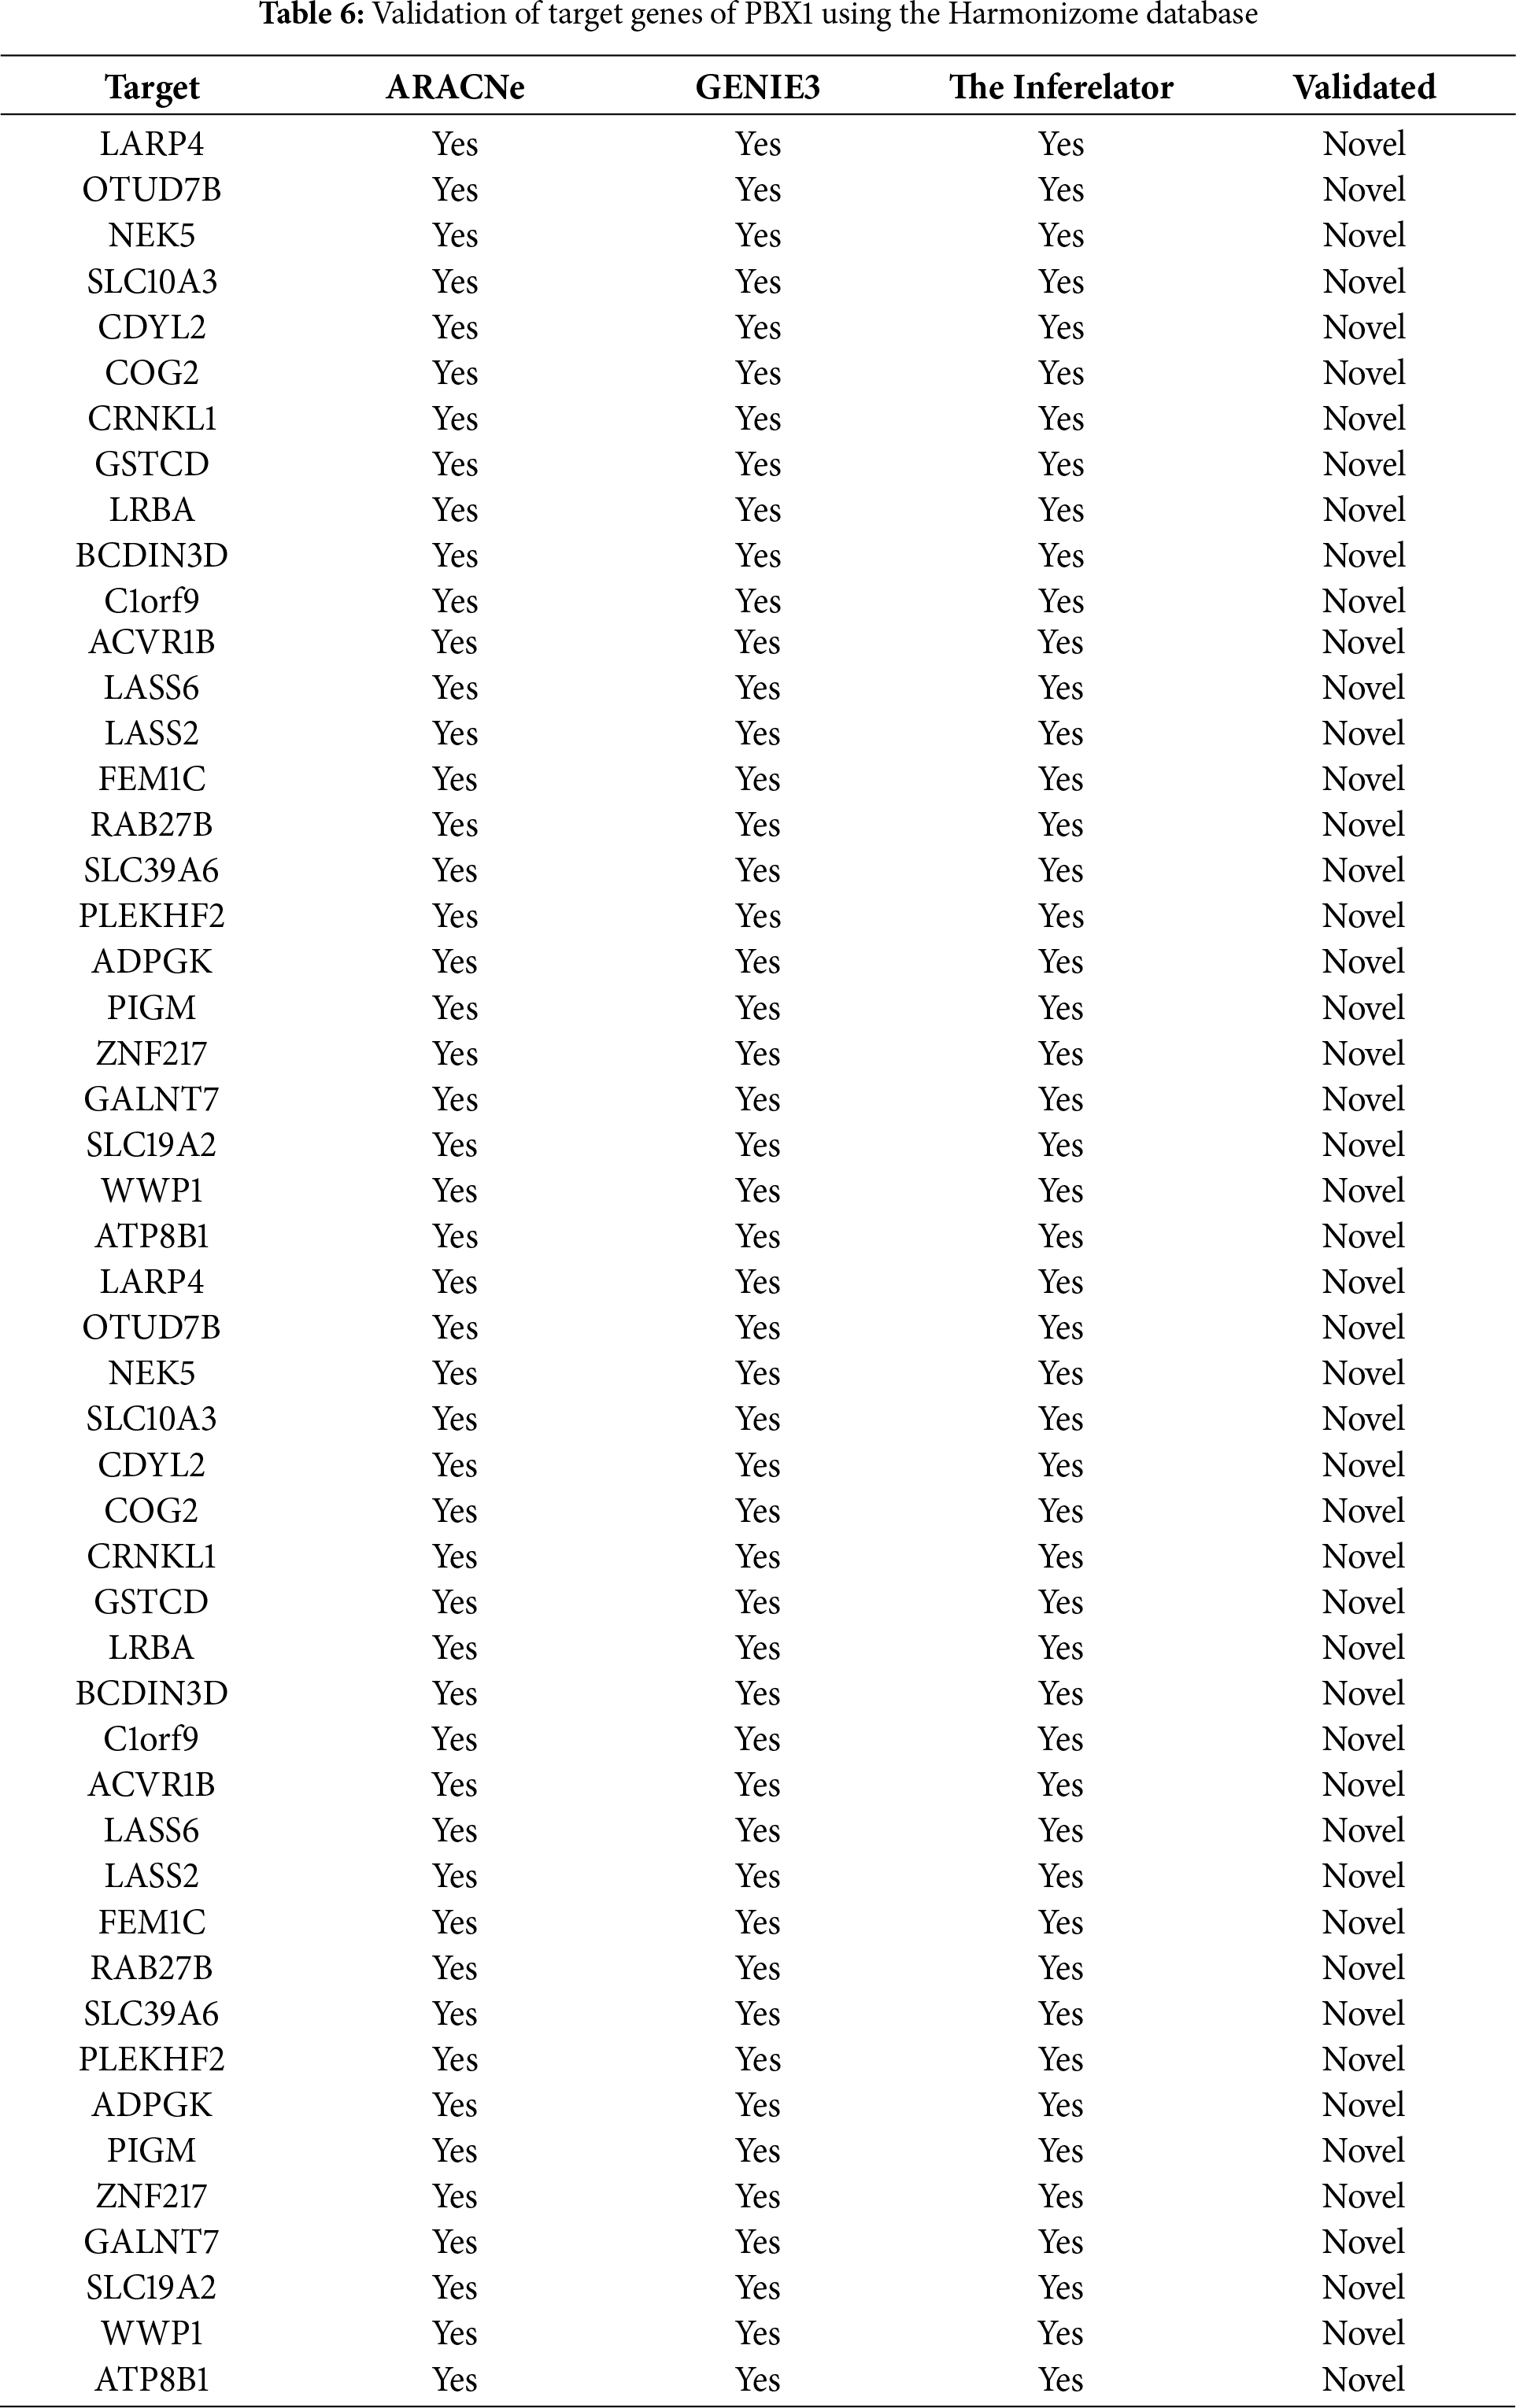
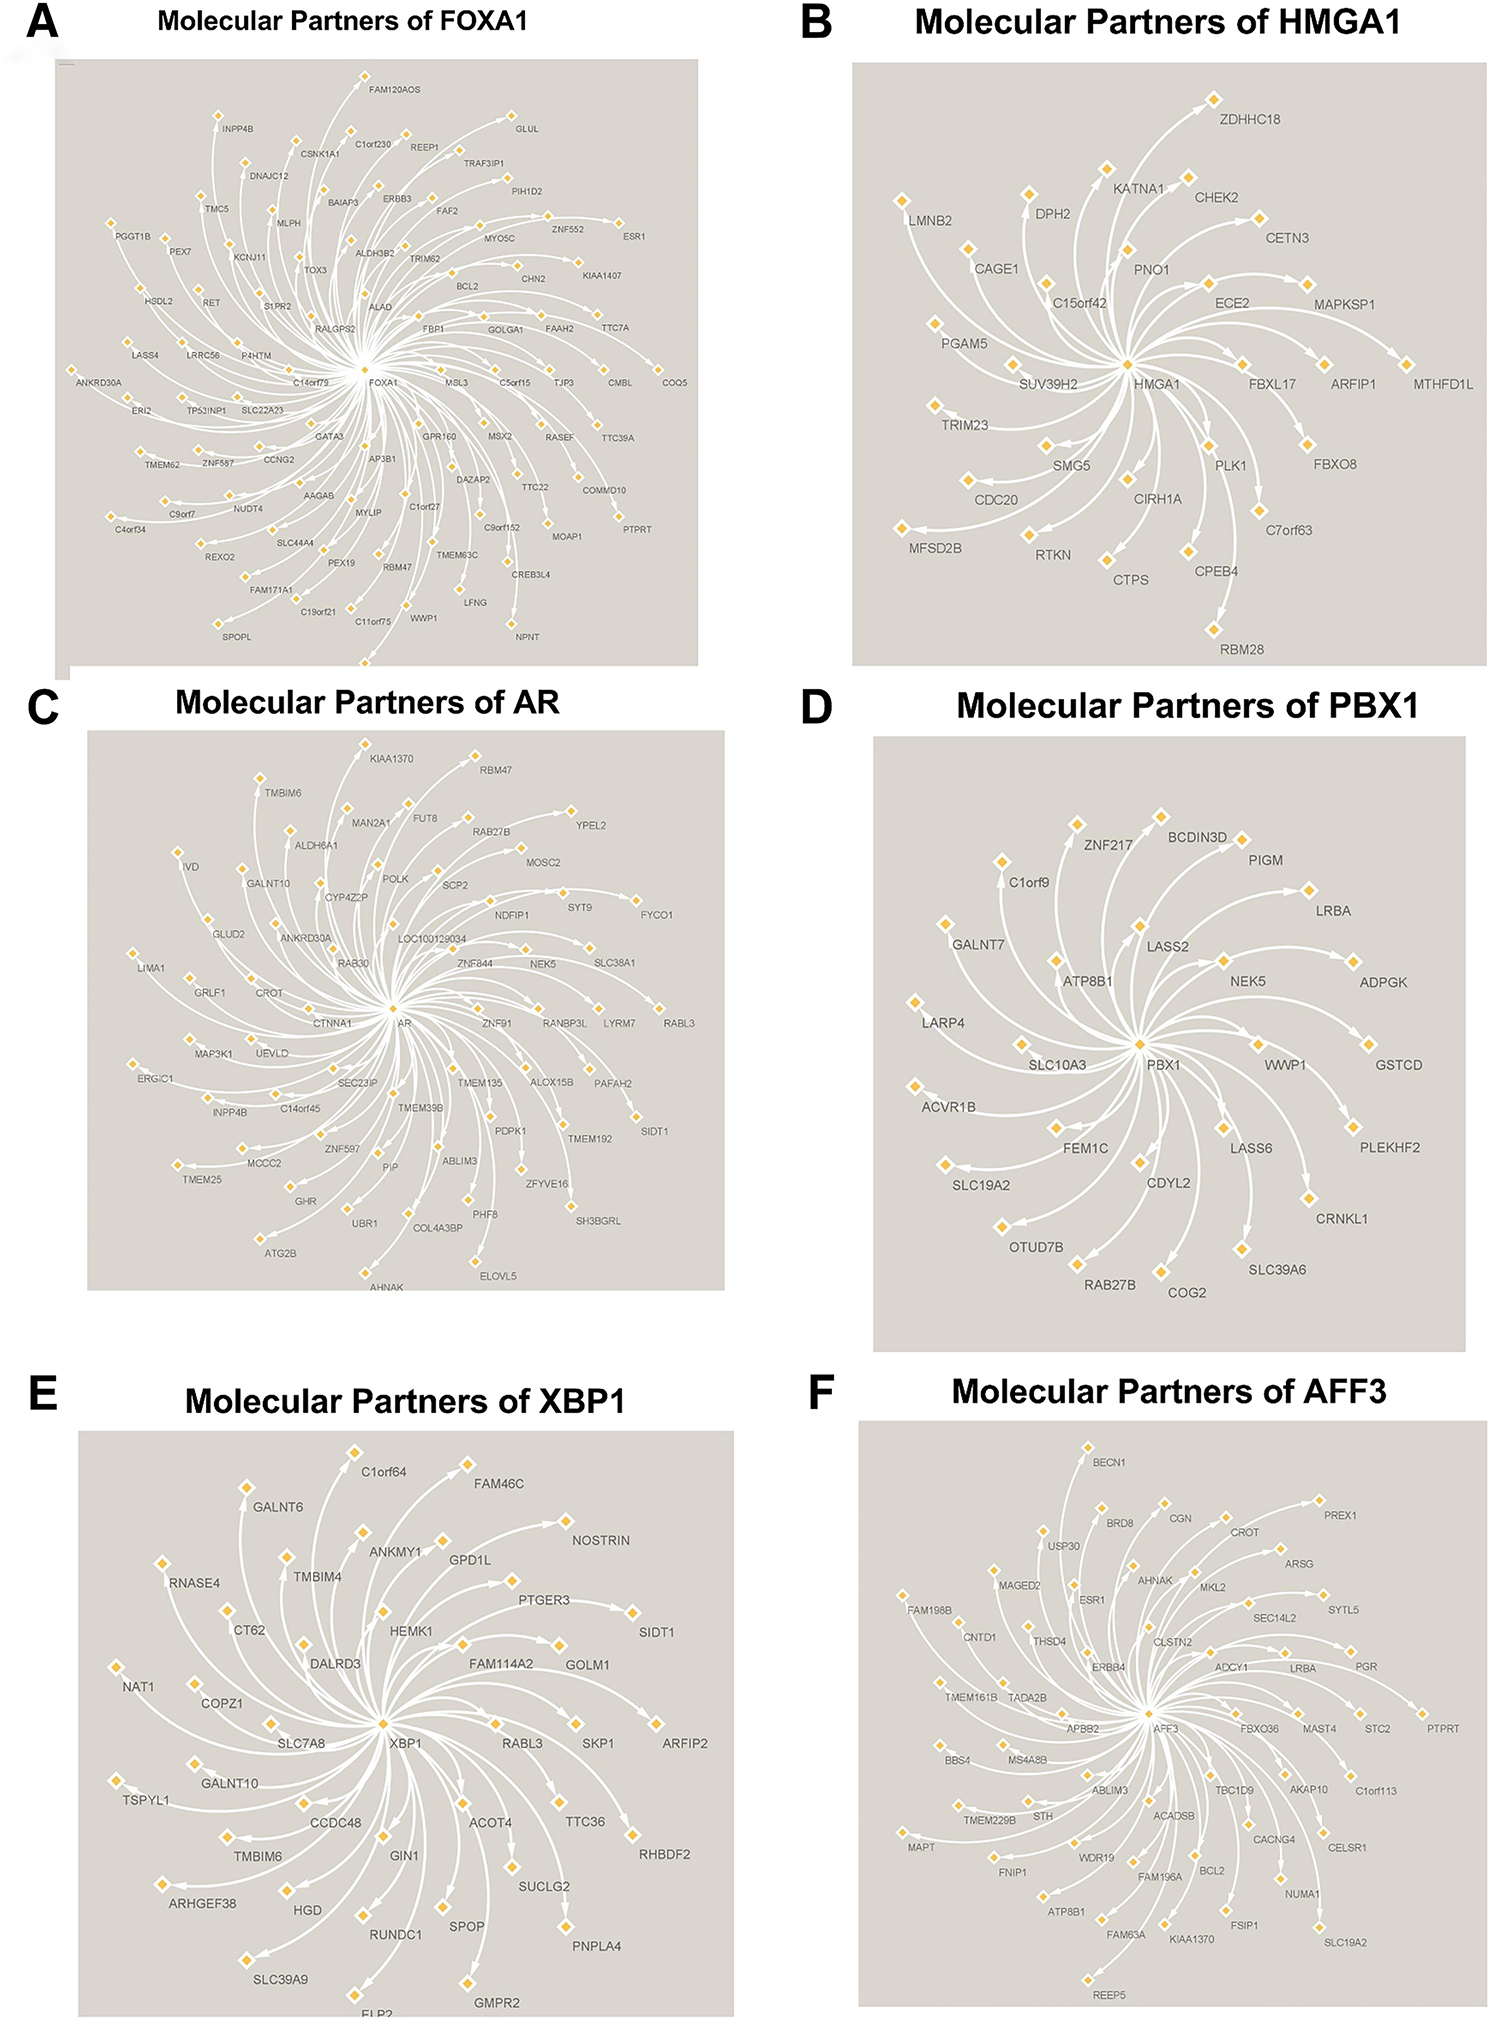
Figure 4: Molecular Partners of six master regulators obtained using transcriptional regulatory networks via VIPER. (A) FOXA1, (B) HMGA1, (C) AR, (D) PBX1, (E) XBP1 and (F) AFF3. VIPER: Virtual Inference of Protein-activity by Enriched Regulon analysis
3.3 NFE2L3: Master Regulator and Its Target Genes
NFE2L3 was identified as one of the master regulators from the ARACNe-generated network, which had the smallest p-value and had increased expression in the TNBC group compared to the TPBC group. The regulatory target genes of NFE2L3 were more than 100 in each generated network. To limit and confirm the validity of target genes, we combined the regulatory target genes of NFE2L3, which were in common between ARACNe and GENIE3, limiting to nine targets depicted in Fig. 5A, along with their differential expression patterns between TNBC and TPBC. The nine consensus target genes of NFE2L3 have, separately, been extensively researched with respect to breast cancer. The finding that NFE2L3 regulates the expression of each of these nine target genes together is a novel result of this study. The transcriptional regulatory relationship between NFE2L3 and BHLHE40, one of the nine consensus targets of NFE2L3, became our focus of experimental validation using cell line models. The expression levels of BHLHE40 were downregulated in the TNBC group, while the expression levels of NFE2L3 were upregulated in the TNBC group compared to the TPBC group. BHLHE40 is known to promote cell proliferation and migration in breast cancer [34,35]. Surprisingly, BHLHE40 expression levels in TNBC were suppressed relative to those in TPBC. This led to the question of whether NFE2L3 regulates the expression of BHLHE40 in TNBC. Fig. 5B,C represents the survival analysis of the high and low expression of NFE2L3 and BHLHE40 using the TCGA BrCA dataset. High expression of NFE2L3 is inversely correlated to overall survival, which means patients with high expression of NFE2L3 have poor overall survival compared to patients with lower expression of NFE2L3. On the other hand, there is no significant difference in survival rates between patients with high or low expression of BHLHE40.

Figure 5: (A) Consensus regulatory targets of NFE2L3, based on the regulatory networks inferred using GENIE3 and ARACNe. The red represents the protein upregulated in TNBC compared to TPBC. The blue represents the protein downregulated in TNBC compared to TPBC. Kaplan-Meier survival plots of (B) NFE2L3 and (C) BHLHE40 using the TCGA RNA-seq Breast cancer dataset. The red line represents higher expression of the gene, while the blue line represents lower expression of the gene. p < 0.05. Higher NFE2L3 expression corresponds to poor overall survival than those with low NFE2L3 expression, while there is no significant difference in survival between patients with high and low expressions of BHLHE40
3.4 NFE2L3 Regulates BHLHE40 Expression at the Transcriptional Level
Triple-negative breast cancer cell lines (MDA-MB-231 and MDA-MB-468) were used to validate siRNA and plasmids targeting NFE2L3 (siNFE2L3 and NFE2L3 plasmid, respectively) and BHLHE40 (siBHLHE40 and BHLHE40 plasmid, respectively). Treatment with siNFE2L3 significantly decreased NFE2L3 mRNA expression levels in both cell lines compared to the control group (Fig. 6A,B). Notably, NFE2L3 mRNA expression was downregulated by 35% and 26% in the MDA-MB-231 and MDA-MB-468 siNFE2L3-treated cell groups, respectively, compared to the control group. Paradoxically, NFE2L3 levels were increased in MDA-MB-231 when treated with siBHLHE40 compared to the control (Fig. 6A). In contrast, treatment with the NFE2L3 plasmid significantly increased NFE2L3 mRNA expression levels in both cell lines compared to the untreated control group. NFE2L3 mRNA expression levels were upregulated by 57.28% and 43.71% compared to the control in MDA-MB-231 and MDA-MB-468 in NFE2L3 plasmid-treated cells, respectively (Fig. 6C,D). The mRNA expression levels of BHLHE40 exhibited decreased by 38% and 50% in MDA-MB-231 and MDA-MB-468 cells treated with siBHLHE40, respectively, compared to the control group. Similarly, BHLHE40 mRNA expression decreased by 65% and 30% in MDA-MB-231 and MDA-MB-468 cells treated with siNFE2L3, respectively, compared to the control. In both cell lines, BHLHE40 mRNA expression was significantly reduced in cells treated with siNFE2L3 and siBHLHE40 compared to the control group (Fig. 6E,F). Conversely, a substantial increase of 284- and 47-fold in BHLHE40 expression levels was observed in MDA-MB-231 and MDA-MB-468 cells treated with the BHLHE40 plasmid, respectively. These levels were significantly higher compared to the control group in both cell lines (Fig. 6G,H). Furthermore, the expression levels of BHLHE40 were significantly elevated in MDA-MB-231 and MDA-MB-468 cells treated with NFE2L3 by 196% and 3.94%, respectively, suggesting a transcriptional relationship between NFE2L3 and BHLHE40.
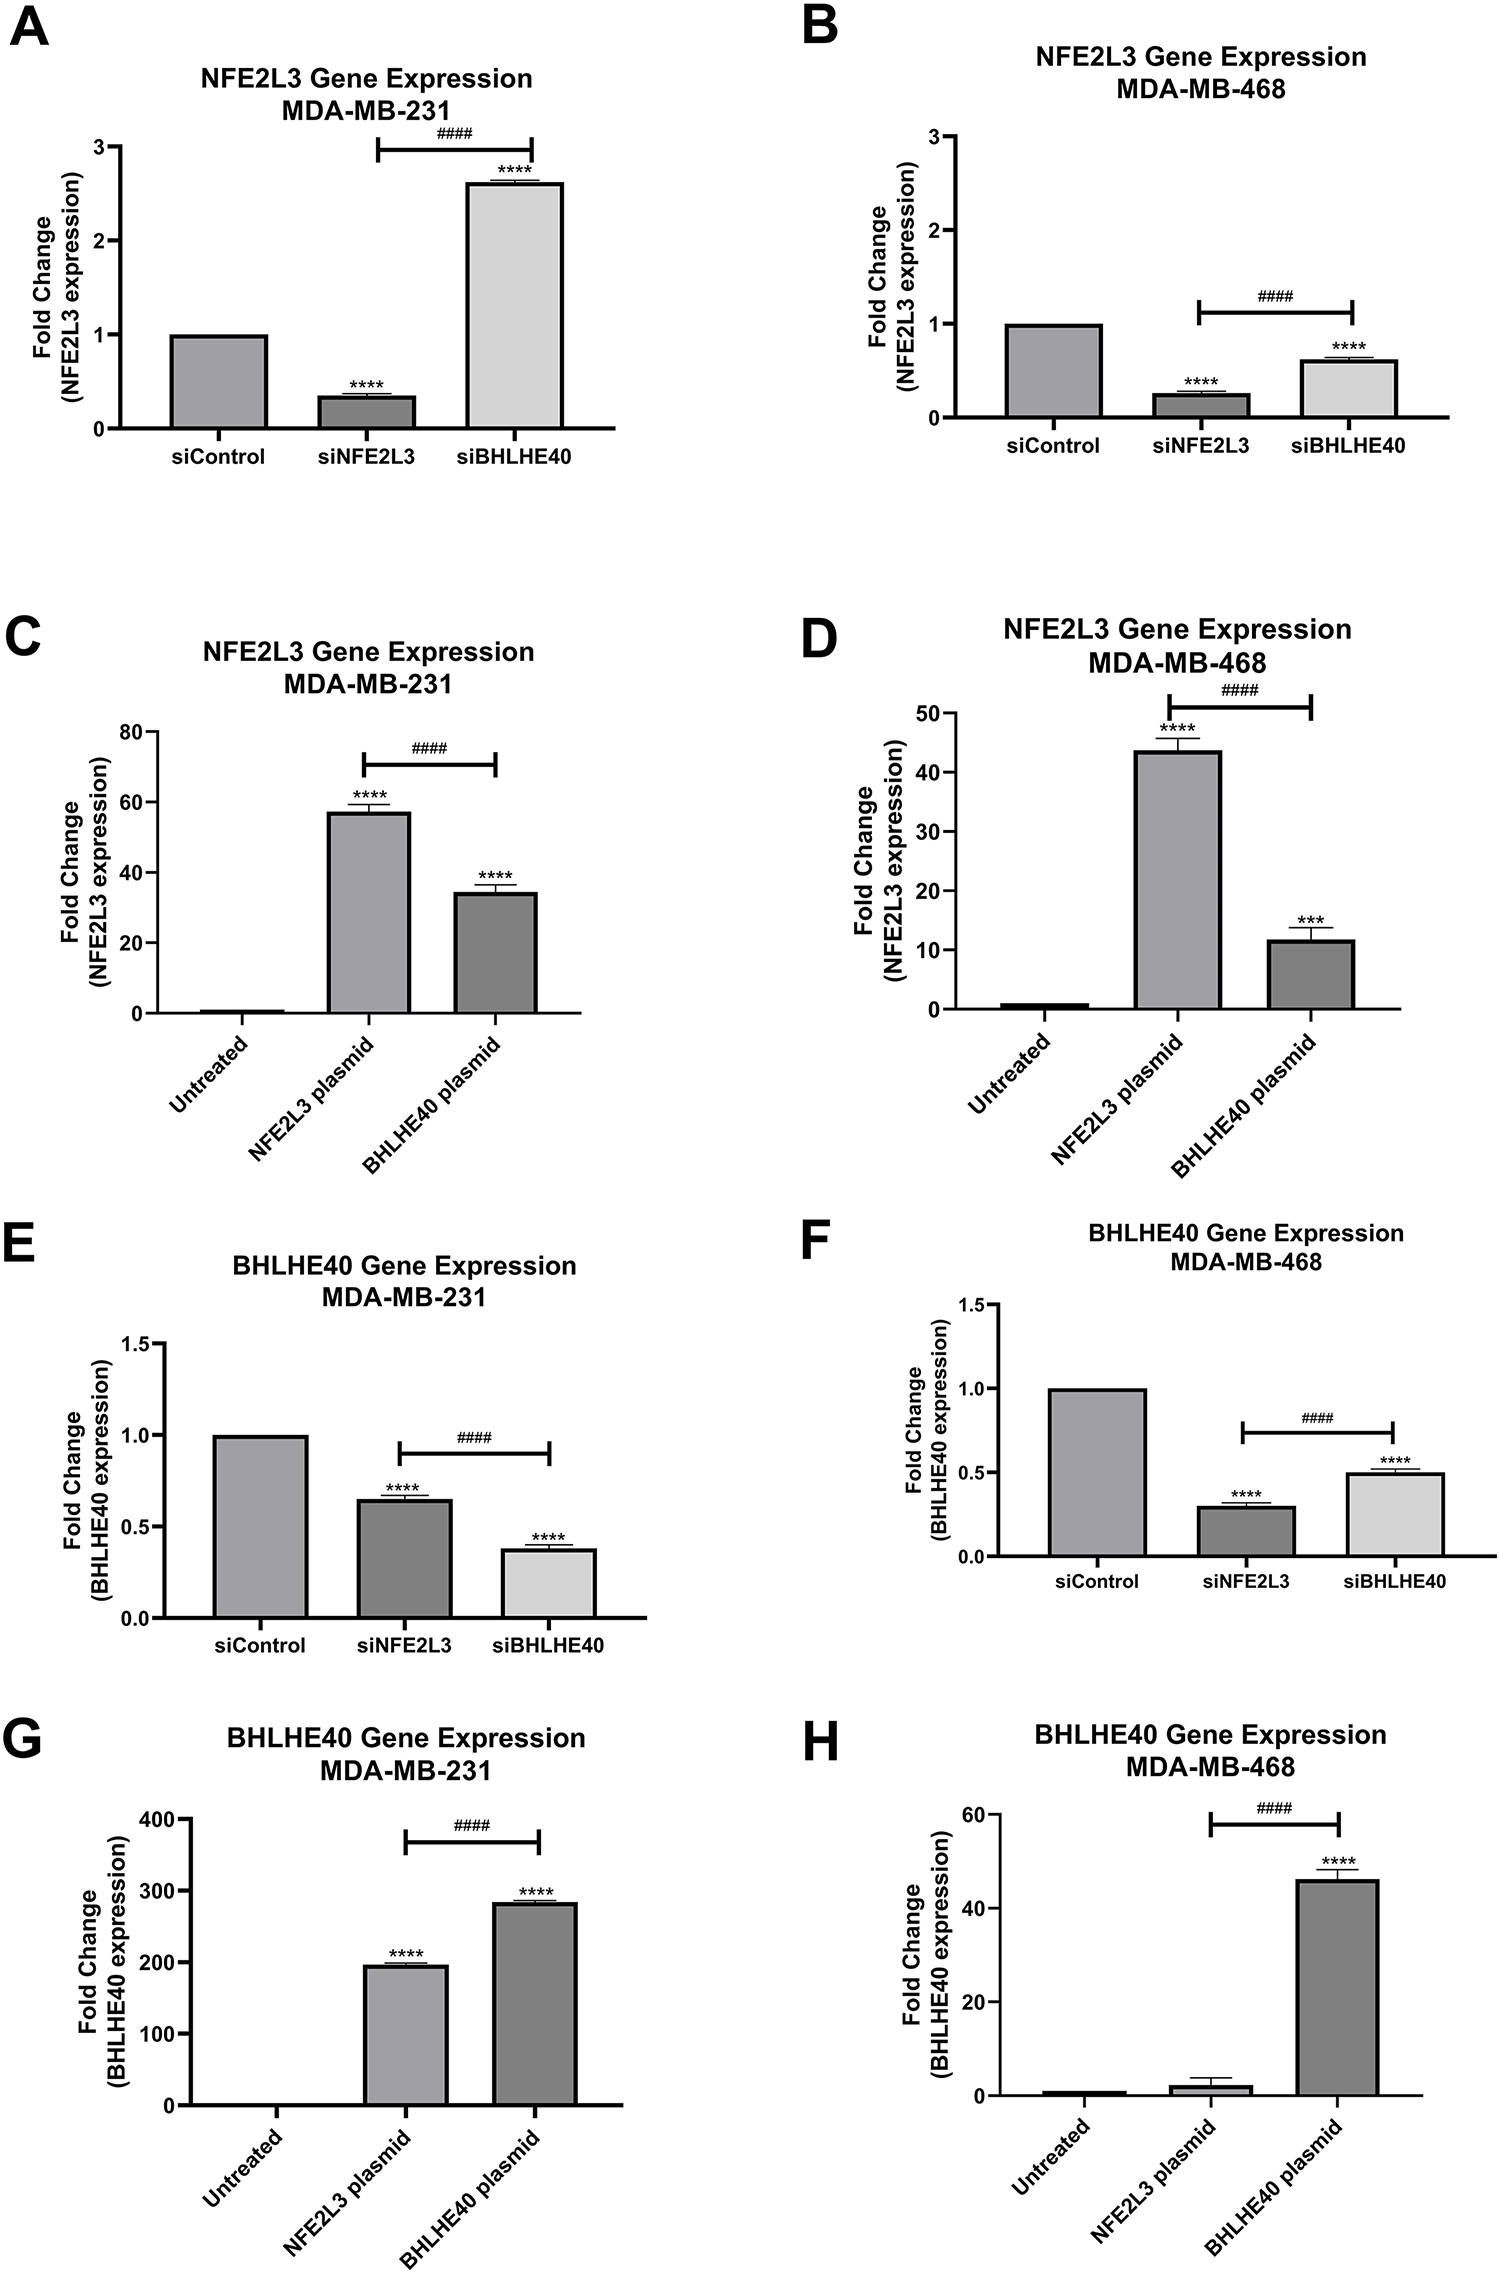
Figure 6: Gene expression quantification using quantitative Reverse Transcriptase polymerase chain reaction (qRT-PCR). NFE2L3 gene expression in (A) MDA-MB-231 and (B) MDA-MB-468 cells in siControl, siNFE2L3, and siBHLHE40 groups. (C,D) Gene expression in (C) MDA-MB-231 and (D) MDA-MB-468 cells in untreated, NFE2L3 plasmid and BHLHE40 plasmid groups. BHLHE40 gene expression using qRT-PCR. BHLHE40 gene expression in (E) MDA-MB-231 and (F) MDA-MB-468 cells following treatment with siControl, siNFE2L3, and siBHLHE40. BHLHE40 gene expression in (G) MDA-MB-231 and (H) MDA-MB-468 cells following treatment with vehicle (untreated), NFE2L3 plasmid, and BHLHE40 plasmid. One-way ANOVA followed by post-hoc Tukey’s test was used. Compared to the siControl or untreated group: ***indicates p < 0.001, and ****indicates p < 0.0001. Compared to siNFE2L3 or NFE2L3 plasmid group: ####indicates p < 0.0001
3.5 NFE2L3 Regulates BHLHE40 Expression at the Translational Level
The basal protein expression of NFE2L3 and BHLHE40 was assessed via Western blotting, with GAPDH serving as a loading control. The normalized NFE2L3 protein levels were 54.72 ± 1.86% and 60.76 ± 0.88% in MDA-MB-231 and MDA-MB-468 cells, respectively. The normalized BHLHE40 protein levels were 57.49 ± 0.69% and 48.70 ± 0.22% in MDA-MB-231 and MDA-MB-468 cells, respectively. The NFE2L3 basal protein levels were observed to be higher in MDA-MB-468 cells compared to MDA-MB-231 cells, whereas BHLHE40 basal protein expression was higher in MDA-MB-231 cells compared to MDA-MB-468 cells (Figures not added).
The protein expression of NFE2L3 and BHLHE40 was determined following siRNA treatment, and the micrographs of the protein blots are presented in Fig. 7A. The protein expression results are representative of only MDA-MB-231 cells, as the results from MDA-MB-468 cells were inconsistent. Treatment with siNFE2L3 resulted in a 50.01 ± 0.56% expression in NFE2L3 protein levels in MDA-MB-231 cells (Fig. 7B). This silencing of NFE2L3 also led to a significant decrease in BHLHE40 protein levels compared to the siControl group, in MDA-MB-231 cells (Fig. 7C). Interestingly, treatment with siBHLHE40 resulted in a significant decrease in NFE2L3 expression in MDA-MB-231 (Fig. 7B).
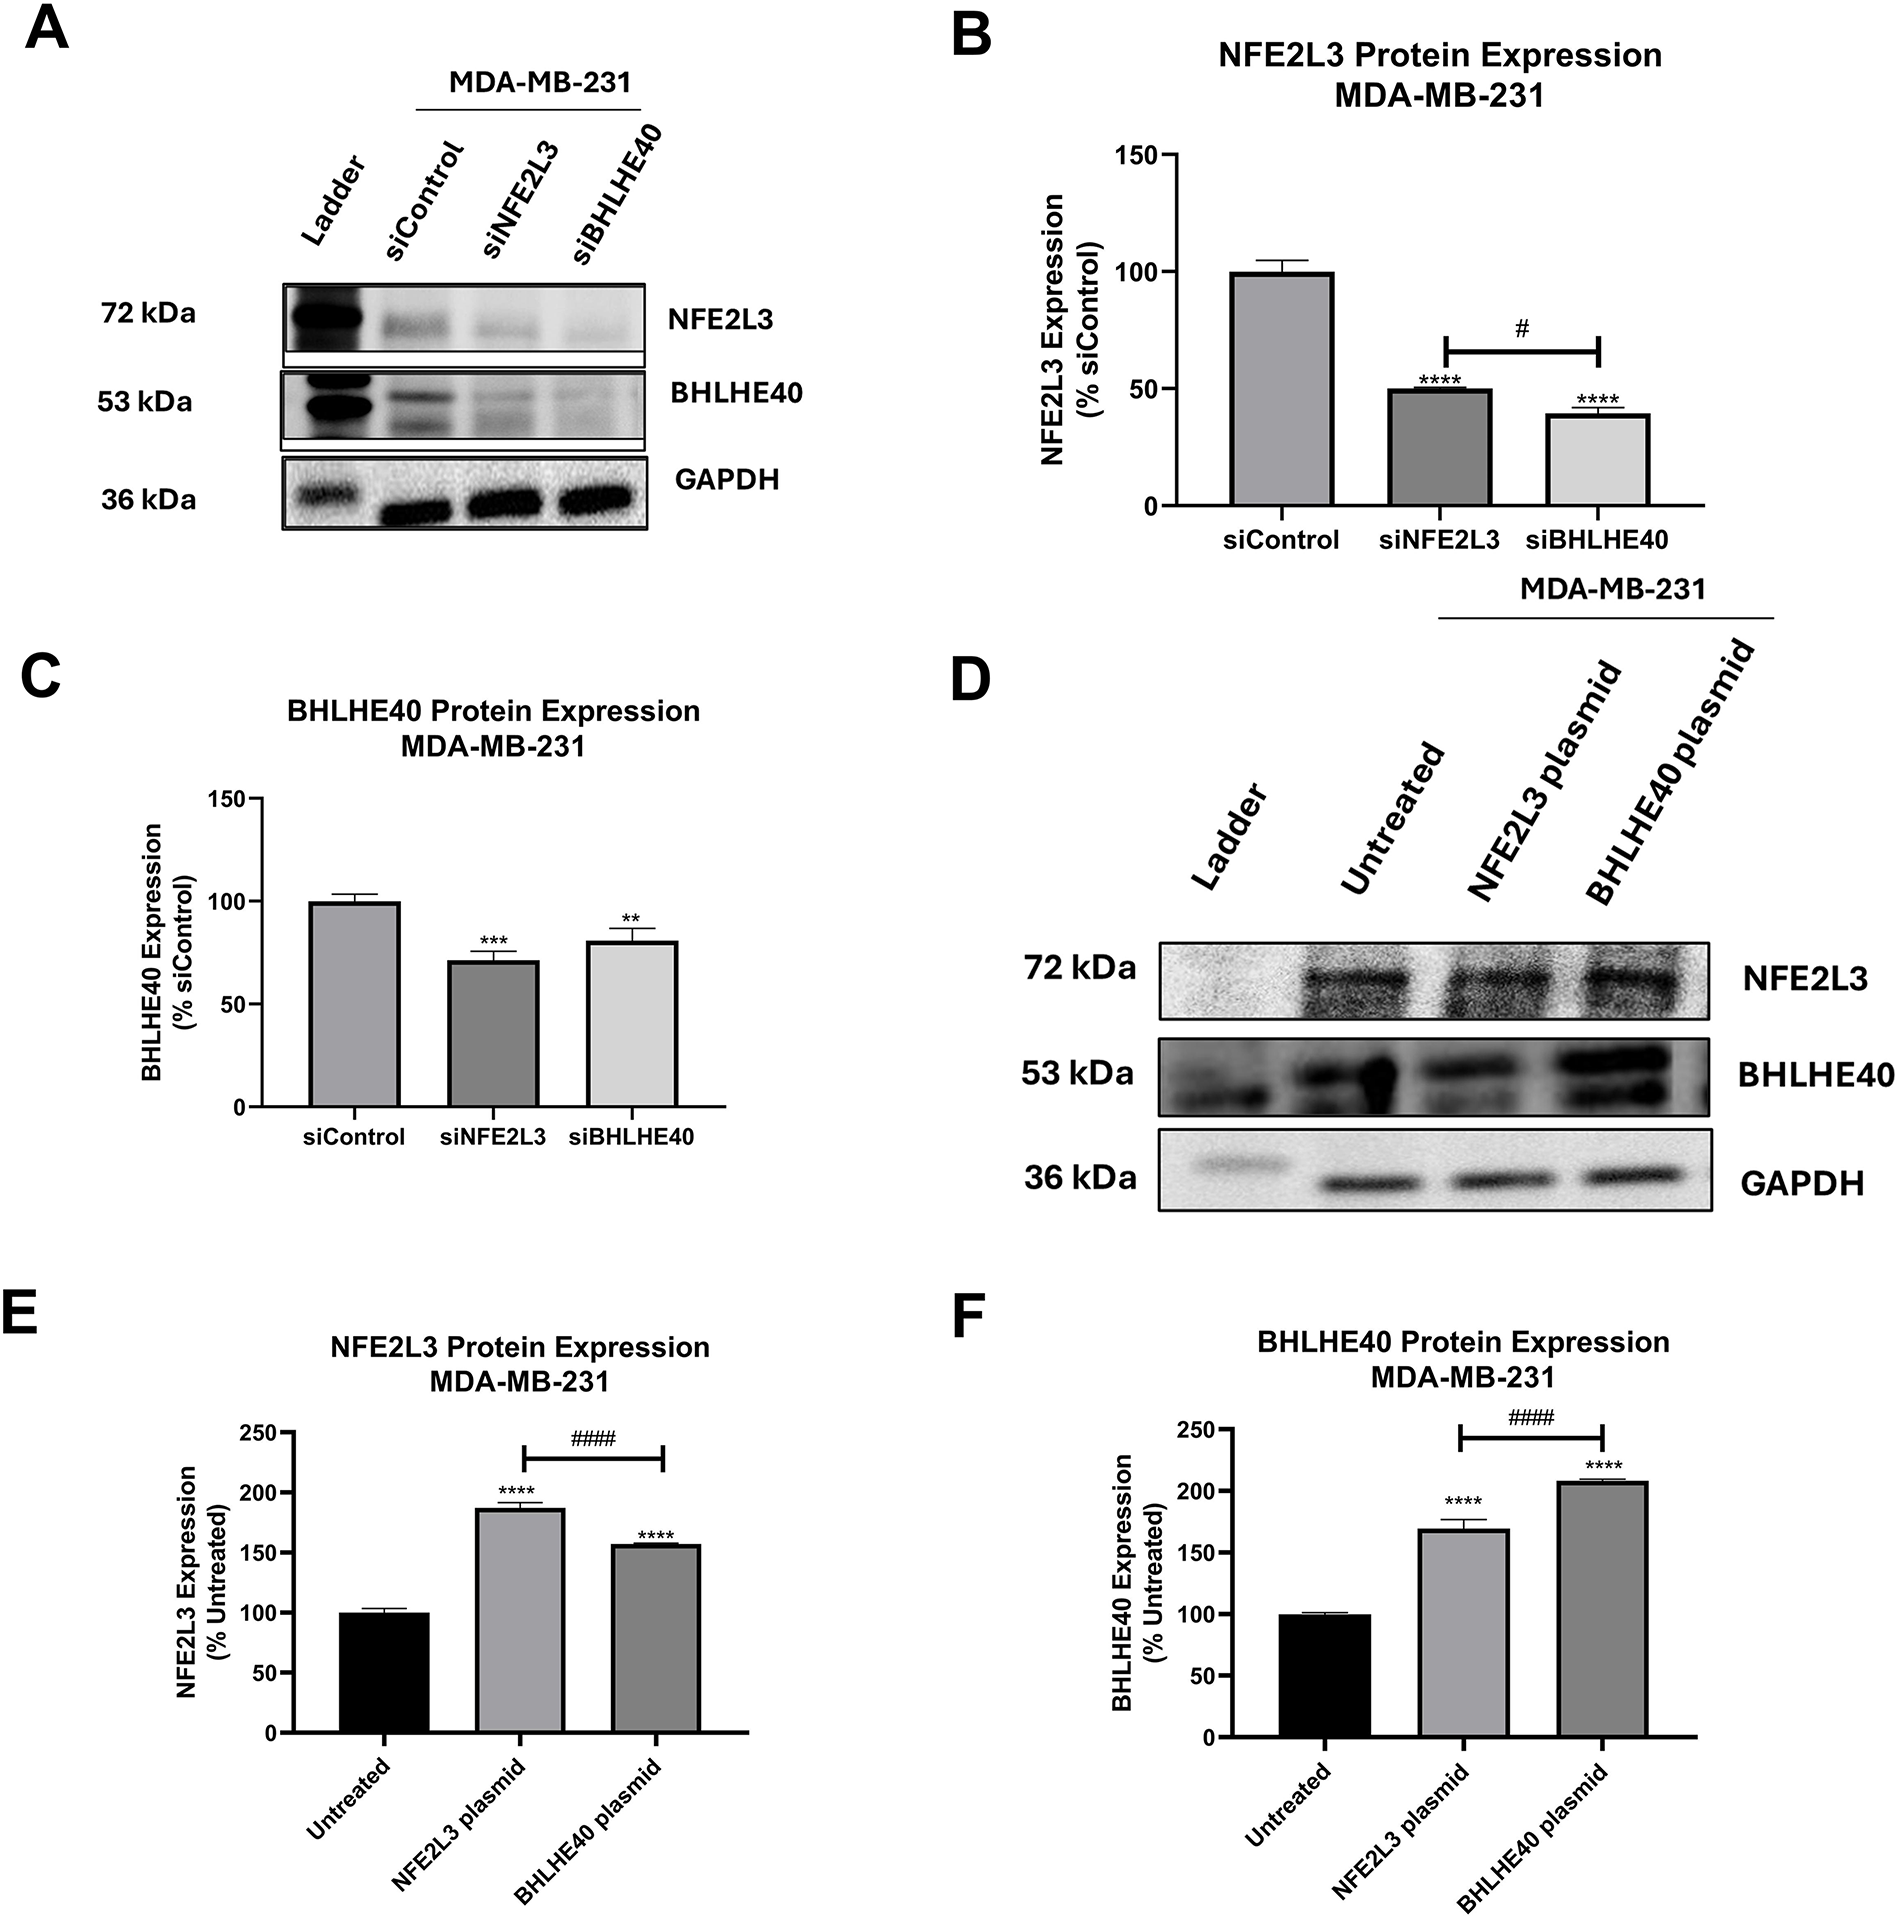
Figure 7: Basal protein expression of NFE2L3 and BHLHE40 NFE2L3 and BHLHE40 in breast cancer cells. (A) Representative blots of NFE2L3 and BHLHE40 protein expression following treatment with siControl, siNFE2L3, and siBHLHE40. GAPDH was used as a loading control. (B) Graphical presentation of NFE2L3 protein expression in MDA-MB-231 cells following treatment as described. (C) Graphical presentation of BHLHE40 protein expression in MDA-MB-231 cells following treatment as described. (D) Representative blots of NFE2L3 and BHLHE40 protein expression following treatment with vehicle (Untreated), NFE2L3 DNA plasmid, and BHLHE40 DNA plasmid. GAPDH was used as a loading control. (E) Graphical presentation of NFE2L3 protein expression in MDA-MB-231 cells following treatment as described. (F) Graphical presentation of BHLHE40 protein expression in MDA-MB-231 cells following treatment as described. One-way ANOVA followed by post-hoc Dunnet’s test was used. Compared to siControl: **indicates p < 0.01, ***indicates p < 0.001, and ****indicates p < 0.0001. Compared to the siNFE2L3 group or NFE2L3 plasmid group: #indicates p < 0.05, and ####indicates p < 0.0001
Additionally, treatment with siBHLHE40 resulted in reduced expression of BHLHE40 protein levels of MDA-MB-231 cells (40.73 ± 1.56%) (Fig. 7C). Notably, both siNFE2L3 and siBHLHE40 treatments significantly reduced BHLHE40 protein expression compared to the siControl group, suggesting an intricate interplay between NFE2L3 and BHLHE40 genes and/or protein.
Transfection with the NFE2L3 plasmid led to a significant increase in the protein levels of both NFE2L3 and BHLHE40 compared to the control group in both cell lines. Representative blots depicting the protein expression of NFE2L3 and BHLHE40 in the NFE2L3 plasmid and BHLHE40 plasmid groups are shown in Fig. 7D. Treatment with the NFE2L3 plasmid resulted in a significant increase in NFE2L3 protein levels in MDA-MB-231 cells (118 ± 1.38%) (Fig. 7E). Similarly, the protein levels of BHLHE40 in NFE2L3-treated cells were significantly increased to 112 ± 1.96% in MDA-MB-231 (Fig. 7F). Moreover, the protein levels of BHLHE40 in BHLHE40-treated cells were also significantly increased in MDA-MB-231 cells (177.12 ± 4.80%). Notably, treatments with the NFE2L3 plasmid resulted in increased BHLHE40 protein expression in MDA-MB-231 cells (Fig. 7F). Overall, induction of NFE2L3 gene expression led to an increase in BHLHE40 mRNA and protein levels, while silencing NFE2L3 gene expression resulted in a decrease in BHLHE40 mRNA and protein levels.
3.6 NFE2L3 Binds to the Promoter Region of BHLHE40 and Has a Physical Protein-Protein Interaction
To evaluate the activation of the BHLHE40 transcriptional activity, a luciferase-based reporter assay was performed in MDA-MB-231 and MDA-MB-468 cells. Cells were transfected with a BHLHE40 DNA plasmid fused with a luciferase reporter gene and compared with co-transfection of the NFE2L3 DNA plasmid (Fig. 8A). Compared to the BHLHE40 plasmid group, transfection with the NFE2L3 plasmid significantly increased luciferase activity by 2.42- and 2.66-fold in MDA-MB-231 and MDA-MB-468 cells, respectively (Fig. 8B,C). These results suggest that the NFE2L3 protein can bind to the promoter region of the BHLHE40 gene to regulate its transcriptional activity. Co-immunoprecipitation analysis revealed that in both cell lines, there was a physical protein-protein interaction between NFE2L3 and BHLHE40. Based on the blots (Fig. 8D,E), we observed a weak interaction in the MDA-MB-468 cells compared to the MDA-MB-231 cells. Also, the negative isotype control did not show any band at the protein level, which indicates that the antibodies used for NFE2L3 and BHLHE40 do not bind to any off-target proteins. The whole cell lysate was added to identify the protein of interest and other bands.
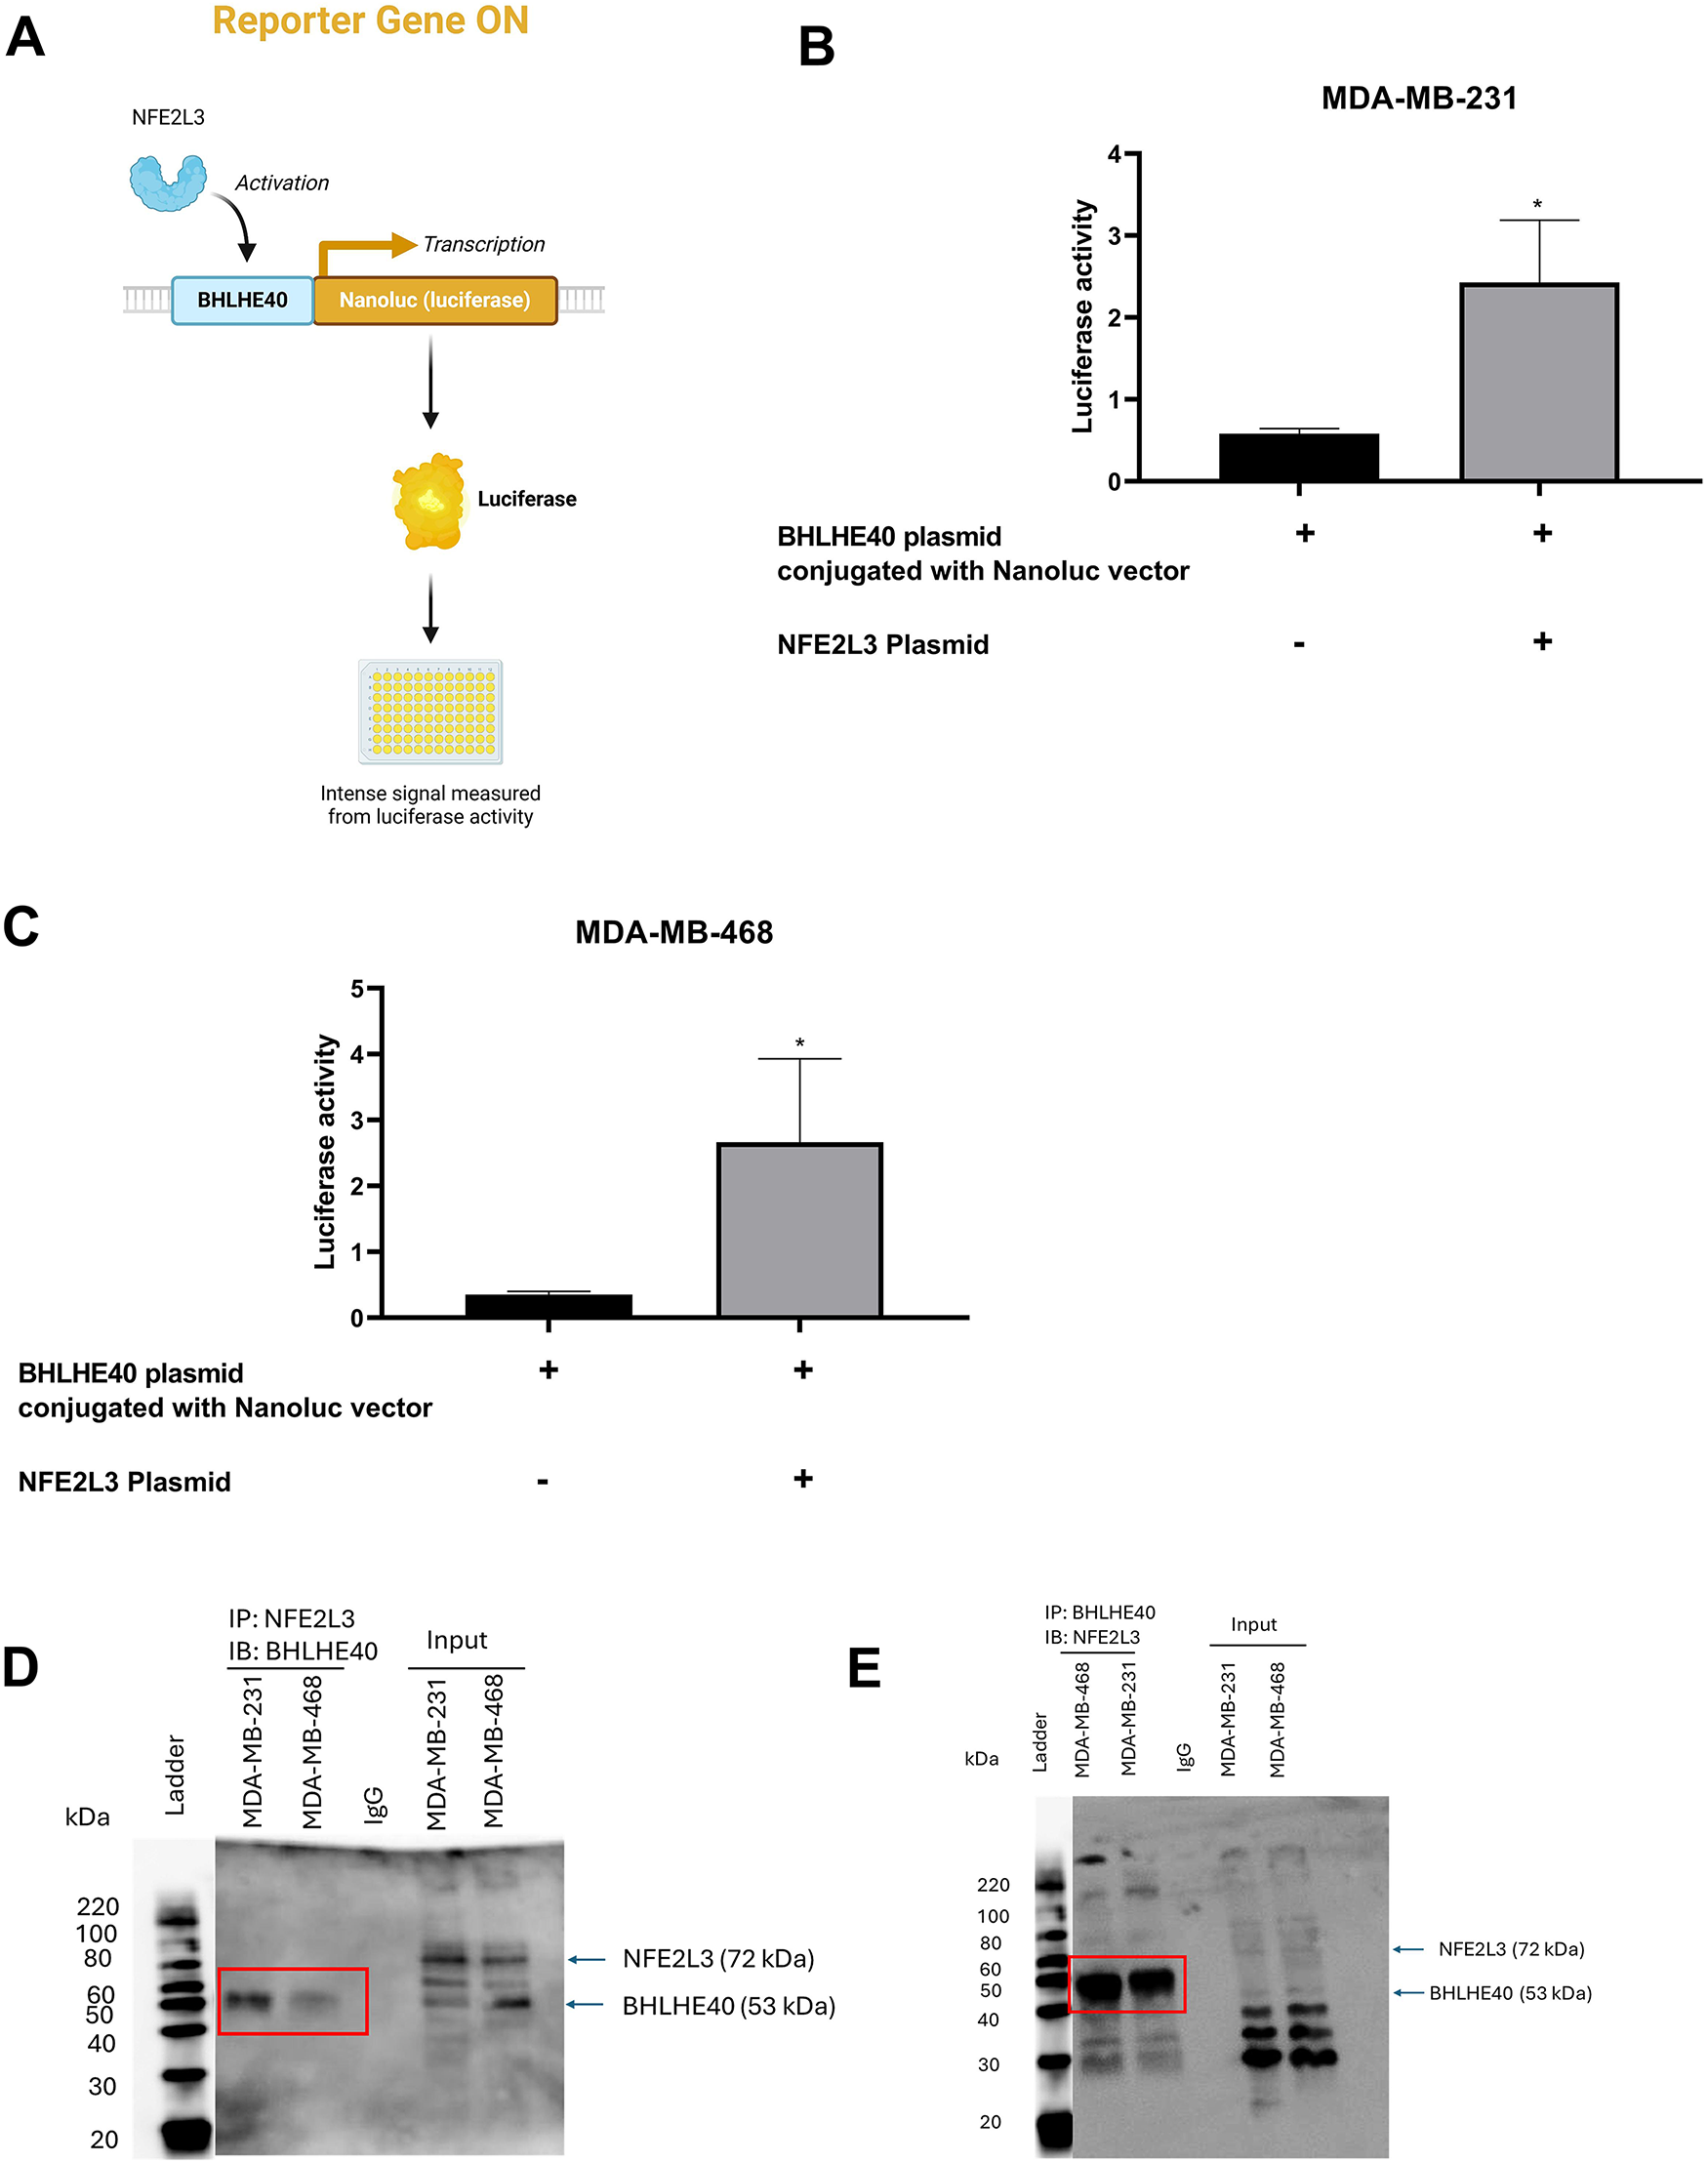
Figure 8: Validation of regulatory relationship between NFE2L3 and BHLHE40. (A) Visual representation of luciferase assay with BHLHE40 conjugated with Nanoluc vector, activated by NFE2L3, resulting in production of luciferase activity. Qualitative analysis of BHLHE40 transcriptional activation by NFE2L3 plasmid compared to BHLHE40 plasmid conjugated with the Nanoluc vector in (B) MDA-MB-31 and (C) MDA-MB-468 cells. Co-immunoprecipitation analysis of NFE2L3 protein and BHLHE40 protein interaction. (D) Co-IP of NFE2L3 pulldown with immunoblotting with BHLHE40. (E) Co-IP of BHLHE40 pulldown with immunoblotting with NFE2L3. Red boxes indicate the interacting bands. Student’s t-test was used to compare the two groups, *indicates p < 0.05
3.7 BHLHE40 in the Absence of NFE2L3 Results in a Decrease in Cell Proliferation and Cell Migration
In MDA-MB-231 cells, the effects of NFE2L3 and BHLHE40 overexpression on cell proliferation were investigated (Fig. 9A,B). Treatment with siNFE2L3 followed by NFE2L3 DNA plasmid administration resulted in significantly increased cell proliferation at 24 h (194 ± 1.83%), followed by a decrease at 48 h (137.99 ± 14.3%), and a significant reduction at 72 h (72.61 ± 6.71%), compared to the control and siNFE2L3 groups (Fig. 9A). Similar trends were observed when the NFE2L3 plasmid was introduced into the siBHLHE40 group. Increases in cell proliferation were observed at 24 h (104.38 ± 4.74%), followed by decreases at 48 h (80.38 ± 12.2%) and significant reductions at 72 h (45.33 ± 0.2%) compared to the control and siBHLHE40 groups (Fig. 9A). Treatment with the BHLHE40 DNA plasmid in cells pre-treated with siNFE2L3 significantly decreased the cell proliferation rate at all time points, compared to the control and siNFE2L3 groups. At 24 h, the cell proliferation was 61.36 ± 4.24% followed by a decrease at 48 h to 43.70 ± 5.199%, and 21.78 ± 0.11% at 72 h (Fig. 9B). Similarly, while the addition of the BHLHE40 plasmid to cells pretreated with siBHLHE40 resulted in an increase in cell proliferation at 24 h followed by a decrease at 48 h, and a significant decrease at 72 h of 51.41 ± 5.08%, compared to control and siBHLHE40 groups (Fig. 9B).
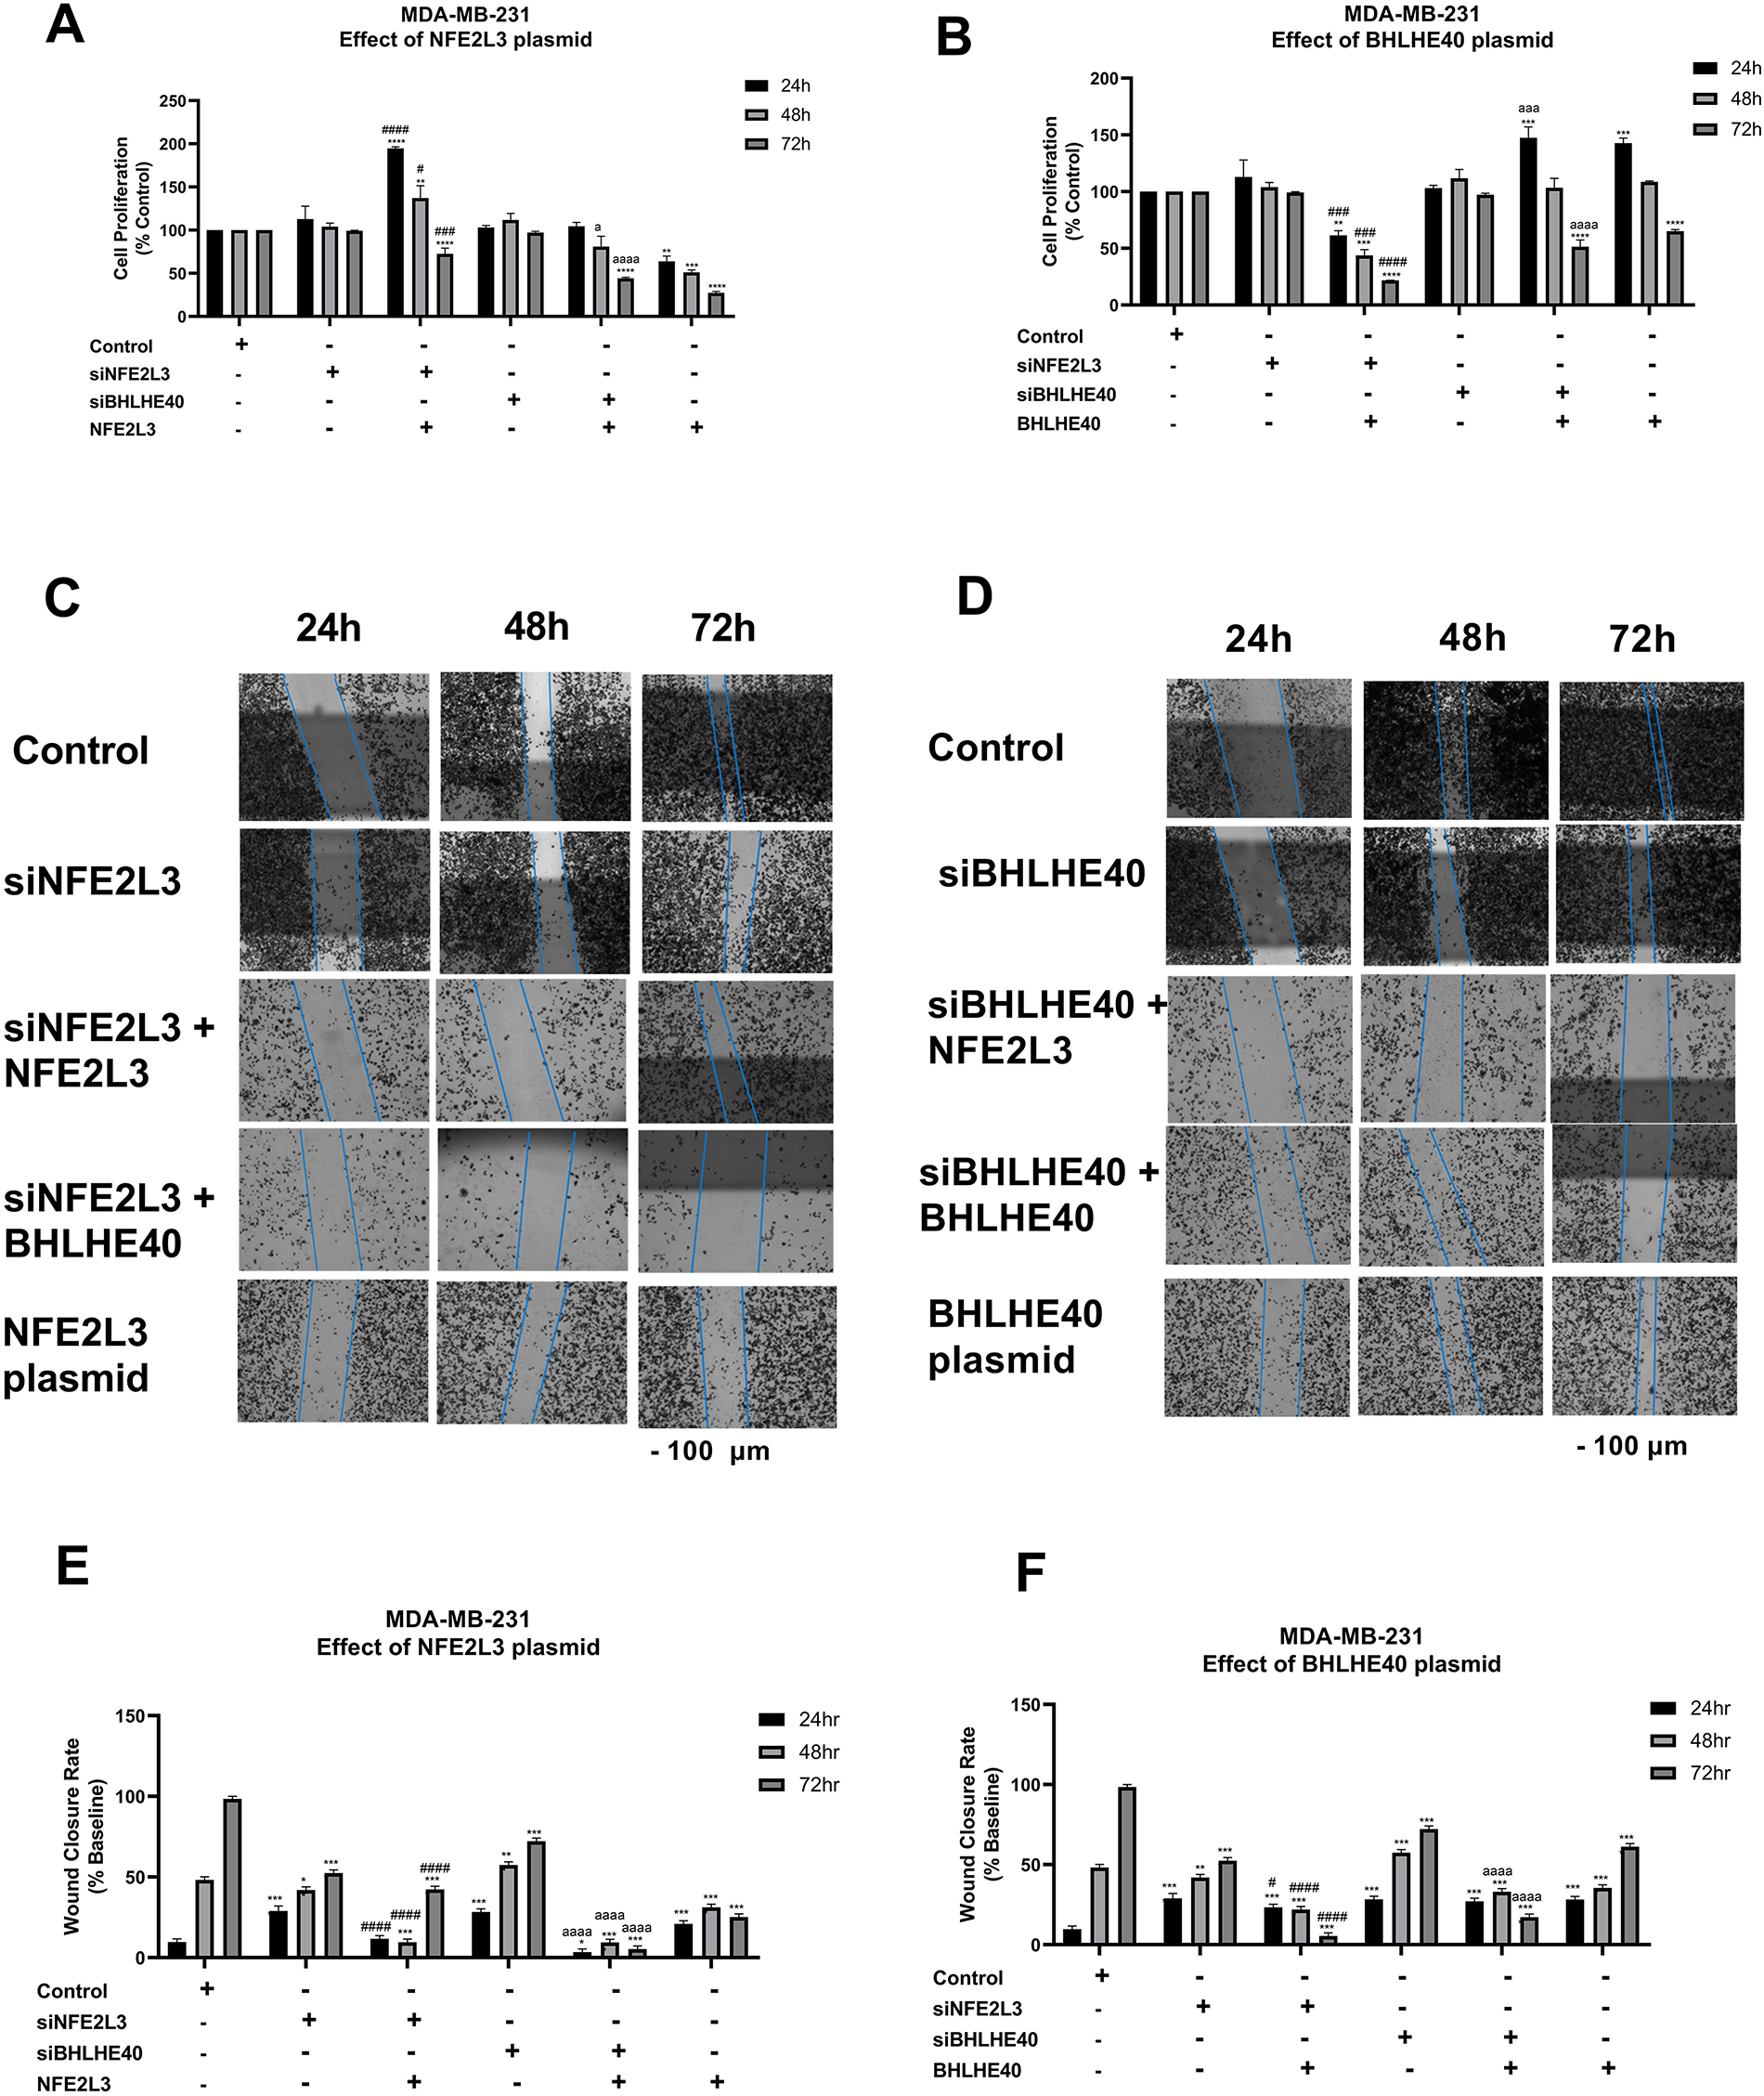
Figure 9: Phenotypic studies on MDA-MB-231 cells. Effect of knockdown or induction of NFE2L3 and BHLHE40 gene expression on MDA-MB-231 cell proliferation. MDA-MB-231 cells’ proliferation was determined following treatment with vehicle (Control), siNFE2L3, siBHLHE40, as well as (A) NFE2L3 DNA plasmid, or (B) BHLHE40 DNA plasmid for 24, 48, and 72 h. Effect of knockdown or induction of NFE2L3 and BHLHE40 gene expression on MDA-MB-231 cell migration. MDA-MB-231 cell migration was determined following treatment with vehicle (Control), siNFE2L3, siBHLHE40, as well as (C) NFE2L3 DNA plasmid, or (D) BHLHE40 DNA plasmid for 24, 48, and 72 h. (Scale—100 μm) (E,F) Graphical presentation of the estimation of wound closure area following treatment as described above. One-way ANOVA followed by post-hoc Tukey’s test was used. Compared to untreated: *indicates p < 0.05, **indicates p < 0.01, ***indicates p < 0.001, and ****indicates p < 0.0001. Compared to siNFE2L3: #indicates p < 0.05, ###indicates p < 0.001, and ####indicates p < 0.0001. Compared to siBHLHE40, aindicates p < 0.05, aaaindicates p < 0.001, and aaaaindicates p < 0.0001
In MDA-MB-231 cells, the effects of NFE2L3 and BHLHE40 overexpression on cell migration were investigated (Fig. 9C,D). Brightfield images of the wound closure are represented in Fig. 9C,D. Treatment with siNFE2L3 followed by NFE2L3 DNA plasmid administration resulted in significantly decreased cell migration at 24 h (11.65 ± 1.8%), followed by a gradual decrease at 48 h (9.57 ± 1.4%), and a significant decrease at 72 h (42.3 ± 1.6%), compared to the siNFE2L3 groups (Fig. 9E). Similar trends were observed when the NFE2L3 plasmid was introduced into the siBHLHE40 group. A decrease in cell migration was observed at 24 h (1.42 ± 1.6%), followed by decreases at 48 h (9.44 ± 1.2%) and significant reductions at 72 h (5.33 ± 1.7%) compared to the siBHLHE40 groups (Fig. 9E).
The treatment of the BHLHE40 DNA plasmid in cells pre-treated with siNFE2L3 significantly decreased the cell proliferation rate at all time points, compared to the siNFE2L3 group. At 24 h, the cell migration was 23.3 ± 1.7% followed by a decrease at 48 h to 21.85 ± 1.99%, and 3.85 ± 1.6% at 72 h (Fig. 9F). Similarly, while the addition of the BHLHE40 plasmid to cells pretreated with siBHLHE40 did not result in an increase in cell migration at 24 and 48 h, at 72 h, there was a significant decrease of 19.21 ± 1.6%, compared to control and siBHLHE40 groups (Fig. 9F).
The aggressive nature of triple-negative breast cancer (TNBC) and the limited availability of targeted treatment options underscore the complexity of breast cancer pathophysiology, highlighting the need for further research and attention. To address these limitations, the study used a 2016 pan-cancer TCGA RNA-seq breast cancer dataset [36,37] to understand the biology of TNBC by identifying those regulatory relationships that play an important role in the development of TNBC. The TCGA dataset is a comprehensive study including multi-omics data across various tumor types, which is ideal to study molecular pathways and mechanisms in cancer. The study identified genes with differential expression in the TNBC and TPBC groups. Most of the DEGs were enriched in cell cycle processes across four robust databases, implying a strong connection with cancer cell survival, proliferation, and migration [38]. Additionally, products of these DEGs participate in pathways related to cancer, such as WNT signaling, NK/NF-ĸB signaling, and p53 signaling. These canonical pathways are well-discussed in their roles in cancer biology [39].
TRNs are hierarchies of relationships between transcription factors (proteins) and their target genes [40,41]. These regulatory networks were reverse-engineered from gene expression compendia with the use of three algorithms: ARACNe, GENIE3, and the Inferelator. ARACNe-generated master regulators via VIPER have been validated in different studies [15,20]. A recent study used the TCGA dataset along with ARACNe and VIPER, identifying master regulators associated with tumor invasiveness [42]. However, the use of GENIE3 and Inferelator-generated master regulators via VIPER is a novel part of this study. The intersection of the common genes led to the identification of six novel master regulators, HMGA1, AFF3, XBP1, PBX1, FOXA1, and AR, with the addition of their target genes. The individual role of these genes with respect to breast cancer has been discussed in the literature [43–48]. The target gene list that we obtained was validated with target genes present in JASPAR PWM, ENCODE, and ChEA, identifying many novel targets that require validation.
NFE2L3, a master regulator identified using the ARACNe-based network, was studied in triple-negative breast cancer. NFE2L3 is overexpressed in breast cancer, and its role is not completely understood [49]. The role of NFE2L3 in breast cancer is ambiguous and is reportedly both a tumor promoter [50] and a tumor suppressor [51]. Based on the regulatory networks of NFE2L3 within different algorithms, we identified nine common targets of NFE2L3, out of which we decided to explore the NFE2L3/BHLHE40 axis in breast cancer. We posited that targeting of BHLHE40—a pro-metastasis factor in breast cancer—could be affected via targeting NFE2L3 at the upstream of the axis, with resultant regulation of the former and its downstream gene targets. Several recent studies have utilized VIPER in reconstructing transcriptional hierarchies, identifying master regulators such as MYC, STAT3, and FOXM1 as key oncogenic drivers in TNBC [52]. In the broader context of breast cancer transcription regulation, our findings on NFE2L3 and BHLHE40 fit into an emerging paradigm of hierarchical master regulators’ control over tumor state transitions. Identification of NFE2L3 as a potential upstream regulator of BHLHE40 suggests that this axis may constitute part of an unrecognized transcriptional hierarchy in TNBC.
The transfection studies, including knockdown and overexpression of NFE2L3 and BHLHE40 in TNBC cells, supported an interplay between NFE2L3 and BHLHE40 at transcription and translation levels. Generally, induction of NFE2L3 increased the levels of BHLHE40, whereas knockdown of NFE2L3 decreased the expression of BHLHE40 in MDA-MB-231 cells. Dual-luciferase assay and co-immunoprecipitation assay validate the regulatory relationship of NFE2L3 and BHLHE40. The Co-IP shows physical interaction between NFE2L3 and BHLHE40. The results in Fig. 8D,E appear to show an absence of NFE2L3 (IP) and BHLHE40 (IP), following blotting for BHLHE40 and NFE2L3, respectively. A logical explanation for this has to do with the fact that pulling down of the composite proteins may result in a relatively heavier protein complex, depending on the molecular weights of the associated proteins and their relative abundance, and in some cases, resulting in protein bands occurring between the molecular band regions of the associated proteins. It follows that the bands for NFE2L3 and BHLHE40 in Fig. 8D,E, respectively, were not detectable separately because they exist as composites with the other protein and were consequently detected between band regions of the two proteins [53]. While the scope of Co-IP was not extended to characterize the nature of PPI (stable vs. transient, weak vs. strong), the existence of such an interaction between the two proteins points to a possible collaboration in a biological function.
Lastly, the effect of these genes on cell proliferation and cell migration, which are important hallmarks of cancer, was observed using phenotypic assays. While neither knockdown of NFE2L3 nor BHLHE40 was observed to affect MDA-MB-231 cell proliferation over 72 h, knockdown of NFE2L3 followed by induction of BHLHE40 as well as knockdown of BHLHE40 with induction of NFE2L3, were associated with significant decreases in cell proliferation. Interestingly and quite paradoxically, knockdown of BHLHE40—a tumor promoter—followed by its rescue, as well as knockdown of NFE2L3—a tumor suppressor—followed by its rescue, were associated with significant increases in cell proliferation within 24 h and a return to basal levels at 48 h, followed by decreased proliferation at 72 h. And while the tumor suppressor effect of NFE2L3 was observed following its induction after knockdown of BHLHE40 with decreased cell proliferation across all time points, the tumor promoter effect of BHLHE40 was absent following its induction and after knockdown of NFE2L3. While these observations seemed stochastic and paradoxical, it became logical when interpreted through the dependency of BHLHE40 on the transcriptional regulatory influence of NFE2L3 and a possible feedback relationship between them. Notably, whereas the induction of BHLHE40 did not promote cell proliferation over the long term and actually resulted in decreased cell proliferation, induction of NFE2L3 with or without knockdown of either NFE2L3 or BHLHE40 was associated with decreased cell proliferation. Notably, knockdown of NFE2L3 followed by induction of BHLHE40 resulted in decreased cell proliferation, potentially supporting a positive feedback loop mechanism. The cell proliferation dynamics were consistent with those observed with cell migration, where induction of NFE2L3 with or without BHLHE40 knockdown was associated with decreased migratory potential, and more so in the BHLHE40 knockdown group, but also observed with knockdown of NFE2L3 followed by induction of BHLHE40. Altogether, the results provide compelling evidence demonstrating NFE2L3 and BHLHE40 to be engaged in co-regulating the TNBC cancer phenotype. While the exact mechanism of co-regulation of cell proliferation and migration is not yet fully elucidated, results from the luciferase assay, which confirmed NFE2L3 to be a transcriptional regulator of BHLHE40, coupled with the likelihood of a feedback loop mechanism, may explain this interplay. BHLHE40 has been linked to the PI3K/AKT pathway and upregulates AKT phosphorylation and promotes oncogenesis. Further studies focused on interrogating the role of NFE2L3 on a hypothetical BHLHE40/PI3K/AKT axis and its downstream targets could open avenues for exploring the clinical relevance of these biologic molecules.
As previously mentioned, past studies demonstrated the conflicting function of NFE2L3 as both a tumor suppressor and promoter and thus, necessitating additional investigation of NFE2L3 across a broader range of cell lines and tissues [50,51]. Currently, there are no approved therapies in the market or in clinical trials targeting NFE2L3 or BHLHE40. Direct inhibition of these targets is only possible due to the use of siRNA, shRNA, and CRISPR. Studies have reported that GSK3 (glycogen synthase kinase 3) phosphorylates NFE2L3; therefore, GSK3 inhibitors such as lithium chloride might affect NFE2L3 expression, which needs to be experimentally investigated [54]. A number of different biological pathways and molecules such as NF-ĸB, WNT/β-catennin pathway, and CDK1 associated with NFE2L3 have been reported across different cancers, [55–57]. Similarly, BHLHE40 interacts with numerous proteins, such as CLOCK-BMAL1, HDAC1/2, SREBF1, and regulates the function of tumor-infiltrating lymphocytes (TILs) and immune checkpoints such as PD1 and CTLA-4 [34,58]. A recent study reported that fatostatin, an SREBF1 inhibitor, suppressed the growth of pancreatic cells with high expression of BHLHE40 via ferroptosis [59]. Indirect inhibition of NFE2L3 and BHLHE40 via these connected pathways or targets is an interesting approach that requires further investigation. Importantly, successfully delineating and exploiting the tumor suppressor effect of NFE2L3 and its direct regulatory influence on BHLHE40 could provide a novel approach to abrogating the tumor-promoting effect of BHLHE40 as a therapeutic strategy against TNBC.
A limitation of this study is using a single dataset; predictions may not be generalizable to other datasets. Using these models, which mainly capture transcriptional regulation, often skips post-transcriptional modifications that influence these genes. Additionally, a single siRNA was used to knock down the expression of these genes. Typically, multiple siRNAs are employed to minimize potential off-target effects. Unfortunately, authors were constrained in using more than a single siRNA due to limited success in obtaining and custom-designing plasmids. Additionally, successive Western blot analysis MDA-MB-468 cells following knockdown and induction of NFE2L3 and BHLHE40 yielded inconsistent results making it challenging to drawn conclusive inferences for this cell line. The results presented in Fig. 7, therefore, represented replicable data for MDA-MB-231 cells only. Authors recognize the reliance on one cell line as a potential limitation to the study. However, authors are confident that the conclusive results obtained from gene-reporter and co-immunoprecipitation studies in MDA-MB-468 cells add rigor and validate the study a high degree. Our findings are based on computational approaches and in vitro analysis. Further validation using animal models such as TNBC xenografts or patient-derived models would be essential to establish the physiological and therapeutic significance of this NFE2L3/BHLHE40 axis.
In conclusion, the current study provides important insights into breast cancer biology by identifying novel master regulators and their target genes. Additionally, the NFE2L3/BHLHE40 axis represents a novel pathway in breast cancer development and may potentially hold promise as a therapeutic option.
Acknowledgement: As indicated under “Methods” above, the findings of this study are based in whole or in part upon data generated by the TCGA Research Network: http://cancergenome.nih.gov/. This work has been supported by the resources of Massachusetts College of Pharmacy & Health Sciences (MCPHS University).
Funding Statement: The authors received no specific funding for this study.
Author Contributions: Shail Rakesh Modi was responsible for investigating, conducting the research, writing the original draft, and reviewing the final manuscript. Terrick Andey and George Acquaah-Mensah conceptualized, supervised, validated the research, and reviewed and edited the final manuscript. All authors reviewed the results and approved the final version of the manuscript.
Availability of Data and Materials: Data will be available on request.
Ethics Approval: The study did not use any animals or human samples.
Conflicts of Interest: The authors declare no conflicts of interest to report regarding the present study. The authors also declare that the article is original research work that has not been submitted anywhere else.
References
1. Sonkin D, Thomas A, Teicher BA. Cancer treatments: past, present, and future. Cancer Genet. 2024;286–287:18–24. doi:10.1016/j.cancergen.2024.06.002. [Google Scholar] [PubMed] [CrossRef]
2. Bray F, Laversanne M, Sung H, Ferlay J, Siegel RL, Soerjomataram I, et al. Global cancer statistics 2022: GLOBOCAN estimates of incidence and mortality worldwide for 36 cancers in 185 countries. CA Cancer J Clin. 2024;74(3):229–63. doi:10.3322/caac.21834. [Google Scholar] [PubMed] [CrossRef]
3. Siegel RL, Giaquinto AN, Jemal A. Cancer statistics, 2024. CA Cancer J Clin. 2024;74(1):12–49. doi:10.3322/caac.21820. [Google Scholar] [PubMed] [CrossRef]
4. Zagami P, Carey LA. Triple negative breast cancer: pitfalls and progress. npj Breast Cancer. 2022;8(1):95. doi:10.1038/s41523-022-00468-0. [Google Scholar] [PubMed] [CrossRef]
5. Modi SR, Andey T, Acquaah-Mensah G. The role of master regulators such as HMGA1, SOX9, FOXA1 in the development of triple-negative breast cancer. FASEB J. 2022;36(S1). doi:10.1096/fasebj.2022.36.s1.r2616. [Google Scholar] [CrossRef]
6. Anders C, Carey LA. Understanding and treating triple-negative breast cancer. Oncology. 2008;22(11):1233–43. [Google Scholar] [PubMed]
7. Nedeljković M, Damjanović A. Mechanisms of chemotherapy resistance in triple-negative breast cancer-how we can rise to the challenge. Cells. 2019;8(9):957. doi:10.3390/cells8090957. [Google Scholar] [PubMed] [CrossRef]
8. Obidiro O, Battogtokh G, Akala EO. Triple negative breast cancer treatment options and limitations: future outlook. Pharmaceutics. 2023;15(7):1796. doi:10.3390/pharmaceutics15071796. [Google Scholar] [PubMed] [CrossRef]
9. Jamdade VS, Sethi N, Mundhe NA, Kumar P, Lahkar M, Sinha N. Therapeutic targets of triple-negative breast cancer: a review. Br J Pharmacol. 2015;172(17):4228–37. doi:10.1111/bph.13211. [Google Scholar] [PubMed] [CrossRef]
10. Pal S, Mondal S, Das G, Khatua S, Ghosh Z. Big data in biology: the hope and present-day challenges in it. Gene Rep. 2020;21:100869. doi:10.1016/j.genrep.2020.100869. [Google Scholar] [CrossRef]
11. Ahmed F, Samantasinghar A, Soomro AM, Kim S, Choi KH. A systematic review of computational approaches to understand cancer biology for informed drug repurposing. J Biomed Inform. 2023;142:104373. doi:10.1016/j.jbi.2023.104373. [Google Scholar] [PubMed] [CrossRef]
12. Lachmann A, Giorgi FM, Lopez G, Califano A. ARACNe-AP gene network reverse engineering through adaptive partitioning inference of mutual information. Bioinformatics. 2016;32(14):2233–5. doi:10.1093/bioinformatics/btw216. [Google Scholar] [PubMed] [CrossRef]
13. Huynh-Thu VA, Irrthum A, Wehenkel L, Geurts P. Inferring regulatory networks from expression data using tree-based methods. PLoS One. 2010;5(9):e12776. doi:10.1371/journal.pone.0012776. [Google Scholar] [PubMed] [CrossRef]
14. Bonneau R, Reiss DJ, Shannon P, Facciotti M, Hood L, Baliga NS, et al. The inferelator: an algorithm for learning parsimonious regulatory networks from systems-biology data sets de novo. Genome Biol. 2006;7(5):R36. doi:10.1186/gb-2006-7-5-r36. [Google Scholar] [PubMed] [CrossRef]
15. Alvarez MJ, Shen Y, Giorgi FM, Lachmann A, Ding BB, Ye BH, et al. Functional characterization of somatic mutations in cancer using network-based inference of protein activity. Nat Genet. 2016;48(8):838–47. doi:10.1038/ng.3593. [Google Scholar] [PubMed] [CrossRef]
16. Chan SS, Kyba M. What is a master regulator? J Stem Cell Res Ther. 2013;3:114. doi:10.4172/2157-7633.1000e114. [Google Scholar] [PubMed] [CrossRef]
17. Bozdag S, Li A, Baysan M, Fine HA. Master regulators, regulatory networks, and pathways of glioblastoma subtypes. Cancer Inform. 2014;13(Suppl 3):33–44. doi:10.4137/CIN.S14027. [Google Scholar] [PubMed] [CrossRef]
18. Schubert M, Klinger B, Klünemann M, Sieber A, Uhlitz F, Sauer S, et al. Perturbation-response genes reveal signaling footprints in cancer gene expression. Nat Commun. 2018;9(1):20. doi:10.1038/s41467-017-02391-6. [Google Scholar] [PubMed] [CrossRef]
19. Choi SR, Hwang CY, Lee J, Cho KH. Network analysis identifies regulators of basal-like breast cancer reprogramming and endocrine therapy vulnerability. Cancer Res. 2022;82(2):320–33. doi:10.1158/0008-5472.CAN-21-0621. [Google Scholar] [PubMed] [CrossRef]
20. Andey T, Attah MM, Akwaaba-Reynolds NA, Cheema S, Parvin-Nejad S, Acquaah-Mensah GK. Enhanced immortalization, HUWE1 mutations and other biological drivers of breast invasive carcinoma in Black/African American patients. Gene X. 2020;5:100030. doi:10.1016/j.gene.2020.100030. [Google Scholar] [CrossRef]
21. Chevillard G, Blank V. NFE2L3 (NRF3the Cinderella of the Cap‘n’Collar transcription factors. Cell Mol Life Sci. 2011;68(20):3337–48. doi:10.1007/s00018-011-0747-x. [Google Scholar] [PubMed] [CrossRef]
22. Reynolds SM, Miller M, Lee P, Leinonen K, Paquette SM, Rodebaugh Z, et al. The ISB cancer genomics cloud: a flexible cloud-based platform for cancer genomics research. Cancer Res. 2017;77(21):e7–10. doi:10.1158/0008-5472.CAN-17-0617. [Google Scholar] [PubMed] [CrossRef]
23. Harris MA, Clark J, Ireland A, Lomax J, Ashburner M, Foulger R, et al. The Gene Ontology (GO) database and informatics resource. Nucleic Acids Res. 2004;32(suppl 1):D258–61. doi:10.1093/nar/gkh036. [Google Scholar] [PubMed] [CrossRef]
24. Love MI, Huber W, Anders S. Moderated estimation of fold change and dispersion for RNA-seq data with DESeq2. Genome Biol. 2014;15(12):550. doi:10.1186/s13059-014-0550-8. [Google Scholar] [PubMed] [CrossRef]
25. Modi S, Gandhi N, Yoon H, Kuack J, Jee H, Enwere C, et al. Gene expression changes in COVID-19 patients impact pathways related to circadian rhythm, phosphatidylinositol signaling, cytokine storm, and platelet aggregation. Gene Rep. 2023;33:101831. doi:10.1016/j.genrep.2023.101831. [Google Scholar] [CrossRef]
26. Kuleshov MV, Jones MR, Rouillard AD, Fernandez NF, Duan Q, Wang Z, et al. Enrichr: a comprehensive gene set enrichment analysis web server 2016 update. Nucleic Acids Res. 2016;44(W1):W90–7. doi:10.1093/nar/gkw377. [Google Scholar] [PubMed] [CrossRef]
27. Kanehisa M, Goto S. KEGG Kyoto encyclopedia of genes and genomes. Nucleic Acids Res. 2000;28(1):27–30. doi:10.1093/nar/28.1.27. [Google Scholar] [PubMed] [CrossRef]
28. Yu G, He QY. ReactomePA: an R/Bioconductor package for reactome pathway analysis and visualization. Mol Biosyst. 2016;12(2):477–9. doi:10.1039/c5mb00663e. [Google Scholar] [PubMed] [CrossRef]
29. Kutmon M, Riutta A, Nunes N, Hanspers K, Willighagen EL, Bohler A, et al. WikiPathways: capturing the full diversity of pathway knowledge. Nucleic Acids Res. 2016;44(D1):D488–94. doi:10.1093/nar/gkv1024. [Google Scholar] [PubMed] [CrossRef]
30. Shannon P, Markiel A, Ozier O, Baliga NS, Wang JT, Ramage D, et al. Cytoscape: a software environment for integrated models of biomolecular interaction networks. Genome Res. 2003;13(11):2498–504. doi:10.1101/gr.1239303. [Google Scholar] [PubMed] [CrossRef]
31. Modi SR, Andey T. Piperlongumine in combination with EGFR tyrosine kinase inhibitors for the treatment of lung cancer cells. Oncol Res. 2024;32(11):1709–21. doi:10.32604/or.2024.053972. [Google Scholar] [PubMed] [CrossRef]
32. Cell Signaling Technology. Immunoprecipitation protocol utilizing magnetic separation (for analysis by western immunoblotting). [cited 2025 Jan 1]. Available from: https://www.cellsignal.com/learn-and-support/protocols/protocol-ip-magnetic. [Google Scholar]
33. Rouillard AD, Gundersen GW, Fernandez NF, Wang Z, Monteiro CD, McDermott MG, et al. The harmonizome: a collection of processed datasets gathered to serve and mine knowledge about genes and proteins. Database. 2016;2016:baw100. doi:10.1093/database/baw100. [Google Scholar] [PubMed] [CrossRef]
34. Kiss Z, Mudryj M, Ghosh PM. Non-circadian aspects of BHLHE40 cellular function in cancer. Genes Cancer. 2020;11(1–2):1–19. doi:10.18632/genesandcancer.201. [Google Scholar] [PubMed] [CrossRef]
35. Bi H, Li S, Qu X, Wang M, Bai X, Xu Z, et al. DEC1 regulates breast cancer cell proliferation by stabilizing cyclin E protein and delays the progression of cell cycle S phase. Cell Death Dis. 2015;6(9):e1891. doi:10.1038/cddis.2015.247. [Google Scholar] [PubMed] [CrossRef]
36. Ren Y, Deng R, Zhang Q, Li J, Han B, Ye P. Bioinformatics analysis of key genes in triple negative breast cancer and validation of oncogene PLK1. Ann Transl Med. 2020;8(24):1637. doi:10.21037/atm-20-6873. [Google Scholar] [PubMed] [CrossRef]
37. Chen DL, Cai JH, Wang CCN. Identification of key prognostic genes of triple negative breast cancer by LASSO-based machine learning and bioinformatics analysis. Genes. 2022;13(5):902. doi:10.3390/genes13050902. [Google Scholar] [PubMed] [CrossRef]
38. Hanahan D, Weinberg RA. Hallmarks of cancer: the next generation. Cell. 2011;144(5):646–74. doi:10.1016/j.cell.2011.02.013. [Google Scholar] [PubMed] [CrossRef]
39. Sanchez-Vega F, Mina M, Armenia J, Chatila WK, Luna A, La KC, et al. Oncogenic signaling pathways in the cancer genome atlas. Cell. 2018;173(2):321–37.e10. doi:10.1016/j.cell.2018.03.035. [Google Scholar] [PubMed] [CrossRef]
40. Saint-André V. Computational biology approaches for mapping transcriptional regulatory networks. Comput Struct Biotechnol J. 2021;19:4884–95. doi:10.1016/j.csbj.2021.08.028. [Google Scholar] [PubMed] [CrossRef]
41. He B, Tan K. Understanding transcriptional regulatory networks using computational models. Curr Opin Genet Dev. 2016;37:101–8. doi:10.1016/j.gde.2016.02.002. [Google Scholar] [PubMed] [CrossRef]
42. Jethalia M, Jani SP, Ceccarelli M, Mall R. Pancancer network analysis reveals key master regulators for cancer invasiveness. J Transl Med. 2023;21(1):558. doi:10.1186/s12967-023-04435-6. [Google Scholar] [PubMed] [CrossRef]
43. Zanin R, Pegoraro S, Ros G, Ciani Y, Piazza S, Bossi F, et al. HMGA1 promotes breast cancer angiogenesis supporting the stability, nuclear localization and transcriptional activity of FOXM1. J Exp Clin Cancer Res. 2019;38(1):313. doi:10.1186/s13046-019-1307-8. [Google Scholar] [PubMed] [CrossRef]
44. Metovic J, Borella F, D’Alonzo M, Biglia N, Mangherini L, Tampieri C, et al. FOXA1 in breast cancer: a luminal marker with promising prognostic and predictive impact. Cancers. 2022;14(19):4699. doi:10.3390/cancers14194699. [Google Scholar] [PubMed] [CrossRef]
45. Chen J, Tan B, Zhuang W, Yu T, Li J, He C. AFF3 is a prognostic biomarker correlated with immune infiltrates in triple-negative breast cancer. Clin Exp Obstet Gynecol. 2023;50(8):165. doi:10.31083/j.ceog5008165. [Google Scholar] [CrossRef]
46. Kolyvas EA, Caldas C, Kelly K, Ahmad SS. Androgen receptor function and targeted therapeutics across breast cancer subtypes. Breast Cancer Res. 2022;24(1):79. doi:10.1186/s13058-022-01574-4. [Google Scholar] [PubMed] [CrossRef]
47. Kao TW, Chen HH, Lin J, Wang TL, Shen YA. PBX1 as a novel master regulator in cancer: its regulation, molecular biology, and therapeutic applications. Biochim Biophys Acta BBA Rev Cancer. 2024;1879(2):189085. doi:10.1016/j.bbcan.2024.189085. [Google Scholar] [PubMed] [CrossRef]
48. Chen X, Iliopoulos D, Zhang Q, Tang Q, Greenblatt MB, Hatziapostolou M, et al. XBP1 promotes triple-negative breast cancer by controlling the HIF1α pathway. Nature. 2014;508(7494):103–7. doi:10.1038/nature13119. [Google Scholar] [PubMed] [CrossRef]
49. Kobayashi A. Roles of NRF3 in the hallmarks of cancer: proteasomal inactivation of tumor suppressors. Cancers. 2020;12(9):2681. doi:10.3390/cancers12092681. [Google Scholar] [PubMed] [CrossRef]
50. Chen WM, Hu QY, Hou W, Chen MW, Chen YH, Tang JC. Nrf3 promotes the proliferation and migration of triple-negative breast cancer by activating PI3K/AKT/mTOR and epithelial-mesenchymal transition. Oncol Lett. 2023;26(4):443. doi:10.3892/ol.2023.14030. [Google Scholar] [PubMed] [CrossRef]
51. Sun J, Zheng Z, Chen Q, Pan Y, Lu H, Zhang H, et al. NRF3 suppresses breast cancer cell metastasis and cell proliferation and is a favorable predictor of survival in breast cancer. Onco Targets Ther. 2019;12:3019–30. doi:10.2147/OTT.S197409. [Google Scholar] [PubMed] [CrossRef]
52. Paull EO, Aytes A, Jones SJ, Subramaniam PS, Giorgi FM, Douglass EF, et al. A modular master regulator landscape controls cancer transcriptional identity. Cell. 2021;184(2):334–51.e20. doi:10.1016/j.cell.2020.11.045. [Google Scholar] [PubMed] [CrossRef]
53. Lin JS, Lai EM. Protein-protein interactions: co-immunoprecipitation. Methods Mol Biol. 2017;1615:211–9. doi:10.1007/978-1-4939-7033-9_17. [Google Scholar] [PubMed] [CrossRef]
54. Kannan MB, Dodard-Friedman I, Blank V. Stringent control of NFE2L3 (nuclear factor, erythroid 2-like 3; NRF3) protein degradation by FBW7 (F-box/WD repeat-containing protein 7) and glycogen synthase kinase 3 (GSK3). J Biol Chem. 2015;290(43):26292–302. doi:10.1074/jbc.M115.666446. [Google Scholar] [PubMed] [CrossRef]
55. Ren Y, Wang Y, Hao S, Yang Y, Xiong W, Qiu L, et al. NFE2L3 promotes malignant behavior and EMT of human hepatocellular carcinoma (HepG2) cells via Wnt/β-catenin pathway. J Cancer. 2020;11(23):6939–49. doi:10.7150/jca.48100. [Google Scholar] [PubMed] [CrossRef]
56. Aono S, Hatanaka A, Hatanaka A, Gao Y, Hippo Y, Taketo MM, et al. β-catenin/TCF4 complex-mediated induction of the NRF3 (NFE2L3) gene in cancer cells. Int J Mol Sci. 2019;20(13):3344. doi:10.3390/ijms20133344. [Google Scholar] [PubMed] [CrossRef]
57. Bury M, Le Calvé B, Lessard F, Dal Maso T, Saliba J, Michiels C, et al. NFE2L3 controls colon cancer cell growth through regulation of DUX4, a CDK1 inhibitor. Cell Rep. 2019;29(6):1469–81.e9. doi:10.1016/j.celrep.2019.09.087. [Google Scholar] [PubMed] [CrossRef]
58. Salmon AJ, Shavkunov AS, Miao Q, Jarjour NN, Keshari S, Esaulova E, et al. BHLHE40 regulates the T-cell effector function required for tumor microenvironment remodeling and immune checkpoint therapy efficacy. Cancer Immunol Res. 2022;10(5):597–611. doi:10.1158/2326-6066.CIR-21-0129. [Google Scholar] [PubMed] [CrossRef]
59. Cao Y, Wang X, Liu Y, Liu P, Qin J, Zhu Y, et al. BHLHE40 inhibits ferroptosis in pancreatic cancer cells via upregulating SREBF1. Adv Sci. 2024;11(7):2306298. doi:10.1002/advs.202306298. [Google Scholar] [PubMed] [CrossRef]
Cite This Article
 Copyright © 2026 The Author(s). Published by Tech Science Press.
This work is licensed under a Creative Commons Attribution 4.0 International License , which permits unrestricted use, distribution, and reproduction in any medium, provided the original work is properly cited.
 Downloads
 Citation Tools