
 Submit a Paper
 Propose a Special lssue
 Open Access
ARTICLE
Exploration of Genetic Pattern of Phenological Traits in Wheat (Triticum aestivum L.) under Drought Stress
1 Department of Plant Breeding and Genetics, Faculty of Agriculture, University of Agriculture Faisalabad, Faisalabad, 38040, Pakistan
2 Department of Botany, Faculty of Life Sciences, University of Okara, Okara, 56130, Pakistan
3 Department of Field Crops, Faculty of Agriculture, Çukurova University, Adana, 01330, Turkey
4Department of Crop Genetics and Breeding, Rice Research Institute, Sichuan Agricultural University, Chengdu Campus, 611130, China
5 Key Laboratory of Agriculture Products Improvement, Zhejiang Agriculture and Forestry University, Hangzhou, 311300, China
6 Institute of Crop Science, Ministry of Agriculture and Rural Affairs Key Laboratory of Spectroscopy Sensing, Zhejiang University, Hangzhou, 310058, China
7 Department of Biotechnology, Institute of Natural and Applied Sciences, Çukurova University, Adana, 01330, Turkey
8 Agricultural Institute, ELKH Centre for Agricultural Research, Martonvásár, 2462, Hungary
9 College of Agronomy, Sichuan Agricultural University, Ya’an, 611130, China
10 Institute of Molecular Biology and Biotechnologies, Azerbaijan National Academy of Sciences, Baku, AZ 1073, Azerbaijan
11 Research Institute of Crop Husbandry, Ministry of Agriculture of the Azerbaijan Republic, Baku, AZ 1098, Azerbaijan
12 Laboratory of Bioclimatology, Department of Ecology and Environmental Protection, Poznan University of Life Sciences, Poznan, 60-649, Poland
* Corresponding Authors: Muhammad Umer Farooq. Email: ; Anshu Rastogi. Email:
Phyton-International Journal of Experimental Botany 2022, 91(12), 2733-2758. https://doi.org/10.32604/phyton.2022.022094
Received 21 February 2022; Accepted 27 April 2022; Issue published 29 August 2022
 View Full Text
 Download PDF
Abstract
Drought is the major detrimental environmental factor for wheat (Triticum aestivum L.) production. The exploration of genetic patterns underlying drought tolerance is of great significance. Here we report the gene actions controlling the phenological traits using the line × tester model studying 27 crosses and 12 parents under normal irrigation and drought conditions. The results interpreted via multiple analysis (mean performance, correlations, principal component, genetic analysis, heterotic and heterobeltiotic potential) disclosed highly significant differences among germplasm. The phenological waxiness traits (glume, boom, and sheath) were strongly interlinked. Flag leaf area exhibits a positive association with peduncle and spike length under drought. The growing degree days (heat-units) greatly influence spikelets and grains per spike, however, the grain yield/plant was significantly reduced (17.44 g to 13.25 g) under drought. The principal components based on eigenvalue indicated significant PCs (first-seven) accounted for 79.9% and 73.9% of total variability under normal irrigation and drought, respectively. The investigated yield traits showed complex genetic behaviour. The genetic advance confronted a moderate to high heritability for spikelets/spike and grain yield/plant. The traits conditioned by dominant genetic effects in normal irrigation were inversely controlled by additive genetic effects under drought and vice versa. The magnitude of dominance effects for phenological and yield traits, i.e., leaf twist, auricle hairiness, grain yield/plant, spikelets, and grains/spike suggests that selection by the pedigree method is appropriate for improving these traits under normal irrigation conditions and could serve as an indirect selection index for improving yield-oriented traits in wheat populations for drought tolerance. However, the phenotypic selection could be more than effective for traits conditioned by additive genetic effects under drought. We suggest five significant cross combinations based on heterotic and heterobeltiotic potential of wheat genotypes for improved yield and enhanced biological production of wheat in advanced generations under drought.Keywords
Abbreviations
| GDD | Growing Degree Days to Maturity (Heat Units) |
| GW | Glume Wax (Zodiac Scale) |
| BW | Boom Wax (Zodiac Scale) |
| SW | Sheath Wax (Zodiac Scale) |
| LA | Leaf Attitude (Zodiac Scale) |
| LT | Leaf Twist (Zodiac Scale) |
| AC | Auricle Color (Zodiac Scale) |
| AH | Auricle Hairiness (Zodiac Scale) |
| NOL | Number of Leaves |
| NON | Number of Nodes |
| FLA | Flag Leaf Area (cm2) |
| PH | Plant Height (cm) |
| PL | Peduncle Length (cm) |
| PT | Productive Tillers |
| Spsp–1 | Number of Spikelets per Spike |
| SL | Spike Length (cm) |
| Gsp | Grains per Spike |
| Gypl–1 | Grain Yield per Plant (g) |
| EMS | Error Mean Square |
| R | Replications |
| MPH | Mid Parent Heterosis |
| BPH | Better Parent Heterosis |
Owing to potential high yield and nutritional qualities, wheat (Triticum aestivum L.) is the main cultivated cereal crop around the globe. It is the major source of carbohydrates and proteins for a large proportion of the world population. The wheat has been cultivated in a widespread area with a productivity of approximately 766 million tons annually [1]. Various abiotic and biotic limiting factors such as drought, temperature, and insects are responsible for lower wheat production from one season to another [2]. Globally, the wheat-growing areas are exposed to water scarcity by 20%–25% [3]. Furthermore, water stress reduced the wheat yields by 50%–90% depending on the plant growth stage and its severity, which varies from 1 to 60 mha in developing countries [4]. The world’s population is expected to increase up to 8.2 billion in 2025 and 11.2 billion in 2050, while 65% of them are estimated to live in drought-affected areas [5]. In this way the declining trends of water resources and the increasing percentage of the global population, water scarcity will become the most imperative limiting factor to food supply [6,7]. It can negatively affect plant growth, development, pre-anthesis, terminal phase, and agronomical characteristics, including wheat yield [8]. The deficit irrigation at the earlier anthesis stage could severely affect seed setting [9], whereas terminal water stress can lead to a reduction in total grain weight (TGW) [7]. Most probably, the water deficiency at post-anthesis of wheat is a reason for leaf senescence and has a significant effect on the development and filling rates of grains [10]. Modern wheat cultivars follow an opposite metabolic law to primitive ones in relation to leaf biomass/reproductive growth and possess a proposed yield advantage [11]. Gui and colleagues observed that the number of spikelets/spike and grains per spike were the main factors affecting the crop yield [12]. However, these intermittent drought occurrences are the main challenges limiting wheat productivity in the arid and semiarid regions [13]. Water scarcity is a major issue due to the restricted water release and construction of the dams on the river’s flow. Heat and seasonal environmental changes demand the development of drought-tolerant germplasm [14]. Due to the significant reduction in both quality and grain yield, the development of greater drought-tolerant and high-yielding wheat varieties/germplasm is a major concern.
Understanding the types of gene action and genetic behavior [15] controlling major morphological, physiological, and agronomic-targeted characters is a major principle for designing a suitable breeding program for the genetic improvement of crops [16]. In this regard, the importance of phenological traits cannot be denied. It can serve as an indirect criterion to access diversity for germplasm improvement. Many studies have reported the direct or indirect involvement of the mentioned traits in germplasm improvement, i.e., millet [17], wheat [18], barley [19], and common beans [20]. The inheritance of quantitative characters is defined as a moving goal because these traits were affected by the actions of multiple genes, the interaction between genes and genotype × environment [21] with individual minor effects. The biometrical genetic models were developed to explore the inheritance of such characters [22]. On the other hand, the principal component and biplot analysis are advantageous techniques to estimate the genetic effects of prevailing traits, variance components, and heritability [22]. In addition, the mean generation model is a simple and useful technique to estimate main gene effects (additive and dominance). This method would be helpful in selecting the best relative breeding strategies [23]. Furthermore, only a few previous studies focused on the inheritance pattern of phenological traits and genetic component studies of these selected traits under drought conditions. Drought gradually impaired leaf water potential and membrane stability [24]. Knowing the inheritance of quantitative characters, the information about gene action is necessary to increase the efficiency of a breeding strategy. These techniques could assist in identifying the performance of selected crop parents and the potential of inducing the population employed for each pedigree selection or heterosis exploitation [25].
Therefore, the present study aimed to identify the high-yielding drought-tolerant wheat genotypes and the indirect impact of secondary phenological traits under normal and drought conditions. In this regard, the mean performances, relative contributions, heterosis, genetic variability, gene action type, heritability, correlation, and principal components of variability are determined following the line × tester mating design in the bread wheat accessions under two water regimes. The results regarding association studies and component analysis between phenological characters and yield-related metric traits could provide significant information about the involvement of secondary traits in abiotic stress tolerance.
To test the identified key questions for heterosis and the effect of drought on phenological traits, nine lines viz., 9730, 9731, 9733, 9859, 9860, 9861, AARI-11, PB-11, and AAS-11, and three testers (E-108, E-113, E-114) were crossed using line × tester mating design. The experiment was carried out at coordinates 31.4310° N and 73.0695° E, University of Agriculture Faisalabad. The pedigree record and cross combination parentage used are the same as in our previous report [26]. Four irrigations to normal block (following the delta water requirement) and 1 irrigation to drought block was given (Roani irrigation excluded). The drought stress was administered after the onset of the tillering stage. Polythene sheets were used to cover the drought block to avoid any forecasted precipitation. The testers were imported from CIMMYT and characterized with waxiness on their spike and stem’s outer surface. The seeds were sown in triplicates for data reliability. Plant × plant and row × row distance was maintained at 15 cm and 30 cm, respectively.
2.2 Agronomic Practices and Data Collection
The phenological and yield-related metric traits, viz., Growing Degree Days to maturity (GDD), Glume Wax (GW), Boom Wax (BW), Sheath Wax (SW), Leaf Attitude (LA), Leaf Twist (LT), Auricle Color (AC), Auricle Hairiness (AH), Number of Leaves (NOL) and Number of Nodes (NON), Flag Leaf Area (FLA), Plant Height (PH), Peduncle Length (PL), Productive Tillers (PT), Spikelets/spike (Spsp-1), Spike Length (SL), Grains/spike (Gsp) and Grain yield/plant (Gypl-1) were estimated to figure out the impact of drought on them.
Zodiac coding scale (0–5) was used to calculate phenological traits (glume wax, boom wax, sheath wax, leaf attitude, leaf twist, auricle color, auricle hairiness). Zero (0) represents a negligible effect, while a value near 5 represents the maximum effect for the measurement of each phenological trait. However, the values (1, 2, 3, 4) were computed as in-between blending expressions from low to strong. For leaf attitude (erectness, droopiness) and leaf twist, zero represents straight leaves, while 5 is for maximum leaf curliness (as drought conditions greatly affect the leaf structure, so they were estimated). For auricle color, zero represents white color, while 5 is for yellow color, the reading in-between represents a mixed shade from white-light-yellow to dark yellow. The auricle hairiness was estimated as none (0) to highly dense hairs (5) around the auricle. The number of leaves and number of nodes was estimated by counting them from the base to the rachis of the plant (to see how drought can affect the nodes and leaf number as well).
Growing Degree Days to maturity (GDD) (measured in terms of heat units from sowing to complete maturity of the crop) [27]. However, yield-related metric traits (plant height, peduncle length, productive tillers, spike length, spikelets/spike, grains/spike, grain yield/plant) were computed similarly as reported earlier [27]. flag leaf area (cm2) was computed as defined by [28] with little modifications [26] using the formula (Flag leaf area = flag leaf width × flag leaf length × 0.74). The flag leaf width was taken at 3 points in a leaf and averaged to get the mean value for the calculation of the flag leaf area. The overall value obtained was multiplied with a correction factor of 0.74.
For heterosis (Mid parent heterosis; MPH) and Heterobeltosis (Better parent heterosis; BPH), the performance of F1 and their parents were compared under normal and drought conditions. Mid parent heterosis was computed using the formula [29] with few modifications.
While heterobeltosis was computed using formula:
To evaluate the level of significance among MPH and BPH, a T-test was implemented. T calculated values for MP and BP were estimated and compared at a 5% level of probability to evaluate significance.
The data were subjected to analysis of variance (ANOVA) to compare the mean differences [30]. Genetic variability (gene action, degree of dominance, genetic variance, genetic gain, and proportional contribution) was computed [31]. The heterotic and heterobeltiotic potential of wheat genotypes was computed using the formula [32]. A T-test (P ≤ 0.05) was used to test the significance. Correlation analyses were estimated using the R language software Package 3.1.2. Principal component analysis and biplot analysis were computed using GenStat (10th statistical package). Graphs were drawn using R language 3.1.2, SigmPlot 12.5, Origin 8.0, and Microsoft Excel 2016 [33].
The beginning of the 21st century was marked by the global scarcity of water resources, environmental pollution, and increased salinization of soil and water [5]. Water scarcity is the most devastating abiotic stress and has a great global threat [34]. An increasing human population and a reduction in land available for cultivation are two threats to agricultural sustainability [35]. The environment has a great influence on morphologically and economically important traits. The differences in development, altered biochemical pathways, and osmolyte differentiation were observed in plants experiencing deficit irrigation [36]. In this regard, the physiological and morphological indicators are useful tools to identify behavioral change. However, the secondary phenological traits, viz. (glume wax, boom wax, sheath wax, leaf attitude, leaf twist, auricle color, auricle hairiness, number of leaves, number of nodes, and flag leaf area) might be an important aspect for the yield traits inheritance and performance in abiotic stress conditions, which is not well documented.
3.1 Identification of Mean Differences for Studied Traits
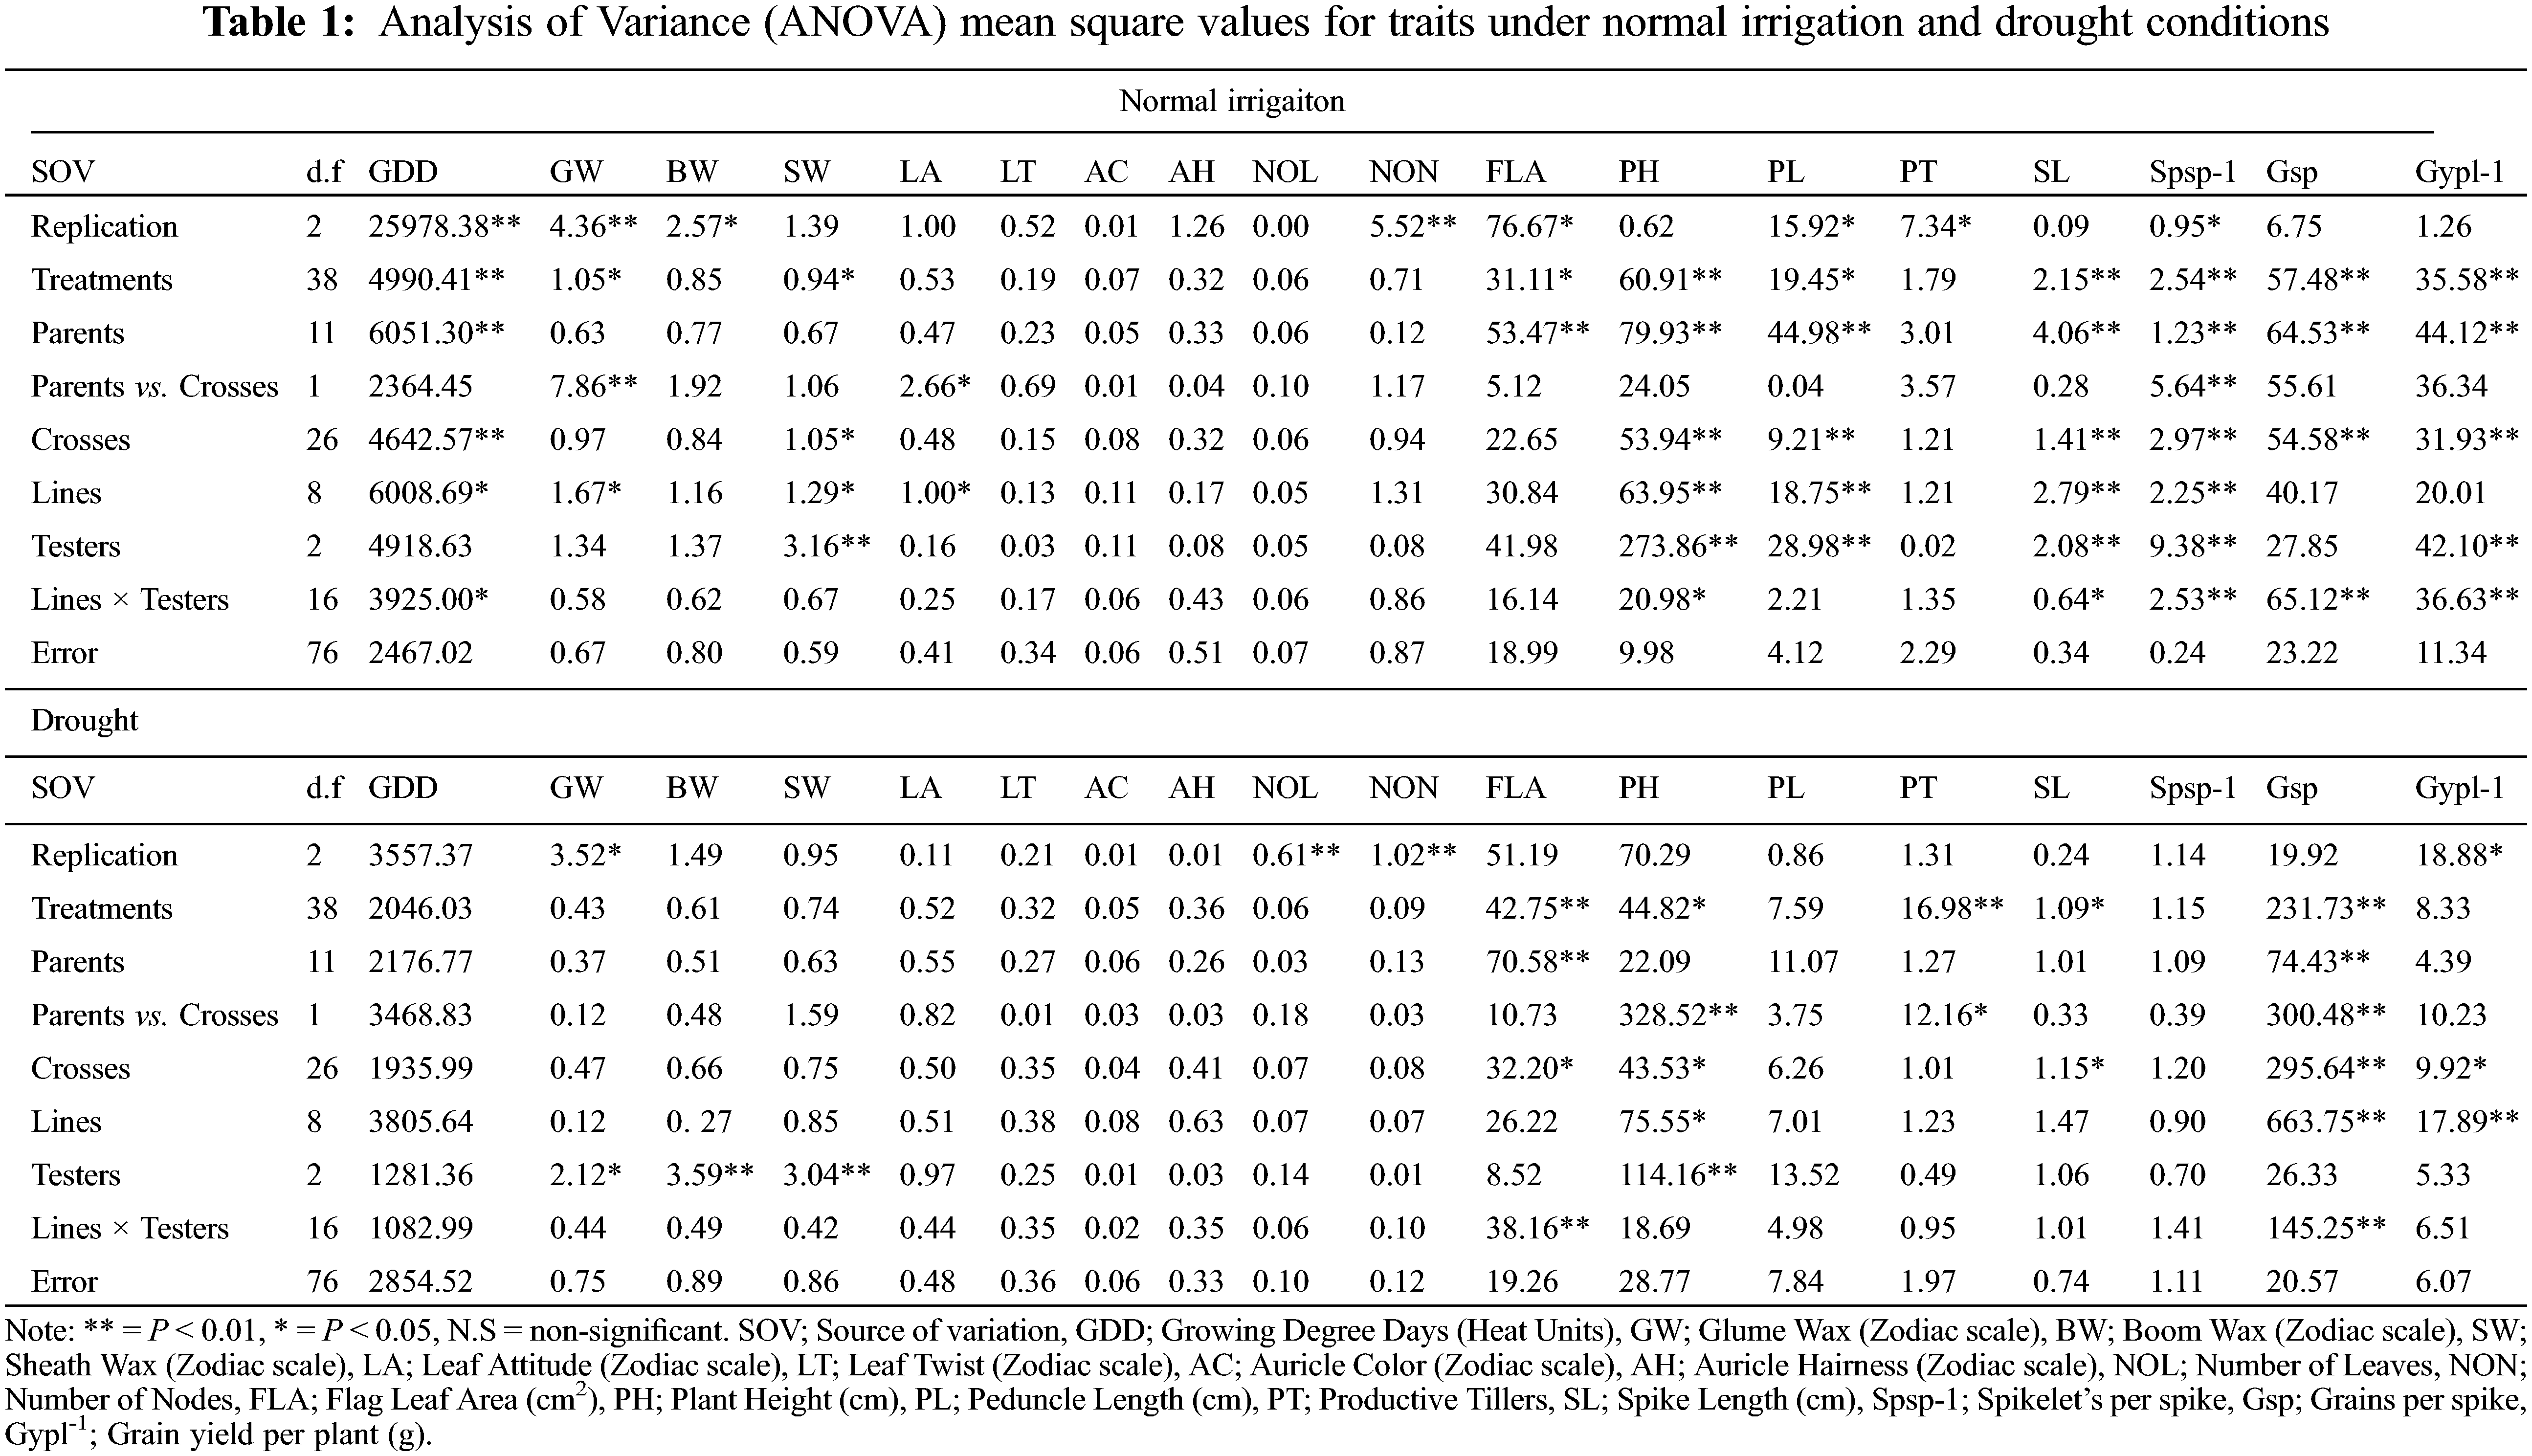
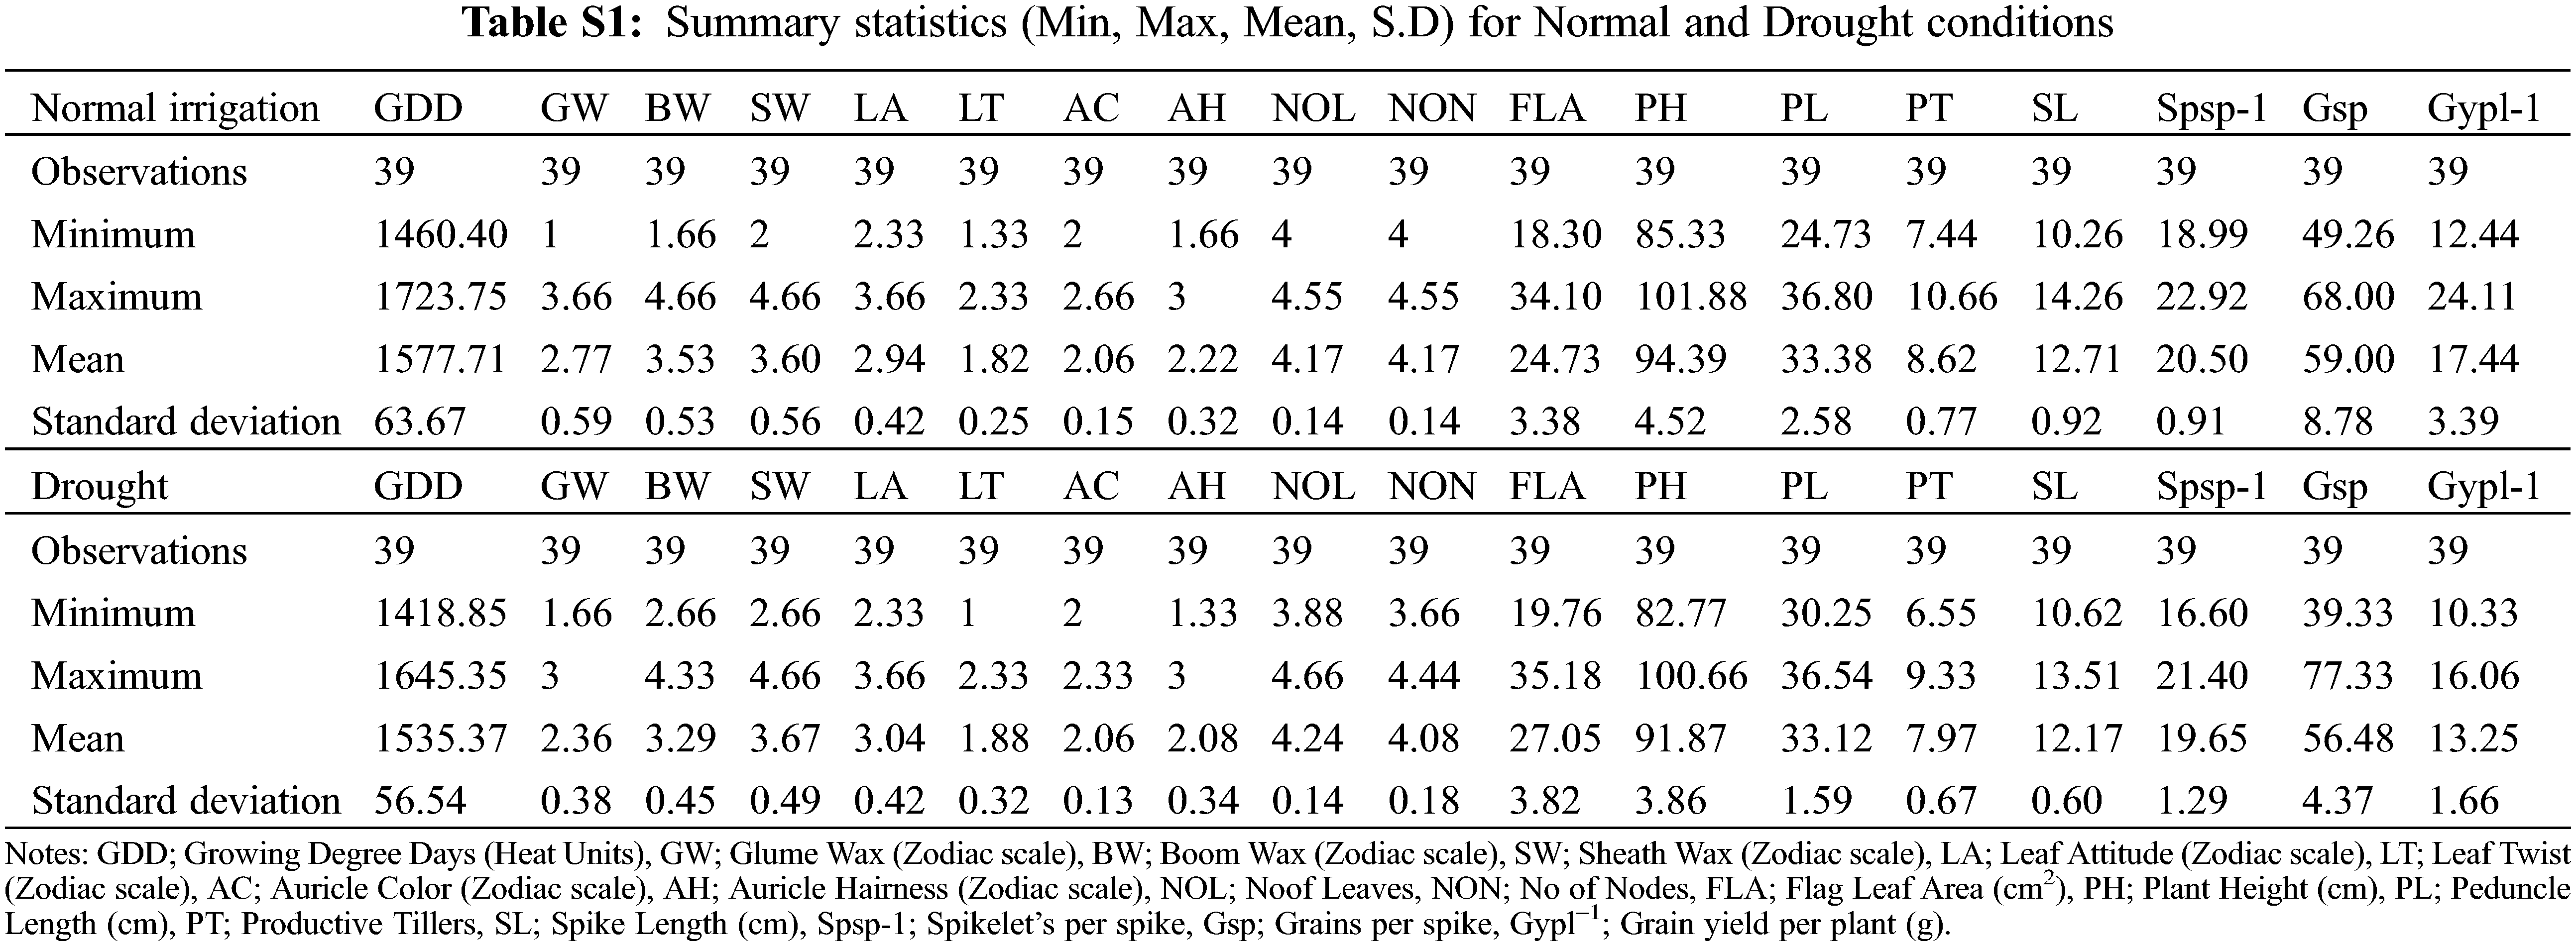
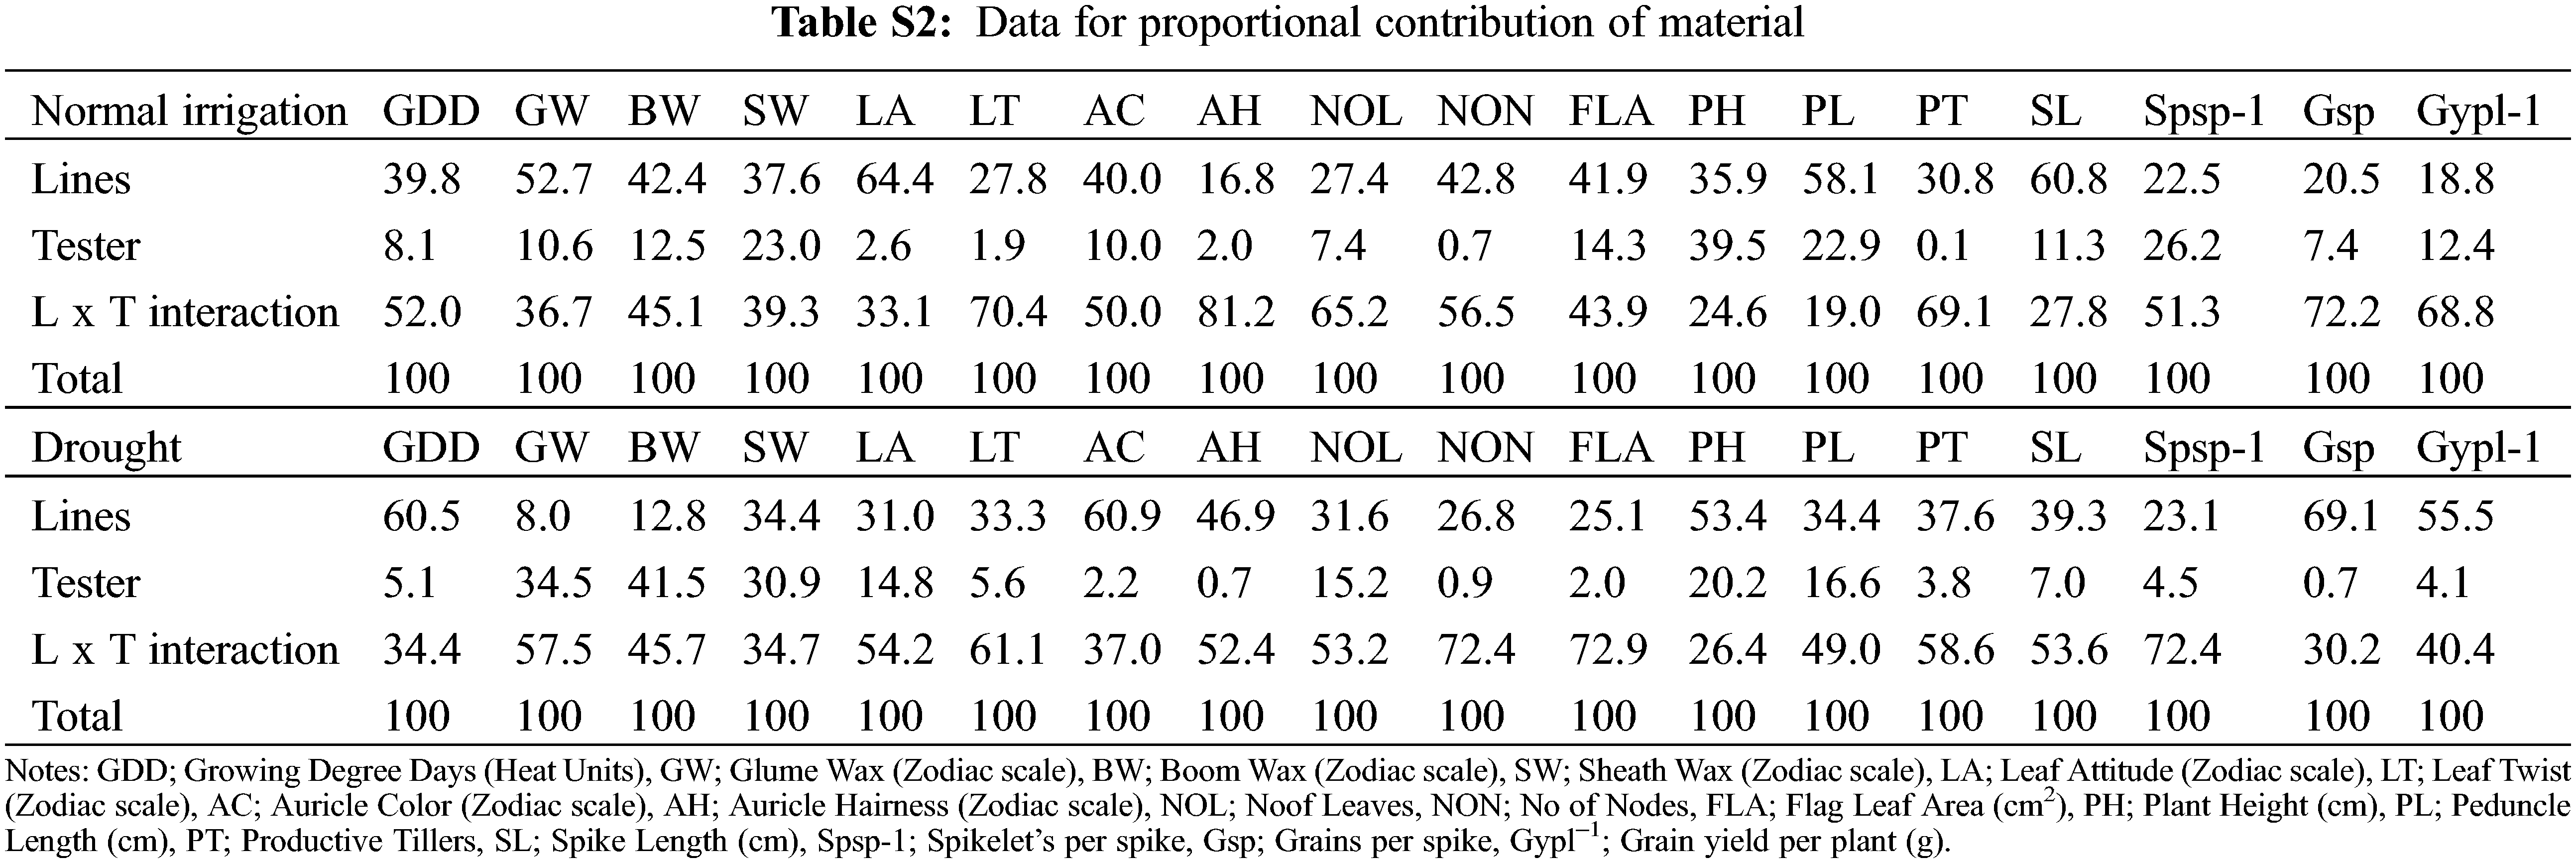
For plant breeders, genetic diversity is a well-recognized value and the first step in a plant breeding program [37,38]. The variance analysis (ANOVA) indicated the traits growing degree days to maturity, glume wax, boom wax, sheath wax, leaf attitude, flag leaf area, plant height, peduncle length, spike length, Spikelets/spike, Grains/spike, Grain yield/plant exhibit significant variation under different water regimes (Table 1). Under normal conditions, the contribution of treatment factors (parents, crosses, lines, and testers) was high toward total variability. However, testers contribute significantly toward total variability during the onset of drought. High treatment variance in different water regimes was also observed by wheat scientists [39]. The phenological traits, i.e., leaf twist, auricle color, auricle hairiness and the number of nodes were not significantly different. The mean of all traits decreased significantly by drought except for leaf attitude, the number of leaves, and flag leaf area which were increased in-significantly as disclosed by the mean and standard deviation (Table S1). The grains number increased in drought, but the grain yield was significantly reduced, this happened due to hollow or empty grain formation. Similar results of severe reduction by drought stress in various traits were investigated by various scientists [40,41]. The contribution of testers was significant for waxiness traits, glume wax, boom wax, and sheath wax under drought. However, the higher mean performance of flag leaf area but with reduced Grain yield/plant under drought was observed. The higher mean performance of the flag leaf area is attributed to varietal different responses under different epigenetic environmental factors [42]. In the present study, the higher proportional contribution of (L × T interaction) might attribute to a higher flag leaf area under drought (Table S2). Moreover, flag leaf senescence has started immediately after anthesis in grain filling duration [43]. Guendouz identified that water stress reduced the specific leaf weight by 41.86% [42], which might be the reason for the higher flag leaf area mean but with lower Grain yield/plant during drought.
3.2 The Association Studies between Yield and Phenological Traits
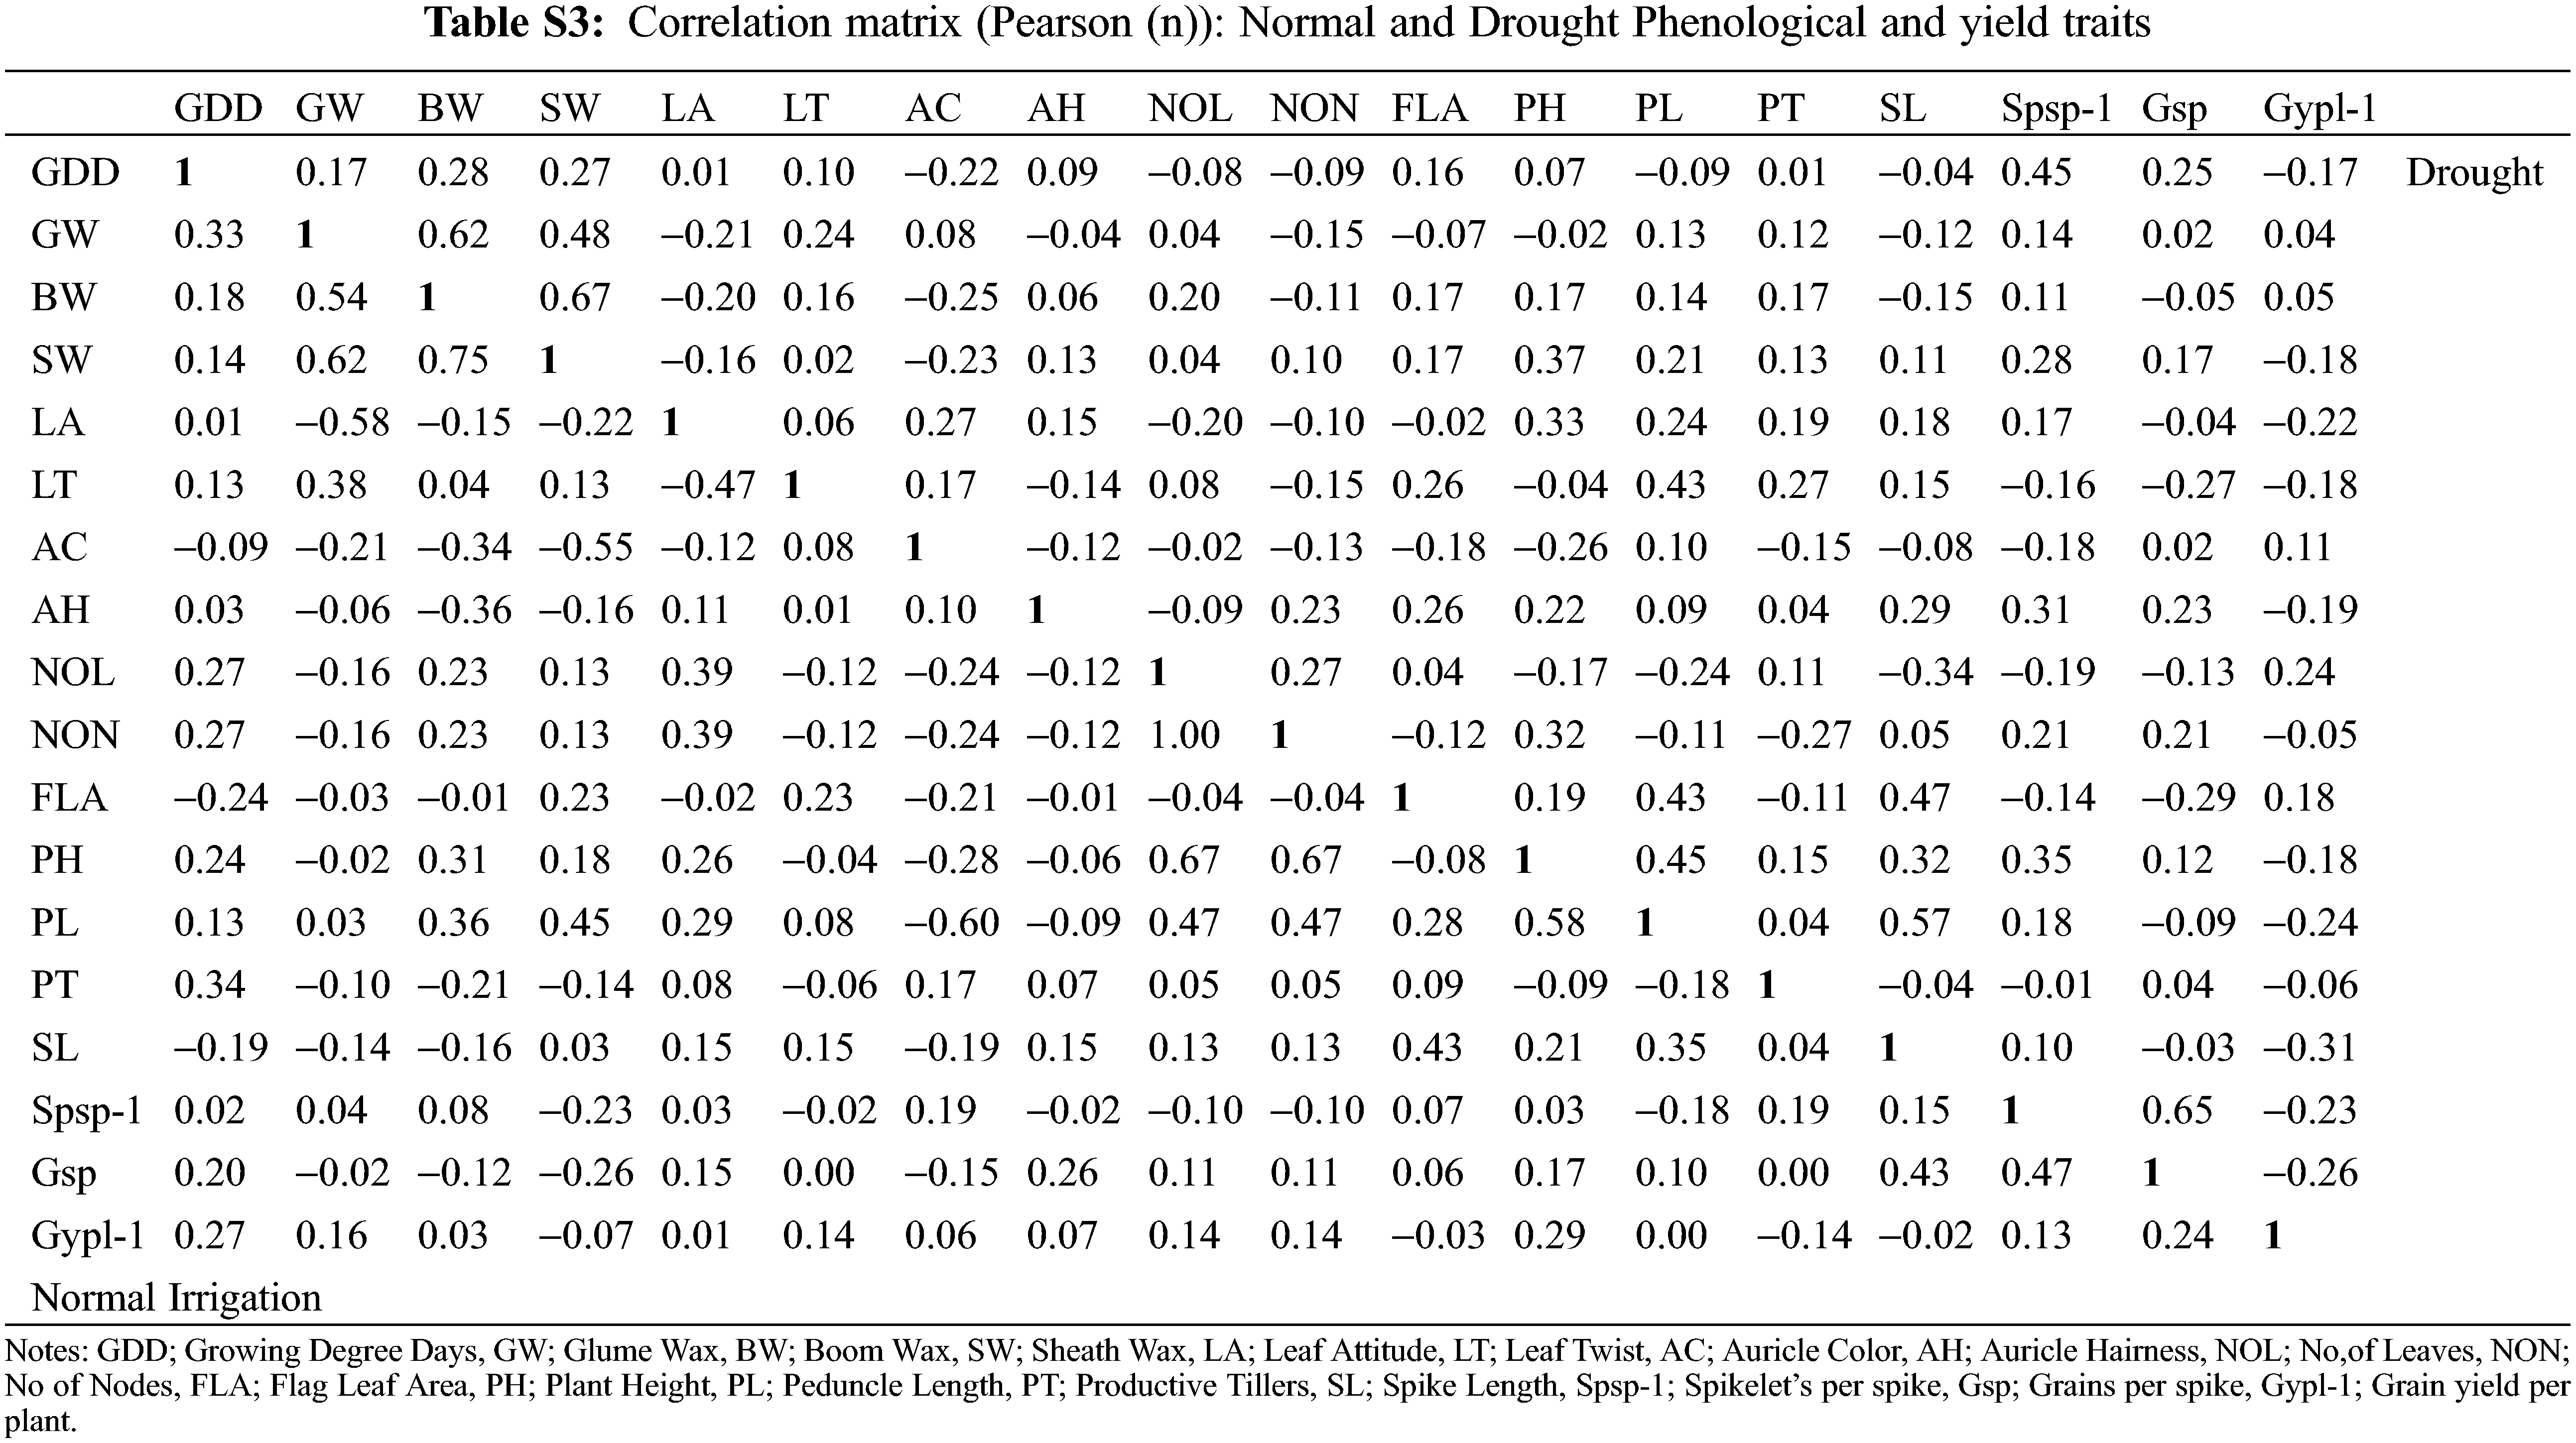
The changes in various morphological and physiological traits serve as a drought-responsive indicator in wheat genotypes. The consequences of the deleterious effects of drought on important metabolic processes reduced the ultimate grain yield. The association studies indicated a strong positive correlation between the waxiness-related phenological traits glume wax, boom wax, and sheath wax (r = 0.62, 0.75, 0.67) under normal irrigation and drought (Fig. 1). The association of auricle color and Grain yield/plant was minimal under drought with other phenological traits. Leaf properties (leaf attitude, leaf twist, and flag leaf area) were significantly and directly influencing other indirectly-yield associated traits (peduncle length, spike length, plant height) under drought. Farooq et al. [44] stated that water stress affects wheat physiology by reducing the stomatal conductance and metabolic functions with increasing leaf senescence as well as causing tissue dehydration. The correlation between yield-related metric traits (plant height with peduncle length, r = 0.58, plant height with number of leaves and number of nodes, r = 0.67, number of nodes with number of leaves, r = 1.00, and Spikelets/spike with Grains/spike, r = 0.65) was strongly evident (Table S3). The interaction of traits growing degree days to maturity with Spikelets per spike and Grains/spike was positive under both experimental conditions, especially under drought. The initiation of drought signals the crop to complete its physiological maturity earlier than the normal conditions during the wheat growth phase as also evident by mean performances (Table S1). With changed maturity behavior in wheat traits under drought, other interlinked correlated traits affecting yield were also observed (flag leaf area with peduncle length and spike length). However, the association of other phenological traits was found negative with yield traits. This divergent behavior in wheat maturity days under water stress might control the inferiority of nutrients in the parts of a plant, which reduces chlorophyll content in plant leaves due to the deficiency of nitrogen elements needed for assimilation [38]. The loss of the chloroplast integrity in the leaf causes early senescence under the drought that ultimately leads the plant to mature early [45]. Erkul also documented a weak association between TGW, and GY, medium for SPS, and high for NGS [46].
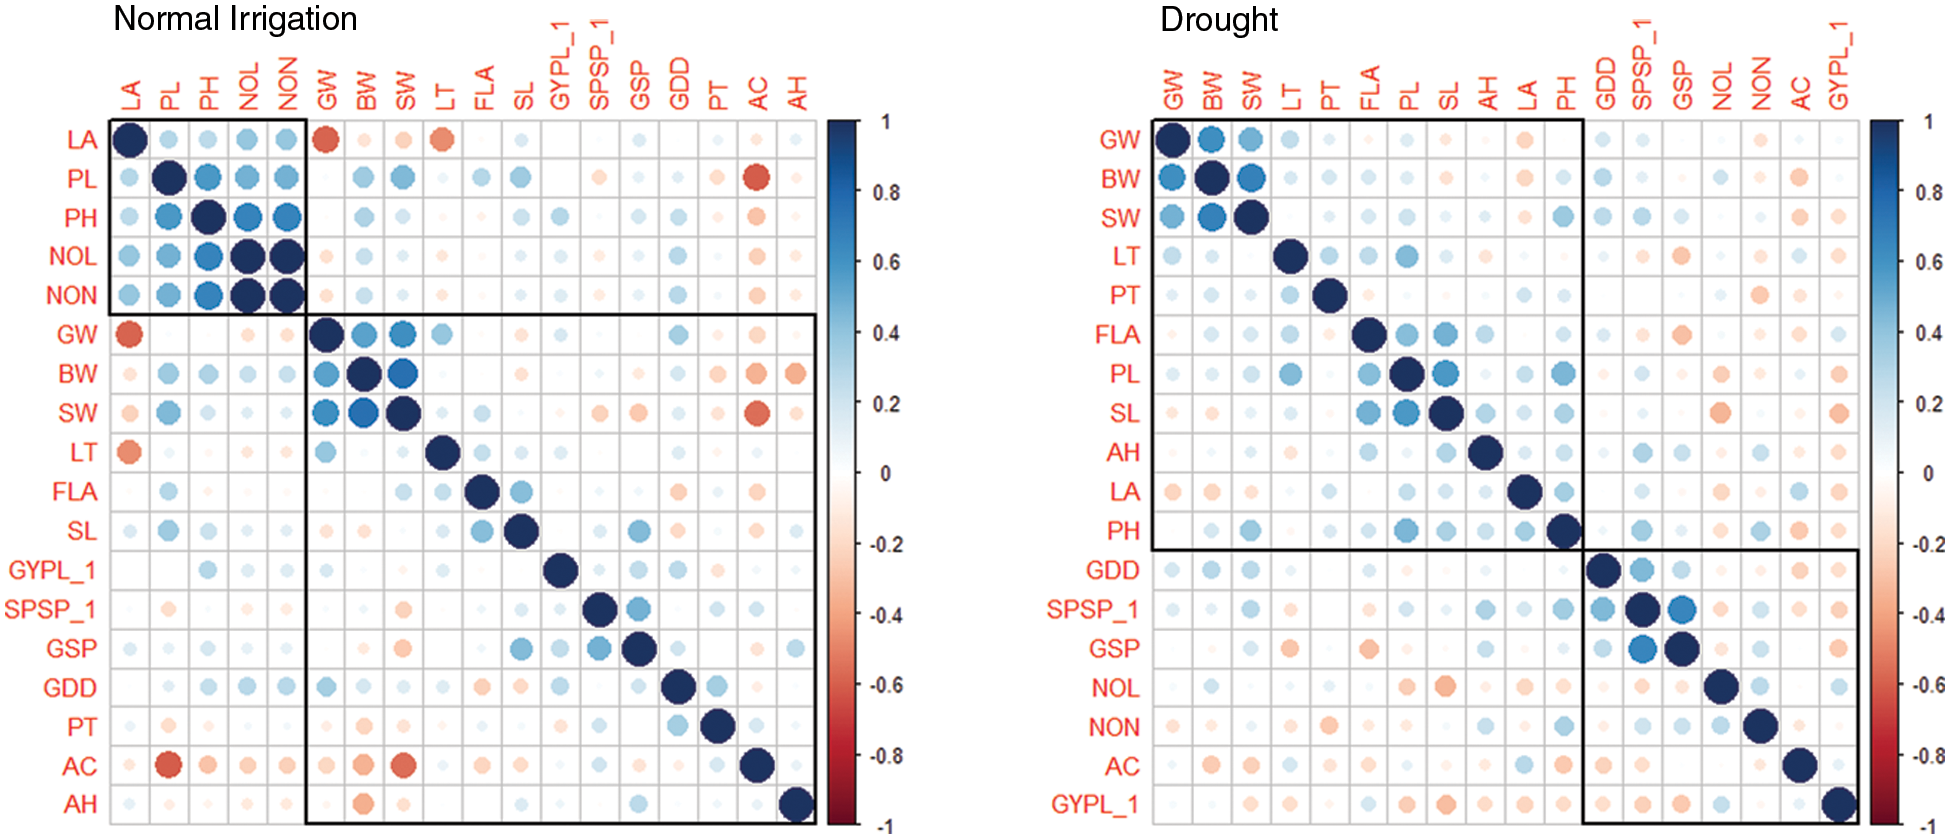
Figure 1: Correlation analysis for phenoogical and yield traits under Normal Irrgation (Left) and Drought (Right) conditions
3.3 Principal Component Studies for Phenological and Yield Traits
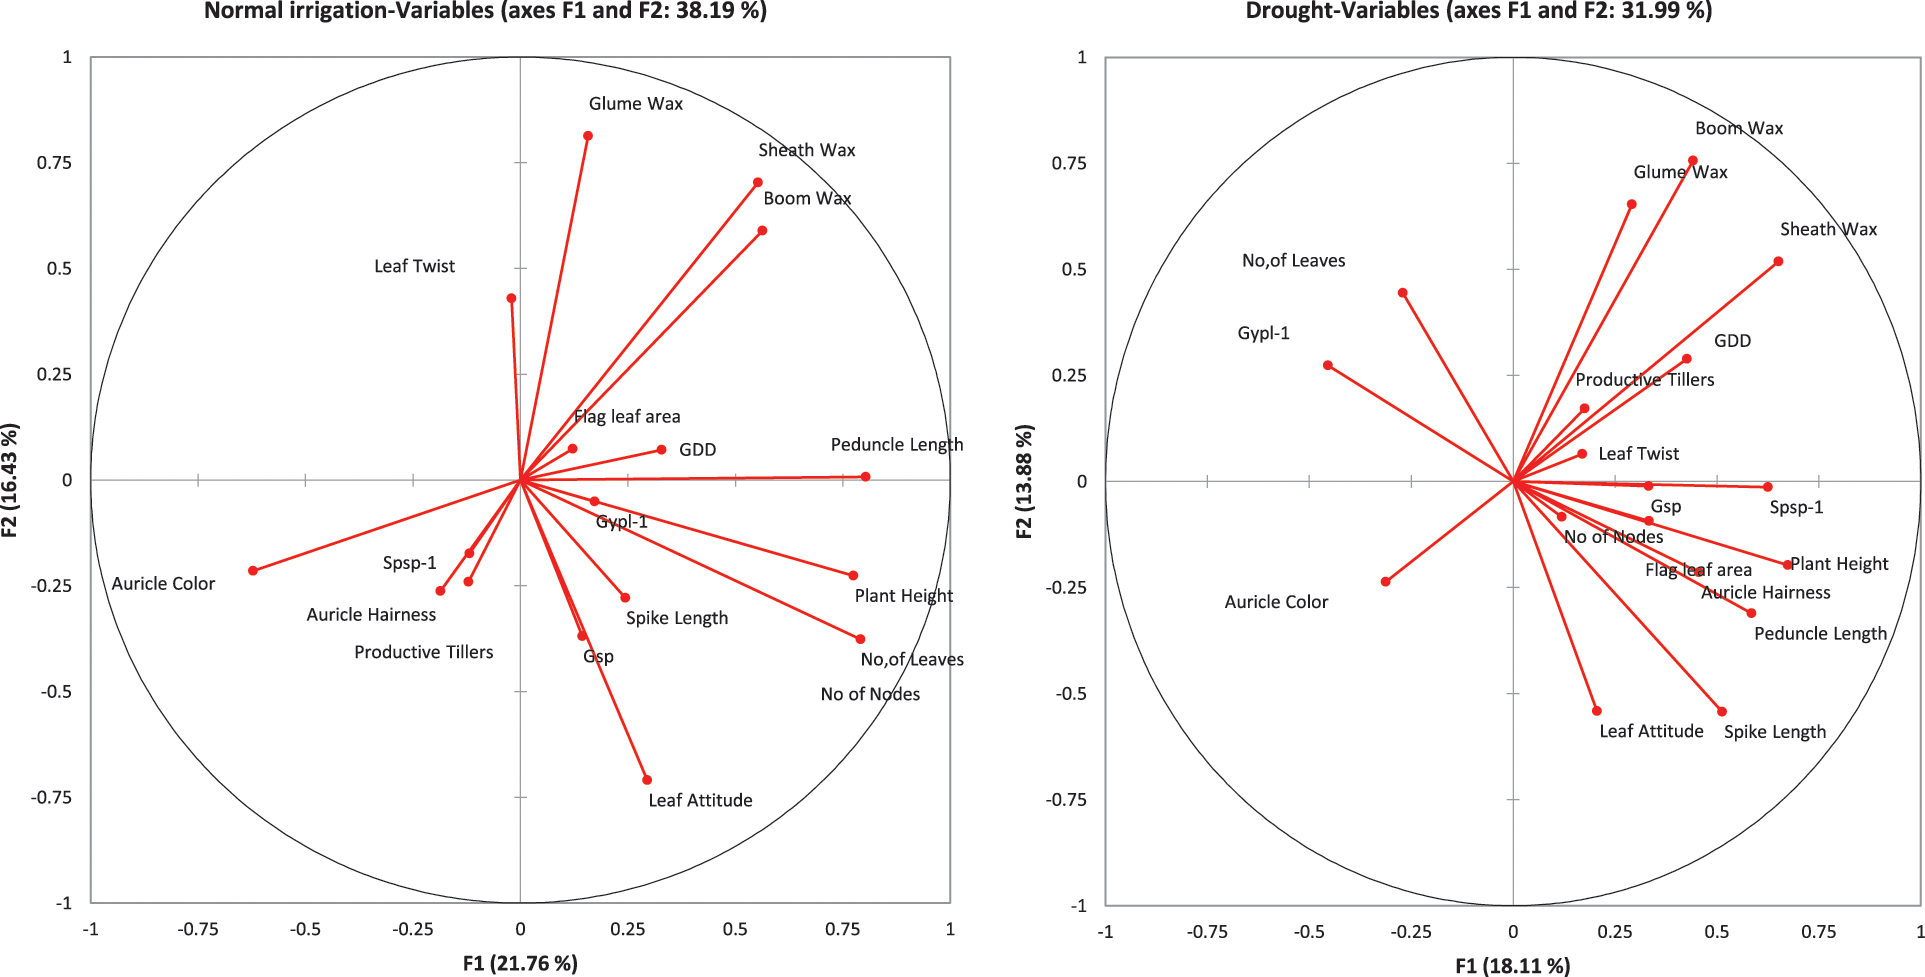
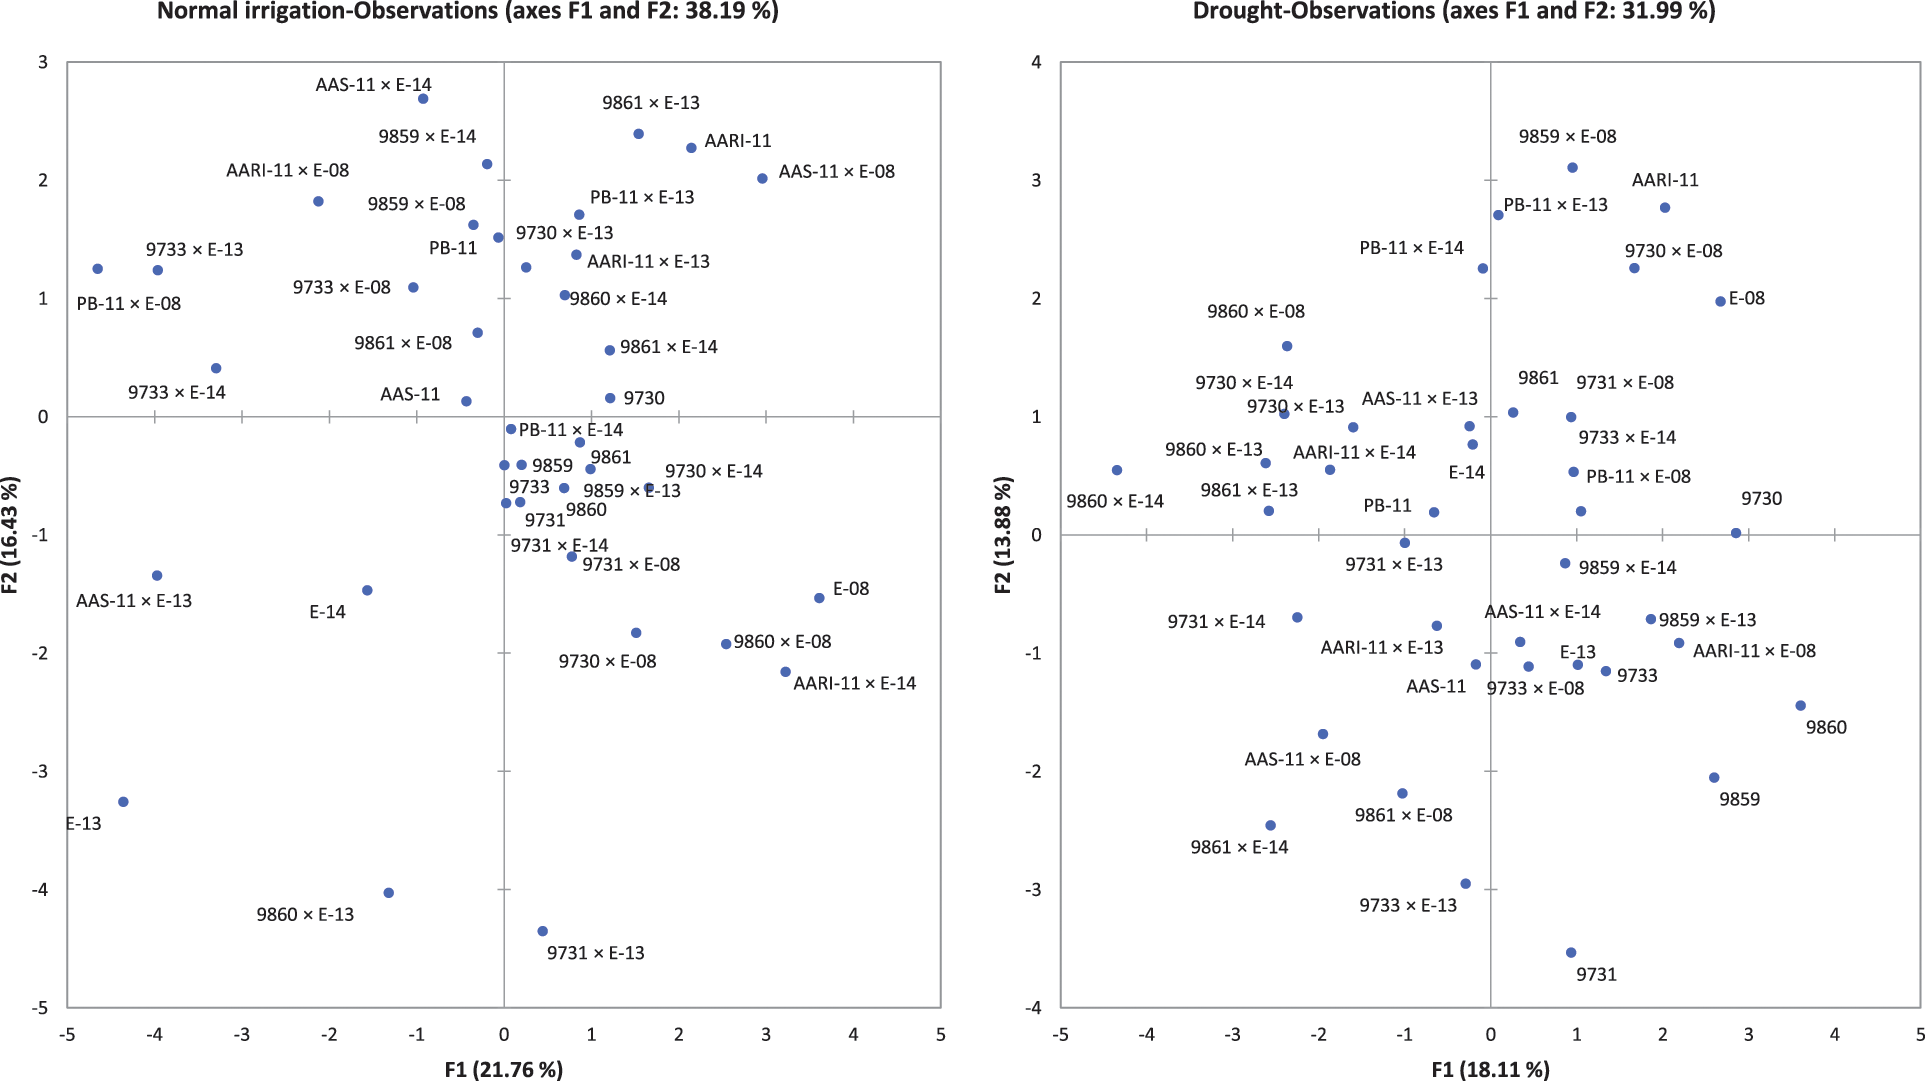
The principal component and biplot analysis are integral parts of any data management to dissect the random component variability [47]. The synchronous biplot study between traits and genotypes depicted that most of the genotypes were consistent and close to the proximity of phenological and yield-related metric traits under normal irrigation. However, the responses of genotypes in drought conditions varied (Fig. 2). Scree plot analysis disclosed the significant PCs (first-seven) accounted for 79.9% and 73.9% of total variability under normal conditions and drought, respectively. The cumulative variability and eigenvalue decreased in drought (Supplementary Fig. 1). Among different fractions of PCA analysis, the curvatures indicated the traits glume wax, sheath wax, boom wax, growing degree days to maturity, were in positive 1st Quadrant and Grains/spike, number of nodes, spike length, plant height, and leaf attitude were in 2nd Quadrant under both studied conditions. It was found that the drought inversely impacts the inheritance pattern of leaf attributes leaf twist, auricle hairiness, flag leaf area, number of leaves, peduncle length, productive tillers, Spikelets per spike, and Grain yield/plant (Supplementary Fig. 2). Inverse behavior of sheath wax with auricle color was observed in variable water regimes. Overall, the variable axes were 38.19% and 31.99% in normal irrigation and drought conditions, respectively. The projection of traits on PC1 and PC2 revealed a difference of 3.65% in F1 and 2.55% in F2. The metric traits (plant height with peduncle length and spike length) were strongly linked and inversely affected by growing degree days to maturity in drought conditions. It could result in early maturity, stunted growth, and reduced yield in wheat genotypes under drought. Moreover, the mean performance was decreased (17.44 to 13.25) for Grain yield/plant with a clear reduction under both water regimes respectively (Table S1). When wheat plants were exposed to moisture stress at stem elongation and pollen stage, the plant experienced stress, and grain yield and dry matter were found reduced, compared to the full-irrigated condition as disclosed by Dong and colleagues [48]. Biplot analysis indicated the different varietal performances (Supplementary Fig. 3). Among testers, the response was different in drought. However, among lines, the behavior of 9730, AARI-11 (lies in 1st Quadrant) and 9731, 9859, 9860 (lies in 2nd Quadrant), and PB-11 (lies in 4th Quadrant) was consistent in drought as well. However, the cross combination PB-11 × E-13 performance was better in drought. The genotypes projection based on PC1 and PC2 help in developing meaningful plant breeding strategies [49] and selecting efficient parents by PCA [50].
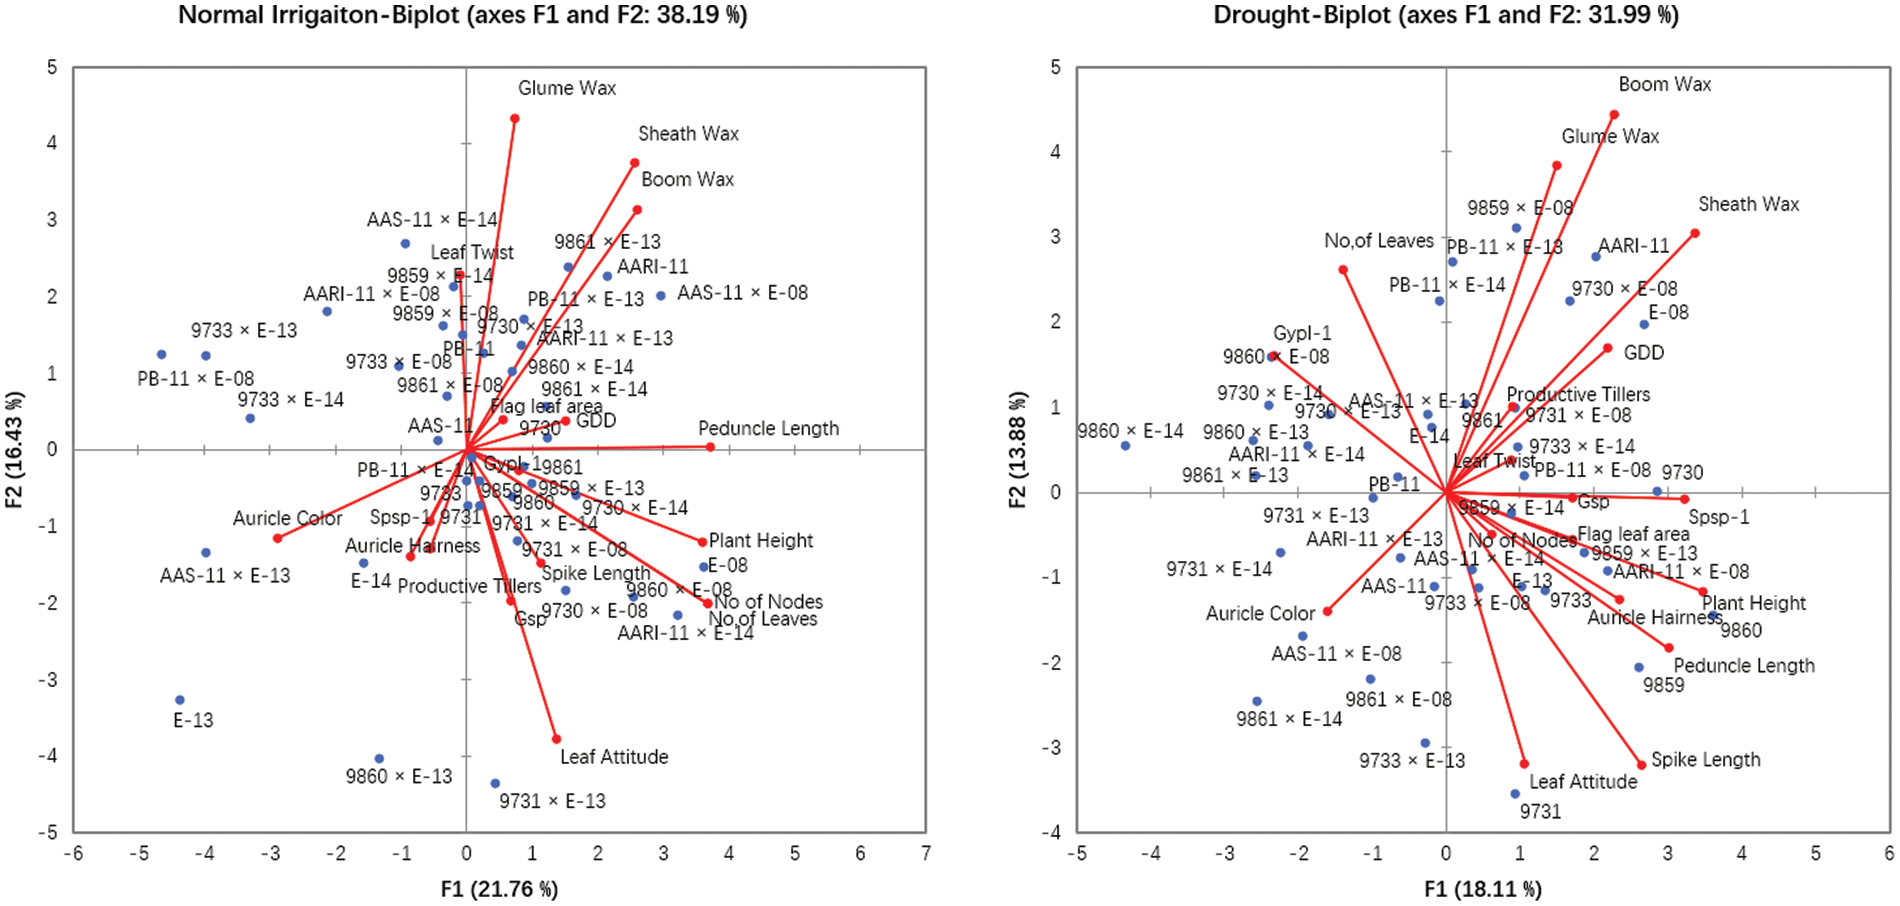
Figure 2: Principal component and Biplot analysis for parameters and varietal comparison under normal irrigation (Left) and drought (Right)
3.4 Genetic Dissection (Additive, Dominance, and Degree of Dominance)
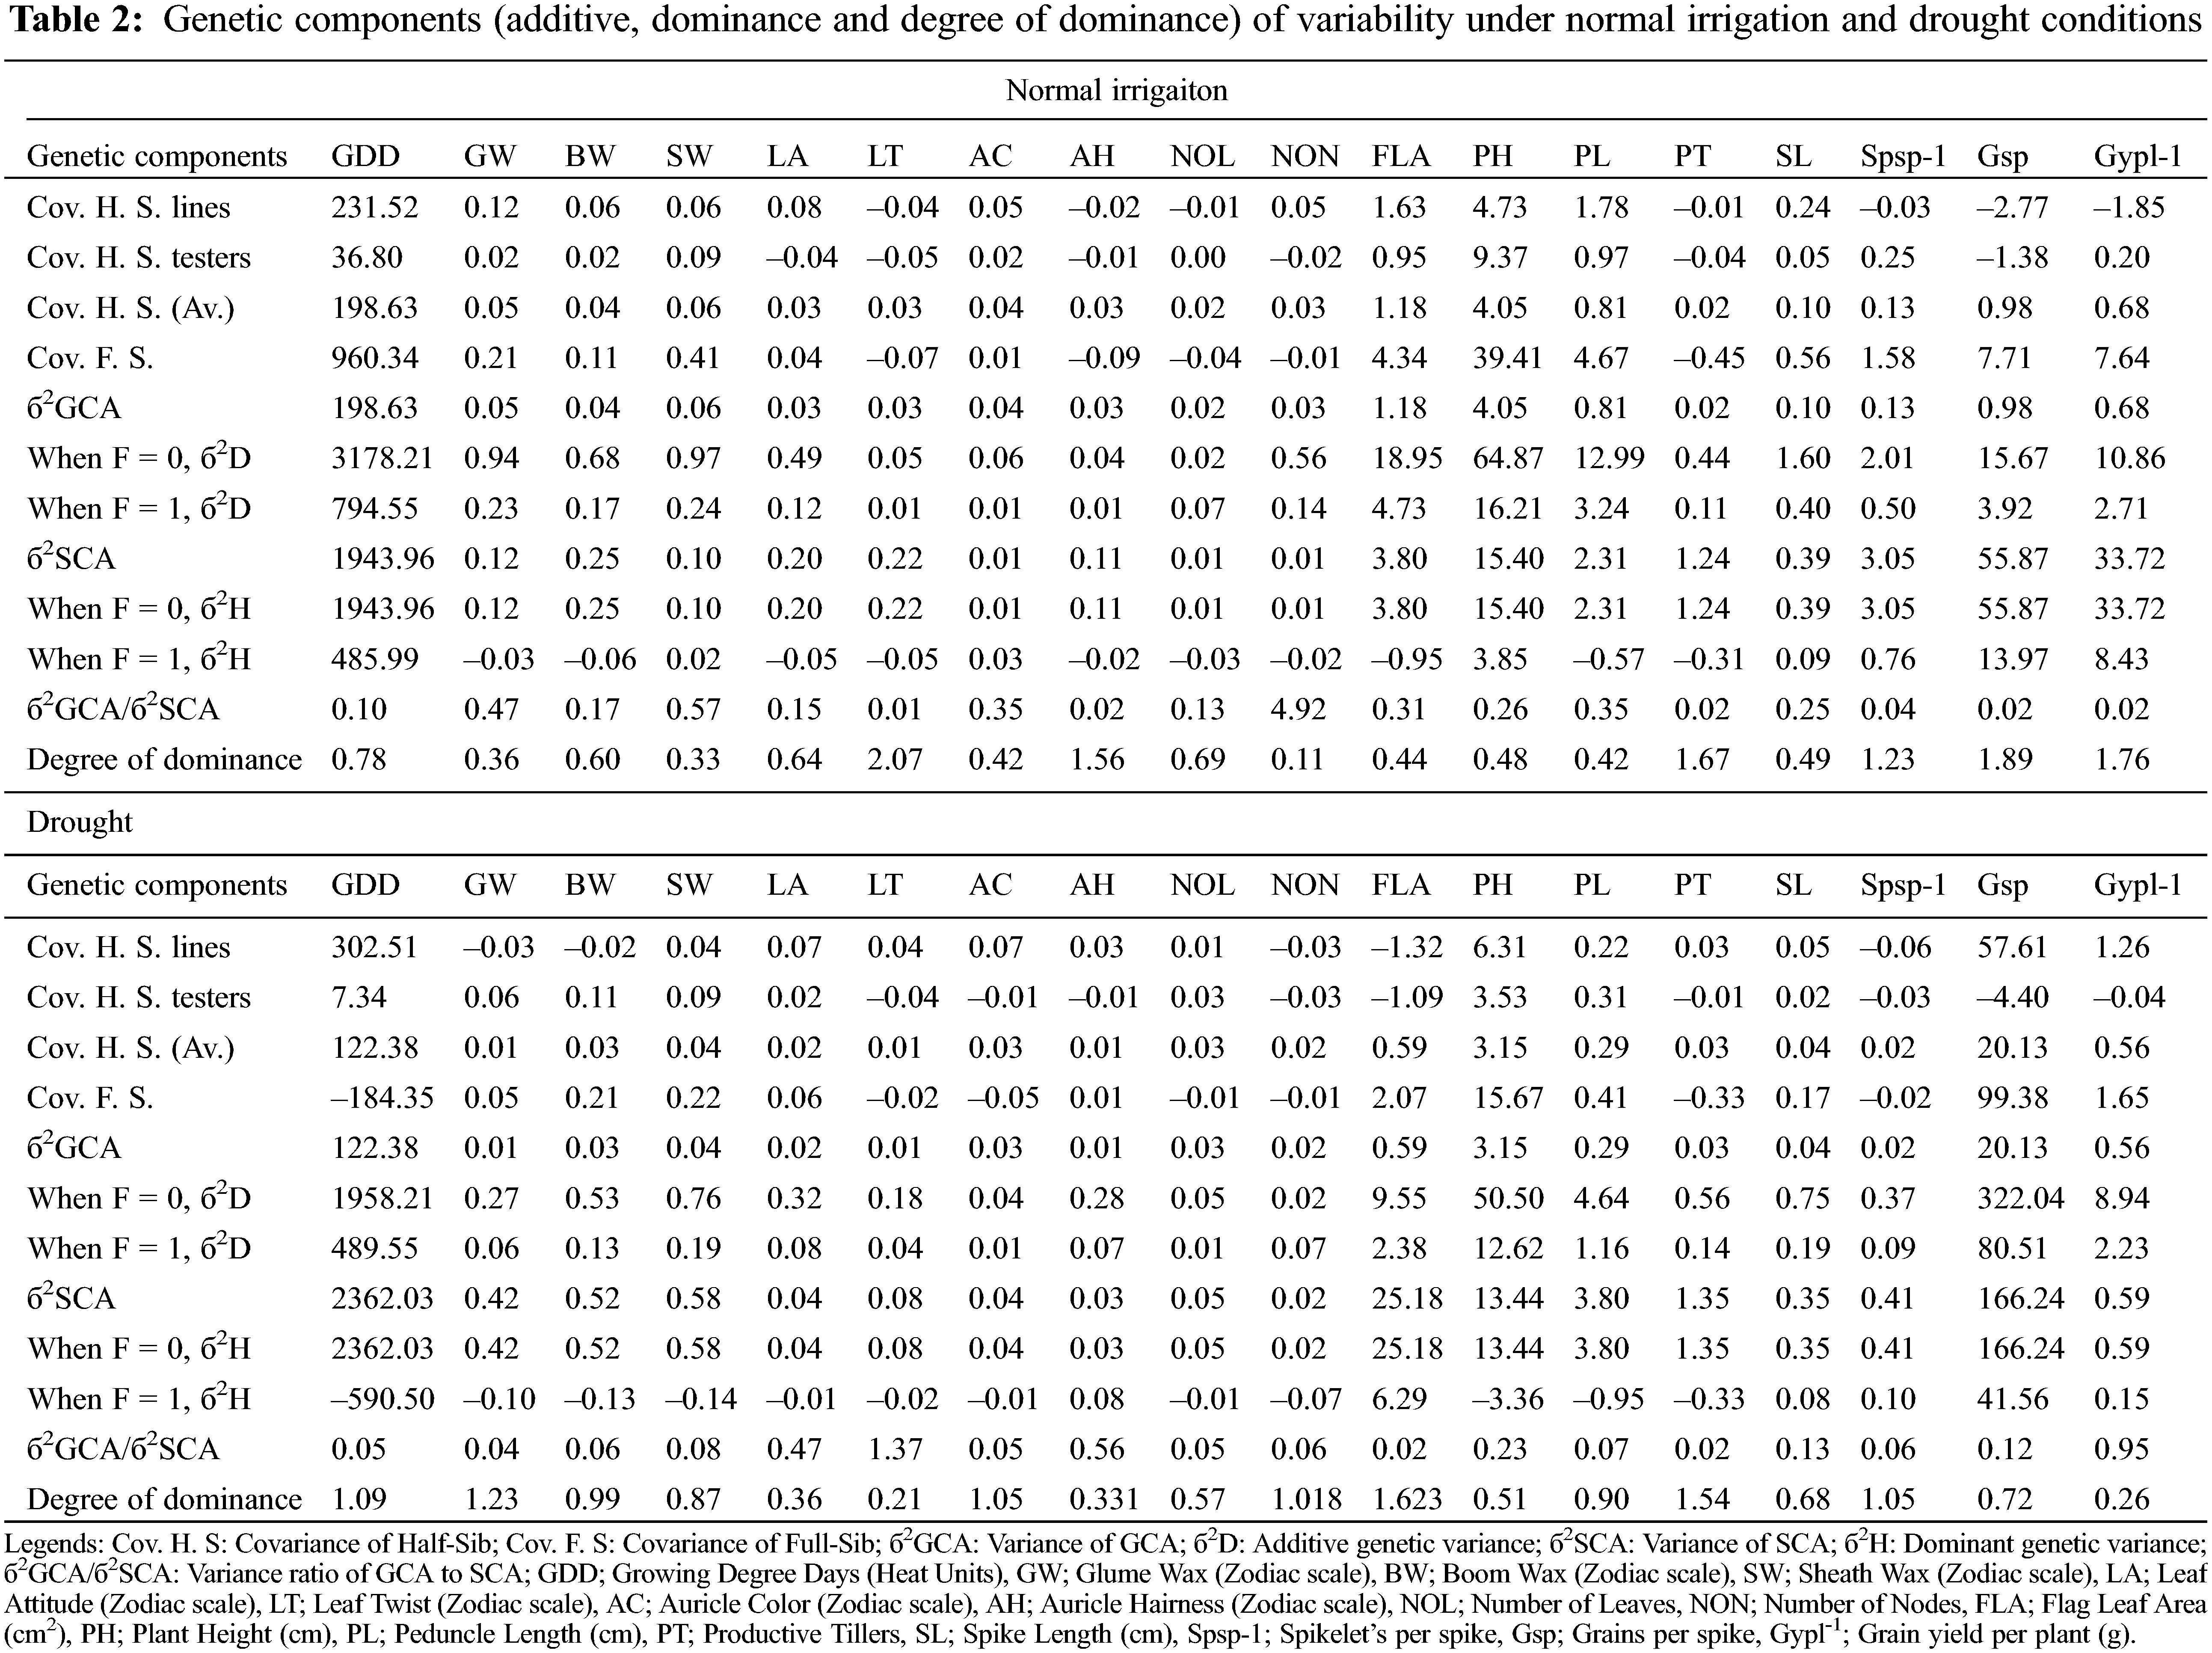
The genetic analysis via half-sib and full-sib approaches identifies that SCA variance was dominant over GCA variance for all the characters under study except for auricle color, and the number of leaves under normal irrigation (Table 2). The preponderance of additive genetic effects in the normal irrigation group was positive and significant as escorted by additive and dominant genetic variances and confirmed by the degree of dominance for traits growing degree days to maturity, glume wax, boom wax, sheath wax, leaf attitude, auricle color, number of leaves, number of nodes, flag leaf area, plant height, peduncle length, and spike length [40]. Therefore, the phenotypic selection was more than effective in improving these traits. The magnitude of dominance effects for traits of leaf twist, auricle hairiness, productive tillers, Spikelets/spike, Grains/spike, and Grain yield/plant suggests that selection by the pedigree method is appropriate for improving these traits in wheat populations [51] under full irrigation conditions. The phenological and yield-related traits conditioned by dominant genetic effects in the normal irrigation group (leaf twist, auricle hairiness, Grains/spike, and Grain yield/plant) [52] were inversely controlled by additive genetic effects under drought [53]. While, the traits controlled by additive genetic effect in the normal irrigation group (growing degree days to maturity, glume wax, auricle color, number of nodes, and flag leaf area) were inversely controlled by dominant genetic effects under drought (Table 2) [54]. The genetic behavior of other traits (boom wax, sheath wax, leaf attitude, number of leaves, plant height, peduncle length, and spike length) was consistent and insensitive to drought treatment. The result was strengthened by the variance ratio of GCA to SCA as it was found to be less than unity for those traits [55]. It is associated with homozygosity and suggests the effectiveness of selection for improving these characters [56].
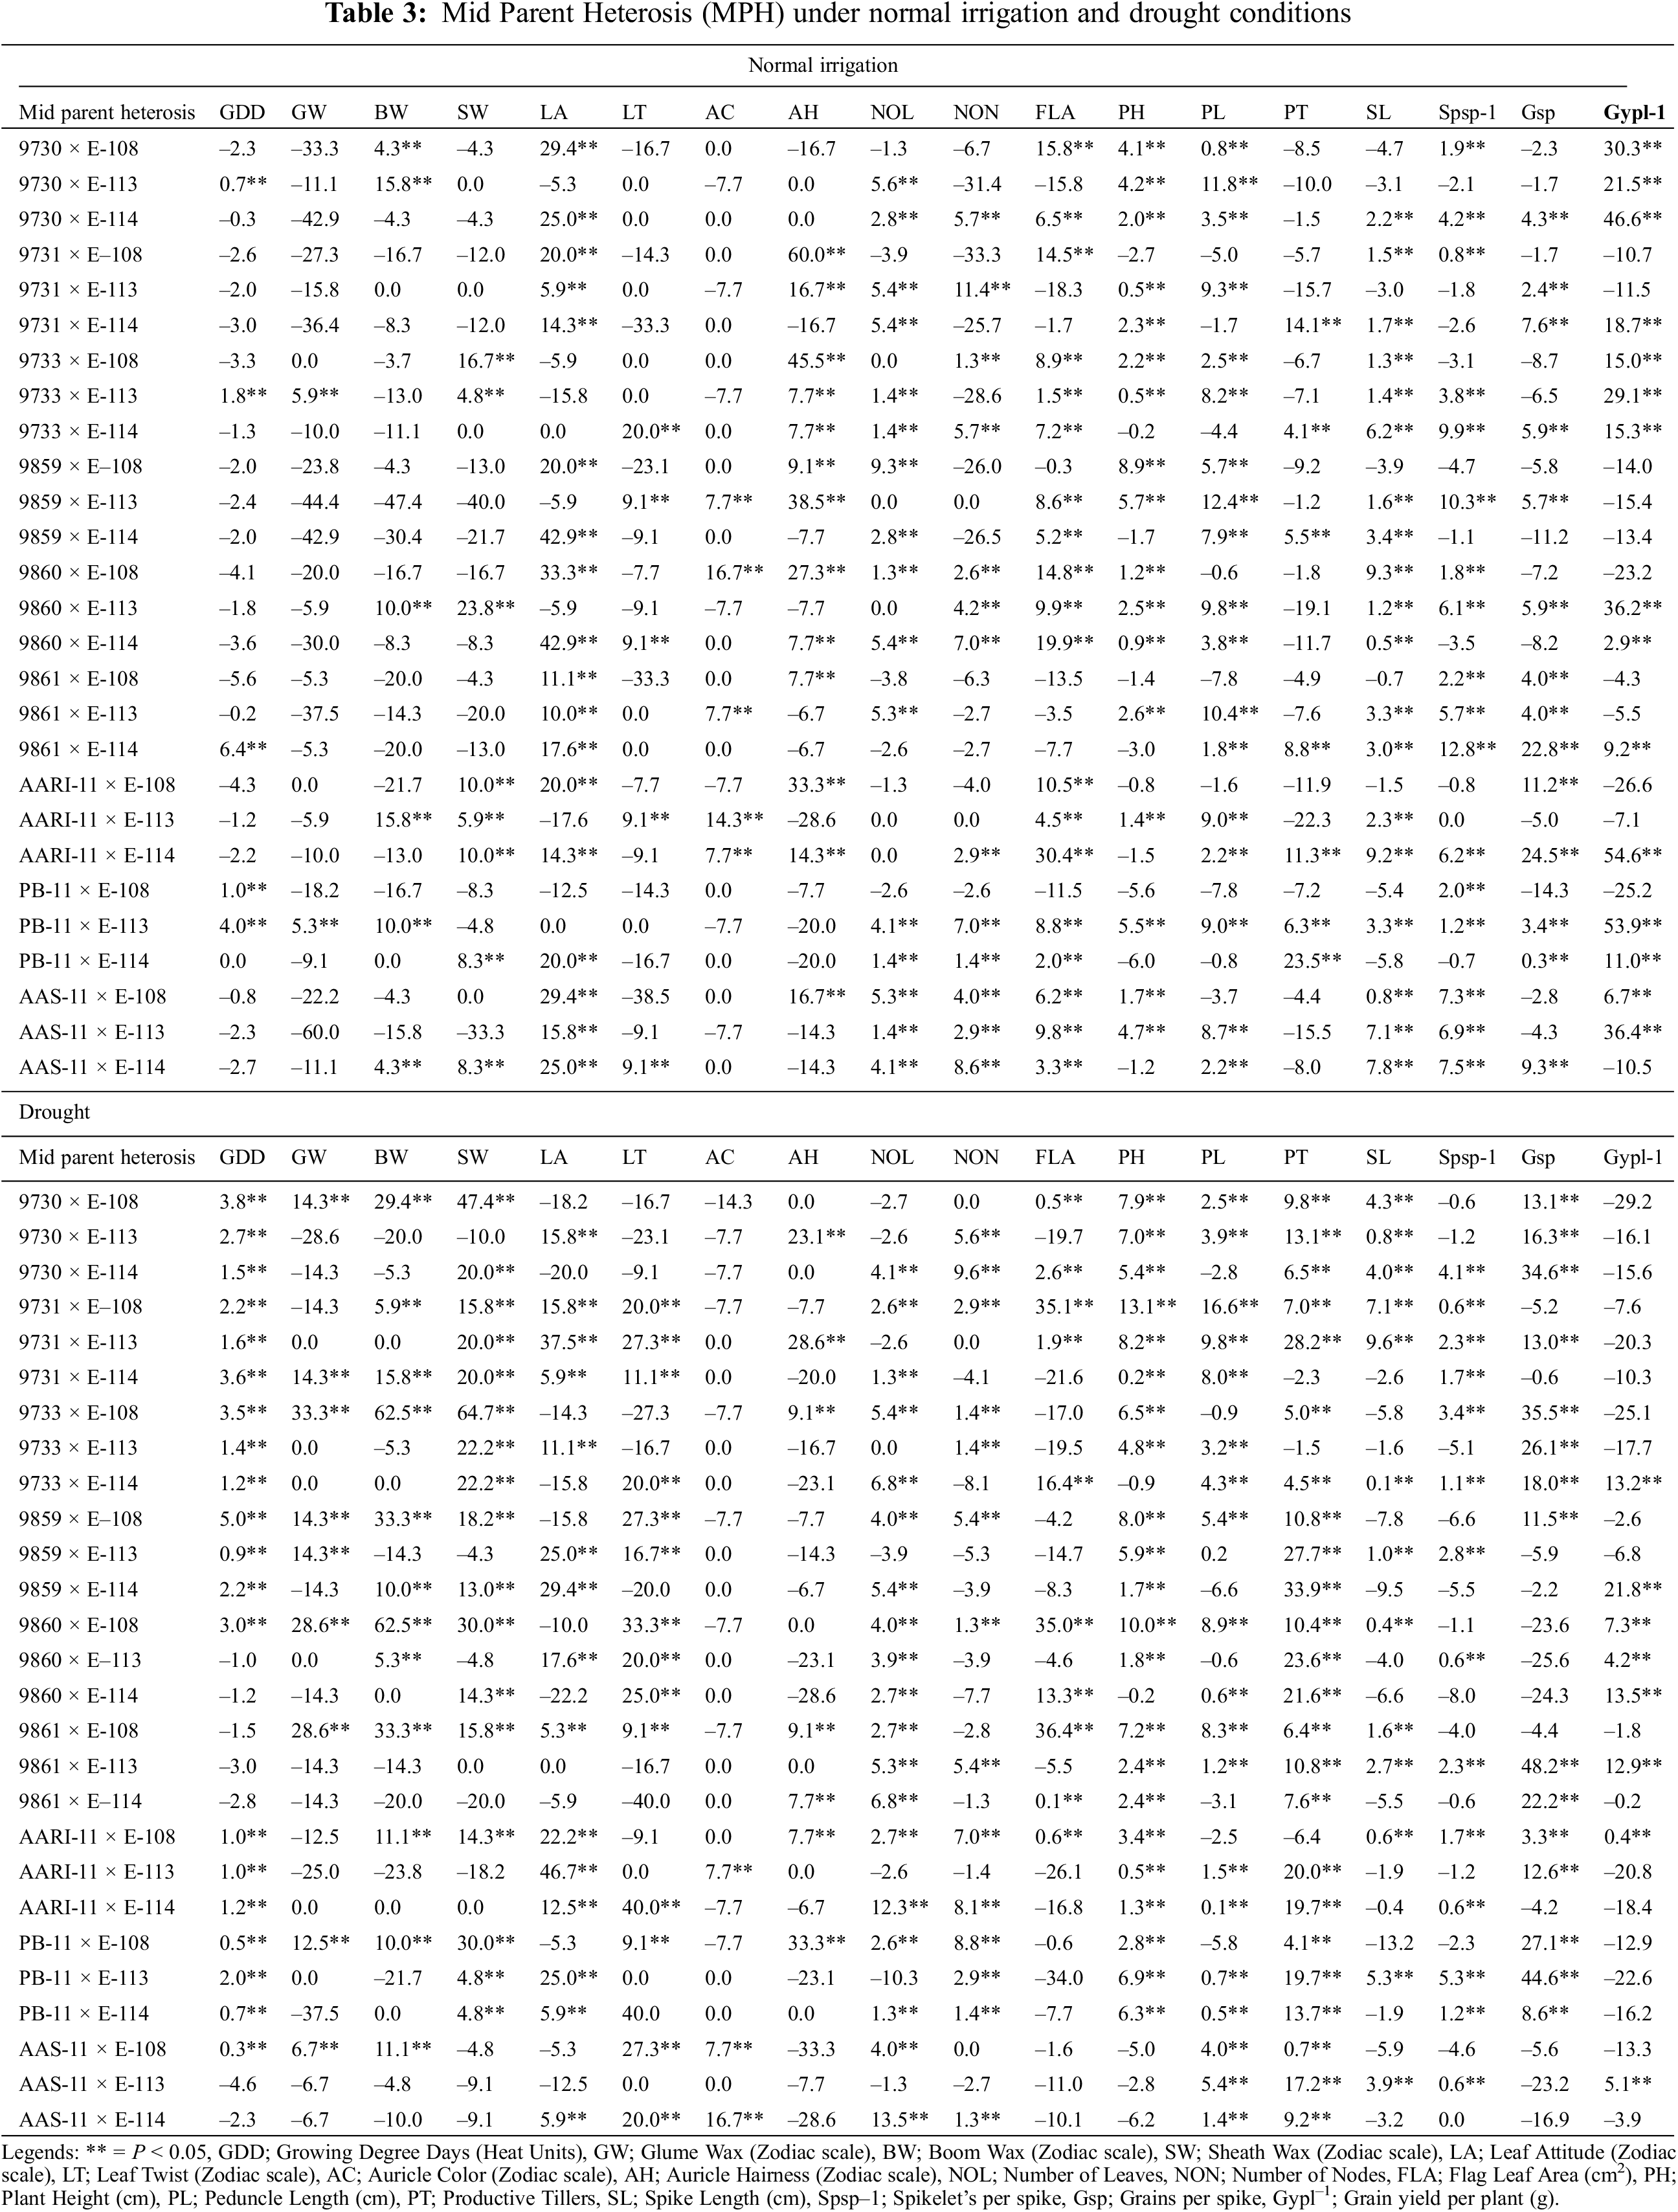
3.5 Evaluation of the Heterotic and Heterobeltiotic Potential of Wheat Genotypes
The expression of heterosis and efficiency of selection also largely depend upon the magnitude of genetic variability present in the plant populations. In wheat, the magnitude and nature of heterosis are used to help plant breeders identify superior wheat cross combinations that could produce desirable transgressive segregants in advanced generations for additional enrichment of grain yield and yield components. The comparison for significant highest heterotic (Mid Parent Heterosis (MPH); Table 3) and heterobeltotic (Better Parent Heterosis (BPH); Table 4) potential was made for traits in 27 cross combination’s under normal irrigation and drought. The highest MPH performances (Table 3) of cross combinations for phenological and yield traits under normal irrigation conditions were identified as: 9861 × E-114 for growing degree days to maturity (6.4%), 9733 × E-113 for GLUME WAX (5.9%), AARI-11 × E-113 and 9730 × E-113 for boom wax (15.8%), 9860 × E-113 for sheath wax (23.8%), 9859 × E-114 and 9860 × E-114 for leaf attitude (42.9%), 9733 × E-114 for leaf twist (20%), 9860 × E-108 for auricle color (16.7%), 9731 × E-108 for auricle hairiness (60%), 9859 × E-108 for number of leaves (9.3%), 9731 × E-113 for number of nodes (11.4%), 9730 × E-108 for flag leaf area (15.8%), 9859 × E-108 for plant height (8.9%), 9859 × E-113 for peduncle length (12.4 %), PB-11 × E-114 for productive tillers (23.5%), 9860 × E-108 for spike length (9.3%), 9861 × E-114 for Spikelets/spike (12.8%), AARI-11 × E-114 for Grains/spike (24.5%) and Grain yield/plant (54.9%), respectively. Ahmad and colleagues also identified heterotic potential of 28 F1 crosses for yield traits [57]. The better MPH performances of cross combinations for different phenological and yield traits under drought were: 9859 × E-108 for growing degree days to maturity (5%), 9733 × E-108 for glume wax (33.3%), 9733 × E-108 and 9860 × E-108 for boom wax (62.5%), 9733 × E-108 for sheath wax (64.7 %), AARI-11 × E-113 for leaf attitude (46.7%), AARI-11 × E-114 for leaf twist (40%), AAS-11 × E-114 for auricle color (16.7%), PB-11 × E-108 for auricle hairiness (33.3%), AARI-11 × E-114 for number of leaves (12.3%), 9730 × E-114 for number of nodes (9.6%), 9731 × E-108 for flag leaf area (35.1%), plant height (13.1%), and peduncle length (16.6%), 9859 × E-114 for productive tillers (33.9%), 9731 × E-113 for spike length (9.6%), PB-11 × E-113 for Spikelets per spike (5.3%), 9861 × E-113 for Grains/spike (48.2%) and 9859 × E-114 for Grain yield/plant (21.8%). The heterosis for grain yield per spike followed by tillers per plant and 1000-grain weight was independently associated with heterosis for grain yield in different water regimes and also depends on early and normal planting [58].
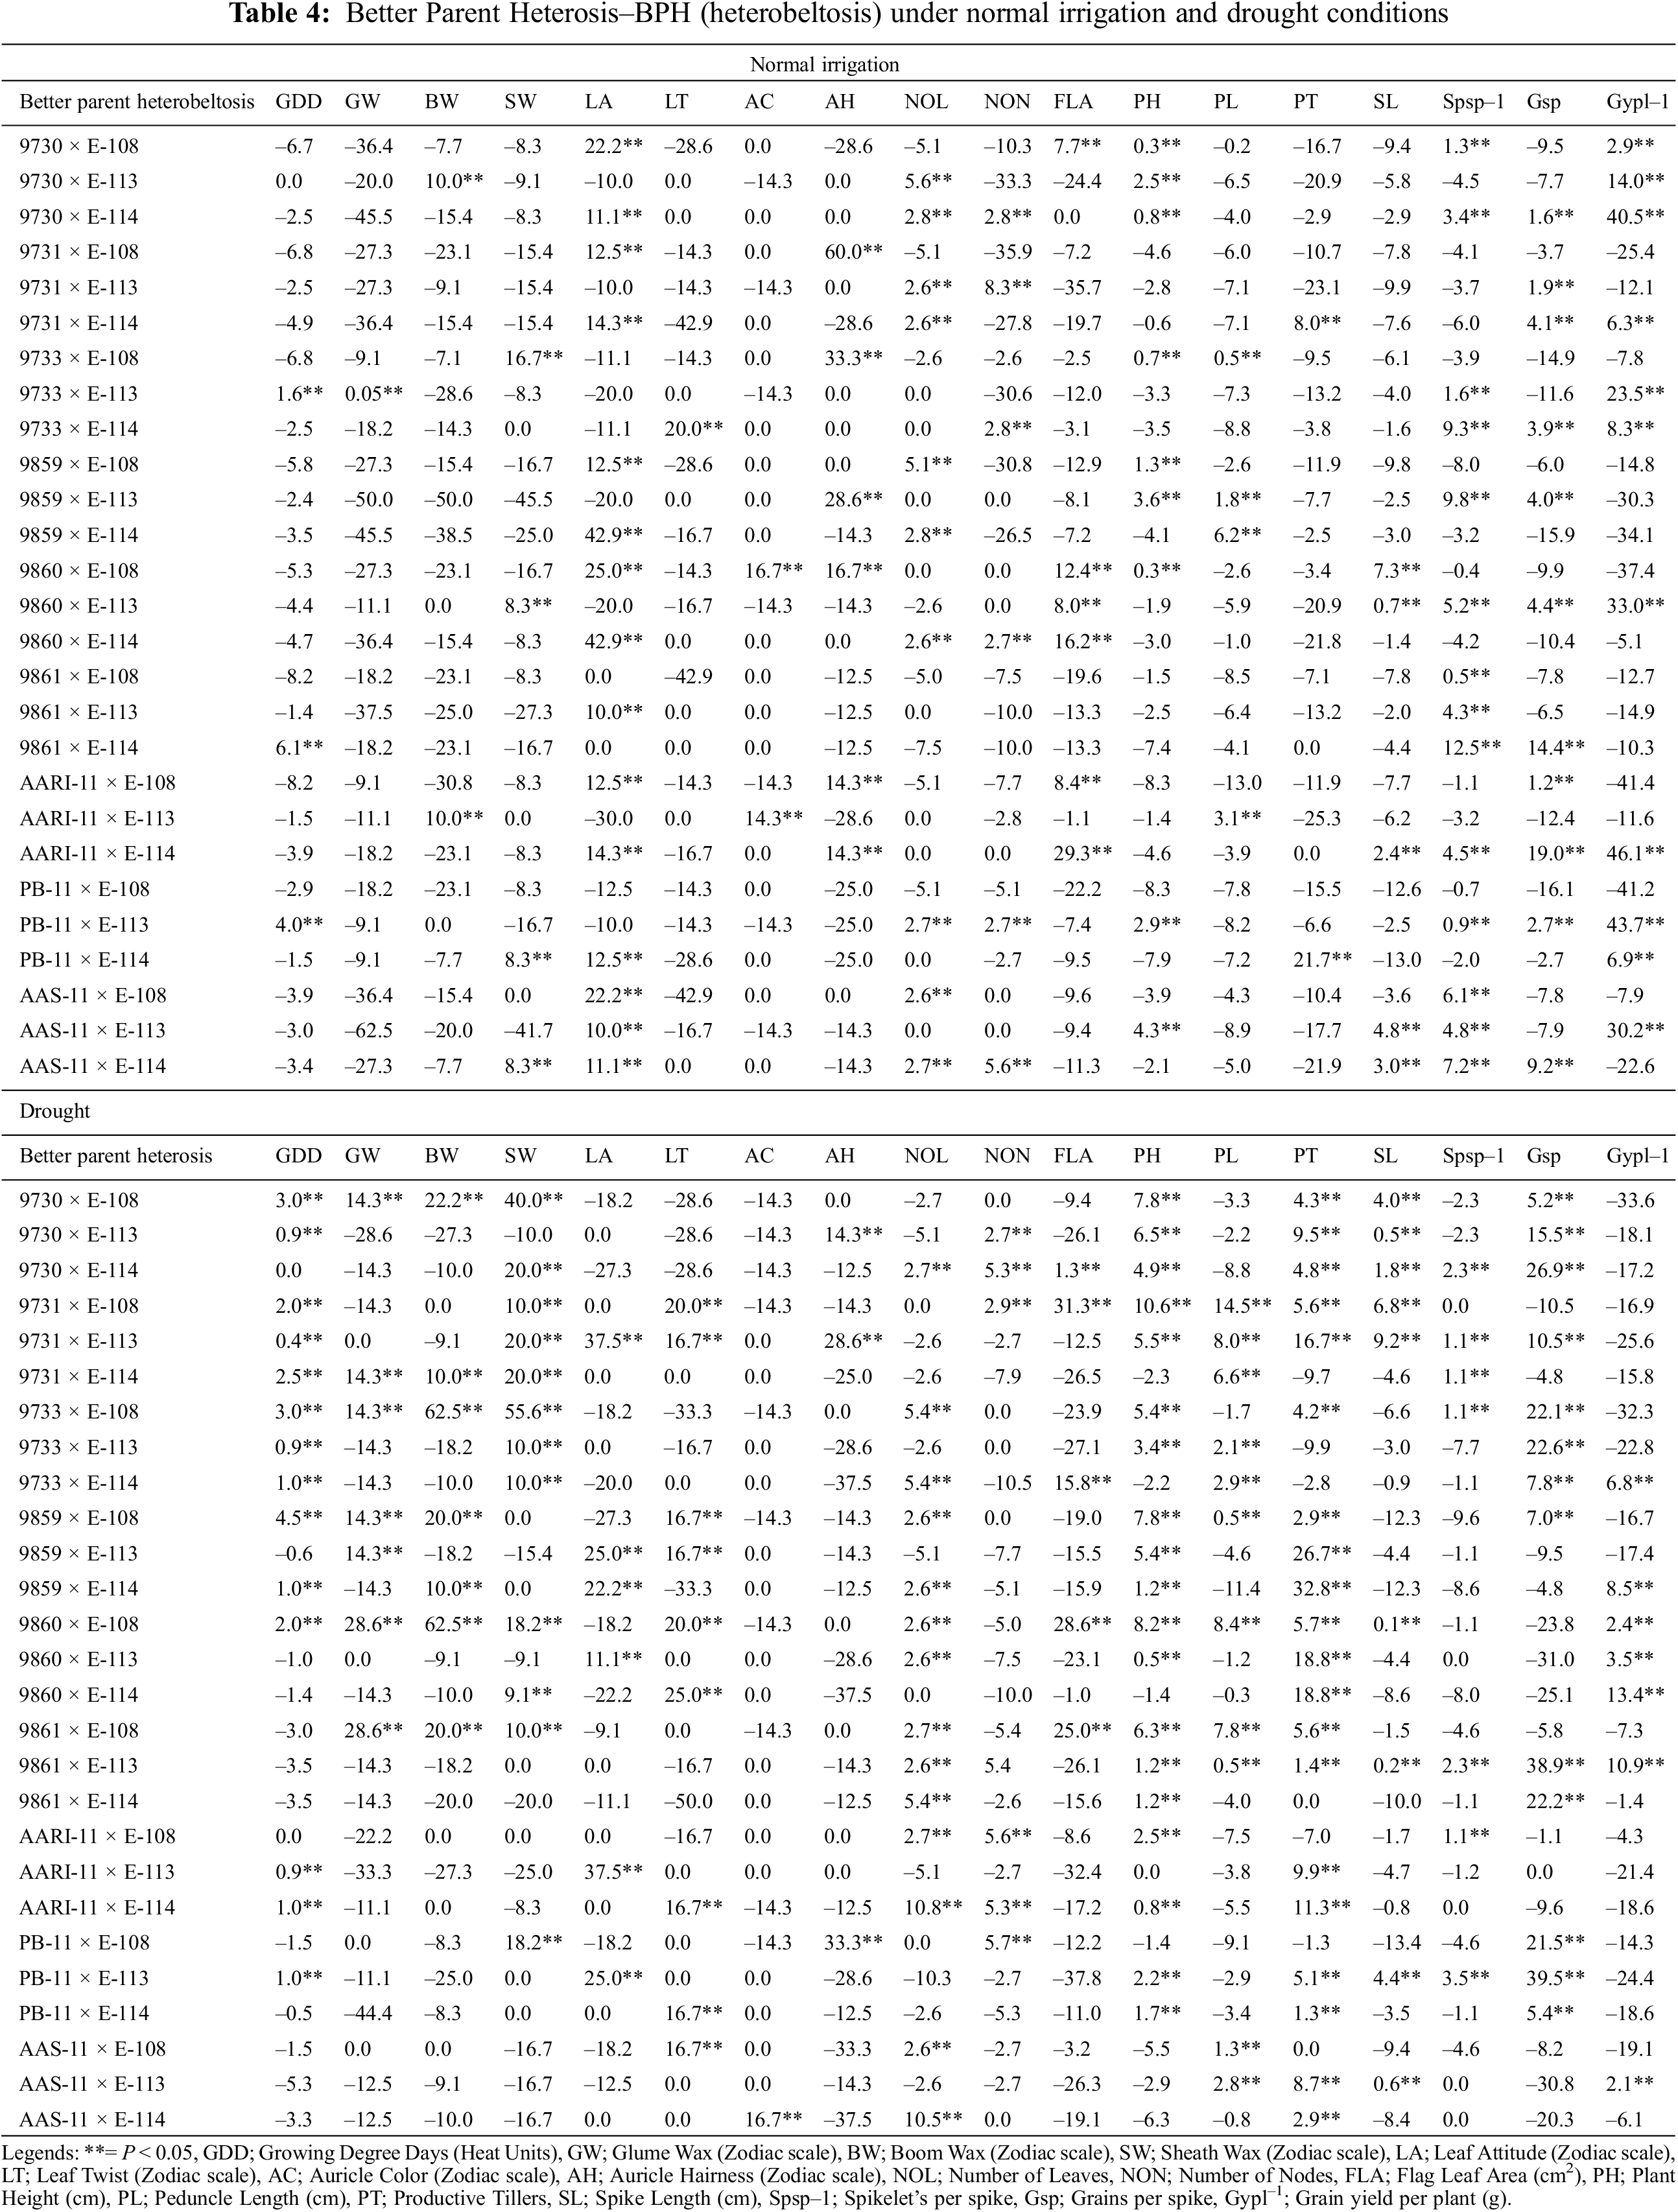
The significant highest heterobeltotic potential (BPH) of wheat genotypes under both water regimes was different (Table 4). Under normal irrigation conditions, the cross combination 9861 × E-114 performed better for growing degree days to maturity (BPH; 6.1%). Similarly, 9733 × E-113 for glume wax (0.05%), AARI-11 × E-113 and 9730 × E-113 has the highest value for boom wax, i.e., 10%, 9733 × E-108 for sheath wax (16.7%), 9860 × E-114 for leaf attitude (42.9%), 9733 × E-114 for leaf twist (20%), 9860 × E-108 for auricle color (16.7%), 9731 × E-108 for auricle hairiness (60%), 9730 × E-113 for number of leaves (5.6%), 9731 × E-113 for number of nodes (8.3%), AARI-11 × E-114 for flag leaf area (29.3%), AAS-11 × E-113 for plant height (4.3%), 9859 × E-114 for peduncle length (6.2%), PB-11 × E-114 for productive tillers (21.7%), 9860 × E-108 for spike length (7.3%), 9861 × E-114 for Spikelets/spike (12.5%), AARI-11 × E-114 for Grains/spike (19.0%) and Grain yield/plant (46.1%), respectively.
However, the BPH performances of genotypes in drought conditions was as follows: 9859 × E-108 for growing degree days to maturity (4.5%), 9860 × E-108 and 9861 × E-108 for glume wax (28.6%), 9733 × E-108 and 9860 × E-108 for boom wax (62.5%), 9733 × E-108 for sheath wax (55.6%), aari-11 × E-113 and 9731 × E-113 for leaf attitude (37.5%), 9860 × E-114 for leaf twist (25%), AAS-11 × E-114 for auricle color (16.7%), PB-11 × E-108 for auricle hairiness (33.3%) and number of nodes (5.7%), AARI-11 × E-114 for number of leaves (10.8%), 9731 × E-108 for flag leaf area (31.3%), plant height (10.6%) and peduncle length (14.5%), 9859 × E-114 for productive tillers (32.8%), 9731 × E-113 for spike length (9.2%), PB-11 × E-113 for Spikelets per spike (3.5%) and Grains/spike (39.5%) and 9860 × E-114 Grain yield/plant (13.4%). The positive mid parent and better parent heterosis for yield components, Grains/spike and 1000 grain weight was reported previously by Wheat breeders [59,60] and also in other crops [61].
3.6 The Proportional Contribution of Lines, Testers, and Cross Combinations in Total Variability
The relative contribution of genotypes indicated that line × tester interactive effects were the major contributing partner under different water regimes. Lines performed better for traits (growing degree days to maturity, auricle color, plant height, Grains/spike, and Grain yield/plant) under drought. The contribution of testers was evident for plant height under normal irrigation (Table S2). The testers were characterized by waxiness (glume wax, boom wax, and sheath wax), which appeared subsequently in the F1 crosses. Among parents, E-108, 9861 performed better in drought, while 9730, AARI-11 performed better in both water regimes (Fig. 2). The hybrid combinations 9733 × E-113 and PB-11 × E-113 have better MPH potential under normal irrigation. AAS-11 × E-114 has better MPH and BPH under normal irrigation. The combinations 9731 × E-108, 9861 × E-108, and AARI-11 × E-108 have better MPH (Table 3) under drought, while 9731 × E-113 and 9860 × E-108 have better MPH and BPH for most of the studied traits under drought. The combinations 9730 × E-114 and AARI-11 × E-114 have effective MPH and BPH under both water regimes (Table 4). Hence, parents E-108, 9730, AARI-11, 9861, and cross combinations 9730 × E-114, and 9860 × E-108 could be recommended for improved yield and enhanced biological production of wheat under drought.
3.7 Genetic Variability, Heritability, and Genetic Advance
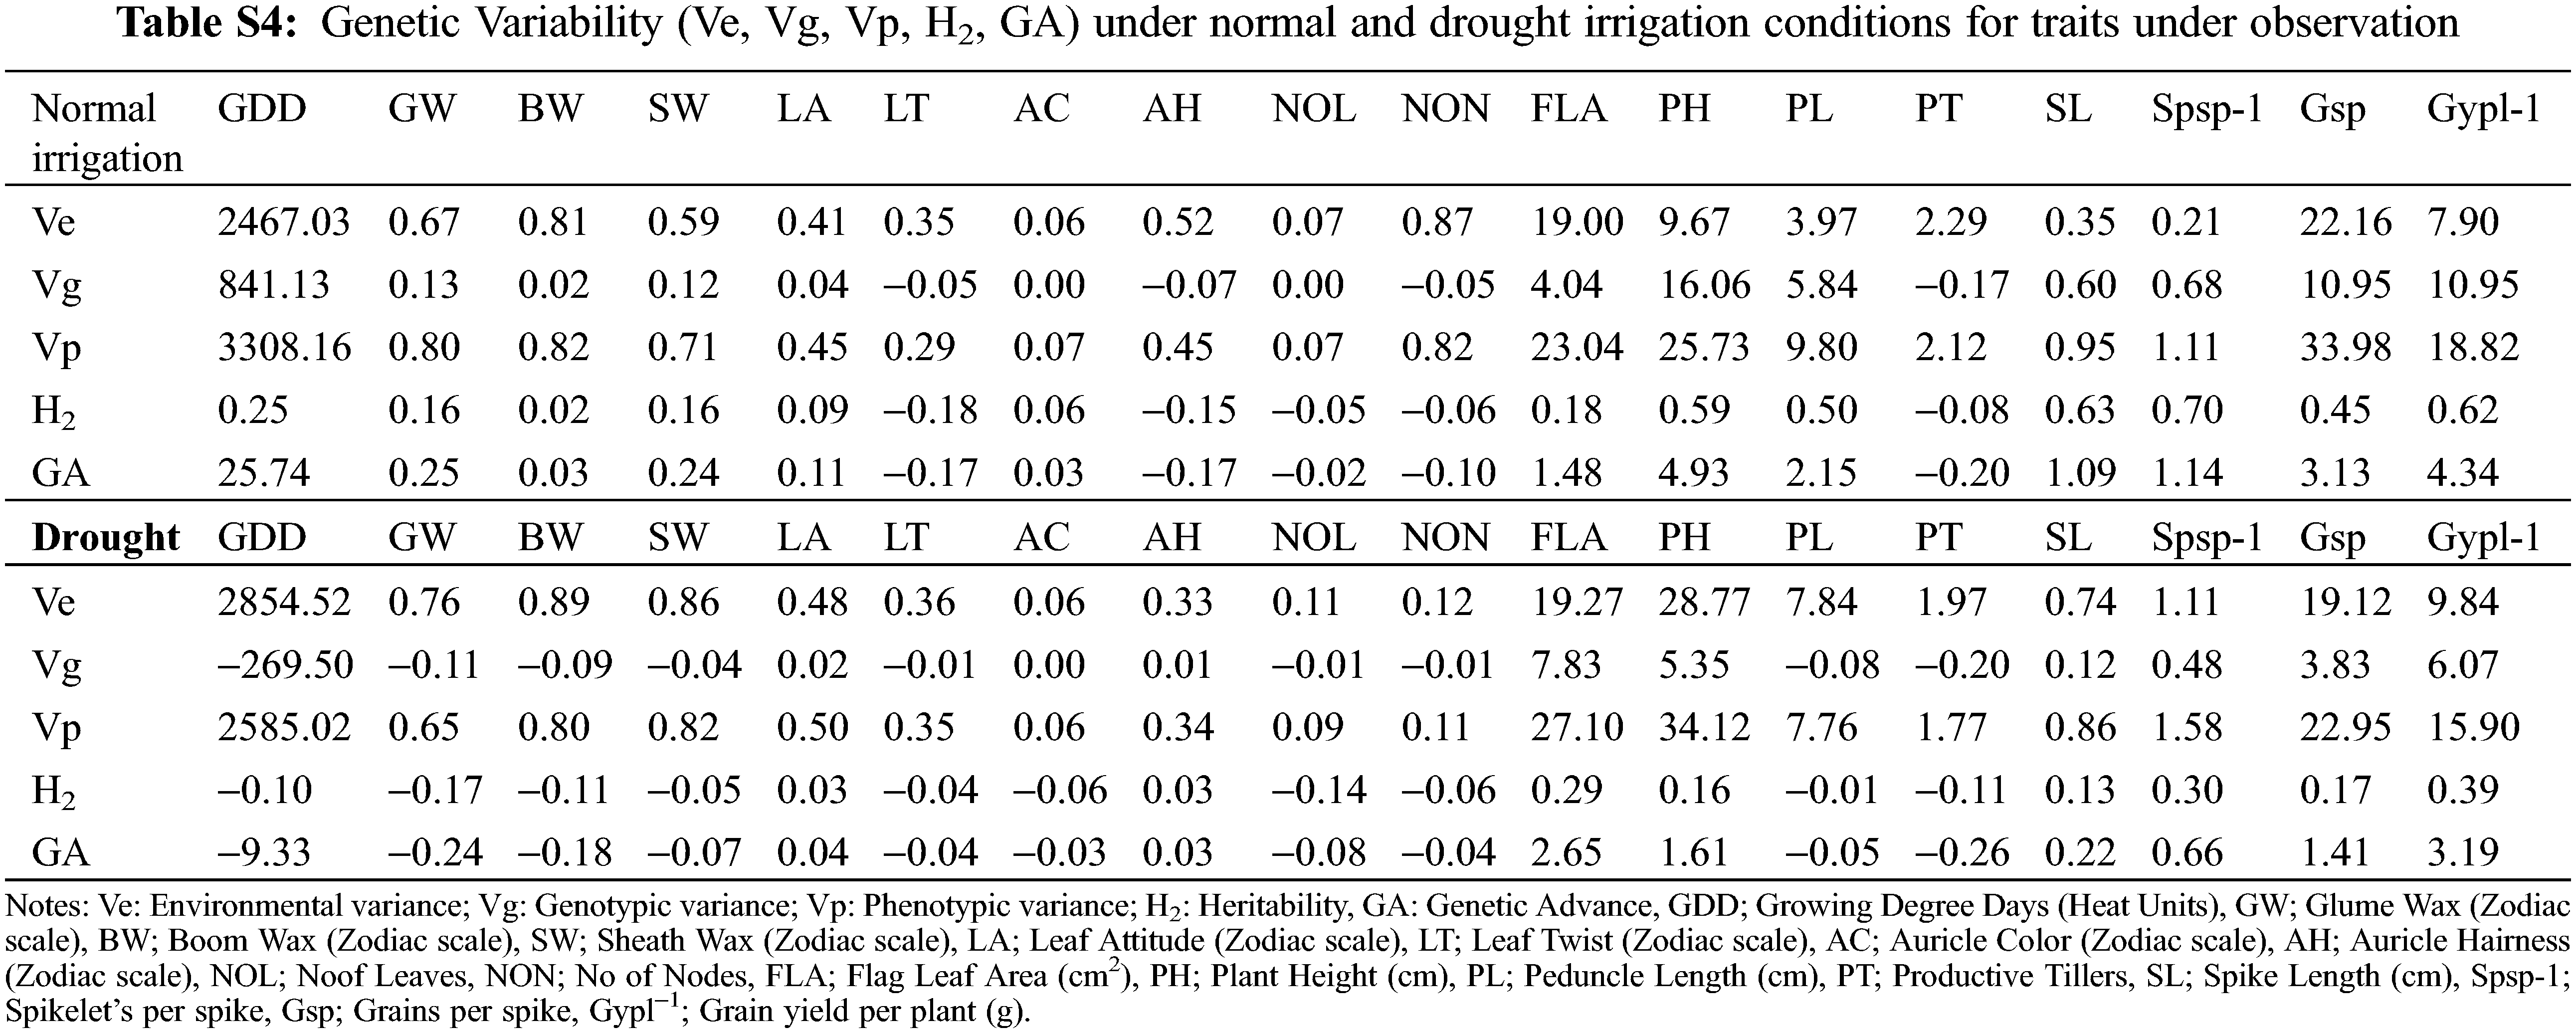
The identification of gene action and environmental roles for the inheritance of phenological traits is an important aspect. Interestingly, the magnitude of environmental variance (Ve) was dominated over genotypic (Vg) for the expression of total phenotypic variability (Vp) for the majority of phenological traits except for plant height, peduncle length, spike length, Spikelets/spike, and Grain yield/plant under normal irrigation conditions (Table S4). Both dominant and additive types of gene action exist for inheritance. The probabilities of the estimated trait being transferred into the next generation were below 50% for the majority of traits except for plant height, peduncle length, spike length, Spikelets/spike, and Grain yield/plant were moderate to high heritability was observed under normal irrigation conditions (Fig. 3). The negative heterosis for wheat phenological traits (growing degree days to maturity) is a generally desirable and useful parameter under drought [52]. The findings of Kumar were in concurrence for days to heading [62]. while Yadav et al. identified different results [63]. The genetic advance (GA) when computed, revealed that the values were relatively low (<1) for most of the phenological traits. Meanwhile, they were moderate to high (>1) for yield-related metric traits (growing degree days to maturity, flag leaf area, plant height, peduncle length, spike length, spikelets per spike, grains/spike, and grain yield/plant) under normal irrigation [64]. Under drought, the low GA for leaf attitude, auricle hairiness, spike length, and spikelets/spike was observed, while it was moderate to high for traits flag leaf area, plant height, Grains/spike, and Grain yield/plant [65].
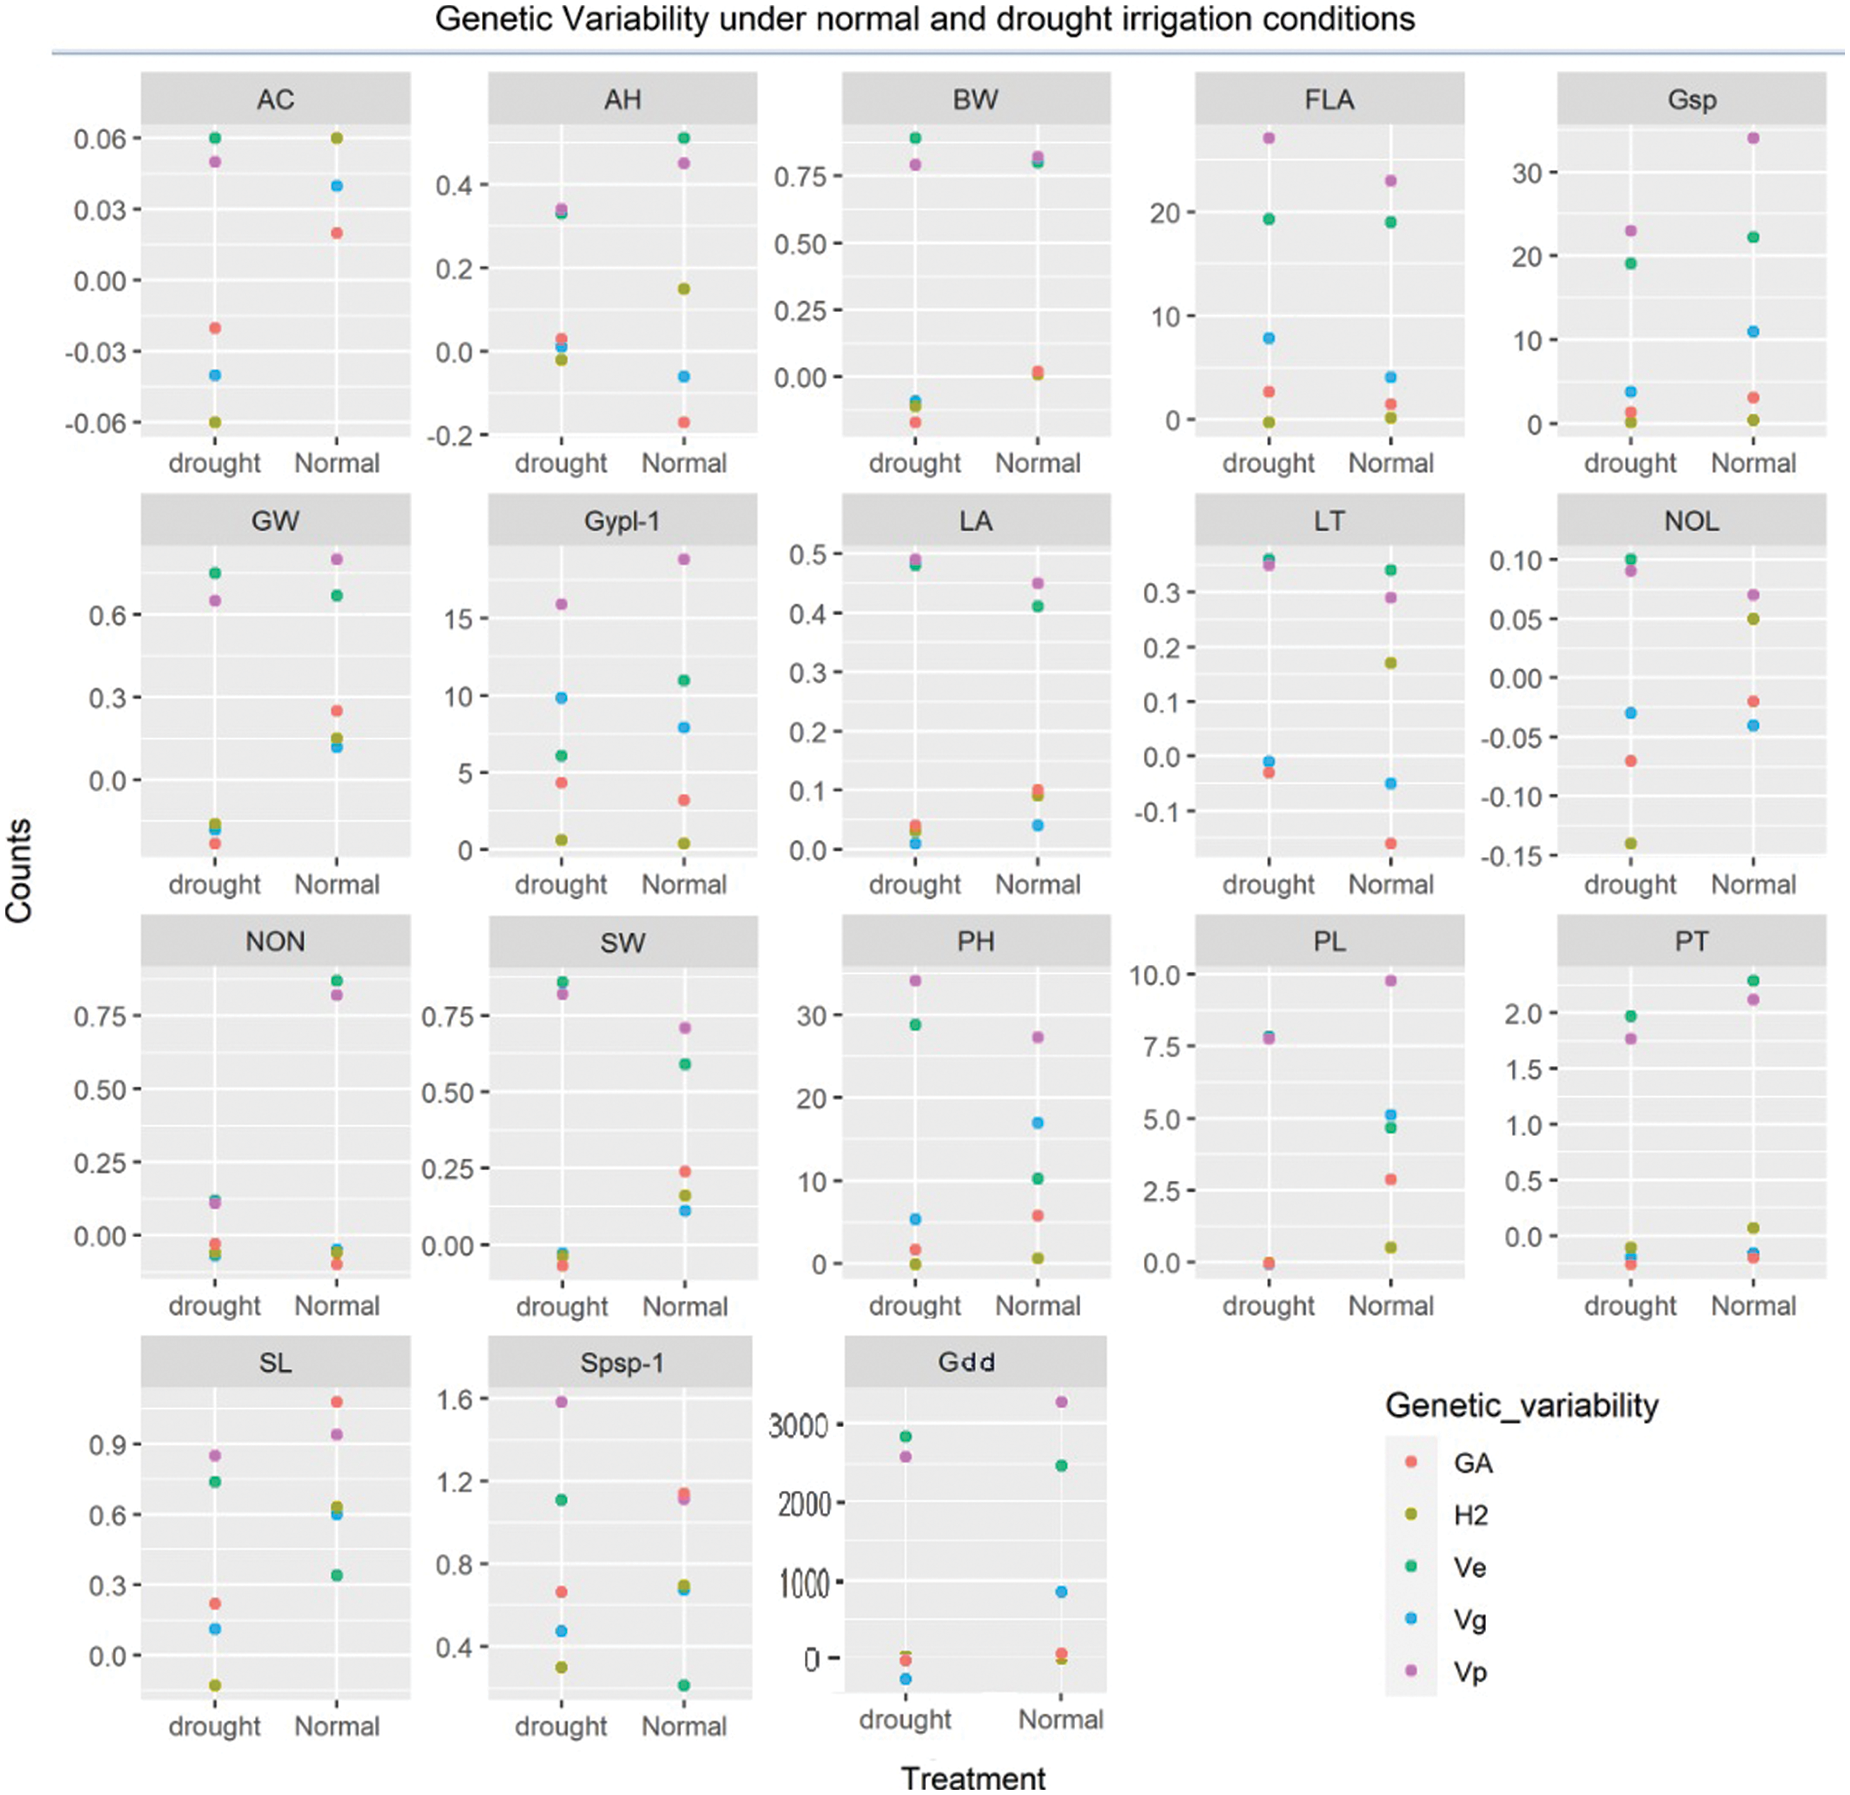
Figure 3: Genetic advance, heritability, and variances (environmental, genotypic and phenotypic) under different water regimes
Shamuyarira reported low GA for DTM, Spikelets/spike, and TGW, the GA for Grain yield/plant was 6.84% under drought and 17.12% under non-stressed conditions which were in concurrence with to present study [38]. Alternatively, low GA for Grain yield/plant, medium for Spikelets/spike, and high for Grains/spike were observed by Erkul and colleagues [46]. Implying environmental significant role in the inheritance of studied traits. A wide range of adaptations and mitigation strategies are required to cope with such impacts and meanwhile, adaptations to abiotic factors could serve as an important indirect criterion for yield enhancement.
This study focuses on secondary phenological and yield–related metric–traits measurement and their indirect role in the behavioral response of germplasm under full–irrigation and drought conditions. Genetic analysis showed that the means of all generations decreased by drought except for traits of leaf attitude, leaf twist, flag–leaf area, auricle color, auricle hairiness, number of leaves, and nodes. The association studies disclosed that the trait growing degree days (heat–units) greatly influence spikelets and grains per spike, especially under drought. The projection of traits on PC1 and PC2 revealed significant PCs (first–seven) accounted for 79.9% and 73.9% of total variability with a difference of 3.65% in F1 and 2.55% in F2 under normal irrigation and drought, respectively. The Grain yield/plant was decreased with a clear reduction from 17.44 g to 13.25 g under drought. The genetic dissection (additive, dominance, and degree of dominance) depicted that the phenological and yield–related traits conditioned by dominant genetic effects under normal irrigation (leaf twist, auricle hairiness, Grains/spike, and Grain yield/plant) were inversely controlled by additive genetic effects under drought [53,54]. While, the traits conditioned by additive genetic–effect under normal irrigation (growing degree days to maturity, glume wax, auricle color, number of nodes, and flag leaf area) were inversely controlled by dominant genetic effects under drought. While, the genetic behavior of traits (boom wax, sheath wax, leaf attitude, number of leaves, plant height, peduncle length, and spike length) was consistent and insensitive. The investigated yield traits showed complex genetic behaviour. The magnitude of dominance effects for traits of leaf twist, auricle hairiness, productive tillers, Spikelets per spike, Grains/spike, and Grain yield/plant suggests that selection by the pedigree method is appropriate for improving these traits under normal irrigation conditions and could serve as an indirect selection index for improving yield–oriented traits in wheat populations for drought tolerance. however, the phenotypic selection could be more than effective for traits conditioned by additive genetic effects under drought. The magnitude of environmental variance (Ve) was seem dominated over genotypic (Vg) for the expression of total phenotypic variability (Vp) for the majority of phenological traits except for plant height, peduncle length, spike length, Spikelets/spike, and Grain yield/plant. The probabilities of the estimated trait being transferred into the next generation were below 50% for the majority of traits except for plant height, peduncle length, spike length, Spikelets/spike, and Grain yield/plant were moderate to high heritability confronted by moderate to high genetic advance (>1). Based on heterotic and heterobeltiotic potential, five cross combinations (9861 × E-113, 9859 × E-114, 9860 × E-114, PB-11 × E-113, and AARI-11 × E-114) are recommended for efficient yield and phenological traits in a future wheat breeding program.
Author Contribution Statement: Muhammad Umer Farooq: Design and conceived research, Data collection, Formal analysis, Writing original drafts, Editing, and reviewing. Iqra Ishaaq: Conducted experiment, Wrote original draft, Discussion & data curation. Syeda Anjum Tahira: Reviewing and editing, Saira Bano: Writing resultsand editing, Rizwana Maqbool: Reviewing, Celaleddin Barutcular: Reviewing. Muhammad Yasir: Formal analysis. Zaid Ulhassan: Reviewing and editing. Ghassan Zahid: Reviewing, Anshu Rastogi: Reviewing and editing, Muhammad Ahsan Asghar: Reviewing. Sajad Hussain: Reviewing, Kocsy Gabor: Reviewing, Jianqing Zhu: Reviewing.
Funding Statement: The authors received no specific funding for this study.
Conflicts of Interest: The authors declare that they have no conflicts of interest to report regarding the present study.
References
1. FAO (2019). Crops and livestock products. [Google Scholar]
2. El-Hendawy, S. E., Hassan, W. M., Al-Suhaibani, N. A., Schmidhalter, U. (2017). Spectral assessment of drought tolerance indices and grain yield in advanced spring wheat lines grown under full and limited water irrigation. Agricultural Water Management, 182(1), 1–12. DOI 10.1016/j.agwat.2016.12.003. [Google Scholar] [CrossRef]
3. Schmidt, J., Claussen, J., Wörlein, N., Eggert, A., Fleury, D. et al. (2020). Drought and heat stress tolerance screening in wheat using computed tomography. Plant Methods, 16(1), 1–12. DOI 10.1186/s13007-020-00565-w. [Google Scholar] [CrossRef]
4. Reynolds, M., Pask, A., Mullan, D. (2012). Physiological breeding I: Interdisciplinary approaches to improve crop adaptation. CIMMYT. [Google Scholar]
5. Alexandratos, N., Bruinsma, J. (2012). World agriculture towards 2030/2050: The 2012 revision. DOI 10.22004/ag.econ.288998. [Google Scholar] [CrossRef]
6. Lei, Y., Zhang, H., Chen, F., Zhang, L. (2016). How rural land use management facilitates drought risk adaptation in a changing climate—A case study in arid northern China. Science of the Total Environment, 550, 192–199. [Google Scholar]
7. Ali, M., Abdul-Hamid, M. (2017). Yield stability of wheat under some drought and sowing dates environments in different irrigation systems. Zagazig Journal of Agricultural Research, 44(3), 865–886. DOI 10.21608/zjar.2017.52284. [Google Scholar] [CrossRef]
8. Ali, M. M. A. EH., Mansour, E., Awaad, H. A. (2021). Drought tolerance in some field crops: State of the art review. In: Awaad, H., Abu-Hashim M., Negm A. (Eds.Mitigating environmental stresses for agricultural sustainability in Egypt, pp. 17–62. Cham: Springer Water, Springer International Publishing. [Google Scholar]
9. Weldearegay, D., Yan, F., Jiang, D., Liu, F. (2012). Independent and combined effects of soil warming and drought stress during anthesis on seed set and grain yield in two spring wheat varieties. Journal of Agronomy and Crop Science, 198(4), 245–253. DOI 10.1111/j.1439-037X.2012.00507.x. [Google Scholar] [CrossRef]
10. El-Hendawy, S. E., Al-Suhaibani, N. A., Elsayed, S., Hassan, W. M., Dewir, Y. H. et al. (2019). Potential of the existing and novel spectral reflectance indices for estimating the leaf water status and grain yield of spring wheat exposed to different irrigation rates. Agricultural Water Management, 217, 356–373. [Google Scholar]
11. Lv, G. C., Cheng, Z. G., Li, F. M., Akram, N. A., Xiong, Y. C. (2019). Comparative response to drought in primitive and modern wheat: A cue on domestication. Planta, 250(2), 629–642. DOI 10.1007/s00425-019-03188-1. [Google Scholar] [CrossRef]
12. Gui, Y. W., Sheteiwy, M. S., Zhu, S. G., Batool, A., Xiong, Y. C. (2021). Differentiate effects of non-hydraulic and hydraulic root signaling on yield and water use efficiency in diploid and tetraploid wheat under drought stress. Environmental and Experimental Botany, 181, 104287. [Google Scholar]
13. Moustafa, E. S., Ali, M., Kamara, M. M., Awad, M. F., Hassanin, A. A. et al. (2021). Field screening of wheat advanced lines for salinity tolerance. Agronomy, 11(2), 281. [Google Scholar]
14. Mansour, H. A., Mohamed, S. E. S., Lightfoot, D. A. (2020). Molecular studies for drought tolerance in some Egyptian wheat genotypes under different irrigation systems. Open Agriculture, 5(1), 280–290. [Google Scholar]
15. Emon, R. M., Ahammed, G. J. (2020). Germplasm and genetic diversity studies in rice for stress response and quality traits. Rice Research for Quality Improvement: Genomics and Genetic Engineering, pp. 47–60. Springer. [Google Scholar]
16. Fellahi, Z. E. A., Hannachi, A., Bouzerzour, H. (2018). Analysis of direct and indirect selection and indices in bread wheat (Triticum aestivum L.) segregating progeny. International Journal of Agronomy, 2018, 8312857. [Google Scholar]
17. Seghatoleslami, M., Kafi, M., Majidi, E. (2008). Effect of deficit irrigation on yield, WUE and some morphological and phenological traits of three millet species. Pakistan Journal of Botany, 40(4), 1555–1560. [Google Scholar]
18. Shahryari, R., Mahfoozi, B., Mollasadeghi, V., Khayatnezhad, M. (2011). Genetic diversity in bread wheat for phenological and morphological traits under terminal drought stress condition. Advances in Environmental Biology, 5(1), 169–173. [Google Scholar]
19. Vaezi, B., Bavei, V., Shiran, B. (2010). Screening of barley genotypes for drought tolerance by agro-physiological traits in field condition. African Journal of Agricultural Research, 5(9), 881–892. [Google Scholar]
20. Ramirez-Vallejo, P., Kelly, J. D. (1998). Traits related to drought resistance in common bean. Euphytica, 99(2), 127–136. DOI 10.1023/A:1018353200015. [Google Scholar] [CrossRef]
21. Mackay, T. F., Stone, E. A., Ayroles, J. F. (2009). The genetics of quantitative traits: Challenges and prospects. Nature Reviews Genetics, 10(8), 565–577. DOI 10.1038/nrg2612. [Google Scholar] [CrossRef]
22. Mather, K., Jinks, J. L. (2013). Biometrical genetics: The study of continuous variation. New York, NY: Springer. [Google Scholar]
23. Magda, E., El-Rahman, A. (2013). Estimation of some genetic parameters through generation mean analysis in three bread wheat crosses. Alexandria Journal of Agricultural Research, 58(3), 183–195. [Google Scholar]
24. Ahammed, G. J., Li, X., Yang, Y., Liu, C., Zhou, G. et al. (2020). Tomato WRKY81 acts as a negative regulator for drought tolerance by modulating guard cell H2O2–mediated stomatal closure. Environmental and Experimental Botany, 171, 103960. [Google Scholar]
25. Singh, R. K., Chaudhary, B. D. (1977). Biometrical methods in quantitative genetic analysis. In: Biometrical methods in quantitative genetic analysis. New Delhi, India: Kalyani Publishers. [Google Scholar]
26. Farooq, M. U., Cheema, A. A., Ishaaq, I., Zhu, J. (2018). Correlation and genetic component studies for peduncle length affecting grain yield in wheat. International Journal of Advances in Applied Sciences, 5, 67–75. [Google Scholar]
27. Farooq, M. U., Khan, A. S., Ishaaq, I., Cheema, A. A., Afzal, M. S. et al. (2018). Growing degree days during the late reproductive phase determine spike density and cognate yield traits. Agronomy, 8(10), 217. [Google Scholar]
28. Muller, J. (1991). Determining leaf surface area by means of linear measurements in wheat and triticale (brief report). Archiv Fuchtungsforsch, 21(2), 121–123. [Google Scholar]
29. Matzingar, D. F., Mann, T. J., Cockerham, C. C. (1962). Diallel crosses in Nicotiana tabaccum. Crop Science, 2(1), 383–386. [Google Scholar]
30. d Steel, R. G., Torrie, J. H. (1986). Principles and procedures of statistics: A biometrical approach. New York City, NY: McGraw–Hill. [Google Scholar]
31. Kempthorne, O. (1957). An introduction to genetic statistics. Wiley. [Google Scholar]
32. Bhatt, G. (1971). Heterotic performance and combining ability in a diallel cross among spring wheats (Triticum aestivum L.). Australian Journal of Agricultural Research, 22(3), 359–368. DOI 10.1071/AR9710359. [Google Scholar] [CrossRef]
33. Clewer, A. G., Scarisbrick, D. H. (2013). Practical statistics and experimental design for plant and crop science. Hoboken, New Jersey: John Wiley & Sons. [Google Scholar]
34. Li, T., Hasegawa, T., Yin, X., Zhu, Y., Boote, K. et al. (2015). Uncertainties in predicting rice yield by current crop models under a wide range of climatic conditions. Global Change Biology, 21(3), 1328–1341. DOI 10.1111/gcb.12758. [Google Scholar] [CrossRef]
35. Shahbaz, M., Ashraf, M. (2013). Improving salinity tolerance in cereals. Critical Reviews in Plant Sciences, 32(4), 237–249. DOI 10.1080/07352689.2013.758544. [Google Scholar] [CrossRef]
36. Lamers, J., van der Meer, T., Testerink, C. (2020). How plants sense and respond to stressful environments. Plant Physiology, 182(4), 1624–1635. DOI 10.1104/pp.19.01464. [Google Scholar] [CrossRef]
37. Fischer, R., Rebetzke, G. (2018). Indirect selection for potential yield in early-generation, spaced plantings of wheat and other small-grain cereals: A review. Crop and Pasture Science, 69(5), 439–459. DOI 10.1071/CP17409. [Google Scholar] [CrossRef]
38. Shamuyarira, K. W., Shimelis, H., Tapera, T., Tsilo, T. J. (2019). Genetic advancement of newly developed wheat populations under drought-stressed and non-stressed conditions. Journal of Crop Science and Biotechnology, 22(2), 169–176. DOI 10.1007/s12892-018-0262-0. [Google Scholar] [CrossRef]
39. Said, A., Hefny, Y. A. (2021). Inheritance of drought tolerance using six populations model in two bread wheat crosses. Egyptian Journal of Agronomy, 43(1), 69–81. DOI 10.21608/agro.2021.51233.1239. [Google Scholar] [CrossRef]
40. Raza, H., Khan, A., Ahmed, N. (2019). Genetic analysis for some phenological and morphological traits in wheat (Triticum aestivum L.) under two different sowing windows. Applied Ecology and Environmental Research, 17(2), 2059–2071. DOI 10.15666/aeer/1702_20592071. [Google Scholar] [CrossRef]
41. Soares, G. F., Ribeiro, W. Q., Pereira, L. F., Lima, C. A. D., Soares, D. D. S. et al. (2020). Characterization of wheat genotypes for drought tolerance and water use efficiency. Scientia Agricola, 78, 1–11. [Google Scholar]
42. Guendouz, A., Semcheddine, N., Moumeni, L., Hafsi, M. (2016). The effect of supplementary irrigation on Leaf area, SpeciŞc Leaf Weight, Grain yield and Water use efŞciency in durum wheat (Triticum durum Desf.) Cultivars. Ekin Journal of Crop Breeding and Genetics, 2(1), 82–89. [Google Scholar]
43. Tiryakioğlu, M. (2015). The relationship between flag leaf senescence and grain yield of some durum wheat varieties under drought stress during grain filling period. https://kitaplar.ankara.edu.tr/xmlui/bitstream/handle/20.500.12575/60166/21684.pdf?sequence=1&isAllowed=y. [Google Scholar]
44. Farooq, M., Hussain, M., Siddique, K. H. (2014). Drought stress in wheat during flowering and grain-filling periods. Critical Reviews in Plant Sciences, 33(4), 331–349. [Google Scholar]
45. Pour-Aboughadareh, A., Mohammadi, R., Etminan, A., Shooshtari, L., Maleki-Tabrizi, N. et al. (2020). Effects of drought stress on some agronomic and morpho-physiological traits in durum wheat genotypes. Sustainability, 12(14), 5610. [Google Scholar]
46. Erkul, A., Aydin, U., Konak, C. (2010). Inheritance of yield and yield components in a bread wheat (Triticum aestivum L.) cross. Turkish Journal of Field Crops, 15(2), 137–140. [Google Scholar]
47. Kaiser, H. F. (1960). The application of electronic computers to factor analysis. Educational and Psychological Measurement, 20(1), 141–151. [Google Scholar]
48. Dong, B., Zheng, X., Liu, H., Able, J. A., Yang, H. et al. (2017). Effects of drought stress on pollen sterility, grain yield, abscisic acid and protective enzymes in two winter wheat cultivars. Frontiers in Plant Science, 8, 1008. [Google Scholar]
49. Sisodia, B., Rai, V. (2017). An application of principal component analysis for pre-harvest forecast model for wheat crop based on biometrical characters. International Research Journal of Agricultural Economics and Statistics, 8(1), 83–87. [Google Scholar]
50. Khodadadi, M., Fotokian, M. H., Miransari, M. (2011). Genetic diversity of wheat (Triticum aestivum L.) genotypes based on cluster and principal component analyses for breeding strategies. Australian Journal of Crop Science, 5(1), 17–24. [Google Scholar]
51. Attri, H., Dey, T., Singh, B., Kour, A. (2021). Genetic estimation of grain yield and its attributes in three wheat (Triticum aestivum L.) crosses using six parameter model. Journal of Genetics, 100(2), 1–9. [Google Scholar]
52. Fellahi, Z. E. A., Hannachi, A., Bouzerzour, H., Boutekrabt, A. (2013). Line × tester mating design analysis for grain yield and yield related traits in bread wheat (Triticum aestivum L.). International Journal of Agronomy, 2013, 1–9. [Google Scholar]
53. Jain, S., Sastry, E. (2012). Heterosis and combining ability for grain yield and its contributing traits in bread wheat (Triticum aestivum L.). Journal of Agriculture and Allied Science, 1(1), 17–22. [Google Scholar]
54. Ahmad, F., Khan, S., Ahmad, S. Q., Khan, H., Khan, A. et al. (2011). Genetic analysis of some quantitative traits in bread wheat across environments. African Journal of Agricultural Research, 6(3), 686–692. [Google Scholar]
55. Çifci, E. A., Yagdi, K. (2010). The research of the combining ability of agronomic traits of bread wheat in F1 and F2 generations. Journal of Agricultural Faculty of Uludag University, 24, 85–92. [Google Scholar]
56. Ammar, A., Irshad, A., Liaqat, S., Ahmad, R. I., Qayyum, A. et al. (2014). Combining ability studies for yield components in wheat (Triticum aestivum). Journal of Food, Agriculture and Environment, 12, 383–386. [Google Scholar]
57. Hassan, G., Gul, R. (2006). Evaluation of the heterotic and heterobeltiotic potential of wheat genotypes for improved yield. Pakistan Journal of Botany, 38(4), 1159–1167. [Google Scholar]
58. Singh, H., Sharma, S., Sain, R. (2004). Heterosis studies for yield and its components in bread wheat over environments. Hereditas, 141(2), 106–114. [Google Scholar]
59. Muhammad, S., Sadiq, H. (1988). Estimation of heterosis in yield components of wheat. Pakistan Journal of Agricultural Research, 9(1), 1–5. [Google Scholar]
60. Rasul, I., Khan, A. S., Ali, Z. (2002). Estimation of heterosis for yield and some yield components in bread wheat. International Journal of Agriculture and Biology, 4(2), 214–216. [Google Scholar]
61. Ojo, G., Adedzwa, D., Bello, L. (2007). Combining ability estimates and heterosis for grain yield and yield components in maize (Zea mays L.). Journal of Sustainable Development in Agriculture and Environment, 3, 49–57. [Google Scholar]
62. Kumar, P., Singh, H., Lal, C., Choudhary, R. (2021). Heterosis analysis for yield and its component traits in bread wheat (Triticum aestivum L.) over different environments. Journal of Environmental Biology, 42, 438–445. [Google Scholar]
63. Yadav, A. K., Maan, R. K., Kumar, S., Kumar, P. (2011). Variability, heritability and genetic advance for quantitative characters in hexaploid wheat (Triticum aestivum L.). Electronic Journal of Plant Breeding, 2(3), 405–408. [Google Scholar]
64. E., EL., Marwa, M. (2018). Genetic behavior of some agronomic characters in three bread wheat crosses under different environmental conditions. Alexandria Journal of Agricultural Sciences, 63(5), 313–325. DOI 10.21608/alexja.2018.29390. [Google Scholar] [CrossRef]
65. Sultan, M., El-Latif, A., Abdel-Moneam, M., El-Hawary, M. (2011). Genetic parameters for some yield and yield components characters in four crosses of bread wheat under two water regime treatments. Journal of Plant Production, 2(2), 351–366. DOI 10.21608/jpp.2011.85531. [Google Scholar] [CrossRef]
Supplementary Materials
The following data is available in the supplementary file. Table S1: Summary statistics (Min, Max, Mean, S.D) for Normal and Drought conditions. Table S3: Correlation matrix (Pearson (n)): Normal and Drought Phenological and yield traits. Table S2: Data for proportional contribution of material. Table S4: Genetic variability (Ve, Vg, Vp, H2, GA) under normal and drought irrigation conditions for traits under observation. Supplementary Fig. 1: Scree plot analysis for drought and Normal irrigation experiment. Supplementary Fig. 2: PCA analysis for drought and Normal irrigation experiment. Supplementary Fig. 3. Biplot analysis for drought and Normal irrigation experiment.
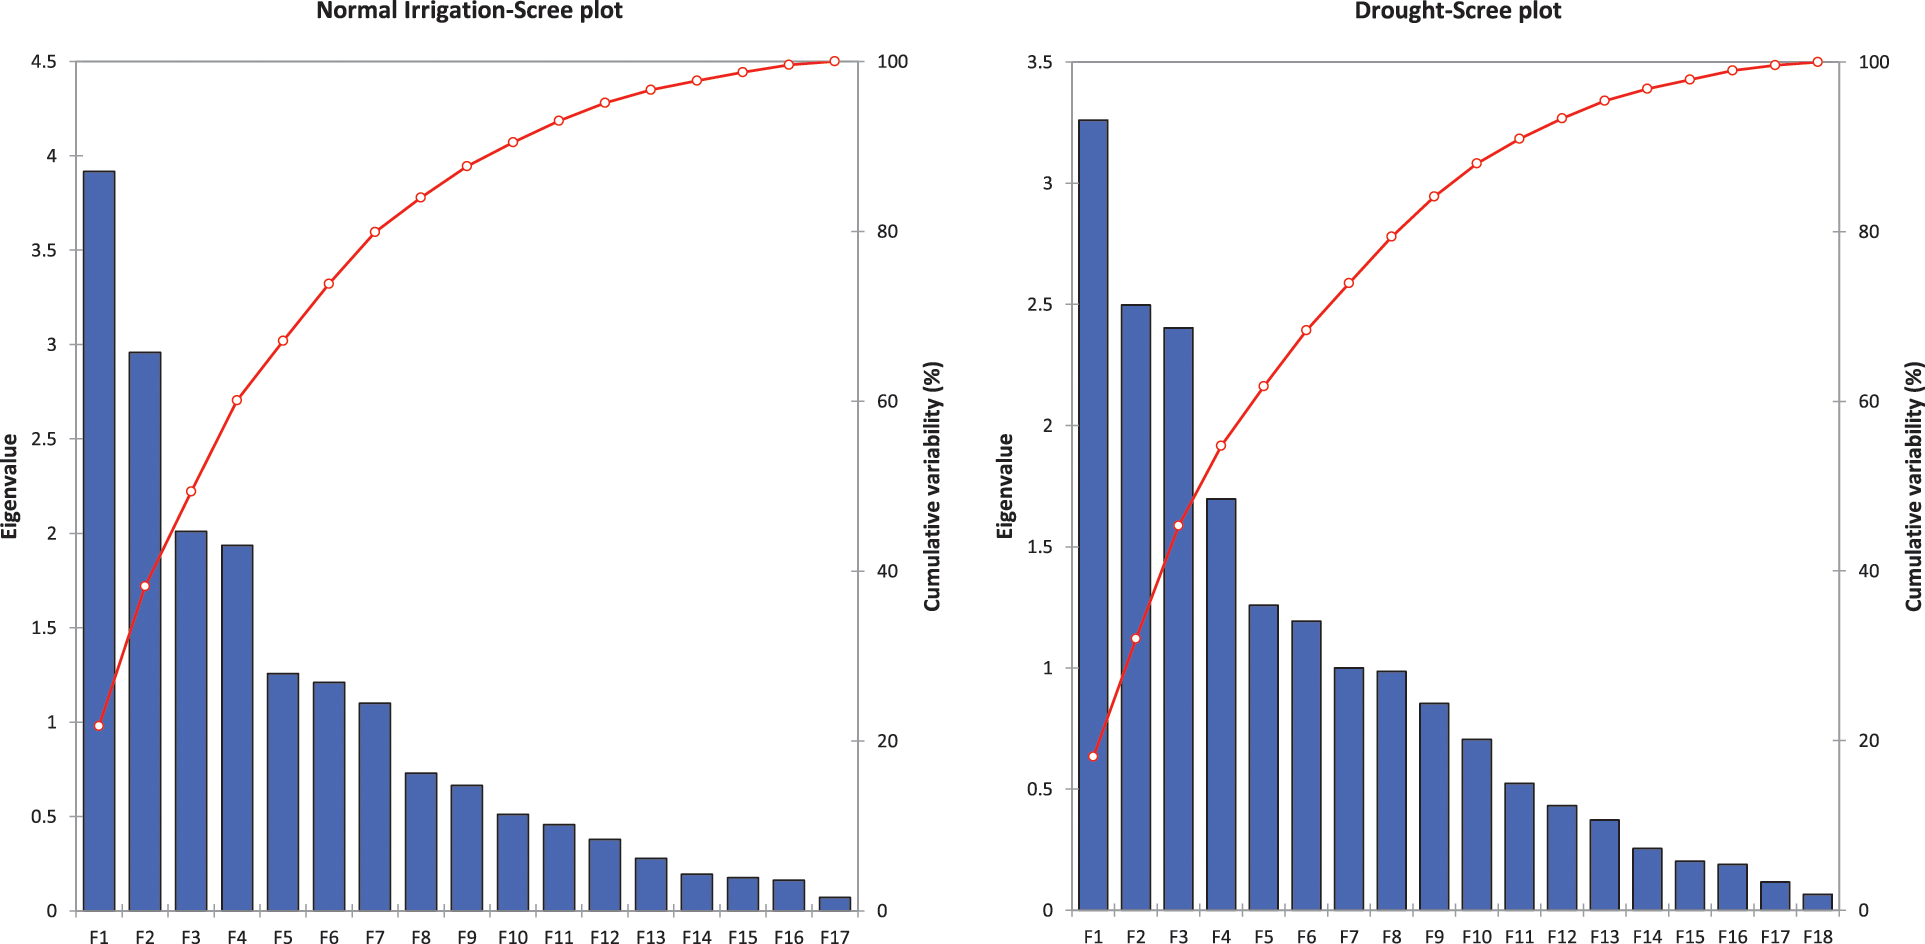
Supplementary Figure 1: Scree plot analysis for Normal irrigation (left) and drought (right) experiment
Supplementary Figure 2: PCA analysis for normal irrigation (left) and drought (right) experiment
Supplementary Figure 3: Biplot analysis for normal irrigation (left) and drought (right) experiment
Cite This Article
 Copyright © 2022 The Author(s). Published by Tech Science Press.
This work is licensed under a Creative Commons Attribution 4.0 International License , which permits unrestricted use, distribution, and reproduction in any medium, provided the original work is properly cited.
 Downloads
 Citation Tools