
 Submit a Paper
 Propose a Special lssue
 Open Access
ARTICLE
Genetic Diversity, Population Structure, and Genome-Wide Association Study of Seven Agronomic Traits in 273 Diverse Upload Cotton Accessions
1 Cash Crops Research Institute of Xinjiang Academy of Agricultural Science (XAAS), Urumqi, China
2 Engineering Research Centre of Cotton of Ministry of Education, Xinjiang Agricultural University, Urumqi, China
3 R&D Department, Adsen Biotechnology Corporation, Urumqi, China
4 National Key Laboratory of Crop Genetic Improvement, Huazhong Agricultural University, Wuhan, China
* Corresponding Authors: Xueyuan Li. Email: ; Quanjia Chen. Email:
# These authors contributed equally to this work
Phyton-International Journal of Experimental Botany 2023, 92(12), 3345-3357. https://doi.org/10.32604/phyton.2023.028755
Received 10 January 2023; Accepted 18 April 2023; Issue published 28 December 2023
 View Full Text
 Download PDF
Abstract
Upland cotton (Gossypium hirsutum) is the most important plant producing natural fibers for the textile industry. In this study, we first investigated the phenotypic variation of seven agronomic traits of 273 diverse cotton accessions in the years 2017 and 2018, which were from 18 geographical regions. We found large variations among the traits in different geographical regions and only half of the traits in either years 2017 or 2018 followed a normal distribution. We then genotyped the collection with 81,612 high quality SNPs. Phylogenetic tree and population structure revealed a diverse genetic structure of the core collection, and geographical diversification was an important factor, but account for part of the variances of genetic diversification. We then performed genome-wide association study for the seven traits in the years 2017 and 2018, and the average values of each trait in the two years, respectively. We identified a total of 19 significant marker-trait associations and found that Pollen Ole e 1 allergen/extension could be the candidate gene associated with the fall-off cotton bolls from the last three branches. In addition, large variations were observed for the heritability of traits in the years 2017 and 2018. These results provide new potential candidate genes for further functional validation, which could be useful for genetic improvement and breeding of new cotton cultivars with better agronomic performances.Keywords
Upland cotton (Gossypium hirsutum), a member of the Gossypium genus [1], is a vital source of natural fibers for the global textile industry [2]. Improving the yield and fiber quality with resistance to numerous adversities remains as the top breeding priorities [3]. However, our understanding of the genetic basis of the important agronomic traits is still limited [2,3].
Genetic diversity is crucial for conservation, breeding and biodiversity. Over the years, the genetic diversity of cotton has been studied using various approaches, including morphological traits [4], pedigree information [5] and different molecular markers [6–10]. Next-generation sequencing technology makes it possible to generate thousands to millions of SNPs for hundreds of cotton germplasm accessions [2,3]. However, this approach can be expensive. Alternatively, sequencing accessions at a lower sequence depth [11] or using SNP arrays [11–17] and SLAF-seq [18] can be used to infer the genetic diversity and structure of large cotton germplasm resource.
Genome-wide association study (GWAS) has proven to be an effective and efficient way to identify genetic loci associated with important agronomic traits in cotton, including yield, fiber quality, growth period, and plant type [1,11,13,14,16–26]. More natural accessions harness more genetic diversity and possible recombination events, breaking down the linkage disequilibrium (LD) and identifying causal variants that cannot be detected in linkage populations [27,28]. However, the associated loci identified in different GWASs can be inconsistent, which can be technically referred and evaluated by heterogeneity (the genetic variations observed across different GWASs) and can be caused by various factors, such as Genotype × Environment interactions, genetic background, genetic structure, and linkage disequilibrium [19,29–31]. In this study, we investigated a core cotton collection and performed GWAS on seven important agronomic traits. Our aims were to identify new significantly associated loci to breed new varieties with higher cotton quality.
In this study, a total of 273 diverse cotton accessions were selected from 18 geographical regions (Supplementary Table 1). The field experiment was performed at No. sixteenth regiment experiment field during 2017 and 2018 at Alaer, Xinjiang Province, China, and each accession has three replicates.
A total of seven important morphological traits were measured across two years, including pollen vitality (PV), leaf area (LA), chlorophyll content (CC), the number of dry cotton bolls (DBs), the number of the fall-off cotton bolls from the last three branches (FB3), the number of the cotton bolls from the last three branches (CB3), and drop ratio (DR). Pollen viability was assessed using 2,3,5-triphenyl tetrazolium chloride (TTC) solution. Briefly, flowers were sampled and immersed in TTC and were then stored at room temperature for 1 h. Then 2% sulfuric acid was added to stop the staining process. Pollen was then photographed under microscope and the pollen viability was measured as the percentage of normally stained pollens compared to total number of pollens. The chlorophyll content was measured near the leaf main veins and both sides of the functional leaves using the SPAD-502 chlorophyll meter, with three replicates. Leaf area was measured on the top, middle and bottom leaves using the LA-S leaf area measuring instrument. The number of the fall-off cotton bolls from the last three branches, the number of the cotton bolls from the last three branches were manually cross-checked. The boxplot of the phenotypic variation was generated using ggplot2 package in R. The normality of the phenotypes was tested using the Shapiro-Wilk test in R function.
2.3 Genotyping and SNP Calling
Adaptors and low quality sequences were removed using Trimmomatic [32] (v0.39) with parameters “TruSeq3-PE-2.fa:2:30:10:1:TRUE SLIDINGWINDOW:4:20 LEADING:3 TRAILING:3 MINLEN:40”. The clean sequencing data obtained by specific-locus amplified fragment sequencing (SLAF-seq) was realigned to the reference genome of cotton released by Using Zhejiang University Cotton v2.1 (https://www.cottongen.org/species/Gossypiumhirsutum/ZJU-AD1v2.1) using BWA v0.7.15 software [33] with default parameters. Then haplotypeCaller of GATK v4.0 [34] and SAMtools v1.9 [35] were used to detect variation calling separately, and the overlapped SNP markers were identified to create a final reliable SNP dataset. Raw SNPs from GATK were filtered with default hard filtering with parameters ‘QD < 2.0 || FS > 60.0 || MQ < 40.0 || SOR >3.0 || MQRankSum < −12.5 || ReadPosRankSum < −8.0’. SnpEff v4.0 [36] was used to obtain the locations and the functions of the variable sites (intergenic zones, gene zones, or CDS zones; synonymous mutations, nonsynonymous mutations, etc.).
In order to obtain a final set of high-quality SNPs, the minimal minor allele frequency (MAF) was set to 0.05, with a maximum percentage of missing at 0.3, generating a total of 81,612 high quality SNPs. All these SNPs were used for further population genetic analyses, including phylogenetic tree, population structure, kinship and genome-wide association study.
The optimal ML phylogenetic tree model for the 273 cotton core collection was built using IQ-TREE v1.6.12 [37]. In order to reduce the overall computing time and load, we first thinned the 81,612 SNPs to 11,589 SNPs using vcftools with --thin 100000. The optimal fitted model was PMB+F+R7, which was determined based on the lowest BIC value using ModelFinder [38].
The population structure was calculated using all the 81,612 high quality SNPs from fastSTRUCTURE v1.0 [39]. The optimal number of sub-populations was determined at 7.
2.7 Genome-Wide Association Study
Genome-wide association study was tested using EMMAX [40]. The PCA and the Balding-Nichols (BN) kinship were added as cofactors. Genome-wide significant threshold (2.81E-6) was determined in GEC1 [41]. The candidate region was determined by calculating the LD for the peak SNPs and its nearby SNPs using PLINK [42] with parameters ‘--ld-window 1000000 --ld-window-r2 0.2’.
Geographical diversity can result in diverse phenotypic variations. In this study, we mainly focused on seven important quantitative agronomic traits, namely pollen vitality (PV), leaf area (LA), chlorophyll content (CC), the number of dry cotton bolls (DBs), the number of the fall-off cotton bolls from the last three branches (FB3), the number of the cotton bolls from the last three branches (CB3) and drop ratio (DR). We observed significant phenotypic variations among the defined geographical locations, and the overall variation patterns across different geographical locations in 2017 and 2018 were similar (Fig. 1). These findings suggest that geographical locations play a vital role in shaping the diversification and variation of the analyzed phenotypes.
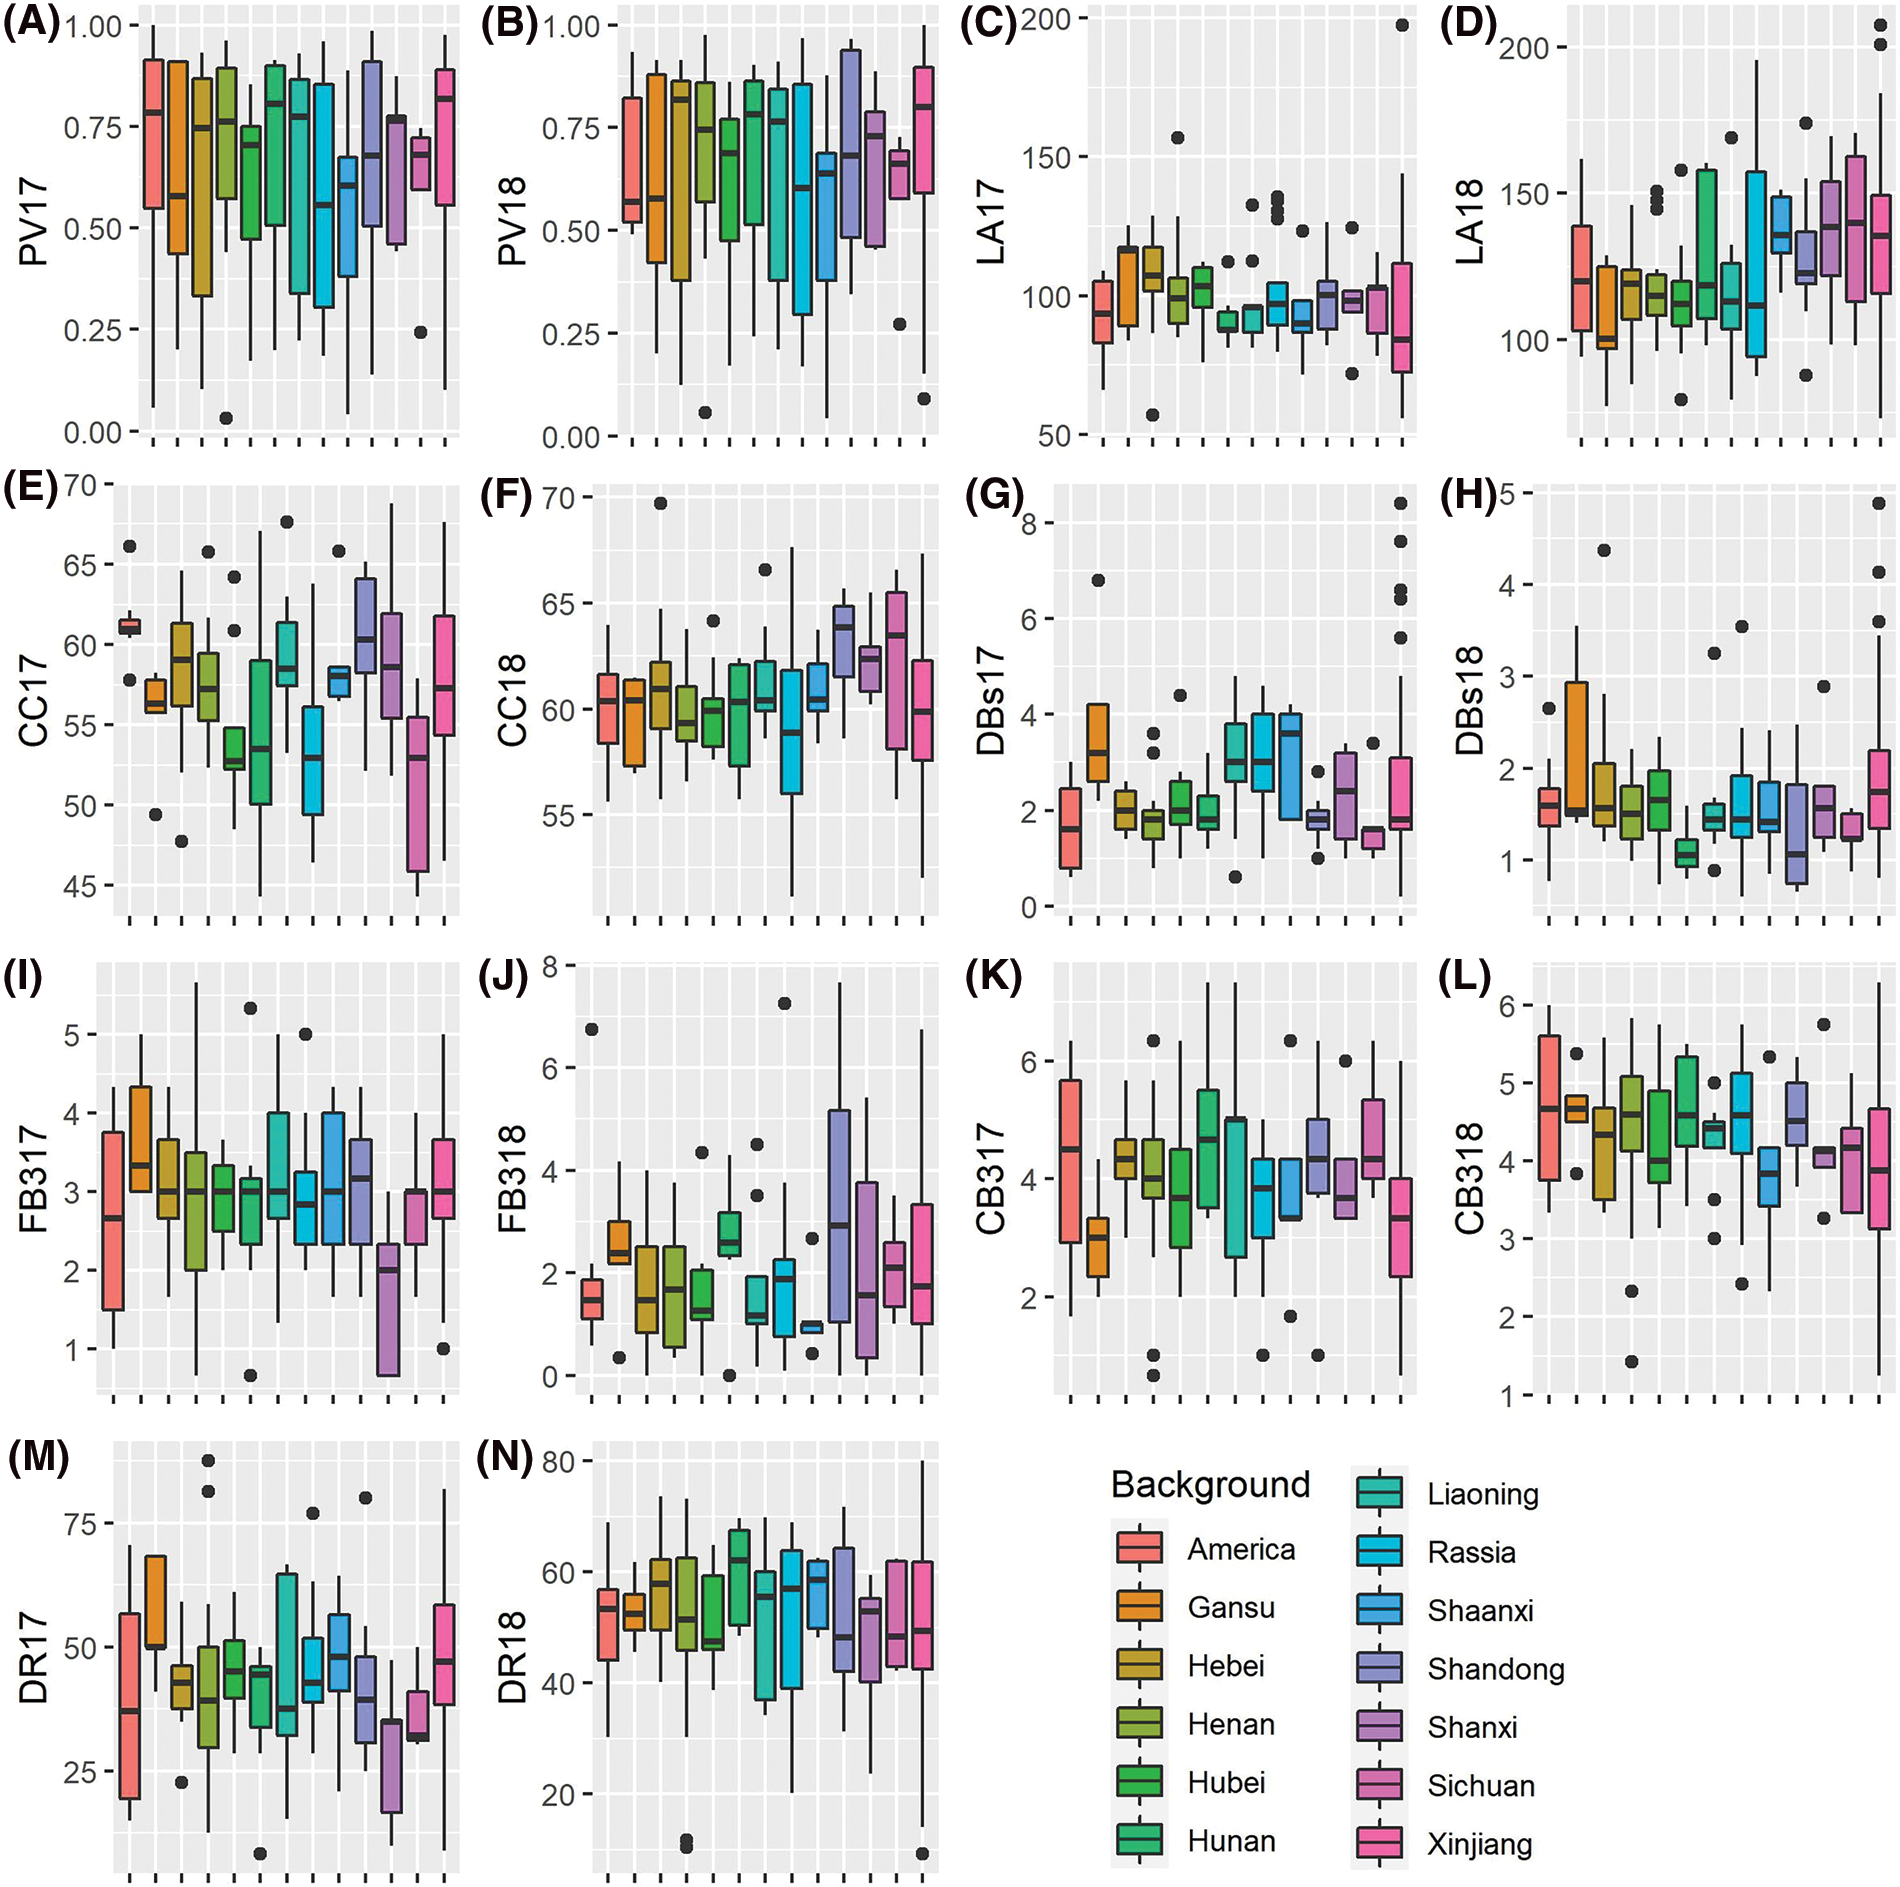
Figure 1: Boxplot of the measured phenotypes for the 273-core cotton collection in 2017 and 2018. PV17, pollen vitality in 2017; PV18, pollen vitality in 2018; LA17, leaf area in 2017; LA18, leaf area in 2018; CC17, chlorophyll content in 2017; CC18, chlorophyll content in 2018; DBs17, the number of dry cotton bolls in 2017; DBs18, the number of dry cotton bolls in 2018; FB317, the number of the fall-off cotton bolls from the last three branches in 2017; FB318, the number of the fall-off cotton bolls from the last three branches in 2018; CB317, the number of the cotton bolls from the last three branches in 2017; DR17, drop ratio in 2017; DR18, drop ratio in 2018. Only geographical background with no less than five accessions were used in this comparison
All the analyzed traits were considered as quantitative traits and should theoretically follow a normal distribution. However, we found that only the chlorophyll content (CC) showed a normal distribution in both the measurement of years 2017 and 2018. On the other hand, the remaining six traits were either only normally distributed in one year or non-normally distributed in both years. Pollen vitality (PV) and the number of dry cotton balls (DBs) even showed a high significant difference compared to normal distribution (Fig. 2). These findings indicate that the analyzed traits not only exhibit high diversity but also deviate from normal distribution.
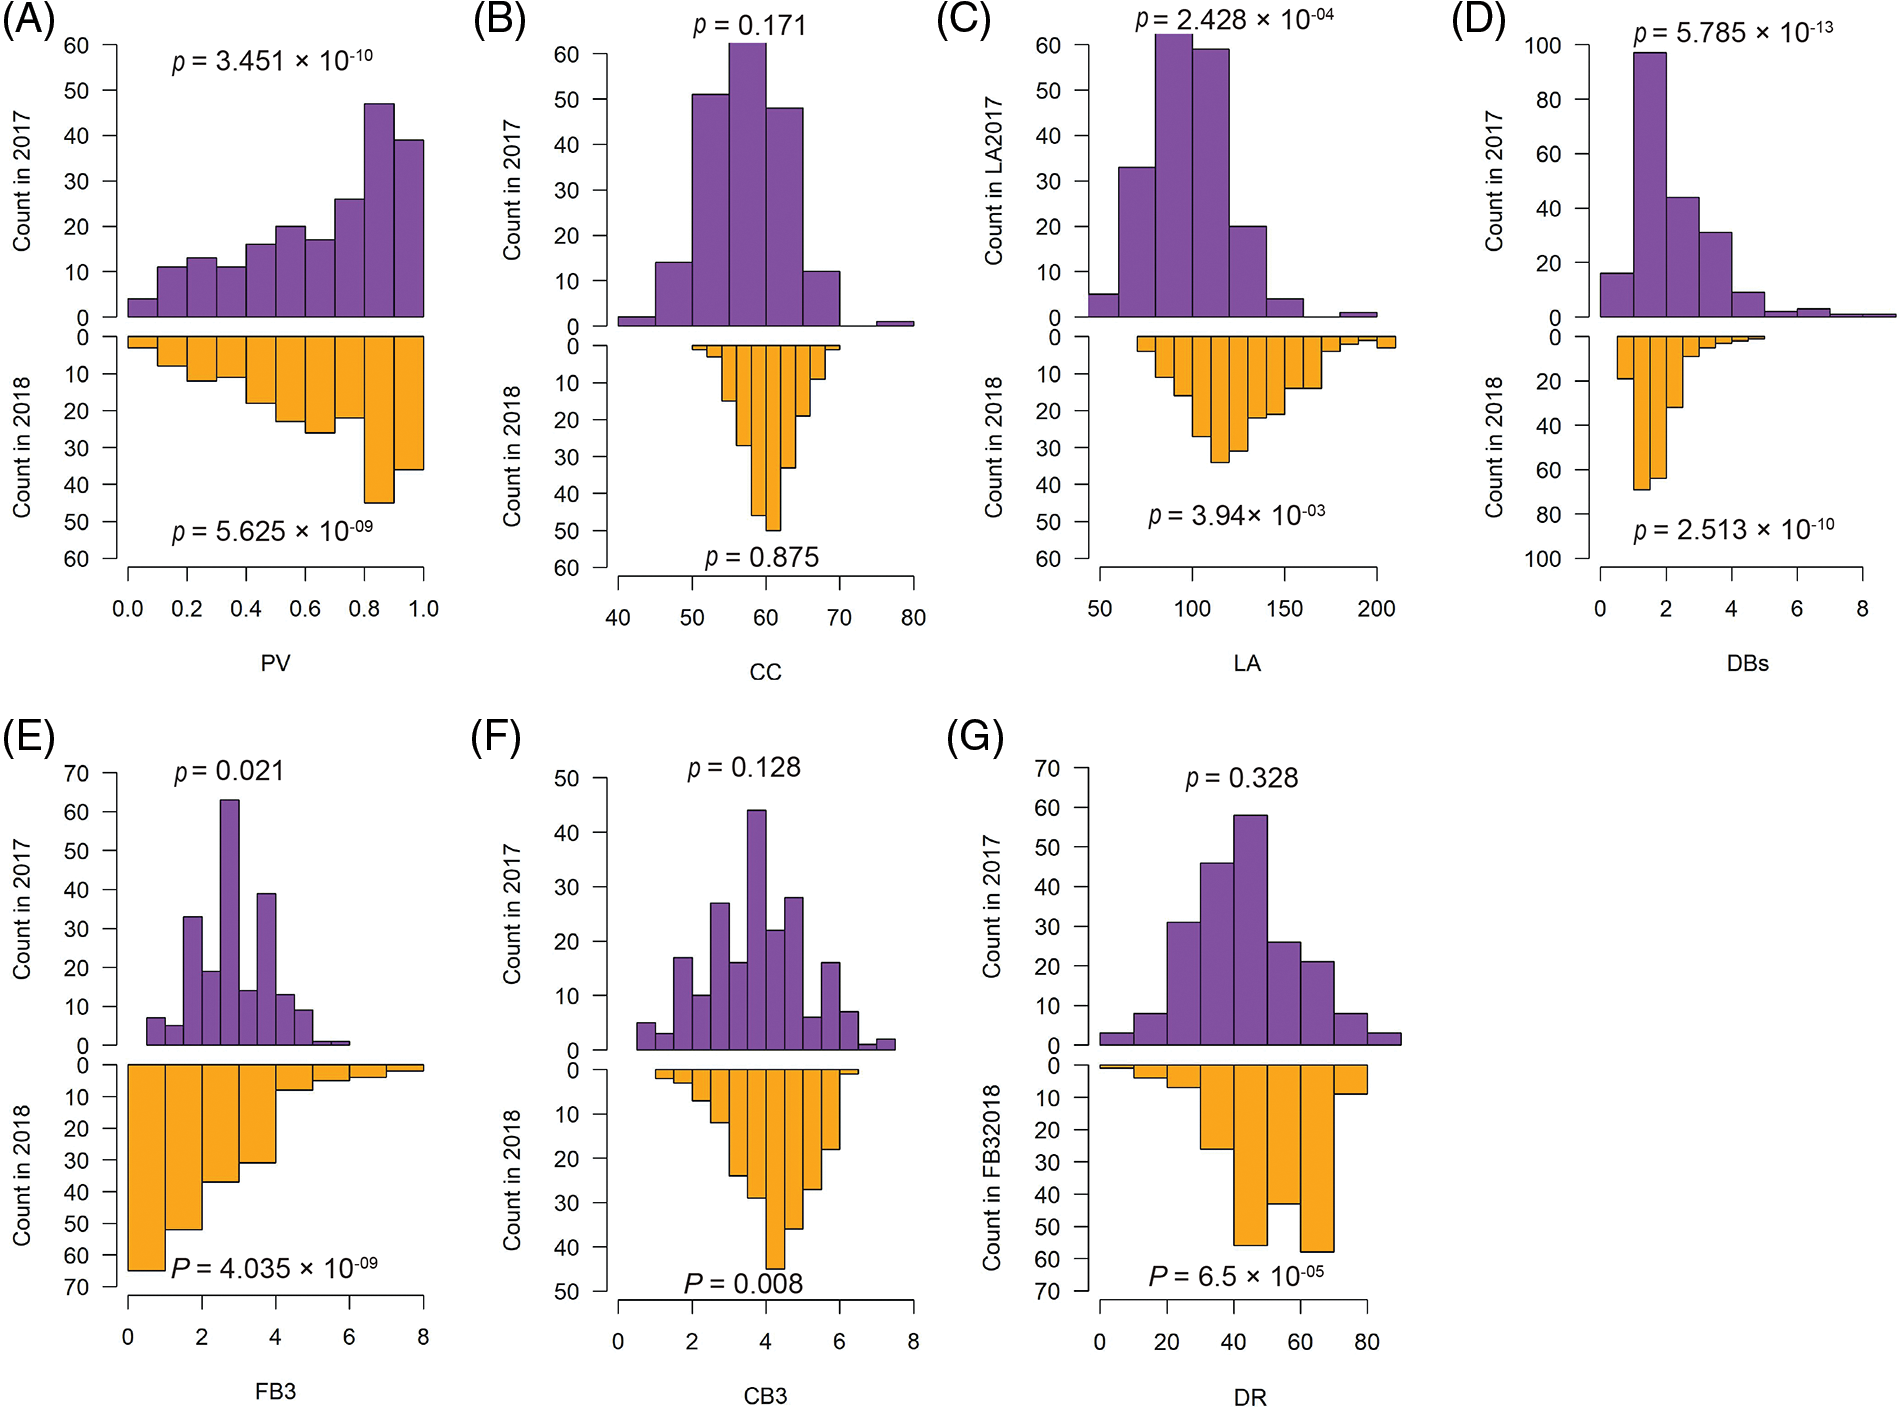
Figure 2: Distributions of the measured phenotypes for the 273-core cotton collection in 2017 and 2018. The normality was tested using the Shapiro-Wilk test in R function shapiro.test(). PV, pollen vitality; LA, leaf area; CC, chlorophyll content; DBs, the number of dry cotton bolls; FB3, the number of the fall-off cotton bolls from the last three branches; CB3, the number of the cotton bolls from the last three branches; DR, drop ratio. p value < 0.05 indicated that the distribution was significantly different from normal distribution
We also measured the correlations among the seven traits across both years (Supplementary Fig. 1). In the year 2017, we observed a strong positive correlation (0.82) between DR (cotton bolls drop ratio) and FB3 (the number of fall-off cotton bolls from the last three branches), while DR and CB3 (the number of cotton bolls from the last three branches) had a strong negative correlation. However, we did not find any strong correlations among the traits in year 2018. Moreover, we found that only PV (pollen vitality) exhibited a high positive correlation (0.94) between the year 2017 and 2018.
Although the core cotton collection represents a diverse phenotypic and geographical diversity, a comprehensive genetic structure analysis is largely missed. In this study, we first calculated the maximum-likelihood phylogenetic tree (IQ-Tree) (Fig. 3A). We found that this core collection could be mainly subdivided into six subgroups, and then calculated the population structure and found that the optimal number of subpopulation structure was seven. When further cross-checked the population structure ranged from five to eight and found that, although not very highly consistent, the population structure still provided supplementary information to the phylogenetic structure (Fig. 3B). Interpreting the possible causes of the genetic structure would provide explanations of the genetic differentiation and make the structure much more reasonable. However, though some of the accessions, especially from Xinjiang Province, clustered more closely than others, geographical information could explain some of the phylogenetic tree as well as the population structure (Supplementary Table 1). These findings demonstrated a highly complex genetic structure of this core collection.
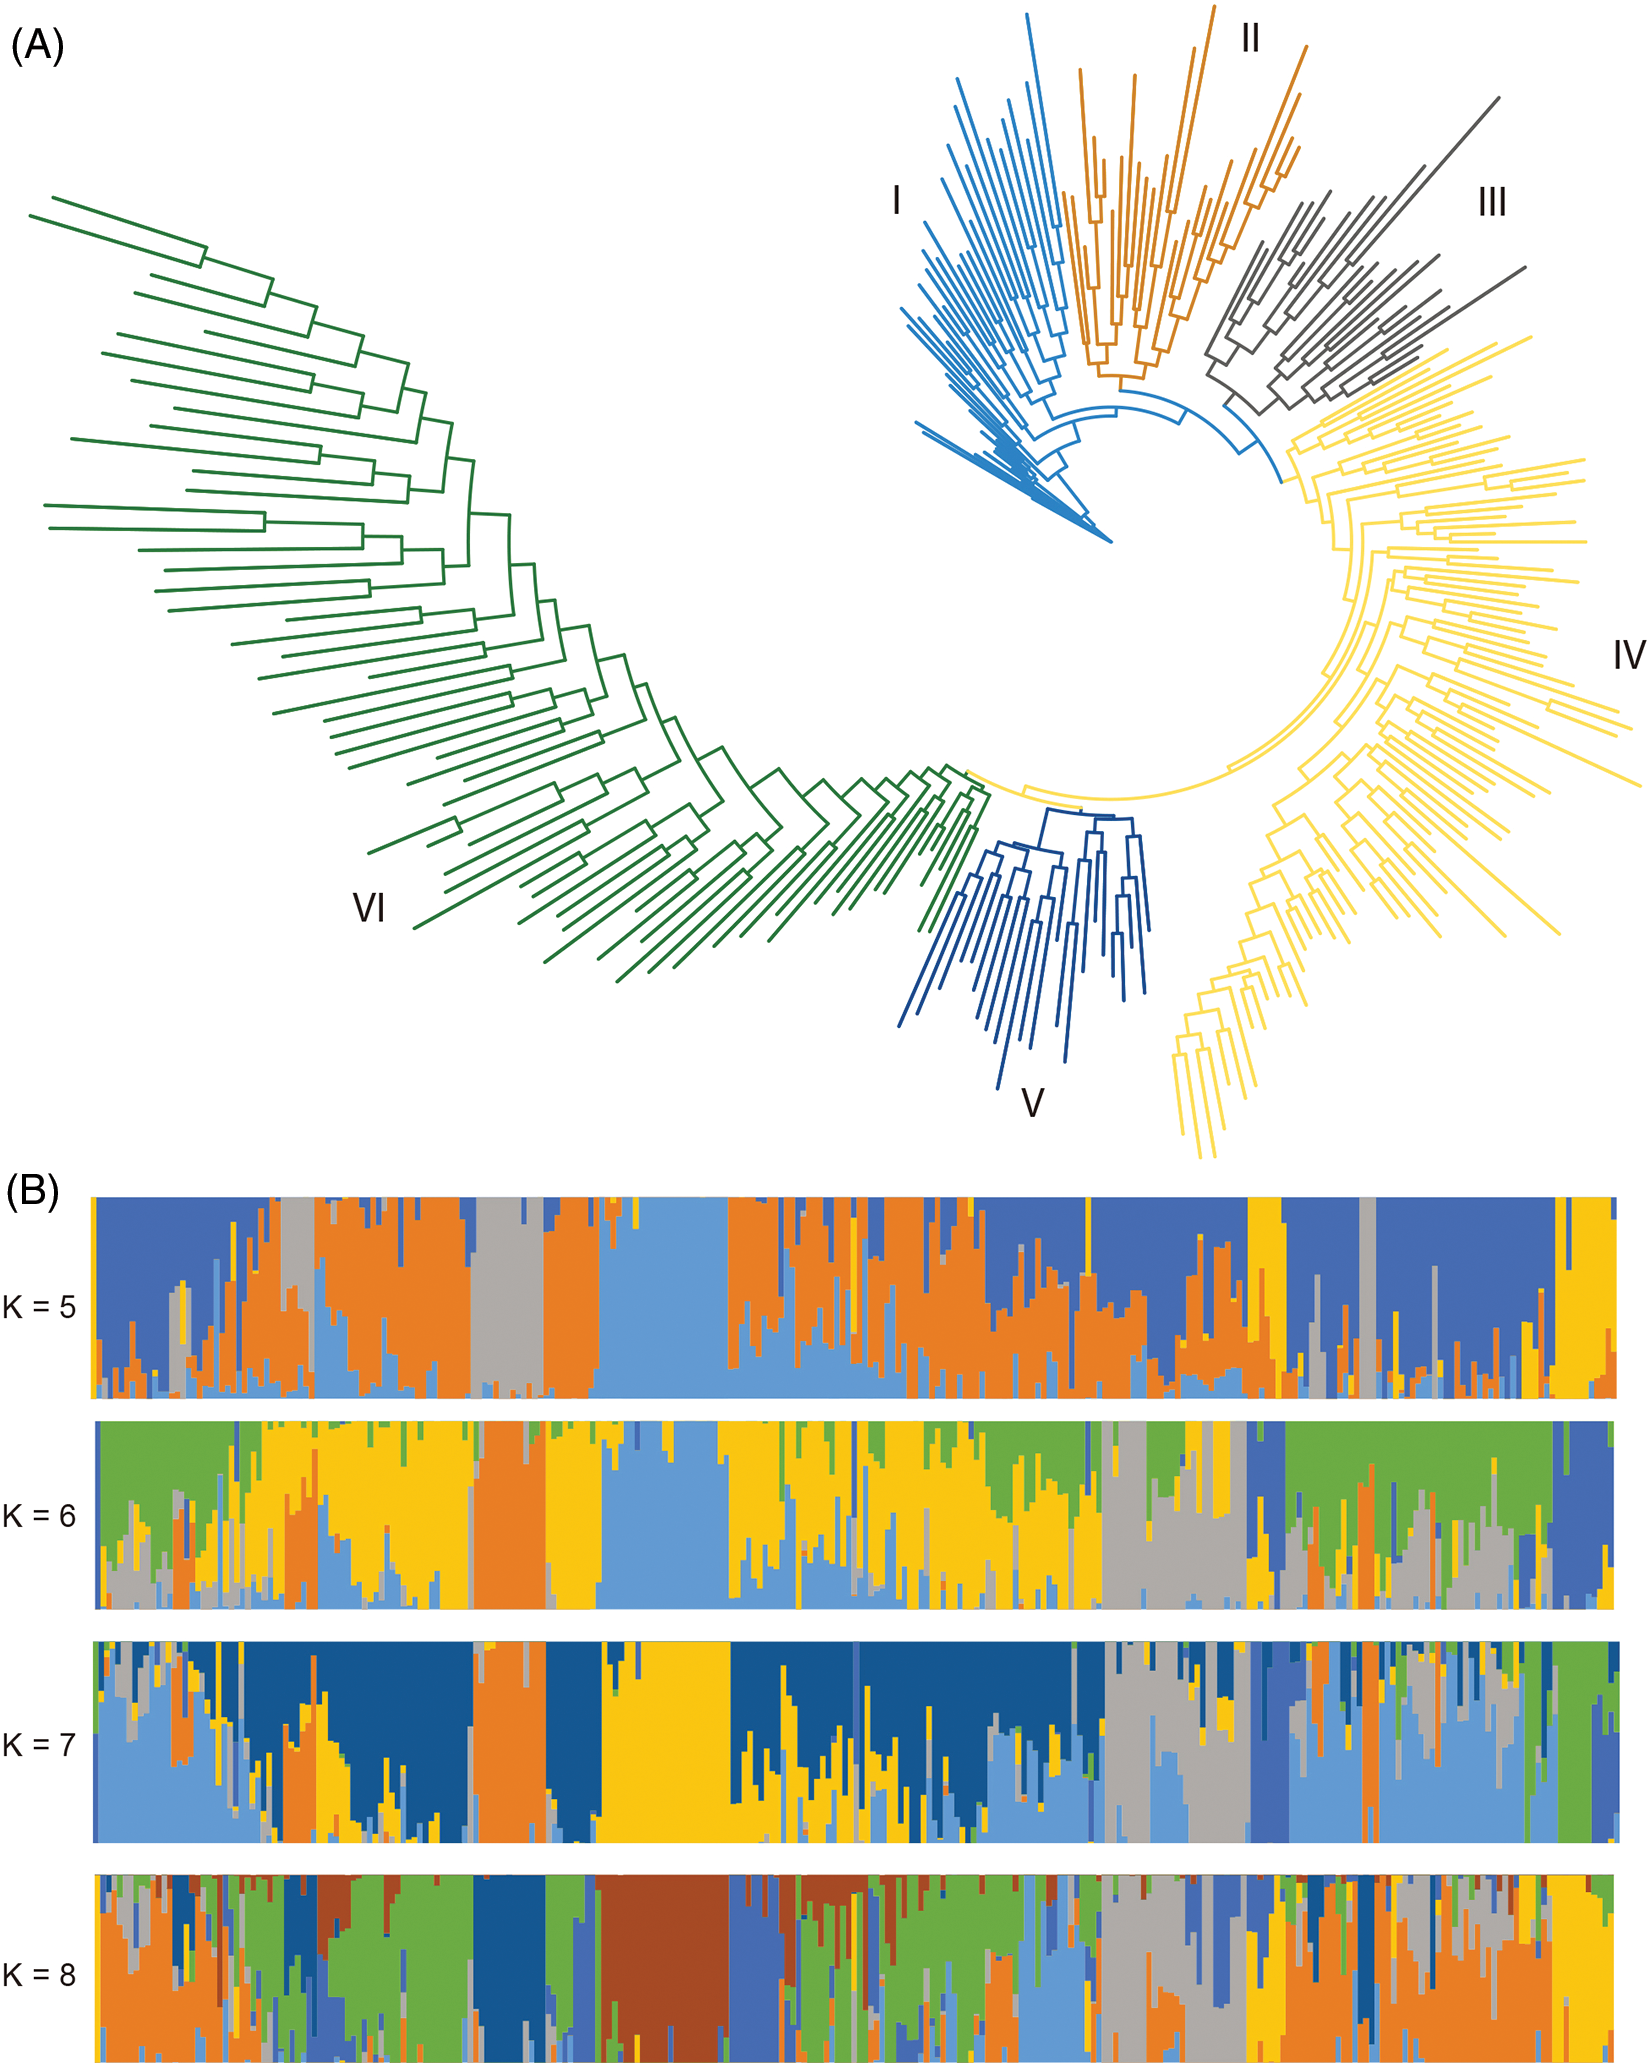
Figure 3: Phylogenetic and population structure of 273 cotton accessions. (A) Phylogenetic structure of the 273 cotton accessions. (B) Population structure of the 273 cotton accessions with the number of subpopulations ranged from five to eight
3.3 Genome-Wide Association Study
In order to account for the weaker correlations between the phenotypes across 2017 and 2018, we performed the GWAS both on the year-specific and average values. Additionally, we also normalized the phenotypes using the ln() transformation. Our analyses successfully identified 19 significant associations (Table 1), but no significant associations for chlorophyll content. Notably, we identified up to seven significant associations for the number of fall-off cotton balls from the last three branches (FB3), an important parameter related to total yield. These accessions were discovered either in 2018 or in the average value of 2017 and 2018 with five being identified in 2018 (Table 1, Fig. 4A). However, no significant associations were detected in 2017. The quantile-quantile (Q-Q) plot showed proper correction and positive associations (Fig. 4B). The linkage disequilibrium revealed that SNPs near the peak SNP (D10:25394605) decayed quickly to a short distance (Fig. 4C). The nearest candidate gene to D10:25394605 was annotated as a Pollen Ole e 1 allergen/extension (CotAD_63822), which may regulate the number of cotton balls via the regulation of pollens.
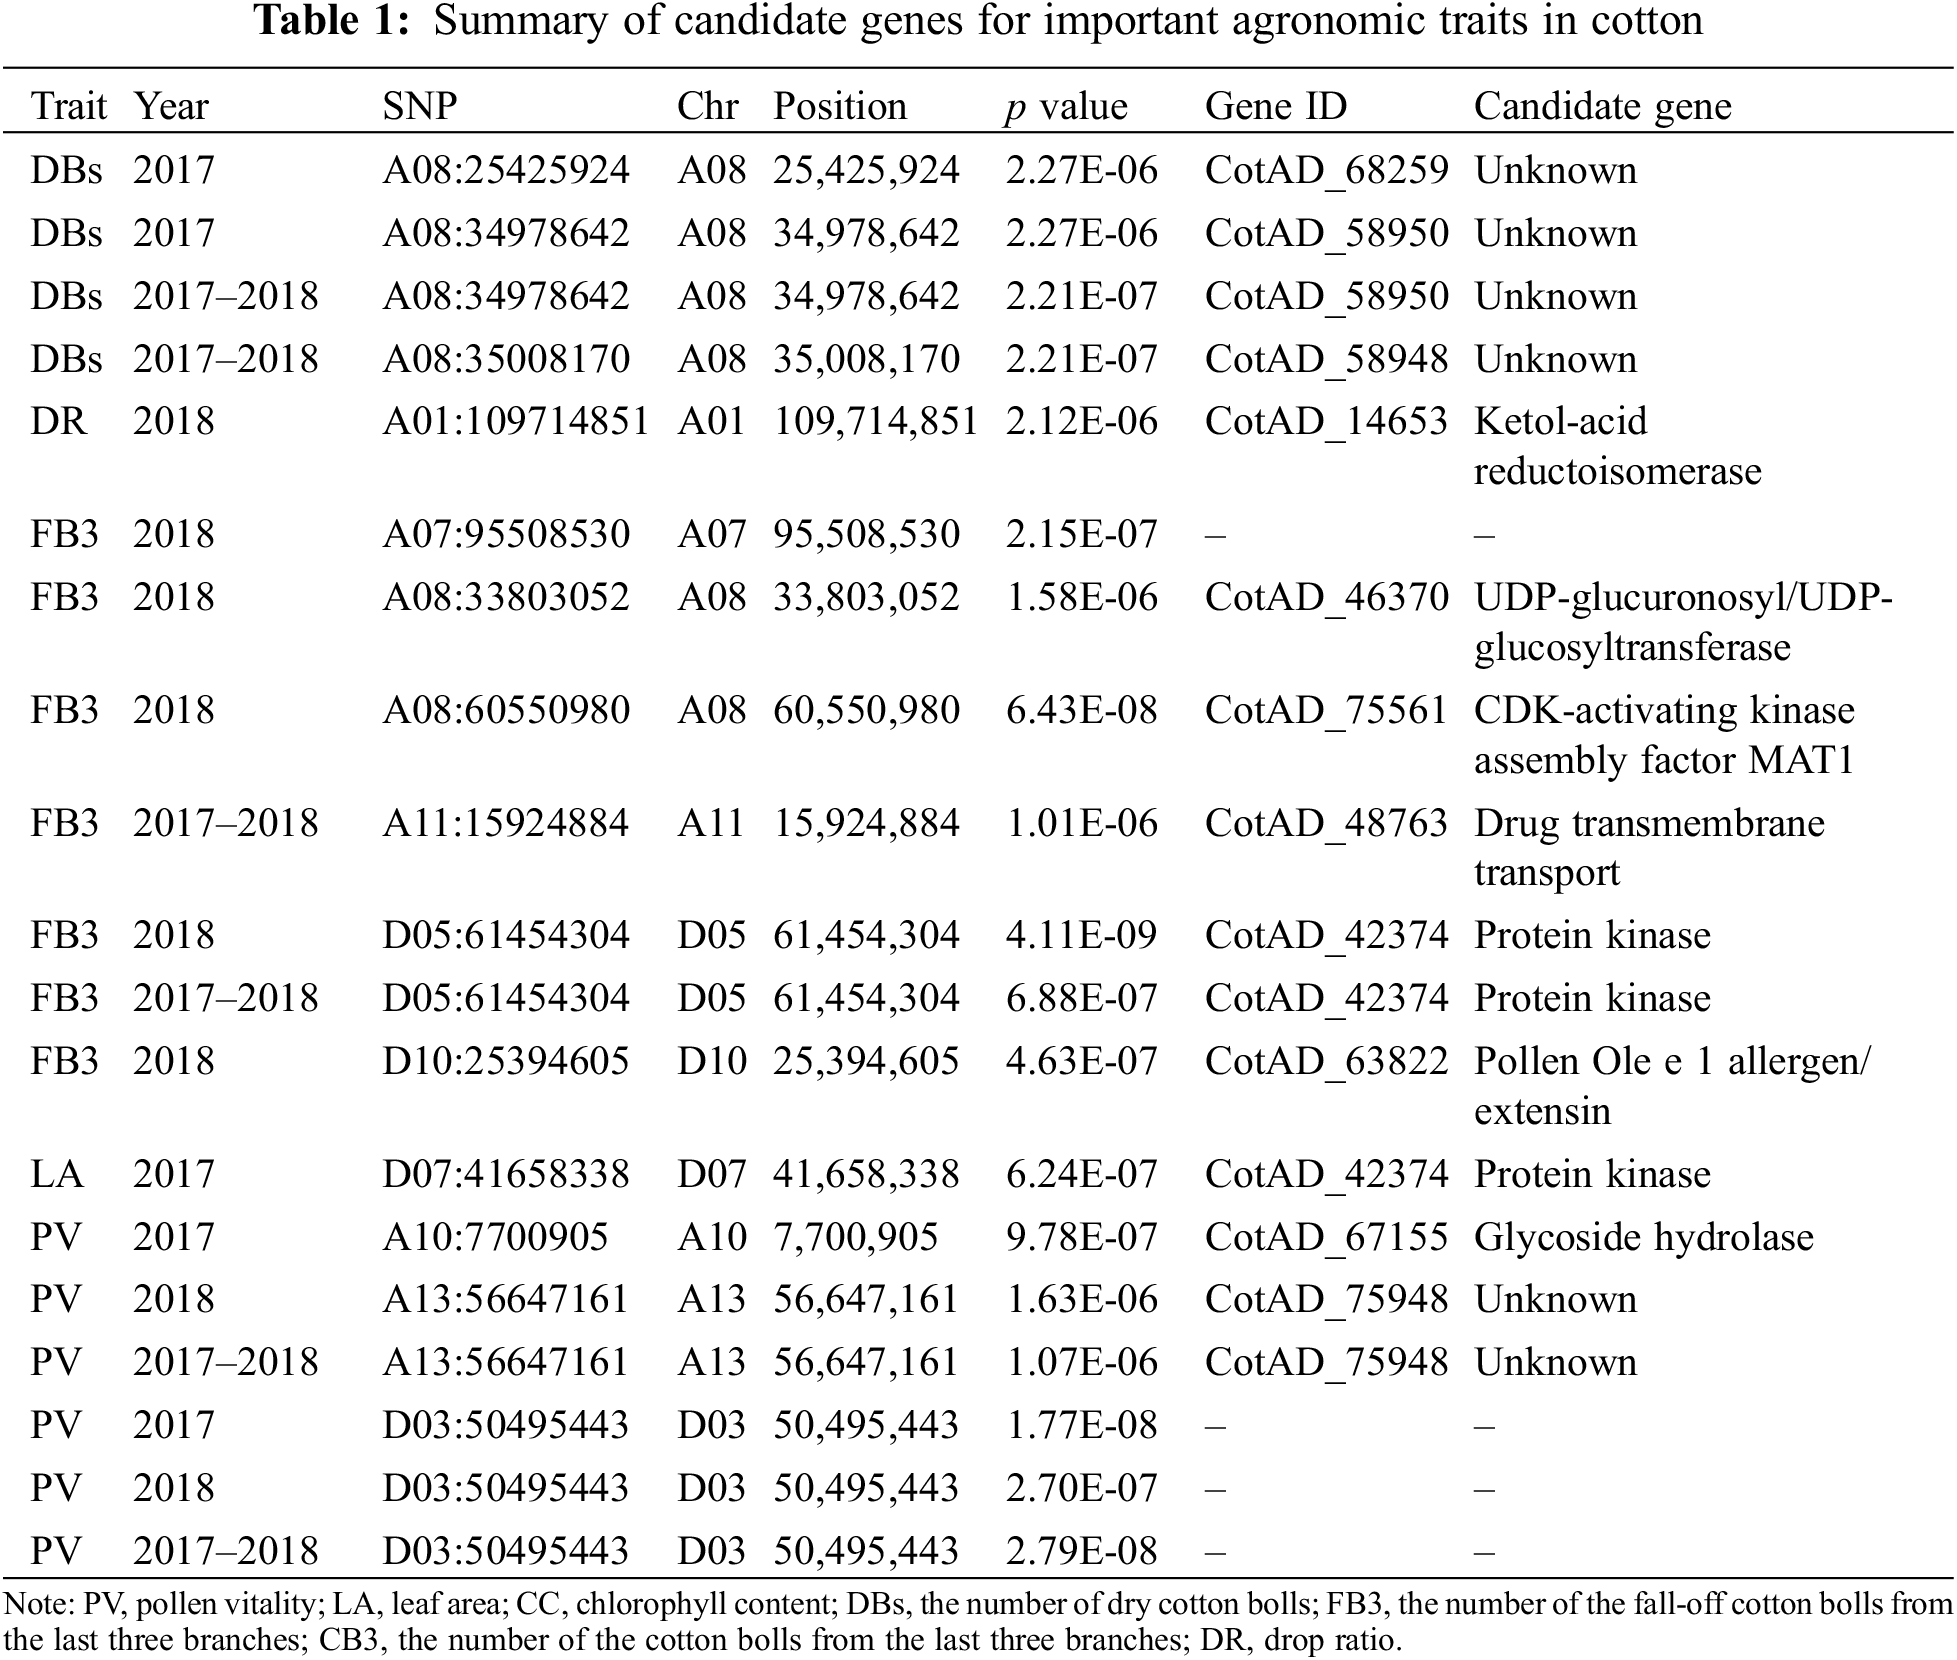
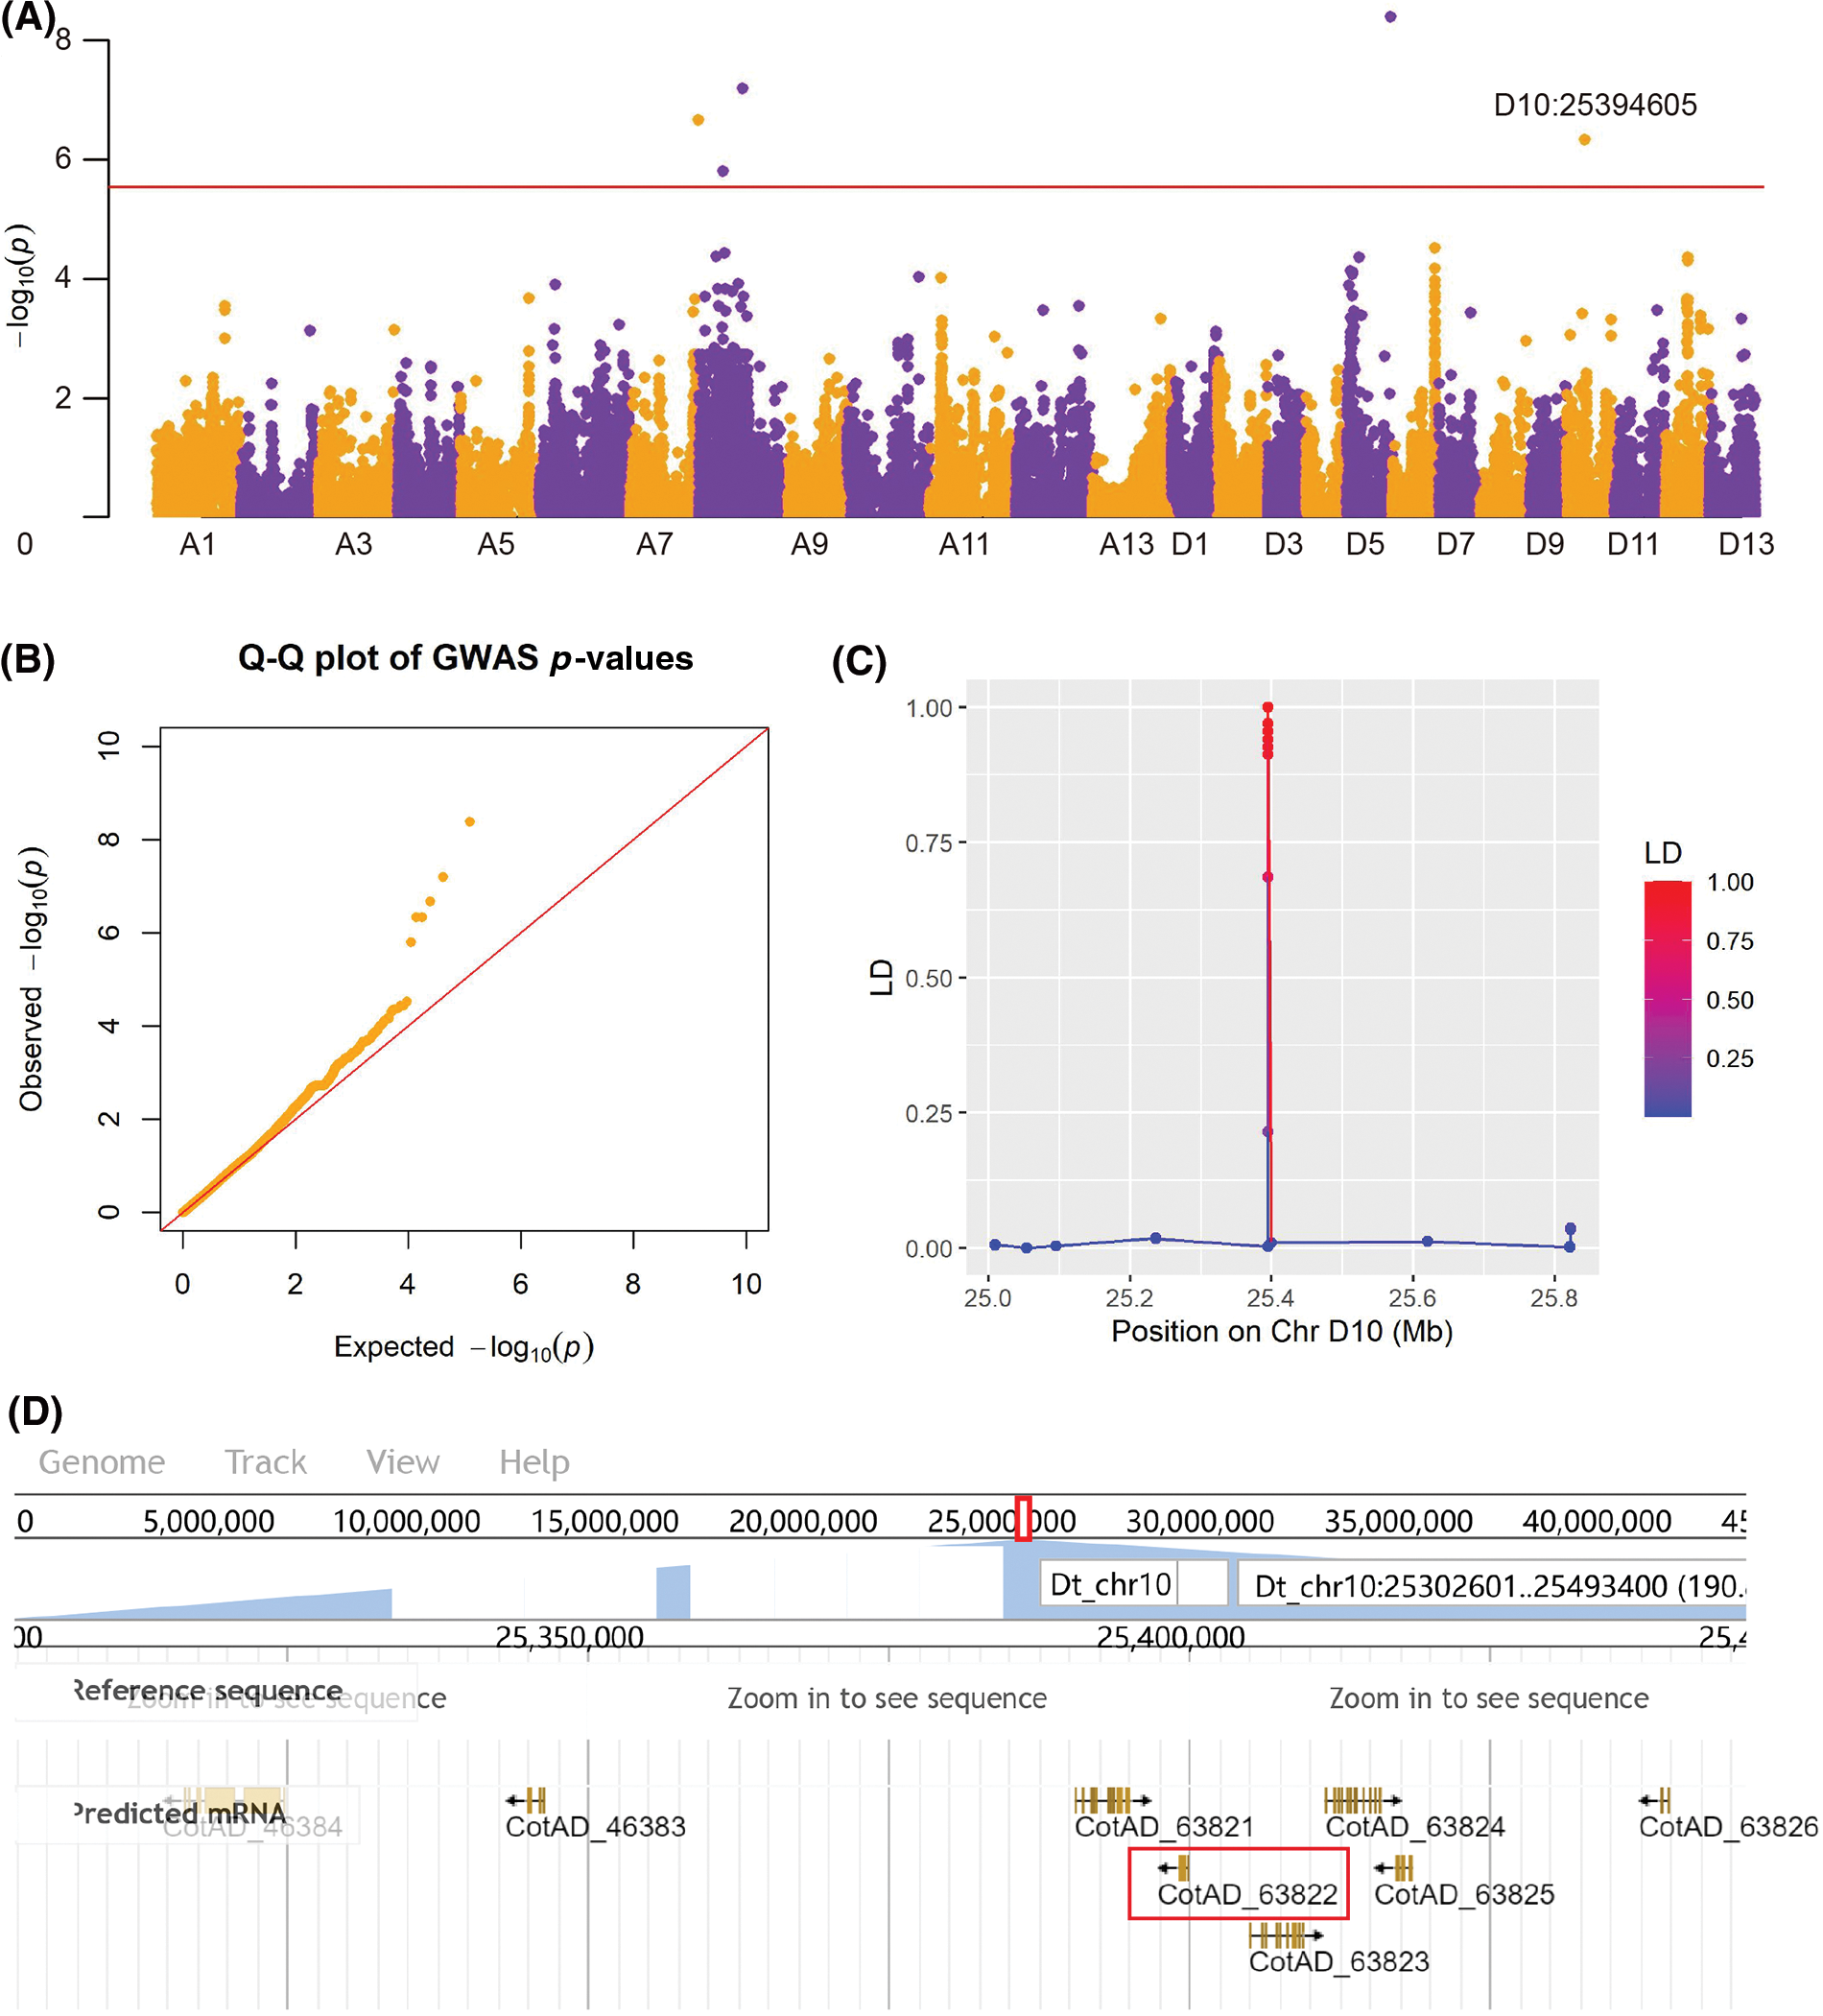
Figure 4: Genome-wide association of FB3 in 2018 identified a candidate gene Pollen Ole e 1 allergen/extension (CotAD_63822). (A) Manhattan plot of SNP-trait associations. (B) Quantile-quantile (Q-Q) plot of the associations. (C) Linkage disequilibrium between D10:25394605 (the peak SNP) and its close SNPs. (D) Candidate genes near the peak association. The candidate genes of interests were highlighted in red rectangular
In addition to the analysis of genetic structure and GWAS, we also examined the heritability of the measured traits. Our results showed that all the measured traits had quite low heritability and a large variation between years (Fig. 5). Among these, the heritability of CB3, CC, DR and FB3 were extremely low, and the heritability of DBs and LA were moderate, with an average value of 0.204 and 0.241, respectively. However, the heritability of DBs and LA in 2017 was much larger than that in 2018.
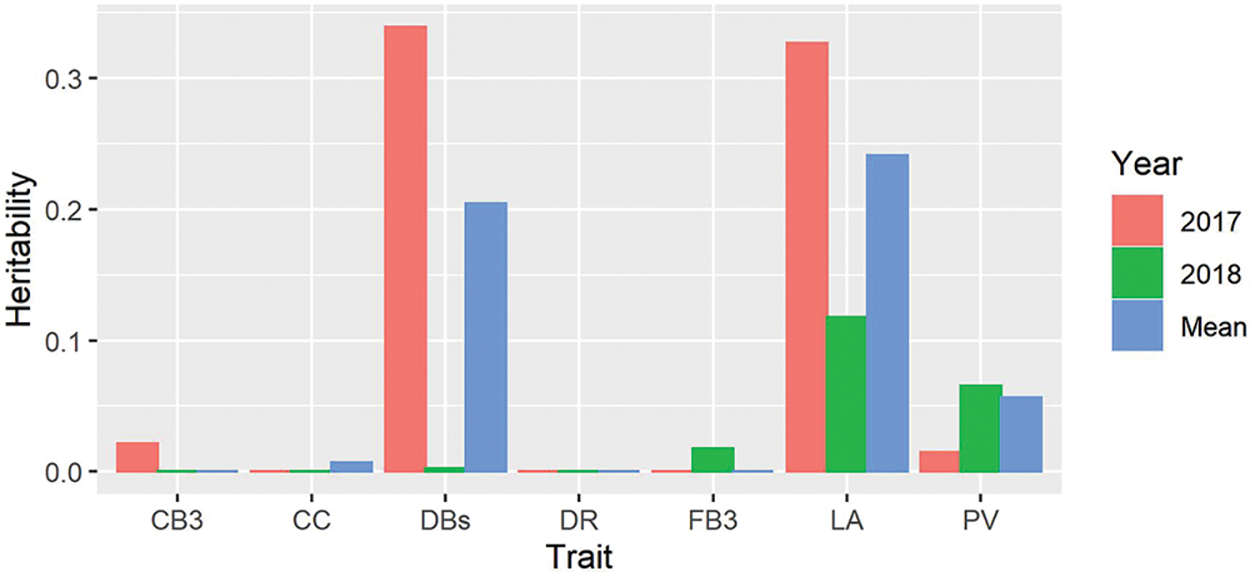
Figure 5: Heritability estimated from the EMMAX for all the traits in 2017 and 2018. PV, pollen vitality; LA, leaf area; CC, chlorophyll content; DBs, the number of dry cotton bolls; FB3, the number of the fall-off cotton bolls from the last three branches; CB3, the number of the cotton bolls from the last three branches; DR, drop ratio
Improving yield is one of the primary goals in cotton breeding, and it involves several important components, such as boll number, boll weight, drop ratio, all of which are controlled by various QTLs with major and minor genetic effects [13,19,22,26]. Identifying new QTLs associated with cotton yield is crucial to dissect the genetic control of yield-related components and to develop new high-yield cultivars. While GWASs have been identified many yield-related QTLs, our understandings of the genetic control remain limited [2,11–13,17,19,20,22,24,26,43]. In this study, we presented a new cotton collection from the main cultivation area in Xinjiang, China, which complements the publicly available cotton genetic and genomic resources.
Understanding the causes of genetic structure and subgrouping in the phylogenetic tree is important for deepening our understandings of genetic diversity history. Geographical diversification has been shown to be one important factor causing genetic structure in wheat [44], tomato [45], pepper [46], lettuce [47], soybean [48] and others. We found that geographical diversification was an important factor causing population structure, but it could not explain all the diversification, indicating that the genetic structure of this cotton collection was complex.
GWAS has great potentials for identifying causal variants of complex quantitative traits in plants [30,49–55], and its applications in cotton has identified dozens of associated loci for different yield and fiber-related traits [2,11–13,17,19,20,22,24,26,43]. GWAS has also been applied to identify associations for resistances [56–59]. Among the associations detected in this study, we identified Pollen Ole e 1 allergen/extension as a candidate gene associated with the fall-off cotton balls from the last three branches. While this gene is primary responsible for the pollen allergy [60], it also played an important role in regulating pollen germination and fertilization [60,61]. Pollen allergens are derived from large gene families and have diversified during long-term evolution. For example, up to 145 and 107 pollen allergens were predicted in the genome of Arabidopsis and rice, respectively, which could play diverse roles in metabolic processes and stress responses during pollen development [62]. Our study provides new candidate genes for quality breeding of cotton, and further functional validation of these candidate genes will be necessary and helpful for deepening our understanding of the genetic control of these important agronomic traits.
In this study, we assessed the phenotypic variation of seven agronomic traits of 273 cotton accessions from 18 geographical regions across two years (2017–2018). We observed significant variations in different geographical regions and only some traits were normally distributed across the collection. Phylogenetic tree and population structure analysis revealed a diverse genetic structure of the core collection, with geographical location accounting for some of the genetic structure. Our genome-wide association study identified 19 significant associated loci, with the Pollen Ole e 1 allergen/extension gene being a candidate gene associated with the fall-off cotton bolls from the last three branches. This study provides deeper insights into the phenotypic and genetic diversity of a new cotton collection and sheds light on new candidate genes associated with important agronomic traits of cotton, which could facilitate the breeding of new cotton varieties.
Acknowledgement: None.
Funding Statement: This work was supported by the Xinjiang Uygur Autonomous Region Major Science and Technology Project (2021A02001-3).
Author Contributions: YL, JZ and JW conceived the project, prepared the data analysis and draft manuscript. XL and QC supervised the project. ZG, ZL, LM, ZZ, ZS, and YQ revised the manuscript. All authors read and approved the final manuscript.
Availability of Data and Materials: The raw reads of upload cotton genome resequencing have been deposited in the CNGBdb-China National GeneBank DataBase (https://db.cngb.org/) under the accession no. CNP0002250. All data generated or analyzed during this study are included in this published article and its supplementary information files.
Conflicts of Interest: The authors declare that they have no conflicts of interest to report regarding the present study.
Supplementary Materials: The supplementary material is available online at https://doi.org/10.32604/phyton.2023.028755.
References
1. Islam, M. S., Thyssen, G. N., Jenkins, J. N., Zeng, L., Delhom, C. D. et al. (2016). A MAGIC population-based genome-wide association study reveals functional association of GhRBB1_A07 gene with superior fiber quality in cotton. BMC Genomics, 17, 903. [Google Scholar] [PubMed]
2. Fang, L., Wang, Q., Hu, Y., Jia, Y., Chen, J. et al. (2017). Genomic analyses in cotton identify signatures of selection and loci associated with fiber quality and yield traits. Nature Genetics, 49, 1089–1098. [Google Scholar] [PubMed]
3. Ma, Z., Zhang, Y., Wu, L., Zhang, G., Sun, Z. et al. (2021). High-quality genome assembly and resequencing of modern cotton cultivars provide resources for crop improvement. Nature Genetics, 53(9), 1385–1391. [Google Scholar] [PubMed]
4. Tatineni, V., Cantrell, R. G., Davis, D. D. (1996). Genetic diversity in elite cotton germplasm determined by morphological characteristics and RAPDs. Crop Science, 36, 186–192. [Google Scholar]
5. May, O. L., Bowman, D. T., Calhoun, D. S. (1995). Genetic diversity of US upland cotton cultivars released between 1980 and 1990. Crop Science, 35, 1570–1574. [Google Scholar]
6. Pillay, M., Myers, G. O. (1999). Plant genetic resources: Genetic diversity in cotton assessed by variation in ribosomal RNA genes and AFLP markers. Crop Science, 39, 1881–1886. [Google Scholar]
7. Liu, S., Cantrell, R. G., McCarty, J. C., Stewart, J. M. D. (2020). Simple sequence repeat-based assessment of genetic diversity in cotton race stock accessions. Crop Science, 40, 1459–1469. [Google Scholar]
8. de Magalhães Bertini, C. H. C., Schuster, I., Sediyama, T., de Barros, E. G., Moreira, M. A. (2006). Characterization and genetic diversity analysis of cotton cultivars using microsatellites. Genetics and Molecular Biology, 29, 321–329. [Google Scholar]
9. Tyagi, P., Gore, M. A., Bowman, D. T., Campbell, B. T., Udall, J. A. et al. (2014). Genetic diversity and population structure in the US upland cotton (Gossypium Hirsutum L.). Theoretical and Applied Genetics, 127, 283–295. [Google Scholar] [PubMed]
10. Hinze, L. L., Hulse-Kemp, A. M., Wilson, I. W., Zhu, Q. H., Llewellyn, D. J. et al. (2017). Diversity analysis of cotton (Gossypium Hirsutum L.) germplasm using the CottonSNP63K. BMC Plant Biology, 17, 1–20. [Google Scholar]
11. Wen, T., Dai, B., Wang, T., Liu, X., You, C. et al. (2019). Genetic variations in plant architecture traits in cotton (Gossypium Hirsutum) revealed by a genome-wide association study. Crop Journal, 7, 209–216. [Google Scholar]
12. Wang, Y., Li, G., Guo, X., Sun, R., Dong, T. et al. (2019). Dissecting the Genetic architecture of seed-cotton and lint yields in upland cotton using genome-wide association mapping. Breeding Science, 69, 611–620. [Google Scholar] [PubMed]
13. Sun, Z., Wang, X., Liu, Z., Gu, Q., Zhang, Y. et al. (2018). A genome-wide association study uncovers novel genomic regions and candidate genes of yield-related traits in upland cotton. Theoretical and Applied Genetics, 131, 2413–2425. [Google Scholar] [PubMed]
14. Yuan, Y., Wang, X., Wang, L., Xing, H., Wang, Q. et al. (2018). Genome-wide association study identifies candidate genes related to seed oil composition and protein content in Gossypium Hirsutum L. Frontiers in Plant Science, 9, 1359. [Google Scholar] [PubMed]
15. Li, C., Fu, Y., Sun, R., Wang, Y., Wang, Q. (2018). Single-locus and multi-locus genome-wide association studies in the genetic dissection of fiber quality traits in upland cotton (Gossypium Hirsutum L.). Frontiers in Plant Science, 9, 1–16. [Google Scholar]
16. Sun, Z., Wang, X., Liu, Z., Gu, Q., Zhang, Y. et al. (2017). Genome-wide association study discovered genetic variation and candidate genes of fibre quality traits in Gossypium Hirsutum. Plant Biotechnology Journal, 15, 982–996. [Google Scholar] [PubMed]
17. Gapare, W., Conaty, W., Zhu, Q. H., Liu, S., Stiller, W. et al. (2017). Genome-wide association study of yield components and fibre quality traits in a cotton germplasm diversity panel. Euphytica, 213, 1–22. [Google Scholar]
18. Su, J., Li, L., Zhang, C., Wang, C., Gu, L. et al. (2018). Genome-wide association study identified genetic variations and candidate genes for plant architecture component traits in Chinese upland cotton. Theoretical and Applied Genetics, 131, 1299–1314. [Google Scholar] [PubMed]
19. Zhu, G., Hou, S., Song, X., Wang, X., Wang, W. et al. (2021). Genome-wide association analysis reveals quantitative trait loci and candidate genes involved in yield components under multiple field environments in cotton (Gossypium Hirsutum). Plant Biology, 21, 1–11. [Google Scholar]
20. Huang, C., Shen, C., Wen, T., Gao, B., Zhu, D. et al. (2021). Genome-wide association mapping for agronomic traits in an 8-way upland cotton MAGIC population by SLAF-seq. Theoretical and Applied Genetics, 134, 2459–2468. [Google Scholar] [PubMed]
21. Liu, W., Song, C., Ren, Z., Zhang, Z., Pei, X. et al. (2020). Genome-wide association study reveals the genetic basis of fiber quality traits in upland cotton (Gossypium Hirsutum L.). BMC Plant Biology, 20, 1–13. [Google Scholar]
22. Geng, X., Sun, G., Qu, Y., Sarfraz, Z., Jia, Y. et al. (2020). Genome-wide dissection of hybridization for fiber quality- and yield-related traits in upland cotton. Plant Journal, 104, 1285–1300. [Google Scholar]
23. Song, C., Li, W., Pei, X., Liu, Y., Ren, Z. et al. (2019). Dissection of the genetic variation and candidate genes of lint percentage by a genome-wide association study in upland cotton. Theoretical and Applied Genetics, 132, 1991–2002. [Google Scholar] [PubMed]
24. Fu, Y., Dong, C., Wang, J., Wang, Y., Li, C. (2019). Genome-wide association study reveals the genetic control underlying node of the first fruiting branch and its height in upland cotton (Gossypium Hirsutum L.). Euphytica, 215, 1–14. [Google Scholar]
25. Su, J., Ma, Q., Li, M., Hao, F., Wang, C. (2018). Multi-locus genome-wide association studies of fiber-quality related traits in Chinese early-maturity upland cotton. Frontiers in Plant Science, 9, 1–13. [Google Scholar]
26. Baytar, A. A., Peynircioğlu, C., Sezener, V., Basal, H., Frary, A. et al. (2018). Genome-wide association mapping of yield components and drought tolerance-related traits in cotton. Molecular Breeding, 38, 74. [Google Scholar]
27. Tam, V., Patel, N., Turcotte, M., Bossé, Y., Paré, G. et al. (2019). Benefits and limitations of genome-wide association studies. Nature Reviews Genetics, 20, 467–484. [Google Scholar] [PubMed]
28. Korte, A., Ashley, F. (2013). The advantages and limitations of trait analysis with GWAS: A review self-fertilisation makes arabidopsis particularly well suited to GWAS. Plant Methods, 9, 29. [Google Scholar] [PubMed]
29. Diouf, I., Derivot, L., Koussevitzky, S., Carretero, Y., Bitton, F. et al. (2020). Genetic basis of phenotypic plasticity and genotype × environment interactions in a multi-parental tomato population. Journal of Exprimental Botany, 71(18), 5365–5376. [Google Scholar] [PubMed]
30. Zhao, J., Sauvage, C., Zhao, J., Bitton, F., Bauchet, G. et al. (2019). Meta-analysis of genome-wide association studies provides insights into genetic control of tomato flavor. Nature Communications, 10(1), 1534. [Google Scholar] [PubMed]
31. Evangelou, E., Ioannidis, J. P. A. (2013). Meta-analysis methods for genome-wide association studies and beyond. Nature Reviews Genetics, 14(6), 379–389. [Google Scholar] [PubMed]
32. Bolger, A. M., Lohse, M., Usadel, B. (2014). Trimmomatic: A flexible trimmer for illumina sequence data. Bioinformatics, 30(15), 2114–2120. [Google Scholar] [PubMed]
33. Li, H., Durbin, R. (2009). Fast and accurate long-read alignment with burrows-wheeler transform. Bioinformatics, 26, 589–595. [Google Scholar]
34. Mckenna, A., Hanna, M., Banks, E., Sivachenko, A., Cibulskis, K. et al. (2010). The genome analysis toolkit: A MapReduce framework for analyzing next-generation DNA sequencing data. Genome Research, 20, 1297–1303. [Google Scholar] [PubMed]
35. Li, H., Handsaker, B., Wysoker, A., Fennell, T., Ruan, J. et al. (2009). The sequence alignment/map format and SAMtools. Bioinformatics, 25(16), 2078–2079. [Google Scholar] [PubMed]
36. Cingolani, P., Platts, A., Wang, L. L., Coon, M., Nguyen, T. et al. (2012). A program for annotating and predicting the effects of single nucleotide polymorphisms, SnpEff. Fly, 6, 80–92. [Google Scholar] [PubMed]
37. Nguyen, L. T., Schmidt, H. A., von Haeseler, A., Minh, B. Q. (2015). IQ-TREE: A fast and effective stochastic algorithm for estimating maximum-likelihood phylogenies. Molecular Biology and Evolution, 32(1), 268–274. [Google Scholar]
38. Kalyaanamoorthy, S., Minh, B. Q., Wong, T. K. F., Von Haeseler, A., Jermiin, L. S. (2017). Fast model selection for accurate phylogenetic estimates. Nature Methods, 14(6), 587–589. [Google Scholar] [PubMed]
39. Raj, A., Stephens, M., Pritchard, J. K. (2014). FastSTRUCTURE: Variational inference of population structure in large SNP data sets. Genetics, 197, 573–589. [Google Scholar] [PubMed]
40. Kang, H. M., Sul, J. H., Service, S. K., Zaitlen, N. A., Kong, S. Y. et al. (2010). Variance component model to account for sample structure in genome-wide association studies. Nature Genetics, 42(4), 348–354. [Google Scholar] [PubMed]
41. Li, M., Yeung, J. M. Y., Cherny, S. S., Sham, P. C. (2012). Evaluating the effective numbers of independent tests and significant p-value thresholds in commercial genotyping arrays and public imputation reference datasets. Human Genetics, 131, 747–756. [Google Scholar] [PubMed]
42. Purcell, S., Neale, B., Todd-Brown, K., Thomas, L., Ferreira, M. A. R. et al. (2007). PLINK: A tool set for whole-genome association and population-based linkage analyses. The American Journal of Human Genetics, 81, 559–575. [Google Scholar] [PubMed]
43. Huang, C., Nie, X., Shen, C., You, C., Li, W. et al. (2017). Population structure and genetic basis of the agronomic traits of upland cotton in china revealed by a genome-wide association study using high-density SNPs. Plant Biotechnology Journal, 15, 1374–1386. [Google Scholar] [PubMed]
44. Zhang, T., Hu, Y., Jiang, W., Fang, L., Guan, X. et al. (2015). Sequencing of allotetraploid cotton (Gossypium hirsutum L. acc. TM-1) provides a resource for fiber improvement. Nature Biotechnology, 33, 531–537. [Google Scholar] [PubMed]
45. Causse, M., Zhao, J., Diouf, I., Wang, J., Lefebvre, V. et al. (2020). Genomic designing of climate-smart vegetable crops. Cham, Switzerland: Springer. [Google Scholar]
46. Tripodi, P., Rabanus-Wallace, M. T., Barchi, L., Kale, S., Esposito, S. et al. (2021). Global range expansion history of pepper (Capsicum spp.) revealed by over 10,000 genebank accessions. Proceedings of the National Academy of Sciences of the United States of America, 118, e2104315118. [Google Scholar] [PubMed]
47. Wei, T., van Treuren, R., Liu, X., Zhang, Z., Chen, J. et al. (2021). Whole-genome resequencing of 445 lactuca accessions reveals the domestication history of cultivated lettuce. Nature Genetics, 53(5), 752–760. [Google Scholar] [PubMed]
48. Liu, Y., Du, H., Liu, Y., Du, H., Li, P. et al. (2020). Pan-genome of wild and cultivated soybeans. Cell, 182, 1–15. [Google Scholar]
49. Atwell, S., Huang, Y. S., Vilhjálmsson, B. J., Willems, G., Horton, M. et al. (2010). Genome-wide association study of 107 phenotypes in Arabidopsis Thaliana inbred lines. Nature, 465, 627–631. [Google Scholar] [PubMed]
50. Kump, K. L., Bradbury, P. J., Wisser, R. J., Buckler, E. S., Belcher, A. R. et al. (2011). Genome-wide association study of quantitative resistance to southern leaf blight in the maize nested. Association Mapping Population, 43, 163–168. [Google Scholar]
51. Li, H., Peng, Z., Yang, X., Wang, W., Fu, J. et al. (2013). Genome-wide association study dissects the genetic architecture of oil biosynthesis in maize kernels. Nature Genetics, 45(1), 43–50. https://doi.org/10.1038/ng.2484 [Google Scholar] [PubMed] [CrossRef]
52. Luo, J. (2015). Metabolite-based genome-wide association studies in plants. Current Opinions in Plant Biology, 24, 31–38. [Google Scholar] [PubMed]
53. Huang, X., Wei, X., Sang, T., Zhao, Q., Feng, Q. et al. (2010). Genome-wide asociation studies of 14 agronomic traits in rice landraces. Nature Genetics, 42(11), 961–967. https://doi.org/10.1038/ng.695 [Google Scholar] [PubMed] [CrossRef]
54. Yano, K., Yamamoto, E., Aya, K., Takeuchi, H., Lo, P. C. et al. (2016). Genome-wide association study using whole-genome sequencing rapidly identifies new genes influencing agronomic traits in rice. Nature Genetics, 48(8), 927–934. [Google Scholar] [PubMed]
55. Fang, C., Ma, Y., Wu, S., Liu, Z., Wang, Z. et al. (2017). Genome-wide association studies dissect the genetic networks underlying agronomical traits in soybean. Genome Biology, 18(1), 161. [Google Scholar] [PubMed]
56. Sun, H., Meng, M., Yan, Z., Lin, Z., Nie, X. et al. (2019). Genome-wide association mapping of stress-tolerance traits in cotton. Crop Journal, 7(1), 77–88. [Google Scholar]
57. Abdelraheem, A., Elassbli, H., Zhu, Y., Kuraparthy, V., Hinze, L. et al. (2020). A genome-wide association study uncovers consistent quantitative trait loci for resistance to verticillium wilt and fusarium wilt race 4 in the US upland cotton. Theoretical and Applied Genetics, 133(2), 563–577. [Google Scholar] [PubMed]
58. Zhang, J., Abdelraheem, A., Thyssen, G. N., Fang, D. D., Jenkins, J. N. et al. (2020). Evaluation and genome-wide association study of verticillium wilt resistance in a MAGIC population derived from intermating of eleven upland cotton (Gossypium hirsutum) parents. Euphytica, 216, 1–13. [Google Scholar]
59. Li, T., Ma, X., Li, N., Zhou, L., Liu, Z. et al. (2017). Genome-wide association study discovered candidate genes of verticillium wilt resistance in upland cotton (Gossypium hirsutum L.). Plant Biotechnology Journal, 15, 1520–1532. [Google Scholar] [PubMed]
60. Huang, X., Yan, H., Wu, Z., Yi, Y. (2020). Putative allergens identified in mango (Mangifera indica Linn) leaf and fruit with transcriptome analysis. Journal of Food Science and Technology, 5, 98–110. [Google Scholar]
61. De Dios Alché, J., M’rani-Alaoui, M., Castro, A. J., Rodríguez-García, M. I. (2014). Ole e 1, the major allergen from olive (Olea europaea L.) pollen, increases its expression and is released to the culture medium during in vitro germination. Plant Cell Physiology, 45, 1149–1157. [Google Scholar]
62. Chen, M., Xu, J., Devis, D., Shi, J., Ren, K. et al. (2016). Origin and functional prediction of pollen allergens in plants. Plant Physiology, 172, 341–357. [Google Scholar] [PubMed]
Cite This Article
 Copyright © 2023 The Author(s). Published by Tech Science Press.
This work is licensed under a Creative Commons Attribution 4.0 International License , which permits unrestricted use, distribution, and reproduction in any medium, provided the original work is properly cited.
 Downloads
 Citation Tools