
 Submit a Paper
 Propose a Special lssue
 Open Access
ARTICLE

Global and Comparative Proteome Analysis of Nitrogen-Stress Responsive Proteins in the Root, Stem and Leaf of Brassica napus
1 Crop Science Institute, Sichuan Academy of Agricultural Sciences, Chengdu, 610066, China
2 Environment-Friendly Crop Germplasm Innovation and Genetic Improvement Key Laboratory of Sichuan Province, Chengdu, 610066, China
* Corresponding Authors: Haojie Li. Email: ; Liangcai Jiang. Email:
(This article belongs to the Special Issue: Plant Omics in Challenging Environment)
Phyton-International Journal of Experimental Botany 2023, 92(3), 645-663. https://doi.org/10.32604/phyton.2023.024717
Received 06 June 2022; Accepted 29 August 2022; Issue published 29 November 2022
 View Full Text
 Download PDF
Abstract
Nitrogen (N) is one of the basic nutrients and signals for plant development and deficiency of it would always limit the productions of crops in the field. Quantitative research on expression of N-stress responsive proteins on a proteome level remains elusive. In order to gain a deep insight into the proteins responding to nitrogen stress in rapeseed (Brassica napus L.), comparative proteomic analysis was performed to investigate changes of protein expression profiles from the root, stem and leaf under different N concentrations, respectively. More than 200 differential abundance proteins (DAPs) were detected and categorized into groups according to annotations, including “binding and catalytic activity”, “involved in primary metabolism and cellular processes”, “stress-response” and so on. Variation in chlorophyll (Chl) content and antioxidant activities further revealed that oxidative stress raised with the increase of N concentration. Bioinformatics analysis based on the expression level of total proteins suggested these DAPs might play important roles in adaptation to N-stress conditions. Generally, these results provides a new aspect into N-stress responding proteins in Brassica plants.Keywords
Supplementary Material
Supplementary Material FileNitrogen (N) is one of the essential nutrients for plants serving as a constituent of nucleotides and proteins [1], and more importantly, it also serves as a signal molecule to regulate the metabolism, as well as the development of plants [2,3]. Improving crop production with less N fertilizer input and high nitrogen use efficiency (NUE) is a major aim for sustainable agriculture [4–8]. Nitrate in soil is labile, hard to be maintained and easy to be returned to the environment [1], making biologically available nitrogen always in short supply in terrestrial ecosystems. With low NUE, nonlegume plants need 20–50 g N element absorbed by their roots to produce 1 kg dry biomass, and the natural supply of soil N usually restricts plant yields in most agricultural cropping systems [1,9]. Every year, millions of tons of N fertilizer are used to ensure agriculture production, which has played an important role in maintaining high crop yield and decreasing world hunger during the past decades [10]. However, the increasing usage amount, on the other hand, has also led to the growing burden to farmers and arisen well-documented energy and environmental costs [9,11]. Therefore, it is necessary to reduce the N fertilizer usage amount or increase NUE of crops [12]. Thus, it reveals the molecular mechanisms underlying acclimation and response to N deficiency is an emerging issue in this field.
Many studies indicate that plants have evolved complicated strategies to adapt themselves to either short-term or long-term N-deficiency stress [2,3,13]. A large set of genome-wide data is available regarding the transcriptional and proteome changes induced by N deficiency in Arabidopsis, sorghum or other plant species [14–18]. Those studies have laid a valid foundation for revealing the molecular mechanism underlying N deficiency response in plants. As one of the dominant oilseed crops worldwide, rapeseed (Brassica napus L.) requires high amounts of N element but suffers low use efficiency of it [19]. Additionally, as a rotation crop, rapeseed is always cultivated in soils with nutrient deficiency conditions, including N-deficiency. Although protein expression profiles in response to boron (B) or phosphorus (P) deficiency on proteomic level were reported previously [20,21], there have been seldom reports about proteomic data under N-stress in rapeseed to date. Therefore, having a deep understanding of the mechanism for N response is essential to improve its use efficiency.
Comparative proteomic analysis between untreated and stress-treated conditions has been used to identify major proteins involved in stress responses in rice [22]. Throughout understanding of the cellular process in rapeseed associated with N-stress conditions it could be revealed based on the analysis of proteome complement. In this study, we treated rapeseed seedlings under different N concentrations and then detected proteins from roots, stems and leaves, respectively; followed by DAPs identification and their functional analysis. Moreover, some basic metabolisms such as carbohydrate metabolism, photosynthesis processes, enzyme activities and organic acid production were also found regulated by N stresses. Thus, it provided new insights into the proteome changes of rapeseed response to N stress.
2.1 Plant Materials and Growth Conditions
Seeds of rapeseed were surface-sterilized for 20 min in 0.5% (w/v) sodium hypochlorite solution and washed at least three times by distilled water. After that, seeds were germinated on moistened gauze in a black plastic tray filled with deionized water. Rapeseeds were cultivated as described by Basu et al. [23].
After the emergence of the first true leaf, seedlings were transferred into a modified system consisting of four different N concentrations respectively: 0%, 10%, 50% and 100% N element relative content compared with standard MS media (100% N element relative content), where N element was supplied in the form of ammonium nitrate (NH4NO3), for 18 days. The MS solution [24] was refreshed once a week. Roots, stems and leaves from each plant under different treatments were sampled [20] respectively, for further research. The first two euphylla next to the cotyledon from five seedlings were sampled, respectively. Three biological repetitions were conducted for each sample.
After N treatments, the leaf, stem and root were sampled respectively for protein extraction, according to the description by Hurkman et al. [25]. Liquid nitrogen was used to grind the samples (1 g each). Consequently, four volumes of lysis buffer was added to the sample in each centrifuge tube, followed by sonication for three times on ice. After centrifugation at 12,000 g at 4°C for 10 min, the remaining debris was removed. Then, the supernatant was collected and the protein concentration was determined by BCA kit (Meilun Biotechnology, Dalian, China).
2.3 Tryptic Digestion and TMT Labeling
Protein solution from each sample was treated successively with 5 mmol/L dithiothreitol at 56°C for 30 min and alkylated with 11 mmol/L iodoacetamide at RT in darkness for 15 min. The protein sample was then diluted by 100 mmol/L triethyl ammonium bicarbonate (TEAB) to make sure urea concentration ≤2 mol/L. Digestion was performed by adding trypsin at a 1:50 (trypsin:protein) ratio at 37°C overnight; then at a 1:100 (trypsin:protein) ratio for another 4 h.
After trypsin digestion, peptide was desalted by Strata X C18 SPE column (Phenomenex, California, USA) and vacuum-dried. Peptide was reconstituted in 0.5 M TEAB and labeled according to the instruction for TMT kit (ThermoFisher, Massachusetts, USA).
2.4 HPLC Fractionation, Mass Spectrometry and Database Searching
The tryptic peptides were fractionated into fractions by high pH reverse-phase HPLC using Agilent 300 Extend C18 column as the earlier report [26]. The LC-MS/MS analysis was performed based on a minor modified description by Cai et al. [27].
The generated data was then processed using Maxquant search engine (v.1.5.2.8), with the same parameters to Sun et al. [28], and the B. napus protein database (www.brassicadb.org) was used.
Proteins with at least a two-fold change in expression level between treated sample and control and a p-value smaller than 0.05 were defined as DAPs. Gene Ontology (GO) annotation proteome was derived from the UniProt-GOA database (http://www.ebi.ac.uk/GOA/). GO enrichment analysis was performed with topGO (www.bioconductor.org). For each category, a two-tailed Fisher’s exact test was employed and a GO term with a p-value < 0.05 was regarded as significantly enriched. Metabolism pathway annotation and subcellular localization prediction of proteins were employed by Kyoto Encyclopedia of Genes and Genomes (KEGG) database and WoLFPSORT (http://wolfpsort.org/), respectively. Unsupervised clustering was performed using the fuzzy c-means algorithm as implemented in the Mfuzz [29] package in R.
2.6 Chlorophyll Content and Activities of Antioxidant Enzymes
To investigate the effect of N-deficiency stress on rapeseed leaves, the contents of chlorophyll (Chl) and malonyldialdehyde (MDA), and the enzyme activities of superoxide dismutase (SOD), catalase (CAT) and peroxidase (POD) were determined. Leaves under NL0.1, NL0.5 and NL1 treatments were sampled, respectively. 0.08 g leaves from each sample were collected and then the Chl content was determined [30,31]. The MDA content was measured with TBA method [32]. Activities of antioxidants enzymes [33], like SOD [34], POD and CAT [35], were determined according to the instructions of their kits (Nanjing Jiancheng Bioengineering Institute, Nanjing, China). The mean values for the abovementioned biochemical indexes and standard deviations were calculated from the results of three independent tests. Significance of differences were compared by Student’s t tests by using Microsoft Excel 2013 at a level of p-value < 0.05.
3.1 Identification of DAPs in Response to N-Stress
To gain a global view of the N-stress responsive proteome in rapeseed, seedlings were treated under four N concentration conditions. Samples of root, stem and leaf were separately named as NR, NS and NL, respectively; while 0%, 10%, 50%, 100% of relative N concentration treatments were assigned as N0, N0.1, N0.5 and N1, respectively. In N-free condition (NS0), stem failed to be sampled because they were too puny to be collected.
In all rapeseed samples, the relative concentration of N at 50% was the appropriate concentration for rapeseed seedlings in our test, whereas either higher or lower N concentration conditions would limit the development of rapeseed at the two-leaf or five-leaf stage in N0, N0.1 and N1 condition (Figs. 1a and 1b). Therefore, the N0.5 group, including NR0.5, NL0.5 and NS0.5, was selected as control in this study. For those rapeseed seedlings samples, peptides identification was carried out by the freely available software Maxquant searching against B. napus protein database. Finally, a total of 14813 proteins were identified with LC-MS/MS analysis, and 12,452 among them were successfully quantified, including 1,075 proteins which showed significant expression levels between control and the treated samples.
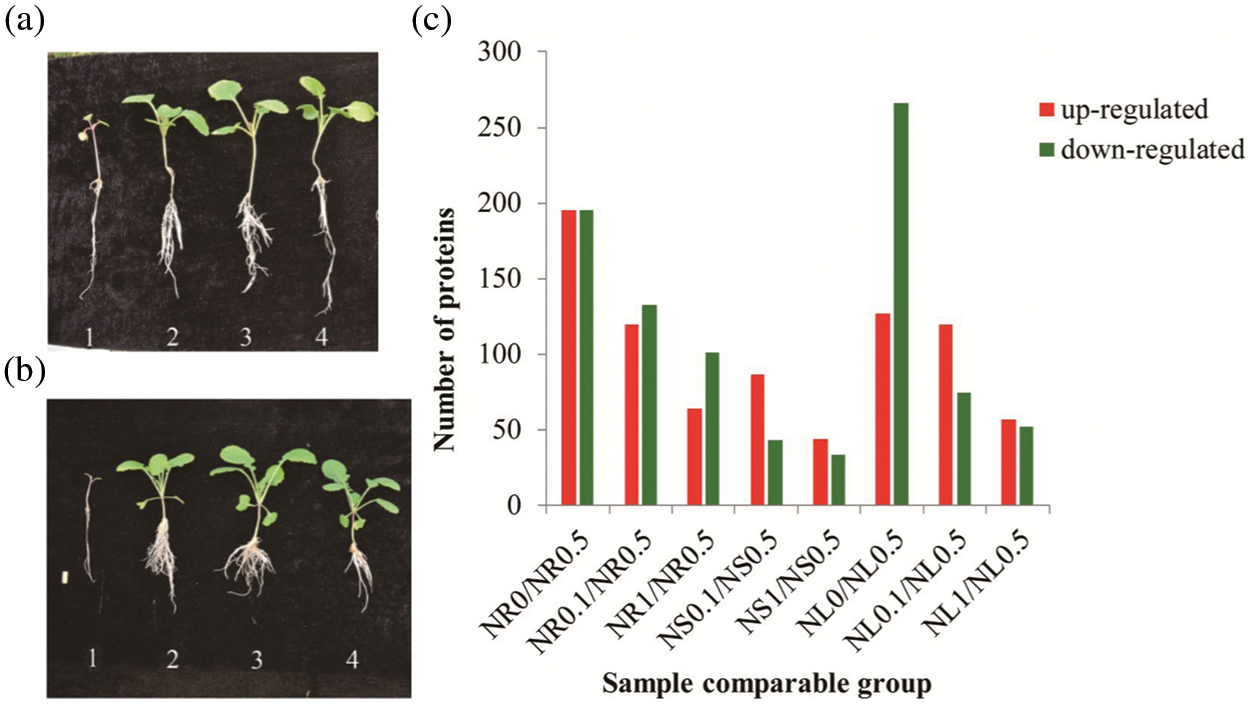
Figure 1: Morphological and comparative proteomic analyses of roots, stems and leaves of rapeseed samples under different N concentration conditions. (a) The morphological appearance of rapeseed seedlings under 0%, 10%, 50% and 100% of N concentration in MS media from left to right (1–4) at two-leaf stage. (b) The morphological appearance of rapeseed seedlings under 0%, 10%, 50% and 100% of N concentration in MS media were shown from left to right (1–4) at five-leaf stage. (c) DAPs between the same tissues at different N concentration conditions and between different tissues at the same N concentration were identified based on protein expression level
Compared with the control (N0.5), samples in NR0, NR0.1 and NR1 obtained 146, 109 and 64 proteins increasing their expression abundance, respectively; while 177, 130 and 101 proteins were down-regulated in the three treatments, respectively (Fig. 1c). In stem, there are 44 proteins which were up-regulated both in NS0.1 and NS1 samples. 50 and 34 proteins were down-regulated separately as a result of NS0.1 and NS1 treatments, respectively (Fig. 1c). In leaf, 75, 112 and 57 proteins were up-regulated, while 294, 74 and 52 proteins exhibited a decreasing expression tendency in NL0, NL0.1 and NL1 samples, respectively (Fig. 1c). In N-free condition, no stem was collected because of the failure of its sampling. The above results indicated that the N0 treatment produced the most DAPs in the leaf, while N0.1 and N1 treatments generated more DAPs in the root.
3.2 Functional Analysis of DAPS in the Root
To deeply understand the functions of the identified DAPs in N-stress in roots, we further performed the Gene Ontology (GO) analysis. Functional classifications were defined using level 2 GO terms. Finally, all of the proteins were categorized into various groups according to their GO terms. In root, most of those DAPs were involved in metabolism processes, cellular processes and single-organism processes under different N-stress conditions. Surprisingly, over 60 proteins related to metabolism were affected in other three N concentration conditions when compared with NR0.5 as control (Figs. 2a–2f). In addition, proteins with catalytic activity and binding functions were the most DAPs affected by N-free condition, accounting for more than 70% of all DAPs.
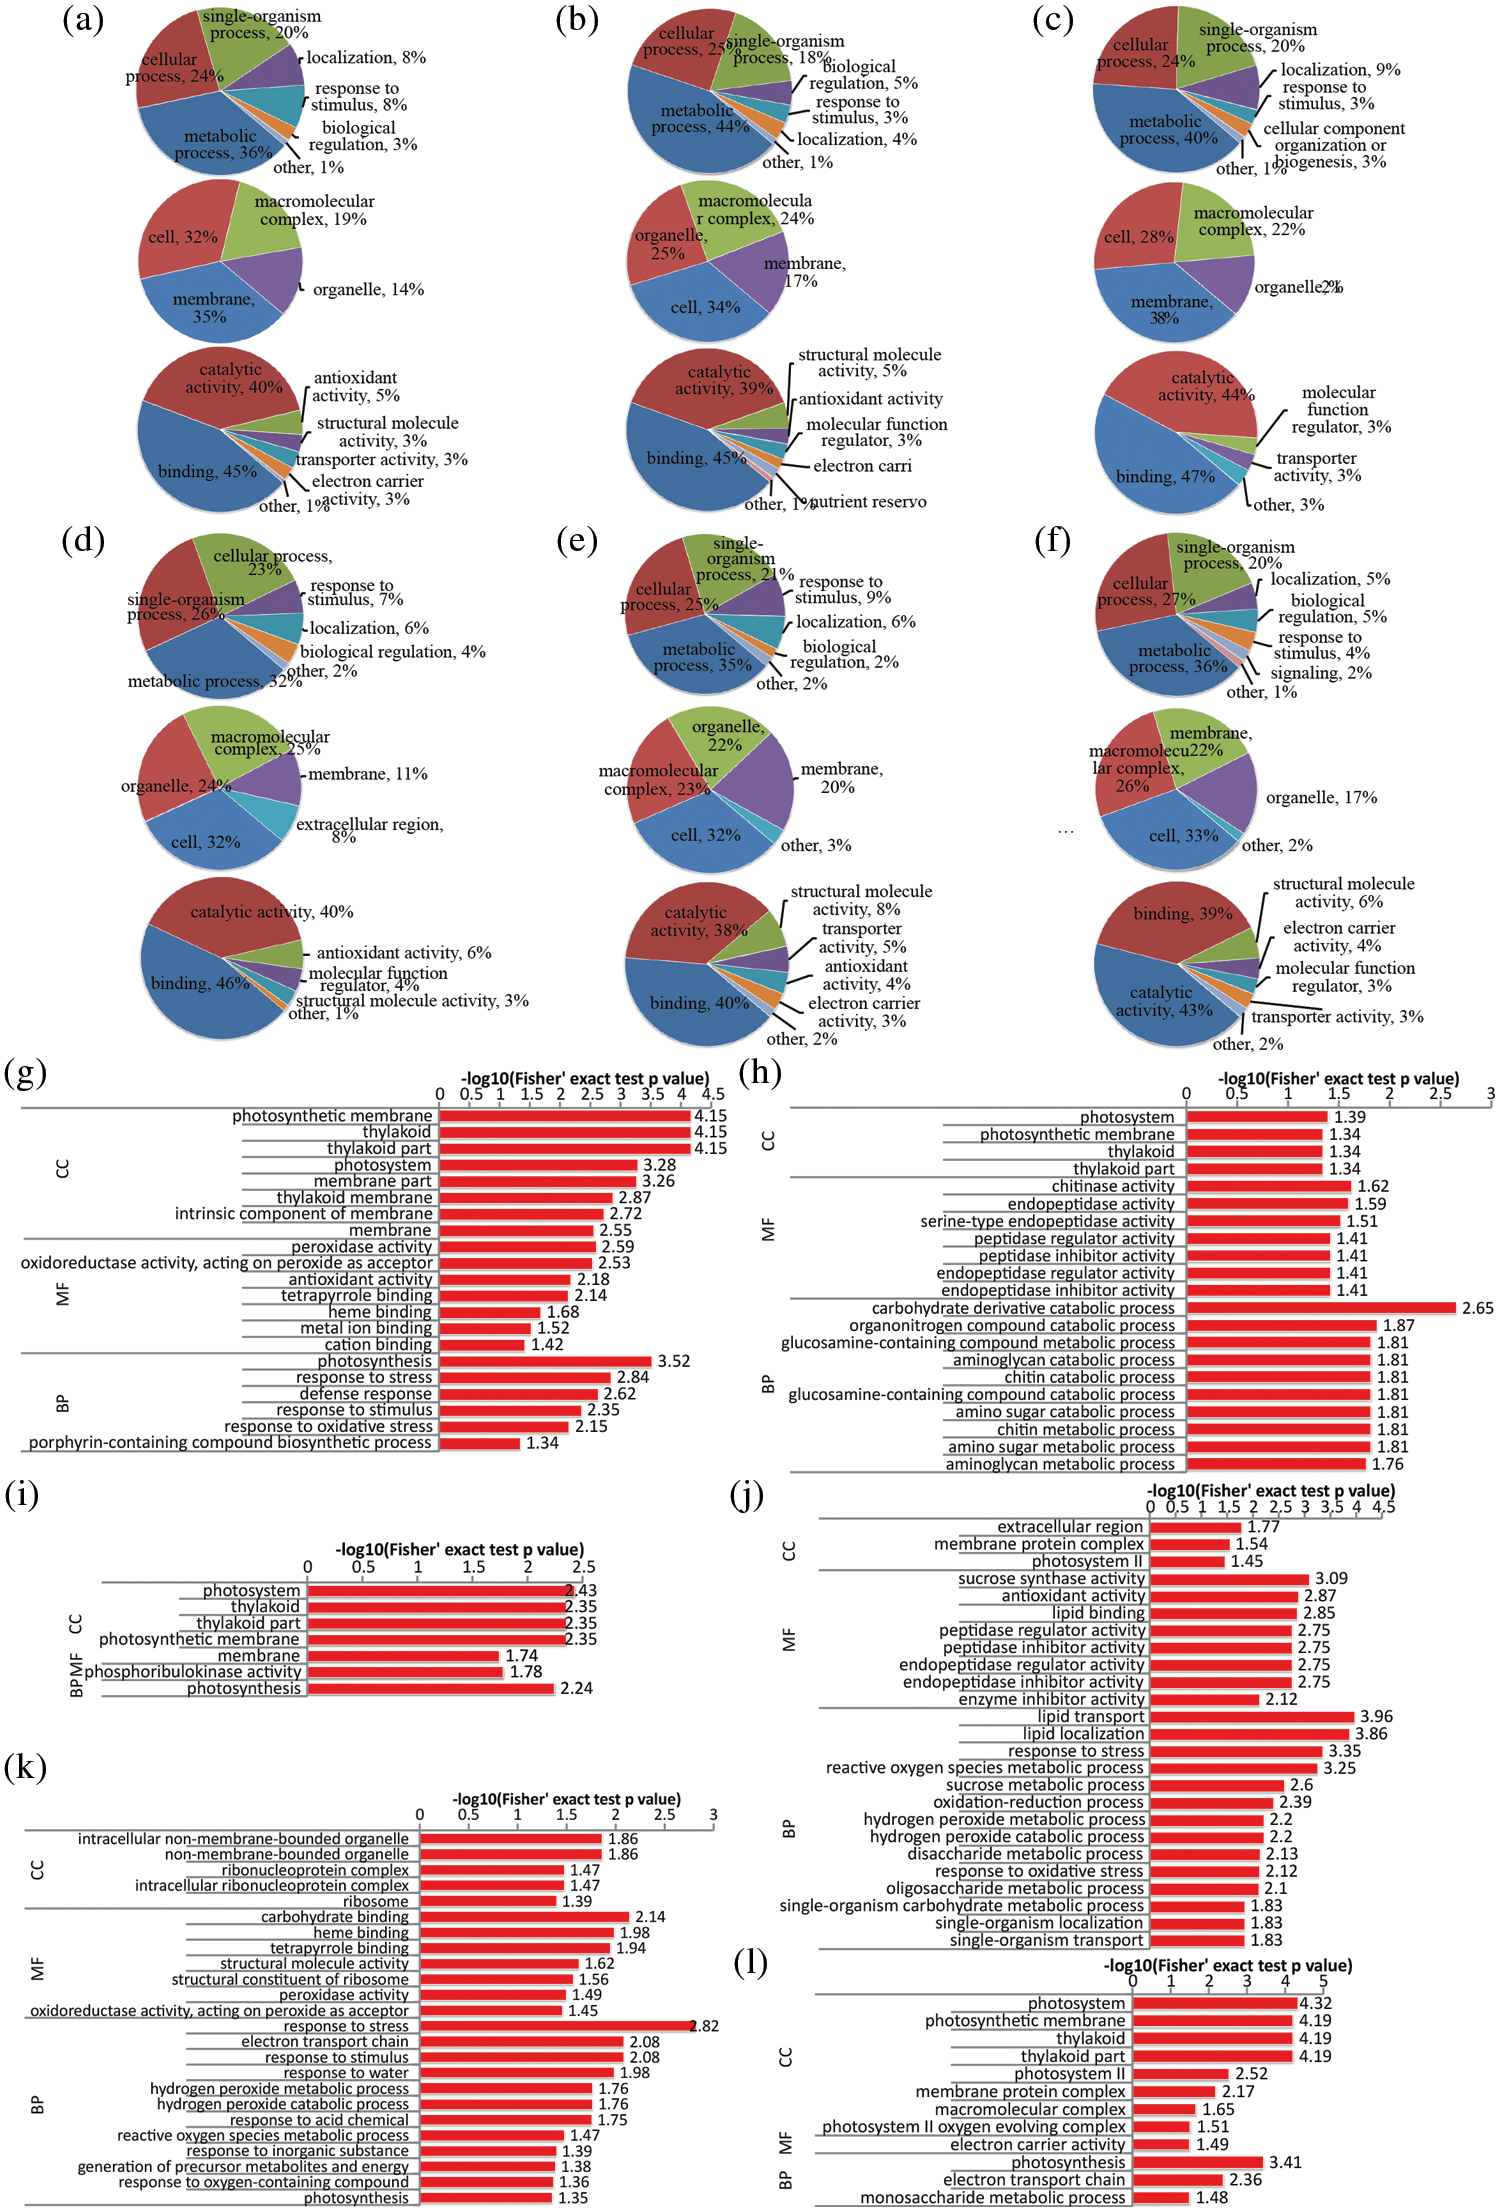
Figure 2: Functional classification and GO enrichment analysis of DAPs in the root of rapeseed. (a, b and c) functional classification of up-regulated proteins in NR0, NR0.1 and NR1, respectively; (d, e and f) functional classification of down-regulated proteins under the three treatments, respectively; (g, h and i) GO enrichment analysis of up-regulated proteins in NR0, NR0.1 and NR1, respectively; (j, k and l) GO enrichment analysis of down-regulated proteins under the three treatments, respectively. NR0.5 was used as control, and GO terms with p-value < 0.05 were identified as significantly enriched
Due to the fundamental role of N element, plants could adjust the basic metabolism processes in response to different N concentrations. In order to gain an insight into the cellular processes affected by N-stress, functional enrichment analysis was performed to identify GO terms, including biological process (BP), molecular function (MF) and cellular component (CC) ontologies. GO enrichment analysis of DAPs between NR0 and NR0.5 suggested that the photosynthesis process, response to stimulus, especially for oxidative stress, lipid metabolic process as well as carbohydrate metabolic process were all affected by N-deficiency condition (Figs. 2g and 2j). Many proteins involved in metabolic process of carbohydrate, organ nitrogen compound, chitin and amino glycan were all up-regulated in N-deficient condition while other proteins response to kinds of stress were down-regulated (Figs. 2h and 2k). Conversely, high-N stress mainly affected the photosynthesis and monosaccharide metabolic processes (Figs. 2i and 2l), with several proteins carrying electron carrier activity function, and were down-regulated in their expression level.
3.3 Functional Analysis of DAPs in the Leaf
DAPs identified from leaf tissue were also classified based on their GO analysis (Fig. 3). In NL0 conditions, more than 20 proteins were located in the chloroplast and involved in the photosynthesis process, and their expression levels were significantly down-regulated, while proteins in the carbohydrate metabolic process were also down-regulated at the same time (Figs. 3a and 3d). Moreover, generally, in N-deficient conditions (Figs. 3b and 3e), expression levels of the oxidative stress associated proteins were significantly up-regulated while proteins in metabolism processes which related to glucose, oxoacid, and carboxylic acid were markedly down-regulated. Under high-N conditions (Figs. 3c and 3f), some peroxidases involved in hydrogen peroxide metabolic process and oxidative stress response were induced by high-N stress, exhibiting an up-regulated expression tendency, and some other peroxidase family proteins were down-regulated. Apart from that, proteins in glycolytic process were also significantly up-regulated in high-N stress. GO enrichment analysis of DAPs (Figs. 3g–3l) suggested that hydrogen peroxide metabolic process (GO:0042743) was significantly enriched under high-N conditions with the increased expression levels of six peroxidase proteins, including A0A078IQH8, A0A078CES8, A0A078G4Z5, A0A078DYG3, A0A078HM16 and A0A078C7Q5. Some other peroxidase like proteins involved in ROS response were down-regulated under N-high conditions, including A0A078DC38, A0A078F2Y3, A0A078IWI1 and A0A078EDR4. Collectively, these results suggested that the abnormal N concentration in the environment could trigger the oxidative stress with aberrant hydrogen peroxide metabolic process, while N-free conditions mainly affected the basic photosynthesis processes in rapeseed leaves.
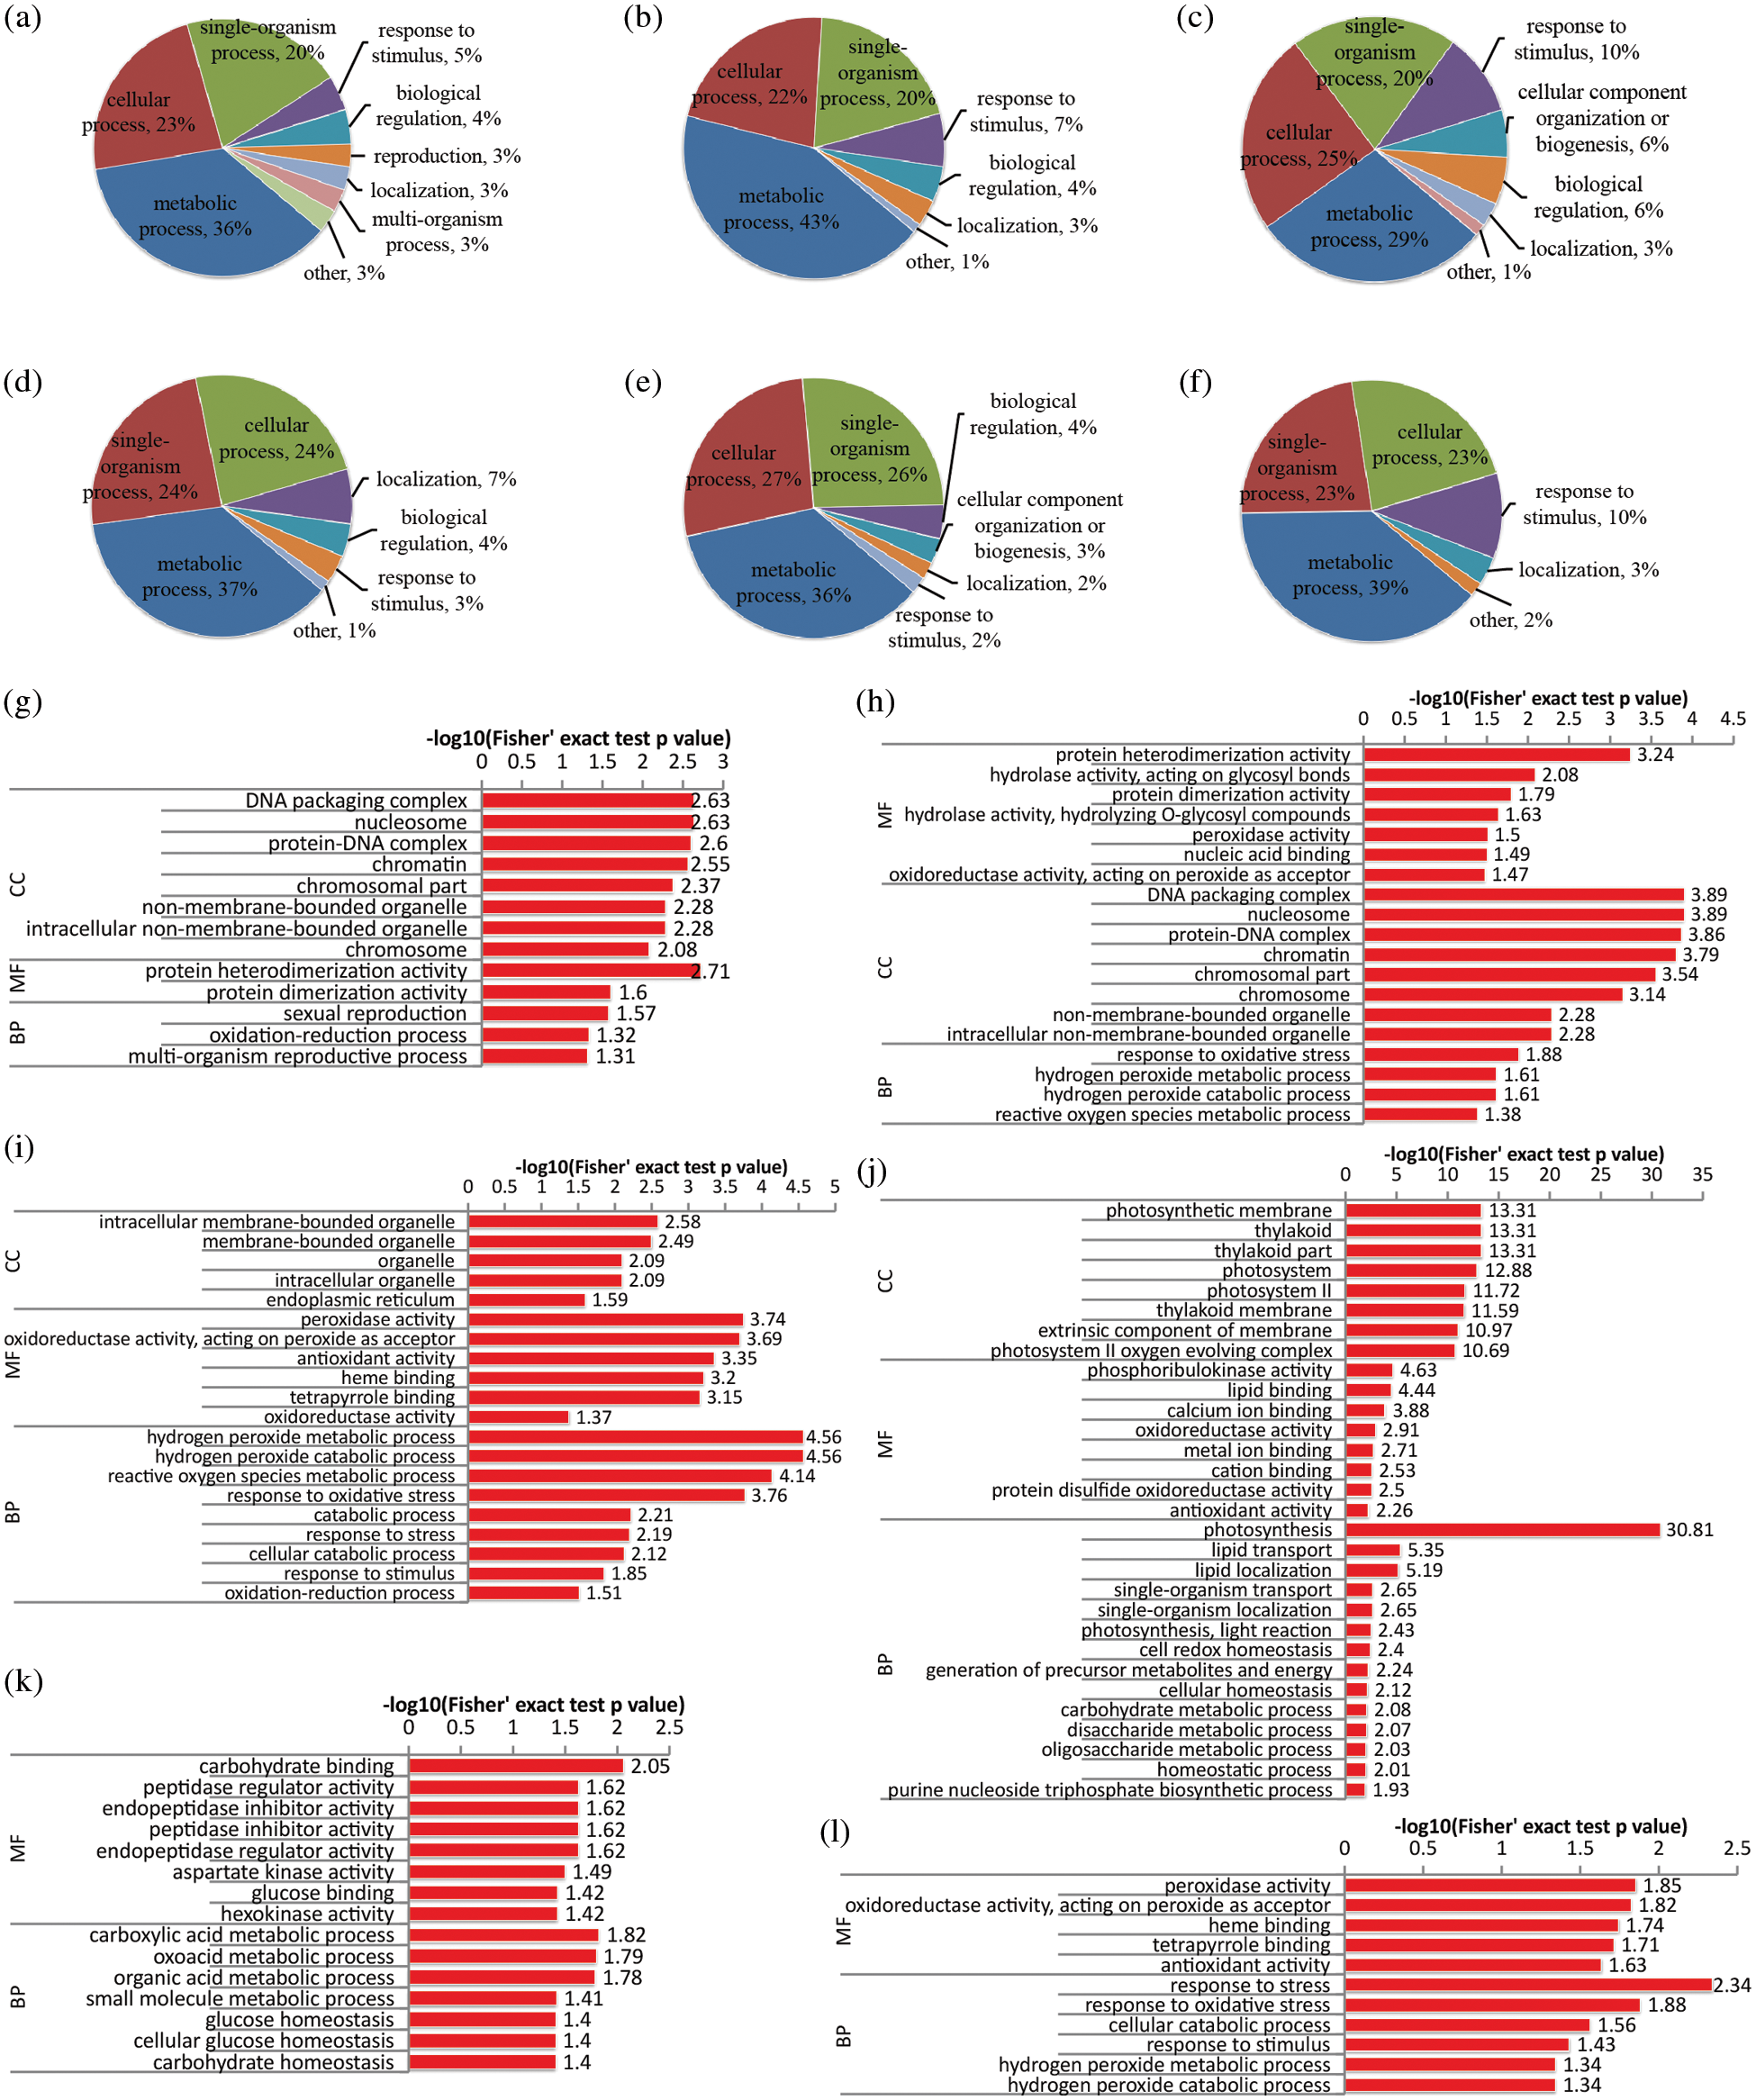
Figure 3: Functional classification and GO enrichment analysis of DAPs in the leaf of rapeseed. (a, b and c) functional classification of up-regulated proteins in NL0, NL0.1 and NL1, respectively; (d, e and f) functional classification of down-regulated proteins under the three treatments, respectively; (g, h and i) GO enrichment analysis of up-regulated proteins in NL0, NL0.1 and NL1, respectively; (j, k and l) GO enrichment analysis of down-regulated proteins under the three treatments, respectively. NL0.5 was used as control, and GO terms with p-value < 0.05 were identified as significantly enriched
3.4 Functional Analysis of DAPs in the Stem
In stem tissue, only samples cultivated in MS medium with 10%, 50% and 100% of N concentrations, i.e., NS0.1, NS0.5 and NS1, were collected because of the failure of stem tissue collection from the rapeseed seedling in N-free (NS0) samples. Comparing with control (NS0.5), less than 100 DAPs were obtained in the treatment of N-deficiency (Figs. 4a and 4c) or high-N (Figs. 4b and 4d). Under N-deficient conditions, besides the four common biological processes, single-organism process, metabolic process, localization and cellular process, proteins involved in response to stimulus, such as peroxidase proteins (A0A078IZ52 and A0A078IQH8) and ras-like protein (A0A078JCX4), were also up-regulated after the N-deficient treatment. GO enrichment analysis (Figs. 4e–4h) suggested that processes involved in carbohydrate metabolism and other metabolic processes were also inhibited under N-deficient conditions. Under high-N conditions, some proteins (A0A078JFZ1, A0A078D829 and A0A078DYG3) that associated with oxidative stress were significantly influenced, while the proteins involved in oxoacid metabolic and organic acid metabolic were down-regulated.
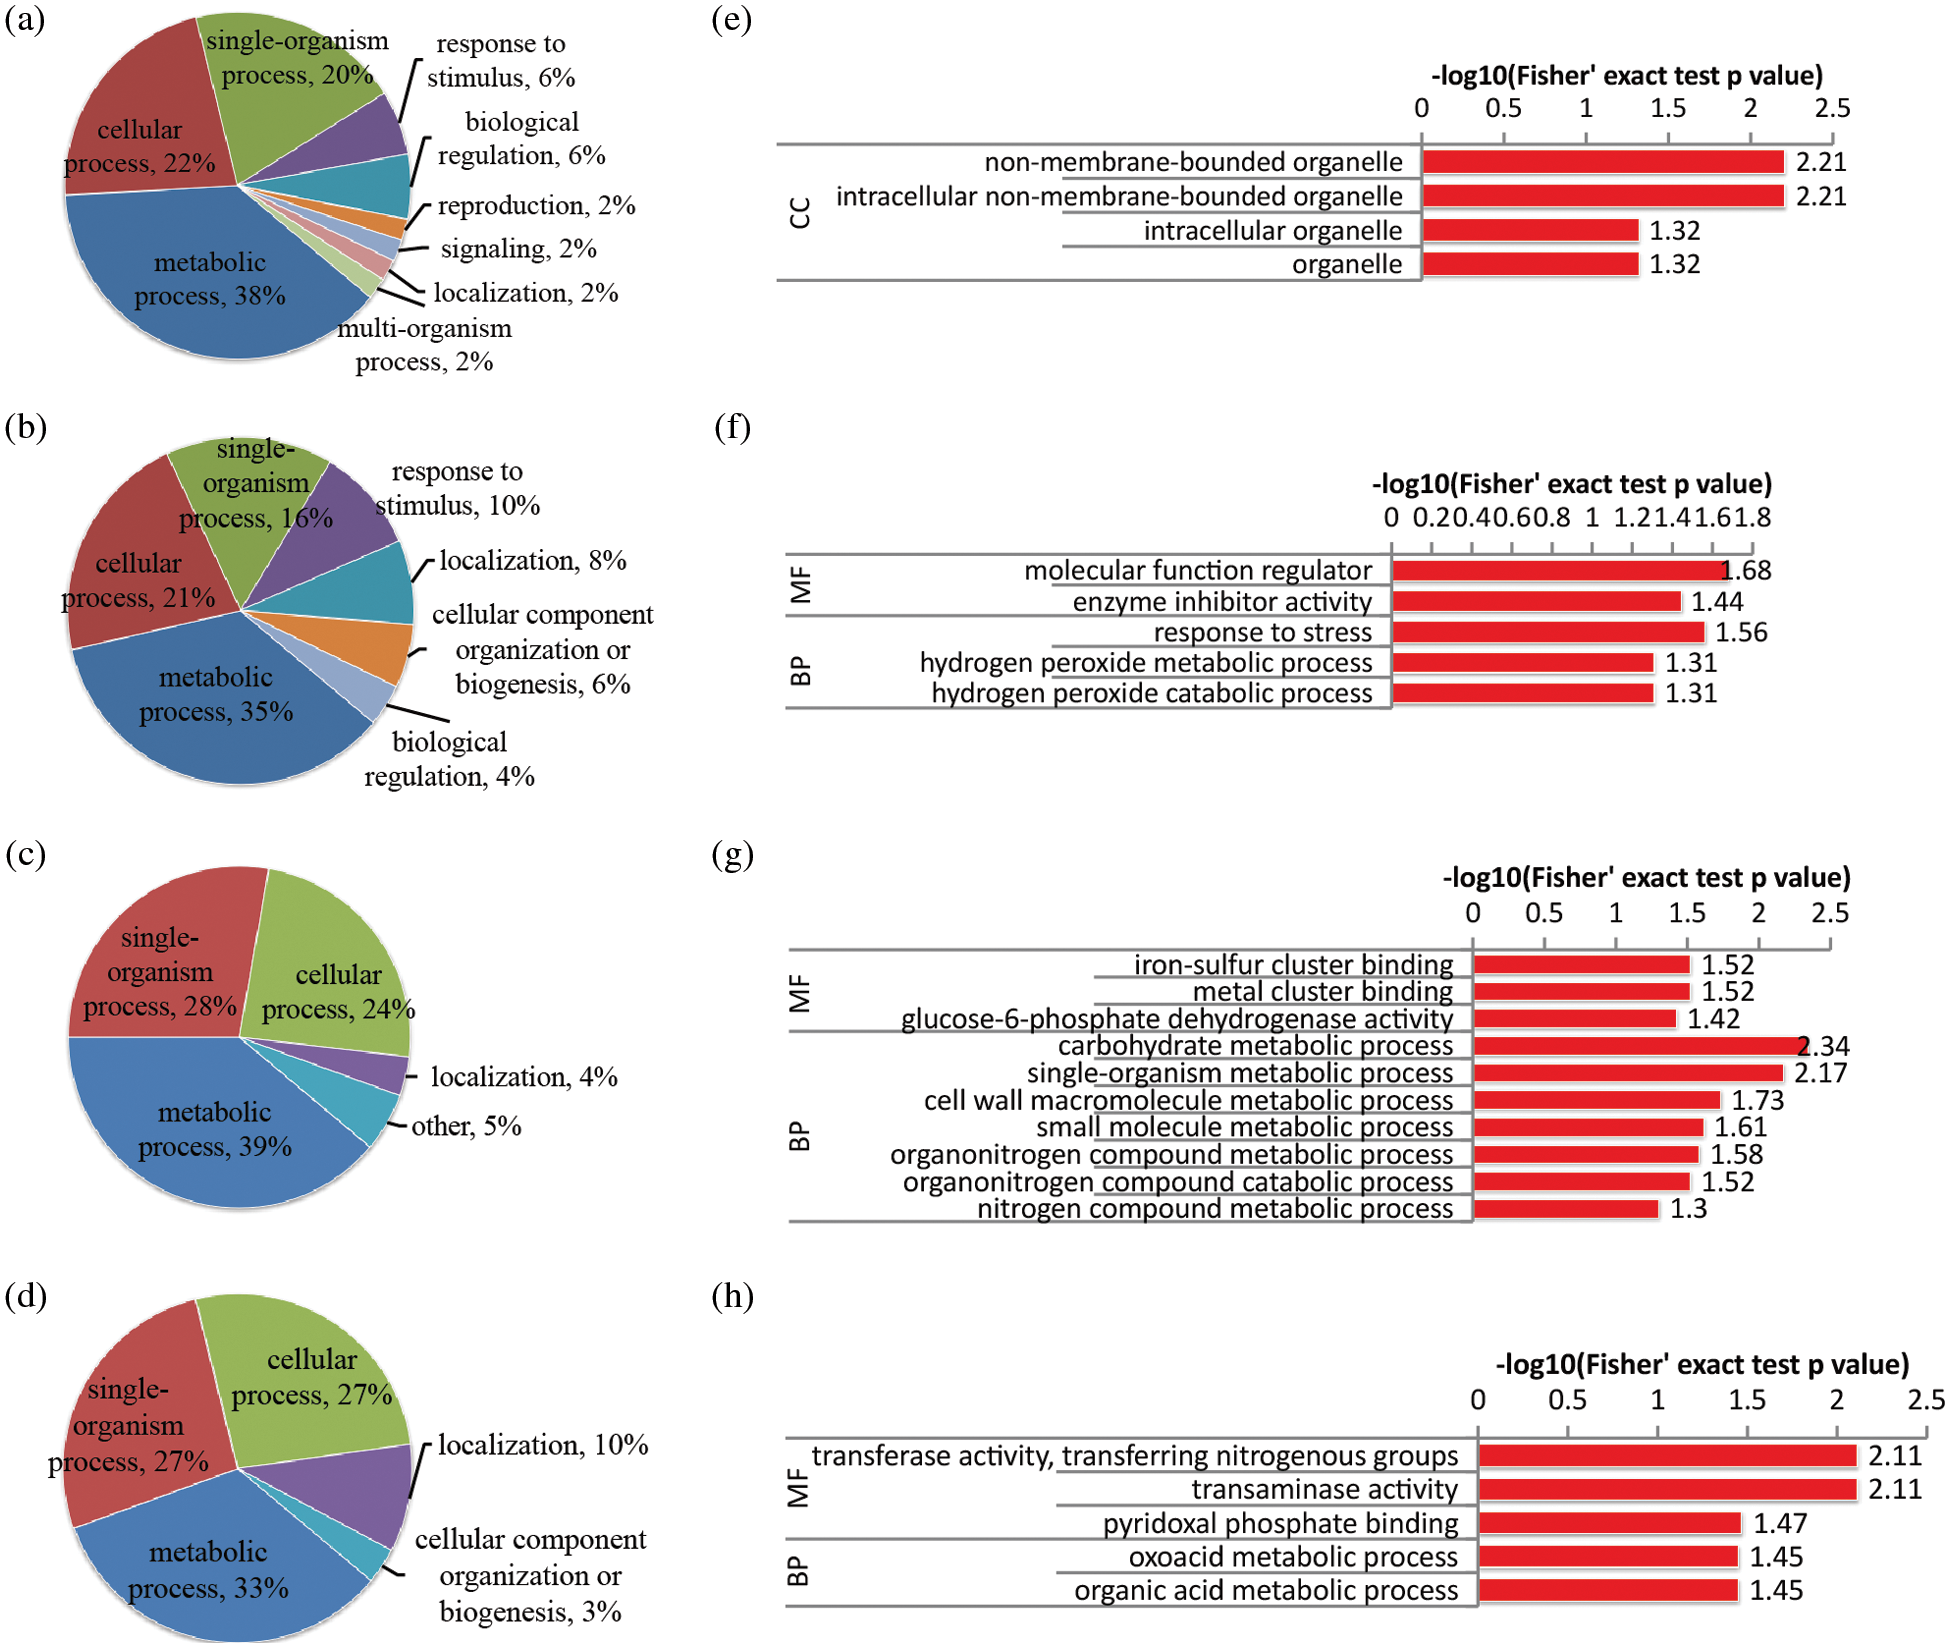
Figure 4: Functional classification and GO enrichment analysis of DAPs in the stem of rapeseed. (a and b) functional classification of up-regulated proteins in NS0.1 and NS1, respectively; (c and d) functional classification of down-regulated proteins under the two treatments, respectively; (e and f) GO enrichment analysis of up-regulated proteins in NS0.1 and NS1, respectively; (g and h) GO enrichment analysis of down-regulated proteins under the two treatments, respectively. NS0.5 was used as control, and GO terms with p-value < 0.05 were identified as significantly enriched
3.5 Expression Profiling Analysis
As described above, a large majority of DAPs were identified based on different tissues and various N concentration treatments (Table 1). To gain a deeper insight into the expression profiles of these DAPs, cluster analysis was performed by using the unsupervised clustering method. Multiple repeats of the expression level of each protein were used to calculate the average value, and those proteins with minor expression level variation among various treatments in the root were filtered out. According to their expression trend under different treatments, in particular, NR0, NR0.1, NR0.5 and NR1, these DAPs were clustered into six clusters (Fig. 5). For instance, the 851 proteins which represented the lowest expression level under N0, and had their expression level raised with the increase of N contestation, then had their expression level peaking at N1, were sorted into Cluster 5 (Fig. 5e). In general, significant more proteins were clustered into the glycolytic process and oxidative stress group under different N-concentration conditions (Fig. 5). In addition, more than 100 proteins involved in oxidation-reduction process significantly increased their expressions in roots. Since N is one of the essential nutrients for plants development, it is not rare that the expression levels of many RNA, nucleoside, cellular carbohydrate and sucrose biosynthesis and other primary metabolism processes related proteins were up-regulated under N-stress conditions in both root and leaf tissues. Interestingly, from the clusters of high N concentrations, significant more DAPs were enriched into protein translation process, glycolysis process, oxidative stress process etc., and these suggested that higher N concentrations might enhance the protein translation process and glycolysis process. At the same time, it also caused serious oxidative stress to rapeseed and limited the photosynthesis capacity, due to a large amount of down-regulated proteins involved in the photosynthesis process. The same to the higher N concentration, Cluster 1 and 2 indicated that low N conditions facilitated protein folding and refolding processes since Cluster 3 represented proteins involved in the tricarboxylic acid cycle and other kinds of primary biosynthesis and metabolic processes. The DAPs enriched in this cluster all exhibited an up-regulated expression tendency. In leaves, some photosynthesis related proteins, such as the PSB01 (BnaA10g28000D), were found induced by the N-stress, since some previous studies confirmed that PSB01 was a critical protein for stabilizing the manganese cluster in the photosynthesis process. In addition, under N stress, some chromatin and nucleosome assembly associated proteins and also some proteins involved in sexual reproduction were induced. However, in stem tissue, N-stress mainly influenced the expression levels of translation, transporter, photosynthesis and primary metabolic process-related proteins.
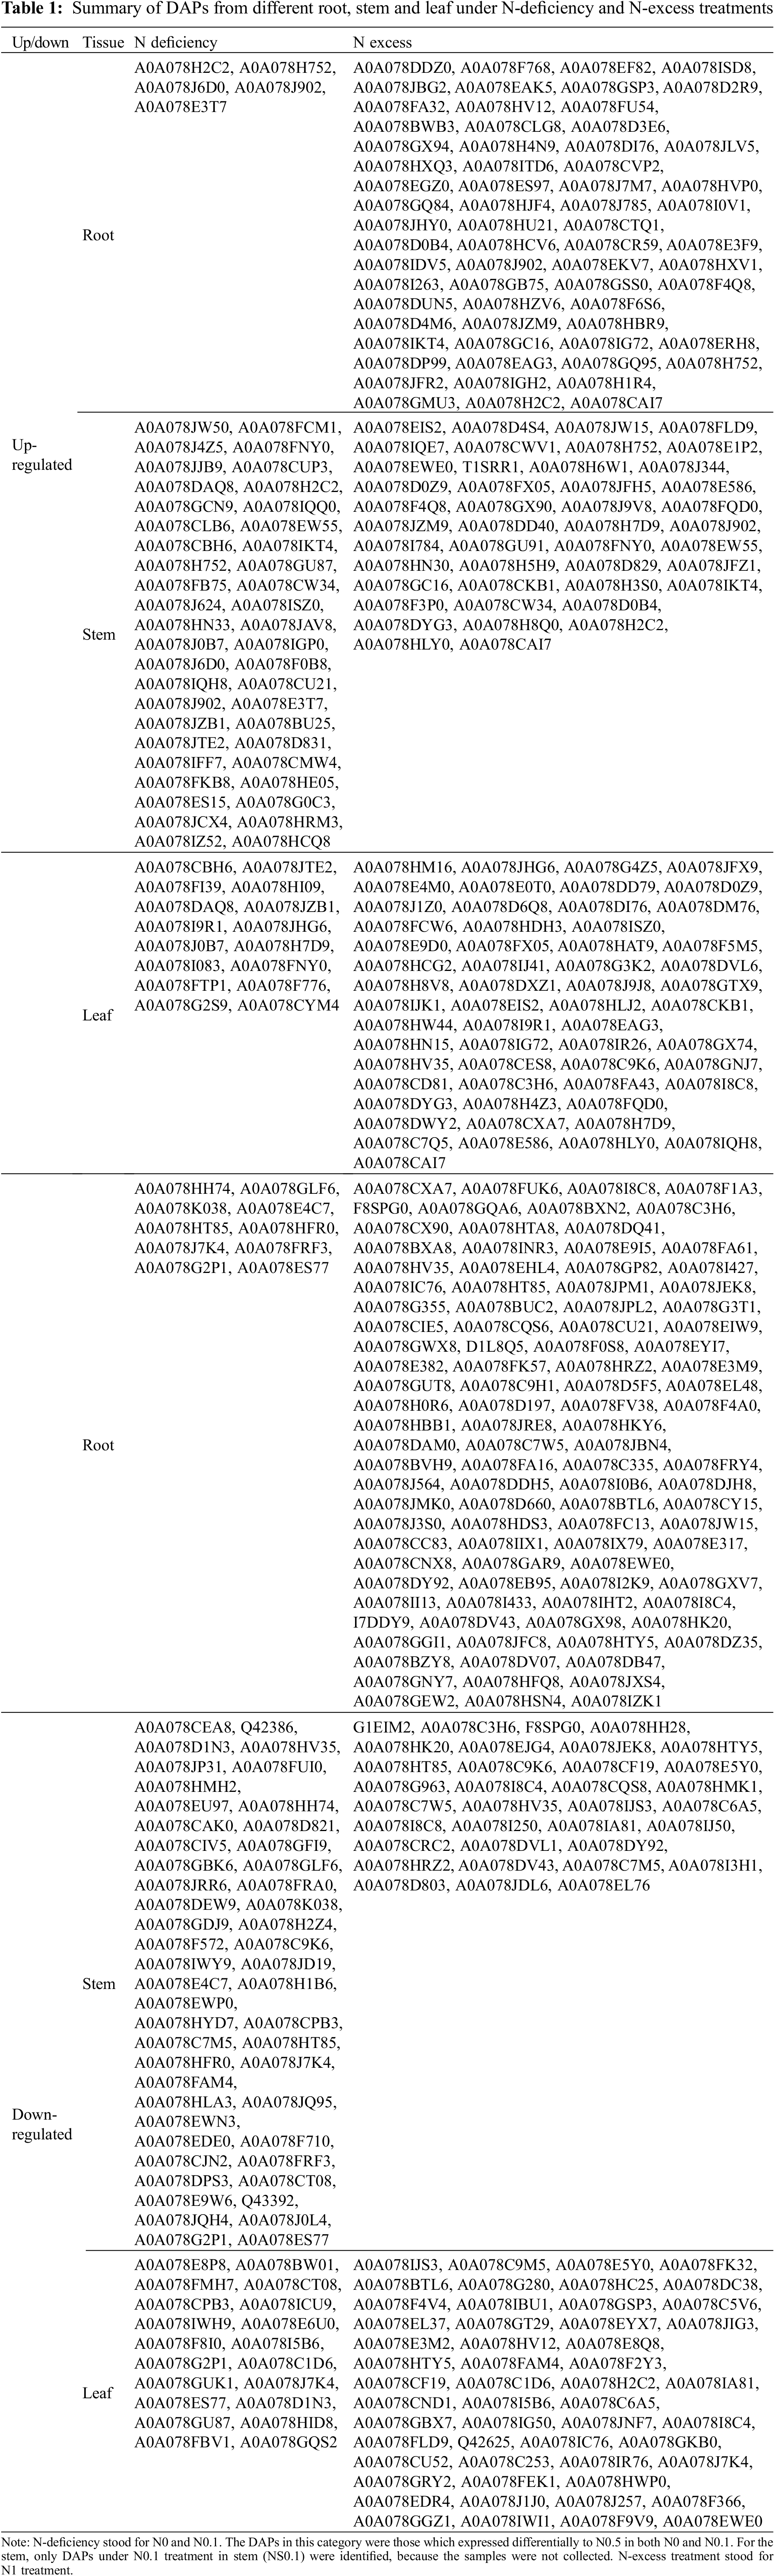
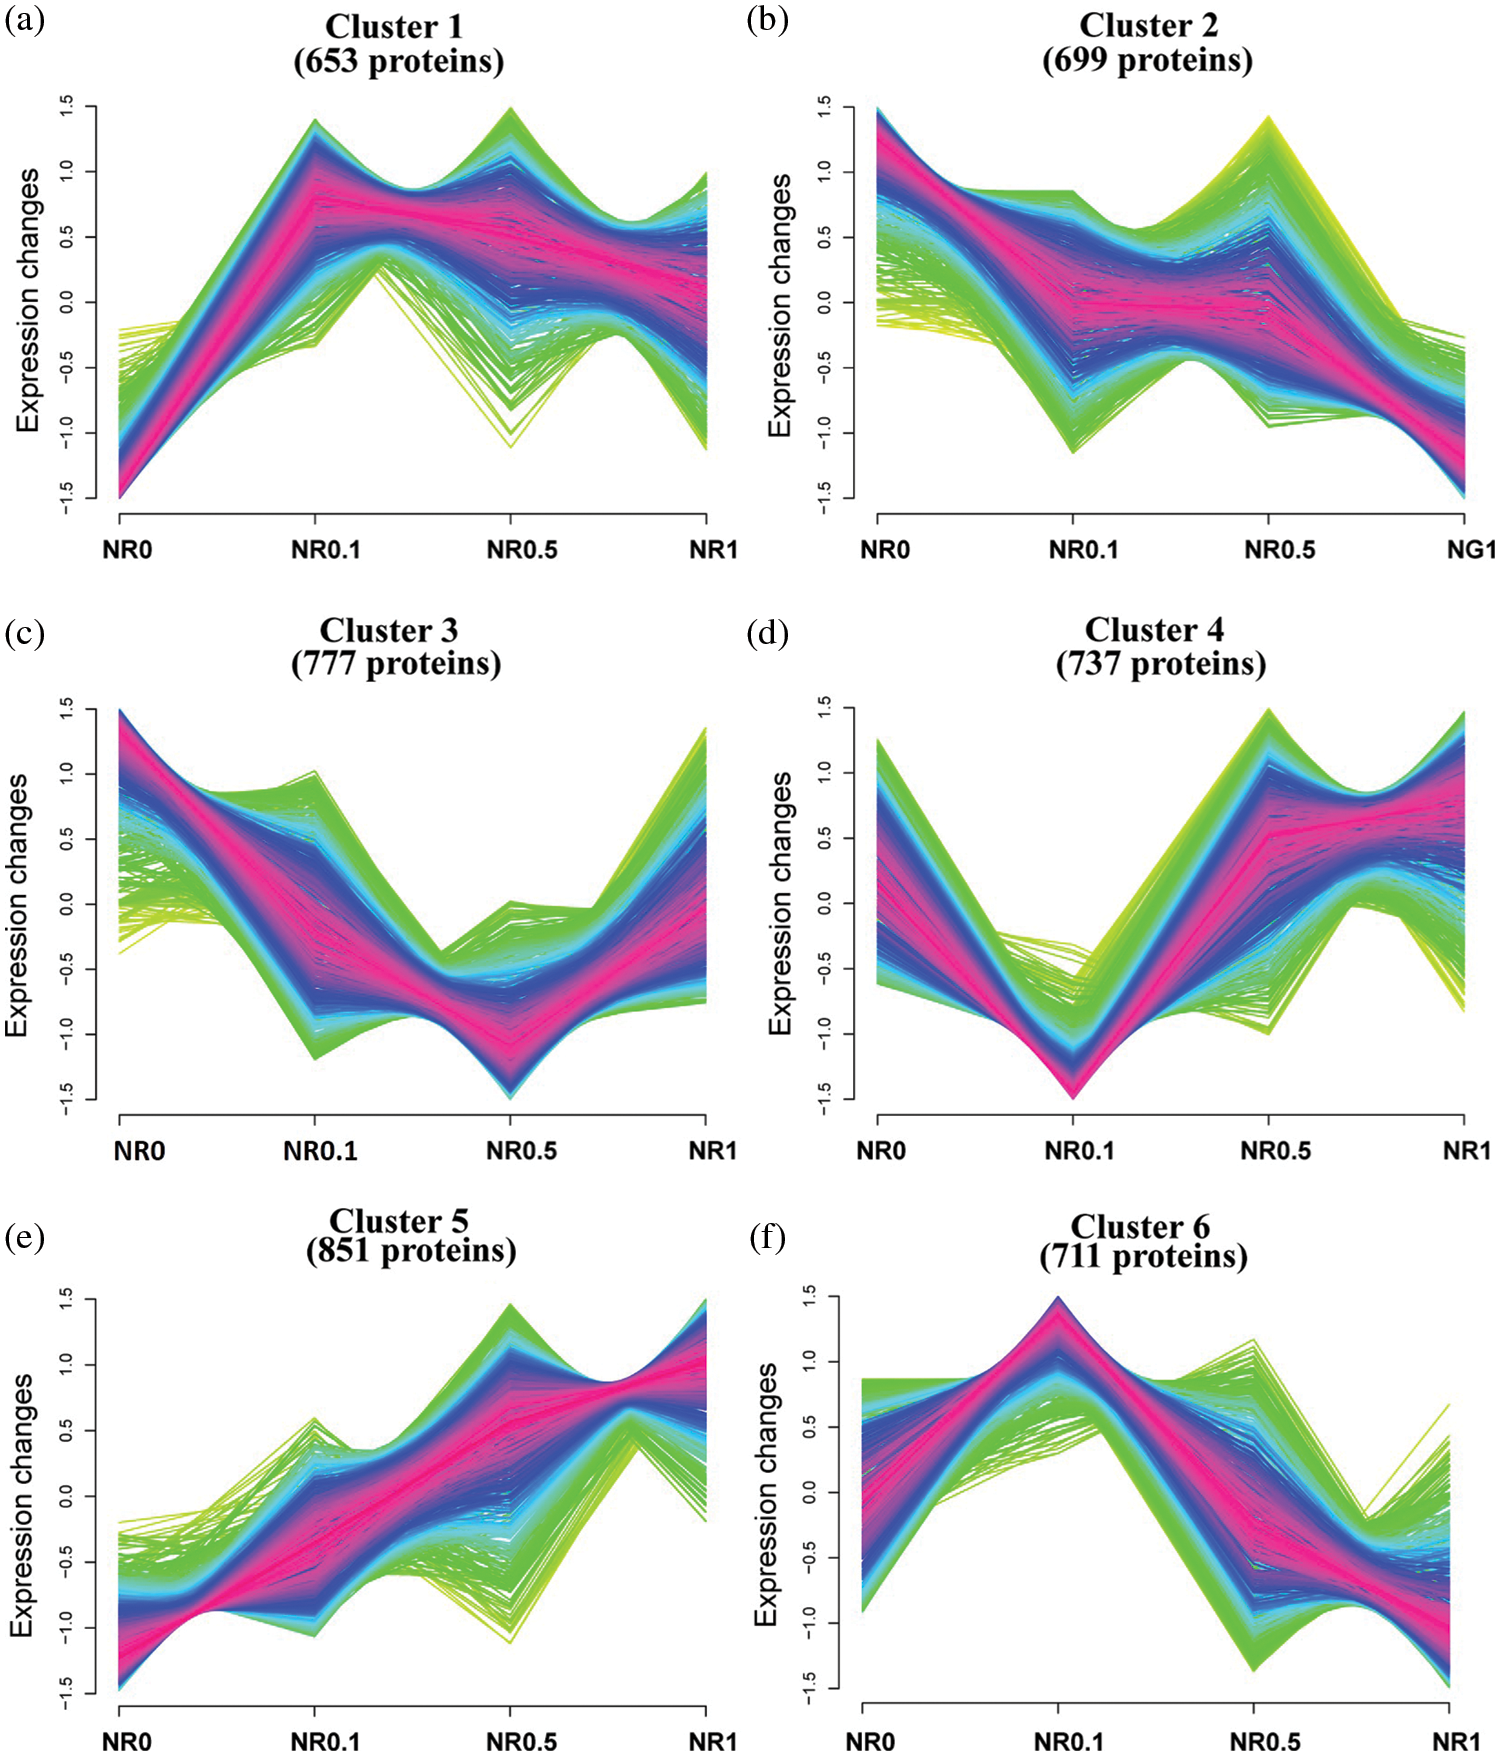
Figure 5: Dynamic characterization of proteins in rapeseed root. Cluster analysises of regulated proteins were carried out according to their expression profiles
3.6 ROS Stress in the Leaf of Rapeseed
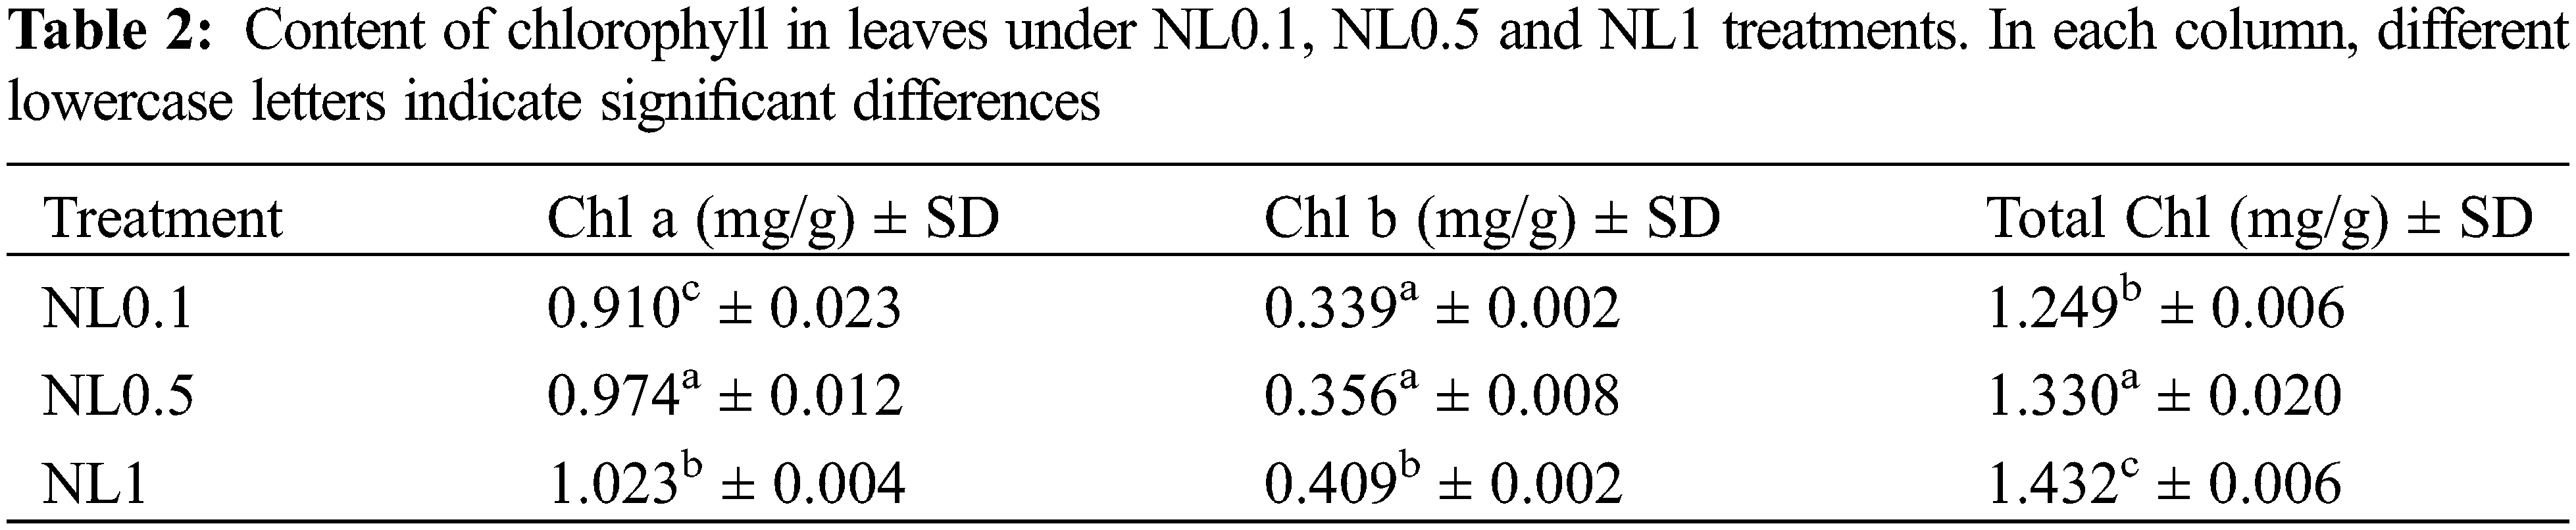
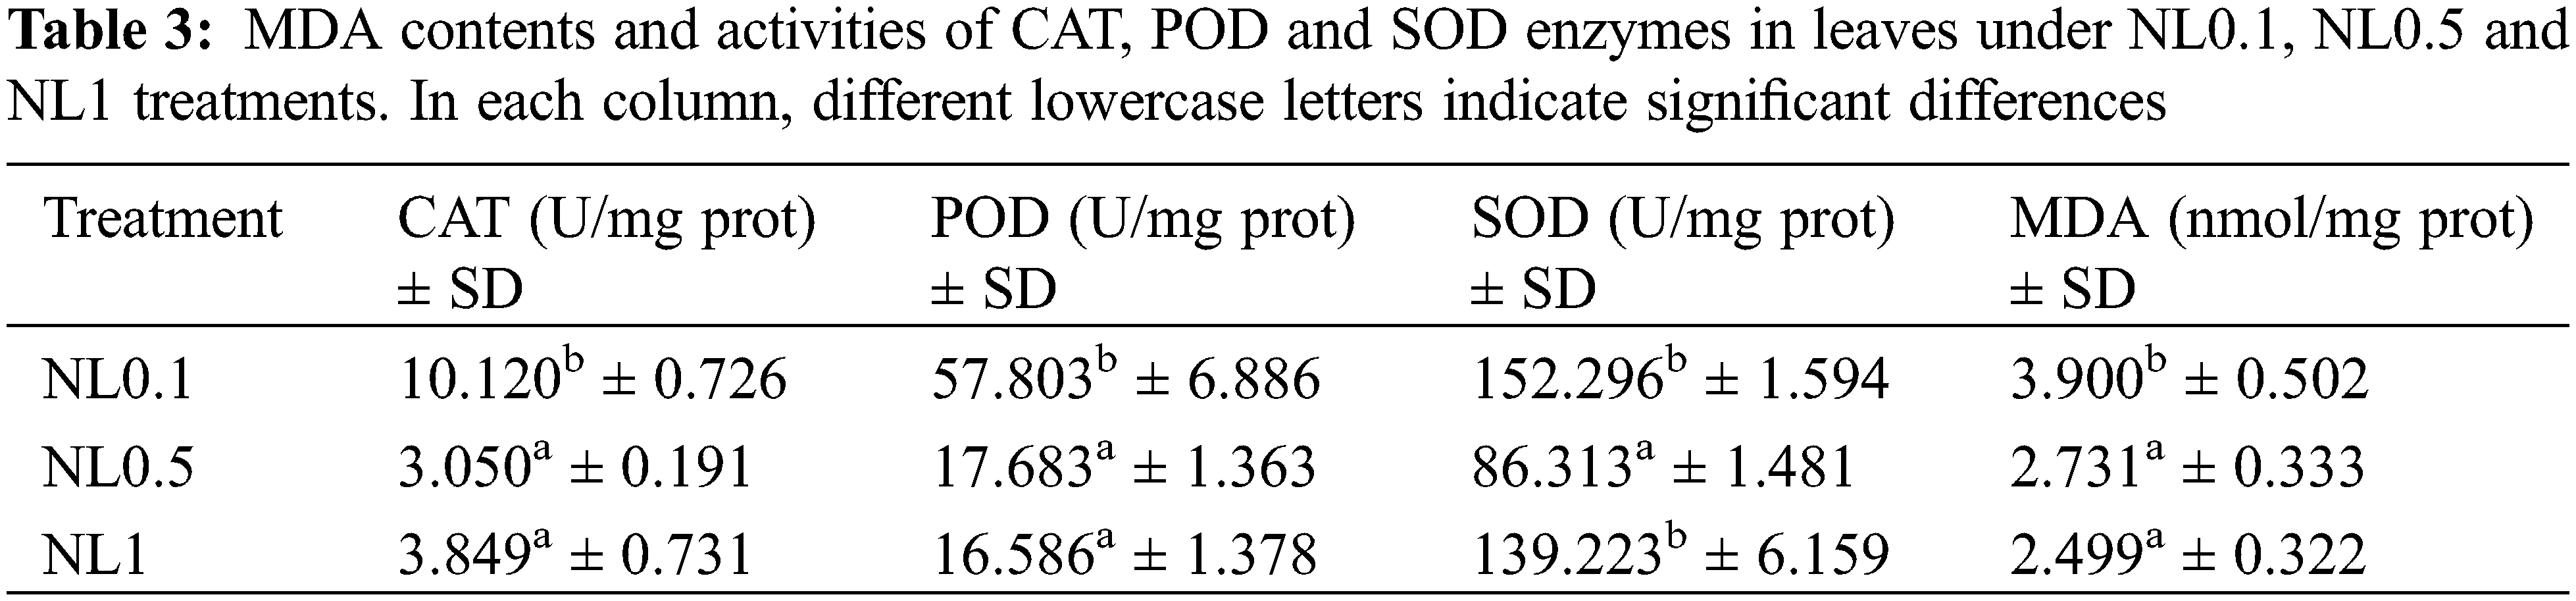
Based on the results obtained above, the photosynthesis process, oxidative stress and hydrogen peroxide metabolic process of rapeseed were significantly affected by the N-stress. To further ascertain these changes resulting from the different N concentrations, the contents of protein in leaves, chlorophylls (chl a, chl b and total chl), CAT, SOD, POD and MDA were analyzed. Our results indicated that both N0.1 and N1 could restrain the protein biosynthesis when compared with the control (N0.5). The chlorophyll (chlorophyll a, chlorophyll b and total chlorophyll) contents analyses showed that they were increased with the increase of N concentrations, and these suggested that the N content positively regulated the synthesis of chlorophylls (Table 2). Interestingly, despite the minor modifications of the POD and MDA contents under N1 condition compared with N0.5, we found that both low and high N concentrations could induce the oxidative stress response of rapeseed. This resulted in that the contents of CAT, SOD, POD and MDA significantly increased under N0.1 condition, and CAT and SOD significantly increased under N1 (Table 3), and these results were consistent with reality.
Nitrogen is one of the essential nutrients for life and in plants. Much of the total nitrogen is used in chlorophyll molecules, which are essential for photosynthesis and proper development. The N-starved Arabidopsis seedlings have been proved to exhibit typical N-deficient phenotypes [13], such as reduced chlorophyll content and fresh weight. In this study, the protein concentration and chlorophyll content in rapeseed leaves were significantly decreased under N-deficiency stress as well as high-N stress conditions when compared to the control samples (NL0.5) (Tables 1 and 3).
Previous results have proved that over-accumulation of reducing equivalents and elevated lipid degradation induced the excess ROS molecules under N-deficient conditions [36,37]. Our results also showed that many proteins related to oxidative stress indeed changed their expression abundance after N-stress treatment. MDA is an endogenous genotoxic product of enzymatic and oxygen radical-induced lipid peroxidation. Its content was used to indicate membrane lipid peroxidation state in rapeseed herein. The variations of MDA content are presented in Table 3. MDA content significantly increased under N-deficient conditions with no apparent change in high-N stress conditions. MDA content increased 42.85% in NL0.1 samples, while it decreased slightly in NL1 samples, indicating the high content of ROS stress in N-deficient conditions. A positive correlation between nitrogen concentration and chlorophyll content has been well documented in many plant species including rice [38], maize [39], soybean [40] and wheat [41]. Further, we observed significantly increased levels of antioxidative enzymes, such as CAT, POD and SOD. CAT is one of the key enzymes for dismutating H2O2 into H2O and O2. CAT enzyme activity in leaves increased more than 230% after N-deficiency treatment, with only 25% detected in high-N stress. The catalyzing activity of POD, the key enzyme responsible for eliminating H2O2 into the chloroplasts, increased greatly in N-deficient conditions and decreased in some degree in N-high conditions. This indicates the high oxidative stress in the chloroplast in N-deficient conditions, which is consistent with the proteomic analysis of rapeseed leaves. SOD is one of the ubiquitous enzymes in aerobic organisms and mainly function as ROS scavenges in cell, and its catalyzing activity increased significantly in both two conditions. Those results proved that N-deficient stress could induce more sever oxidative stress and reduce much more the photosynthesis activity than high-N stress in rapeseed.
Rapeseed production has undergone a rapid increase in recent decades due to the abundant application of N fertilizer. However, on the other hand, the application of N fertilizer burdened farmers and led to well-documented environment problems [1,42]. In the farmers’ and society’s views, most of the N added to agricultural systems has been wasted and substantially alters downwind and downstream ecosystems. Solutions to the problems require a comprehensive overview of the adaptation to N-stress conditions. In order to understand the effect that N-stress has on rapeseed, we treated rapeseed seedlings under different N concentrations and analyzed the proteomic data from roots, stems and leaves, respectively. The result in this study showed not only that N-deficiency could limit the development of rapeseed, but also that high-N stress is also a drawback for the photosynthesis activity.
4.1 Proteins Related to Primary Biosynthesis and Metabolic Processes
Nitrogen is an essential nutrient to plant growth and development. Because of the complex reasons contributing to the loss of N in soil, plants must cope with the variation of N concentrations in soil and other environment to acquire proper N for themselves. N deficiency has been proved to negatively regulate growth or development [43]. The expression levels of large groups of proteins or genes were affected under N-stress conditions in Arabidopsis and other plants [14,44,45]. In rapeseed, many proteins involved in metabolic processes related to proper development remarkably changed their abundance under N-stress.
Proteomic changes induced by N-stress are shown in their expression profiles in rapeseed tissues under several N-stresses conditions. Taking 50% N concentration as control, a total of 239 and 165 proteins significantly changed their expression levels in the NR0.1 and NR1 samples compared to NR0.5. There were only 124 and 74 DAPs separately identified in NS0.1 and NS0.5 samples, and 192 and 109 proteins were relatively affected by N-deficient stress in NL0.1 and NL0.5 samples. Functional classification and GO enrichment analysis illustrated that proteins related to metabolism and cellular processes accounted for two main portions of all DAPs regardless of tissue resource, including many key basic metabolic processes such as amino acid, protein and carbohydrate metabolic processes.
Eight proteins markedly changed their expression in high-N stress in all three tissues. Among them, ALIS1 (A0A078CAI7), the protein that catalyzes flipping of phospholipids across cellular membranes and contributes to vesicle biogenesis in the secretory and endocytic pathways [46], is commonly up-regulated in all three tissues under high-N stress. Considering the key role of ALIS in forming the putative flippase complex, this result indicates the potential higher level of protein with different subcellular localizations under high-N stress condition. Two proteins, AGT (A0A078HTY5) and isoflavone reductase (IFR, A0A078I8C4), decreased their expression. AGT is an enzyme that catalyzes nitrogenous groups transferring between L-alanine and pyruvate, which is a key process in alanine and aspartate metabolism and glycine, serine and threonine metabolism. IFR specifically recognizes isoflavones and participates in isoflavonoid biosynthesis, while isoflavonoid act as signal molecule in plant–microorganism interactions which then affect multiple metabolic processes in plants [47], including plant defense, and catalyzes a stereospecific NADPH-dependent reduction.
In N-deficiency stress, the expressions of 14 proteins were universally affected regardless of tissue source: A0A078CMW4, A0A078CT08, A0A078D1N3, A0A078EWN3, A0A078EWP0, A0A078F710, A0A078G2P1, A0A078GLF6, A0A078H2C2, A0A078HV35, A0A078IQH8, A0A078J7K4, A0A078FCM1 and A0A078J4Z5. Among them, two proteins also changed their expression in response to high-N stress: A0A078H2C2 and A0A078HV35. While N-deficiency stress repressed the expression of A0A078H2C2 in root and stem, high-N stress induced more of it than the control. A0A078H2C2 is one protease enzyme involved in macromolecule and organic substance metabolic processes, and A0A078HV35 is a transcription factor that plays an important role in plants development. Low-N stress enhanced the expression of TF25, which contributes to cell death, in root and stem, while high-N reduced its expression. A0A078H2C2 is a protease enzyme involved in protein metabolic processes with metalloendopeptidase activity. A0A078HV35 is a transcription factor that plays an important role in plant development, which specifically increased its abundance in leaf tissues. Those results showed the common and specific response to N-stress in the three different tissues whereas N-deficient and high-N stress all affect the primer metabolic process in rapeseed.
4.2 Proteins Involved in the Photosynthesis Process
The photosynthesis capacity of leaves has been reported related to the nitrogen content of plants, mainly because of the requirement of nitrogen in leaf proteins that are involved in the Calvin cycle [48]. The limitation of nitrogen in soil and other environments has been one of the greatest limitations for crops production. In this study, we identified several DAPs in rapeseed leaves between N-stress and control conditions. The Chl content decreased under N-deficiency conditions, whereas it increased under N-high conditions, including Chlorophyll a and Chlorophyll b, which suggested the positive relationship between N and chlorophyll contents. However, the photosynthesis capability decreased in both N-stress conditions when referring to the chlorophyll a/b ratio. The chlorophyll a/b ratio in leaves is often considered to reflect the solar energy use of plants [49]. Herein, more decline of chlorophyll a/b ratio was detected in high-N stress. Those results suggested that N deficiency reduced seedling’s photosynthesis use efficiency, while high-N stress could limit the photosynthesis capacity of rapeseed in a greater degree.
Comparative proteomic analysis also indicated some proteins related to the photosynthesis process that were affected by the N concentration in the environment. N-deficient rapeseed had substantially changed the abundance of proteins that are involved in the photosynthetic light reaction, electron transport chain, carbon fixation, and other related regulation processes. Rapeseed in high-N stress conditions significantly decreased the abundance level of proteins such as photosystem I subunit VII, antenna protein, photosynthetic membrane protein and psbQ. Further analysis between N-free and control (NL0.5) samples demonstrated that the abundance of proteins required for the photosynthesis process was greatly up-regulated compared with N-deficient condition.
4.3 Proteins Response to Stresses
A large set of proteins related to biotic and abiotic stress-response processes were identified under N stress. Further GO enrichment analysis of DAPs in N-deficient condition indicated that six DAPs in N-deficient condition also responded to abiotic and biotic stress.
In N-deficient condition (NL0.1), more proteins were affected by N-starvation stress. A0A078BWD3, dehydrin ERD14-like protein, was specifically down-regulated in rapeseed root in N-deficient stress condition, and much more reduction was detected in N-free condition. A0A078J0B7 is one of the CHB4 family protein that is involved in defense against chitin-containing fungal pathogens, and it was only significantly up-regulated in rapeseed stem tissue. Besides those proteins induced by N-deficient stress, we also found some stress-related proteins that were down-regulated, such as MLP-like protein [50], yxiE protein and SI alpha-3.
N-stress is well-documented to cause plant oxidative stress. In this study, many peroxidase proteins involved in hydrogen peroxide catabolic process were affected by N-deficient stress and high-N stress, such as A0A078IQH8, A0A078CES8, A0A078G4Z5, A0A078DYG3, A0A078HM16 and A0A078C7Q5. Peroxidase protein [51] and peroxidase-like proteins that involved in oxidative stress significantly increased their expression level in response to N-stress. At the same time, A0A078IQH8, a peroxidase protein, was down-regulated in N-deficient conditions in root tissue, while it was induced in stem and leaf tissues, which indicated the tissue-specific expression pattern of proteins in response to stress conditions.
Further analysis showed that MDA content increased in N-deficient conditions and decreased in N-high conditions. Plants have evolved many strategies to defend themselves from oxidative stress with several antioxidant enzymes, such as POD, SOD and CAT. Our results showed the enhanced enzyme activity of those antioxidant proteins under N-stress, especially in N-deficient conditions. The activity of several antioxidant enzymes, including CAT, SOD and POD, was measured in those leaf samples. In addition, the content of MDA and the activities of antioxidant enzymes under N-deficient conditions were gradually increased, suggesting the aggravation of oxidative stress with the proceeding N-deficiency stress.
This study identified the N-stress responsive genes in rapeseed by investigation of proteomics after various N-concentration treatments. A large set of genes significantly changed their protein abundance under low- and high-N stress conditions, including proteins involved in basic metabolic processes and stress-response processes, which are essential for plant development. Further analysis revealed that genes/proteins associated with carbohydrate metabolism, nucleotide metabolism, amino acid metabolism, disease defense, oxidative stress response and photosynthesis were involved in N-stress responses. This study shed light on further research for understanding the N-stress response mechanisms in B. napus.
Authorship: The authors confirm their contribution to the paper as follows: study conception and design: L. Chai, H. Li, L. Jiang; data collection: H. Li, J. Zhang; analysis and interpretation of results: C. Cui , B. Zheng, J. Jiang; draft manuscript preparation: L. Chai, H. Li. All authors reviewed the results and approved the final version of the manuscript.
Funding Statement: This research was funded by Modern Agro-Industry Technology Research System of China (CARS-12); Independent Innovation Project of SAAS (2022ZZCX004); 1+9 Open Competition Project of SAAS (1+9KJGG002, 1+9KJGG001); the Accurate Identification Project of Crop Germplasm from Sichuan Provincial Finance Department; Sichuan Science and Technology Program (2022ZDZX0015); Sichuan Crop Breeding Community (2021YFYZ0018); Disciplinary Construction Project for Modern Agriculture in SAAS (2021XKJS003); Chengdu Science and Technology Project (2021-YF09-00062-SN).
Conflicts of Interest: The authors declare that they have no conflicts of interest to report regarding the present study.
References
1. Robertson, G. P., Vitousek, P. M. (2009). Nitrogen in agriculture: Balancing the cost of an essential resource. Annual Review of Environment and Resources, 34(1), 97–125. DOI 10.1146/annurev.environ.032108.105046. [Google Scholar] [CrossRef]
2. Crawford, N. M. (1995). Nitrate: Nutrient and signal for plant growth. The Plant Cell, 7(7), 859–868. DOI 10.1105/tpc.7.7.859. [Google Scholar] [CrossRef]
3. Bouguyon, E., Gojon, A., Nacry, P. (2012). Nitrate sensing and signaling in plants. Seminars in Cell & Developmental Biology, 23(6), 648–654. DOI 10.1016/j.semcdb.2012.01.004. [Google Scholar] [CrossRef]
4. Raun, W. R., Johnson, G. V. (1999). Improving nitrogen use efficiency for cereal production. Agronomy Journal, 91(3), 357–363. DOI 10.2134/agronj1999.00021962009100030001x. [Google Scholar] [CrossRef]
5. Raun, W. R., Solie, J. B., Johnson, G. V., Stone, M. L., Mullen, R. W. et al. (2002). Improving nitrogen use efficiency in cereal grain production with optical sensing and variable rate application. Agronomy Journal, 94(4), 815–820. DOI 10.2134/agronj2002.8150. [Google Scholar] [CrossRef]
6. Gross, M. (2012). We need to talk about nitrogen. Current Biology, 22(1), R1–R4. DOI 10.1016/j.cub.2011.12.033. [Google Scholar] [CrossRef]
7. Cassman, K. G., Dobermann, A., Walters, D. T. (2002). Agroecosystems, nitrogen-use efficiency, and nitrogen management. AMBIO: A Journal of the Human Environment, 31(2), 132–141. DOI 10.1579/0044-7447-31.2.132. [Google Scholar] [CrossRef]
8. Kant, S., Bi, Y., Rothstein, S. J. (2010). Understanding plant response to nitrogen limitation for the improvement of crop nitrogen use efficiency. Journal of Experimental Botany, 62(4), 1499–1509. DOI 10.1093/jxb/erq297. [Google Scholar] [CrossRef]
9. Xu, G., Fan, X., Miller, A. J. (2012). Plant nitrogen assimilation and use efficiency. Annual Review of Plant Biology, 63(1), 153–182. DOI 10.1146/annurev-arplant-042811-105532. [Google Scholar] [CrossRef]
10. Ju, X., Xing, G., Chen, X., Zhang, S., Zhang, L. et al. (2009). Reducing environmental risk by improving N management in intensive Chinese agricultural systems. PNAS, 106(9), 3041–3046. DOI 10.1073/pnas.0813417106. [Google Scholar] [CrossRef]
11. Reich, P. B., Hobbie, S. E., Lee, T., Ellsworth, D. S., West, J. B. et al. (2006). Nitrogen limitation constrains sustainability of ecosystem response to CO2. Nature, 440(7086), 922–925. DOI 10.1038/nature04486. [Google Scholar] [CrossRef]
12. Fageria, N. K., Baligar, V. C. (2005). Enhancing nitrogen use efficiency in crop plants. Advances in Agronomy, 88, 97–185. [Google Scholar]
13. Wang, X., Bian, Y., Cheng, K., Zou, H., Sun, S. S. et al. (2012). A comprehensive differential proteomic study of nitrate deprivation in Arabidopsis reveals complex regulatory networks of plant nitrogen responses. Journal of Proteome Research, 11(4), 2301–2315. [Google Scholar]
14. Scheible, W., Morcuende, R., Czechowski, T., Fritz, C., Osuna, D. et al. (2004). Genome-wide reprogramming of primary and secondary metabolism, protein synthesis, cellular growth processes, and the regulatory infrastructure of Arabidopsis in response to nitrogen. Plant Physiology, 136(1), 2483–2499. [Google Scholar]
15. Peng, M., Bi, Y., Zhu, T., Rothstein, S. J. (2007). Genome-wide analysis of Arabidopsis responsive transcriptome to nitrogen limitation and its regulation by the ubiquitin ligase gene NLA. Plant Molecular Biology, 65(6), 775–797. DOI 10.1007/s11103-007-9241-0. [Google Scholar] [CrossRef]
16. Zhao, D., Reddy, K. R., Kakani, V. G., Reddy, V. R. (2005). Nitrogen deficiency effects on plant growth, leaf photosynthesis, and hyperspectral reflectance properties of sorghum. European Journal of Agronomy, 22(4), 391–403. DOI 10.1016/j.eja.2004.06.005. [Google Scholar] [CrossRef]
17. Varvel, G. E., Schepers, J. S., Francis, D. D. (1997). Ability for in-season correction of nitrogen deficiency in corn using chlorophyll meters. Soil Science Society of America Journal, 61(4), 1233–1239. [Google Scholar]
18. Tiffert, Y., Franz-Wachtel, M., Fladerer, C., Nordheim, A., Reuther, J. et al. (2011). Proteomic analysis of the GlnR-mediated response to nitrogen limitation in Streptomyces coelicolor M145. Applied Microbiology and Biotechnology, 89(4), 1149–1159. DOI 10.1007/s00253-011-3086-9. [Google Scholar] [CrossRef]
19. Rathke, G., Behrens, T., Diepenbrock, W. (2006). Integrated nitrogen management strategies to improve seed yield, oil content and nitrogen efficiency of winter oilseed rape (Brassica napus L.A review. Agriculture, Ecosystems & Environment, 117(2–3), 80–108. DOI 10.1016/j.agee.2006.04.006. [Google Scholar] [CrossRef]
20. Chen, S., Ding, G., Wang, Z., Cai, H., Xu, F. (2015). Proteomic and comparative genomic analysis reveals adaptability of Brassica napus to phosphorus-deficient stress. Journal of Proteomics, 117(3), 106–119. DOI 10.1016/j.jprot.2015.01.012. [Google Scholar] [CrossRef]
21. Wang, Z., Wang, Z., Shi, L., Wang, L., Xu, F. (2010). Proteomic alterations of Brassica napus root in response to boron deficiency. Plant Molecular Biology, 74(3), 265–278. DOI 10.1007/s11103-010-9671-y. [Google Scholar] [CrossRef]
22. Komatsu, S., Konishi, H., Shen, S., Yang, G. (2003). Rice proteomics. Molecular & Cellular Proteomics, 2(1), 2–10. DOI 10.1074/mcp.R200008-MCP200. [Google Scholar] [CrossRef]
23. Basu, U., Good, A. G., Taylor, G. J. (2001). Transgenic Brassica napus plants overexpressing aluminium-induced mitochondrial manganese superoxide dismutase cDNA are resistant to aluminium. Plant, Cell & Environment, 24(12), 1269–1278. DOI 10.1046/j.0016-8025.2001.00783.x. [Google Scholar] [CrossRef]
24. Murashige, T., Skoog, F. (1962). A revised medium for rapid growth and bio assays with tobacco tissue cultures. Physiologia Plantarum, 15, 473–497. [Google Scholar]
25. Hurkman, W. J., Tanaka, C. K. (1986). Solubilization of plant membrane proteins for analysis by two-dimensional gel electrophoresis. Plant Physiology, 81(3), 802–806. [Google Scholar]
26. Udeshi, N. D., Svinkina, T., Mertins, P., Kuhn, E., Mani, D. R. et al. (2013). Refined preparation and use of anti-diglycine remnant (K-ε-GG) antibody enables routine quantification of 10,000s of ubiquitination sites in single proteomics experiments. Molecular & Cellular Proteomics, 12(3), 825–831. DOI 10.1074/mcp.O112.027094. [Google Scholar] [CrossRef]
27. Cai, H., Qi, S., Yan, Q., Ling, J., Du, J. et al. (2021). Global proteome profiling of human livers upon ischemia/reperfusion treatment. Clinical Proteomics, 18(1), 3. DOI 10.1186/s12014-020-09310-w. [Google Scholar] [CrossRef]
28. Sun, J., Jiang, T., Gu, F., Ma, D., Liang, J. (2020). TMT-based proteomic analysis of plasma from children with rolandic epilepsy. Disease Markers, 2020, 1–10. DOI 10.1155/2020/8840482. [Google Scholar] [CrossRef]
29. Kumar, L., Futschik, M. E. (2007). Mfuzz: A software package for soft clustering of microarray data. Bioinformation, 2(1), 5–7. DOI 10.6026/97320630002005. [Google Scholar] [CrossRef]
30. Mackinney, G. (1941). Absorption of light by chlorophyll solutions. Journal of Biological Chemistry, 140(2), 315–322. DOI 10.1016/S0021-9258(18)51320-X. [Google Scholar] [CrossRef]
31. Arnon, D. I. (1949). Copper enzymes in isolated chloroplasts. Polyphenoloxidase in Beta vulgaris. Plant Physiology, 24(1), 1–15. [Google Scholar]
32. Schmedes, A., Hølmer, G. (1989). A new thiobarbituric acid (TBA) method for determining free malondialdehyde (MDA) and hydroperoxides selectively as a measure of lipid peroxidation. Journal of the American Oil Chemists’ Society, 66(6), 813–817. DOI 10.1007/BF02653674. [Google Scholar] [CrossRef]
33. Bradford, M. (1976). A rapid and sensitive method for the quantitation of microgram quantities of protein utilizing the principle of protein-dye binding. Analytical Biochemistry, 72(1–2), 248–254. DOI 10.1006/abio.1976.9999. [Google Scholar] [CrossRef]
34. Sun, Y. I., Oberley, L. W., Li, Y. (1988). A simple method for clinical assay of superoxide dismutase. Clinical Chemistry, 34(3), 497–500. [Google Scholar]
35. Velikova, V., Yordanov, I., Edreva, A. (2000). Oxidative stress and some antioxidant systems in acid rain-treated bean plants: Protective role of exogenous polyamines. Plant Science, 151(1), 59–66. [Google Scholar]
36. Huang, Z., Jiang, D., Yang, Y., Sun, J., Jin, S. (2004). Effects of nitrogen deficiency on gas exchange, chlorophyll fluorescence, and antioxidant enzymes in leaves of rice plants. Photosynthetica, 42(3), 357–364. [Google Scholar]
37. Buchanan, B. B., Balmer, Y. (2005). Redox regulation: A broadening horizon. Annual Review of Plant Biology, 56(1), 187–220. DOI 10.1146/annurev.arplant.56.032604.144246. [Google Scholar] [CrossRef]
38. Nakano, H., Makino, A., Mae, T. (1997). The effect of elevated partial pressures of CO2 on the relationship between photosynthetic capacity and N content in rice leaves. Plant Physiology, 115(1), 191–198. [Google Scholar]
39. Schlemmer, M. R., Francis, D. D., Shanahan, J. F., Schepers, J. S. (2005). Remotely measuring chlorophyll content in corn leaves with differing nitrogen levels and relative water content. Agronomy Journal, 97(1), 106–112. [Google Scholar]
40. Fritschi, F. B., Ray, J. D. (2007). Soybean leaf nitrogen, chlorophyll content, and chlorophyll a/b ratio. Photosynthetica, 45(1), 92–98. DOI 10.1007/s11099-007-0014-4. [Google Scholar] [CrossRef]
41. Cartelat, A., Cerovic, Z. G., Goulas, Y., Meyer, S., Lelarge, C. et al. (2005). Optically assessed contents of leaf polyphenolics and chlorophyll as indicators of nitrogen deficiency in wheat (Triticum aestivum L.). Field Crops Research, 91(1), 35–49. DOI 10.1016/j.fcr.2004.05.002. [Google Scholar] [CrossRef]
42. Zhang, W. L., Tian, Z. X., Zhang, N., Li, X. Q. (1996). Nitrate pollution of groundwater in Northern China. Agriculture, Ecosystems & Environment, 59(3), 223–231. DOI 10.1016/0167-8809(96)01052-3. [Google Scholar] [CrossRef]
43. Liao, C., Peng, Y., Ma, W., Liu, R., Li, C. et al. (2012). Proteomic analysis revealed nitrogen-mediated metabolic, developmental, and hormonal regulation of maize (Zea mays L.) ear growth. Journal of Experimental Botany, 63(14), 5275–5288. DOI 10.1093/jxb/ers187. [Google Scholar] [CrossRef]
44. Bi, Y., Wang, R., Zhu, T., Rothstein, S. J. (2007). Global transcription profiling reveals differential responses to chronic nitrogen stress and putative nitrogen regulatory components in Arabidopsis. BMC Genomics, 8(1), 281. DOI 10.1186/1471-2164-8-281. [Google Scholar] [CrossRef]
45. Carvalhais, L. C., Dennis, P. G., Fedoseyenko, D., Hajirezaei, M. R., Borriss, R. et al. (2011). Root exudation of sugars, amino acids, and organic acids by maize as affected by nitrogen, phosphorus, potassium, and iron deficiency. Journal of Plant Nutrition and Soil Science, 174(1), 3–11. DOI 10.1002/jpln.201000085. [Google Scholar] [CrossRef]
46. López-Marqués, R. L., Poulsen, L. R., Hanisch, S., Meffert, K., Buch-Pedersen, M. J. et al. (2010). Intracellular targeting signals and lipid specificity determinants of the ALA/ALIS P4-ATPase complex reside in the catalytic ALA α-subunit. Molecular Biology of the Cell, 21(5), 791–801. DOI 10.1091/mbc.e09-08-0656. [Google Scholar] [CrossRef]
47. Dixon, R. A., Steele, C. L. (1999). Flavonoids and isoflavonoids–A gold mine for metabolic engineering. Trends in Plant Science, 4(10), 394–400. DOI 10.1016/S1360-1385(99)01471-5. [Google Scholar] [CrossRef]
48. Evans, J. R. (1989). Photosynthesis and nitrogen relationships in leaves of C3 plants. Oecologia, 78(1), 9–19. [Google Scholar]
49. Porra, R. J., Thompson, W. A., Kriedemann, P. E. (1989). Determination of accurate extinction coefficients and simultaneous equations for assaying chlorophylls a and b extracted with four different solvents: Verification of the concentration of chlorophyll standards by atomic absorption spectroscopy. Biochimica et Biophysica Acta—Bioenergetics, 975(3), 384–394. [Google Scholar]
50. Wang, Y., Yang, L., Chen, X., Ye, T., Zhong, B. et al. (2015). Major latex protein-like protein 43 (MLP43) functions as a positive regulator during abscisic acid responses and confers drought tolerance in Arabidopsis thaliana. Journal of Experimental Botany, 67(1), 421–434. [Google Scholar]
51. Mittler, R., Zilinskas, B. A. (1994). Regulation of pea cytosolic ascorbate peroxidase and other antioxidant enzymes during the progression of drought stress and following recovery from drought. The Plant Journal, 5(3), 397–405. DOI 10.1111/j.1365-313X.1994.00397.x. [Google Scholar] [CrossRef]
Cite This Article
 Copyright © 2023 The Author(s). Published by Tech Science Press.
This work is licensed under a Creative Commons Attribution 4.0 International License , which permits unrestricted use, distribution, and reproduction in any medium, provided the original work is properly cited.
 Downloads
 Citation Tools