
 Submit a Paper
 Propose a Special lssue
 Open Access
ARTICLE

Physiological and Biochemical Mechanisms of Salinity Tolerance in Carex morrowii Boott
Department of Park and Horticulture, Vocational School of Technical Sciences, Bursa Uludag University, Bursa, 16059, Turkey
* Corresponding Author: Aysegul Akpinar. Email:
(This article belongs to the Special Issue: Abiotic and Biotic Stress Tolerance in Crop)
Phyton-International Journal of Experimental Botany 2023, 92(7), 2197-2210. https://doi.org/10.32604/phyton.2023.029006
Received 23 January 2023; Accepted 22 March 2023; Issue published 29 May 2023
 View Full Text
 Download PDF
Abstract
Carex species are widely used in many parts of the world and contain a large number of ecologically diverse species. Among the Carex species, some of them are known to be glycophytes, while others are halophytes. Carex morrowii Boott (Cyperaceae) is resistant to trample through their root structure and has an essential ornamental value in the landscape with their leaves. However, no information was found about the level of salinity tolerance/ sensitivity of the Carex morrowii among these species. In the present study, changes in trace element contents (Na, K, Ca, Cu, Mn, Mg, Ni, Fe, P, Zn, and N) and their transport from roots to leaves, osmotic regulation, alterations in chlorophyll and carotenoid contents, nitrogen assimilation (nitrate reductase activity; NRA) and total soluble protein content in both roots and leaves of Carex morrowii under different salinity concentrations (50 mM, 100 mM, 200 mM and 300 mM NaCl) were examined in detail. Our study provides the first detailed data concerning the responses of leaves and roots and the determination of the level of salinity tolerance/sensitivity of the Carex morrowii. The K+ /Na+ ratio was preserved up to 200 mM NaCl, and accordingly, the element uptake and transport ratios showed that they could control moderate NaCl levels. Ca homeostasis that is maintained even in 200 mM NaCl concentration can be effective in maintaining the structural integrity and selective permeability of the cell membranes, while 300 mM NaCl concentration caused decreased photosynthetic pigments, and deterioration in element content and compartmentation. Moreover, these data suggest that plant parts of Carex morrowii respond differently against varied levels of salinity stress. Although the decrease in NR activity at 200 mM and 300 mM NaCl concentrations in the leaves, NR activity was maintained in the roots. Consequently, Carex morrowii is moderately tolerant to salinity and the carotenoid content and osmotic regulation of Carex morrowii appears to be instrumental in its survival at different salinity levels. Especially the roots of Carex morrowii have a remarkable role in salinity tolerance.Keywords
Carex species belonging to the family Cyperaceae, are important perennial vascular plants of the ecosystem grown for their foliage [1,2]. Carex species are widely used in many parts of the world because of cold and drought tolerance and trample resistance due to the root structure, and high ornamental value in the landscape [3–5]. Members of this genus can be found almost anywhere except in extreme desert, marine, and deep-water environments. Therefore, it exhibits enormous ecological diversity [6]. For this reason, they have just become the subject of many studies, from their genetic background to their responses to different abiotic stresses [7–9]. Especially the use of poor quality and recycled water in landscape irrigation due to competition and the cost of drinking water [9] has made it important and necessary to determine the salinity tolerance of Carex species, which are frequently used in landscaping.
Salinity has now become one of the most important abiotic stress factors due to changing climatic conditions and anthropogenic activities. 7.2 hectares in Canada and 8.5 million hectares of land in the United States, respectively, suffer from salinity according to McSorley et al. [10] and Yensen [11]. Degraded cultivated land [12,13], excessive fertilizer [14], as well as irrigation with reclaimed water continuously [15,16], are the leading anthropogenic activity that causes salinity. Especially, it is known that poor quality and reclaimed water are used for landscape irrigation due to the competition and cost of drinking water [9]. Thus, evaluation of the salinity tolerance of landscape plants such as Carex species is important and necessary. Responses of Carex species to salinity are very diverse. Although Carex glareosa and Carex livida are species that can live in high salinity conditions [17], C. elata, C. flava, C. panicea, C. paniculata, C. pseudocyperus, C. riparia, C. rostrata, C. vesicaria, C. acuta, C. canescens species are glycophytes as stated by Schück et al. [18]. There is no data in the literature regarding the levels of salinity tolerance/sensitivity of Carex morrowii yet. Therefore, it is necessary to determine their propensity to thrive in salty environments and to learn whether Carex morrowii is glycophytes or halophytes. These species (glycophytes and halophytes) differ in how they respond to salinity in terms of toxic ion uptake, ion compartmentation and/or exclusion, osmotic regulation, CO2 assimilation, photosynthetic electron transport, chlorophyll content and fluorescence, total protein content and compositions [19–21].
Therefore, in the present study, toxic ion uptake, changes in trace element contents (Na, K, Ca, Cu, Mn, Mg, Ni, Fe, P, Zn, and N), an accumulation of these nutrients in plant parts, osmotic regulation, chlorophyll, and carotenoid contents, nitrogen assimilation capacity (nitrate reductase activity; NRA) and total soluble protein content in both roots and leaves of Carex morrowii Boott were examined in detailed at four different salinity concentrations (50 mM, 100 mM, 200 mM, and 300 mM NaCl). To the best of our knowledge, besides physiological findings, our study provides the first detailed data about the responses of leaves and roots and the determination of the level of salinity tolerance/sensitivity of the Carex morrowii. Studying the behavior of Carex morrowii in response to salinity will provide us with valuable information for future physiological and molecular studies on select and breeding plants to increase their salt tolerance and productivity to understand and explain the mechanisms of salinity tolerance.
Carex morrowii plants were supplied from a local nursery and were planted in 14 × 12 cm pots containing perlite at the laboratory. Then, they were placed in a growth chamber at Bursa Uludag University. During the experiment, the temperature of the growth chamber was maintained at 25°C during the day and 18°C at night, while it was set in a 16-h photoperiod [average humidity 60%, light 1200 lux]. Hoagland solution [22] was used as a nutrient solution [pH: 6.0]. All plants were grown in these conditions for two weeks.
In the determination of the level of salinity tolerance/sensitivity of the Carex morrowii Boott, salinity treatments were applied in a wide range as 50 mM NaCl (slight salinity; EC: 1–4 dS m−1), 100 mM NaCl (moderate salinity; EC: 5–7 dS m−1), 200 mM NaCl (moderate salinity; EC: 8–10 dS m−1) and 300 mM NaCl (severe salinity; EC: >12 dS m−1). The incremental method described by Pavlović et al. [23] was used to avoid high salinity shock and salt concentrations in 2-day intervals stepwise increased with 25 mM NaCl. After it had reached the final salt concentration, salinity treatments continued for 15 days more at 2-day intervals. The treatments were carried out for 45 days in total. The nutrient solution of controls of each species remained unchanged. On completion of the experiments, the leaves of the plants in each pot were scored for health description followed by analyses of chlorophyll content. Plants were then harvested together with a control group and divided into roots and leaves. Some of their leaves and roots were dried for elemental analysis and the rest were frozen in liquid nitrogen and kept at −80°C for physiological analysis.
2.2 Determination of Trace Element (Na, K, Ca, Cu, Mn, Mg, Ni, Fe, P, Zn) Contents by Inductively Coupled Plasma-Optical Emission Spectrometer (ICP-OES)
Laboratory supplies, such as plastic and glassware, were soaked in a dilute nitric acid solution [10% v/v] overnight to prevent contamination from the outside. They were then rinsed multiple times with ultrapure water and dried in an oven at 40°C. Single standard solutions of trace elements (1000 mgL−1) from Inorganic Ventures (USA), and ultrapure-grade argon (Ar) (99.999% pure) from Orsez (Turkey) were purchased. HNO3 (65%, v/v) was of suprapure quality (Merck, Darmstadt-Germany), and all the other reagents were of analytical reagent grade. The plant samples were homogenized in a sterile porcelain mortar after being dried in the oven at 70°C for 24 h and weighed. In a 100-mL borosilicate glass vessel, the powdered samples were digested with a mixture of HNO3 [3 mL] and H2O2 [2 mL] using 0.0080 g of leaves and 0.0035 g of roots. Each sample underwent a digestion process in triplicate. For the root and leaf samples, the solutions were transferred to polypropylene centrifuge tubes after cooling to room temperature and were diluted to a volume of 25 mL with 0.3% v/v nitric acid. The approved reference materials and reagent blanks underwent the same digestion process. To account for any instrument drift, the internal standard was added to the samples, calibration standards, and blanks at a final concentration of 10 µg L−1. By studying the verified reference material, the method’s correctness was assessed. The multi-element standard solution was daily diluted to provide working solutions of trace elements (Na, K, Ca, Cu, Mn, Mg, Ni, Fe, P, Zn), which were then used for external calibration. Four replicates were used for each trace element analysis. Trace element contents of the samples were determined by ICP-OES (Perkin Elmer 2100 USA). The detection and quantification limits of K, Ca, P, Mg, Na, Mn, Ni, Fe, Zn and Cu were 2.2, 2.7, 3.0, 2.1, 0.9, 0.1, 0.3, 0.3, 0.3, 0.2 mg/kg and 7.4, 9.1, 10.4, 6.9, 3.0, 0.4, 1.0, 1.0, 0.8, 0.7 mg/kg, respectively.
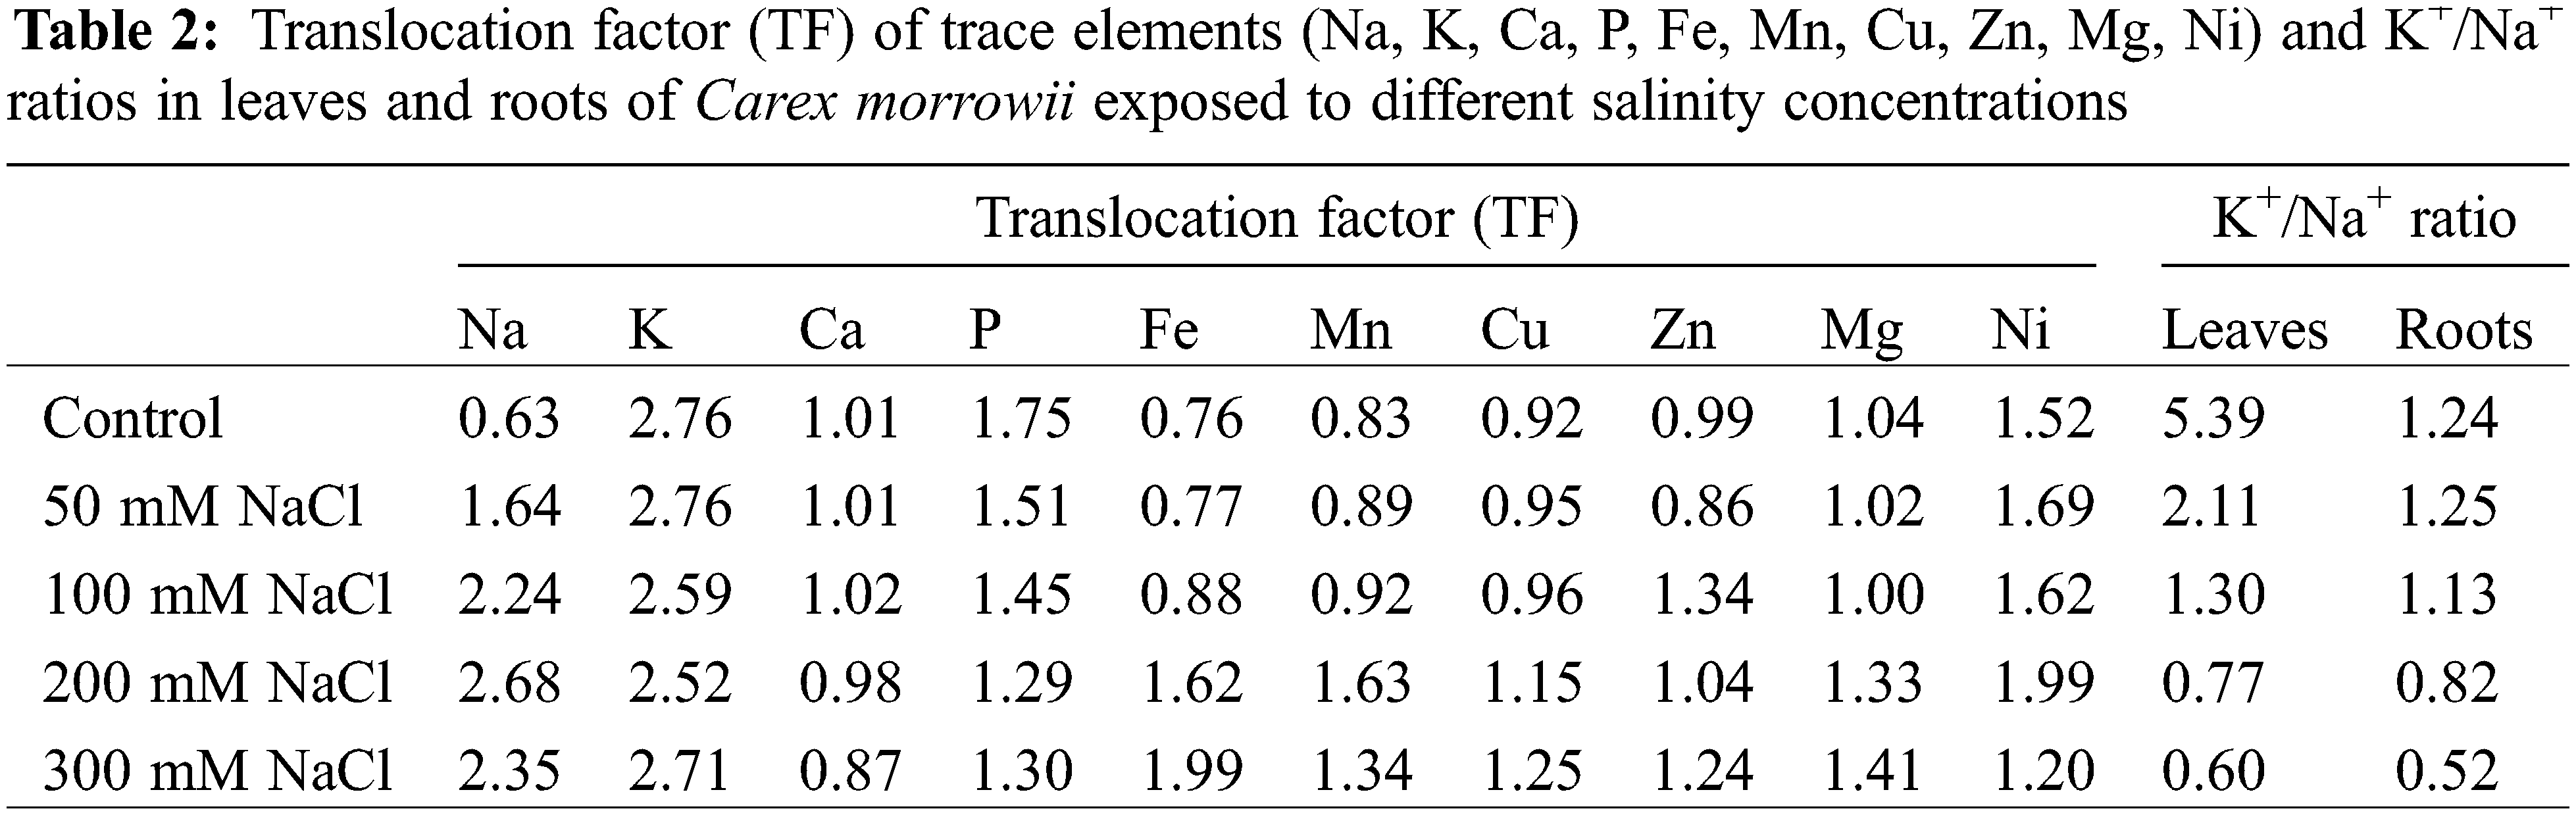
Translocation factor (TF) indicators as widely applied to evaluate the trace element accumulation in the plant parts were calculated. The translocation factor (TF) refers to the ratio of the total element concentration of leaves (Cleaves) and element concentration of roots (Croots): Cleaves/Croots [24].
2.3 Determination of Nitrogen (N) Contents
N contents of the plant parts were determined using Kjeldahl apparatus (FOSS 984.13) and expressed as percent (%). N content of all plant samples was carried out by drying and remained constant at 70°C. Then, samples were milled through hammer mill particle size of about 0.5 to 1 ml. And then, the dried and ground plant samples were distilled in alkaline environment, which was burned at 180°C with the concentrated H2SO4 (0.5 g) and combustion salt. After distillation, the flask containing 30 ml of 2% boric acid was titrated with 0.1 N H2SO4 and the total N amounts in the samples were calculated from the consumption.
2.4 Chlorophyll Contents (Chlorophyll a, Chlorophyll b, and Total Chlorophyll), Chlorophyll Degradation Rates (a/b), and Carotenoid Contents
According to the Arnon [25] method, the amount of chlorophyll (chlorophyll a, chlorophyll b, and total chlorophyll) was measured spectrophotometrically. 80% acetone [10 mL] was used to homogenize fresh leaves [0.05 g fresh weight; FW], which were then filtered. The absorbance of the samples at 645, 663, and 470 nm was measured (Novaspec II, LKB Biochrom) for determining chlorophyll a, chlorophyll b, total chlorophyll, and chlorophyll degradation rate (a/b) and calculated according to the formulations in below.
Then, the unit of total carotenoids could be converted into the content unit, i.e., mass per unit dry leaf weight (mg/g), using data on the volume of leaf pigment extract, the dry leaf weight, and the leaf disc area.
where VT (ml) is the volume of leaf pigment extract solution and W(g) is the leaf fresh weight (FW).
2.5 Nitrate Reductase (NR) Activity
The NR activity is an in-vivo test based on the spectrophotometric absorbance of the nitrite (NO2−) formed as the product of the reduction of nitrate in the incubation medium. It was determined with the method, described by Hageman et al. [26] and Jaworski [27], and modified by Gebauer et al. [28]. It was calculated using the absorption value and dry weight and expressed as μmol NO2− g−1 D.W. h−1.
2.6 Total Soluble Protein Content
Total soluble protein content was determined according to the procedure determined by Arora et al. [29] with some modifications. Leaves and roots samples were ground in liquid nitrogen and were homogenized in borate buffer (ascorbic acid [50 mM], sodium tetraborate [50 mM], phenylmethyl sulphonyl fluoride [PMSF,1 mM], β-mercaptoethanol [1%], pH 9.0) and insoluble PVPP paste made with this buffer [extraction ratio; tissue/ PVPP paste/buffer: 1/2/5] at 4°C. Then samples were centrifuged for 1.5 h at 26000 g. The supernatant was filtered with 0.2 and 0.4 μm filters (Millex; Millipore Co., Bedford, MA, USA). Protein content was measured according to the Bradford assay method using bovine serum albumin as the standard [30].
In each treatment containing five seedlings, element analyses were performed with four replicates (n = 4), while the other examined parameters included three replicates (n = 3) in each treatment. Data presented in the text, figures, and tables are expressed as means ± standard deviation of means. All the statistical tests were performed at a significance level of 0.05 in SPSS Statistics (version 22.0, IBM Corp., Chicago, IL) using factorial analysis of variance (one-way ANOVA) followed by the Tukey test.
In response to salinity, plant species are very diverse in terms of differences in indicator parameters of how well they can withstand salinity conditions such as ion uptake, ion compartmentation and/or exclusion, osmotic regulation, chlorophyll content, generation of reactive oxygen species (ROS), and antioxidant defenses [21,31,32]. And they are classified as glycophytes or halophytes based on these parameters. The main characteristic feature of salinity tolerance in plants is the maintenance of osmotic harmony in plant cells despite Na+ ion uptake to plant parts, Na+ transport from roots to leaves, intracellular Na+ partitioning, and even Na+ secretion in leaves [33–35]. In the present study, Na accumulation was observed in the plant parts of Carex morrowii, and it was determined that the Na accumulation did not change statistically compared to the control, even at 200 mM NaCl concentration in the root parts (Table 1, p < 0.05). In the leaves, on the other hand, Na accumulation increased as the salt concentrations increased. The accumulation of Na in the leaf parts is approximately 2.5 times higher than in the roots. It can also be seen from the translocation factor (TF) value of Na (Table 2). Moreover, it is known that K content decreases due to increased Na content in plant cells exposed to salinity [34]. In this study, the K content in both root and leaf parts of C. morrowii started to decrease statistically with 200 and 300 mM NaCl applications, while it was not statistically changed in 50 and 100 mM NaCl treatments (Table 1, p < 0.05). At the same time, maintaining a minimal cytosolic K+/Na+ ratio is accepted as the key determinant of salinity tolerance [13,36,37]. In both roots and leaves, K+/Na+ ratio compared to control was not changed with 50 mM and 100 mM NaCl treatments (Table 2) and the minimal cytosolic ratio was maintained up to 1 in these salinity concentrations. For normal metabolism, the K+/Na+ ratio is a minimum of 1 [38,39]. Conservation of K+ uptake and accumulation despite toxic Na+ accumulation in the leaves plays a major role in the understanding of the salinity tolerance levels of Carex morrowii.
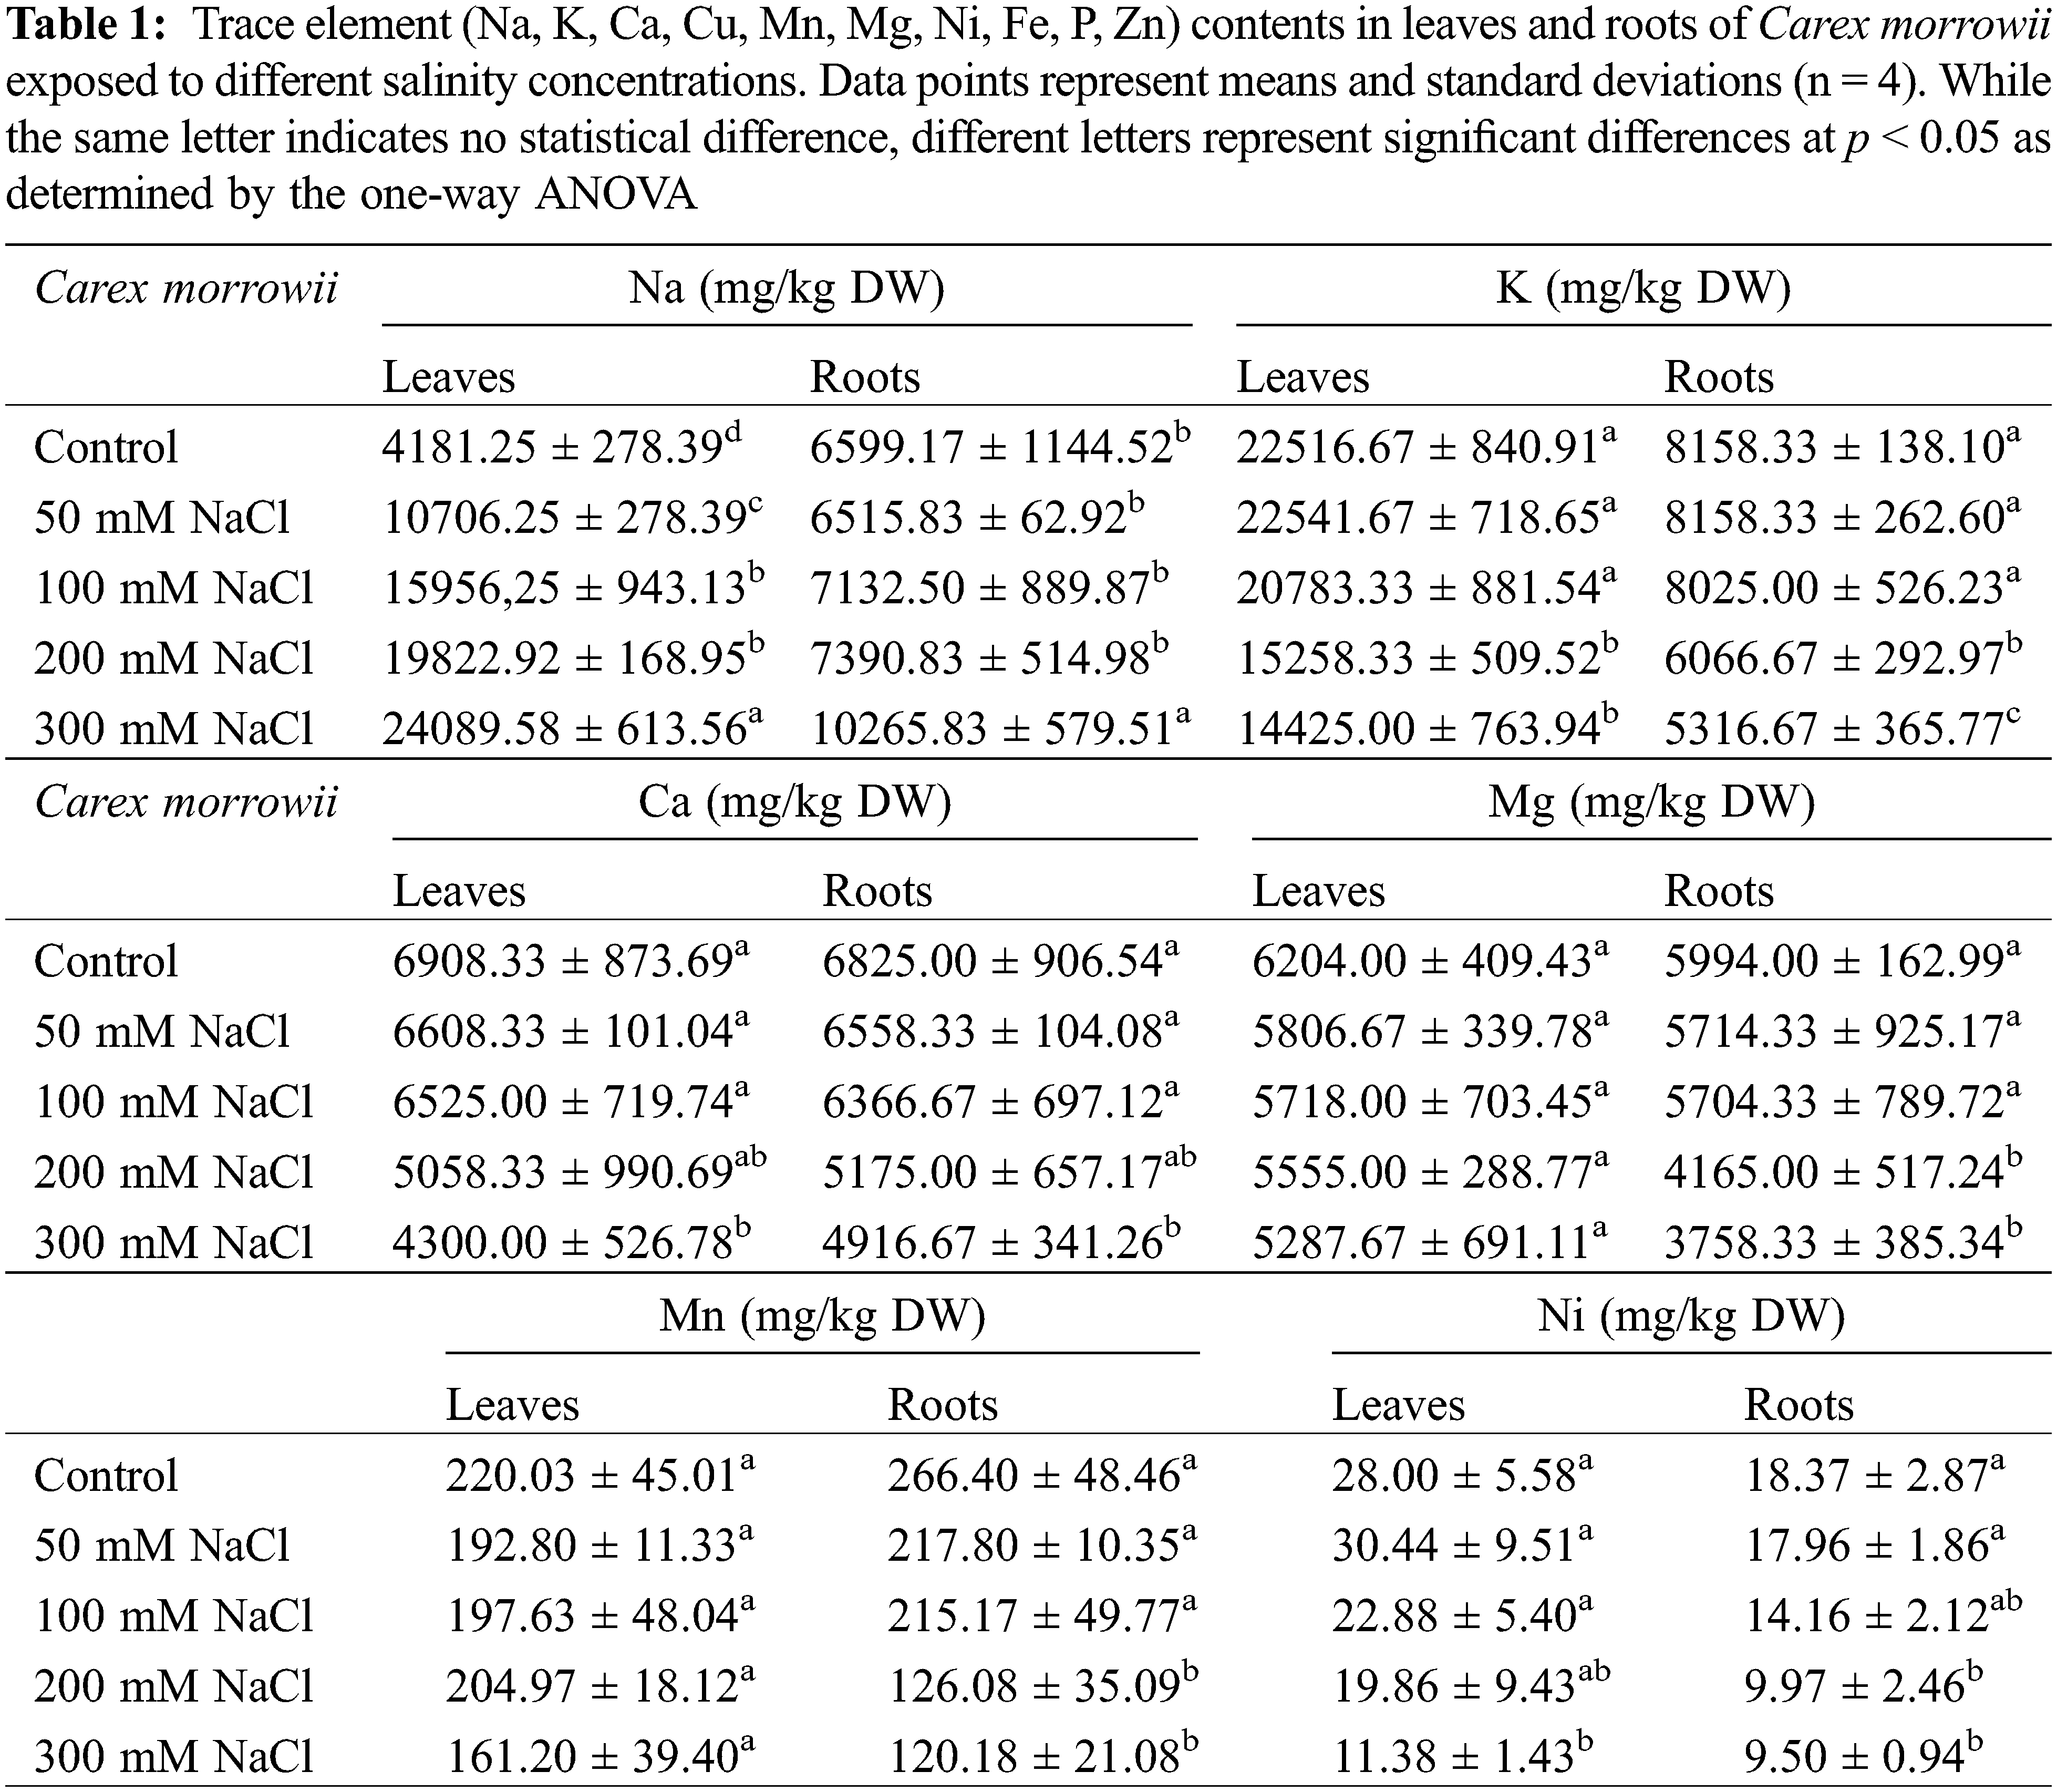
Moreover, maintaining homeostasis of Ca ions like K+ is also an important indicator of salinity tolerance [33]. Changes in Ca uptake and distribution will result in a decrease in plant growth and development due to the problems to be experienced in turgor control and cell wall integrity [40]. In the present study, Ca levels in leaves and roots of Carex morrowii were not affected by 50 mM and 100 mM NaCl concentrations (Table 1). The lowest Ca levels were determined in 300 mM NaCl concentration as 4916.67 ± 341.26 mg/kg DW for the roots and 4300.00 ± 526.78 mg/kg DW for the leaves (p < 0.05). Accordingly, the rate of decrease in Ca levels at 300 mM NaCl concentration is 37% for leaves and 27% for roots compared to the control. However, this rate at 200 mM NaCl concentration is approximately limited by 25% both for leaves and roots compared to the control. Ca levels in leaves and roots of C. morrowii under 200 mM NaCl concentration is at the values that should be found in the plants as specified by Marschner [41] and White et al. [42]. Thus, even in 200 mM NaCl concentration, Ca levels can be effective in maintaining the structural integrity and selective permeability of the cell membranes [43].
The other element contents including Fe, Mg, Mn, Ni, P, Zn, and Cu were also determined in the roots and leaves of Carex morrowii (Table 1). While no change in Fe, Mg, and Mn concentrations of the leaves was observed in all NaCl concentrations, Fe, Mg and Mn concentrations of the roots decreased compared to the control group in 200 and 300 mM NaCl applications (p < 0.05). On the other hand, in the accumulation of Zn and Cu, the same decrease was statistically detected in all NaCl concentrations in the leaves. In contrast, the roots’ accumulation of Zn, and Cu decreased as the NaCl concentration increased. The translocation factor (TF) expressing the rate of element transport to leaves for Fe, Mn, Mg, Zn, and Cu increased (Table 2). Accordingly, 200 and 300 mM NaCl concentrations in C. morrowii caused these micronutrients to transport to the leaves. This case can be a strategy for Carex morrowii survival in high salinity conditions and to alleviate the detrimental effects of salinity. Hence, the salt resistance of C. morrowii has been linked to the translocating and accumulation of these trace elements in roots and leaves. Because trace elements are important components for plants, and a lack of them can have a negative impact on a plant’s ability to grow and develop [44]. Element absorption and translocation capability in plants under abiotic stress conditions cause a more effective metabolic cycle and so they are better able to adapt to their surroundings [45,46].
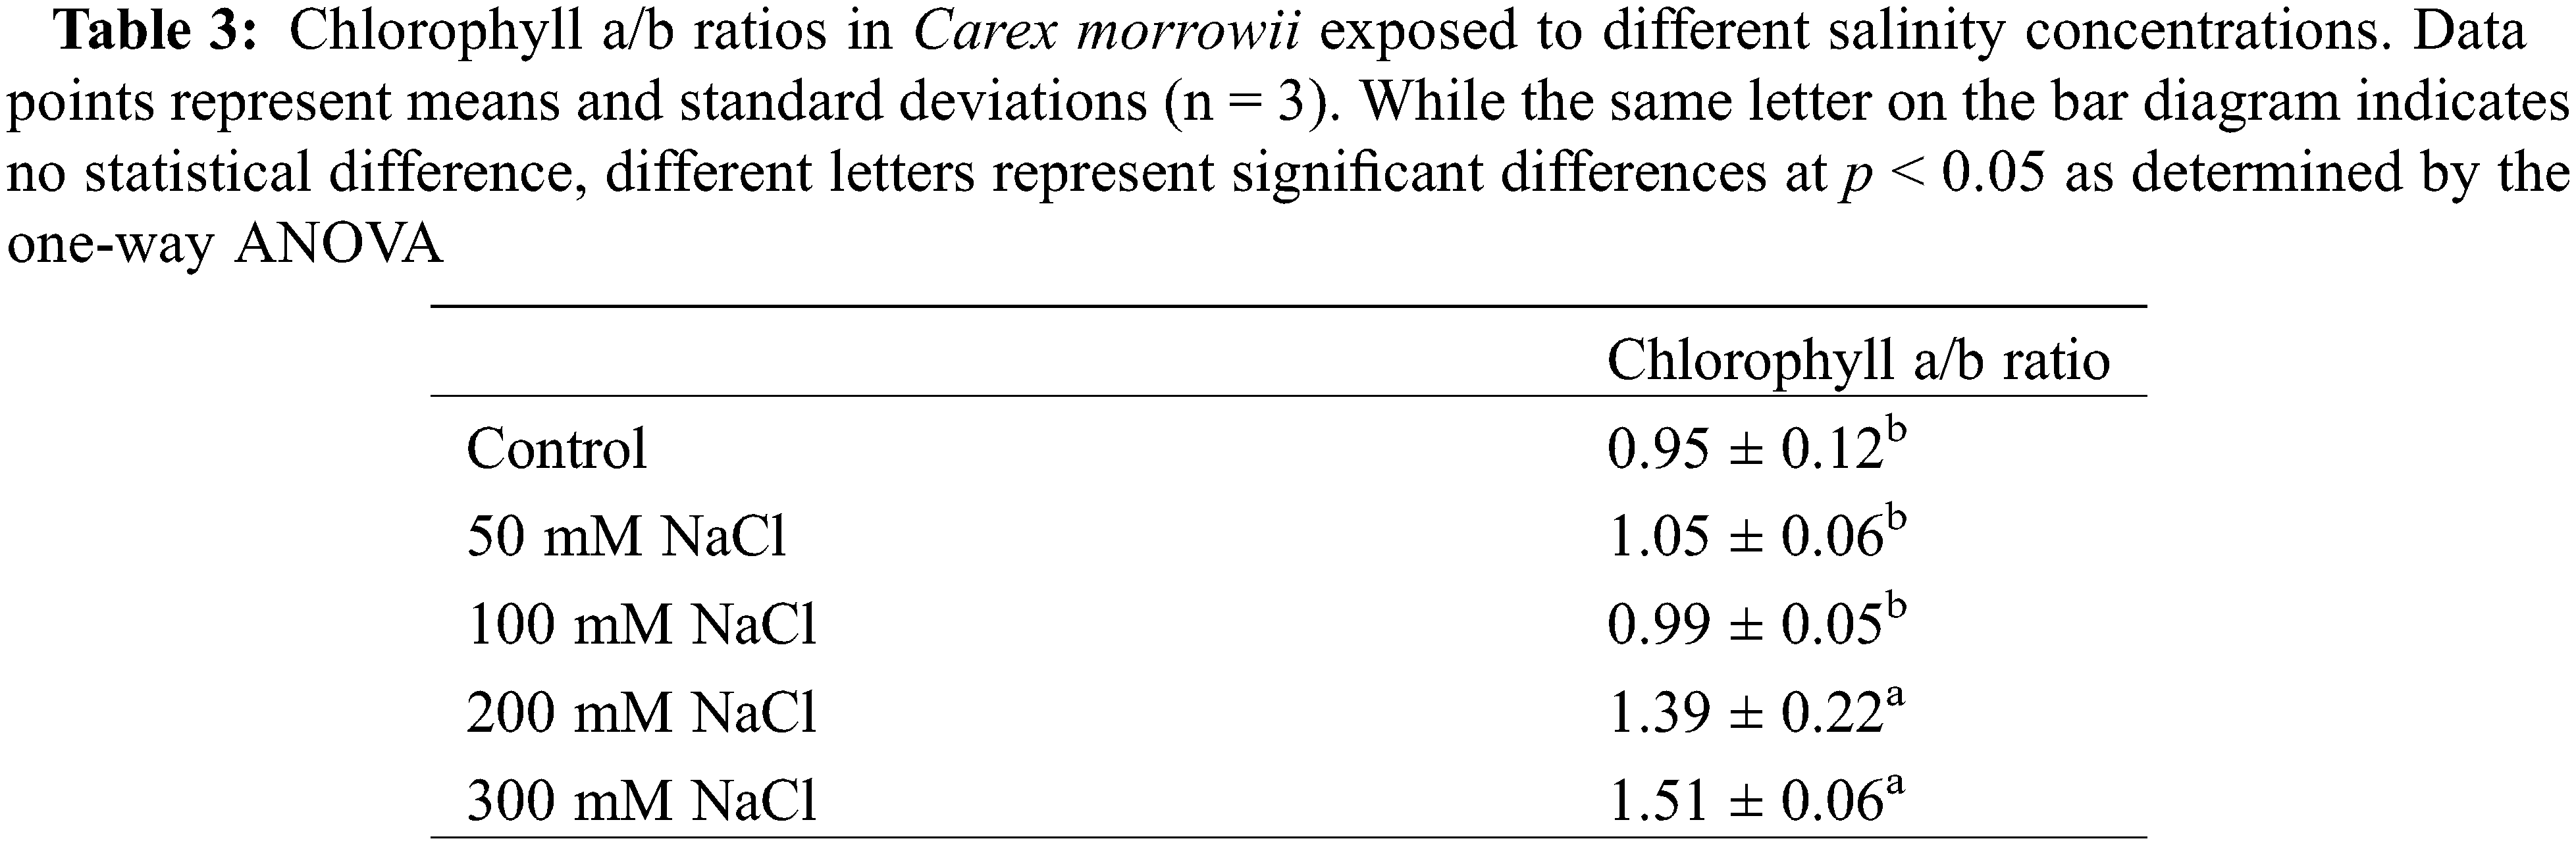
Salt tolerance in plants is related to the ability of a plant to maintain chlorophyll content [47,48]. Glycophytes have a reduction in photosynthetic performance, even salinity low concentrations [49,50]. The literature mentions different photosynthetic responses for halophyte plants; some studies have shown that photosynthesis is unaffected by salinity and even stimulated at low salt concentrations [47,51,52]. There are also studies in which the photosynthetic activity of two obligate halophyte species Arthrocnemum perenne and A. fruticosum from the Chenopodiaceae family was adversely affected, but they continued to survive even though they decreased [47]. In the present study also, responses of Carex morrowii to salinity concentrations were similar. 50 mM and 100 mM NaCl applications did not also alter the chlorophyll content compared to the control (Fig. 1). Although 200 and 300 mM NaCl applications caused a decrease of approximately 50% in the chlorophyll a, b, and total chlorophyll contents, C. morrowii survived by preserving the pigment content at a level in the 200 mM NaCl and above concentrations (Figs. 1 and 2, p < 0.05). At the same time, Chl a/b ratio in C. morrowii increased in the 200 mM and 300 mM NaCl concentrations (Table 3). Chl a/b ratio usually is used to assess a plant’s physiological condition [53]. The increase in Chl a/b ratio of C. morrowii at 200 and 300 mM NaCl, can be a strategy for a reorganization of the photosystem composition to avoid the hazards of photoinhibition. Similar cases were found in the findings of Ramani et al. [54] and Rabhi et al. [47]. It is known that halophytes are plants that can survive in environments where the salt concentration is about 200 mM NaCl or more, by showing photosynthetic adaptation to salinity [55].
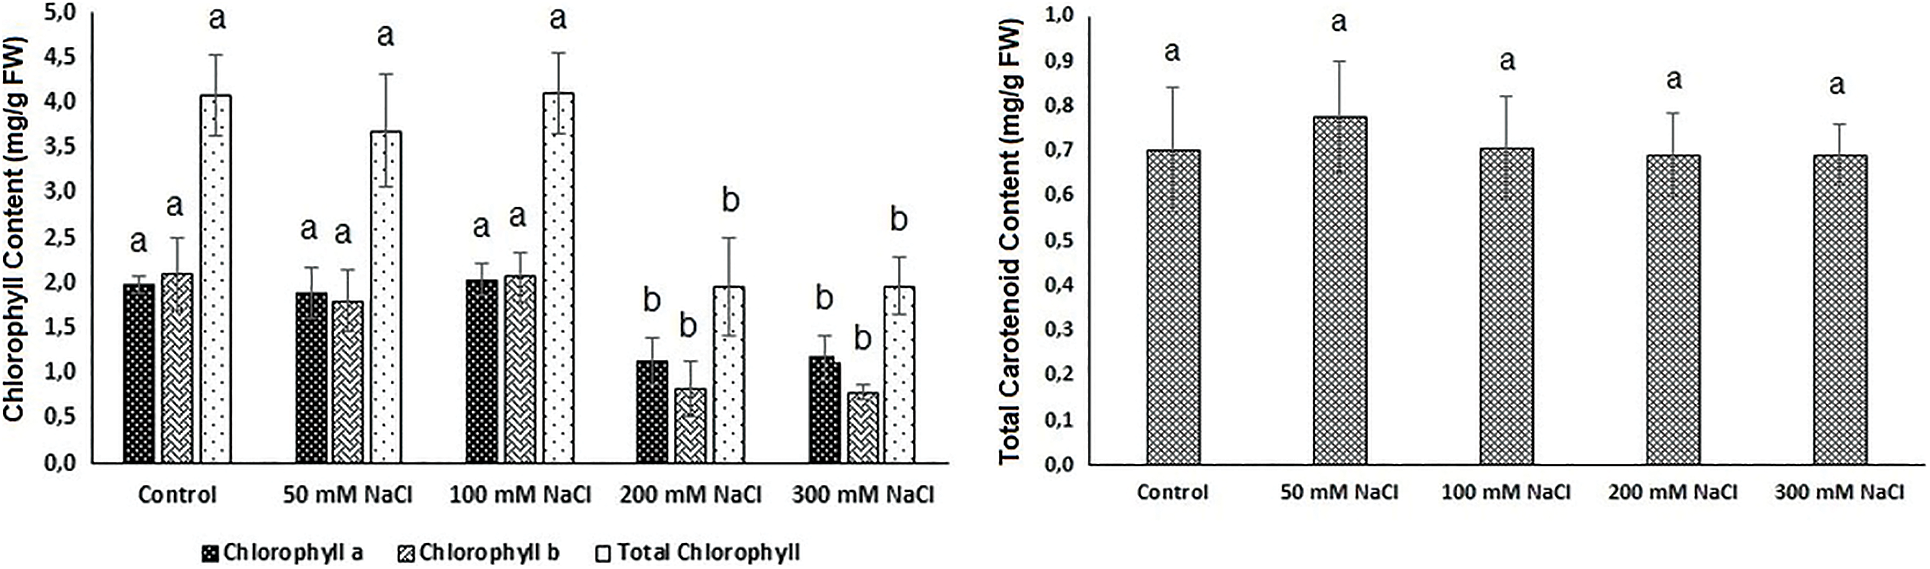
Figure 1: Chlorophyll (Chlorophyll a, Chlorophyll b, and Total Chlorophyll) and total carotenoid contents in leaves of Carex morrowii exposed to different salinity concentrations. Data points represent means and standard deviations (n = 3). While the same letter on the bar diagram indicates no statistical difference, different letters represent significant differences at p < 0.05 as determined by the one-way ANOVA
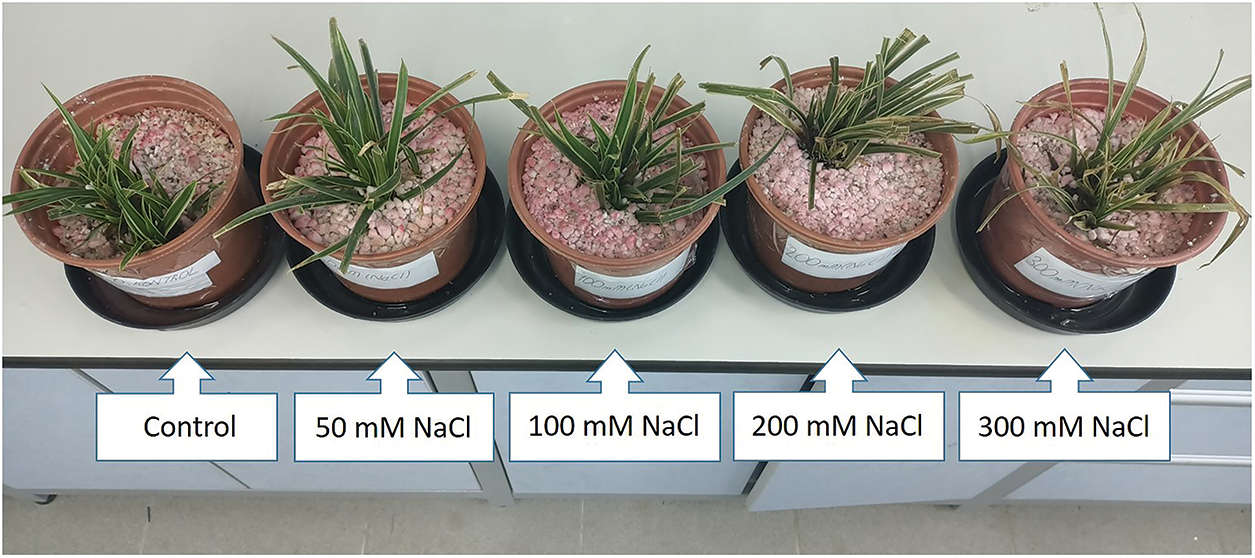
Figure 2: Visual appearance of Carex morrowii exposed to different salinity concentrations
As indicated in Fig. 1, no change in the total carotenoid content of C. morrowii was observed. Similar findings were reported in Brassica species [56,57] and safflower (Carthamus tinctorius L.) seedlings [58] grown on saline soils. It is known that carotenoid contents are the main components for plants in maintaining the possibility of their existence and growth under stressful environmental conditions [59]. Under salinity stress, carotenoids activated the mevalonic acid pathway and trigger the biosynthesis of abscisic acid (ABA) which is an important phytohormone involved in cellular signaling, regulation of plant growth, and stomatal conductance [60,61]. Thus, the carotenoid content of Carex morrowii appears to be instrumental in its survival at high salinity concentrations.
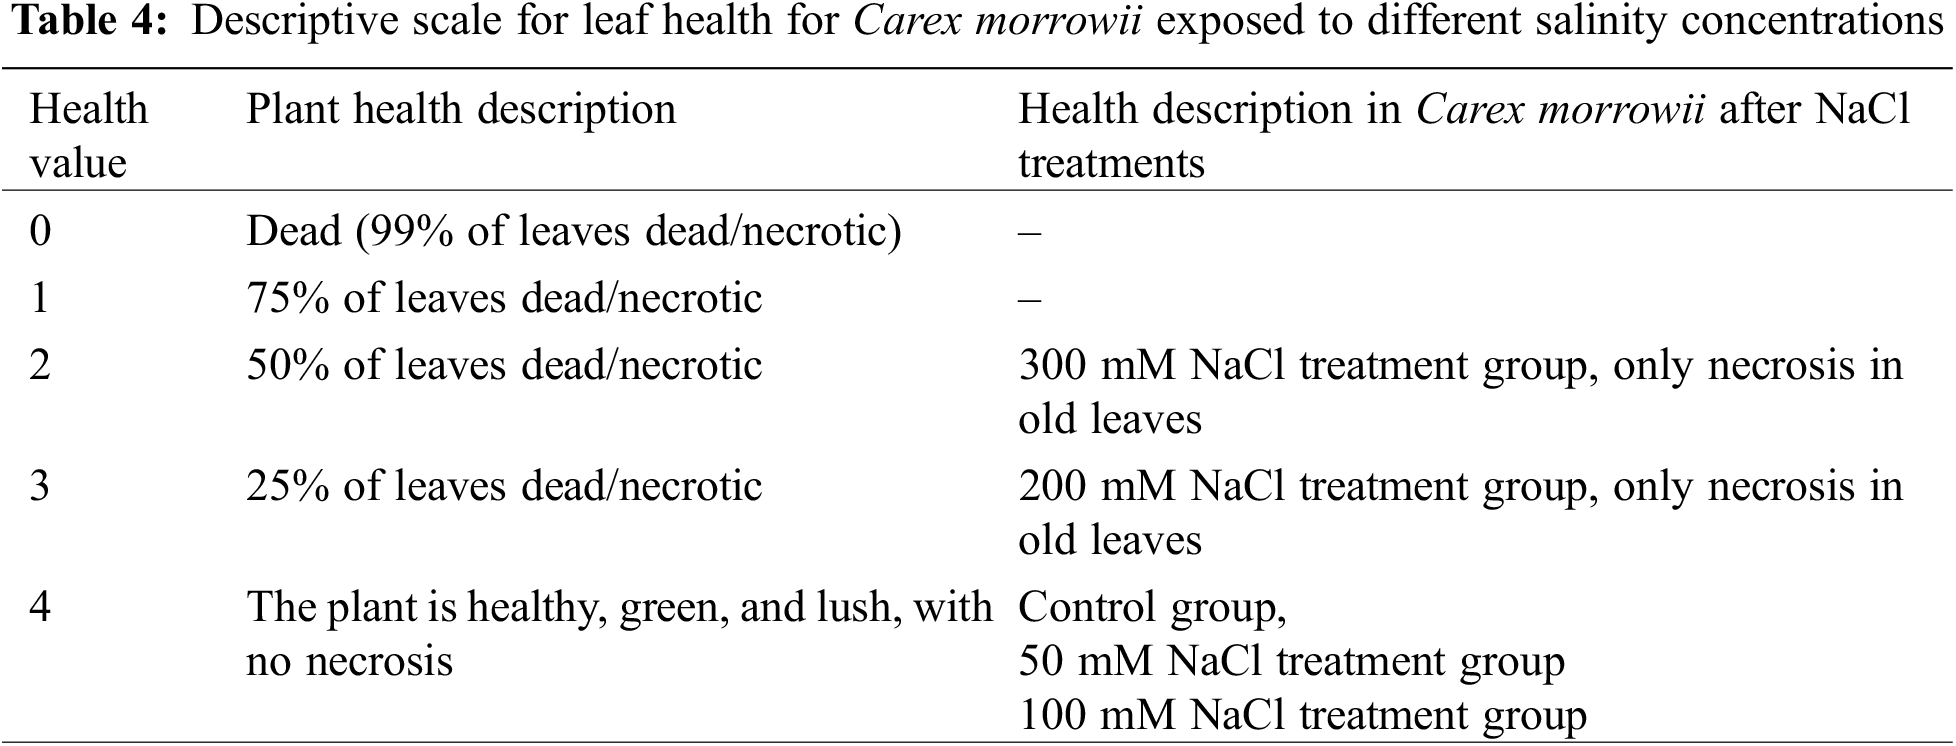
The visual appearance of C. morrowii under NaCl applications was shown in Fig. 2. A descriptive scale for the leaf health of C. morrowii is presented in Table 4. There was no death in all the leaves in any application. However, necrosis was observed on the old leaves in the 200 and 300 mM NaCl treatments. While 25% of old leaves necrotic of C. morrowii in the 200 mM NaCl treatment group were determined, in the 300 mM NaCl treatment group 50% of old leaves were detected as necrosis. The high Na ions accumulation in the old leaves causes death and fall of these organs and this is observed in some glycophytes and most halophytes (salt-tolerant) [32].
Although nitrate uptake of plants is limited under salinity conditions [62], the responses of halophytes are still unclear. In this study, the nitrate uptake in Carex morrowii exposed to salinity was observed by its nitrate reductase (NR) activity which is considered an indicator of nitrogen metabolism [63]. While the NR activity determined in the roots of C. morrowii was not affected by NaCl concentrations, it was determined that the NR activity in the leaves decreased at a similar rate under 100, 200, and 300 mM NaCl concentrations (Fig. 3, p < 0.05). It is also stated by Abd El-Baki et al. [64] that the transport of nitrate from root to shoot is impaired in salinity conditions, and NR activity decreases in the leaves and intensifies in the root parts of Zea mays which have moderate salt tolerance. The reason for the decreased NR activity in the leaves seems that osmotic stress triggered by salinity inactivated NR activity. However, this is not an irreversible process [65]. On the other hand, a study on the nitrogen metabolism of halophytes indicates that there are low levels of NR activity in the leaves and there is only a small increase in enzyme level with nitrate addition due to the root zone being an important nitrate reduction site [66]. Thus, the maintenance of NR activity in the roots of C. morrowii indicates that the plant protects itself under salinity conditions. Moreover, C. morrowii is species that is a tall perennial with widespread stolon arrangement like other Sedge plants and is known to regulate the above-ground parts by preserving the existence of roots under stress conditions [6]. It is also stated by Reda et al. [65] that the determinant responses about NR activity and nitrogen utilization should be obtained from the responses of the roots. Therefore, the percentage (%) of total N content in both leaves and roots of Carex morrowii was also determined in our study (Fig. 4). While the % N content in the root parts was not affected by NaCl concentrations, the % N content in the leaf parts of C. morrowii decreased similarly in 200 and 300 mM NaCl concentrations (Fig. 4, p < 0.05). The responses belonging to % N contents were consistent with the NRA in plant parts of C. morrowii. Carex morrowii was able to cope with high salinity concentrations thanks to its strong root system. Moreover, data on the total soluble protein content of Carex morrowii also support these results (Fig. 5). At high salinity concentrations applied as 200 and 300 mM NaCl, the total soluble protein content in the leaves decreased, while it increased in the root parts (p < 0.05).
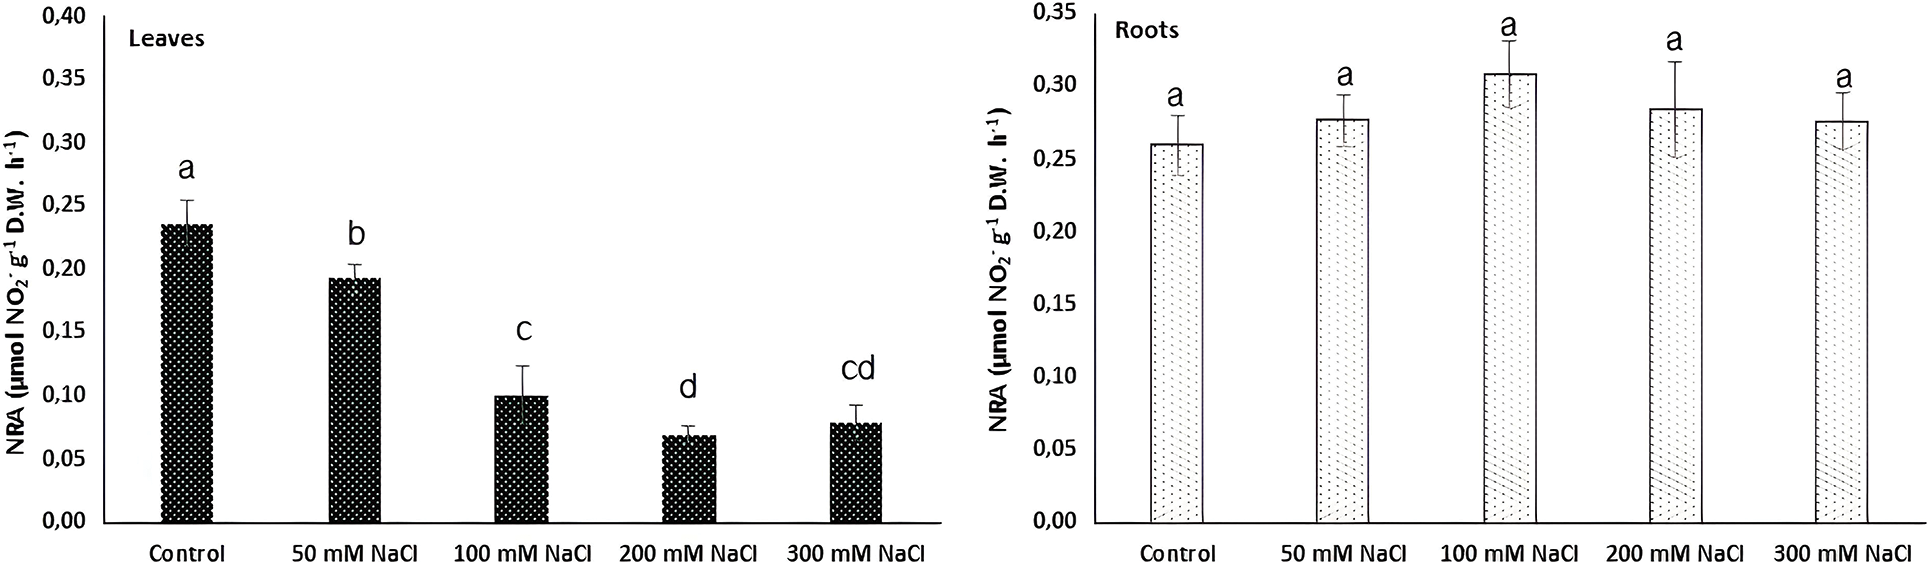
Figure 3: Nitrate reductase activity (NRA, μmol NO2− g−1 D.W. h−1) in leaves and roots of Carex morrowii exposed to different salinity concentrations. Data points represent means and standard deviations (n = 3). While the same letter on the bar diagram indicates no statistical difference, different letters represent significant differences at p < 0.05 as determined by the one-way ANOVA
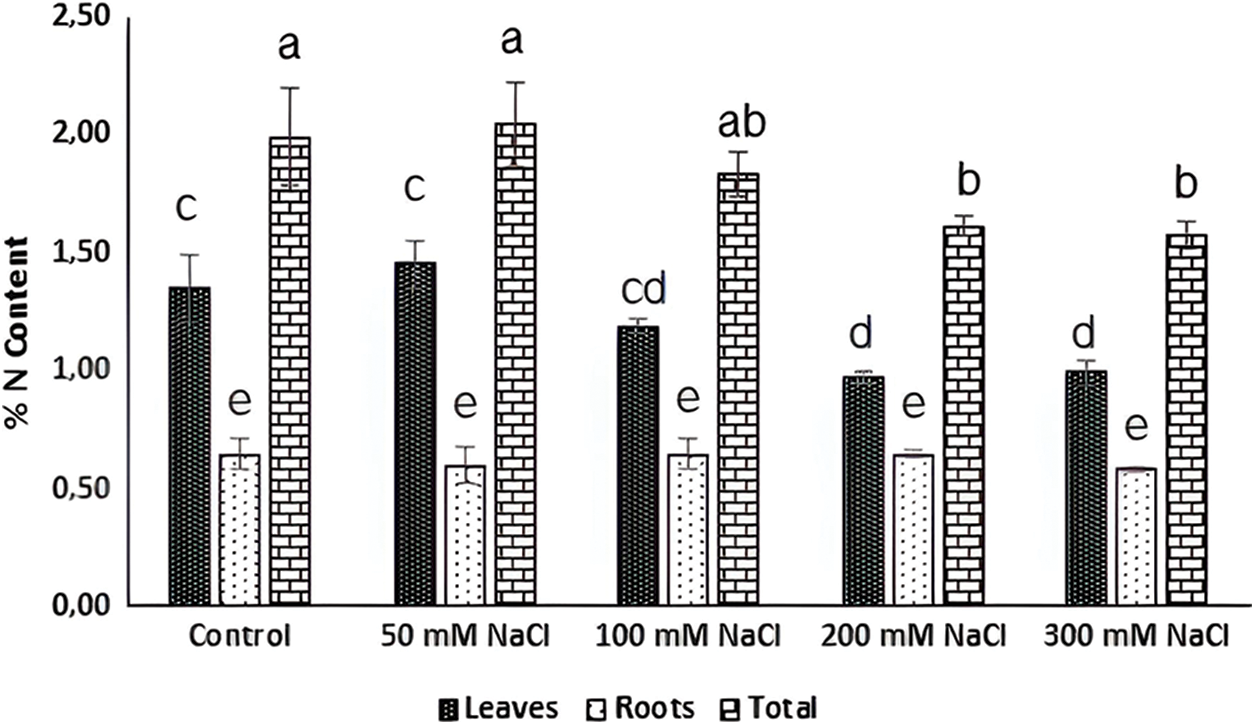
Figure 4: N content (%) in leaves and roots of Carex morrowii exposed to different salinity concentrations. Data points represent means and standard deviations (n = 3). While the same letter on the bar diagram indicates no statistical difference, different letters represent significant differences at p < 0.05 as determined by the one-way ANOVA
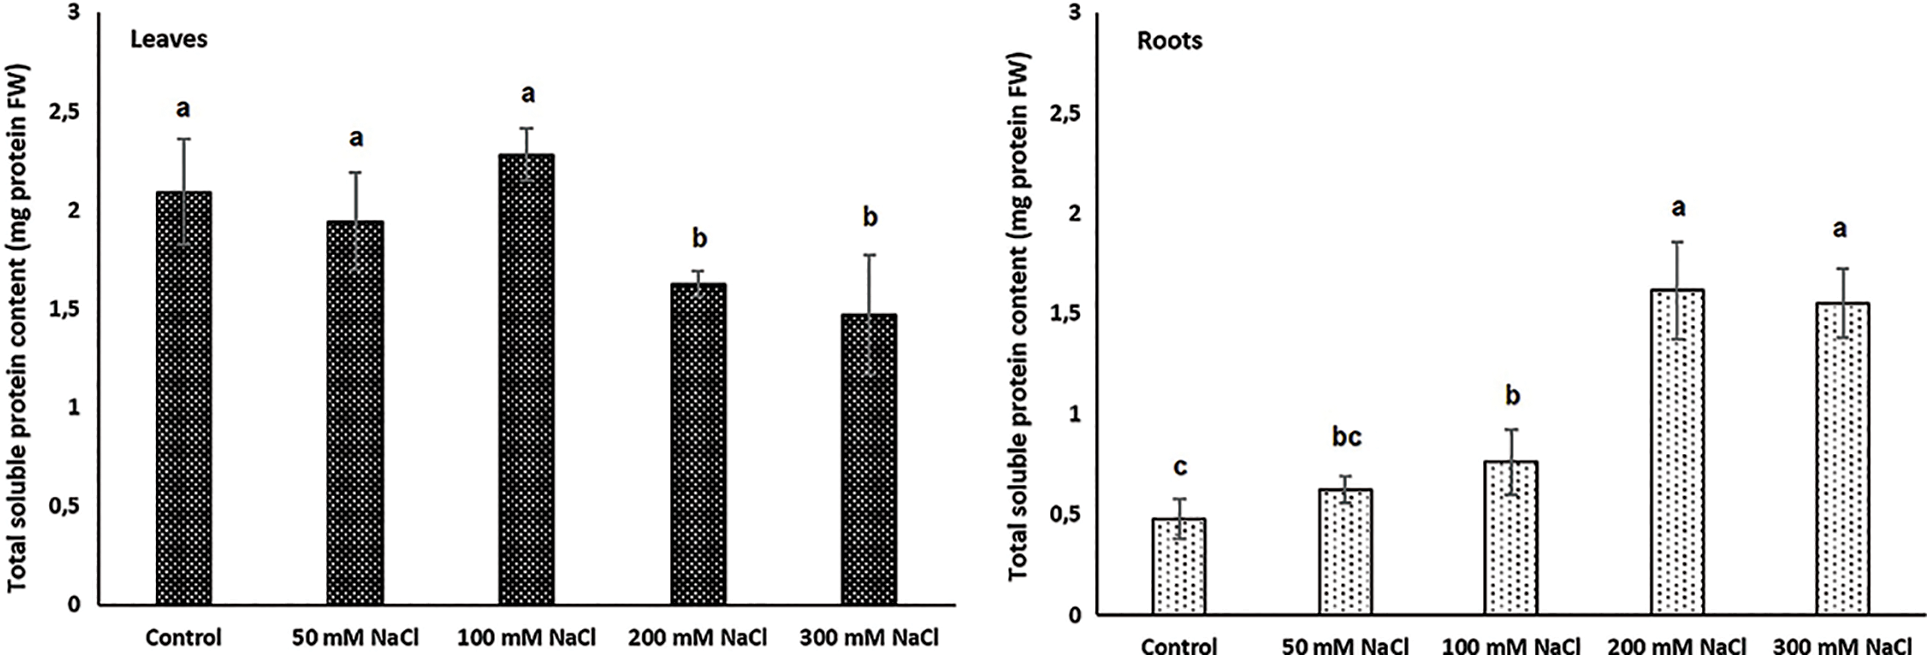
Figure 5: Total soluble protein content (mg fresh weight [mg FW]) in leaves and roots of Carex morrowii exposed to different salinity concentrations. Data points represent means and standard deviations (n = 3). While the same letter on the bar diagram indicates no statistical difference, different letters represent significant differences at p < 0.05 as determined by the one-way ANOVA
Carex morrowii can easily withstand 50 and 100 mM NaCl concentrations. 200 mM NaCl concentration seems to be the highest possible value for Carex morrowii. The K+/Na+ ratio was preserved up to 200 mM NaCl, and accordingly, the trace element uptake and transport ratios showed that it had the ability to control moderate NaCl levels. Ca homeostasis that is maintained even in 200 mM NaCl concentration may have been effective in maintaining the structural integrity and selective permeability of the cell membranes. As a matter of fact, the morphological appearance and health status at 200 mM NaCl concentration were much better than at 300 mM NaCl concentration. It should be noted that the root system of Carex morrowii plays an essential role in the self-protection strategy against salinity stress, although leaves are adversely affected at high salinity levels such as 200 and 300 mM NaCl concentrations. Moreover, the carotenoid content of Carex morrowii appears to be instrumental in its survival at high salinity concentrations. Based on our data, Carex morrowii is moderately tolerant to salinity and the roots of Carex morrowii have an incredible role in this salt tolerance. Therefore, the roles of cellular and molecular components of Carex morrowii and other Carex species in salinity tolerance deserve further investigation.
Funding Statement: The author received no specific funding for this study.
Ethics Approval: This article did not involve any experiment with human or animal subjects.
Conflicts of Interest: The author declares that they have no conflicts of interest to report regarding the present study.
References
1. Ondra, N. (2002). Grasses. In: Versatile partners for uncommon garden design, pp. 144. China: C&C Offset Printing. [Google Scholar]
2. Liu, L., Fan, X., Tan, P., Wu, J., Zhang, H. et al. (2021). The development of SSR markers based on RNA-sequencing and its validation between and within Carex L. species. BMC Plant Biology, 21, 17. [Google Scholar] [PubMed]
3. Wang, Y., Yang, H., Li, X., Wang, W., Bai, C. et al. (2015). Carex jianfengensis (Carex sect. Rhomboidales, Cyperaceaea new species from Hainan, China. PLoS One, 10(9), e0136373. [Google Scholar] [PubMed]
4. Ye, Y. R., Wang, W. L., Zheng, C. S., Fu, J., Liu, H. W. (2017). Evaluation of cold resistance of four wild Carex species. Chinese Journal of Applied Ecology, 28(1), 89–95. [Google Scholar] [PubMed]
5. Wallace, M. Y., Salman, A. (2020). Aegean climate compatible ornamental grass species and visual properties for landscape design. Bursa Uludag University Agriculture Faculty Journal, 34, 291–302. [Google Scholar]
6. Mishra, S., Tripathi, A., Tripathi, D. K., Chauhan, D. K. (2015). Role of sedges (Cyperaceae) in wetlands, environmental cleaning and as food material: Possibilities and future perspectives. Journal of Experimental Botany, 62, 42–53. [Google Scholar]
7. Group, T. G. C., Jiménez-Mejías, P., Hahn, M., Lueders, K., Starr, J. R. et al. (2016). Megaphylogenetic specimen-level approaches to the Carex (Cyperaceae) phylogeny using ITS, ETS, and matK sequences: Implications for classification. Systematical Botany, 41(3), 500–518. [Google Scholar]
8. Martín-Bravo, S., Jiménez-Mejías, P., Villaverde, T., Escudero, M., Hahn, M. et al. (2019). A tale of worldwide success: Behind the scenes of Carex (Cyperaceae) biogeography and diversification. Journal of Systematics and Evolution, 57(6), 695–718. [Google Scholar]
9. Xing, H., Hershkowitz, J., Paudel, A., Sun, Y., Chen, J. J. et al. (2021). Morphological and physiological responses of ornamental grasses to saline water irrigation. HortScience, 56(6), 678–686. [Google Scholar]
10. McSorley, K., Rutter, A., Cumming, R., Zeeb, B. A. (2016). Chloride accumulation vs chloride excretion: Phytoextraction potential of three halophytic grass species growing in a salinized landfill. Science of the Total Environment, 572(1–2), 1132–1137. [Google Scholar] [PubMed]
11. Yensen, N. (2006). Halophyte uses for the twenty-first century. In: Khan, M. A., Weber, D. (Eds.Ecophysiology of high salinity tolerant plants (40 ed.), pp. 367–396. Netherlands: Springer. [Google Scholar]
12. Lee, G. J., Carter Jr, T. E., Villagarcia, M. R., Li, Z., Zhou, X. et al. (2004). A major QTL conditioning salt tolerance in S-100 soybean and descendent cultivars. Theoretical and Applied Genetics, 109(8), 1610–1619. [Google Scholar] [PubMed]
13. Munns, R., Tester, M. (2008). Mechanisms of salinity tolerance. Annual Review of Plant Biology, 59(1), 651–681. [Google Scholar] [PubMed]
14. Chen, Q., Zhang, X., Zhang, H., Christie, P., Li, X. (2004). Evaluation of current fertilizer practice and soil fertility in vegetable production in the Beijing region. Nutrient Cycling in Agroecosystems, 69(1), 51–58. [Google Scholar]
15. Khurram, S., Miyamoto, S. (2005). Seedling growth, leaf injury and ion uptake response of cold-resistant palm species to salinity. Journal of Environmental Horticulture, 23(4), 193–198. [Google Scholar]
16. Wu, L., Guo, X., Harivandi, A. (2001). Salt tolerance and salt accumulation of landscape plants irrigated by sprinkler and drip irrigation systems. Journal of Plant Nutrition, 24(9), 1473–1490. [Google Scholar]
17. Tande, G. F., Lipkin, R. (2003). Wetland sedges of Alaska. Anchorage: Alaska Natural Heritage Program, Environment and Natural Resources Institute, University of Alaska. [Google Scholar]
18. Schück, M., Greger, M. (2022). Chloride removal capacity and salinity tolerance in wetland plants. Journal of Environmental Management, 308, 114553. [Google Scholar]
19. Koyro, H. W. (2006). Effect of salinity on growth, photosynthesis, water relations and solute composition of the potential cash crop halophyte Plantago coronopus (L.). Environmental and Experimental Botany, 56, 136–146. [Google Scholar]
20. Stepien, P., Johnson, G. N. (2009). Contrasting responses of photosynthesis to salt stress in the glycophyte Arabidopsis and the halophyte Thellungiella: Role of the plastid terminal oxidase as an alternative electron sink. Plant Physiology, 149, 1154–1165. [Google Scholar] [PubMed]
21. Tang, X., Mu, X., Shao, H., Wang, H., Brestic, M. (2015). Global plant-responding mechanisms to salt stress: Physiological and molecular levels and implications in biotechnology. Critical Reviews in Biotechnology, 35(4), 425–437. [Google Scholar] [PubMed]
22. Hoagland, D. R., Arnon, D. I. (1950). The water-culture for growing plants without soil. California Agricultural Experiment Station Circular, 347, 32. [Google Scholar]
23. Pavlović, I., Mlinarić, S., Tarkowská, D., Oklestkova, J., Novák, O. et al. (2019). Early Brassica crops responses to salinity stress: A comparative analysis between Chinese Cabbage, White Cabbage, and Kale. Frontiers in Plant Science, 10, 450. [Google Scholar] [PubMed]
24. Mellem, J. J., Baijnath, H., Odhav, B. (2009). Translocation and accumulation of Cr, Hg, As, Pb, Cu, and Ni by Amaranthus dubius (Amaranthaceae) from contaminated sites. Journal of Environmental Science and Health, Part A, 44(6), 568–575. [Google Scholar]
25. Arnon, D. I. (1949). Copper enzymes in isolated chloroplasts, polyphenoxidase in Beta vulgaris. Plant Physiology, 24, 1–15. [Google Scholar] [PubMed]
26. Hageman, R. H., Hucklesby, D. P. (1971). Nitrate reductase. Methods Enzymology, 23, 497–503. [Google Scholar]
27. Jaworski, E. K. (1971). Nitrate reductase assay in intact plant tissues. Biochemical and Biophysical Research Communications, 43, 1274–1279. [Google Scholar] [PubMed]
28. Gebauer, G., Melzer, A., Rehder, H. (1984). Nitrate content and nitrate reductase activity in Rumex obtusifolius L. I. Differences in organs and diurnal changes. Oecologia, 63, 136–142. [Google Scholar] [PubMed]
29. Arora, R., Wisniewski, M. E. (1994). Cold acclimation in genetically related (sibling) deciduous and evergreen peach (Prunus persica [L.] Batsch) II: A 60-kilodalton bark protein in cold-acclimated tissues of peach is heat stable and related to the dehydrin family of proteins. Plant Physiology, 105, 95–101. [Google Scholar] [PubMed]
30. Bradford, M. M. (1976). A rapid and sensitive method for the quantitation of microgram quantities of protein utilizing the principle of protein-dye binding. Analytical Biochemistry, 72, 248–254. [Google Scholar] [PubMed]
31. Kyro, H. W. (2006). Effect of salinity on growth, photosynthesis, water relations and solute composition of the potential cash crop halophyte Plantago coronopus (L.). Environmental and Experimental Botany, 56, 136–146. [Google Scholar]
32. Acosta-Motos, J. R., Hernandez, J. A., Alvarez, S., Barba-Espin, G., Sanchez-Blanco, M. J. (2017). The long-term resistance mechanisms, critical irrigation threshold, and relief capacity shown by Eugenia myrtifolia plants in response to saline reclaimed water. Plant Physiology Biochemistry, 111, 244–256. [Google Scholar] [PubMed]
33. Tester, M., Davenport, R. (2003). Na+ tolerance and Na+ transport in higher plants. Annual of Botany, 91, 503–527. [Google Scholar] [PubMed]
34. Peng, Z., He, S., Sun, J., Pan, Z., Gong, W. et al. (2016). Na+ compartmentalization is related to salinity stress tolerance in upland cotton (Gossypium hirsutum) seedlings. Scientific Reports, 6, 34548. [Google Scholar] [PubMed]
35. Munns, R., James, R. A., Gilliham, M., Flowers, T. J., Colmer, T. D. (2016). Tissue tolerance, an essential but elusive trait for salt-tolerant crops. Functional Plant Biology, 43, 1103–1113. [Google Scholar] [PubMed]
36. Katschnig, D., Bliek, T., Rozema, J., Schat, H. (2015). Constitutive high-level SOS1 expression and absence of HKT1;1 expression in the salt accumulating halophyte Salicornia dolichostachya. Plant Science, 234, 144–154. [Google Scholar] [PubMed]
37. Assaha, D. V. M., Ueda, A., Saneoka, H., Al-Yahyai, R., Yaish, M. W. (2017). The role of Na+ and K+ transporters in salt stress adaptation in glycophytes. Frontiers in Physiology, 18, 509. [Google Scholar]
38. Blumwald, E., Aharon, G. S., Apse, M. P. (2000). Sodium transport in plant cells. Biochimica et Biophysica Acta-Biomembranes, 1465, 140–151. [Google Scholar]
39. Liu, S., Remley, M., Nichols, R. L., Fritschi, F. B. (2019). Morphological traits underlying differences in early vigor among four cotton genotypes. Crop Science, 59(3), 1165–1181. [Google Scholar]
40. Lee, Y. P., Kim, S. H., Bang, J. W., Lee, H. S., Kwak, S. S. et al. (2007). Enhanced tolerance to oxidative stress in transgenic tobacco plants expressing three antioxidant enzymes in chloroplasts. Plant Cell Reports, 26, 591–598. [Google Scholar] [PubMed]
41. Marschner, H. (1995). Mineral nutrition of higher plants, 2nd edition. London, UK: Academic Press. [Google Scholar]
42. White, P. J., Broadley, M. R. (2003). Calcium in plants. Annual of Botany, 92, 487–511. [Google Scholar] [PubMed]
43. Chen, S., Li, J., Wang, S., Hüttermann, A., Altman, A. (2001). Salt, nutrient uptake and transport, and ABA of Populus euphratica; a hybrid in response to increasing soil NaCl. Trees, 15, 186–194. [Google Scholar]
44. Ahmad, P., Prasad, M. N. V. (2012). Abiotic stress responses in plants: Metabolism, productivity and sustainability. New York, NY, USA: Springer. [Google Scholar]
45. Naeini, M. R., Khoshgoftarmanesh, A. H., Fallahi, E. (2006). Partitioning of chlorine, sodium, and potassium and shoot growth of three pomegranate cultivars under different levels of salinity. Journal of Plant Nutrition, 29(10), 1835–1843. [Google Scholar]
46. Karimi, H. R., Hasanpour, Z. (2014). Effects of salinity and water stress on growth and macronutrient concentration of pomegranate (Punica granattum L.). Journal of Plant Nutrition, 37, 1–15. [Google Scholar]
47. Rabhi, M., Castagna, A., Remorini, D., Scattino, C., Smaoui, A. et al. (2012). Photosynthetic responses to salinity in two obligate halophytes: Sesuvium portulacastrum and Tecticornia indica. South African Journal of Botany, 79, 39–47. [Google Scholar]
48. Hameed, A., Ahmed, M. Z., Hussain, T., Aziz, I., Ahmad, N. et al. (2021). Effects of salinity stress on chloroplast structure and function. Cells, 10(8), 2023. [Google Scholar] [PubMed]
49. Horie, T., Karahara, I., Katsuhara, M. (2012). Salinity tolerance mechanisms in glycophytes and overview central focus on rice plants. Rice, 5(1), 11–18. [Google Scholar] [PubMed]
50. Rastogi, A., Kovar, M., He, X., Zivcak, M., Kataria, S. et al. (2020). JIP-test as a tool to identify salinity tolerance in sweet sorghum genotypes. Photosynthetica, 58, 518–528. [Google Scholar]
51. Parida, A. K., Das, A. B. (2005). Salt tolerance and salinity effects on plants: A review. Ecotoxicology and Environmental Safety, 60(3), 324–349. https://doi.org/10.1016/j.ecoenv.2004.06.010 [Google Scholar] [PubMed] [CrossRef]
52. Parida, A. K., Das, A. B., Mittra, B. (2004). Effects of salt on growth, ion accumulation photosynthesis and leaf anatomy of the mangrove, Bruguiera parviflora. Trees: Structure and Function, 18(2), 167–174. https://doi.org/10.1007/s00468-003-0293-8 [Google Scholar] [CrossRef]
53. Bačkor, M., Fahselt, D., Davidson, R., Wu, T. (2003). Effects of copper on wild and tolerant strains of the lichen photobiont Trebouxia erici (Chlorophyta) and possible tolerance mechanisms. Archives of Environmental Contamination and Toxicology, 45, 159–167. [Google Scholar] [PubMed]
54. Ramani, B., Reeck, T., Debez, A., Stelzer, R., Huchzermeyer, B. et al. (2006). Aster tripolium L. and Sesuvium portulacastrum L.: Two halophytes, two strategies to survive in saline habitats. Plant Physiology and Biochemistry, 44, 395–408. [Google Scholar] [PubMed]
55. Flowers, T. J., Colmer, T. D. (2008). Salinity tolerance in halophytes. New Phytologist, 179, 945–963. [Google Scholar] [PubMed]
56. Linić, I., Šamec, D., Grúz, J., Vujčić Bok, V., Strnad, M. et al. (2019). Involvement of phenolic acids in short-term adaptation to salinity stress is species-specific among brassicaceae. Plants, 8, 155. [Google Scholar] [PubMed]
57. Šamec, D., Linić, I., Salopek-Sondi, B. (2021). Salinity stress as an elicitor for phytochemicals and minerals accumulation in selected leafy vegetables of brassicaceae. Agronomy, 11, 361. [Google Scholar]
58. Zhao, G. M., Han, Y., Sun, X., Li, S. H., Wang, Q. M. (2015). Salinity stress increases secondary metabolites and enzyme activity in safflower. Industrial Crops and Products, 64, 175–181. [Google Scholar]
59. Elloumi, W., Jebali, A., Maalej, A., Chamkha, M., Sayadi, S. (2020). Effect of mild salinity stress on the growth, fatty acid, and carotenoid compositions, and biological activities of the thermal freshwater microalgae Scenedesmus sp. Biomolecules, 10(11), 1–17. [Google Scholar]
60. Zhu, J. K. (2003). Regulation of ion homeostasis under salt stress. Current Opinion in Plant Biology, 6(5), 441–445. https://doi.org/10.1016/S1369-5266(03)00085-2 [Google Scholar] [PubMed] [CrossRef]
61. Gupta, B., Huang, B. (2014). Mechanism of salinity tolerance in plants: Physiological, biochemical, and molecular characterization. International Journal of Genomics, 2014(1), 701596. [Google Scholar] [PubMed]
62. Abdelgadir, E. M., Oka, M., Fujiyama, H. (2005). Characteristics of nitrate uptake by plants under salinity. Journal of Plant Nutrition, 28(1), 33–46. [Google Scholar]
63. Akpinar, A., Arslan, H., Guleryuz, G., Kirmizi, S., Erdemir, U. S. et al. (2015). Ni-induced changes in nitrate assimilation and antioxidant metabolism of Verbascum olympicum Boiss.: Could the plant be useful for phytoremediation or/and restoration purposes? International Journal of Phytoremediation, 17, 546–555. [Google Scholar] [PubMed]
64. Abd El-Baki, G. K., Siefrt, Z. F., Man, H. M., Weiner, H., Kaldenhoff, R. et al. (2000). Nitrate reductase in Zea mays L. under salinity. Plant, Cell and Environment, 23, 515–521. [Google Scholar]
65. Reda, M., Migocka, M., Kłobus, G. (2011). Effect of short-term salinity on the nitrate reductase activity in cucumber roots. Plant Science, 180, 783–788. [Google Scholar] [PubMed]
66. Liu, S. T., Ranathunge, K., Lambers, H., Finnegan, P. M. (2022). Nitrate-uptake restraint in Banksia spp. (Proteaceae) and Melaleuca spp. (Myrtaceae) from a severely phosphorus-impoverished environment. Plant and Soil, 476(1–2), 63–77. [Google Scholar]
Cite This Article
 Copyright © 2023 The Author(s). Published by Tech Science Press.
This work is licensed under a Creative Commons Attribution 4.0 International License , which permits unrestricted use, distribution, and reproduction in any medium, provided the original work is properly cited.
 Downloads
 Citation Tools