
 Submit a Paper
 Propose a Special lssue
 Open Access
ARTICLE

Drought-Ready Soybean Resilience: Molecular Marker-Based Screening and Selection of Superior Genotypes
1 Department of Plant Breeding and Genetics, PMAS Arid Agriculture University, Rawalpindi, 46000, Pakistan
2 National Institute for Genomics and Advanced Biotechnology (NIGAB), National Agricultural Research Center, PARC, Islamabad, 45500, Pakistan
3 Department of Horticulture, PMAS Arid Agriculture University, Rawalpindi, 46000, Pakistan
4 Institute of Food and Nutritional Sciences, PMAS Arid Agriculture University, Rawalpindi, 46000, Pakistan
5 Pakistan Agriculture Research Council (PARC), Islamabad, 45500, Pakistan
* Corresponding Author: Kamran Shehzad Bajwa. Email:
(This article belongs to the Special Issue: Advances in Enhancing Grain Yield: From Molecular Mechanisms to Sustainable Agriculture)
Phyton-International Journal of Experimental Botany 2025, 94(4), 1299-1318. https://doi.org/10.32604/phyton.2025.062323
Received 16 December 2024; Accepted 28 March 2025; Issue published 30 April 2025
 View Full Text
 Download PDF
Abstract
The agricultural sector is notably affected by climate change, especially soybeans, which may face diminished yields because of severe water shortages. The evaluation of germplasm at morphological and molecular levels is an important pre-breeding step for crop improvement. This study employed 10 simple sequence repeat (SSR) markers to examine 60 soybean genotypes in the quest for drought-resistant lines during 2022–23. The results of the screening experiment (PEG-6000) revealed that the soybean genotypes SPS13, SPS195, PGRB83, and 39982 exhibited significant correlations in growth parameters. The results of molecular characterization indicated that five out of ten molecular markers, specifically Satt373, Satt454, Satt471, Satt478, and Satt581, exhibited distinct banding patterns along with elevated levels of genetic diversity and heterozygosity. The phylogenetic analysis findings indicated that soybean genotypes were categorized into many clusters, with at least six genotypes located in cluster 5 and the most seventeen genotypes in cluster 7. The results obtained from principal component analysis indicated that PC1 explained up to 44.7% of the variance, while PC2 accounted for 17.3%. The results of the heatmap indicated that PGBR83 exhibited the highest expression in plant height, GP39982 and SPS109 in chlorophyll content, GP39982 in proline accumulation, and SPS2, GP40025, SPS69, and GP40174 in protein content, number of pods per plant, and yield per plant, whereas GP40116 and PGRA83 demonstrated consistently low expression. The results of biochemical analysis indicated that the soybean genotypes SPS13, PGRA83, SPS176, 40158, SPS162, SPS195, SPS175, SPS109, and SPS80 were identified as superior sources of protein and oil content, along with genotypes such as PGRB55, SPS177, 40116, and 40111, which exhibited a significant increase under drought stress conditions. The findings of this research provide complete information derived from molecular approaches on soybean genotypes, which might assist breeders in selecting parental lines to generate drought-tolerant soybean cultivars in the future.Keywords
Glycine max, often known as soybean, is an essential crop in worldwide agriculture, accounting for more than 60% of the production of edible oil. Soy, with its outstanding protein content of 40% and oil content of 20%, is much valued in several sectors such as animal feed, biofuel, and food [1,2]. Nevertheless, climate change causes a substantial risk to soybean production, jeopardizing worldwide food security. The adverse effects of drought stress on agricultural development are significant, as they disrupt several physiological and biochemical processes across all growth phases, such as seed germination, seedling growth, and blooming [3,4].
By 2050, the ongoing consequences of climate change will adversely affect temperature rises and modify precipitation patterns, which will not fulfill the future food requirements of a global population expected to surpass 9.7 billion [5]. These unpredicted weather conditions produce a negative impact on agricultural productivity that arises from the alteration of microclimates, disruption of plant-microbe interactions, and the introduction of biotic and abiotic stresses. In the future, disrupted climate changes, either due to nature or human involvement, can lead to more severe, frequent, and longer-lasting droughts [6–8].
This frightening state negatively affects drought-susceptible crops, such as soybeans, particularly during the earliest stages of germination, seedling development, and flowering. In arid or drought circumstances, soybean output may decrease by more than 50%, underscoring the necessity to improve soybean drought resistance for food security [9,10]. Adjustment, avoidance, and evasion are the strategies typically employed to mitigate drought. Since seed germination signifies the commencement of plant growth and development, it is essential to identify drought-tolerant genotypes at this stage for efficient plant breeding. Water scarcity adversely affects the growth and development of soybeans, leading to an approximate global productivity decline of 40%. To mitigate drought’s detrimental impact on soybean yields, it may be economically advantageous to employ both traditional and innovative modern breeding methods [11–13].
Traditional breeding for drought tolerance in soybean has progressed, although significant challenges remain, leading to a substantial research need. One big problem is that drought tolerance is complicated and polygenic, which makes traditional breeding hard to do and not very useful. Field-based phenotypic selection is used in traditional methods, but it takes a long time, is affected by changes in the environment, and isn’t very good at finding genotypes that can handle drought [14,15]. The genetic diversity of drought-resistant soybean germplasm remains underutilized due to limitations in morphological and physiological assessment. Molecular characterization using SSR (Simple Sequence Repeat) is crucial for enhancing breeding efficiency to tackle these challenges [16–18]. Because they are very polymorphic, repeatable, and co-dominant, SSR markers are a fantastic way to find genetic differences that affect how well plants can handle drought [19]. Still, not a lot of research has been done using SSR markers to find quantitative trait loci (QTLs) linked to drought resistance in different soybean populations. Using SSR-based marker-assisted selection (MAS) in breeding programs is still very new, which makes it harder to choose cultivars that can handle drought [20–22].
To fix these problems, we need to do more research with SSR markers to find important loci that are affected by drought, make sure they work in different environments, and include them in MAS methods. Physiological and genomic methods, along with SSR marker analysis, can help with breeding more accurately, which can lead to the development of soybean genotypes that can handle drought better. Lastly, we need to test more SSR markers in various environments to identify key genes affected by drought. Once they do, we can use them with MAS methods to fix these issues. Physiological and genomic methods, along with SSR marker analysis, can help breed more correctly. This makes it easier to make types of soybeans that can handle drought better [23–25]. Through in vitro and in vivo drought rehydration treatments, this study looks at how well 60 different genotypes of soybeans can handle drought when they are seedlings. This study utilized plant survival rates to pinpoint stable plant materials in drought conditions, aiding in the selection of superior soybean varieties for improved yields and the identification of new genetic resources for breeding drought-resistant soybeans. The findings of our study are anticipated to contribute to the development of innovative varieties that can more effectively withstand the impacts of climate change.
In this study, 60 genotypes of Glycine max (L.) were looked at. These genotypes had different responses to drought, such as being more or less susceptible to it. We gathered 60 soybean genotypes sourced from the gene bank housed at the Plant Genetic Resource Institute (https://www.parc.gov.pk/plantdivision/pgri, accessed on 11 April 2025). This institute operates within the framework of the Oilseed Research Program under the auspices of the National Agricultural Research Centre (ORP/NARC) in Islamabad. A comprehensive list of the collected genotypes can be found in Table S1.
2.2 PEG Screening and Preliminary Evaluation
We subjected soybean genotypes to polyethylene glycol (PEG-6000), a macromolecule known for in vitro osmotic stress, prior to the field experiment. Seeds were surface sterilized using sodium hypochlorite with a dilution factor. At the end, several washings with distilled water were performed. We exposed seeds to different PEG concentration levels (0%, 10%, 15% & 20% of PEG-6000) in plastic trays. The experiment was laid down in Complete Randomized Design (CRD) with four treatments, and data were collected after 20 days of sowing. The experiment consisted of four treatments, namely Control, T1, T2, and T3. Each treatment consisted of varying concentrations of PEG-6000, ranging from 0% to 20%. The data collection process encompassed various factors and was conducted 20 days after sowing (DAS). Both root and shoot lengths were measured from the plant’s apex to its base and from the crown to the root’s distal end. For each of the four treatments, measurements were based on three plants at random from each replication. When the plants were both wet and dry, the study looked at the masses of their above- and below-ground parts in each experimental condition. We determined the fresh shoot weights using an analytical scale and measured the dry shoot weights after drying in an oven at 70°C. Root development assessment included quantification of fresh weights and obtaining dry weights through oven drying. Root weight was measured in grams. We calculated the Root-to-Shoot Ratio (RSR) using the described methodology, which involved dividing the dry root weight by the dry shoot weight [26,27].
2.3 Polymorphism via SSR Markers
We conducted the marker trait association analysis using marker-assisted selection and molecular markers. We used marker-assisted selection to link the molecular marker to the target gene. In the marker trait association study, we found markers that were linked to other markers. These markers had different morphological, biochemical, and physiological traits. We conducted the marker trait association study using SNPs for various traits. These markers were involved in drought tolerance among soybean genotypes. We performed the t-test to analyze the trait association with these five markers and identify the marker’s effect on various parameters. We calculated the polymorphism information content (PIC) and heterozygosity information about these markers. We extracted genomic DNA using a modified version of a well-established method. We collected young leaves and ground them into a fine powder [28,29]. To prepare the plant sample for incubation and precipitation, it was finely ground and mixed with CTAB buffer. Following its separation, the DNA pellet was washed in 70% ethanol. We used a Nano-Drop (ND-1000) spectrophotometer to determine the concentration and purity of the DNA. To prepare for PCR/SSR analysis, the DNA samples were diluted until they reached a working concentration of 20 ng/µL. In the simultaneous enquiries, we selected a set of ten SSR markers based on trait detection from existing literature and validated them. We constructed primer sequences and motifs using a blend of data from established and modified soybean genome databases. The precise specifications of the selected primers are summarized (Table 1). To make the SSR markers stronger, we used a thermal cycler and polymerase chain reaction (PCR) in 20 µL of each sample. We first denatured the DNA at 95°C for 4 min. Then, it was denatured, primers were annealed, and the DNA was extended at 72°C for 35 cycles. The PCR products were visualized using gel electrophoresis. A polyacrylamide gel from Sigma-Merck was used, and the fragments were stained with ethidium bromide. We looked at the broken pieces under UV light with a UV Transilluminator Quantum ST4 from Vilber-Lourmat in Marne-la-Vallée, France [30,31].
The field experiment setup followed an Augmented Block Design (ABD), assigning a row length of 6 m to each genotype. The design consisted of six blocks, each containing ten genotypes and a control variety. The plots within the same block were arranged with a spacing of 45 cm, while 75 cm separated each block. The genotypes were randomized within each block, and control checks were randomly interspersed within each block [35].
The data collection process involved measuring and recording various morphological parameters. For genotypes, plant height was determined by measuring the distance from ground level to the top of a juvenile leaf on five randomly chosen plants, recorded in centimeters (cm). The average count of filled and unfilled pods per plant was determined by selecting five random plants from each genotype. We measured the time to maturity from seedling emergence until 57% of pods displayed yellow coloration. We calculated the seed yield per plant by measuring the average yield of five randomly selected plants per genotype in grams (g). The weight of 100 seeds was measured after threshing and recorded in grams (g). An SPAD 502 device was used to measure the amount of chlorophyll in the leaves before the plants flowered. We took average readings from three leaves of five selected plants per genotype and stored them in SPAD units. In the last part of the experiment, ambient and canopy temperatures were recorded for five plants of each genotype in both treatments using an infrared thermometer. For the calculation of Canopy Temperature Depression (CTD) by using the formulas specified by [36]. Whereas Ta represents air temperature and Tc indicated the temperature of canopy.
Cell membrane thermostability ((CMS)) was measured by utilizing method devised by utilizing the following formulae; whereas T = Electrical conductivity of treated samples and C = Electrical conductivity of control samples and subscript 1 = EC reading before autoclaving and subscript 2 = EC reading after autoclaving, respectively.
In order to investigate the quality characteristics, we carried out biochemical investigations. More specifically, we looked at the amounts of edible oil (OC) and protein content (PC). In order to complete the task at hand, it was necessary to conduct an examination of the seeds that had been threshed from each test entry, in addition to the duplicated checks. The total nitrogen content was determined by employing the Kjeldahl technique, with the dry seed weight serving as a parameter. We used the following formula to determine the total nitrogen content [37,38].
By utilizing the standard technique described in AACC (2000), we were able to determine the quality characteristics of the soybean grains, specifically their protein and oil contents.
We used a variety of statistical techniques to subject the phenotypic data collected from both the control and on-site experiments to additional analysis. These techniques included analysis of variance (ANOVA; α = 5%), correlation analysis (p < 0.05), principal component analysis (PCA) biplot, hierarchical cluster analysis, and heatmap analysis. These analyses were successfully carried out by utilizing the R-Studio statistical computer software with package 4.3.3 [39,40].
This study looked at sixty genotypes in the molecular laboratory of the Plant Breeding and Genetics Department at PMAS Arid Agriculture University Rawalpindi during the kharif season of 2022–2023. It did this by exposing the genotypes to drought stress and different amounts of PEG. The results of (Table 2) show that the analysis of variance (ANOVA) showed that there were differences between genotypes for the traits of shoot length, fresh and dry shoot weight, root length, and fresh and dry root weight. The coefficient of variation (CV) was calculated to determine the reliability of genetic variability among all the genotypes. The majority of genotypes demonstrated a notable enhancement in root length under drought stress conditions. Nonetheless, the examination of variance indicated a slight significant alteration in this parameter. The highest mean root length observed under drought stress was 4.02 cm (SPS13), whereas the lowest mean value recorded was 0.73 cm (PGRB58). The coefficient of variation (CV) stands at 39.1%, while the overall mean measures 11.9 cm. The highest mean shoot length recorded under drought stress was 9.77 cm (SPS195), while the lowest mean observed was 1.47 cm (PGRB58). The analysis yielded a coefficient of variation of 37.1% alongside an overall mean measurement of 4.8 cm. The maximum mean fresh root weight recorded was 0.77 g (PGRB83), whereas the minimum was noted at 0.031 g (PGRB70). The coefficient of variation stood at 198.6%, while the overall mean was recorded at 0.09 g. The highest mean value for fresh shoot weight under drought stress was recorded at 1.20 g (39982), whereas the lowest was 0.18 g (39995). This resulted in a coefficient variation of 62.5%, with an overall mean of 0.39 g. The highest mean value for total dry weight under drought stress was recorded at 1.20 g (39982), while the lowest was 0.18 g (39995). This resulted in a coefficient of variation of 11.9% and an overall mean of 1.85 g.
3.2 Polymorphisms of Soybean Cultivars
In the first experiment, ten SSR markers were used to try to amplify DNA from 60 different types of soybeans. Initially, only five SSR markers successfully amplified the DNA from all 60 genotypes. Despite further attempts with varied annealing temperatures, the remaining markers failed to amplify DNA across all genotypes. However, we observed that 60.67% of these SSR markers were polymorphic. The following represents the polymerase chain reaction results of five molecular markers, namely Satt373, Satt454, Satt471, Satt478, and Satt581 (Fig. 1).
Figure 1: A representative gel picture of sixty soybean genotypes with SSR marker. (A) polymorphic amplification of soybean genotypes with Satt373 marker (lanes 1–60); (B) PCR based detection with Satt454 marker (lanes 61–120); (C) polymorphism with Satt471 SSR marker (lanes 121–180); (D) PCR amplification using Satt478 marker (lanes 181–192 and lanes 1–48); (E) detection through polymerase chain reaction of soybean genotypes with Satt581 marker (lanes 49–96); Lane M: 1 kb plus DNA ladder
3.3 Field-Based Analysis of Morphological Characteristics
We used these sixty genotypes of soybean, derived from polymorphism and initial lab experiments, to analyze their morphological characteristics under natural field conditions. The results of field experiments indicated (Table 3) that plant height is a crucial trait for soybean morphology and crop yield. Under drought stress, sixty genotypes of soybeans were tested. These included accessions PGRA83, SPS176, 40158, SPS162, SPS195, SPS175, SPS109, SPS80, PGRB55, SPS177, 40116, and 40111, all of which had their heights drop significantly. The results of the field experiment reported that plant height showed a positive correlation with seed yield and pod number while a negative correlation with 100-seed weight. The study also examined the number of filled pods per plant across various genotypes, including 39982, 40123, 40169, SPS82, SPS99, 40121, 40168, 40174, 40025, SPS77, 40023, SPS69, PGRB70, SPS45, 40064, 40136, 39995, 40103, and PGRB58, and found significant results under drought stress. Notably, genotypes 40136 and PGRB70 exhibited significant increases in plant height under drought stress. Chlorophyll content is a crucial pigment in chloroplasts, essential for photosynthesis. Under drought stress, the highest mean chlorophyll content was observed in genotype SPS195. Most genotypes showed a significant decrease in chlorophyll content under these conditions. Canopy temperature, an accurate indicator of drought stress tolerance, is also vital for photosynthesis. The highest mean canopy temperature, 9.41, was recorded in genotype SPS13, while the lowest, 3.73, was observed in PGRB58. Cell membrane injury, ranging from 57.13% to 99%, is another key parameter for evaluating soybean drought tolerance. The highest cell membrane injury was noted in genotypes 40136 and PGRB70, whereas the lowest, 57.13%, was recorded in SPS109.
3.4 Measurement of Biochemical Parameters
In soybean seeds, the percentage of protein ranged anywhere from 34 to 46 percent. There were a number of genotypes that were excellent sources of protein, including SPS13, PGRA83, SPS176, 40158, SPS162, SPS195, SPS175, SPS109, and SPS80. These genotypes had approximately 30%–35% protein on a dry weight basis. In addition, the majority of genotypes showed a large increase in oil content when subjected to drought stress. More specifically, the genotypes PGRA83, SPS176, 40158, SPS162, SPS195, SPS175, SPS109, SPS80, PGRB55, SPS177, 40116, and 40111 displayed notable increases in oil content under these conditions (Fig. 2).
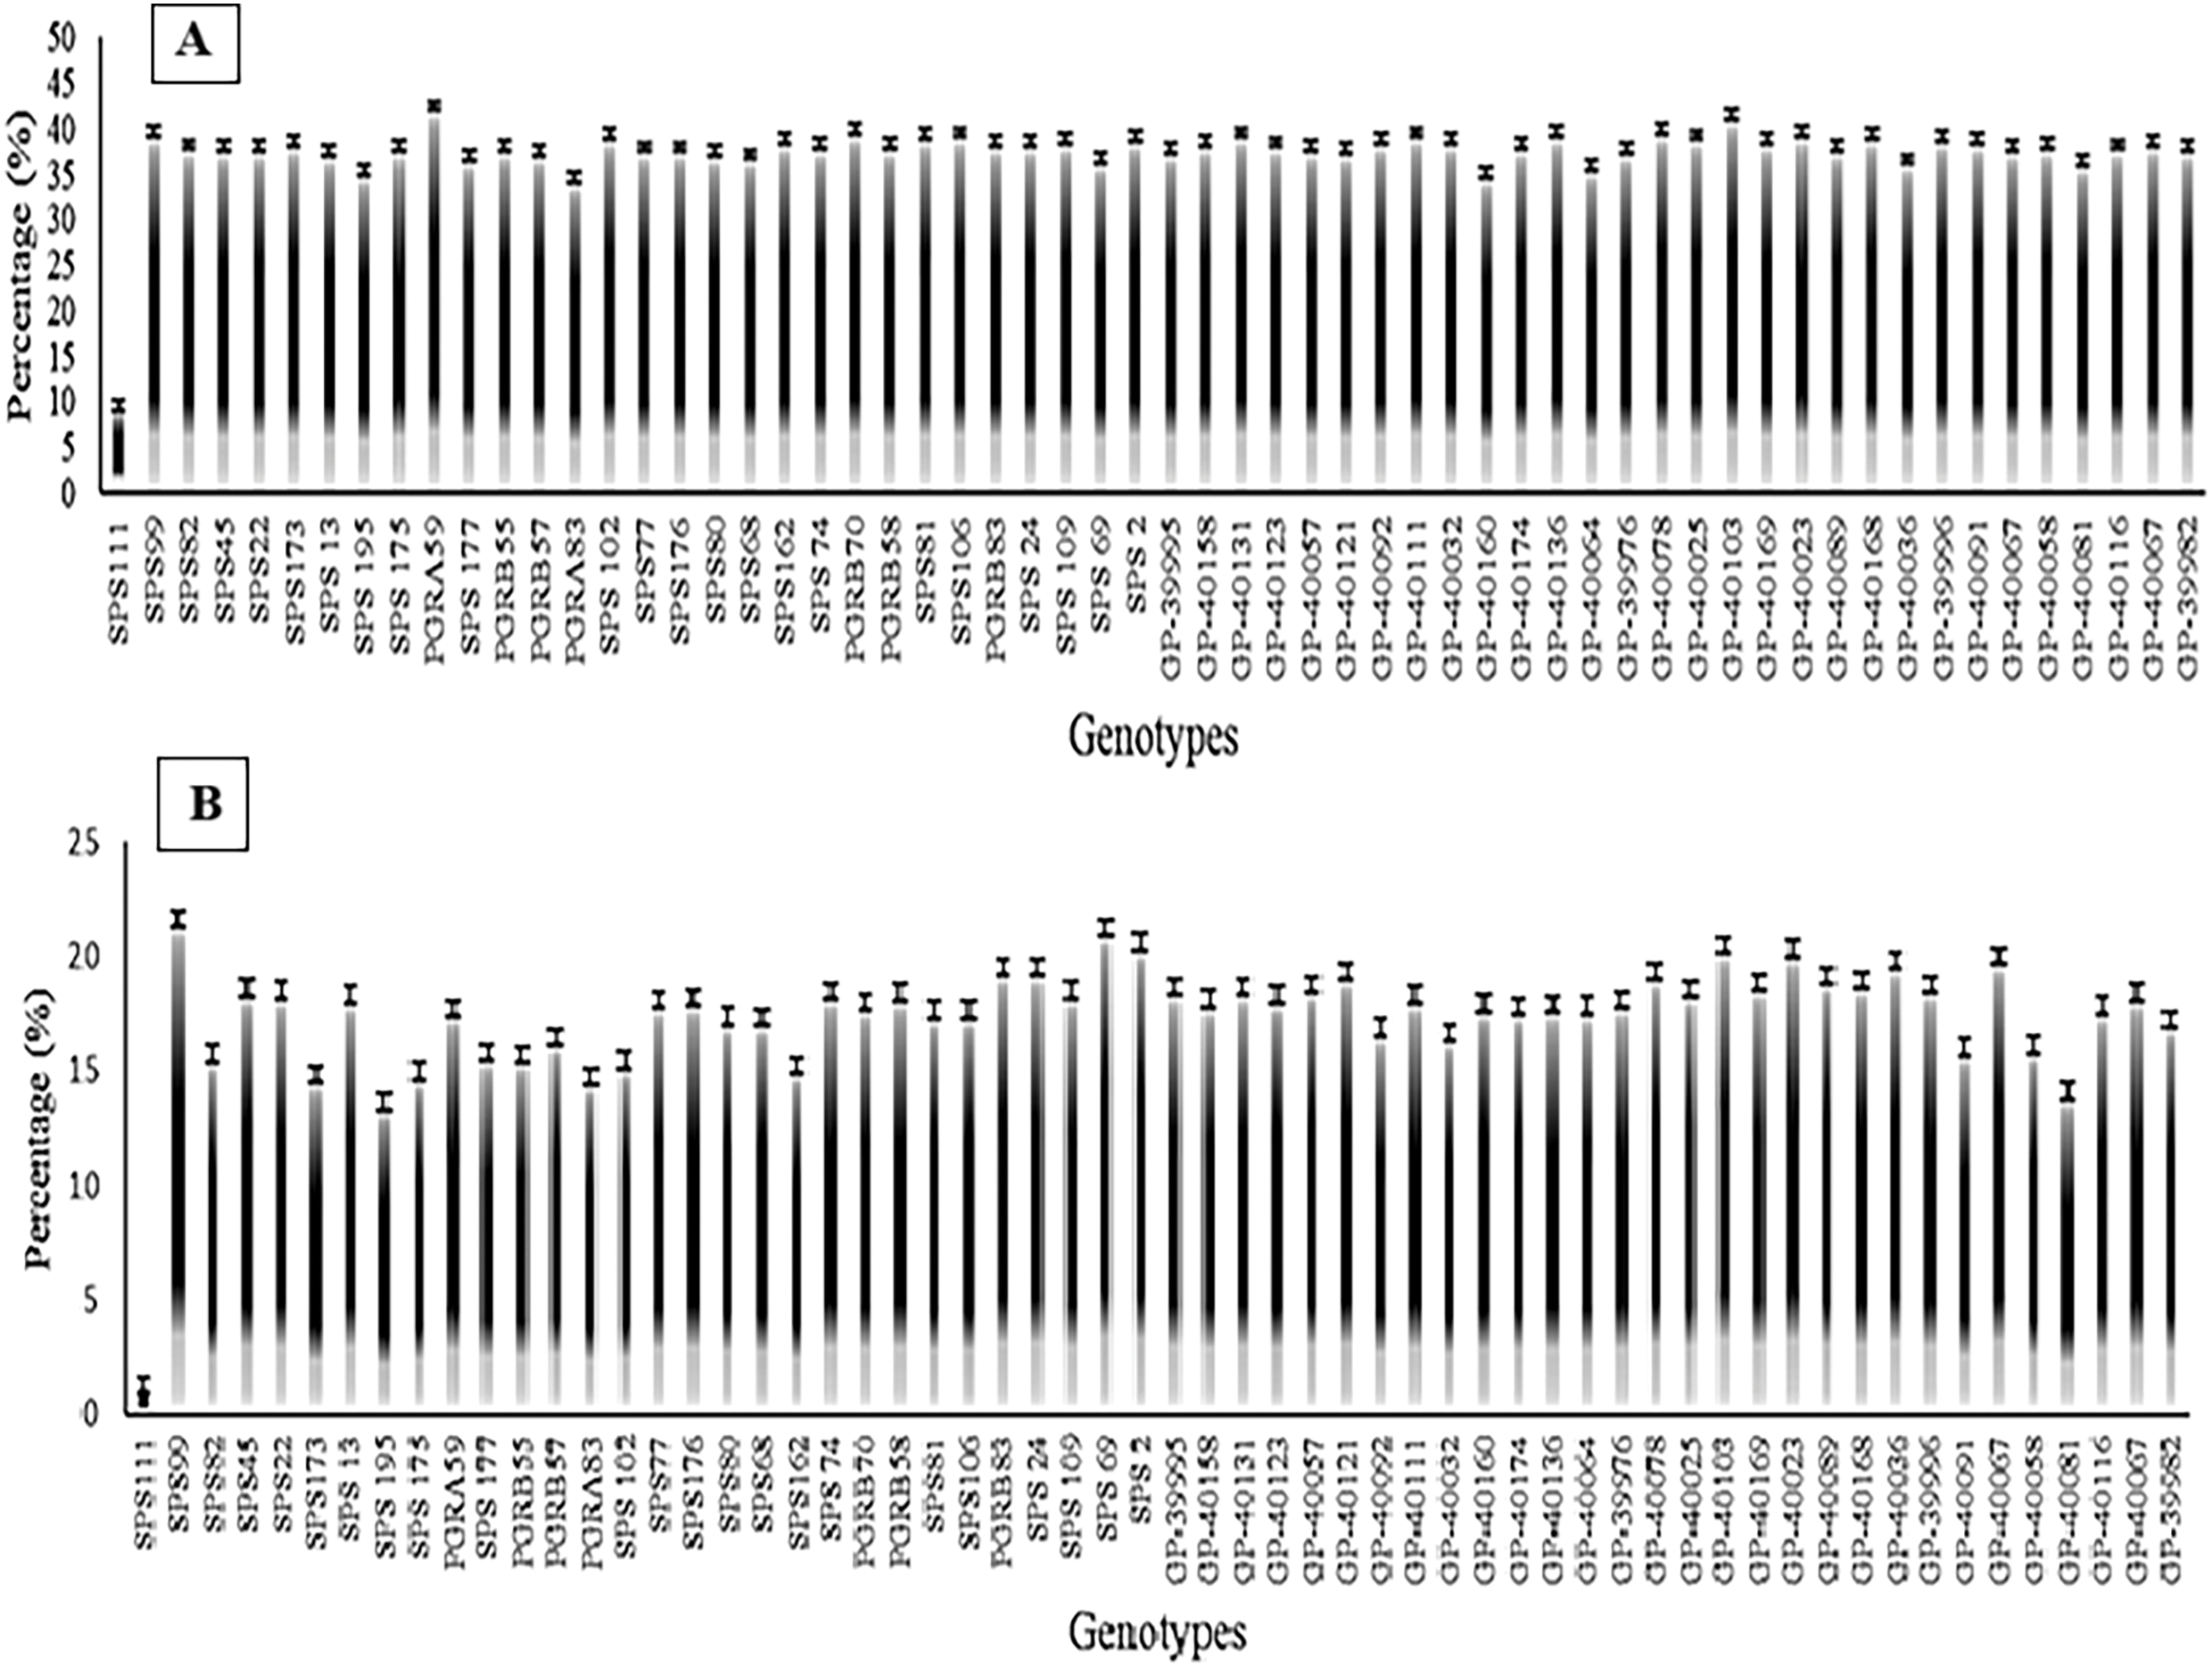
Figure 2: Graphical representation of mean protein and oil contents of 60 soybean genotypes. (A) percentage of protein contents, (B) percentage of oil contents
3.5 Correlation Coefficient Analysis
The paired correlation analysis showed significant associations among all the morphological traits in the lab experiment. The lab experiment showed a positive correlation between the morphological trait RL and all the attributes, with the exception of some treatments that had no association with RL. T4 (PEG-20%) showed an association with all the attributes, while T1 (PEG-0%) and T2 (PEG-10%) were not significantly associated with all the attributes except for SL. Additionally, SL showed positive associations with FSW in T4 treatment. FSW had positive correlations with DSW, FRW, and DRW across all treatments (Fig. 3A). DSW had positive associations with FRW and DRW in T4 treatment. On the other hand, FRW showed positive correlations across all treatments. In the field experiment, the morpho-physiological trait NPPP was significantly and positively related to YPP. The other traits were not related to either treatment. Moreover, HSW showed positive associations among CC and YPP across all treatments. CC had positive associations with PA and YPP. On the other hand, OC revealed positive correlations among PC across all treatments (Fig. 3B).
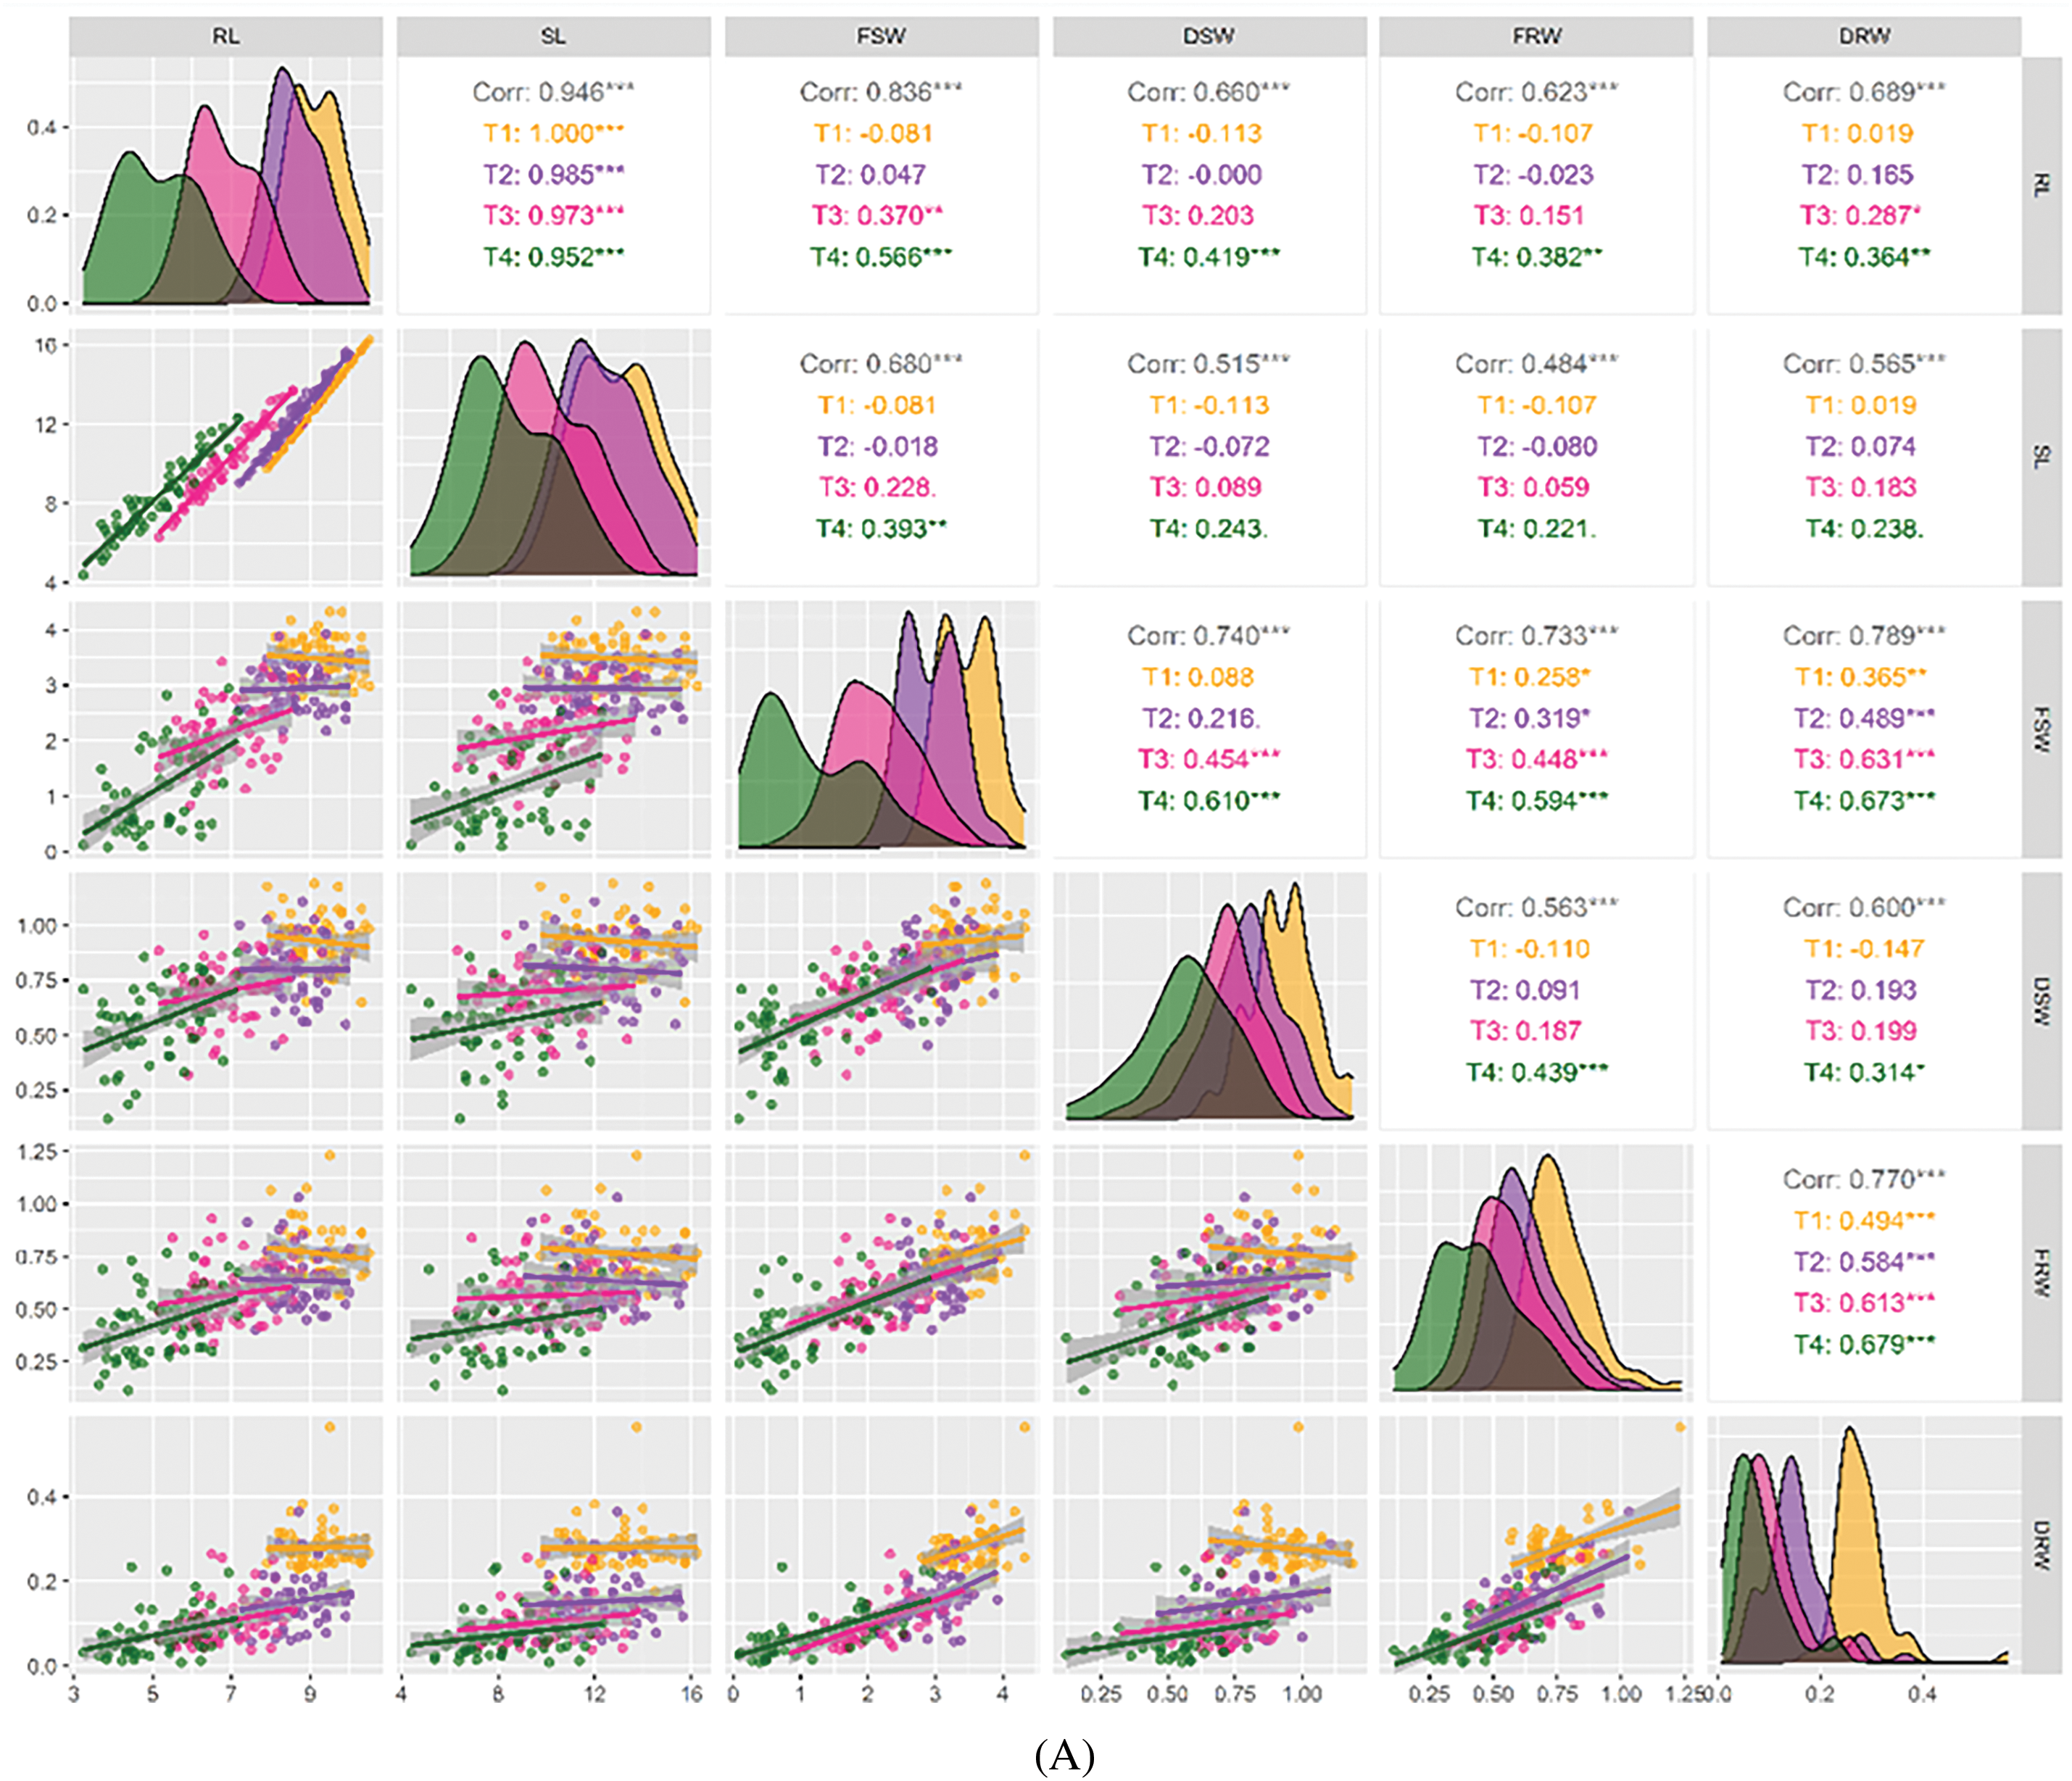
Figure 3: (A) A graphical representation of the Pearson correlation for growth parameters at seedling stage. SL: Shoot Length (cm), RL: Root Length (cm), FSW: Fresh Shoot Weight, DSW: Dry Shoot Weight, FRW: Fresh Root Weight (g), DRW: Dry Root Weight (g). *** = Significant at p ≤ 0.001; ** = Significant at p ≤ 0.01; * = Significant at p ≤ 0.05. (B) Present pairwise correlation analysis of morphological characteristics of soybean genotypes under field condition. PH: Plant Height (cm), NPPP: Number of Pods Plant-1, HSW: Hundred Seeds Weight (g), DM: Days to Maturity, CC: Chlorophyll Content, PA: Proline Accumulation, OC: Oil Content, PC: Protein Content, YPP: Yield Plant-1 (g). *** = Significant at p ≤ 0.001; ** = Significant at p ≤ 0.01; * = Significant at p ≤ 0.05
3.6 Principal Component Analysis
The PCA biplot shows that PC1 accounts for about 44.7% of the total variation in the field experiment, and PC2 accounts for about 17.3% (Fig. 4). Under control conditions, all traits except PA remain closely clustered, displaying maximal parallelism in their expression patterns. The PCA analysis also shows that trait associations are different when there is drought compared to when there is no drought. This suggests that drought and control conditions have different effects on trait pairings. And so, genotypes that show different expressions of traits are separated and put into each quadrant of the biplot based on how those traits are expressed. The principal components (PCs) accounted for 78.73% of the variability in the 60 soybean genotypes. Genotypes located near the biplot axis show minimal genetic variation, whereas those positioned further from the axis demonstrate the highest levels of genetic variability. The genotypes SPS74, SPS177, GP40067, GP40036, GP40091, GP40167, GP40158, and GP40091 exhibit the highest level of genetic diversity. SPS111, SPS82, GP40174, GP40089, PGRB57, PGRB55, PGRB83, and SPS22 demonstrated the least genetic variability.
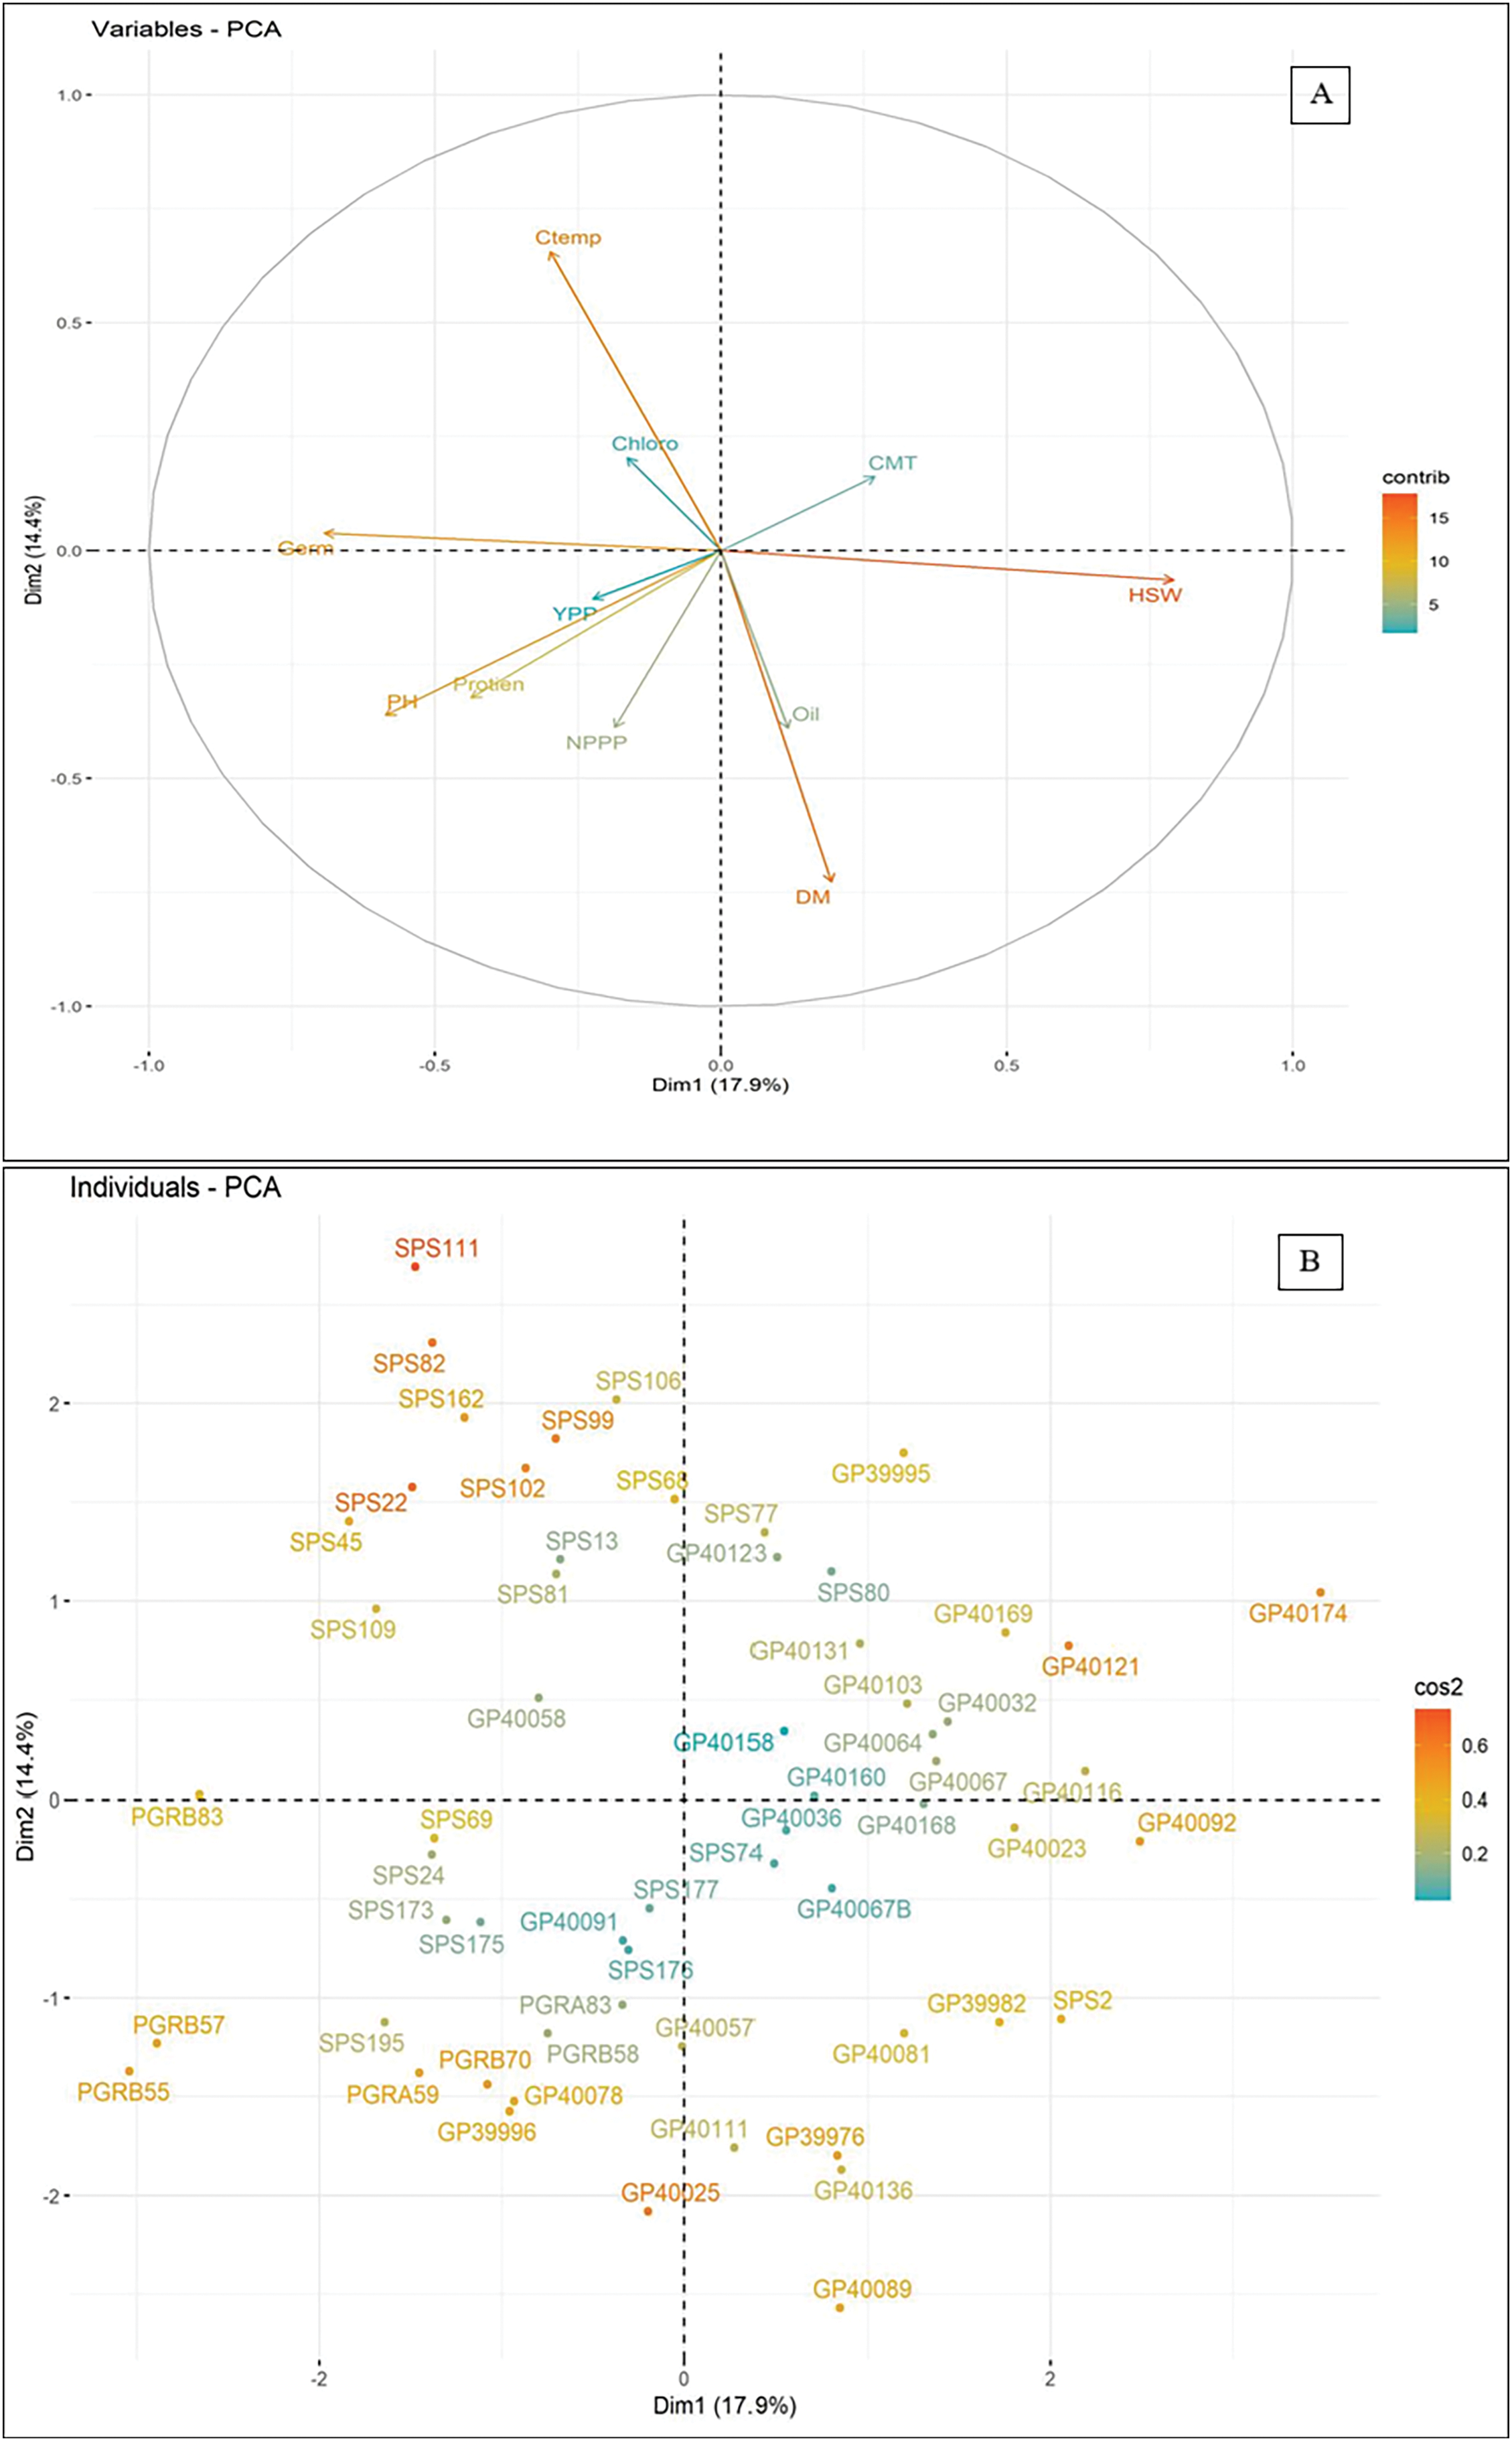
Figure 4: The biplot of 60 soybean germplasm for principal components of morpho-physiological traits; (A) PCA of soybean genotypes for morphological traits, (B) PCA of sixty soybean genotypes with each other
We determined the anticipated number of clusters prior to executing the circular hierarchical cluster analysis by assessing distance in proportion to phenotypic similarity. Based on the differences that were seen, 62 genotypes were put into seven hierarchical clusters, both in the control condition and the drought treatment condition (Fig. 5). Genotypes that were closely related were categorized into the same cluster, and the remainder were allocated to other clusters. In the cluster analysis, cluster 5 contained the highest number of soybean genotypes, totalling 16, followed by cluster 3 with 14, cluster 1 with 12, cluster 6 with 9, and cluster 4 with 5 under control conditions. In contrast, during drought stress circumstances, cluster 7 had the highest number of soybean genotypes at 17, followed by cluster 4 with 13, cluster 3 with 11, cluster 2 with 8, and cluster 5 with 6. The five genotypes that were found to be the most drought-tolerant were GP40067, GP40136, GP40032, PGRB58, and SPS45. These genotypes were genetically very different from the other genotypes, as shown by the distances between them in the dendrogram.
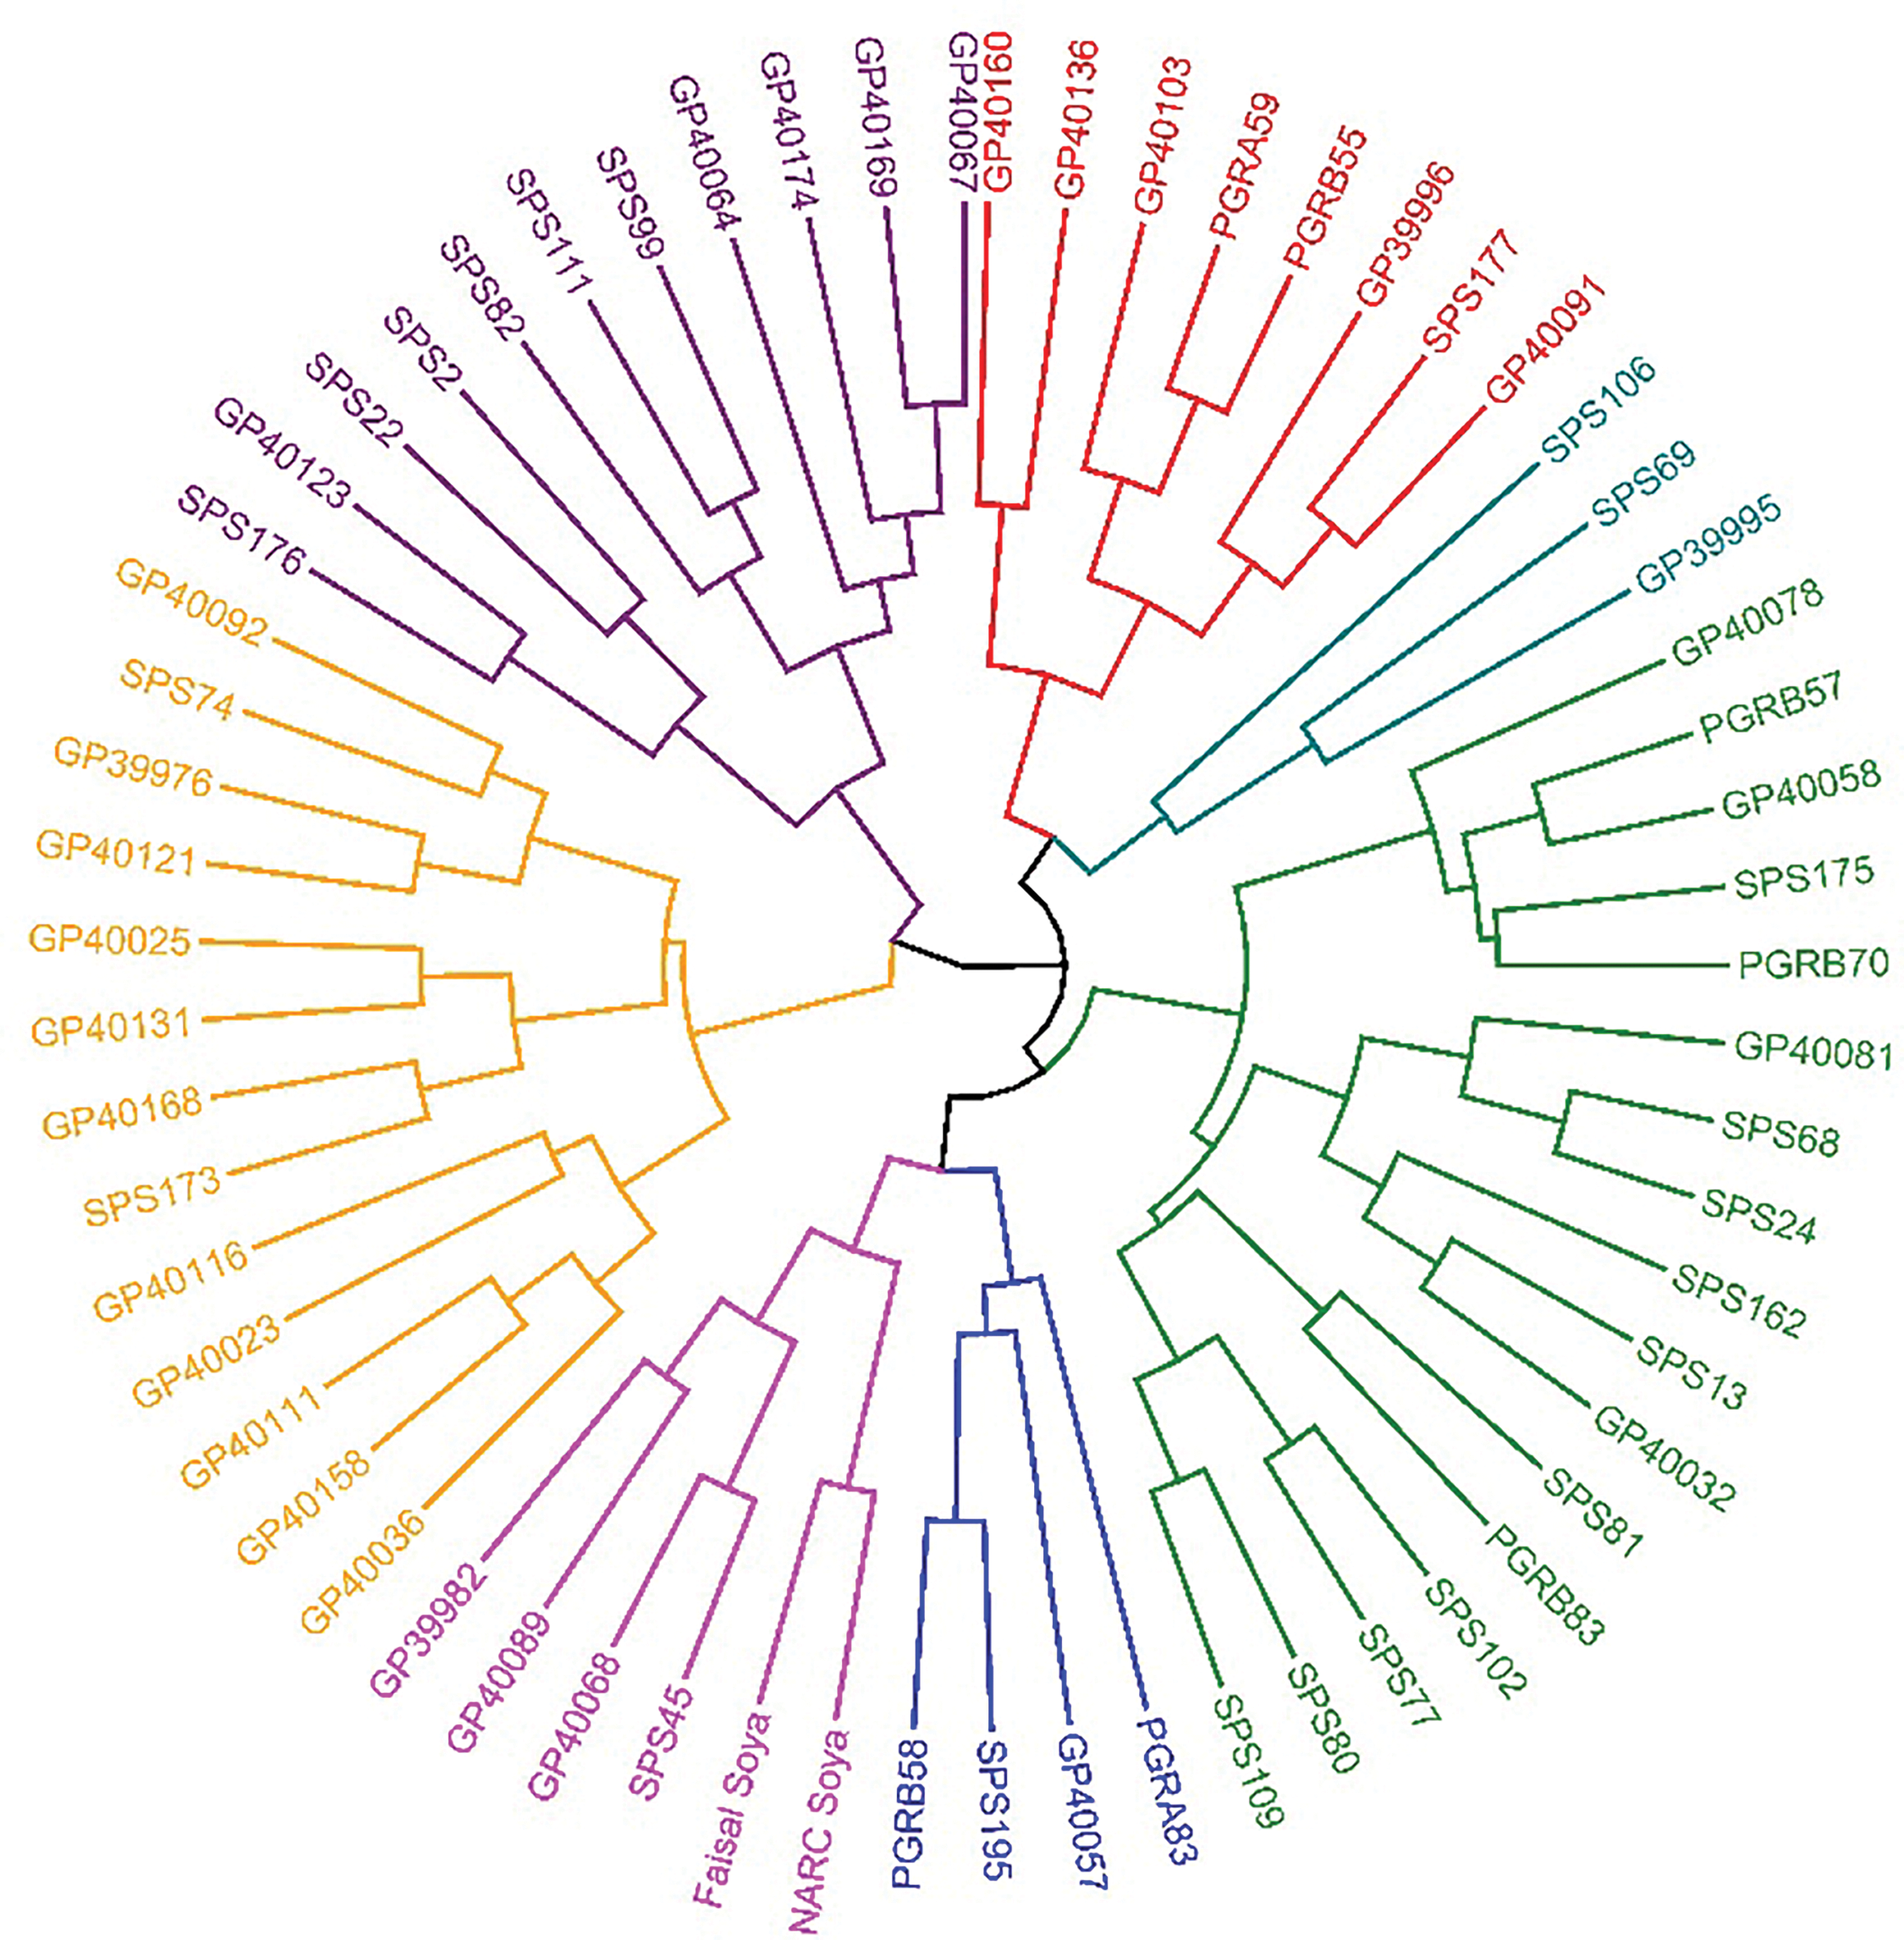
Figure 5: Hierarchical cluster analysis of sixty soybean genotypes illustrating on the base of morpho-physiological attributes under field condition
The study conducted a heatmap analysis among genotypes and traits to determine the expression of morpho-physiological attributes under both control and drought stress conditions. The graphical expression indicated that the maximum genotypes performed best in traits PH, CC, PA, PC, NPPP, and YPP under conditions. Drought stress had a minimal impact on these traits. Some genotypes demonstrated varied expression patterns in response to different agronomic characteristics. Compared to other tissues, PGBR83 exhibited the highest expression level in plant height (cm), while GP39982 and SPS109 primarily expressed themselves in chlorophyll content. Certain genotypes, including GP39982, showed the highest expression level in proline accumulation compared to other genotypes. Different genotypes showed higher levels of expression in protein content, the number of pods per plant, and the yield per plant. These genotypes showed higher levels of expression for SPS2, GP40025, SPS69, and GP40174. Some genotypes, like GP40116 and PGRA83, had low expression levels in all the morphological traits that were looked at (Fig. 6).
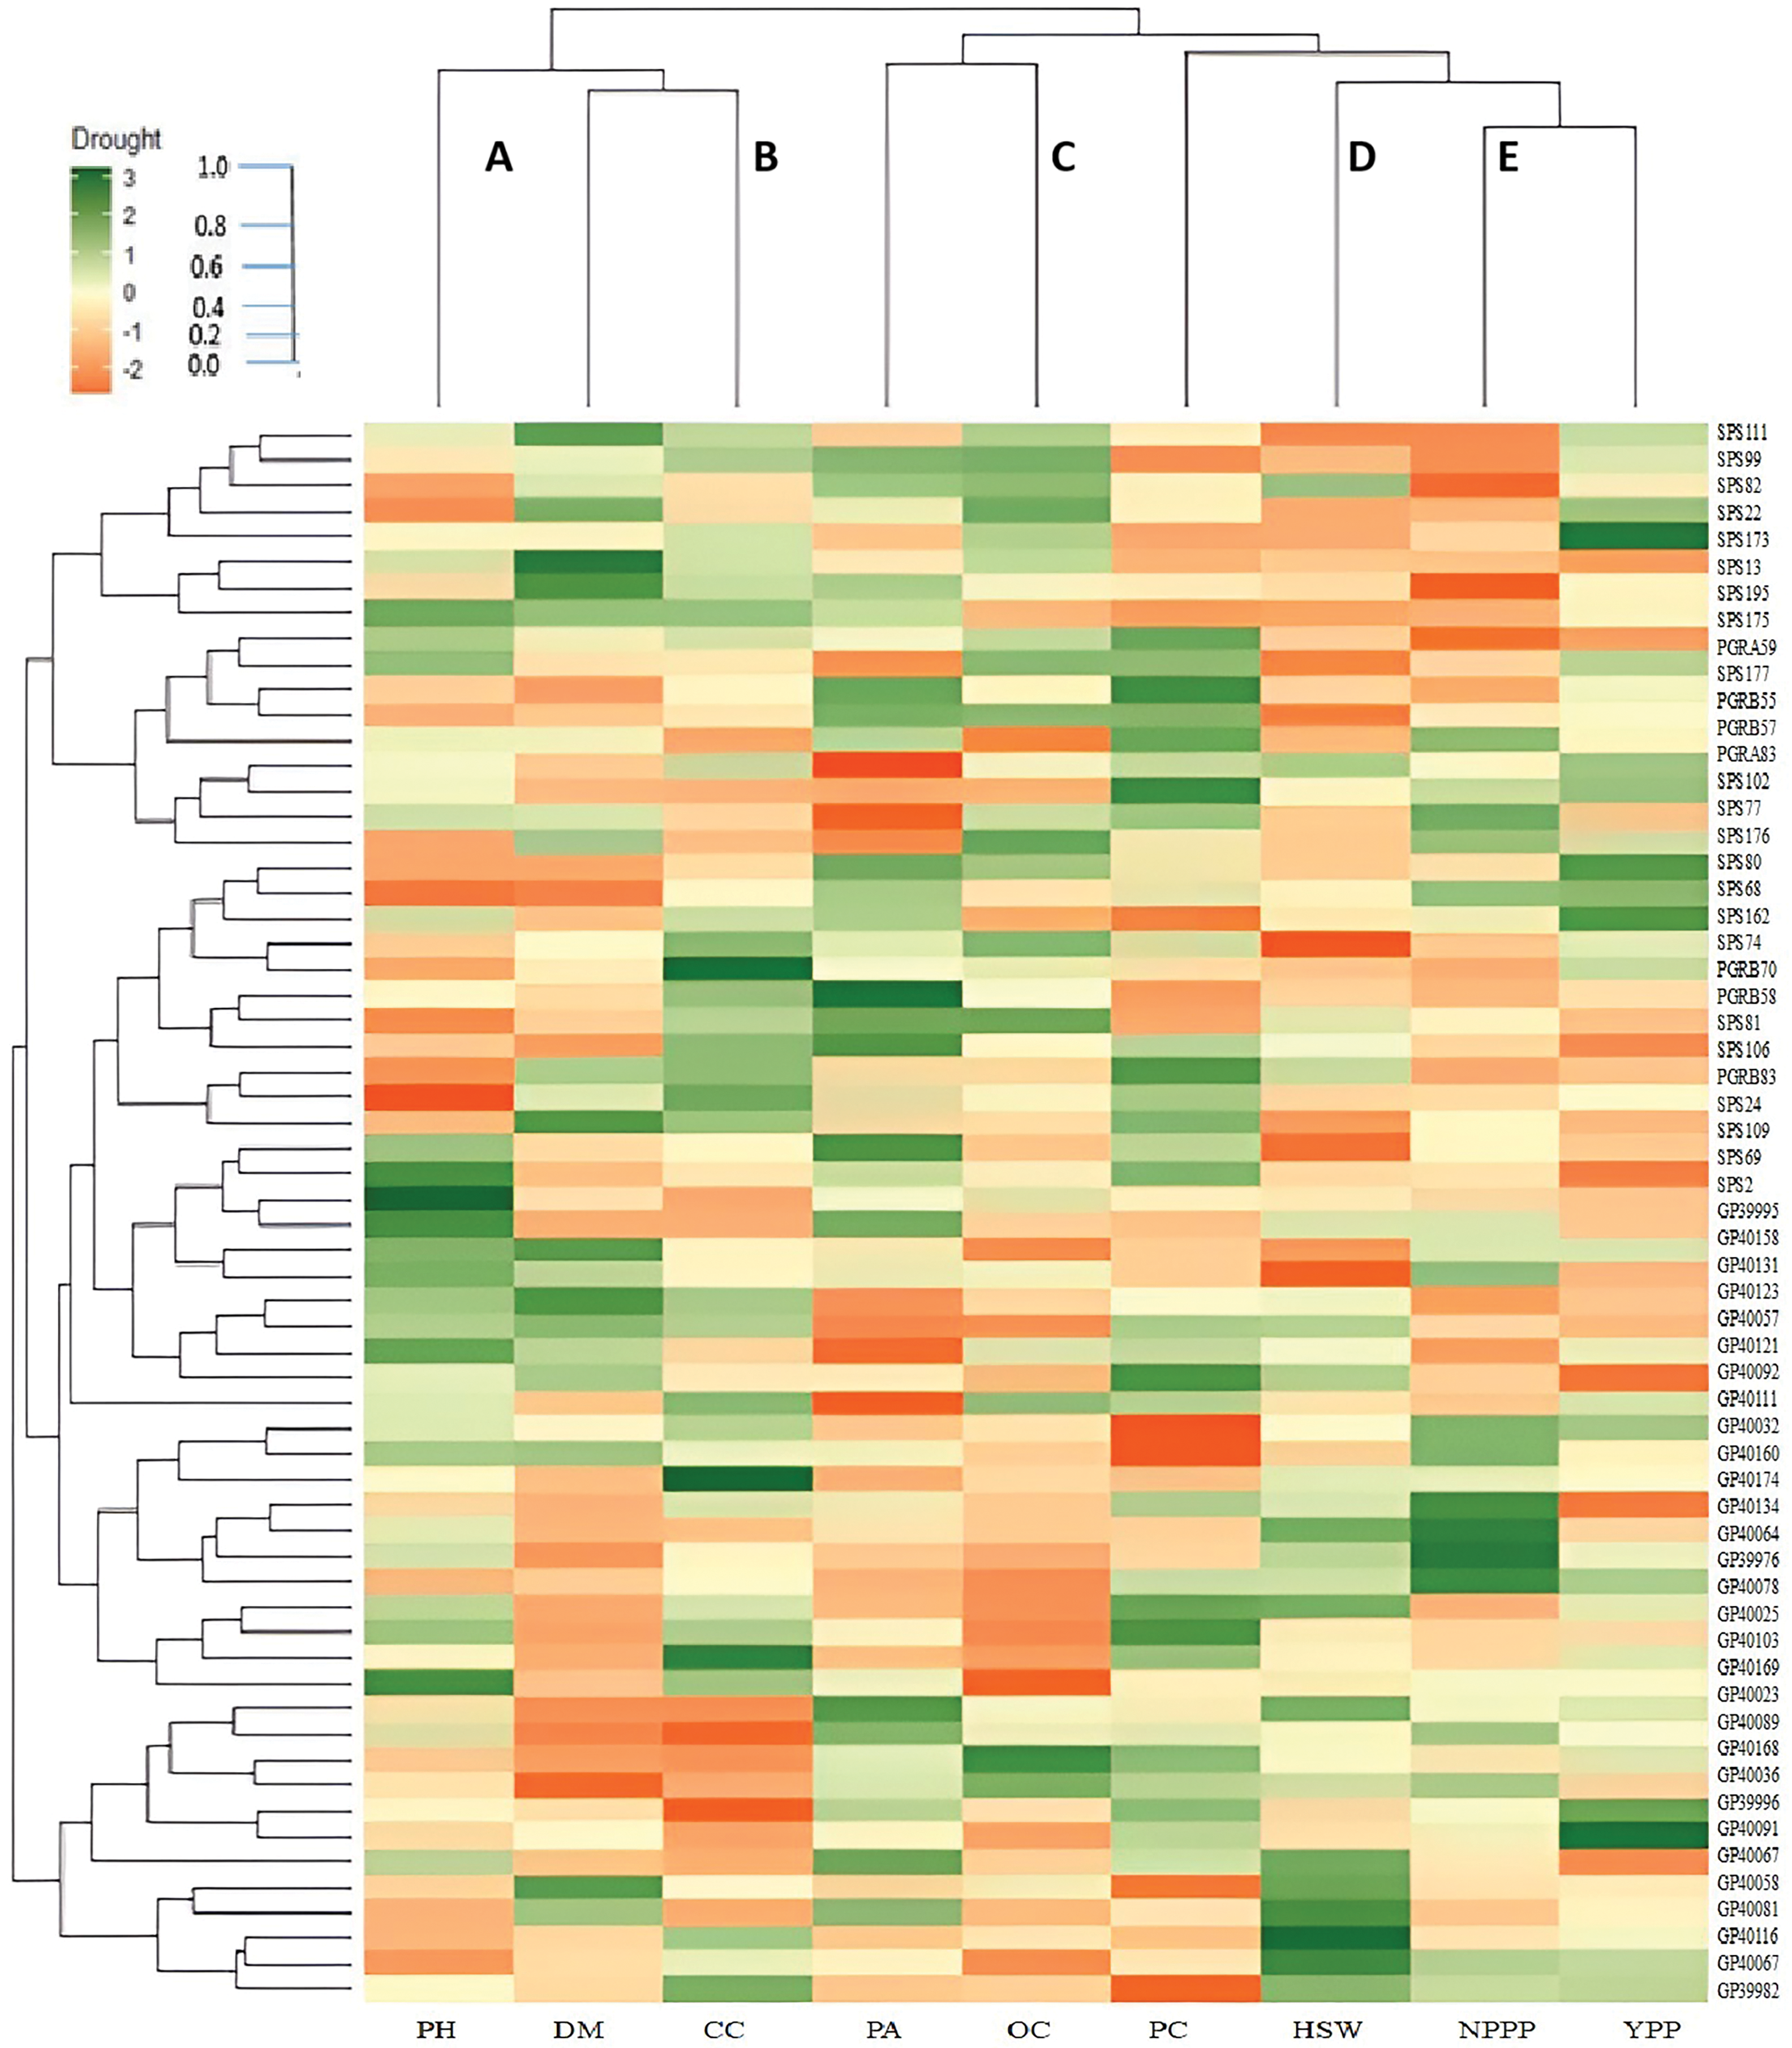
Figure 6: Heatmap analysis of sixty soybean for correlation between genotypes and morpho-physiological traits. PH: Plant Height (cm), DM: Days to Maturity, CC: Chlorophyll Content, PA: Proline Accumulation, OC: Oil Content, PC: Protein Content, HSW: Hundred Seeds Weight (g), NPPP: Number of Pods Plant-1, YPP: Yield Plant-1 (g)
Soybean (Glycine max L.) production and yield stability are severely hindered by drought stress. It is generally acknowledged in the field that direct selection for seed and oil yield stability is the best way to develop high-yielding cultivars under drought conditions [41,42]. It is essential to molecularly isolate drought-tolerant and susceptible genotypes in soybeans to breed new varieties with higher yield potential. Molecular data can reveal genetic distances and variants. According to [43–45], soybean genotyping has been done in the past to improve traits like seed quality, drought tolerance, and resistance to rhizoctonia root rot and yellow mosaic virus.
In order to find soybeans with more edible oil, we used amplification of 60 genotypes (Table S1) with 10 drought-resistant SSR markers. Because of its high molecular weight and water solubility, PEG-6000 is a powerful osmotic regulator that does not penetrate plant cell walls. A nutritional solution containing 0% to 20% PEG-6000 mimicked mild drought stress for four days (Table 2). According to the analysis of variance results, Treatment 2 was the most effective in terms of PEG, while Treatment 3 came in second. The effects of PEG-induced drought stress were more severe in Treatment 4. The second treatment reduced root length by 33%, the third by 56%, and the fourth by 33%. Treatments 2, 3, and 4 exhibited a reduction in fresh shoot weight of 37%, 64%, and 79%, respectively. After the second treatment, we observed a 13% decrease in dry shoot weight. This research finding aligns with the results of previous studies reported by [46–48].
After the PEG-6000 screening, the sixty soybean genotypes were used for the analysis of genetic variability using ten SSR markers, which were selected based on their tissue-specific function from available literature (Table 1). According to polymorphic data, five molecular markers, namely Satt373, Satt451, Satt471, Satt478, and Satt531, were the most effective molecular markers in identifying soybeans with varied patterns of genetic variation. These SSR markers were effective in automatically distinguishing the soybean cultivars since they generated four distinct banding patterns. The results of Fig. 1 illustrate the polymorphism of single sequence repeat biomarkers. The findings contradict the conclusions of [49,50], who discovered that none of the seven primers were able to differentiate between 16 different cultivars of Brassica juncea using a single study. The finding obtained from our studies was also correlated with the results reported by [51].
The heights of soybean cultivars PGRA83, SPS176, 40158, SPS162, SPS195, SPS175, SPS109, SPS80, PGRB55, SPS177, 40116, and 40111 showed a significant reduction during the field analysis of the morphological characteristics of soybean germplasm. The number of whole pods was very different between genotypes 39982, 40123, 40169, SPS82, SPS99, 40121, 40168, 40174, 40025, SPS77, 40023, SPS69, PGRB70, SPS45, 40064, 40136, 39995, 40103, and PGRB58. Genotypes 40136 and PGRB70 exhibited a notable increase in plant height. The genotype SPS195 exhibited the highest chlorophyll concentration, whereas SPS13 recorded the highest canopy temperature at 9.41 degrees. On the other hand, PGRB58 recorded the minimum temperature of 3.73 degrees. We identified cell membrane damage as an additional indicator of drought resistance, with values ranging from 57.13 to 99.9 percent. Genotypes 40136 and PGRB70 inflicted the greatest damage to the cell membrane, whereas SPS109 resulted in the least damage, achieving a score of 57.13% (Table 3). The findings revealed a significant association with those documented by [52].
We conducted an evaluation of soybean genotypes with respect to their oil and protein contents and analyzed their efficacy under field conditions. The results indicated that soybean genotypes SPS13, PGRA83, SPS176, 40158, SPS162, SPS195, SPS175, SPS109, and SPS80 and found that they have between 30% and 35% protein by dry weight. As you can see in Fig. 2, the oil content of the soybean genotypes PGRA83, SPS176, 40158, SPS162, SPS195, SPS175, SPS109, SPS80, PGRB55, SPS177, 40116, and 40111 went up a lot when the conditions were right. The analogous findings were also reported by [53,54]. The correlation coefficient analysis done in the field showed that the number of pods per plant (NPPP) and the yield per plant (YPP) were related in a positive way. There was a strong link between the hundred seeds weight (HSW), chlorophyll content (CC), and yield per plant (YPP) (Fig. 3A,B). We observed a significant relationship between oil and protein content and factors such as plant height, pod count per plant, and yield per plant. The results of our investigation are consistent with those reported in the studies conducted by [55–57].
The PCA biplot obtained from the field experiment indicates that PC1 represents 44.7% of the variation, whereas PC2 represents 17.3% (Fig. 4A,B). The PCA analysis shows that trait associations are different in drought conditions compared to control conditions. This shows that these environments have different effects on trait pairings [58,59]. We employed circular, hierarchical cluster analysis to organize sixty genotypes into seven clusters based on the phenotypic similarities observed under both control and drought conditions. Five drought-tolerant genotypes, GP40067, GP40136, GP40032, PGRB58, and SPS45, showed a lot of genetic diversity (Fig. 5). The efficiency of soybean production is significantly influenced by the adaptability of various varieties to the prevailing soil conditions. A successful genotype is characterized by its elevated grain production and its ability to enhance yields even in drought conditions. This method serves as a valuable approach for examining stability under drought conditions. Genotypes GP40067, GP40136, GP40032, PGRB58, and SPS45 had the highest level of genotype stability, as shown by the heatmap (Fig. 6). As a result, the results can assist breeders and agronomists in making well-informed choices regarding selection and cultivar recommendations. The results of our study align with the work conducted by [60,61].
The research demonstrates that recognizing superior genotypes greatly improves the efficiency of breeders in marker-assisted selection (MAS) programs. The use of specific molecular markers for genotype identification allows plant breeders to focus on plants that display desirable traits, including enhanced yields and drought resistance. The improved accuracy in this process supports breeding efforts, thereby reducing the time and resources needed to create superior crop varieties. The next phase involves thorough field studies at multiple locations to evaluate pod count under drought conditions, biomass production, and yield stability. We implement marker-assisted selection and genomic selection to incorporate established lines that can withstand drought conditions into our breeding programs. This enhances the advancement of high-yield soybean varieties that can endure drought conditions [58,62].
In this paper, we offer a strategy for finding and choosing preferred progenitors that are defined by high levels of genetic variety and phenotypic variability. The tested soybean genetic resources were very different in every way that was related to agronomy, yield, and seed quality. We used a multivariate method to develop crucial indices based on important agro-morphological traits. In the future, they could be useful in soybean breeding programs aimed at enhancing seed yield and nutritional value. We have identified additional rare lines for improved production, including 40158, SPS162, and PGRB55, in addition to SPS177, 40116, and 40111. Either these lines will be kept as premium resources for future breeding operations, or they will get approval for broad cultivation. These local varieties SPS13, PGRA83, SPS176, 40158, SPS162, SPS195, SPS175, SPS109, and SPS80 would make great parent lines for commercial cultivars that want to make more oil. We will use the intriguing genotypes found in this study as a framework to develop soybean cultivars that are both adaptable and nutritionally superior.
Acknowledgement: The authors would like to extend their sincere appreciation to the Plant Genetic Resource Institute (PGRI) and Oil Seed Program of National Agricultural Research Center, Islamabad, Pakistan.
Funding Statement: The authors received funding with Ref. No. PMAS-AAUR/ORIC/2018 dated 08-03-2021 from Office of Research, Innovation and Commercilization, Pir Mahr Ali Shah Air Agriculture University, Rawalpindi, Pakistan for this study.
Author Contributions: Muhammad Imran Khan: Performed the research experiments; Fahad Masoud Wattoo: Designed the research activity; Kamran Shehzad Bajwa: Writing, reviewing and rephrasing the current manuscript; Zahid Akram: Co-principle investigator and experimental design of current study; Sabahat Noor and Zaheer Abbas: Editing of manuscript; Rashid Mehmood Rana: Data analysis for current experiment; Muhammad Tahir Akram: Provided soybean germplasm and materials; Shaukat Ali: Reviewed the manuscript; Rai Muhammad Amir: Supervision of current research; Ghulam Muhammad Ali: Reviewed and edited the manuscript. All authors reviewed the results and approved the final version of the manuscript.
Availability of Data and Materials: The original contributions presented in the study are included in the article, further inquiries can be directed to the corresponding author.
Ethics Approval: Not applicable.
Conflicts of Interest: The authors declare no conflicts of interest to report regarding the present study.
Supplementary Materials: The supplementary material is available online at https://www.techscience.com/doi/10.32604/phyton.2025.062323/s1.
References
1. Bhartiya A, Aditya JP, Gupta S, Rajesh V, Nataraj V, Kant L, et al. Utilising soybean [Glycine max (L.) Merr.] wild and untapped genetic resources through pre-breeding: challenges and opportunities. Plant Breed. 2024;143(5):629–49. doi:10.1111/pbr.13193. [Google Scholar] [CrossRef]
2. Singh P, Krishnaswamy K. Sustainable zero-waste processing system for soybeans and soy by-product valorization. Trends Food Sci Technol. 2022;128(10):331–44. doi:10.1016/j.tifs.2022.08.015. [Google Scholar] [CrossRef]
3. Du X, Zhang X, Chen X, Jin W, Huang Z, Kong L. Drought stress reduces the photosynthetic source of subtending leaves and the transit sink function of podshells, leading to reduced seed weight in soybean plants. Front Plant Sci. 2024;15:1337544. doi:10.3389/fpls.2024.1337544. [Google Scholar] [PubMed] [CrossRef]
4. Staniak M, Szpunar-Krok E, Kocira A. Responses of soybean to selected abiotic stresses-photoperiod, temperature and water. Agriculture. 2023;13(1):146. doi:10.3390/agriculture13010146. [Google Scholar] [CrossRef]
5. Abbass K, Qasim MZ, Song H, Murshed M, Mahmood H, Younis I. A review of the global climate change impacts, adaptation, and sustainable mitigation measures. Environ Sci Pollut Res Int. 2022;29(28):42539–59. doi:10.1007/s11356-022-19718-6. [Google Scholar] [PubMed] [CrossRef]
6. Bandurska H. Drought stress responses: coping strategy and resistance. Plants. 2022;11(7):922. doi:10.3390/plants11070922. [Google Scholar] [PubMed] [CrossRef]
7. Xing Y, Wang X. Precision agriculture and water conservation strategies for sustainable crop production in arid regions. Plants. 2024;13(22):3184. doi:10.3390/plants13223184. [Google Scholar] [PubMed] [CrossRef]
8. Khatun M, Sarkar S, Era FM, Islam AKMM, Anwar MP, Fahad S, et al. Drought stress in grain legumes: effects, tolerance mechanisms and management. Agronomy. 2021;11(12):2374. doi:10.3390/agronomy11122374. [Google Scholar] [CrossRef]
9. Ghuman HF, Ahmed Z, Sadia B, Awan FS. Genetic dissection of advanced soybean (Glycine max L.) germplasm for spring season cultivation in Pakistan. Plant Genet Resour. 2024;22(3):158–64. doi:10.1017/s1479262123001120. [Google Scholar] [CrossRef]
10. Pereyra VM, Hefley T, Vara Prasad PV, Ciampitti IA. Soybean seed yield, protein, and oil concentration for a modern and old genotype under varying row spacings. Heliyon. 2024;10(15):e35054. doi:10.1016/j.heliyon.2024.e35054. [Google Scholar] [PubMed] [CrossRef]
11. Yang S, Zhang M, Yao R, Chen L, Cong W, Yao D, et al. Linkage mapping and QTL analysis of isoflavones composition in soybean seeds. Phyton-Int J Exp Bot. 2024;93(9):2209–25. doi:10.32604/phyton.2024.055046. [Google Scholar] [CrossRef]
12. Şimşek Ö. Harvesting sustainability: innovations and practices in modern agriculture. Green Technol Sustain. Forthcoming 2025. doi:10.1016/j.grets.2025.100192. [Google Scholar] [CrossRef]
13. Krishna TPA, Veeramuthu D, Maharajan T, Soosaimanickam M. The era of plant breeding: conventional breeding to genomics-assisted breeding for crop improvement. Curr Genomics. 2023;24(1):24–35. doi:10.2174/1389202924666230517115912. [Google Scholar] [PubMed] [CrossRef]
14. Kim SH, Subramanian P, Hahn BS, Ha BK. High-throughput phenotypic characterization and diversity analysis of soybean roots (Glycine max L.). Plants. 2022;11(15):2017. doi:10.3390/plants11152017. [Google Scholar] [PubMed] [CrossRef]
15. Haidar S, Hooker J, Lackey S, Elian M, Puchacz N, Szczyglowski K, et al. Harnessing multi-omics strategies and bioinformatics innovations for advancing soybean improvement: a comprehensive review. Plants. 2024;13(19):2714. doi:10.3390/plants13192714. [Google Scholar] [PubMed] [CrossRef]
16. Ullah A, Akram Z, Rasool G, Waris M, Khurshid H. Agro-morphological characterization and genetic variability assessment of soybean [Glycine max (L.) Merr.] germplasm for yield and quality traits. Euphytica. 2024;220(4):67. doi:10.1007/s10681-024-03322-5. [Google Scholar] [CrossRef]
17. Pardeshi P, Jadhav P, Sakhare S, Zunjare R, Rathod D, Sonkamble P, et al. Morphological and microsatellite marker-based characterization and diversity analysis of novel vegetable soybean [Glycine max (L.) Merrill]. Mol Biol Rep. 2023;50(5):4049–60. doi:10.1007/s11033-023-08328-1. [Google Scholar] [PubMed] [CrossRef]
18. Ma S, Feng H, Sun Y, Yu L, Tang C, Zhao Y, et al. Identifications of seed vigor-related QTLs and candidate genes combined cultivated soybean with wild soybean. Agronomy. 2024;14(2):332. doi:10.3390/agronomy14020332. [Google Scholar] [CrossRef]
19. Alves SIA, Dantas CWD, Macedo DB, Ramos RTJ. What are microsatellites and how to choose the best tool: a user-friendly review of SSR and 74 SSR mining tools. Front Genet. 2024;15:1474611. doi:10.3389/fgene.2024.1474611. [Google Scholar] [PubMed] [CrossRef]
20. Chen C, Liu Y. Genetic diversity and distinctness of flax (Linum usitatissimum L.) based on morphological and simple sequence repeat (SSR) markers. Genet Resour Crop Evol. 2024;71(8):4763–77. doi:10.1007/s10722-024-01933-4. [Google Scholar] [CrossRef]
21. Bidyananda N, Jamir I, Nowakowska K, Varte V, Vendrame WA, Devi RS, et al. Plant genetic diversity studies: insights from DNA marker analyses. Int J Plant Biol. 2024;15(3):607–40. doi:10.3390/ijpb15030046. [Google Scholar] [CrossRef]
22. Hou F, Liang X, Chen R, Ji X, Li H, Jing M, et al. Construction of genetic linkage maps using SSR markers and identification of flower bud-related QTLs in nightlily (Hemerocallis citrina). Agronomy. 2025;15(3):534. doi:10.3390/agronomy15030534. [Google Scholar] [CrossRef]
23. Yerzhebayeva R, Didorenko S, Amangeldiyeva A, Daniyarova A, Mazkirat S, Zinchenko A, et al. Marker-assisted selection for early maturing E loci in soybean yielded prospective breeding lines for high latitudes of northern Kazakhstan. Biomolecules. 2023;13(7):1146. doi:10.3390/biom13071146. [Google Scholar] [PubMed] [CrossRef]
24. He D, Wu X, Liu Z, Yang Q, Shi X, Song Q, et al. Genome-wide association study and genomic prediction of soybean mosaic virus resistance. Int J Mol Sci. 2025;26(5):2106. doi:10.3390/ijms26052106. [Google Scholar] [PubMed] [CrossRef]
25. Sathishkumar R, Mohanrao MD, Geethanjali S, Santha Lakshmi Prasad M, Senthilvel S. A simple and cost-effective SNP genotyping assay for marker-assisted selection of wilt resistance in Castor breeding. Ind Crops Prod. 2025;226(4):120693. doi:10.1016/j.indcrop.2025.120693. [Google Scholar] [CrossRef]
26. Kylyshbayeva G, Bishimbayeva N, Jatayev S, Eliby S, Shavrukov Y. Polyethylene glycol (PEG) application triggers plant dehydration but does not accurately simulate drought. Plants. 2024;14(1):92. doi:10.3390/plants14010092. [Google Scholar] [PubMed] [CrossRef]
27. Esan VI, Obisesan IA, Ogunbode TO, Serrano M. Root system architecture and physiological characteristics of soybean (Glycine max L.) seedlings in response to PEG6000-simulated drought stress. Int J Agron. 2023;2023(3):9697246. doi:10.1155/2023/9697246. [Google Scholar] [CrossRef]
28. Al-daej MI, Rezk AA, El-Malky MM, Shalaby TA, Ismail M. Comparative genetic diversity assessment and marker-trait association using two DNA marker systems in rice (Oryza sativa L.). Agronomy. 2023;13(2):329. doi:10.3390/agronomy13020329. [Google Scholar] [CrossRef]
29. Bajwa KS, Ali MU, Rao AQ, Kiani S, Ahmad F, Bakhsh A, et al. From genes to fields: environmental compatibility of herbicide tolerant transgenic cotton. Ind Crops Prod. 2024;209(8):117903. doi:10.1016/j.indcrop.2023.117903. [Google Scholar] [CrossRef]
30. Wu F, Cai G, Xi P, Guo Y, Xu M, Li A. Genetic diversity analysis and fingerprint construction for 87 passionfruit (Passiflora spp.) germplasm accessions on the basis of SSR fluorescence markers. Int J Mol Sci. 2024;25(19):10815. doi:10.3390/ijms251910815. [Google Scholar] [PubMed] [CrossRef]
31. Perić V, Kravić N, Tabaković M, Mladenović Drinić S, Nikolić V, Simić M, et al. Depicting soybean diversity via complementary application of three marker types. Plants. 2025;14(2):201. doi:10.3390/plants14020201. [Google Scholar] [PubMed] [CrossRef]
32. Rani R, Raza G, Tung MH, Rizwan M, Ashfaq H, Shimelis H, et al. Genetic diversity and population structure analysis in cultivated soybean (Glycine max [L.] Merr.) using SSR and EST-SSR markers. PLoS One. 2023;18(5):e0286099. doi:10.1371/journal.pone.0286099. [Google Scholar] [PubMed] [CrossRef]
33. Chiemeke FK, Olasanmi B, Agre PA, Mushoriwa H, Chigeza G, Abebe AT. Genetic diversity and population structure analysis of soybean [Glycine max (L.) Merrill] genotypes using agro-morphological traits and SNP markers. Genes. 2024;15(11):1373. doi:10.3390/genes15111373. [Google Scholar] [PubMed] [CrossRef]
34. Teklu DH, Shimelis H, Tesfaye A, Shayanowako AIT. Analyses of genetic diversity and population structure of sesame (Sesamum indicum L.) germplasm collections through seed oil and fatty acid compositions and SSR markers. J Food Compos Anal. 2022;110(24):104545. doi:10.1016/j.jfca.2022.104545. [Google Scholar] [CrossRef]
35. Zhang M, Zhou Y, Li C, Yuan C, Shan M, Fan Y, et al. Effects of different intertillage practices on soil biochemical properties and soybean yield in soybean fields. Agronomy. 2025;15(1):146. doi:10.3390/agronomy15010146. [Google Scholar] [CrossRef]
36. Mohammed AAA, Tsubo M, Ma S, Kurosaki Y, Ibaraki Y, Ali-Tahir IS, et al. Micrometeorological comparison of canopy temperature between two wheat cultivars grown under irrigation in a hot environment in Sudan. Agronomy. 2023;13(12):3032. doi:10.3390/agronomy13123032. [Google Scholar] [CrossRef]
37. Ramos PR, Sponchiado J, Echenique JVF, Dacanal GC, de Oliveira AL. Kinetics of vegetable oils (rice bran, sunflower seed, and soybean) extracted by pressurized liquid extraction in intermittent process. Processes. 2024;12(6):1107. doi:10.3390/pr12061107. [Google Scholar] [CrossRef]
38. Ahmadian S, Kenari RE, Amiri ZR, Sohbatzadeh F, Khodaparast MHH. Fabrication of double nano-emulsions loaded with hyssop (Hyssopus officinalis L.) extract stabilized with soy protein isolate alone and combined with chia seed gum in controlling the oxidative stability of canola oil. Food Chem. 2024;430:137093. doi:10.1016/j.foodchem.2023.137093. [Google Scholar] [PubMed] [CrossRef]
39. Tsindi A, Eleblu JSY, Gasura E, Mushoriwa H, Tongoona P, Danquah EY, et al. Analysis of population structure and genetic diversity in a Southern African soybean collection based on single nucleotide polymorphism markers. CABI Agric Biosci. 2023;4(1):15. doi:10.1186/s43170-023-00158-2. [Google Scholar] [CrossRef]
40. Lee JY, Jo H, Son CK, Bae JS, Lee JD. Genetic diversity of Korean black soybean (Glycine max L.) germplasms with green cotyledons based on seed composition traits. Agriculture. 2023;13(2):406. doi:10.3390/agriculture13020406. [Google Scholar] [CrossRef]
41. Rahman SU, McCoy E, Raza G, Ali Z, Mansoor S, Amin I. Improvement of soybean; a way forward transition from genetic engineering to new plant breeding technologies. Mol Biotechnol. 2023;65(2):162–80. doi:10.1007/s12033-022-00456-6. [Google Scholar] [PubMed] [CrossRef]
42. Han D, Zhao X, Zhang D, Wang Z, Zhu Z, Sun H, et al. Genome-wide association studies reveal novel QTLs for agronomic traits in soybean. Front Plant Sci. 2024;15:1375646. doi:10.3389/fpls.2024.1375646. [Google Scholar] [PubMed] [CrossRef]
43. Islam MS, Lee JD, Song Q, Jo H, Kim Y. Integration of genetic and imaging data to detect QTL for root traits in interspecific soybean populations. Int J Mol Sci. 2025;26(3):1152. doi:10.3390/ijms26031152. [Google Scholar] [PubMed] [CrossRef]
44. Fang C, Du H, Wang L, Liu B, Kong F. Mechanisms underlying key agronomic traits and implications for molecular breeding in soybean. J Genet Genom. 2024;51(4):379–93. doi:10.1016/j.jgg.2023.09.004. [Google Scholar] [PubMed] [CrossRef]
45. Hossain MS, Khan MAR, Mahmud A, Ghosh UK, Anik TR, Mayer D, et al. Differential drought responses of soybean genotypes in relation to photosynthesis and growth-yield attributes. Plants. 2024;13(19):2765. doi:10.3390/plants13192765. [Google Scholar] [PubMed] [CrossRef]
46. Bukan M, Kereša S, Pejić I, Sudarić A, Lovrić A, Šarčević H. Variability of root and shoot traits under PEG-induced drought stress at an early vegetative growth stage of soybean. Agronomy. 2024;14(6):1188. doi:10.3390/agronomy14061188. [Google Scholar] [CrossRef]
47. Zhou Y, Li H, Chen H, Yang X, Yu T, Wang Y, et al. Proteomic investigation of molecular mechanisms in response to PEG-induced drought stress in soybean roots. Plants. 2022;11(9):1173. doi:10.3390/plants11091173. [Google Scholar] [PubMed] [CrossRef]
48. Wang X, Song S, Wang X, Liu J, Dong S. Transcriptomic and metabolomic analysis of seedling-stage soybean responses to PEG-simulated drought stress. Int J Mol Sci. 2022;23(12):6869. doi:10.3390/ijms23126869. [Google Scholar] [PubMed] [CrossRef]
49. Miller MJ, Song Q, Li Z. Genomic selection of soybean (Glycine max) for genetic improvement of yield and seed composition in a breeding context. Plant Genome. 2023;16(4):e20384. doi:10.1002/tpg2.20384. [Google Scholar] [PubMed] [CrossRef]
50. Toum L, Perez-Borroto LS, Peña-Malavera AN, Luque C, Welin B, Berenstein A, et al. Selecting putative drought-tolerance markers in two contrasting soybeans. Sci Rep. 2022;12(1):10872. doi:10.1038/s41598-022-14334-3. [Google Scholar] [PubMed] [CrossRef]
51. Raman R, Qiu Y, Coombes N, Raman H. Identification and validation of genomic regions for pod shatter resistance in Brassica rapa using QTL-seq and traditional QTL mapping. BMC Plant Biol. 2025;25(1):175. doi:10.1186/s12870-025-06155-z. [Google Scholar] [PubMed] [CrossRef]
52. Wu X, Wang Y, Xie J, Yang Z, Li H, Li Y, et al. Identification of candidate genes for soybean storability via GWAS and WGCNA approaches. Agronomy. 2024;14(11):2457. doi:10.3390/agronomy14112457. [Google Scholar] [CrossRef]
53. Wang L, Niu FA, Wang J, Zhang H, Zhang D, Hu Z. Genome-wide association studies prioritize genes controlling seed size and reproductive period length in soybean. Plants. 2024;13(5):615. doi:10.3390/plants13050615. [Google Scholar] [PubMed] [CrossRef]
54. Clevinger EM, Biyashev R, Haak D, Song Q, Pilot G, Saghai-Maroof MA. Identification of quantitative trait loci controlling soybean seed protein and oil content. PLoS One. 2023;18(6):e0286329. doi:10.1371/journal.pone.0286329. [Google Scholar] [PubMed] [CrossRef]
55. Potapova NA, Zorkoltseva IV, Zlobin AS, Shcherban AB, Fedyaeva AV, Salina EA, et al. Genome-wide association study on imputed genotypes of 180 Eurasian soybean Glycine max varieties for oil and protein contents in seeds. Plants. 2025;14(2):255. doi:10.3390/plants14020255. [Google Scholar] [PubMed] [CrossRef]
56. Feng W, Ge J, Rodríguez ARS, Zhao B, Wang X, Peixoto L, et al. Oat/soybean strip intercropping benefits crop yield and stability in semi-arid regions: a multi-site and multi-year assessment. Field Crops Res. 2024;318(2):109560. doi:10.1016/j.fcr.2024.109560. [Google Scholar] [CrossRef]
57. Sun M, Zhao T, Liu S, Han J, Wang Y, Zhao X, et al. QTL detection of salt tolerance at soybean seedling stage based on genome-wide association analysis and linkage analysis. Plants. 2024;13(16):2283. doi:10.3390/plants13162283. [Google Scholar] [PubMed] [CrossRef]
58. Kumar R, Das SP, Choudhury BU, Kumar A, Prakash NR, Verma R, et al. Advances in genomic tools for plant breeding: harnessing DNA molecular markers, genomic selection, and genome editing. Biol Res. 2024;57(1):80. doi:10.1186/s40659-024-00562-6. [Google Scholar] [PubMed] [CrossRef]
59. Joshi DR, Clay SA, Sharma P, Rekabdarkolaee HM, Kharel T, Rizzo DM, et al. Artificial intelligence and satellite-based remote sensing can be used to predict soybean (Glycine max) yield. Agron J. 2024;116(3):917–30. [Google Scholar]
60. Amrate PK, Shrivastava MK, Bhale MS, Agrawal N, Kumawat G, Shivakumar M, et al. Identification and genetic diversity analysis of high-yielding charcoal rot resistant soybean genotypes. Sci Rep. 2023;13(1):8905. doi:10.1038/s41598-023-35688-2. [Google Scholar] [PubMed] [CrossRef]
61. Rani R, Raza G, Ashfaq H, Rizwan M, Shimelis H, Tung MH, et al. Analysis of genotype × environment interactions for agronomic traits of soybean (Glycine max [L.] Merr.) using association mapping. Front Genet. 2023;13:1090994. doi:10.3389/fgene.2022.1090994. [Google Scholar] [PubMed] [CrossRef]
62. Sinha D, Maurya AK, Abdi G, Majeed M, Agarwal R, Mukherjee R, et al. Integrated genomic selection for accelerating breeding programs of climate-smart cereals. Genes. 2023;14(7):1484. doi:10.3390/genes14071484. [Google Scholar] [PubMed] [CrossRef]
Cite This Article
 Copyright © 2025 The Author(s). Published by Tech Science Press.
This work is licensed under a Creative Commons Attribution 4.0 International License , which permits unrestricted use, distribution, and reproduction in any medium, provided the original work is properly cited.
 Downloads
 Citation Tools