
 Submit a Paper
 Propose a Special lssue
 Open Access
ARTICLE

Participatory Rice Breeding in Rainfed Land to Sustainable Agriculture
1 National Research and Innovation Agency (BRIN), Jakarta Pusat, Jakarta, 10340, Indonesia
2 Central Java Agricultural Training Center, Temanggung, 56272, Indonesia
3 Faculty of Agriculture, Universitas Gadjah Mada, Depok, Sleman, Yogyakarta, 55281, Indonesia
* Corresponding Author: Taryono. Email:
(This article belongs to the Special Issue: Crop Managements and Crop Adversity: Strategies, Mechanisms, and Implements)
Phyton-International Journal of Experimental Botany 2025, 94(7), 2055-2073. https://doi.org/10.32604/phyton.2025.065227
Received 07 March 2025; Accepted 16 June 2025; Issue published 31 July 2025
 View Full Text
 Download PDF
Abstract
Rice, as a primary commodity, needs to be increased in production while facing the sustainability challenges of limited land, water resources, and climate change. The demand for rice productivity was not enough to rely only on the fertile fields’ ability; it is necessary to consider the rainfed land potential. Cultivation in rainfed land involves biophysical pressure, low production, and limited access to superior varieties. Participatory rice breeding aimed to identify farmers’ trait preferences and develop acceptable lines. A bottom-up approach involved 203 farmers from four rainfed fields in Indonesia, i.e., Semarang-Central Java, Kulon Progo-Yogyakarta, Tabanan-Bali, and Gunungkidul-Yogyakarta. The experiment on February–June 2024 tested six lines (G2, G3, G4, G5, G9, and G10) and four varieties (Situ Bagendit, Gamagora7, Inpari IRNutri Zinc, and Inpago12 Agritan). Farmers’ involvement in evaluating the suitability of genotypes involved using Multidimensional Scaling and Importance-Performance Analysis. Breeders added comprehensive analysis in the growing environment with Genotype Environment Interaction, and key attributes of leverage analysis from farmers must be considered. Genotype performance in the Multidimensional Scaling feasibility indicated that yield primary determinants were panicle type, disease resistance, leaf characteristics, and environmental resilience. Importance Performance Analysis verified that G3, G9, G2, and G4 had a preference at the farm level. Genotype Environment Interaction reveals that G3, G4, and G2 were ideal lines with high potential yields, suitability, and adaptability on rainfed land. Participatory rice breeding in rainfed land integrates farmers’ assessments and breeders’ observations to realize the most preferred genotypes according to the challenges for sustainable agriculture.Keywords
Rice is the staple food of almost the entire world’s population, including Indonesia, while fertile land for producing rice is decreasing, so that rice farming is also carried out on rainfed land. On the other hand, the need for food continues to increase with the increasing population of Indonesia [1].
Oryza sativa L. encounters signs of limited fertile land necessary to optimize agricultural potential on marginal land, including rainfed land. Rice development in rainfed land is a severe challenge for the agricultural sector. Rainfed land has low soil quality, limited water, and loss of essential nutrients, causing low productivity. Rice growth and productivity in rainfed lands were generally lower than in lowland fields [2,3], which caused production failure for local food self-sufficiency [4].
To increase rice productivity in rainfed land, it is necessary to improve quality by using varieties for rainfed land according to farmers’ preferences, called participatory breeding. Indonesia’s rice study in the last decade has focused on breeders’ actions. Indonesia’s assertion for releasing varieties is high yield and stability across an environment. Farmers’ preferences for rice in Indonesia are still limited to the newly released varieties. Farmers’ concern is that rice traits should be used in assembling lines before becoming commercial varieties [5].
Farmers are the end-users of the genotypes. Judgment by farmers as breeder partners should be taken into consideration so that the primary preferred trait is considered when making the lines. Participatory breeding is a process of field testing genotypes with the partners’ participation. This program effectively addresses farmers’ needs in their agroecological areas by employing indigenous knowledge to accept new lines and improve breeding schemes [6].
Farmers’ preferences and behavior were influenced by agronomic attributes, cropping systems, restrictive soil-climate conditions, concerns in a production context, agricultural region scale, and farmers’ knowledge, experience, and perceptions [7]. Multilocation on-farm trials systematically collect feedback from the social community. This protocol incorporates farmers’ viewpoints, allowing a deeper understanding of their rice traits and needs [8].
The decentralized concept integrates Genotype Environment Interaction analysis to promote agricultural decentralization. Genotype analysis in diverse environments was implemented with a statistical Genotype Environment Interaction, a pattern of genotype outcomes, and the interaction between genotypes in multiple environmental conditions [9].
Decentralization’s role in intensifying rice genetic diversity. Breeders and farmers could be the best team in the breeding program. Participatory methods overcome the scarcity of research resources and provide cost-saving benefits. Participation was made using the near-finished breeding program, whereas researchers carried out the scheme with scientific considerations and combined it with farmers’ preferences to choose the best lines [10].
The selection of rice genotypes with yield stability over time and across locations is very important for breeding programs. The interaction between genotype and environment will show that genotypes respond differently across environments [11]. The genotype-environment interaction method identifies the future of lines in a particular location while recognizing that genotypes show stability and high yield over time across zones [12].
Indonesia, as a tropical country, has two seasons: the rainy season (November–June) and the dry season (July–October). Planting patterns in rainfed ricefields are generally just in the rainy season each year [13]. Optimal planting is essential to increase crop yields, especially the fulfillment of water needs by plants. In rainfed ricefields, the main constraint faced is the insufficient availability of irrigation water, so farmers generally only plant one rice crop in the rainy season, and then the land is left fallow [14].
Studies on participatory rice breeding in Indonesian rainfed areas were still limited. Food security requires effective breeding programs in the farmer’s environment to expedite the rate of genetic uplift of genotypes in rainfed land. Participatory breeding builds favorable outlooks between farmers’ knowledge and breeders’ assessment of promising lines.
The aim of this study was to identify farmers’ preferences for rice traits and develop best-performing lines acceptable to farmers in rainfed land. Farmer participation was very helpful in selecting rice varieties according to farmers’ preferences based on high yields and stability, as hypothesized in this study.
The multi-location research took place in rice-growing seasons from February to June 2024. The study was conducted in four sites in Indonesia, i.e., Semarang-Central Java (7.091568°S, 110.447615°E, 100 m a.s.l.); Kulon Progo-Yogyakarta (7.744591°S, 110.186689°E, 160 m a.s.l.); Tabanan-Bali (8.523696°S, 115.045517°E, 100 m a.s.l.), and Gunungkidul-Yogyakarta (7.963939°S, 110.506070°E, 120 m a.s.l.) (Fig. 1). The sites were determined purposively. Selected zones represented the rainfed rice production area, marginal regions affected by major pests and diseases, likewise logistically feasible.
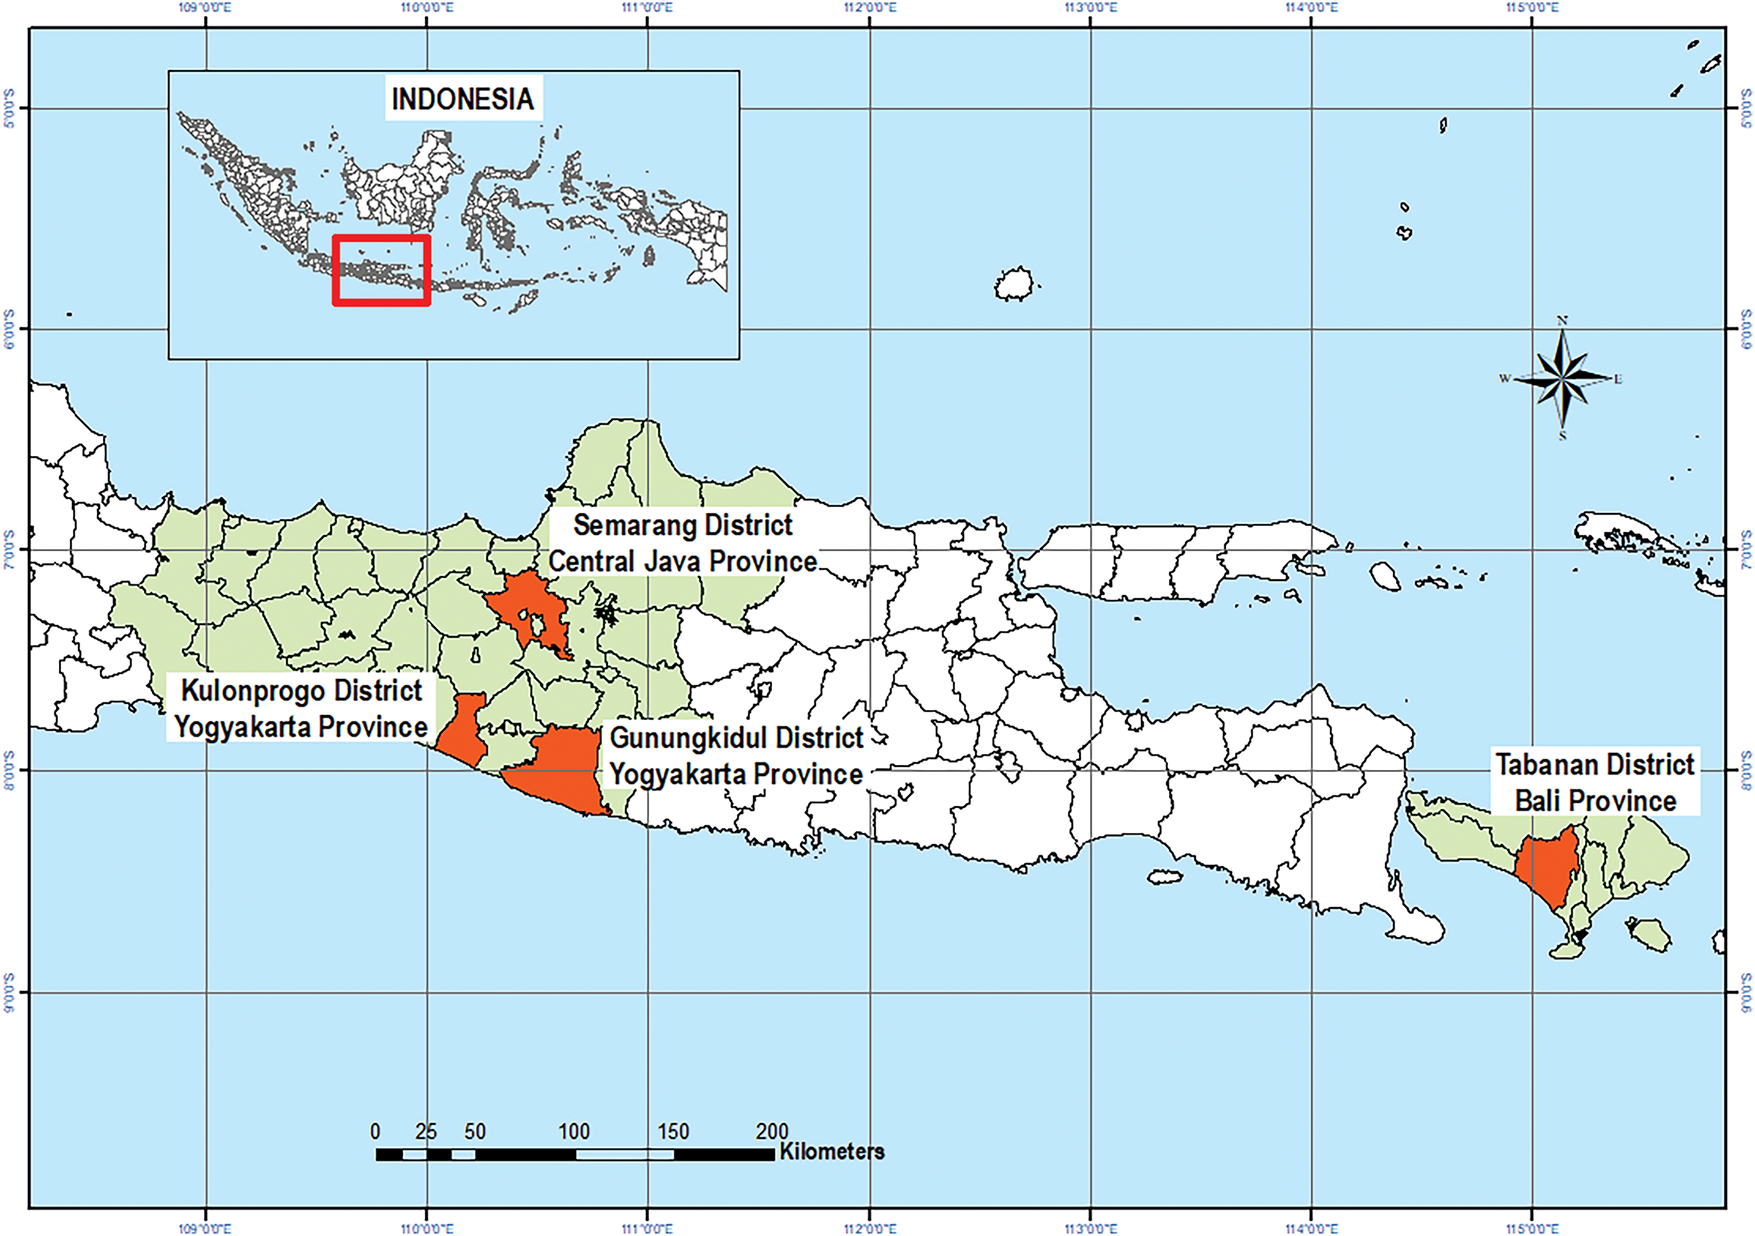
Figure 1: Study sites
The soil type in the four locations was Inceptisols. The soil analysis results based on assessment criteria showed that the soil pH in the four research sites was slightly acidic. pH H2O and pH KCl were measured by the electrometric method. pH H2O calculates the active acidity or actual pH. pH KCl calculates the exchangeable acidity or potential pH. pH KCl was always lower than PH H2O; the difference between the two indicates the total charge of the soil, namely, a greater cation exchange capacity related to the organic matter content in the soil (Table 1).
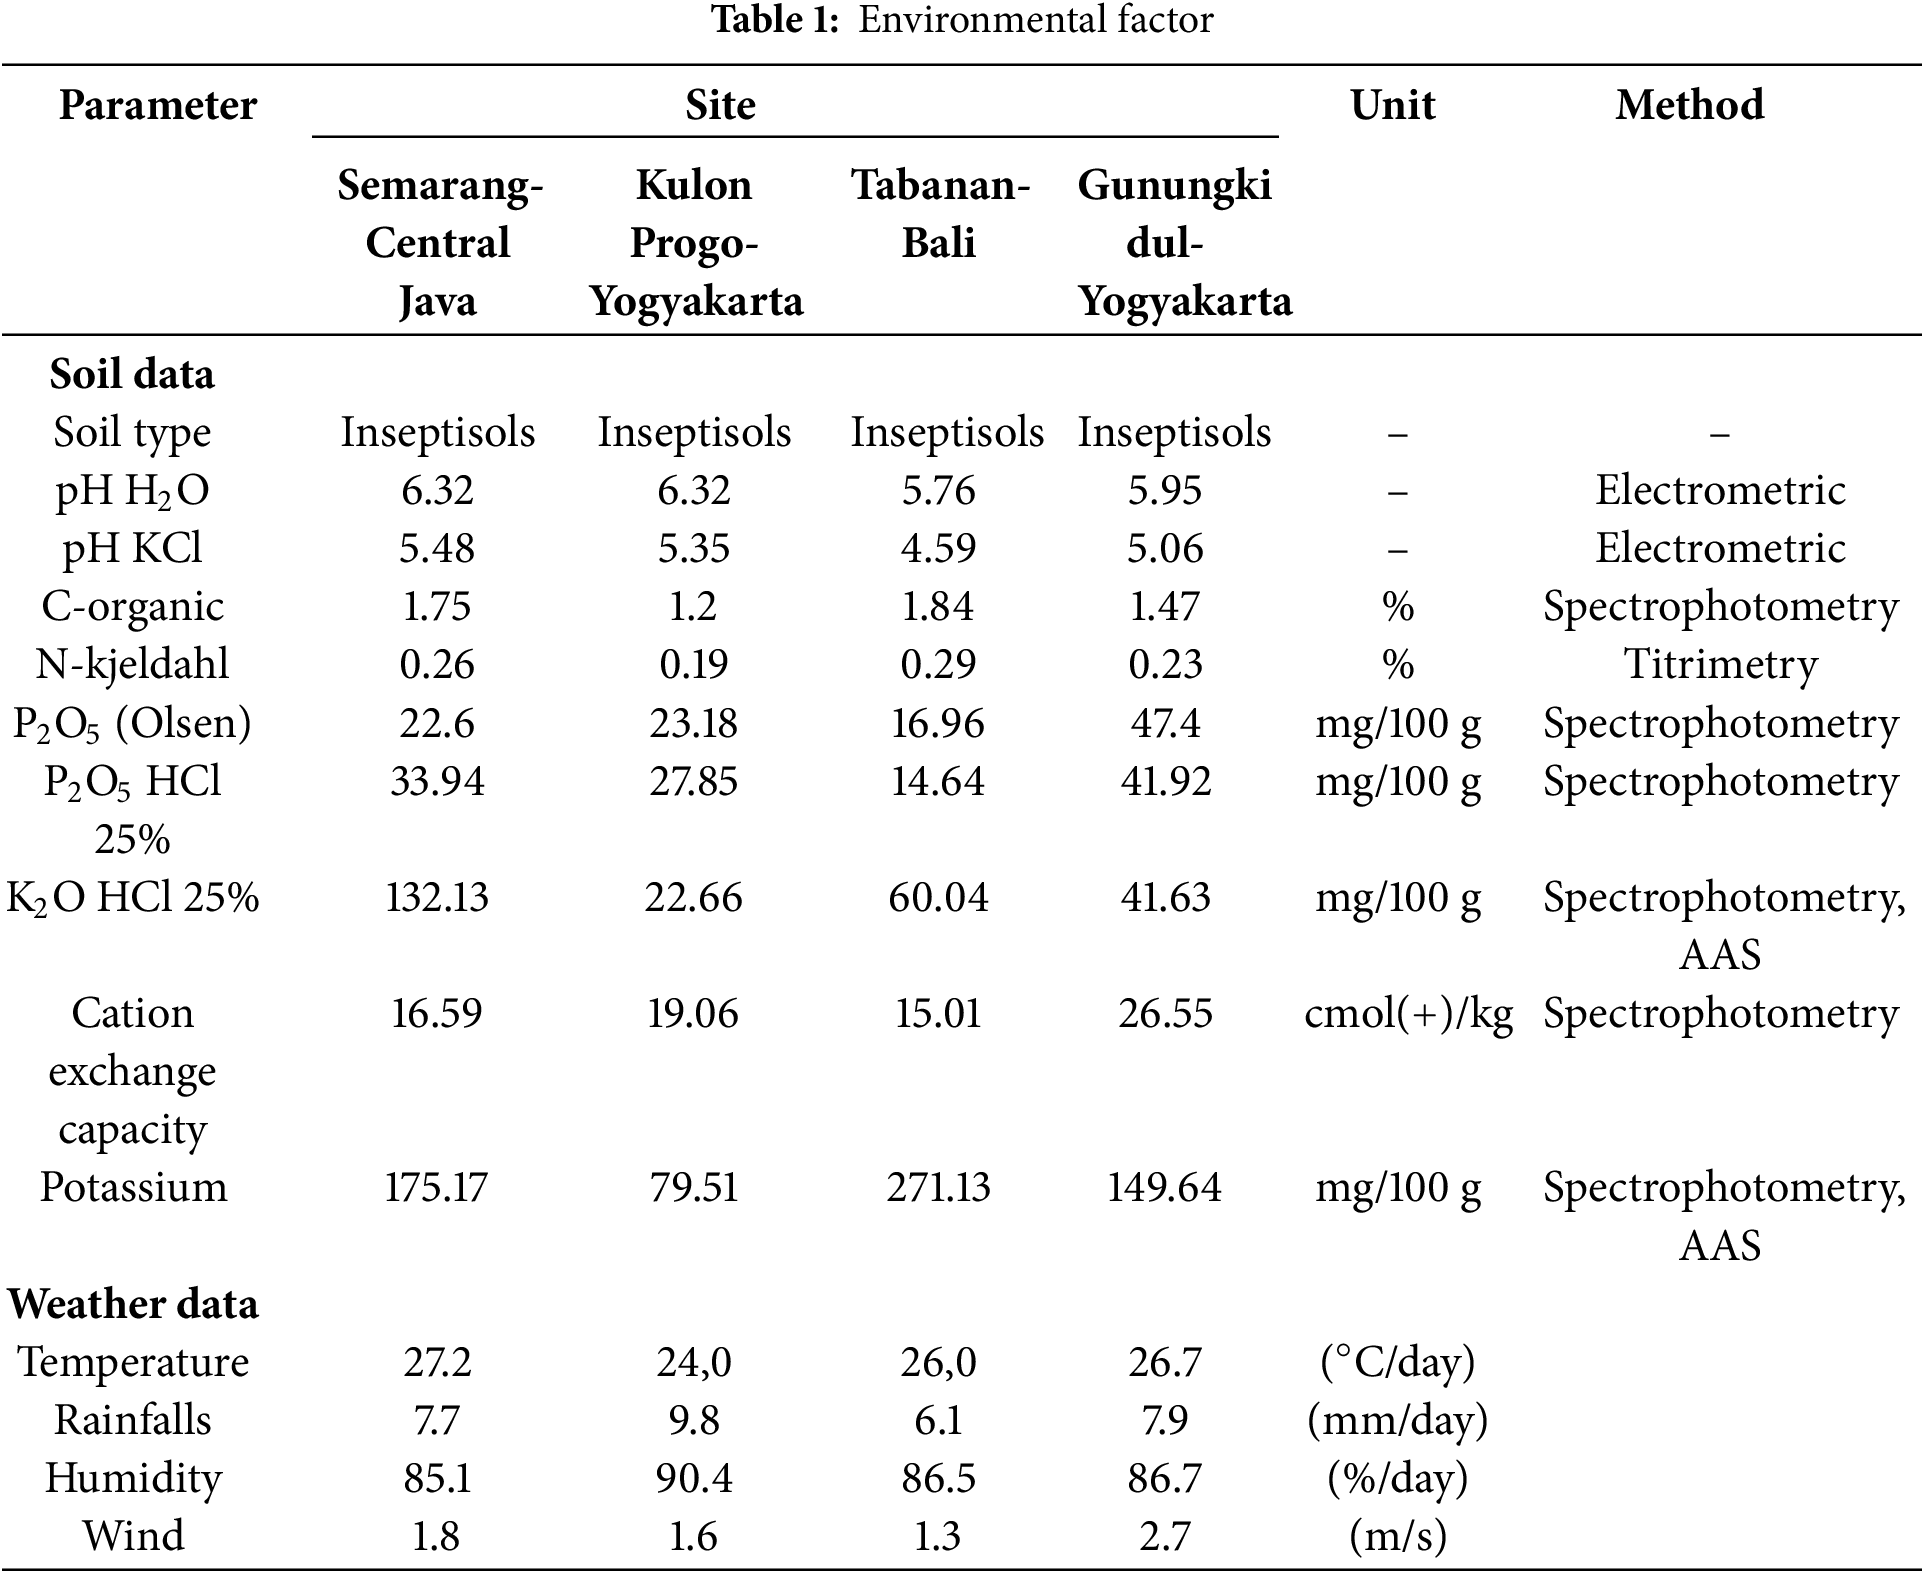
The spectrophotometry method indicated that the C-organic content was low. The N-Kjeldahl content with the titrimetry method in Semarang, Tabanan, and Gunungkidul was moderate, except in Kulon Progo, it was low. Total phosphorus (P2O5/Olsen) varied from very low in Tabanan (16.96 mg/100 g), moderate in Semarang (22.60 mg/100 g) and Kulon Progo (23.18 mg/100 g), and highest in Gunungkidul (47.40 mg/100 g). The phosphorus available (P2O5 HCl 25%) in all locations was very high. The total potassium (K2O HCl 25%) element varied, with very high levels in Semarang (132.13 mg/100 g) and Tabanan (60.04 mg/100 g), high in Gunungkidul (41.63 mg/100 g), and low in Kulon Progo (22.66 mg/100 g). The highest cation exchange capacity was in the land in Gunungkidul, and the lowest was in Tabanan. Potassium availability was a critical trait that needed to be known and was a very high criterion in all zones (Table 1).
Rice yield performance at four sites in Indonesia indicates different characteristics of daily weather data. Climate data was recorded during rice growing in each field. The study in Kulon Progo indicated that daily air temperature (24°C) was the lowest compared to other locations. The highest rainfalls per year were in Kulon Progo (9.8 mm/day), followed by Gunungkidul (7.9 mm/day), Semarang (7.7 mm/day), and Tabanan (6.1 mm/day). The relative humidity in each site was almost similar at more than 80% per day, ranging from 85.1%/day in Semarang to 90.4%/day in Kulon Progo. The swiftest wind speed for rice season was found in Gunungkidul (2.7 m/s) (Table 1).
The research from February to June 2024 dealt with Oryza sativa L. Consistently across four sites simultaneously, it studied ten rice genotypes, i.e., six lines and four varieties. The study tested six new lines (G2, G3, G4, G5, G9, and G10) and four varieties (Situ Bagendit, Gamagora7, Inpari IRNutri Zinc, and Inpago12 Agritan as control) in a multi-location scheme across islands in Indonesia.
The new rice lines were advanced breeding generations with stable properties. The six lines and variety of Gamagora7 were from the collection of Universitas Gadjah Mada. The varieties (Situ Bagendit, Inpari IRNutri Zinc, and Inpago12 Agritan) were varieties owned by the Ministry of Agriculture. Lines performed the best characterization and preference programs, including yield potential, stability, pest, and disease resistance [15].
The study was on the genotypes’ performance in the four fields of Indonesian farmers (Semarang-Central Java; Kulon Progo-Yogyakarta; Tabanan-Bali, and Gunungkidul-Yogyakarta). The research was conducted with three replications in each region with a randomized complete block design. Rice seeds grow in the nursery and were transplanted 15 days after sowing in the field. The rice plants have two per hole at 0.2 and 0.2 m. Plot size was 6 m × 4 m, with a spacing of 0.5 m.
There was no irrigation treatment in this study. Each soil was added 10 t/ha of organic fertilizer before planting. Nitrogen (N) fertilizer (138 kg/ha) was given one and eight weeks after planting. Phosphate (P2O5) fertilizer (15 kg/ha) and potassium (K) fertilizer (22.5 kg/ha) were applied one week after planting. Rice was grown following a standard agronomical practice [16].
2.3 Data Collection and Analysis
The study involved 203 female and male farmers (who represented distinct family socio-economic clusters) from four regions in Indonesia: Semarang-Central Java, Kulon Progo-Yogyakarta, Tabanan-Bali, and Gunungkidul-Yogyakarta. Respondents using purposive random sampling were cooperative, interested in participating, and had prior knowledge and awareness of the importance of recognizing rice attributes. The research captured major preferred traits using structured questionnaires.
Calculating farmers’ preferences was important for identifying superior genotype performance in the breeding system. Farmer involvement in evaluating rice genotype performance was achieved using the multidimensional scaling (MDS) analysis method based on Rapid Appraisal (RAP). The RAP method was developed for rapid assessment by considering multidimensional aspects. The principles of RAP include (1) rapid assessment of object status based on relevant attributes, such as panicle type as an indicator of rice genotype performance; (2) flexibility of attributes that can be adjusted to available information, for example, adaptation is the result of evolution over time; and (3) effective decision-making based on MDS scale analysis [17].
Analysis of rice genotype performance using the MDS approach through several stages, namely: (1) Attribute Determination: This stage includes identification of attributes used to assess rice genotype performance, for example disease resistance, leaf character, and environmental resilience; (2) Attribute Assessment: Each attribute was evaluated using an ordinal scale according to applicable norms. MDS-based ordination analysis to determine the relationship between attributes on various performance dimensions, for example disease resistance, leaf character, and environmental resilience; (3) Compilation of performance index: After the MDS analysis was carried out, a rice seed variety performance index can be compiled that includes performance status in each dimension and identification of attributes that were most influential or sensitive to variety performance [18].
From the results of the MDS analysis, two main outputs were obtained: (1) the index of genotype performance in each footage studied, and (2) leverage attributes or sensitive attributes, the attributes that most influence the performance of rice genotype in each dimension.
Farmers’ preferences for rice traits were analyzed farmers’ average attribute levels of all genotypes. The goodness of the MDS fit model was measured by the S-Stress and R2 values [18]. The model was considered good if the S-Stress mark was less than 0.25 and the R2 value was near 1 [18]. The performance index of rice genotype in this system has a scale between 0 and 100. The index category (ordinal value) and performance status were (1) 0–15 = very-bad; (2) 21–45 = bad; (3) 46–75 = quo, (4) 76–87 = good; and (5) 88–100 = very-good [18].
The field studies also identified the environmental characteristics. The on-farm trial retains the treatments and the replications. The predominant soil classification at each site was established through a composite soil sample collected in a zigzag pattern to a depth of 20 cm before sowing. Soil characteristics were assessed of soil type, pH H2O, pH KCl, C-Organic, N-Kjeldahl, P2O5 (Olsen), P2O5 HCl 25%, K2O HCl 25%, Cation Exchange Capacity, and K. Daily weather data (temperature, rainfalls, humidity, and wind) were recorded during rice growing at each site.
Rice observation techniques were systematically applied in all populations. Data collection was based on the rice descriptors. The yield sample extrapolates to a hectare from two growing seasons [19].
The farmers assessed rice genotype performance, which refers to aspects that affect farmers’ fields. The indicators used for rice genotype performance include (1) environmental resilience, (2) pest resistance, (3) disease resistance, (4) plant age, (5) productive tillers, (6) panicle type, (7) leaf character, and (8) plant height.
Importance Performance Analysis (IPA) could assign farmers’ stances on genotypes, consider major traits, and consent to excellent outcomes. IPA confirms that genotypes are considered lower-than-expected and genotypes perform higher than the prospect of exceeding or less preferred genotypes [20].
Farmers’ perspectives were reflected in the average IPA-based attribute levels of each genotype. Farmers’ preferences for rice traits were analyzed using IBM SPSS Statistics 26 from the average farmer attribute levels of all genotypes. We performed a statistical analysis of IPA applied to the crosshairs and developed four related quadrants. For average farmer performance and importance scores. IPA was widely used in studies related to customer satisfaction. IPA was present in the field of breeding by exploring farmers’ trait preferences.
IPA finalizes the scale-centered framework by graphing rice characteristics based on their relative performance and importance. IPA uses a scale rating to build a five-point Likert scale to estimate each trait. The IPA grid provides two-dimensional results of performance and importance from each relevant trait, with distinct implications for rice genotype development. The actual scale means performance and importance as hair serves as reference points in the two-dimensional grid construction, delineating the matrix into four quadrants and illustrating the preferred attribute [21].
The rice yield data process was used to understand the main upshot of genotype (G), environment (E), and their interactions. Analyze the data of yield to know the mean per site using Duncan’s Multiple Range Test with α = 0.05, and if the results indicate significant differences. The rice yield data were looked over using the Statistical Analysis System in the PROC GLM and PROC MIXED programs [22].
Rice genotype performance was performed superior rice in four sites to estimate the Genotype and Environment Interaction Biplot (GE biplot analysis). The graph’s visual analysis was used to choose suitable genotypes for each site [23]. Furthermore, rice yield was evaluated using the AEC method to identify and graphically visualize superior genotypes. This characterization contributes to understanding trait relationships and the selection of specific genotypes [24].
The bottom-up programs aimed to understand farmers’ preferences and identify important attributes of rice. The assessment of 203 farmers highlighted preferred rice traits and identified attributes that should be established or discarded to improve genotypes.
The programs involved 203 farmers during the field days across four zones. The equal gender distribution of farmers showed 56% (114 people) as male and 44% (89 farmers) as female. The program includes farmers aged 18 to 76 years. The age breakdown of farmers was <25 years (3%/6 people), 26–40 years (15%/30 people), 41–55 years (48%/97 people), and >55 years (34%/70 people). Over half of the farmers (59%) have an education level of elementary or junior high school. Farmers (37%) completed elementary school, indicating that most have little formal education. In contrast, 23% of farmers graduated from high school, 19% finished junior high, and only a few have reached higher education levels, such as college graduates (10%). The experience distribution of farmers was <5 years (9%/18 people), 6–15 years (18%/36 people), more than 15 years (55%/112 people), and no response (18%/37 people) (Fig. 2).
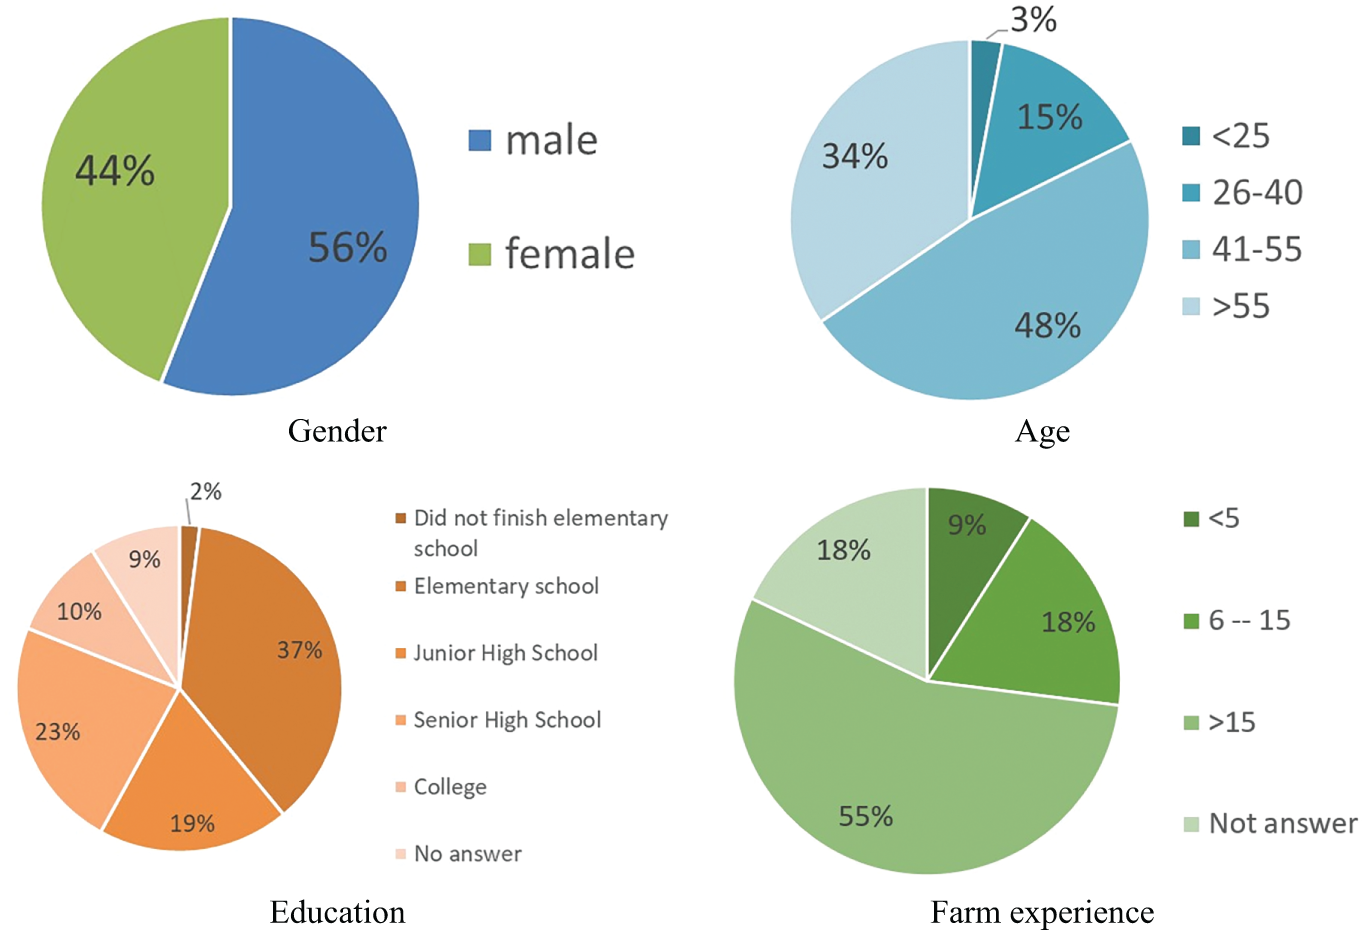
Figure 2: Farmers’ characteristics
In the analysis of rice genotype performance using the MDS approach, dimensions were used to assess the success of the genotype. Rice genotype performance consists of attributes that reflect essential aspects of rice performance in the farmer’s field. This farmer assessment provides a holistic understanding of the quality of rice genotypes. The rice performance produced a value of 78.12, indicating a good category. The feasibility analysis of the model in this dimension showed a stress value of 0.137 and an R2 of 0.962. Thus, the MDS analysis was suitable for use as an evaluation model. This assessment was based on various agronomic indicators related to growing and producing plants. This value illustrates that the genotypes have optimal performance in most indicators assessed (Fig. 3).
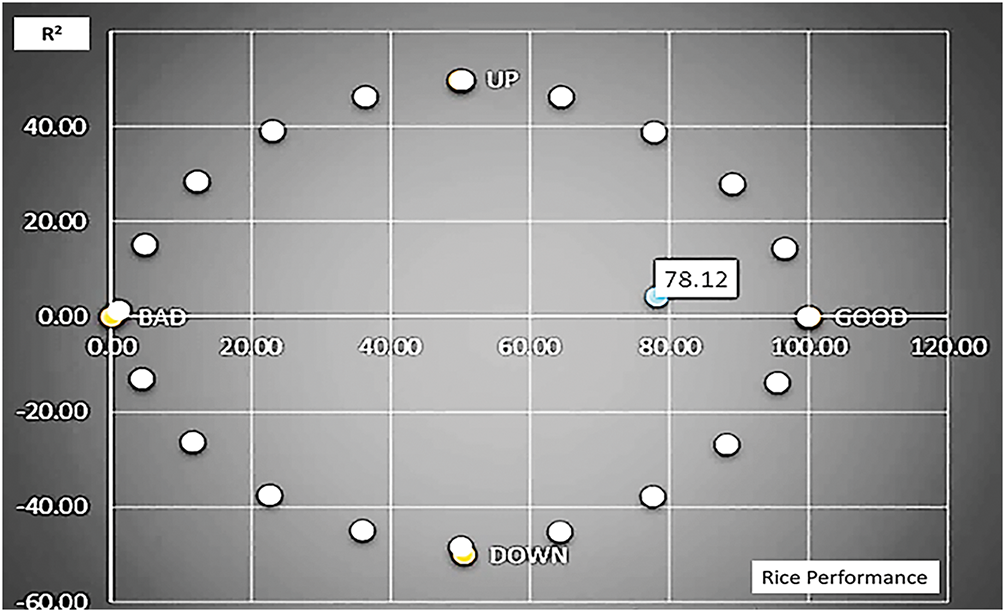
Figure 3: Rice genotype performance
Based on Fig. 4, rice genotype performance indicators include panicle type, with the highest leverage value and sensitivity index of 1.33. Other essential attributes and a leverage value were disease resistance (1.30), leaf characteristics (1.29), and environmental resilience (1.24). Plant height has a sensitivity index of 1.01. Pest resistance has a sensitivity index of 0.20, and plant age has a leverage value of 0.30, meaning the influence on rice performance was relatively small. The attribute with the lowest leverage value and minor influence in this context was productive tillers, with a sensitivity index of 0.09.
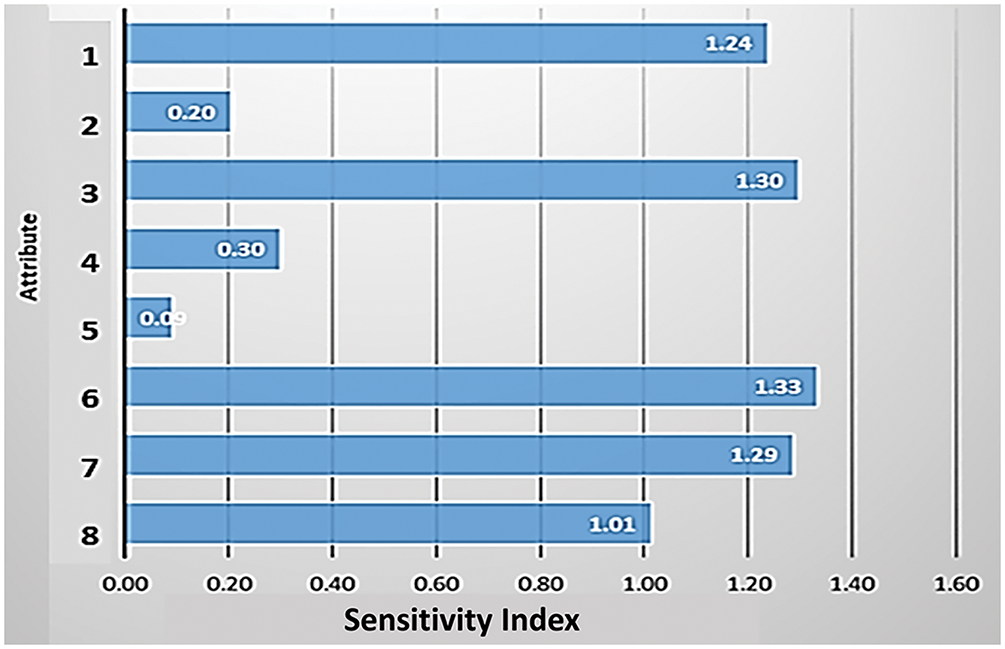
Figure 4: Leverage analysis on rice genotype performance attributes. 1 = environmental resilience; 2 = pest resistance; 3 = disease resistance; 4 = plant age; 5 = productive tillers; 6 = panicle type; 7 = leaf character; and 8 = plant height
The farmers’ preferences were known by valuing preferred rice genotypes in breeding programs by farmers. Research in Semarang-Central Java, Kulon Progo-Yogyakarta, Tabanan-Bali, and Gunungkidul-Yogyakarta showed quadrant I consisting of G3, G9, Situ Bagendit, Inpari IR Nutri Zinc, Gamagora7, G2, and G4. Importance Performance Analysis (IPA) in quadrant I indicated good performance and importance by farmers. Quadrant III accommodates rice with less respect by farmers from the four sites. Three genotypes in quadrant III had poor expectations; their performances were ordinary, and they had lower priority levels. Inpago 12 Agritan, G10, and G5 were associated with this part and have high performance but do not require development (Fig. 5).
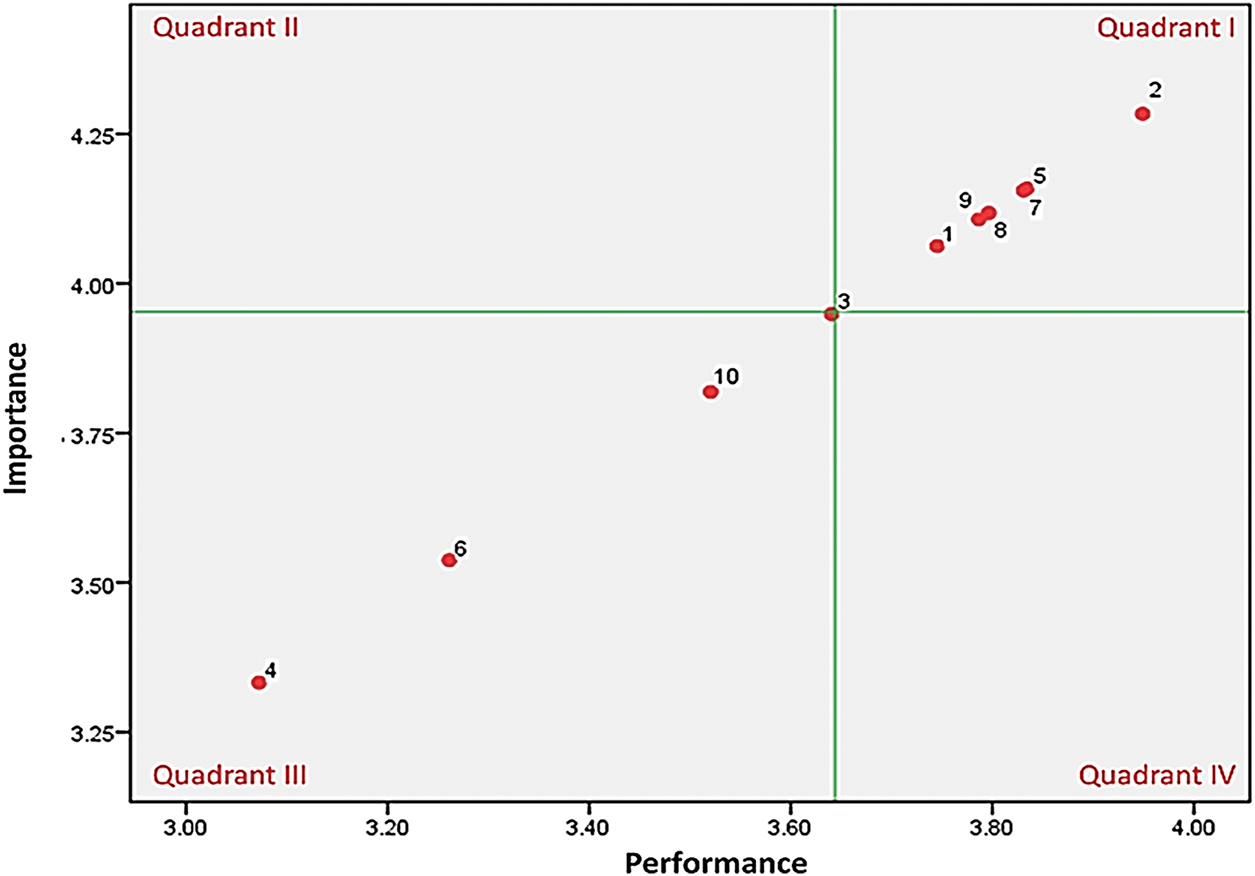
Figure 5: IPA for yield. Genotype 1 = G2, 2 = G3, 3 = G4, 4 = G5, 5 = G9, 6 = G10, 7 = Situ Bagendit, 8 = Gamagora7, 9 = Inpari IRNutri Zinc, (10) = Inpago12 Agritan
The field studies were conducted simultaneously at four sites. Observing the morphology of genotypes by breeders aims to find genetic diversity, superior genotypes, and rice improvement in breeding programs. Rice yield was an essential characteristic. The rice season at Semarang produces a yield of G4 (5.2 t/ha) as the best line, but under Inpari IR Nutri Zinc (6.5 t/ha). Rice productivity in Kulon Progo indicated G3 being the optimal yield (7.3 t/ha), followed by G5 (6.5 t/ha) and G2 (5.8 t/ha) as the best favorable genotypes that can be developed into legal varieties. Tabanan has the best potential rice harvest at line G3 (6.2 t/ha) and the lowest of Inpago 12 Agritan (3.4 t/ha). The yield in Gunungkidul has not indicated optimal results because of drought in this area. Lines G1 and G2 were still the hope for harvest in critical conditions in Gunungkidul. Kulon Progo’s productivity (5.5 t/ha) was the maximum yield in four marginal locations. The promising rice lines have a diverse mean yield. Lines G3 (5.2 t/ha), G4 (4.7 t/ha), and G2 (4.5 t/ha) showed a potential yield in multi-site but still need to be genetically developed to be more optimal compared to Inpari IR Nutri Zinc (5.3 t/ha). The multi-location test was an essential breeding step and determined the rice genotype’s suitability for adaptation (Fig. 6).
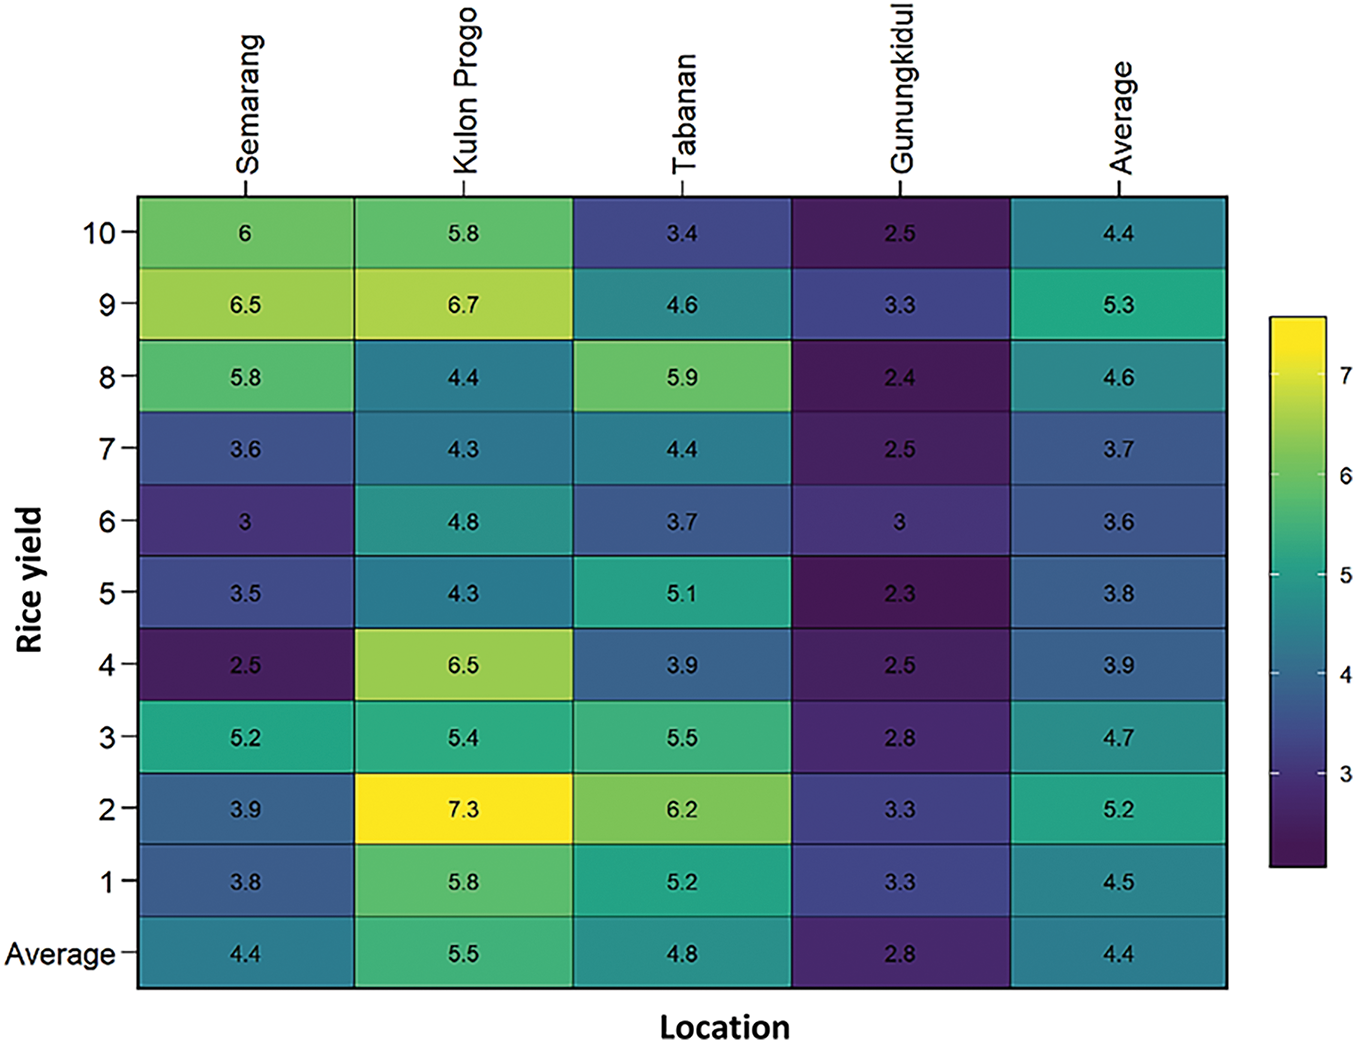
Figure 6: Rice yield performance (t/ha). 1 = G2, 2 = G3, 3 = G4, 4 = G5, 5 = G9, 6 = G10, 7 = Situ Bagendit, 8 = Gamagora7, 9 = Inpari IRNutri Zinc, 10 = Inpago12 Agritan
The GLM procedure indicated that the rice yield distribution was simultaneously tested at four sites. Tukey’s studentized range test for yield with alpha 0.05. Rice yield per location was acquired from 10 genotypes in three replicate populations tested at each site (30 rice yields). The potential yield of genotypes in four sites covers Kulon Progo (5.52 t/ha), Tabanan (4.81 t/ha), Semarang (4.37 t/ha), and Gunungkidul (2.81 t/ha). The highest line yield in the four sites was obtained by G3 (5.18 t/ha), G4 (4.74 t/ha), and G2 (4.53 t/ha). The high average yield during the study by Inpari IR Nutri Zinc 5.23 t/ha. Unfortunately, the yield of G10 was just 3.65 t/ha, the lowest in the rice season (Fig. 7).
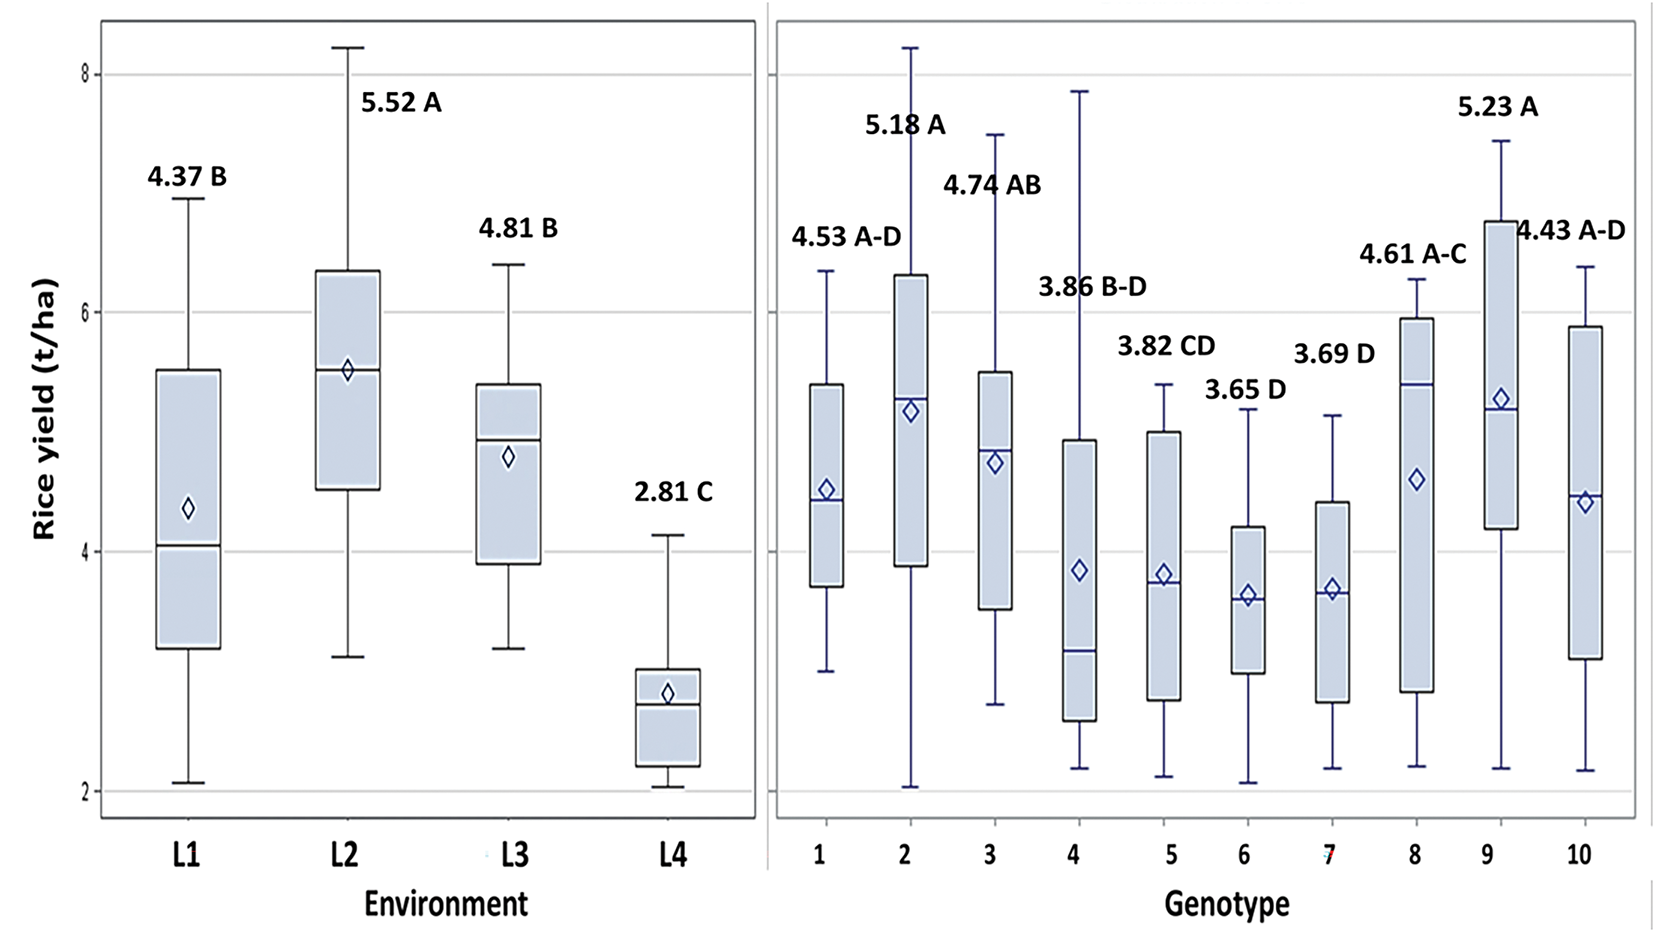
Figure 7: Rice yield distribution. Environment: L1 = Semarang; L2 = Kulon Progo; L3 = Tabanan; L4 = Gunungkidul; Genotype: 1 = G2, 2 = G3, 3 = G4, 4 = G5, 5 = G9, 6 = G10, 7 = Situ Bagendit, 8 = Gamagora7, 9 = InpariIR Nutri Zinc, 10 = Inpago12 Agritan
Genotype-Environment (GE) biplot analysis estimates the relationship and the genotype potential yield association with stability in the environment. GE biplot modified joint regression analysis on yield variations of 10 genotypes in four sites showed a significant (α < 0.05). Research indicated that G3 and Inpari IR Nutri Zinc have the highest yield and stability. G2 and G5 need a touch of improvement to increase their yield potential. Overall, Situ Bagendit, G9, and G10 hold the lowest yield and need genetic upgrades. Kulon Progo, Tabanan, and Gunungkidul were locations with significant yield optimum; Semarang had the lowest yield (Fig. 8a).
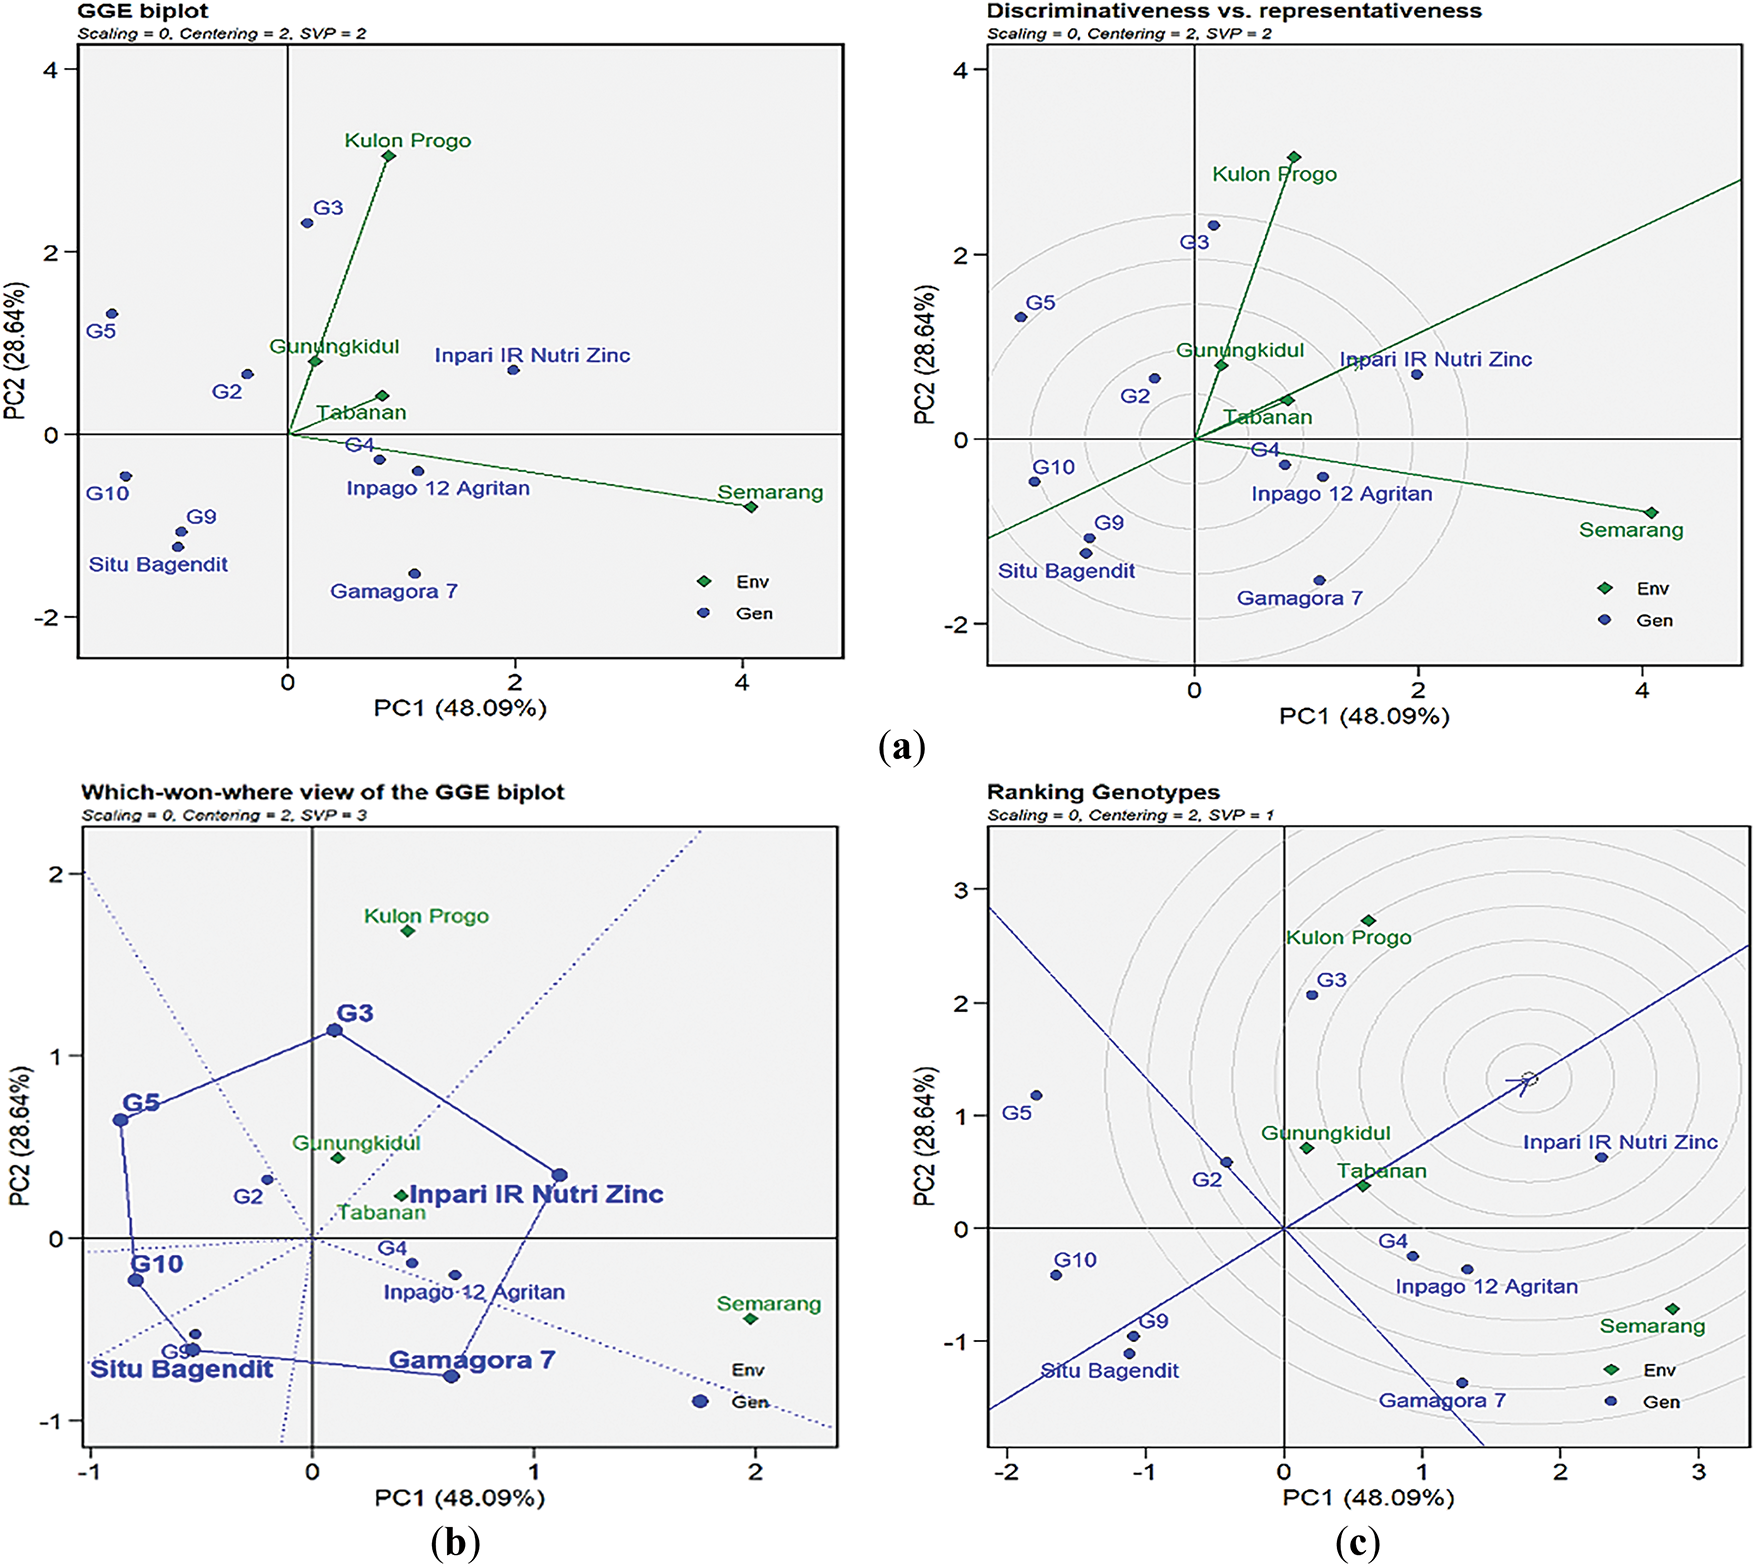
Figure 8: (a) GE biplot of six lines and four varieties; (b) The GE biplot polygon’s which-won-where pattern; (c) GE biplot built upon genotype-focused scaling
GE biplot polygon showed the diversity of total Eigenvalues at the principal components one (PC1) and two (PC2). The PC1 and PC2 clarify the diverse original data with a scatter plot of 76.73%. GE biplot polygon of the genotype and the environment indicated PC1 as the primary and PC2 as the secondary upshot of singular value decomposition rice yield data that was environment-centered. The study recommended genotypes from the GE biplot analysis. The yield indicated interaction, genotype, and site as highly significant factors. Line G3 was appropriate for growth in Kulon Progo and Gunungkidul. Inpari IR Nutri Zinc fit for Semarang and Tabanan. The study showed Kulon Progo, Gunungkidul, Tabanan, and Semarang in different sectors of the convex hull. Within the convex hull was the rice genotype vertex; it will form a polygon if connected with distance biplot points (Fig. 8b).
The ideal genotype was described as having a considerable PC1 value (high yield) and a small PC2 value (high stability). The first concentric circle in a graph shows the ideal genotype. The second concentric circle indicates the desired genotype. Rice genotypes in the third and further concentric circles possess poor yields. The superior lines did not truly exist in this study. Inpari IR Nutri Zinc and G3, Inpago 12 Agritan, G4, and G2 represent almost fair-wanted traits. Rice G3, G4, and G2 were recommended lines (Fig. 8c).
The Average Environment Coordination indicated the rice genotypes’ stability. The Genotype Environment Interaction effect would be more significant if the lines’ vector distances from the biplot’s origin were farther apart, which would decrease stability. Genotypes had high or low yields if the ordinate was divided. The study revealed that lines G3, G4, and G2 had the highest yield and were stable in numerous sites. Although the influence of variety Inpari IRNutri Zinc, Inpago12 Agritan, and Gamagora7 still compete with the promising lines (Fig. 9).
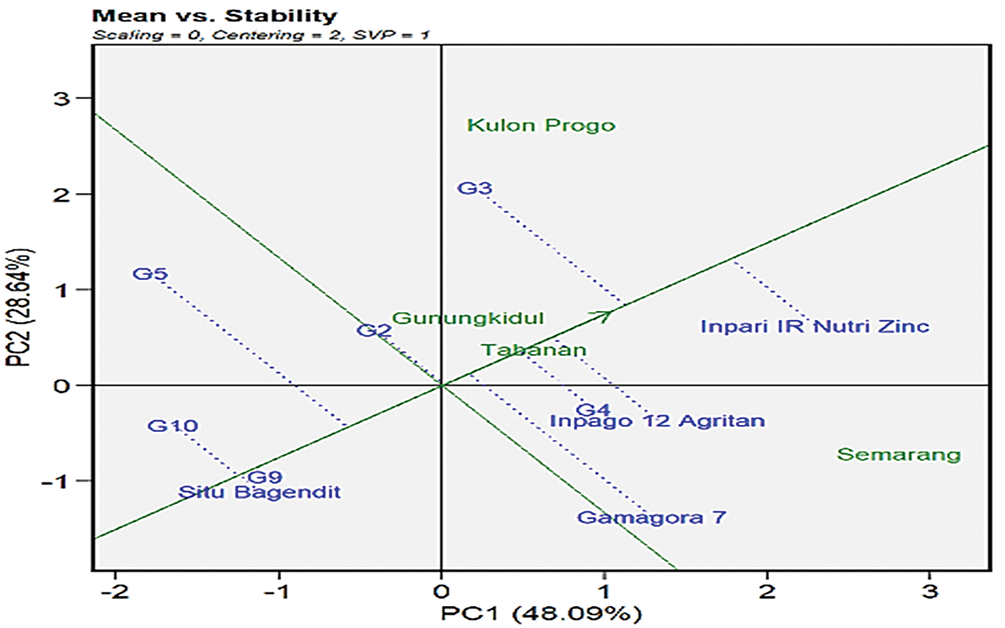
Figure 9: Average environment coordination
The GLM Procedure was used to determine the interaction between the site and rice genotype. The analysis of 40 treatments was 4 locations, 10 genotypes, and 3 replications. Tukey’s Studentized Range test for yield indicated a significant difference at Alpha 0.05. Tukey grouping showed that the interactions that obtained the highest yield were line G3 in Kulon Progo (7.3 t/ha), G5 in Kulon Progo (6.5 t/ha), and G3 in Tabanan (6.3 t/ha). The interactions that produced suboptimal yields were Inpago12 Agritan (2.5 t/ha), Gamagora7 (2.4 t/ha), and G9 (2.3 t/ha), all three planted in Gunungkidul (Fig. 10).
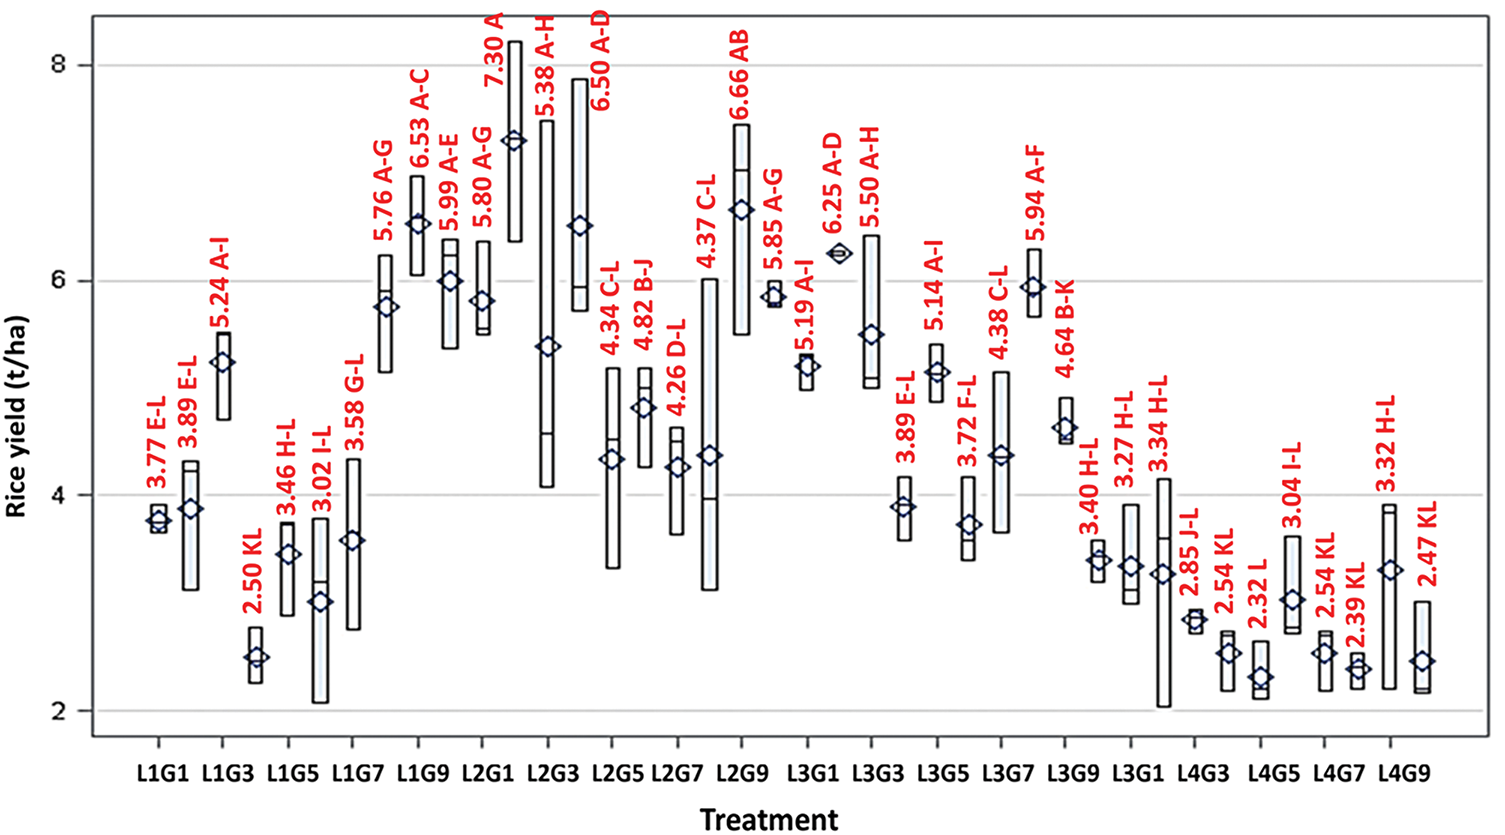
Figure 10: Yield distribution. Treatment L1 = Semarang; L2 = Kulon Progo; L3 = Tabanan; L4 = Gunungkidul; G1 = G2, G2 = G3, G3 = G4, G4 = G5, G5 = G9, G6 = G10, G7 = Situ Bagendit, G8 = Gamagora7, G9 = Inpari IRNutri Zinc, G10 = Inpago12 Agritan
Indonesia has the most potential area for world rice production. However, the released rice genotypes have not involved farmers in selecting promising lines in their fields and overcoming limitations in the specific environment. The increasing need for food was also inversely proportional to the expansion of unproductive land. Potassium was needed to grow and produce high yields in relatively infertile areas with limited water and low inputs. Limited knowledge of farmers requires synergy with breeders in a participatory manner in local agroecosystems.
Rice genotypes were tested in rainfed land to identify appropriate and farmer-preferred genotypes under the participatory breeding program. This scheme aims to identify farmers’ preferences for rice traits within their local conditions and breeders jointly with farmers to determine the best-performing genotypes.
Participatory approaches were needed to address the varietal knowledge of small-scale farmers in agroecological contexts. Participatory approaches using local wisdom can accelerate breeding research, farmer empowerment, line acceptance, increase local adaptation, and promote quality genetic diversity [25].
The farmers came from diverse ages, education, farming experiences, field areas, and present farmers’ preferences. The characteristics diversity between male and female farmers was expected to describe the rice genotypes’ needs. The farmer’s proportion by gender, with a percentage of men of 56% (114 people) and women of 44% (89 people). This illustrates that although men dominate the agricultural sector, women also have a significant role in activities. Gender equality was an important issue in sustainable development efforts. Overall, agriculture can be improved by giving women more influence in this area, both in decision-making and gaining access to resources like land and breeding.
The study indicated that farmers were in the 41–55 age range, which covers almost half of the total farmer population (48%). This age distribution indicates several vital trends in the agricultural sector. The dominance of the 41–55 and >55 age groups among farmers in Indonesia was mostly middle to old age. There were challenges related to the regeneration of young farmers because only 3% were under 25. Farmers aged 26–40 reached 15%, indicating that the productive age group was still involved in agriculture. In the future, maintaining young farmers’ participation in agriculture will be challenging.
Gender parity among farmers can improve the agricultural industry. Breeding participants’ age concerns impact the selection of rice traits. Younger farmers have the option to spend money on improved new genotypes. The farmers’ education was another intervention in the new genotype promotion. Situations on farms necessitated real choices and revealed farmers’ preferences regarding the acceptability of the new genotypes [26].
The agricultural sector was still dominated by farmers with limited access to higher formal education; most farmers had low educational backgrounds (37% had only completed elementary school). In addition, just 19% of farmers had completed junior high school, and 23% had completed high school. College graduates (10%) were a small part of the farming population. The small number of farmers who receive advanced formal education can influence the management of their farms and understand information related to innovations that increase productivity. Efforts to improve the level of education among farmers were essential and helped increase farmers’ capacity to face challenges in the agricultural sector.
Nine percent of all farmers have fewer than five years of experience. This group represents farmers who have just started their farming business and are still in the adaptation stage in facing challenges in the agricultural sector. Furthermore, farmers with 6 to 15 years of experience (18%) were familiar with various farming techniques. Farmers with more than 15 years of experience (55%) have extensive experience in farming and can manage agriculture based on local knowledge.
Decentralized breeding involves setting goals for farmers’ preferences in rice traits. The participatory program was effective in appraising acceptable traits and supplementing breeders’ observations. Preferences were established from a set of rice traits notable and valued by farmers. The characteristics were essential to determine the farmers’ willingness to select and grow new genotypes based on visual observation [27].
The multidimensional scaling (MDS) analysis was one of the prospective models used to determine the dominant variables that affect the system in a participatory breeding program. This prospective analysis method was designed to find dominant variables in rice performance by involving the perspectives of experts who provide fast results. MDS was very suitable for many stakeholders interacting in a complex system. In this study, experts were represented by farmers who use rice genotypes [28].
Overall, the rice performance with a score of 78.12 was a good achievement, indicating the tested rice genotype’s performance in the field. This score places it in the good category, which means that this variety can adapt to diverse agricultural conditions regarding plant survival challenges such as pests, diseases, or environmental changes.
Although this score already reflects good performance, conducting a deeper study of the agronomic indicators that form the overall value was essential. Each indicator plays a critical role in crop success, and each component can help identify areas that may require further improvement or development to increase the productivity and resilience of genotypes across farming conditions.
Rice genotype performance refers to aspects that affect the success of planting in farmers’ fields. Indicators of rice genotype performance include panicle type, with the highest leverage value and sensitivity index of 1.33. Panicle type was a critical factor that greatly influenced the success of genotypes in the field. The ideal panicle type was usually related to the structure and shape of the panicle. A good panicle supports efficient pollination and grain filling, influences the capacity of the plant to produce optimal grain, and supports the harvest. Therefore, genotypes with optimal panicle types tend to perform better.
Another vital attribute was disease resistance, which has a leverage value of 1.30. This indicates that genotype disease resistance was a critical factor in overall performance. Plant diseases cause damage to rice yields, such as leaf blights and bacterial leaf blight. Therefore, disease resistance will provide a more stable and consistent genotype harvest. This was important to consider, especially in areas often hit by plant diseases. Furthermore, leaf characteristics have a sensitivity index of 1.29, indicating that leaf condition and quality also significantly affect rice performance. Healthy leaves play a role in efficiently capturing light for photosynthesis and optimal plant growth. Leaves that are efficient in capturing light and photosynthesis allow plants to grow stronger, produce more productive tillers, and ultimately contribute to crop yields.
Environmental resilience also has a significant influence on leverage value (1.24). This attribute indicates the ability of the rice genotype to survive in challenging environmental conditions, such as drought or flooding. Resilience to uncertain conditions was becoming increasingly important amid ongoing climate change. Rice resistance to extreme environmental conditions, such as drought or waterlogging, was an indicator of genotypes’ tolerance to climate change and productivity across multiple growing seasons.
Plant height has a sensitivity index of 1.01. Ideal plant height was essential in optimizing plant efficiency in absorbing light and increasing the physical stability of plants against adverse weather conditions. Plants that are too tall collapse and reduce yields. Optimal plant height helps maintain balanced productivity. On the other hand, several attributes have lower leverage values, indicating that their impact on rice performance was not as great. Pest resistance has a sensitivity index of 0.20, indicating that pest resistance does not influence. This may be because pests such as brown planthoppers were not a significant threat at the study site.
Plant age has a leverage value of 0.30, meaning the influence on rice performance was also relatively small. Although plant age was important for determining cropping patterns on the same land per year, in this analysis, plant age was not crucial in overall yields. Variation in rice age from planting to harvest among genotypes may not be very diverse or a significant determinant in field conditions.
The attribute with the lowest leverage value was productive tillers, with a sensitivity index of 0.09. Leverage analysis showed that the number of productive tillers does not play a main role in determining genotype performance in this analysis. This low number of new shoots growing from the plant value may indicate that the variation in tillers, among other factors, plays a more significant role in plant growth.
The consistent farmers’ rice major preferred traits during the four sites were an opportunity to improve the breeding program and understand farmers’ preferences. The most preferred by farmers with high morphological performance, and had a chance to be commercial rice.
Participatory breeding assessed rice performance by farmers’ preferences for rice traits and prospecting for suitable genotypes on specific sites. The program approach considers the consumer while evaluating and promoting new genotypes. Farmers have criteria and concerns when adopting a new rice variety [29].
Breeders promote new genotypes that meet farmers’ needs, especially the traits that support diversity. The participatory strategy diffuses new lines. This effort can intensify the acceptance of superior genotypes, and farmers can continue to plant their selected rice. The improved lines performed well in terms of agronomics, and acceptance by farmers was considered important in agriculture [26].
Participatory breeding was a solution to identify rice lines that suit farmers’ needs in farmers’ fields. Participatory selection in rainfed areas offers a solution for rice adaptability in target locations and the suitability of user preferences to meet food needs. Sustainable agriculture programs are more efficient through farmer participation, especially young farmers and women [30].
The best-performing rice lines co-chosen by farmers and breeders ultimately increase yield in rice areas and ensure a variety of acceptance and a greater likelihood for farmers. The participatory program can compare the genotypes’ ranking across sites and link it with the Genotype Environment Interaction in the farmers’ fields. Breeders improve genotypes to meet consumer needs. Participatory programs determine underperforming rice attributes that must be maintained to enhance performance and farmer satisfaction.
The bottom-up program was to understand farmers’ preferences for rice. The 203 farmers’ assessment showed the Importance of Performance Analysis (IPA) for preferred rice in four quadrants. IPA reflected the farmers’ preferences to find rice that must be established. According to stakeholders, the mapping IPA in quadrant I in four sites performs lines G3, G9, G2, and G4 as the most essential and preferred rice. The four lines have good performance priority, and farmers expect these genotypes.
Rice genotypes’ yield performance and stability estimates, GE biplot, and AEC methods. These analyses indicated that lines G3, G4, and G2 were a broader adaptation in marginal multi-site, high potential yield, and stability. The GE biplot analysis indicates genotypes’ adaptability and suitability.
Five sectors were produced by the GE biplot. Two areas accommodate the site, and the rest areas do not load the site. Genotype Environment Interaction was essential in rice breeding, providing diversity between genotypes at certain sites [31]. The ideal lines were not found in the research. The assessment showed G3, G4, and G2 performing desired traits and as reference genotypes. These three lines can be further developed to be closer to the potency of IR Nutri Zinc, which has almost all the desired traits.
The GE biplot concludes the best compliance genotype in each environment. Each vertex describes the genotypes’ stability in all sites and provides a high yield. Each site’s rice genotype ability was indicated by the interplay between genotype and environment [32].
This work has important practical implications for farmers, particularly climate change adaptation and sustainable agriculture. The identified genotypes, G2, G3, and G4, were promising alternatives for enhancing production on rainfed land, frequently marked by water scarcity and poor soil conditions. Farmers who use these genotypes can improve their resilience to drought and other climate problems while still practicing sustainable agriculture. This participatory breeding strategy empowers farmers by including their preferences in the breeding process, but also increases genetic diversity and promotes long-term agricultural sustainability.
The release and dissemination of lines should be tuned according to the results obtained in multi-location and multi-season experiments. The AEC ordinate explains the genotypes’ stability. Stable genotypes can have wide adaptation and performance over seasons and zones. The rice genotype with high diversity in one site does not necessarily perform well in another. The GE biplot-focused scaling was also described as the ideal genotype. Lines G3, G4, and G2 have the nearest distance from the biplot point, are stable, and have the highest yields in various sites.
The participatory, multi-location tests can speed up the best-performing genotypes. Decentralization preferences were created from attributes by farmers to focus breeders’ work. The highlighted rice traits considered by farming households, combined with scientists’ perspectives, could complement breeding programs. The knowledge from scientific studies following the bottom-up perspective could suggest solutions to identify specific adaptation and rice yield constraints.
Rainfed land has limited water and poor soil structure, inhibiting rice roots’ absorption of water and nutrients. This can reduce root growth, nutrient absorption, and plant productivity [33]. Genotypes that grow and produce well in rainfed land were a solution for national rice development.
Initial studies in agroforestry system land revealed that 15 superior rice cultivars, including the lines used in this experiment, had high stability and productivity. Genotype Environment Interaction revealed the highest yield of 6.5 t/ha and was classified as a stable cultivar. Studies in rice fields showed the production capacity of 15 rice genotypes, including those used in this study, had an average production of 7.2 t/ha to 10.6 t/ha with stable properties and were resistant to major rice pests and diseases [19].
Evaluation of Oryza sativa L. morphological characteristics increases the efficiency of agricultural programs. Quantitative and qualitative patterns reveal phenotypic information that has the potential to be developed in specific areas. The decentralized model can understand the main phenotype appearance and the most preferred rice traits from farmers and provide recommendations for improving lines [34].
Participatory describes farmer-selected rice lines with high and stable yields. According to farmers’ perspectives, the effectiveness of participatory rice breeding was explained through Important Performance Analysis [35]. Participatory research was useful for obtaining information on farmers’ preferences and the suitability of rice in farmers’ fields. Sustainable agriculture requires farmers’ active participation in selecting rice lines. Investment in specifically adapted cultivars in unfavorable conditions due to limitations in the growing environment.
The participatory programs combine the farmers’ perspectives and the breeders’ concerns in genotypes with high yield and stability. Farmers’ cultivation in rainfed land focuses on producing food for their families and communities. Rice performance in the feasibility analysis of the multi-dimensional scaling indicated reliability for evaluating the overall performance of genotypes. The leverage analysis key attributes must be considered when assessing rice performance in the field. Panicle type, disease resistance, leaf characteristics, and environmental resilience emerged as the main factors in yield, genotype sustainability, and valuable guidance in rice breeding programs. Importance Performance Analysis and Genotype Environment Interaction indicate genotypes’ preference, adaptability, and suitability. Rice lines G3, G4, and G2 had high farmers’ preferences and potential yields, were stable, and were suitably planted on a wide scale. The decentralization scheme in rainfed land highlighted the farmers’ feedback for their preferred genotypes’ onward use in the breeding program, and enabled them to use proper genotypes for their fields.
Acknowledgement: We are grateful to Jemmy Rinaldi (National Research and Innovation Agency/BRIN), the farmers’ community, and the Local Government in Semarang-Central Java, Kulon Progo-Yogyakarta, Tabanan-Bali, and Gunungkidul-Yogyakarta.
Funding Statement: The study was funded by the Research Organization for Agricultural and Food, the National Research and Innovation Agency (BRIN), and Universitas Gadjah Mada.
Author Contributions: Conceptualization and methodology: Vina Eka Aristya, Taryono; data collection and writing draft preparation: Vina Eka Aristya, Sri Minarsih, Kristamtini, I Gusti Komang Dana Arsana, Samijan, Setyorini Widyayanti, Sodiq Jauhari, Arif Susila, Ni Wayan Trisnawati, I Ketut Mahaputra, I Nyoman Suyasa, Opik Mahendra, Taryono; software and formal analysis: Vina Eka Aristya, Supriyanta, Gilang Wirakusuma, Taufan Alam. All authors reviewed the results and approved the final version of the manuscript.
Availability of Data and Materials: The data used in this study can be accessed by contacting the corresponding author upon request.
Ethics Approval: Not applicable.
Conflicts of Interest: The authors declare no conflicts of interest to report regarding the present study.
References
1. Lesmayati S, Ningsih RD, Noor A, Qomariah R, Napisah K, Amin M. Adaptation and farmer’s preferences on rice and steamed rice quality of several varieties in Tidal Swampland (case study in Sei Jangkit Village, Central Kalimantan). IOP Conf Ser Earth Environ Sci. 2023;1230(1):012202. doi:10.1088/1755-1315/1230/1/012202. [Google Scholar] [CrossRef]
2. FAO (Food and Agriculture Organization). Achieving food security in the face of climate change: summary for policymakers from the Commission on Sustainable Agriculture and Climate Change [Internet]. [cited 2024 Oct 24]. Available from: http://www.fao.org/3/a-i3509e.pdf. [Google Scholar]
3. Keson J, Silalertruksa T, Gheewala SH. Land suitability class and implications to land-water-food nexus: a case of rice cultivation in Thailand. Energy Nexus. 2023;10:100205. doi:10.1016/j.nexus.2023.100205. [Google Scholar] [CrossRef]
4. ArifahA, Salman D, Yassi A, Bahsar-Demmallino E. Climate change impacts and the rice farmers’ responses at irrigated upstream and downstream in Indonesia. Heliyon. 2022;8(12):e11923. doi:10.1016/j.heliyon.2022.e11923. [Google Scholar] [PubMed] [CrossRef]
5. Aristya VE, TaryonoT. Participatory plant breeding to increase the role of superior rice varieties in supporting national food self-sufficiency. Agrotechnol Innov Agrinova. 2019;2(1):26–35. doi:10.22146/agrinova.51985. [Google Scholar] [CrossRef]
6. Fatondji BY, Adoukonou-Sagbadja H, Sognigbe N, Gandonou C, Vodouhè RS. Farmers’ preferences for varietal traits, their knowledge and perceptions in traditional management of drought constraints in rice cropping in Benin: implications for rice breeding. J Agric Sci. 2020;12(11):56. doi:10.5539/jas.v12n11p56. [Google Scholar] [CrossRef]
7. Roussy C, Ridier A, Chain K. Farmers’ preferences for diversification crop attributes. In: Proceedings of the 6th EAAE PhD Workshop: Economic Research in Food Agriculture, Environment and Development; 2015 Jun 8–10; Rome, Italy. [Google Scholar]
8. Manzanilla DO, Paris TR, Tatlonghari GT, Tobias AM, Chi TTN, Phuong NT, et al. Social and gender perspectives in rice breeding for submergence tolerance in Southeast Asia. Ex Agric. 2014;50(2):191–215. doi:10.1017/s0014479713000409. [Google Scholar] [CrossRef]
9. de Leon N, Jannink JL, Edwards JW, Kaeppler SM. Introduction to a special issue on genotype by environment interaction. Crop Sci. 2016;56(5):2081–9. doi:10.2135/cropsci2016.07.0002in. [Google Scholar] [CrossRef]
10. Singh DP, Singh AK, Singh A. Participatory plant breeding. In: Singh DP, Singh AK, Singh A, editors. Plant breeding and cultivar development. London, UK: Academic Press; 2021. p. 483–95. doi:10.1016/b978-0-12-817563-7.00013-1. [Google Scholar] [CrossRef]
11. Xu FF, Tang FF, Shao YF, Chen YL, Tong C, Bao JS. Genotype × environment interactions for agronomic traits of rice revealed by association mapping. Rice Sci. 2014;21(3):133–41. doi:10.1016/S1672-6308(13)60179-1. [Google Scholar] [CrossRef]
12. Sandamal S, Tennakoon A, Wijerathna P, Ge S, Amarasekera D, Marambe B, et al. Phenotypic characterization of Oryza nivara (sharma et shastry) collected from different ecological niches of Sri Lanka. Phyton-Int J Exp Bot. 2022;91(6):1269–87. doi:10.32604/phyton.2022.018983. [Google Scholar] [CrossRef]
13. Al Viandari N, Wihardjaka A, Pulunggono HB, Suwardi S. Sustainable development strategies of rainfed paddy fields in Central Java, Indonesia: a review. Caraka Tani J Sustain Agric. 2022;37(2):275. doi:10.20961/carakatani.v37i2.58242. [Google Scholar] [CrossRef]
14. Sulaiman AA, Candradijaya A, Syakir M. Technological advancement and the economic benefit of Indonesian rain-fed farming development. Adv Agric. 2019;2019:9689037. doi:10.1155/2019/9689037. [Google Scholar] [CrossRef]
15. Aristya VE, Trisyono YA, Mulyo JH, Taryono T. Participatory varietal selection for promising rice lines. Sustainability. 2021;13(12):6856. doi:10.3390/su13126856. [Google Scholar] [CrossRef]
16. IRRI (International Rice Research Institute). Step-by-Step Production [Internet]. [cited 2023 Jan 11]. Available from: http://www.knowledgebank.irri.org/step-by-step-production. [Google Scholar]
17. Pitcher TJ, Preikshot D. Rapfish: a rapid appraisal technique to evaluate the sustainability status of fisheries. Fish Res. 2001;49(3):255–70. doi:10.1016/S0165-7836(00)00205-8. [Google Scholar] [CrossRef]
18. Keith SJ, Boley BB. Importance-performance analysis of local resident greenway users: findings from Three Atlanta BeltLine Neighborhoods. Urban For Urban Green. 2019;44:126426. doi:10.1016/j.ufug.2019.126426. [Google Scholar] [CrossRef]
19. Bioversity International, IRRI, WARDA. Descriptors for wild and cultivated rice (Oryza spp.). Rome, Italy: Bioversity International; 2007. 63 p. [Google Scholar]
20. Malhotra NK, Jain AK, Patil A, Pinson C, Wu L. Consumer cognitive complexity and the dimensionality of multidimensional scaling configurations. In: Malhotra NK, editor. Review of marketing research. Vol. 7. Leeds, UK: Emerald Group Publishing Limited; 2010. p. 199–253. doi:10.1108/s1548-6435(2010)0000007010. [Google Scholar] [CrossRef]
21. Abalo J, Varela J, Manzano V. Importance values for importance-performance analysis: a formula for spreading out values derived from preference rankings. J Bus Res. 2007;60(2):115–21. doi:10.1016/j.jbusres.2006.10.009. [Google Scholar] [CrossRef]
22. SAS Institute Inc. Base SAS® 9.4 procedures guide: statistical procedures. 2nd ed. Cary, NC, USA: SAS Institute Inc; 2013. 558 p. [Google Scholar]
23. Yan W. GGEbiplot [Internet]. [cited 2020 May 7]. Available from: http://www.ggebiplot.com/biplot.html. [Google Scholar]
24. Srivastava AK, Saxena DR, Saabale PR, Raghuvanshi KS, Anandani VP, Singh RK, et al. Delineation of genotype-by-environment interactions for identification and validation of resistant genotypes in chickpea to Fusarium wilt using GGE biplot. Crop Prot. 2021;144:105571. doi:10.1016/j.cropro.2021.105571. [Google Scholar] [CrossRef]
25. Ceccarelli S, Grando S. Participatory plant breeding: who did it, who does it and where? Ex Agric. 2020;56(1):1–11. doi:10.1017/s0014479719000127. [Google Scholar] [CrossRef]
26. Aristya VE, TaryonoT, Trisyono YA, Mulyo JH. Stakeholder preferences on major characteristics of promising rice lines. IOP Conf Ser Earth Environ Sci. 2021;686(1):012056. doi:10.1088/1755-1315/686/1/012056. [Google Scholar] [CrossRef]
27. Ghimire R, Huang WC, Shrestha RB. Factors affecting adoption of improved rice varieties among rural farm households in Central Nepal. Rice Sci. 2015;22(1):35–43. doi:10.1016/j.rsci.2015.05.006. [Google Scholar] [CrossRef]
28. Bourgeois R, Jesus F. Participatory prospective analysis, exploring and anticipating challenges with stakeholders. Bogor, Indonesia: Center for Alleviation of Poverty through Secondary Crops Development in Asia; 2004. 113 p. doi:10.22004/ag.econ.32731. [Google Scholar] [CrossRef]
29. Burman D, Maji B, Singh S, Mandal S, Sarangi SK, Bandyopadhyay BK, et al. Participatory evaluation guides the development and selection of farmers’ preferred rice varieties for salt- and flood-affected coastal deltas of South and Southeast Asia. Field Crops Res. 2018;220:67–77. doi:10.1016/j.fcr.2017.03.009. [Google Scholar] [PubMed] [CrossRef]
30. Bhatta M, Sandro P, Smith MR, Delaney O, Voss-Fels KP, Gutierrez L, et al. Need for speed: manipulating plant growth to accelerate breeding cycles. Curr Opin Plant Biol. 2021;60:101986. doi:10.1016/j.pbi.2020.101986. [Google Scholar] [PubMed] [CrossRef]
31. Al-Daej MI, El-Malky MM, Sattar MN, Rezk AA, Naqqash MN, Al-Khayri JM. Rice (Oryza sativa L.) breeding among hassawi Landrace and Egyptian genotypes for stem borer (Chilo agamemnon L.) resistance and related quantitative traits. Phyton-Int J Exp Bot. 2022;91(9):1905–22. doi:10.32604/phyton.2022.020629. [Google Scholar] [CrossRef]
32. Takai T, Lumanglas P, Simon EV, Arai-Sanoh Y, Asai H, Kobayashi N. Identifying key traits in high-yielding rice cultivars for adaptability to both temperate and tropical environments. Crop J. 2019;7(5):685–93. doi:10.1016/j.cj.2019.06.004. [Google Scholar] [CrossRef]
33. Shafi S, Shafi I, Zaffar A, Zargar SM, Shikari AB, Ranjan A, et al. The resilience of rice under water stress will be driven by better roots: evidence from root phenotyping, physiological, and yield experiments. Plant Stress. 2023;10:100211. doi:10.1016/j.stress.2023.100211. [Google Scholar] [CrossRef]
34. Aristya VE, TaryonoT, Trisyono YA, Mulyo JH. The variability of qualitative traits in promising rice lines. IOP Conf Ser Earth Environ Sci. 2021;686(1):012057. doi:10.1088/1755-1315/686/1/012057. [Google Scholar] [CrossRef]
35. Azzopardi E, Nash R. A critical evaluation of importance-performance analysis. Tour Manag. 2013;35:222–33. doi:10.1016/j.tourman.2012.07.007. [Google Scholar] [CrossRef]
Cite This Article
 Copyright © 2025 The Author(s). Published by Tech Science Press.
This work is licensed under a Creative Commons Attribution 4.0 International License , which permits unrestricted use, distribution, and reproduction in any medium, provided the original work is properly cited.
 Downloads
 Citation Tools