
 Submit a Paper
 Propose a Special lssue
 Open Access
ARTICLE
Comparative Transcriptomic Analysis of a Naturally Found Yellowish Leaf Rehmannia chingii H. L. Li Mutant and Wild Type
1 Beijing Academy of Forestry and Landscape Architecture, Beijing Key Laboratory of Greening Plants Breeding, Beijing, 100102, China
2 Ecological Division, Beijing Construction Engineering Road and Bridge Group Co., Ltd., Beijing, 100032, China
* Corresponding Author: Huali Zhang. Email:
Phyton-International Journal of Experimental Botany 2025, 94(8), 2593-2613. https://doi.org/10.32604/phyton.2025.068133
Received 21 May 2025; Accepted 05 August 2025; Issue published 29 August 2025
 View Full Text
 Download PDF
Abstract
Naturally occurring yellow leaf mutants are an important resource for studying pigment content and biosynthesis, as well as related gene expression. In our ongoing cultivation of Rehmannia chingii H. L. Li, we found an off-type yellow plant. The yellowing started with the new leaves and gradually spread downward until the entire plant exhibited a stable shade of yellow. We studied the differences in the chlorophyll and carotenoid content, carotenoid profile, and transcriptome of this yellow-leaf mutant (P2). Compared to the wild-type R. chingii plant (P1), P2 leaves had significantly lower chlorophyll and carotenoid content. LC-MS/MS analysis revealed that P2 had higher quantities of several metabolites in the carotenoid biosynthesis pathway. Transcriptome sequencing results showed that genes involved in porphyrin metabolism, carbon fixation, photosynthesis and antenna proteins, terpenoid backbone biosynthesis, and carotenoid biosynthesis were differentially expressed between P1 and P2. Large-scale expression differences were observed in the phytohormone and MAPK signaling pathways, as well as in 15 transcription factor families. We discuss possible mechanisms responsible for the yellow leaf color in P2. These preliminary data are valuable for further exploring the molecular mechanisms of leaf color formation and associated pathways.Keywords
Supplementary Material
Supplementary Material FileRehmannia chingii H. L. Li is a perennial herb and a member of the basal taxon Rehmannia in the Orobanchaceae family [1]. It is native to Zhejiang, China, however it is also distributed in Jiangxi, Tiammu mountains, and East China [2,3]. It is a perennial herb and grows primarily in temperate biome (https://powo.science.kew.org/). All the species of Rehmannia have been reported to have useful health beneficial activities owing to the presence of bioactive compounds [4,5]. Rehmannia chingii is an endemic, rare medicinal plant containing bioactive compounds such as iridoid glycosides [6], phenylethanoid glycosides, and ionone derivatives [7]. Therefore, it has been implicated in health-beneficial activities such as hepatoprotective activity [8]. This rare species is threatened by over-exploitation and its populations are declining [3].
Rehmannia chingii plants can grow up to 60 cm tall, and are villous. Their stems can be either simple or branched. The basal leaves are subrosulate with winged petioles (2–7 cm). The leaf blades are elliptic (6–12 × 3–6 cm) and covered with white villi. The base is cuneate and its thickness decreases gradually. The margin is irregularly crenate, coarsely serrate, or crenate. The stem leaves, similar to basal leaves, have gradual decreasing size upward. The purple-red flowers make it a beautiful landscape plant (www.efloras.org; taxon_id = 200021235). Typically, the leaves are green in color (Fig. 1a). During our ongoing cultivation process, a mutant with yellow leaves was observed. The yellowing started with the new leaves, gradually spread downward until the whole plant turned yellow with a stable color (Fig. 1a). This is an ideal candidate plant where the analysis of its leaves can serve as a model to understand the molecular mechanisms of pathways associated with pigments (chlorophyll, xanthophyll, and carotenoid) biosynthesis, energy harvesting, photosynthesis, carbon fixation, and associated signaling pathways. Furthermore, such mutants can be a useful resource for observing the differential accumulation of useful secondary metabolites, thus expanding the medicinal utility of the species.
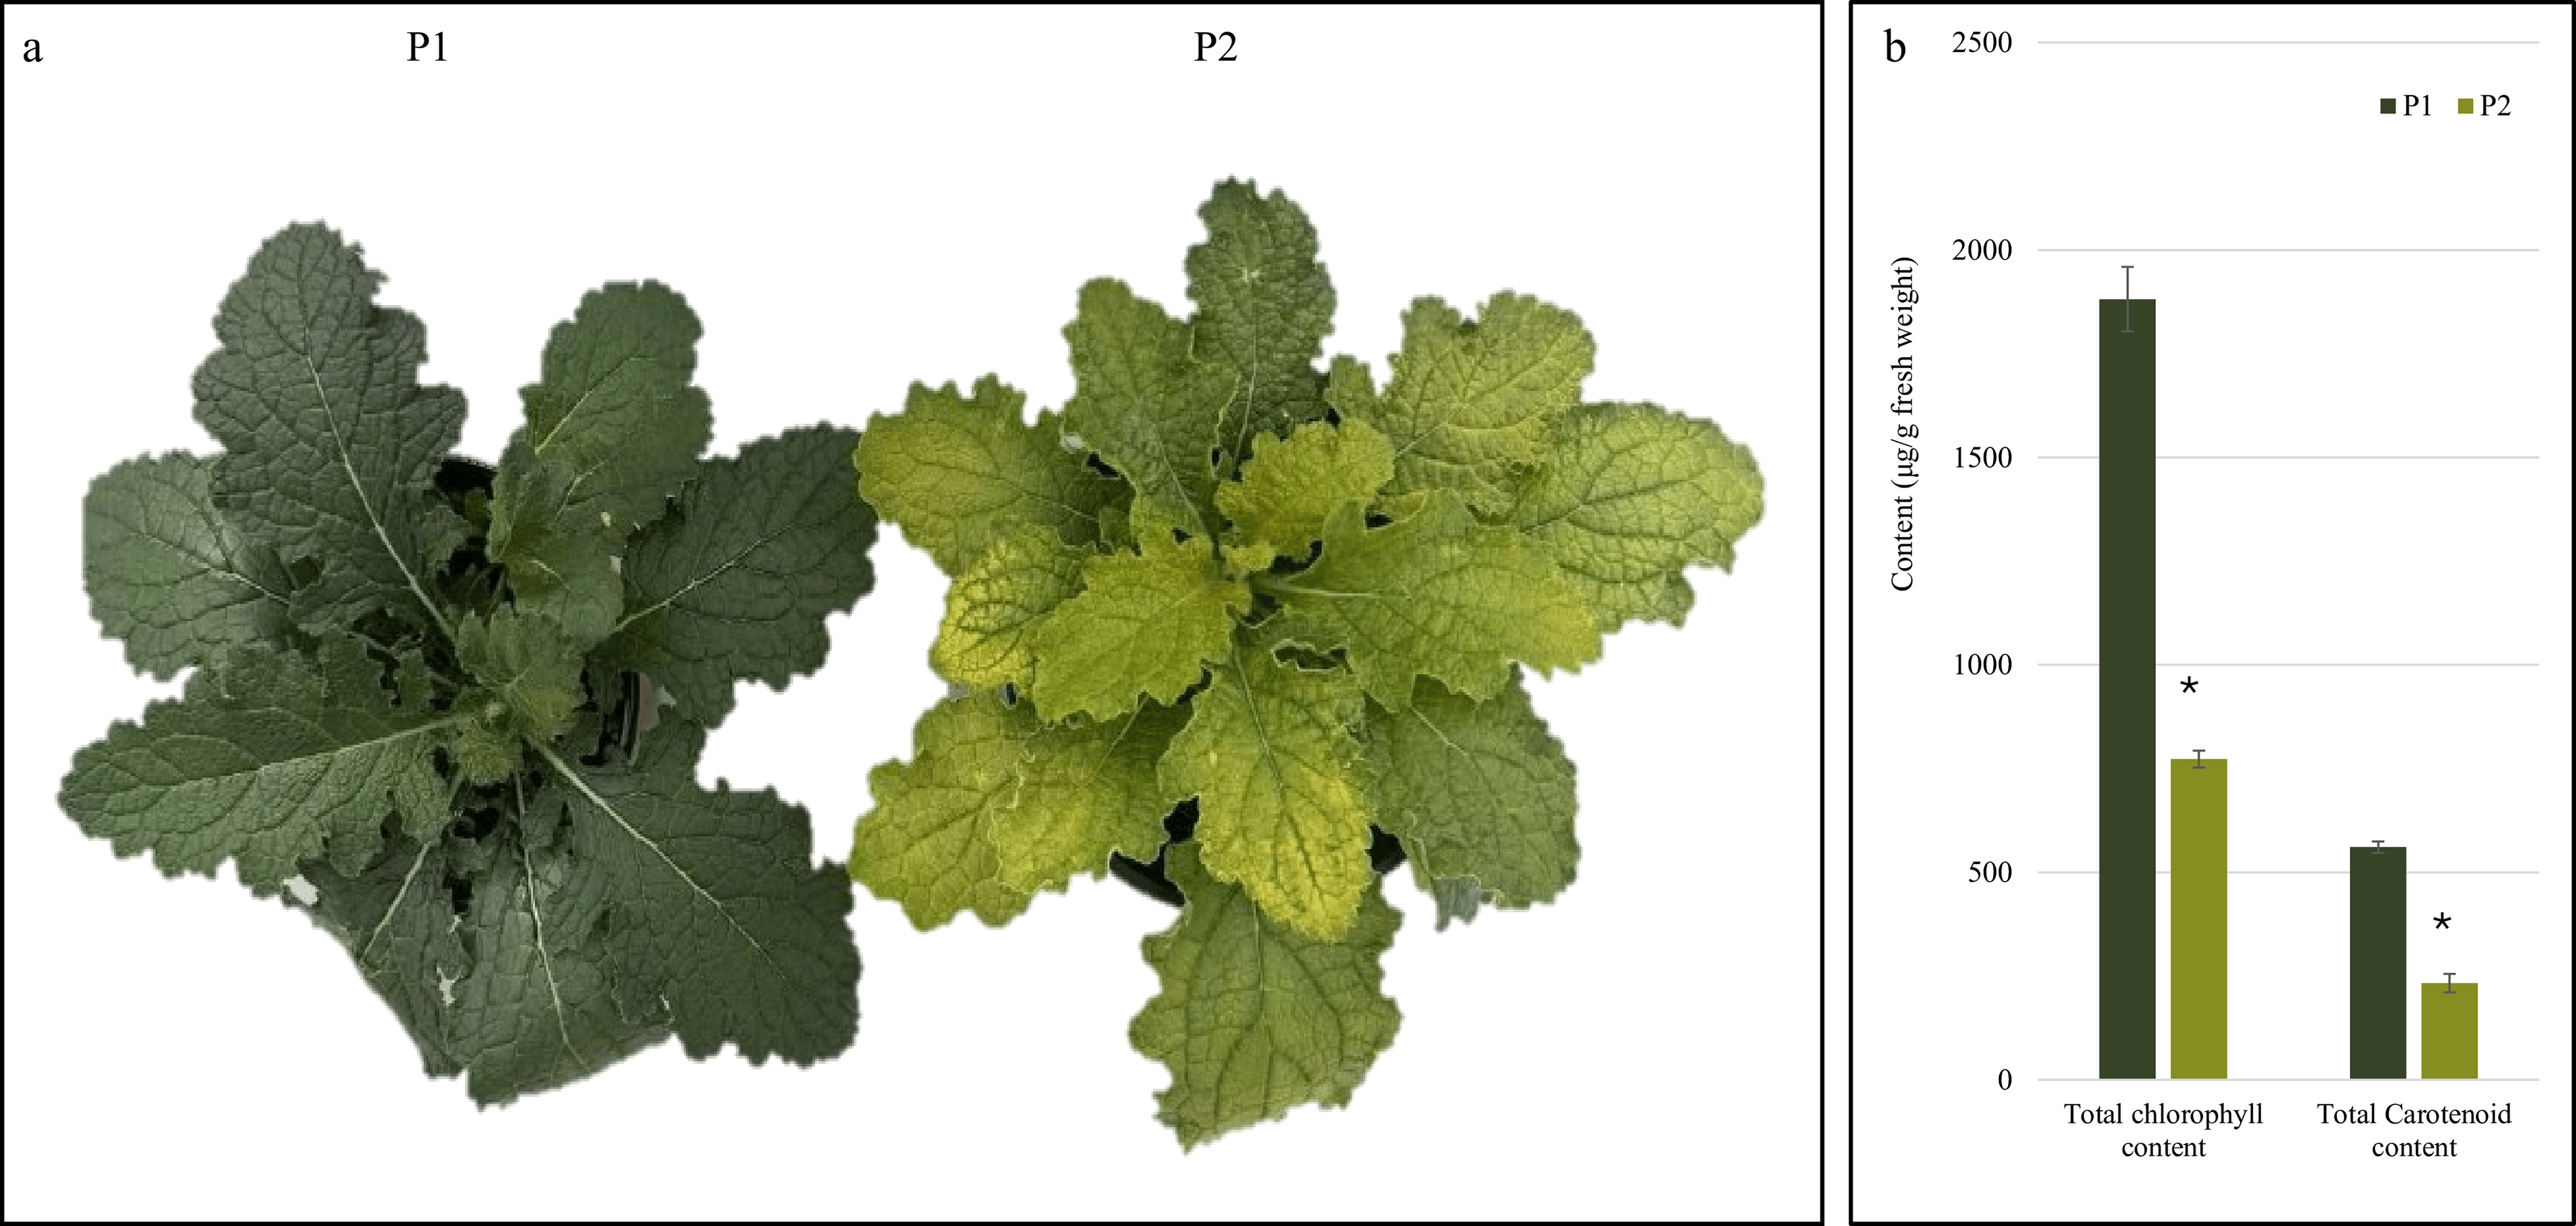
Figure 1: (a) Rehmannia chingii plant samples and (b) pigment content. The bar plots represent mean values (n = 3). The error bars represent ± standard deviation. *means the treatments differ significantly
Leaf color variation is prevalent in several plant species [9]. The range of leaf colors in these plant species is broad, with full leaves or patches of leaves displaying different colors. These changes happen due to variable expression patterns and/or mutations in the genes associated with pigment biosynthesis and the destruction of chloroplasts. Other factors include differences in the expression of transcription factors (TFs) and non-coding RNAs, as well as environmental factors. Additionally, upstream pathways can also impact the end products, i.e., chlorophylls, xanthophyll, carotenoids, etc., leading to variation in leaf color [10]. Recently the understanding of the mechanisms of leaf color variability in several plant species has been explored. A yellow leaf tomato mutant, when studied, had lower contents of the photosynthetic pigments (chlorophyll a and b), damaged chloroplast membrane, and differential expression of genes related to oxidation-reduction, pigment biosynthesis, electron transport chain, plant hormone signaling, MAPK signaling, secondary metabolite (flavonoids and phenols), carbohydrate biosynthesis, etc. [11]. Similar physiological and transcriptomic changes have been observed in the yellow-leaf mutants in watermelon [12], Torreya grandis [13], hybrid of Ilex cornuta and Ilex aquifolium [14], soybean [15], and others [10].
Understanding the observed phenotype (Fig. 1a) during our ongoing cultivation of R. chingii is valuable for many molecular aspects. First, photosynthetic performance is critical for plant survival and yield because the leaf color relates to the photosynthesis and pigment content [15]. Second, leaf color is an important visual trait that contributes to the ornamental value of the plant [16]. Third, plants with different leaf colors have different secondary metabolite content compared to wild-type plant leaves [17,18]. In this regard, recent developments in omics technologies, i.e., metabolomics and transcriptomics, have played an important role in helping researchers to elucidate the key pathways and mechanisms in such mutants [17,19,20]. Leveraging these developments, we compared the total chlorophyll and carotenoid contents, carotenoid profiles by liquid-chromatography with tandem mass spectrometry (LC-MS/MS), and transcriptome sequencing of the leaves from both the wild-type (P1) and naturally found mutant (P2) plants of R. chingii. This comparative analysis provides a foundational knowledge of the key differences in pigment content, carotenoid profiles and levels. Most importantly, it reveals key differences in the expression of genes enriched in several associated pathways.
Rehmannia chingii (Tianmu Dihuang) wild type (P1) and observed mutant (P2) plants are growing in the greenhouse of the Beijing Academy of Landscape Architecture and Greening Sciences, Beijing, China. The plants were identified and confirmed by Professor Shiwei Zhao. The summer temperature inside the greenhouse was 25–35°C and light intensity was 30,000 to 50,000 lux. The minimum and maximum winter temperatures during the growth period were 12°C and 25°C, respectively. Whereas, the light intensity in winter was 15,000 to 25,000 lux. Recommended agronomic practices were followed during the growing season. Samples were collected in March 2025. At the time of sampling, the plants were 26 months old. The leaf samples of P1 and P2 were collected before the beginning of flower bud differentiation. Fresh leaf samples were collected from the plants that were healthy and free of diseases and insect. The leaves were washed with ultra-pure water, immediately frozen with liquid nitrogen, and stored in a −80°C freezer until further processed.
2.2 Total Chlorophyll and Total Carotenoid Content Determination
Chlorophyll content was determined using chlorophyll extraction kit (NM-W-0145; Norminkoda Biotechnology Co., Ltd., Wuhan, China). For each replicate, frozen fresh leaf sample (0.1 g) was taken and added 1 mL of extraction buffer and 50 mg reagent 1. The mixture was ground thoroughly in a −40°C tissue grinder (Servicebios Biotechnology Co., Ltd., Wuhan, China) in the dark and rinsed with extraction solution, followed by transfer-ring the washing solution into a 10 mL centrifuge tube. The solution was then diluted to 10 mL with extraction solution. The tubes were then placed in dark for 3 h until the tissue residue at the bottom turned completely white. Of the extract, took 200 μL (assay) and 200 μL of extraction buffer (blank) into a 96-well plate (Jetbiofil Biotechnology Co., Ltd., Guangzhou, China), and measured the absorbance A at 665 nm and 649 nm, respectively, on a microplate reader (SpectraMax ABS plus, Molecular Devices, Silicon Valley, CA, USA). △A for both 665 and 649 nm intensities was calculated suing Eqs. (1) and (2).
Chlorophyll a and b, and total chlorophyll contents were determined using the following Eqs. (3)–(5).
where Ca, Cb, CT, V, D, and W represent chlorophyll a, chlorophyll b, total chlorophyll, the volume of the extract (10 mL = 0.01 L), the dilution factor (undiluted is 1) and the sample mass (g).
Carotenoid content was determined using carotenoid kit (NM-W-0146; Norminkoda Biotechnology Co., Ltd., Wuhan, China). Briefly, 0.1 g of the leaf samples for each replicate was homogenized in homogenizer (Servicebios Biotechnology Co., Ltd., Wuhan, China). Added 1 mL of extract and 10 mg reagent 1, mixed thoroughly by grinding in dark, and then transferred to a 10 mL centrifuge tube. The mortar was rinsed with the extraction solution, transferred all the rinsing solution and all the green substances in the mortar into a 10 mL centrifuge tube, added the extraction solution to 10 mL, placed the glass test tube in the dark for 3 h. Carotenoid content was determined as followed. The microplate (SpectraMax ABS plus, Molecular Devices, Silicon Valley, CA, USA) was pre-heated for over 30 min and adjusted the multi-wavelength to 470 nm, 646 nm, and 663 nm. Carotenoid content was determined as per following formulae.
where Ca, Cb, Cc, V extraction, F, W, 1 are, chlorophyll a, chlorophyll b, carotenoid concentration, extraction volume (0.01 L), dilution factor, sample mass (g), and optical path ratio (1 cm, optical path of 96-well plate), respectively.
2.3 Carotenoid Detection and Quantification by LC-MS/MS
All the reagents used for LC-MS/MS analysis were of analytical grade. The leaf sample of each replicate was freeze-dried, ground into powder (30 Hz, 1.5 min), and stored at −80°C. Of the powder, 50 mg was weighted and extracted with 0.5 mL 1:1:1 mixed solution of n-hexane: acetone: ethanol. The extract was then vortexed at room temperature for 20 min, centrifuged at 12,000 r/min for five minutes at 4°C, and supernatant was collected. The extraction was repeated twice, and then evaporated to dryness, followed by reconstitution in 150 μL dichloromethane. The solution was then filtered through a microfilter (0.22 μm) and used for LC-MS/MS analysis.
For LC-MS/MS analysis, we used an UPLC-APCI-MS/MS system (UPLC, ExionLC™ AD, https://sciex.com.cn/; MS, Applied Biosystems 6500 Triple Quadrupole, https://sciex.com.cn/). The analytical conditions were as follow, LC: column, YMC C30 (3 μm, 100 mm × 2.0 mm); solvent system, methanol:acetonitrile (1:3, v/v) with 0.01% BHT and 0.1% formic acid (A), methyl tert-butyl ether with 0.01% BHT (B); gradient program, started at 0% B (0–3 min), increased to 70% B (3–5 min), then increased to 95% B (5–9 min), finally ramped back to 0% B (10–11 min); flow rate, 0.8 mL/min; temperature, 28°C; injection volume: 2 μL.
Linear ion trap and triple quadrupole (QQQ) scans were acquired on a triple quadrupole-linear ion trap mass spectrometer (QTRAP), QTRAP® 6500+ LC-MS/MS System, equipped with an APCI Heated Nebulizer, operating in positive ion mode and controlled by Analyst 1.6.3 software (Sciex). The APCI source operation parameters were as follows: ion source, APCI+; source temperature 350°C; and curtain gas (CUR) were set at 25.0 psi. Carotenoids were analyzed using scheduled multiple reaction monitoring (MRM). Data acquisitions were performed using Analyst 1.6.3 software (Sciex). Multiquant 3.0.3 software (Sciex) was used to quantify all metabolites. Mass spectrometer parameters including the declustering potentials (DP) and collision energies (CE) for individual MRM transitions were done with further DP and CE optimization. A specific set of MRM transitions was monitored for each period according to the metabolites eluted within this period.
Carotenoids’ contents were detected using the AB Sciex QTRAP 6500 LC-MS/MS platform.
2.4 Data Analysis of Chlorophyll and Carotenoids
Triplicate data for total chlorophyll and total carotenoid content were analyzed by ANOVA. Means were compared using students’ t-test. These analyses were carried out in Microsoft Excel (2024) Professional Pro (www.microsoft.com).
The LC-MS/MS data of carotenoids were analyzed as follows. The hierarchical cluster analysis (HCA), based on normalized signal intensities, was carried out in R (https://www.r-project.org/) using pheatmap package. Significantly differentially accumulated compounds (DACs) were determined by absolute Log2 foldchange. The identified DACs were annotated using KEGG compound database (http://www.kegg.jp/kegg/compound/ (accessed on 01 August 2025)), and enriched by mapping to KEGG pathways (http://www.kegg.jp/kegg/pathway.html (accessed on 01 August 2025)). Heatmaps were generated using TBtools [21].
2.5 Transcriptome Sequencing and Data Analysis
RNA was extracted from each P1 and P2 replicate by using RNeasy Plant Mini Kit for RNA Extraction (Jiangsu CoWin Biotech Co., Ltd., Taizhou, China). The purity and quality of the RNA were determined using Nanodrop (company and address) and Agilent 2100 bioanalyzer (Agilent, Santa Clara, CA, USA). For library construction, mRNA was enriched using magnetic beads with Oligo(dT), random fragmentation of RNAs with fragmentation buffer, and first strand cDNA synthesis using random hexamers. Double-stranded cDNAs were purified, end-repaired, A-tailed, and ligated to sequencing adapters. Fragment size was selected using AMPure XP beads (Beckman Coulter Life Science, South Kraemer Blvd, Brea, CA, USA). Libraries were quantified using Qubit 2.0 (Thermo Fisher Scientific, Pu Dong Xin Qu, Shanghai, China) and Q-PCR (>2 nM). The libraries were then sequenced on Illumina platform at MGI Tech Co., Ltd., Guangzhou, China (https://en.mgi-tech.com/).
Raw data was filtered, and the clean data was used for further analysis. The quality of the sequencing data was determined based on Q-score. The error distribution and GC content were determined. Reads with adapter and low-quality were removed. Clean reads were spliced to obtain reference sequences for subsequent analysis using Trinity [22]. The resulting sequence was used as a reference, and the clear reads of each sample were mapped to it using Hisat2 [23]. For annotation, CPC2 (https://cpc2.gao-lab.org) was used to search for unigenes with coding potential and BLAST [24] was used to compare these unigenes with the databases, i.e., Nr [25], Swiss-Prot [26], GO [27], eggNOG/COG, KOG [28], KEGG [29], and Pfam [30]. Gene expression was quantified as fragments per kilobase of transcript per million fragments mapped (FPKM) using Cuffquant (https://cole-trapnell-lab.github.io/cufflinks/cuffquant/ (accessed on 01 August 2025)). Overall, gene expression was visualized as violin plots. Principal component analysis, correlation, and hierarchical clustering-based heatmap of gene expression of replicates were computed in R (v 4.5.1). DESeq was used for differential gene expression between samples. Differentially expressed genes (DEGs) were screened based on fold change ≥ 2 and false discovery rate (FDR) < 0.05. To avoid false-positives, the Benjamini-Hochberg correction method was used. Transcription factor annotation was done by comparing the transcripts with PlantTFDB 4.0 (http://planttfdb.cbi.pku.edu.cn/). The DEGs were enriched in KEGG pathways (http://www.kegg.jp/kegg/pathway.html (accessed on 01 August 2025)). Heatmaps were generated using TBtools [31].
2.6 Co-Joint Analysis of LC-MS/MS and Transcriptome Data
The transcriptome and LC-MS/MS data were jointly analyzed. Principal component analysis was done in R. KEGG pathway enrichment of the both datasets was jointly done (http://www.kegg.jp/kegg/pathway.html (accessed on 01 August 2025)). The Pearson correlation coefficients between metabolite intensities and gene expression were computed by using the cor function in R, and those sets having a value of >0.8 and p-value of <0.05 were screened and displayed as nine-quadrant as well as network diagrams.
3.1 Chlorophyll and Carotenoid Content
The P1 leaves were distinctly dark green, the P2 leaves were light green color (yellowish) (Fig. 1a). Since the chlorophyll and carotenoids are the main pigments in green and yellowish green-leaves, we quantified both. The pigment analysis showed that both plants differed significantly. Overall, P2 (1881.62 µg/g) had significantly lower (0.41 fold) total chlorophyll content than P1 (772.91 µg/g). The total carotenoid content in P2 (232.86 µg/g) was also lower (0.30 fold) compared to P1 (560.81 µg/g). These observations suggest that P2 is deficient both in terms of total chlorophyll and total carotenoids.
3.2 LC-MS/MS-Based Carotenoid Detection and Quantification
To further elucidate the differences in key carotenoids between P1 and P2, we used LC-MS/MS. A total of 35 carotenoids were detected in the two plants (Fig. 2a). Of these, 18 were differentially accumulated; two carotenes and 16 xanthophylls. The xanthophylls that were present in higher quantities in P2 are neoxanthin, violaxanthin, lutein dioleate, lutein myristate, and lutein distearate. Similarly, two carotenes, i.e., E/Z-phytoene and phytofluene, had higher quantities in P2 than P1. Contrarily, of the other 11 xanthophyll compounds, six had higher quantities in P1 than P2. Wherease, five (zeaxanthin-myristate-palmitate, lutein caprate, zeaxanthin-laurate-myristate, zeaxanthin-palmitate-stearate, and violaxanthin palmitate) were detected only in P2, while they were not detected in P1 (Fig. 2b). KEGG pathway enrichment confirmed that the metabolites were enriched in related pathways, i.e., metabolic pathways and carotenoid biosynthesis (Fig. 2c).
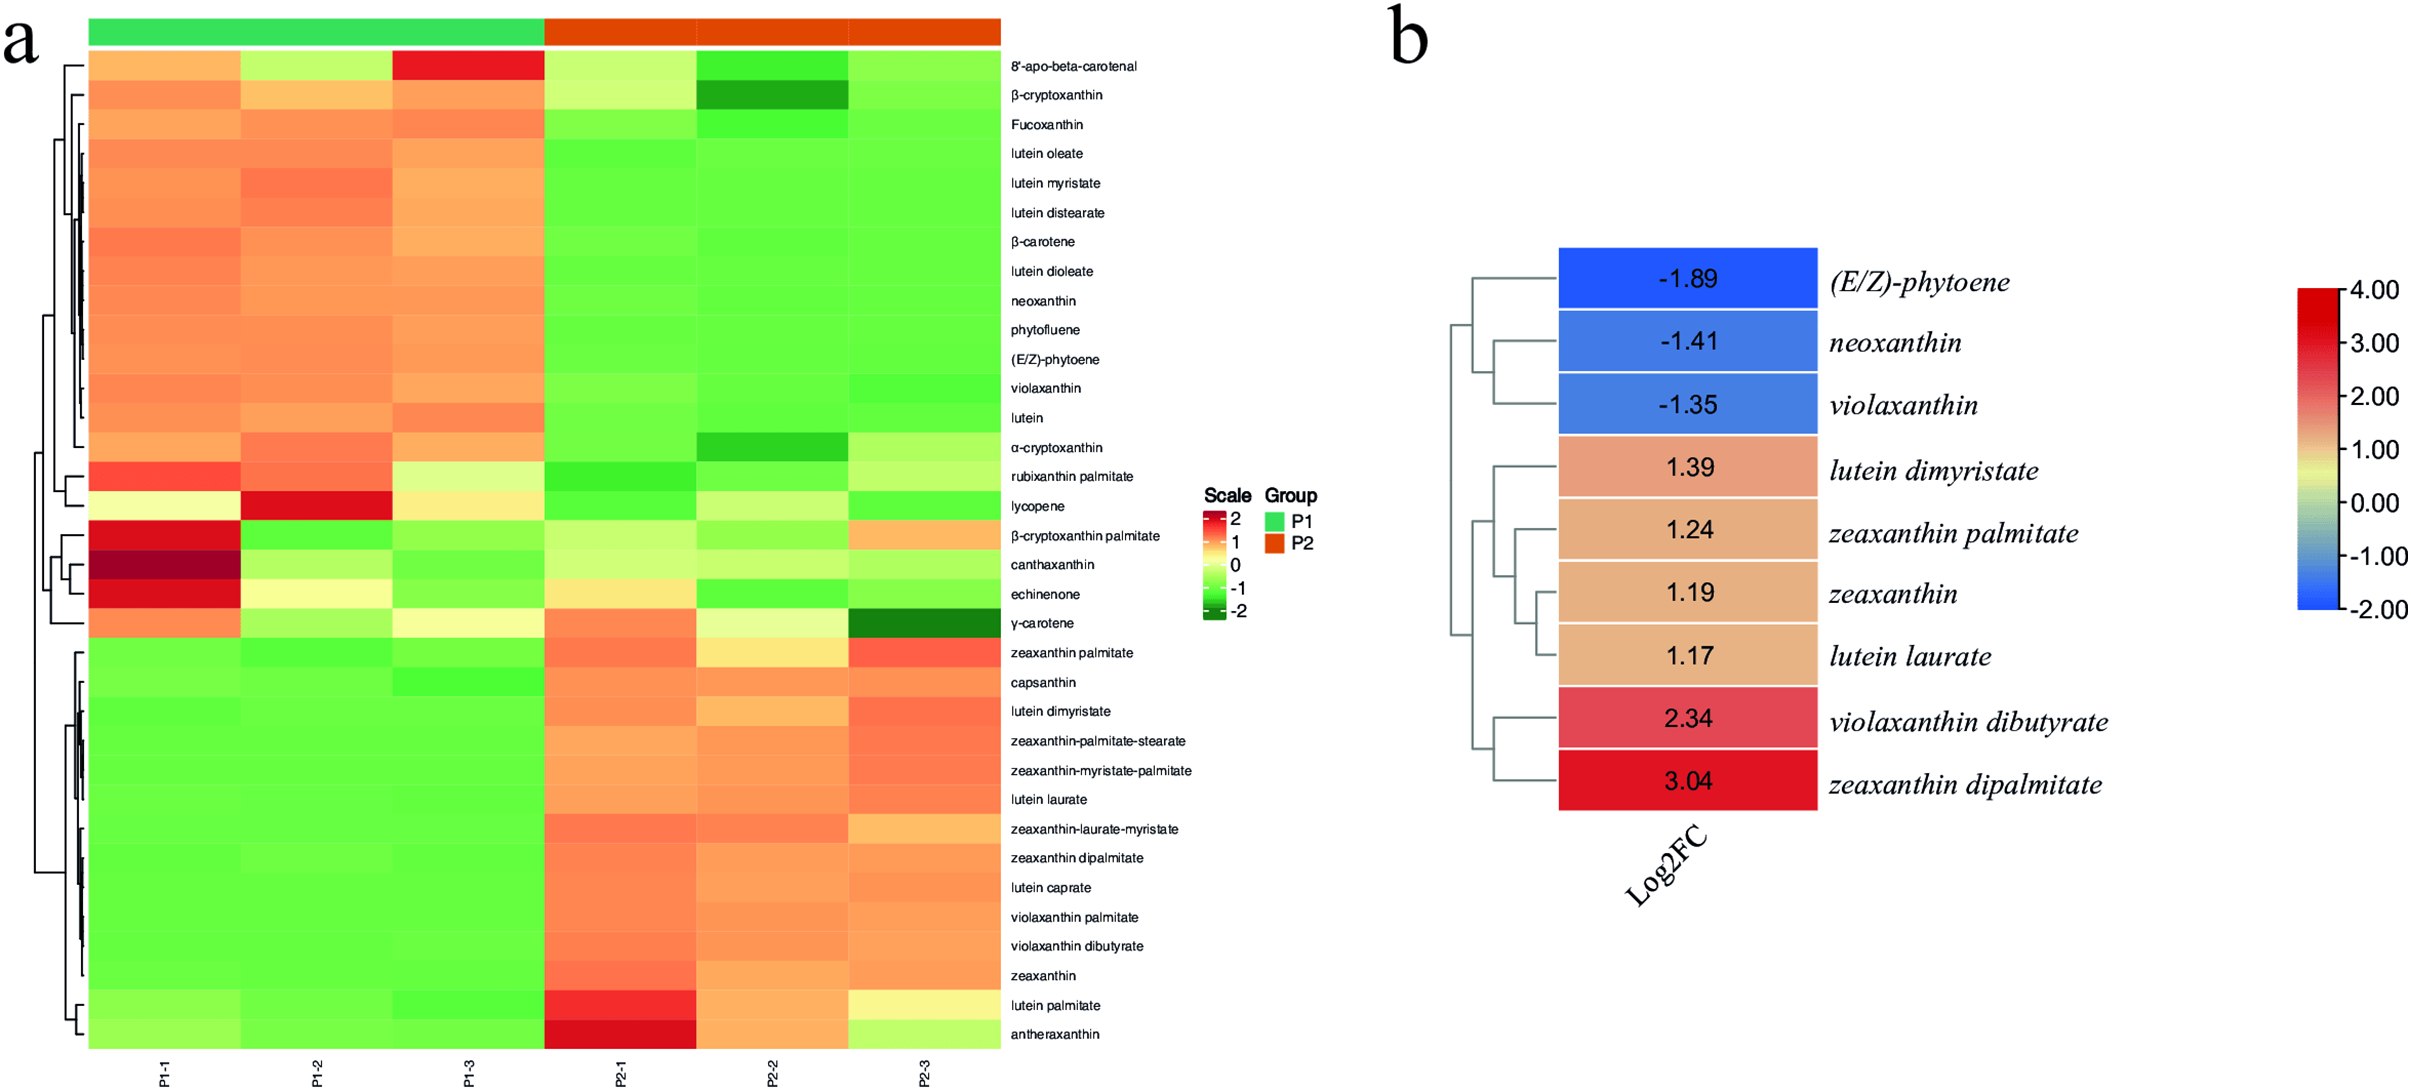
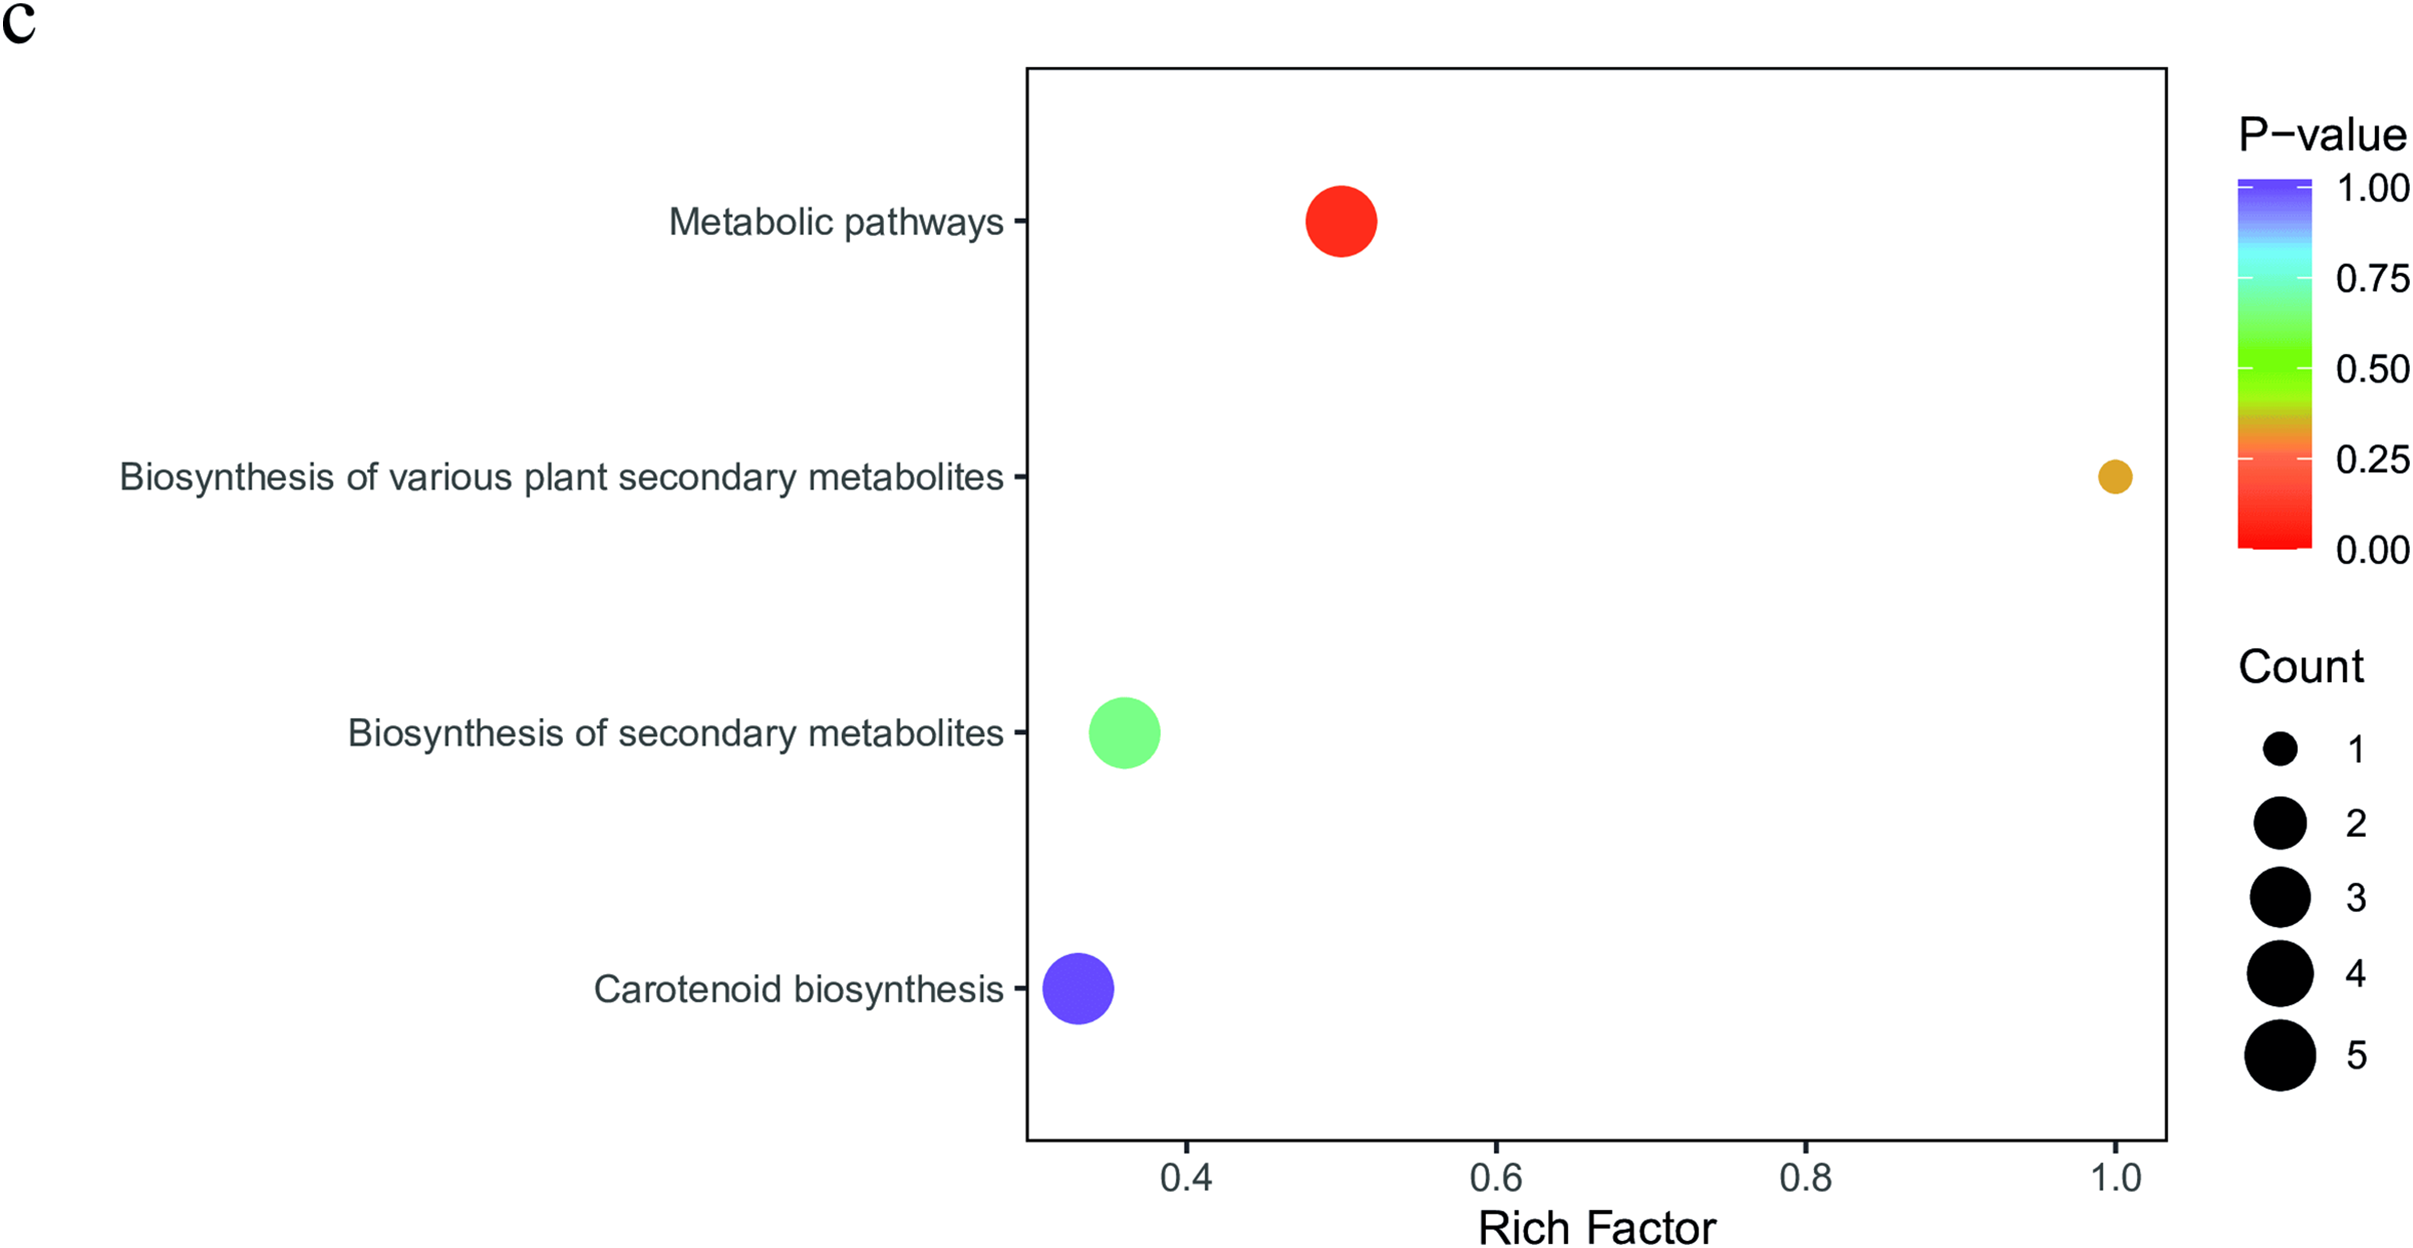
Figure 2: (a) Heatmap of the relative metabolite intensities of the detected carotenoids in P1 and P2 R. chingii leaves. (b) log2-foldchange value (P1/P2) based heatmap and hierarchical clustering of the differentially accumulated xanthophylls in P1 and P2. (c) Scatter-plot of the KEGG pathways to which the carotenoid and xanthophyll compounds were enriched
3.3 Transcriptome Sequencing of Rehmannia chingii P1 and P2 Leaves
3.3.1 Global Transcriptome Profile
Sequencing of six R. chingii libraries produced a total of 268.757 million reads. On average, each library had 44,792,897 reads. Overall, 99.9–100% of these were clean reads with a total of 40,222.7 million bases. The GC content ranged from 44.70%% to 45.24%. The % >Q20 and >Q30 were >98.45% and 95.09%, respectively (Table S1). A total of 148,907 transcripts, 97,185 unigenes, and 24,085 codon genes were identified (Fig. 3a). The frequency distribution of splicing length showed more transcripts, unigenes, and codon genes in ≥2k bp category compared to 200–500 bp and 500–1k bp. Of the total reads, 95.98% to 96.11% could be mapped (Table S2). The highest number of genes could be annotated in Nr (23,066), followed by Swiss-Prot (17,576), KEGG (16,230), GO (11,616), eggnog (14,346), and others (Fig. 3b). Overall gene expression in P1 was higher than in P2 (Fig. 3c). The Pearson’s correlation coefficient within each plant type replicate was 1.00, while between P1 and P2 replicates was 0.89–91 (Fig. 3d). Principal component analysis (PCA) also indicated that replicates of the same plant were grouped together (Fig. S1).
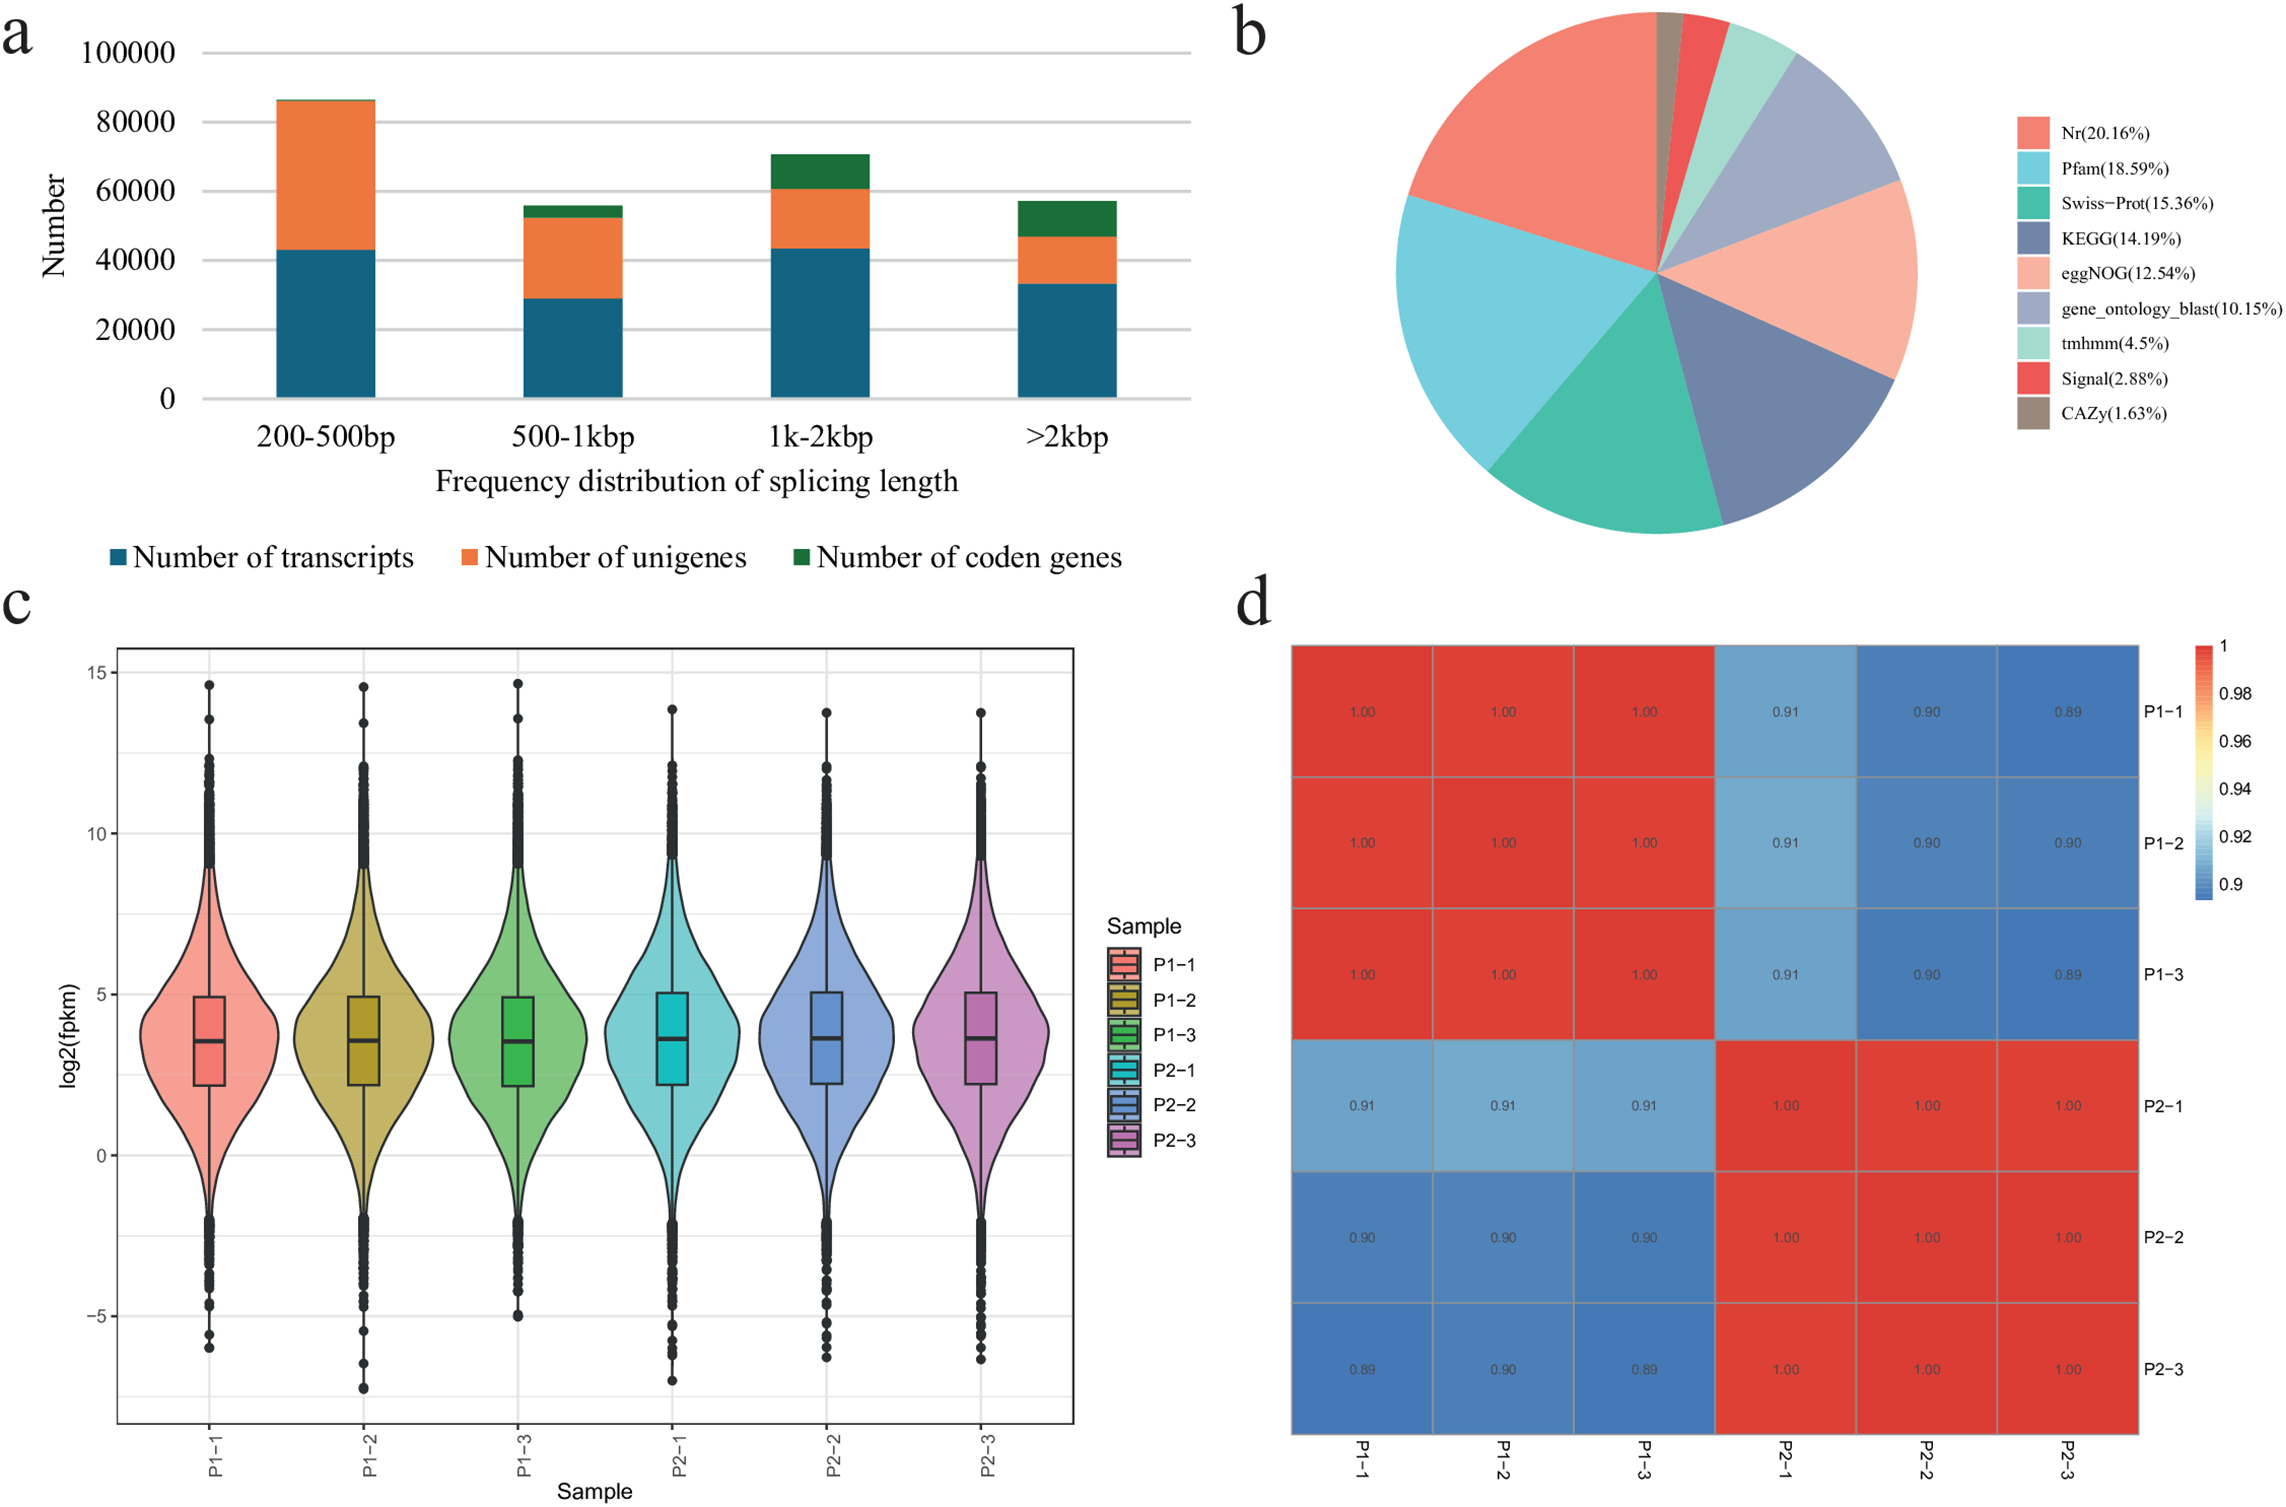
Figure 3: Global transcriptome profile of R. chingii leaf (P1 and P2). (a) Frequency distribution of the splicing length of the transcripts, unigenes, and codon genes in six libraries. (b) Annotation statistics, (c) overall gene expression, and (d) Pearson’s correlation coefficient between P1 and P2 replicates
3.3.2 Differential Transcriptome Profile
a. Differential gene expression between P1 and P2 leaves
A total of 4075 genes were differentially expressed between P1 and P2 (Table S3; Fig. 4a). Of these genes, 2119 had higher expression in P2 than P1, whereas 1956 had lower expression in P2 than P1 (Fig. 4b). Eighty genes were exclusively expressed in P1, whereas 23 were exclusively expressed in P2. Most exclusively expressed genes in P2 were uncharacterized or couldn’t be annotated in any database. Some were annotated as putative germin-like protein 2-1 (g42821_i0), eukaryotic transcription initiation factor 5A-1-like (g40707_i0), E3 ubiquitin-protein ligase RNF181-like (g47524_i0), extension-3, protein CUP-SHAPED COTYLEDON 2 (g24281_i0), NADPH-dependent codeinone reductase 1-1-like (g20968_i0), zinc finger protein CONSTANS-LIKE 12 (g42658_i0), and high-affinity nitrate transporter 3.1-like (g45423_i0). Those exclusively to P1 included polyubiquitin (g32526_i0), probable ribose-5-phosphate isomerase 4 (g29110_i0), cysteine proteinase inhibitor 1-like (g43441_i0), L-type lectin-domain containing receptor kinase VII.1-like (g23485_i0), syntaxin-124 (g22753_i0), tonoplast dicarboxylate transporter (g397_i0), and others (Table S3). These observations indicate that several pathways associated with carbohydrate metabolism, reversible conversion of ribose-5-phosphate to riboulose-5-phosphate, membrane-related functions, vesicle trafficking protein in secretory pathways, energization across the tonoplast, and others.
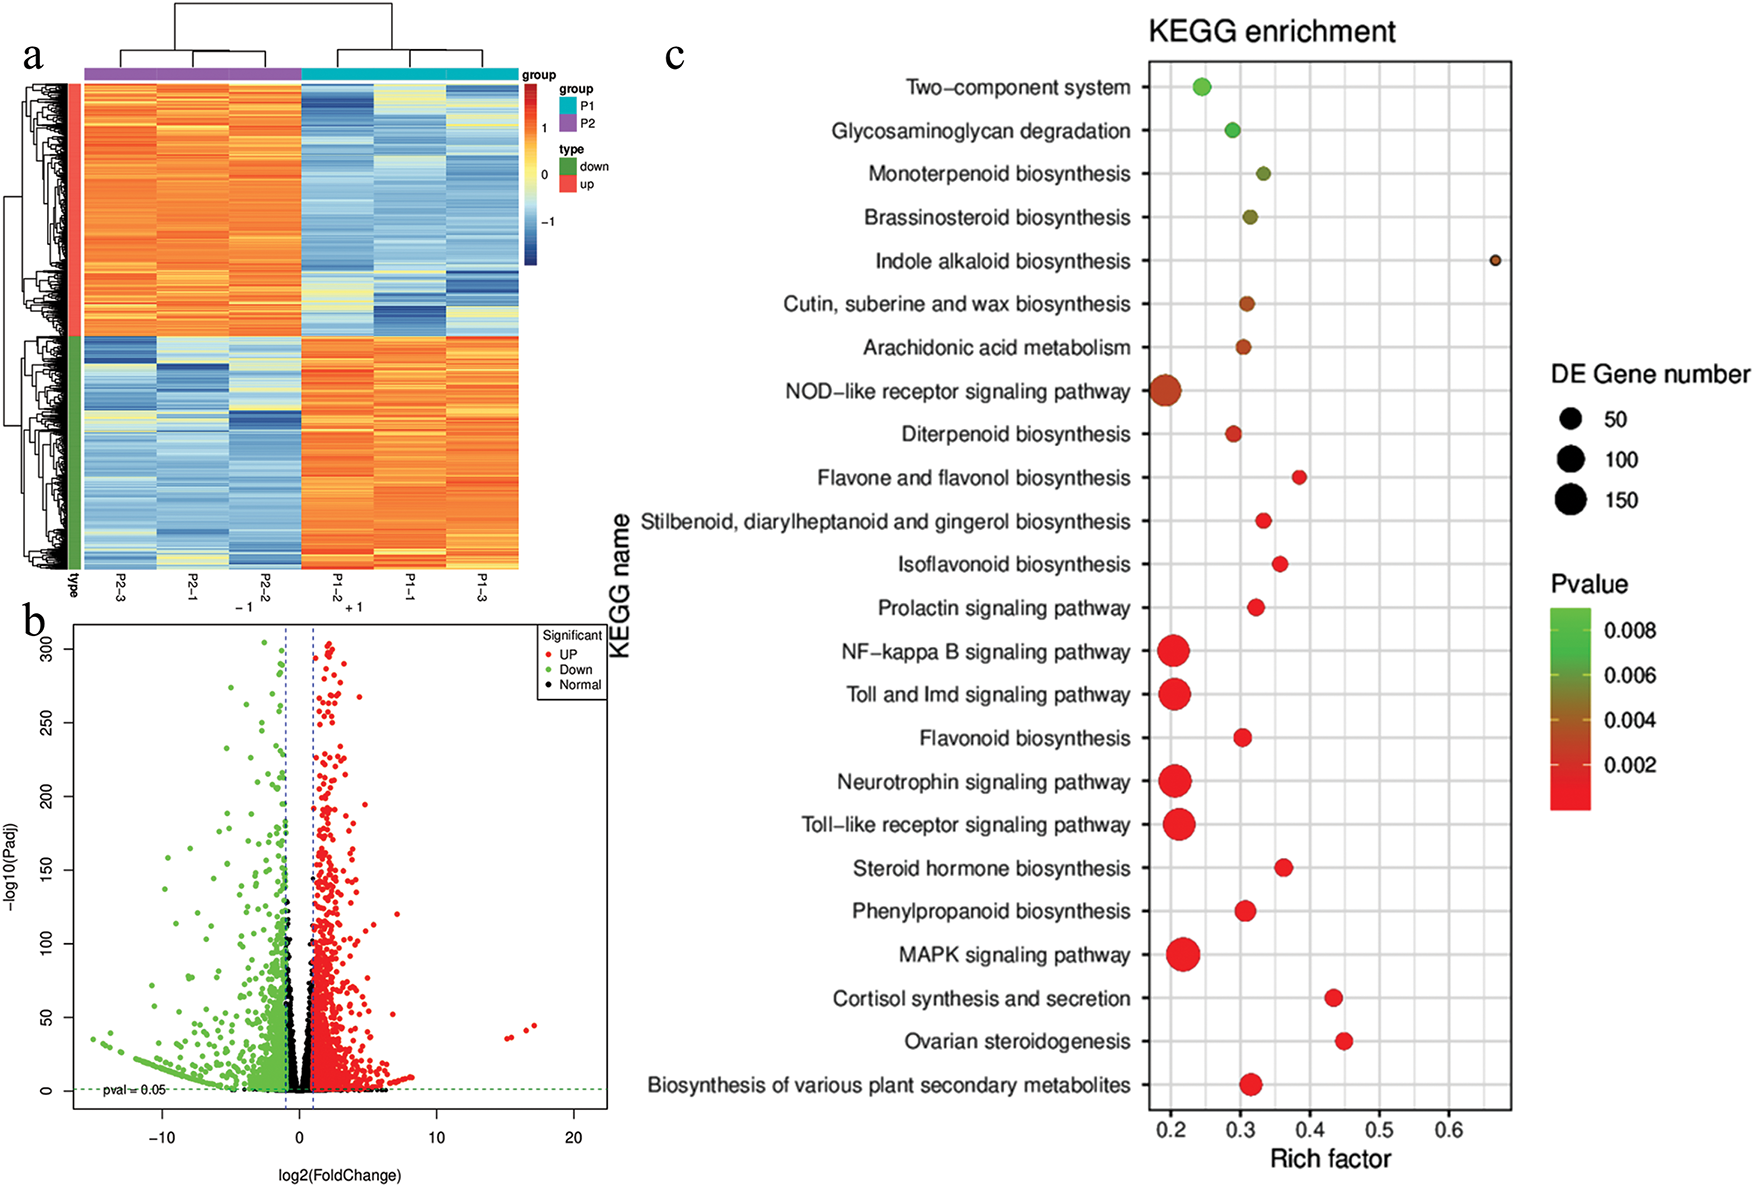
Figure 4: Differential transcriptome profile of P1 and P2 R. chingii leaves. (a) Heatmap (P1/P2) and (b) volcano plot of FPKM values of the differentially expressed genes. (c) Scatter plot of the KEGG pathways to which the DEGs were enriched
The DEGs were enriched in 35 KEGG pathways. The major pathways include biosynthesis of plant secondary metabolites, MAPK signaling pathway, phenylpropanoid biosynthesis, flavonoid biosynthesis, isoflavonoid biosynthesis, stilbenoid, diarylheptanoid and gingerol biosynthesis, diterpenoid biosynthesis, brassinosteroid biosynthesis, and others (Figs. S2a and 4c). GO enrichment results indicated that the highest number of DEGs were enriched in cellular anatomical entity (1537). Most genes were associated with cellular process, metabolic process, and response to stimulus (Fig. S2b).
b. Expression difference in the chlorophyll biosynthesis related pathway genes
Since the key phenotypic difference between the wild type and naturally found mutation plants is the coloration (Fig. 1), which is associated with carbon fixation and pigment biosynthesis. Therefore, we explored the expression changes in four related pathways, i.e., carbon fixation in photosynthetic organisms, porphyrin metabolism, photosynthesis, and photosynthesis antenna proteins.
We explored whether there was a consistent change in gene expression concerning the differences in total chlorophyll content between P1 and P2. Six transcripts, which were annotated as four KO terms were differentially expressed between the two plants (Fig. 5). Two UDP-Glucuronosyltransferase (UGT) transcripts had opposite expression. This gene converts bilirubin to bilirubin β-diglucuronide [32]. Whereas P2 had higher expression of transcripts annotated as uroporphyrinogen decarboxylase (hemE), which is a key gene in the conversion of uroporphyrinogen I and III to coproporphyrinogene I and coproporphyrinogen III, respectively [33]. The latter is present upstream of the chlorophyll a biosynthesis pathway. Its expression has been linked with deregulation of chlorophyll biosynthesis [34], thus potentially linked with the observed P2 phenotype. Its reduced expression has also been linked with light-dependent necrosis [35]. Chlorophyllase (g25168_i0) had lower expression in P2 than P1. Earlier research has shown it as a rate-limiting enzyme in chlorophyll catabolism [36]. Changes in its expression can alter the ratio of chlorophyll-to-chlorophyllide in plants [37]. Therefore, our results suggest that changes in the expression of genes enriched in porphyrin biosynthesis pathway could be possible regulators of differential chlorophyll biosynthesis in the two plants.
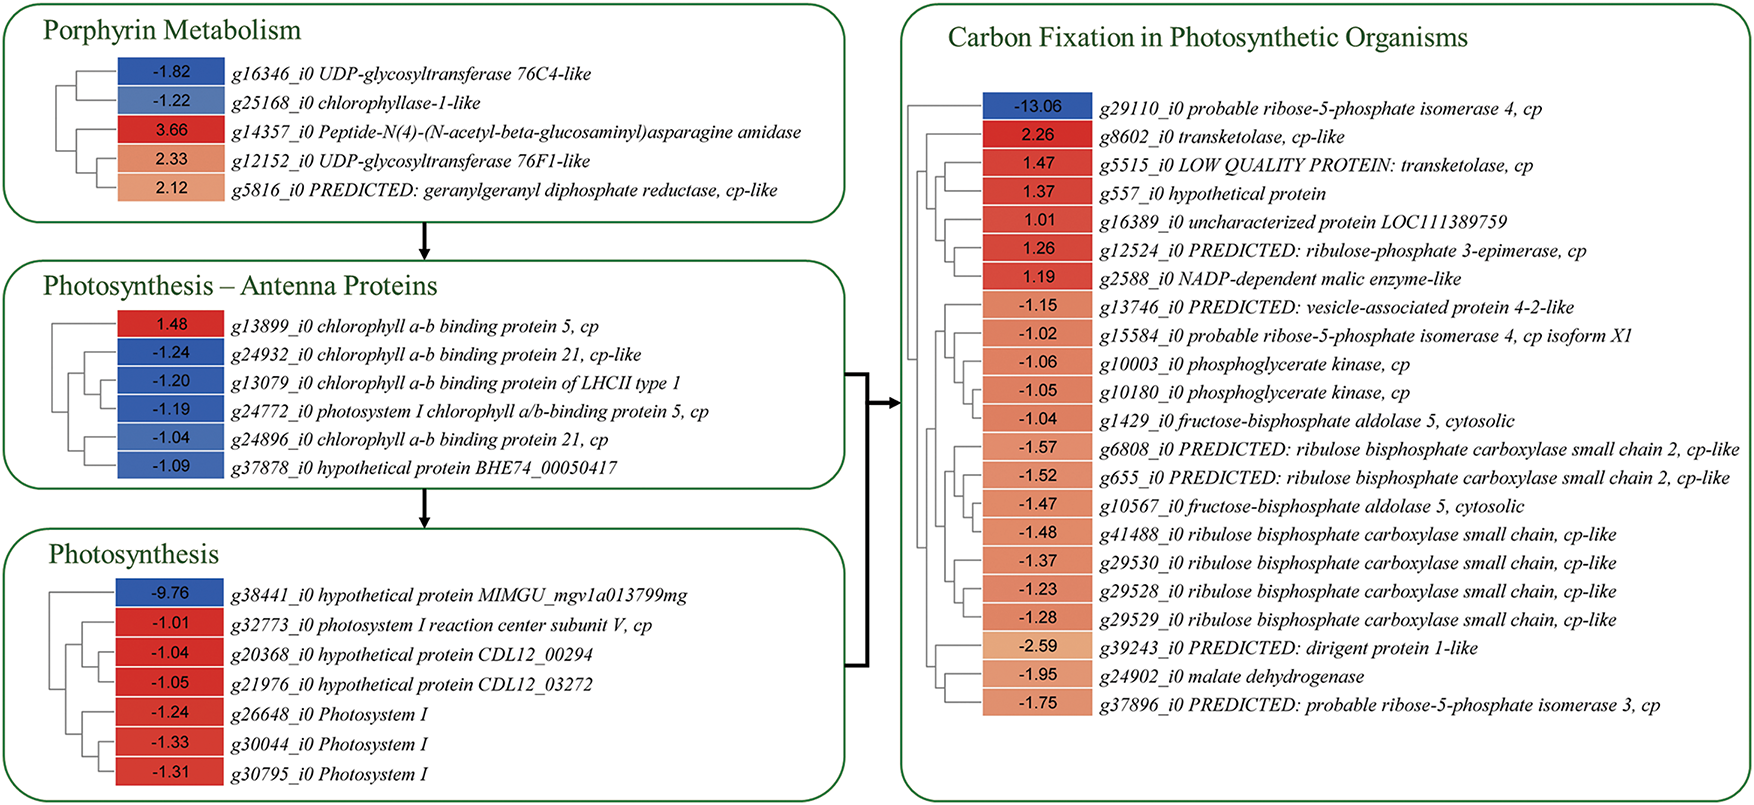
Figure 5: Differential expression of genes enriched in porphyrin metabolism, photosynthesis, and carbon-fixation in P1 and P2 leaves. The genes were selected based on their enrichment in given KEGG pathways. The heatmaps represent log2 foldchange values of the genes (P1/P2)
Given the intrinsic link between photosynthesis and carbon assimilation, we explored the expression changes in associated genes [38]. Twenty-one transcripts associated with 11 KO terms were enriched in the carbon fixation in photosynthetic organisms’ pathway. Most transcripts, such as malate dehydrogenase, phosphoglycerate kinase, ribulose bisphosphate carboxylase small chain, fructose-bisphosphate aldolase 5, dirigent protein 1-like, vesicle-associated protein 4-2-like, probable ribose-5-phosphate isomerase 4, had lower expression in P2 compared to P1. These genes take part in the reductive pentose phosphate cycle [39]. Whereas, malate dehydrogenase transcripts that convert malate to pyruvate [40] had higher expression in P2 than P1 (Fig. 5). These expression changes indicate that the two plants, under the studied experimental conditions, differ in carbon fixation.
The expression of genes enriched in photosynthesis and antenna proteins was consistent with the total chlorophyll content, i.e., all the genes enriched in the photosynthesis pathway had lower expressions in P2 than in P1 (Fig. 5). The photosystem I reaction center subunit was the main KO term to which three transcripts were annotated. The most downregulated gene in P2 was cytochrome c553 (g38441_i0). This expression trend was also visible in antenna proteins such as chlorophyll a-b binding protein of LHCII type 1, chlorophyll a-b binding protein 5 and 21 (Fig. 5).
Thus, our results suggest that P2 possibly produces lower chlorophyll contents due to differences in the expression of genes in porphyrin biosynthesis. Moreover, the two plants also exhibit expression differences in several genes associated with photosynthesis, antenna proteins, and carbon fixation.
c. Expression difference in carotenoid biosynthesis related pathway genes
The carotenoid biosynthesis pathway is present downstream of the terpenoid backbone biosynthesis pathway. Therefore, we also explored the genes enriched in this pathway. A total of 18 genes, which were annotated as seven KO terms, were enriched in terpenoid backbone biosynthesis pathway. Six of these had higher expression in P2, while the remaining had higher expression in P1 (Fig. 6). Two genes (g32276_i0 and g9948_i0) annotated as probable 1-deoxy-D-xylulose-5-phosphate synthase 2 had higher expression in P2 than P1. This gene converts D-glyceraldehyde 3-phosphate to 1-deoxy-D-xylose 5-phosphate in the MEP side of the glycolysis pathway. Further down in this pathway, we observed that one of the four transcripts of isoprene biosynthesis gene (+)-epi-alpha-bisabolol synthase-like had higher expression in P2, while the remaining three had higher expression in P1. However, the transcripts annotated as geranylgeranyl pyrophosphate synthase (GPPS), the key gene that takes part in the conversion of isopentenyl-PP to geranyl-PP, or (E,E)-Famesyl-P and then to geranyl geranyl-PP [41], showed lower expressions in P2. Suggesting relatively lower resources being directed to carotenoid biosynthesis pathway in P2 compared to P1. Moreover, we observed higher expressions of xanthoxin dehydrogenase (also annotated as secoisolariciresinol dehydrogenase-like, g38663_i0, g31426_i0, and g29276_i0) in P2, suggesting xanthoxin conversion to abscisic aldehyde.
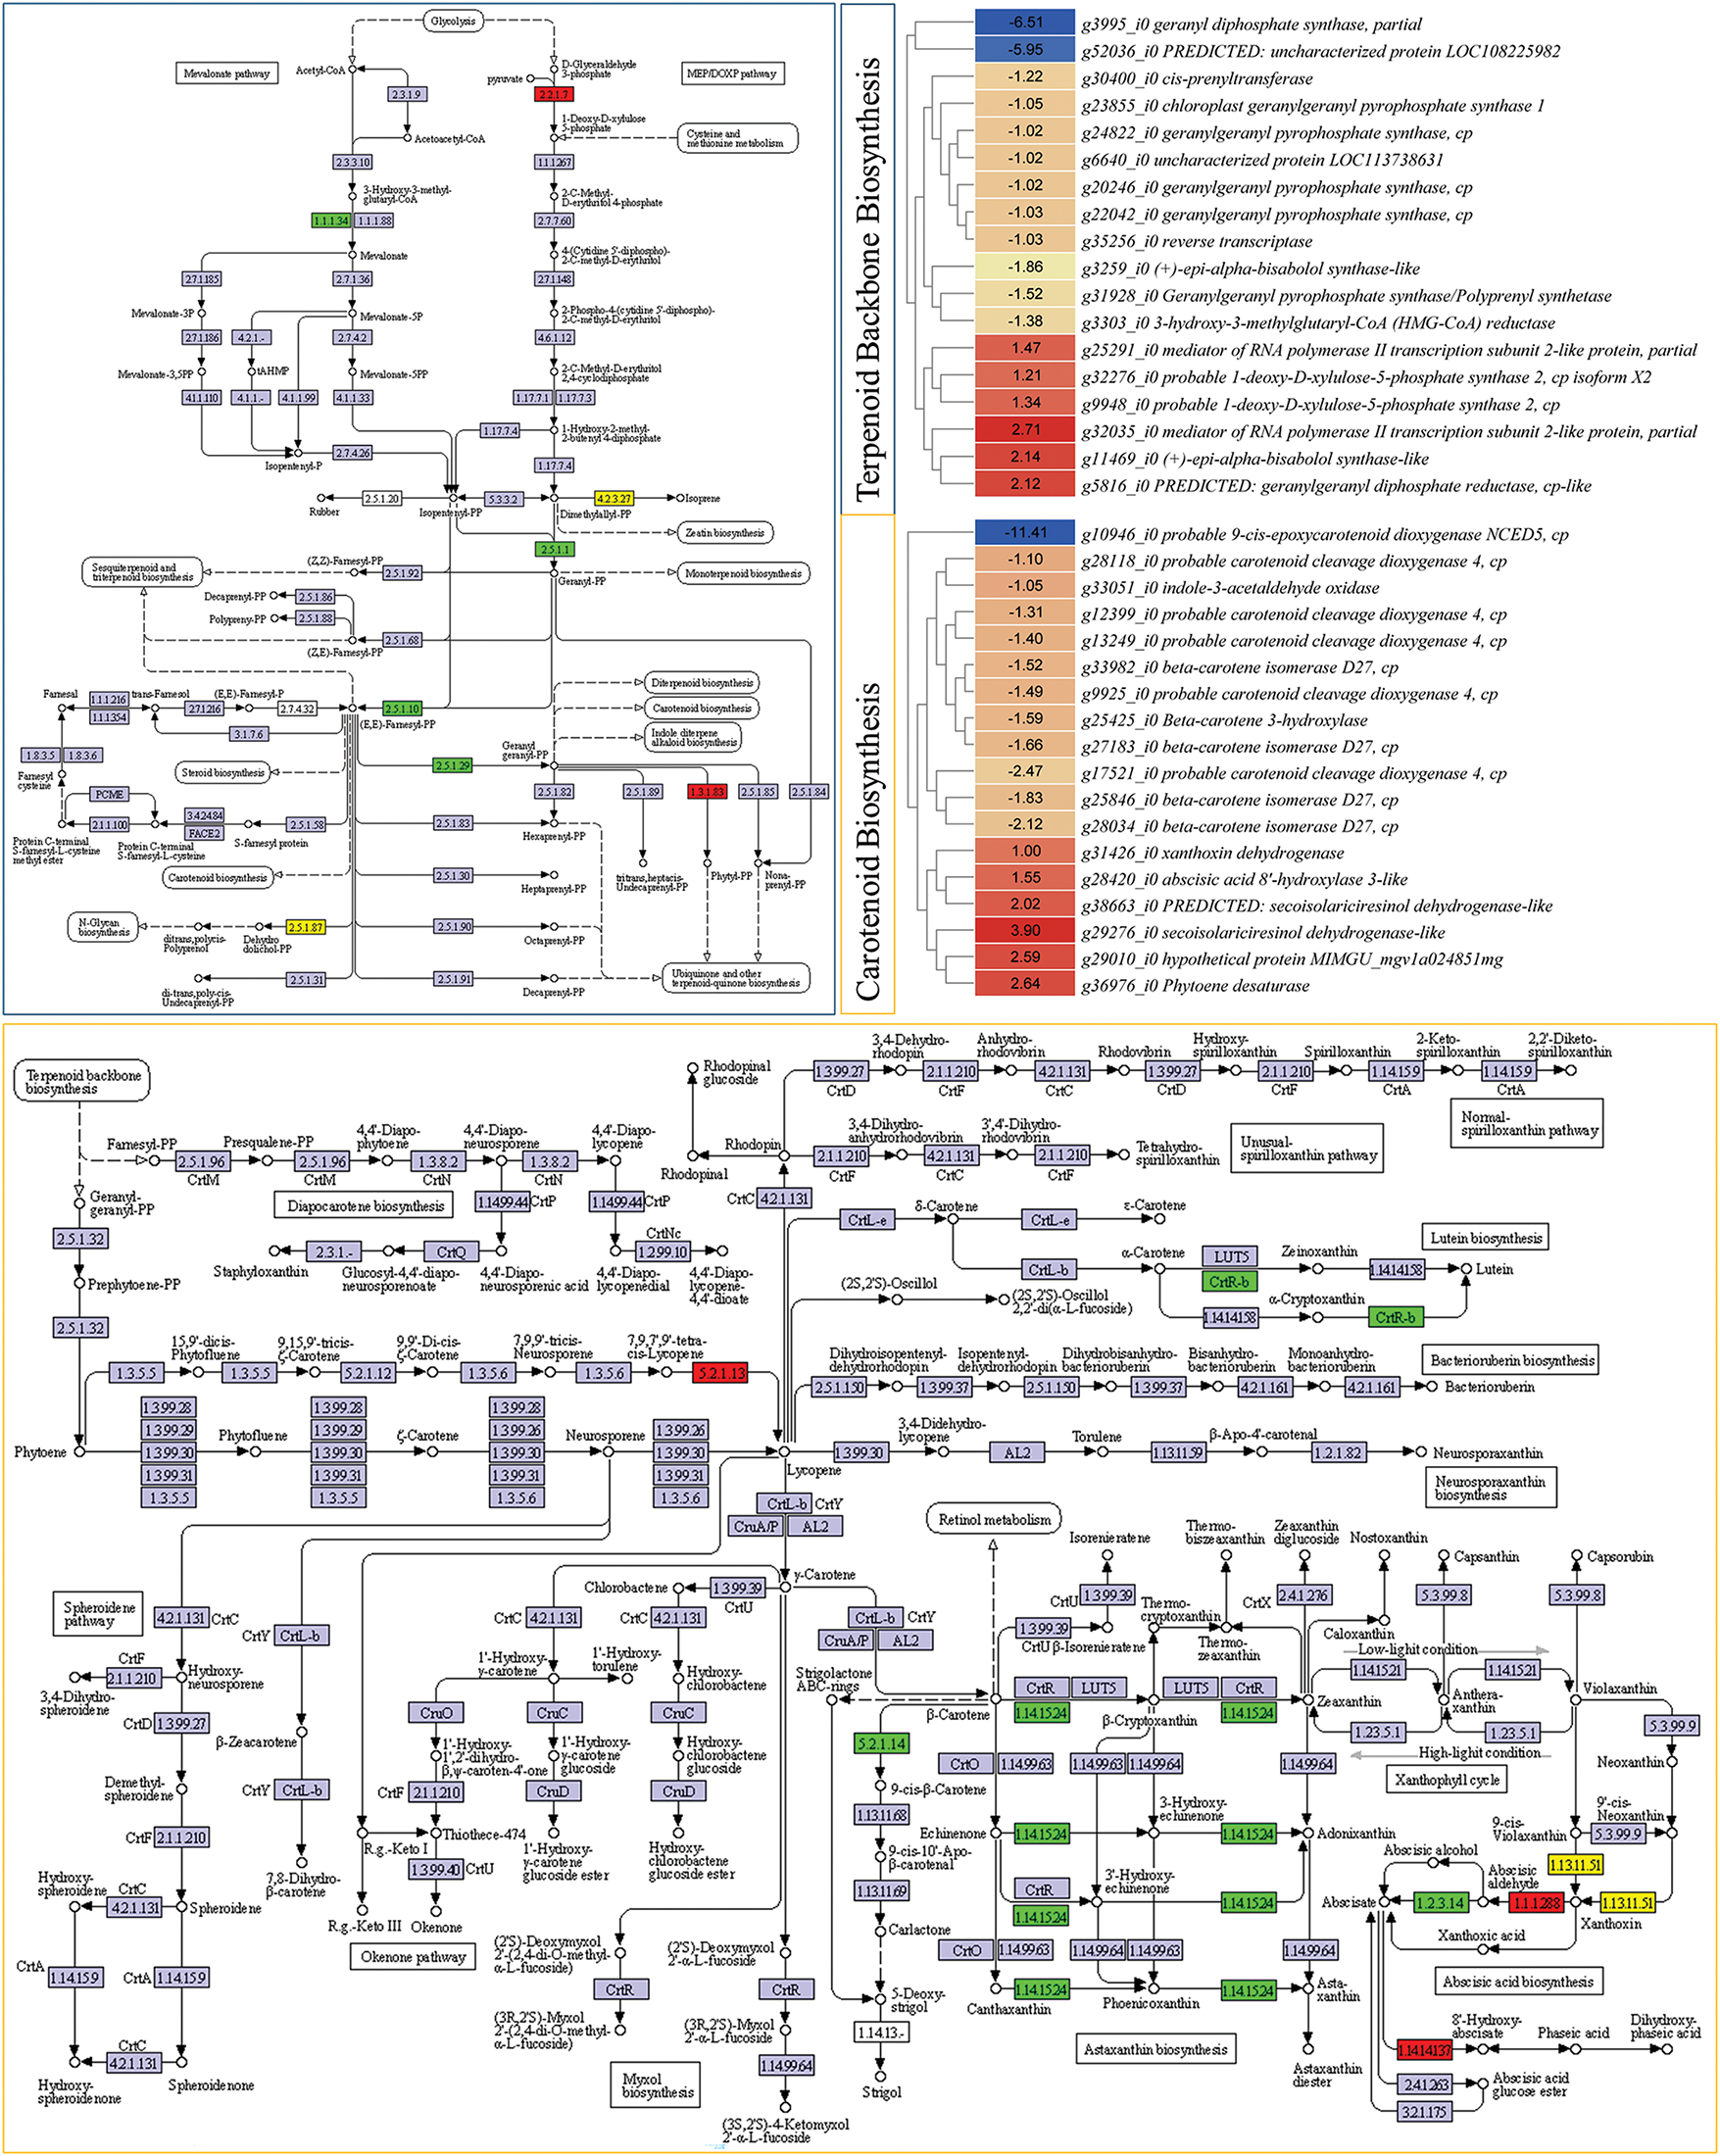
Figure 6: Differential expression of genes enriched in terpenoid backbone (top-left panel with blue border) and carotenoid synthesis (bottom panel with orange border) pathways. The heatmaps show log2foldchange (P1/P2) values of genes enriched in respective pathways. Green and red colors indicate lower and higher expressions of genes in P2 over P1, respectively. The yellow color indicates that there are multiple transcripts with both higher and lower expression in the same plant type
Next, 18 DEGs annotated as seven KO terms were enriched in the carotenoid biosynthesis pathway. Prolycopene isomerase (crtISO, g36976_i0), which converts 7,9,7′,9′-tetracis-lycopene to lycopene had higher expression in P2. However, other genes that further convert lycopene to lutein (g25425_i0), strigol (g25846_i0, g27183_i0, g28034_i0, and g33982_i0), zeaxanthin, and astaxanthin (g25425_i0) had lower expressions in P2 than P1 (Fig. 6). Whereas, transcripts annotated as 9-cis-epoxycarotenoid dioxygenase (probable carotenoid cleavage dioxygenase) showed mixed expression. Most had lower expression in P2, while one (g29010_i0) had higher expression. The LC-MS/MS results indicated higher zeaxanthin in P2, however, most genes in this pathway had lower expression except crtISO, suggesting other regulatory genes might be playing a role in the higher zeaxanthin levels in P2. The lower violaxanthin and neoxanthin contents in P2 are consistent with the higher expression of genes that convert their products to xanthoxin, abscisic aldehyde, abscisate, and ultimately to 8′-hydroxy-abscisate.
The reduced expression of beta-carotene 3-hydroxylase transcripts is consistent with lower total carotenoid content, and lower violaxanthin and 9′-cis-neoxanthin in P2 compared to P1 (Figs. 1b and 6).
These data sets propose that the naturally found mutant exhibits the observed phenotype due to differential regulation of carotenoid biosynthesis and porphyrin biosynthesis pathways.
d. Expression differences in signaling pathways
Since phytohormone and MAPK signaling intricately regulate chlorophyll biosynthesis and photosynthesis pathway, we explored expression changes in related genes. Large-scale transcriptome changes were observed in signaling-related pathways, i.e., plant hormone signal transduction and MAPK signaling. A total of 61 transcripts, which were annotated as 26 KO terms, were enriched in plant hormone signal transduction pathway. Genes enriched in all phytohormone signaling pathways, i.e., auxin, cytokinin, gibberellin, abscisic acid (ABA), ethylene, brassinosteroid, jasmonic acid (JA), and salicylic acid, were differentially expressed. Notably, auxin influx carrier (g15671_i0), ABA receptor PYR/PYL family member (g28438_i0, g32011_i0, g34919_i0), brassinosteroid insensitive 1-associated receptor kinase 1 (g12327_i0) had lower expressions in P2 than in P1. These genes are associated with the reception of auxin, ABA, and brassinosteroid, respectively. This suggests that the P2 is possibly deficient in these phytohormones. On the contrary, we observed higher expression of genes such as two-component response regulator ARR-A family members (g28845_i0 and g34500_i0), xyloglucan:xyloglucosyl transferase TCH4 (g27939_i0), cyclin D3 (g16608_i0), and others had higher expression in P2 than in P1. These expressions indicate that, in addition to other phytohormones, cytokinins, and brassinosteroids are either possible regulators of the phenotype or as a result of differential changes in the above-mentioned pathways, their biosynthesis and signaling might be affected. These observations should be confirmed by further detailed and hormone specific experiments to understand the endogenous content and how each of them impacts the observed phenotype (Fig. 7; Table S3).
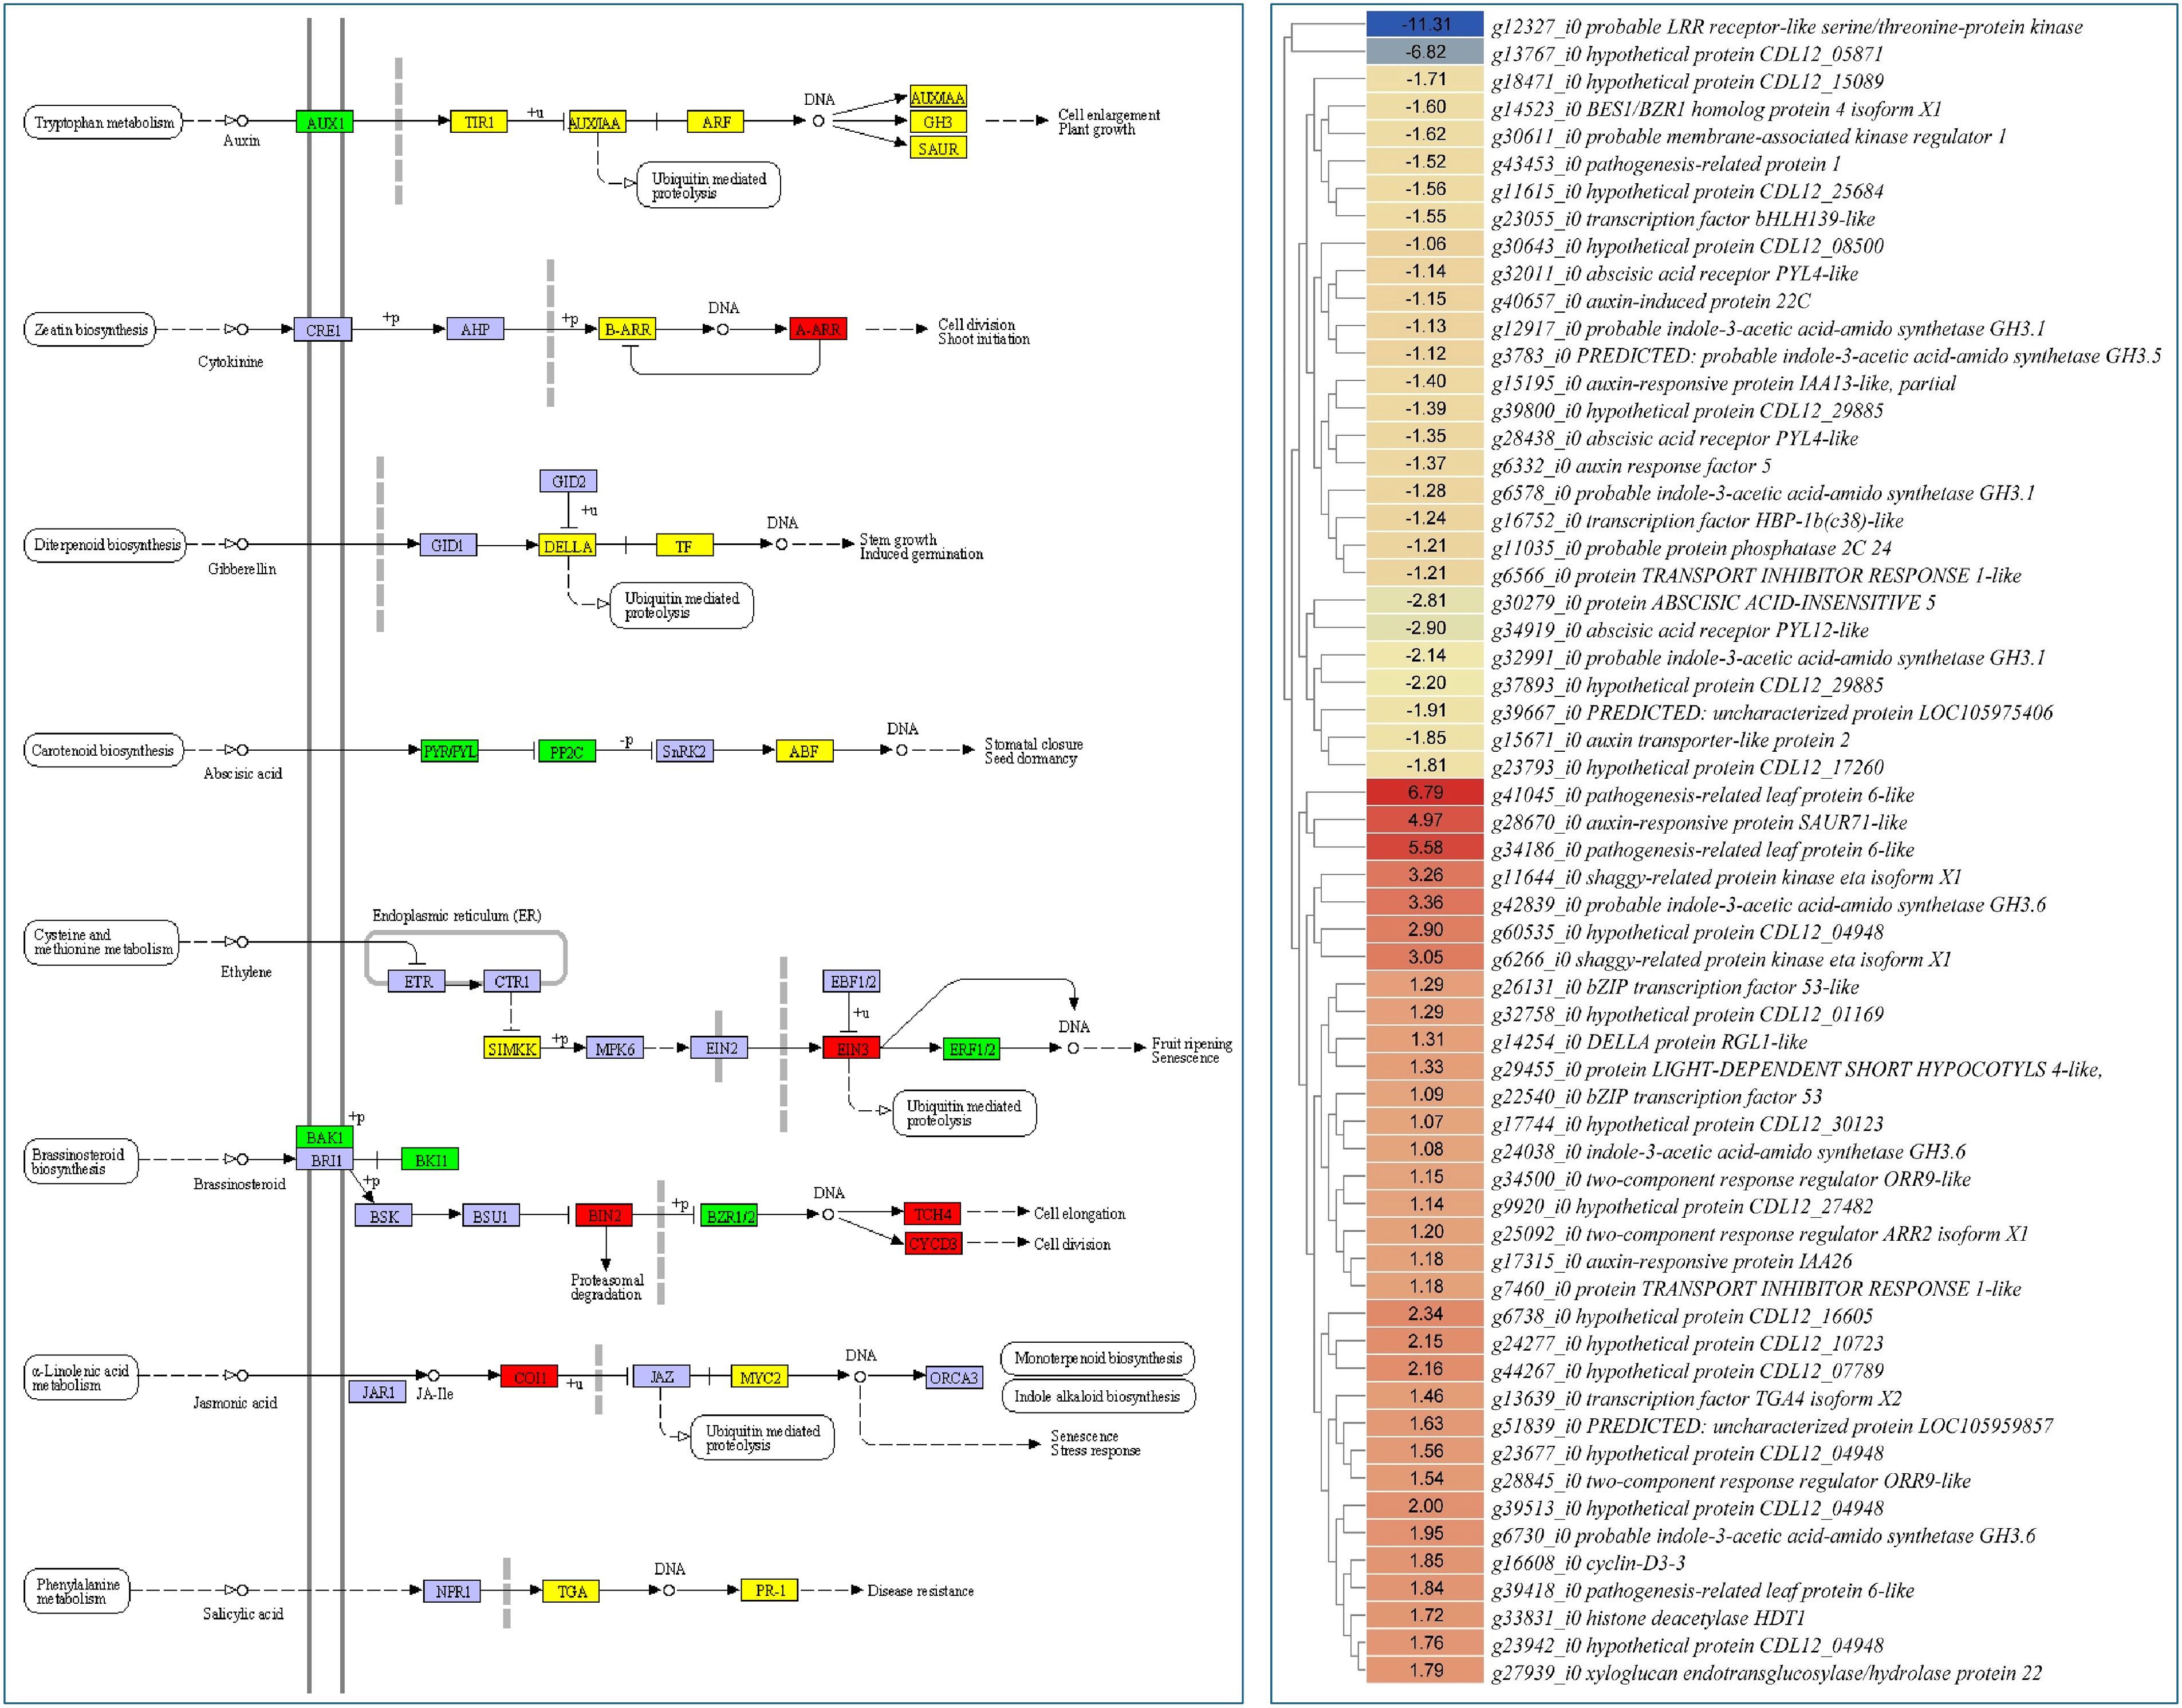
Figure 7: Differential expression of genes enriched in the plant-hormone signaling pathway. The heatmaps show log2foldchange values (P1/P2) of genes enriched in respective pathways. Green and red colors indicate lower and higher expressions of genes in P2 over P1, respectively. Yellow color indicates that there are multiple transcripts with both higher and lower expression in the same plant type
The highest number of transcripts enriched in signaling (224) were enriched in the MAPK signaling pathway. Notably, genes associated with H2O2, i.e., serine/threonine-protein kinase OXI1 (g23825_i0 and g24906_i0), respiratory burst oxidase (RbohD, g4417_i0), and ethylene responsive genes, i.e., P-type Cu+ transporter RAN1 (g1569_i0 and g24232_i0), protein EPIDERMAL PATTERNING FACTOR 1/2 (g43522_i0), LRR receptor-like serine/threonine-protein kinase ERECTA (g3123_i0 and g7610_i0), transcription factor SPEECHLESS (g32613_i0) had lower expressions in P2 than P1. Some genes such as WRKY33, WRKY22, calmodulin, and mitogen-activated protein kinase kinase kinase YODA had higher expressions in P2 than P1 (Table S3). These expression changes suggest large-scale signal transduction differences between P2 and P1 related to reactive oxygen species, ABA, ethylene, and stomatal development.
e. Expression differences in transcription factors
A total of 7697 transcription factors were differentially expressed in the two studied plants. These TFs belonged to 15 major families, with bHLH (1203) having the highest number of genes, followed by NAC (762), ERF (762), MYB-related (718), and others (Fig. 8). The TFs with the lowest expression in P2 than P1 are MYB-related (g32526_i0), bHLH (g23485_i0, g19468_i0, and g15162_i0), ERF (g11545_i0), FAR1 (g12327_i0), GRAS (g14947_i0), STAT (g20862_i0), C3H (g31916_i0), BBR-BPC (g3375_i0), and others. Contrarily, the members of TF families, i.e., CO-like (g42658_i0), HD-ZIP (g30351_i0), NAC (g24281_i0), FAR1 (g41045_i0), C2H2 (g47524_i0), bHLH (g20391_i0), and others (Table S4). Generally, the members of most TF families exhibited variable expression patterns, i.e., some members of the same family had higher expression while the others had lower expressions in the same plant type.
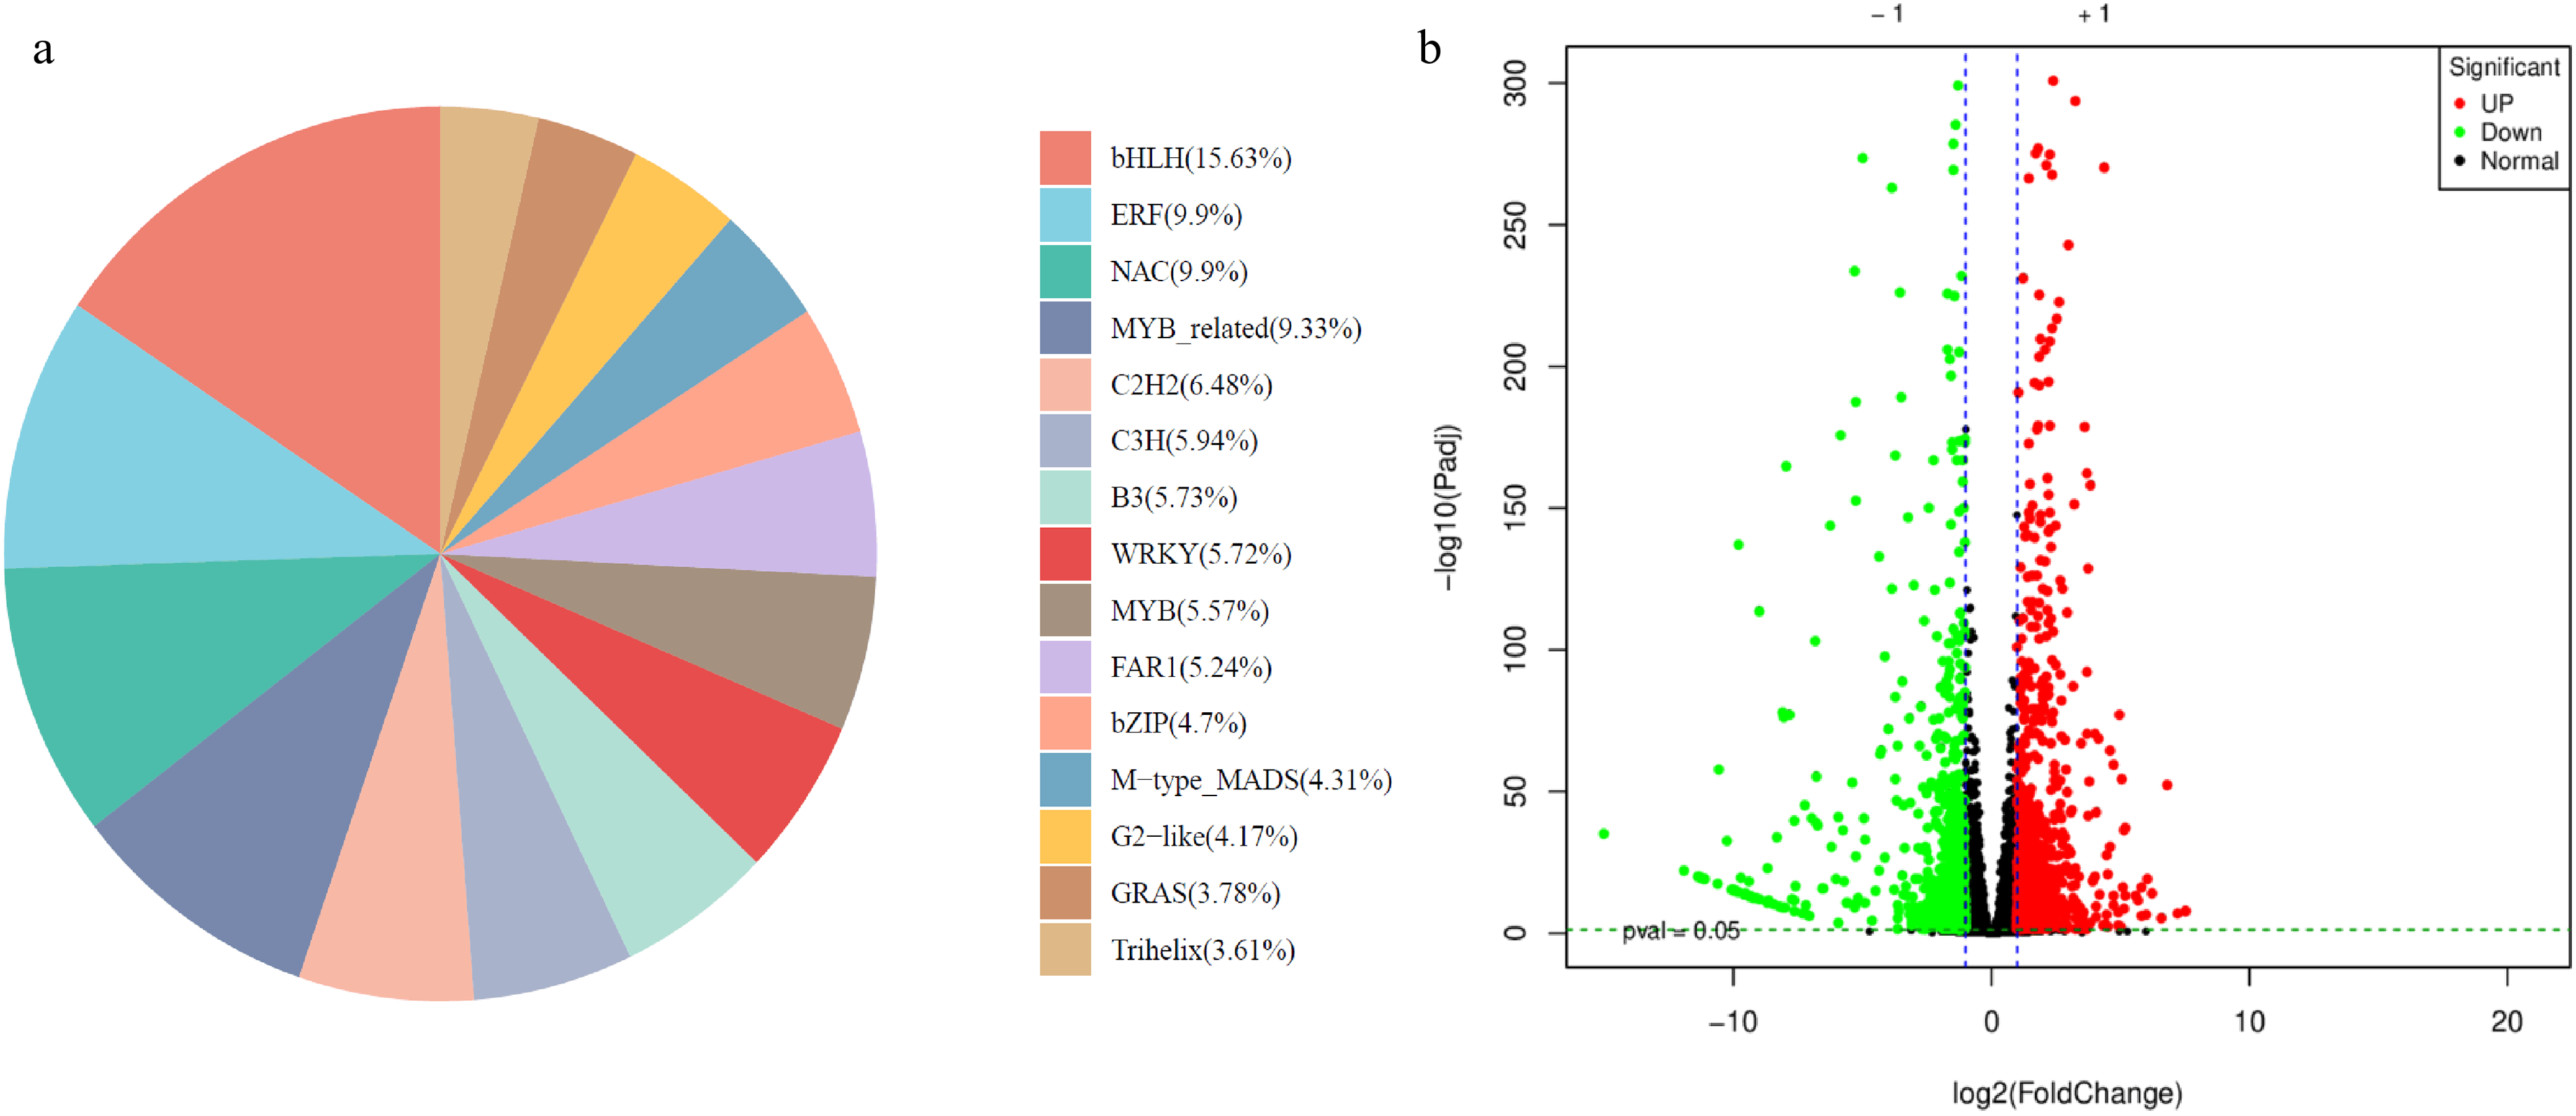
Figure 8: Differential expression of transcription factors in P1 vs. P2. (a) Pie-chart of TF families and corresponding % of transcripts annotated in the family. (b) Volcano plot of the differentially expressed TF in P1 vs. P2
3.4 Co-Joint Analysis of Transcriptome and LC-MS/MS Data
The LC-MS/MS and transcriptome data were co-jointly analyzed. Principal component analysis revealed that replicates of each type of plant type were grouped together in both the LC-MS/MS and transcriptome datasets. However, there was a higher variation between the two plant types (principal component 1) (Fig. 9a,b). The LC-MS/MS based metabolites (carotenoids and xanthophylls) and DEGs were enriched in biosynthesis of various plant secondary metabolites and carotenoid biosynthesis pathways (Fig. 9c). This is consistent with the pathway enrichment results of individual data analysis of LC-MS/MS and transcriptome. Particularly, we observed that the enrichment of carotenoid biosynthesis pathways confirmed the DEGs and carotenoids enriched in this pathway (Fig. S3). These genes and carotenoids exhibited higher correlation coefficients (>0.8) (Fig. 9d–f).
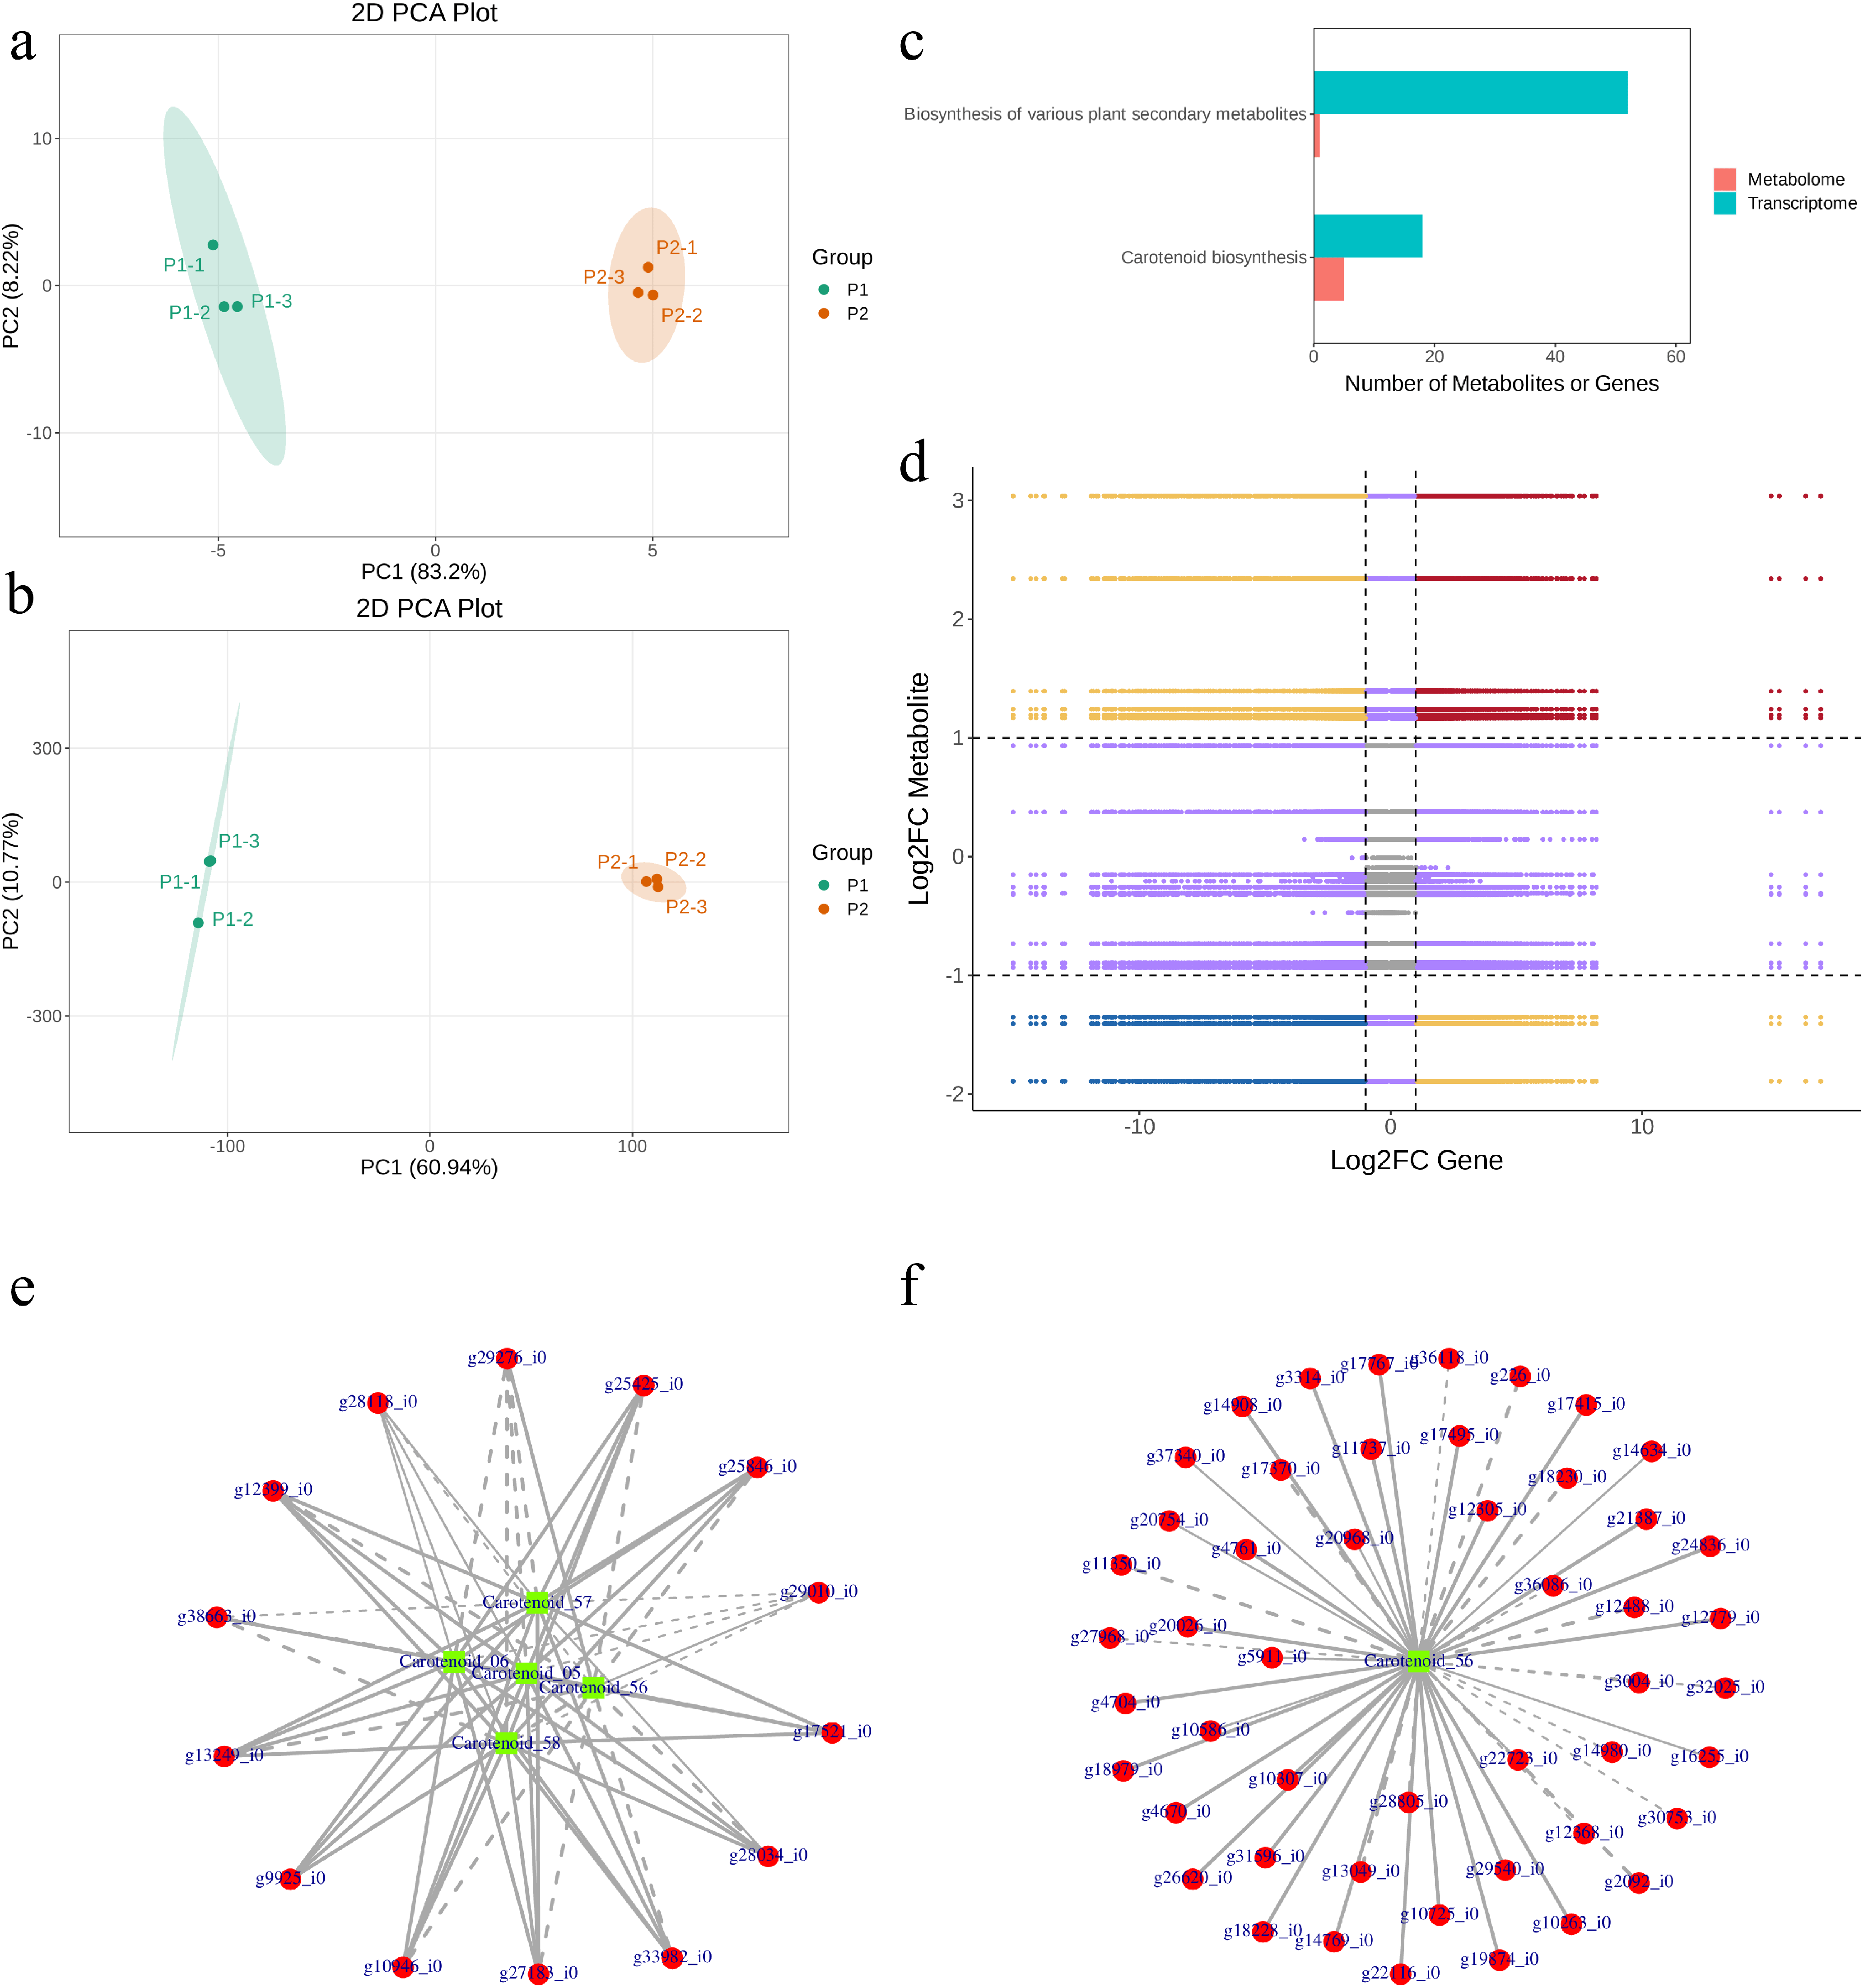
Figure 9: Co-joint analysis of LC-MS/MS and transcriptome data. Princiapl component analysis of (a) LC-MS/MS and (b) transcriptome data. (c) KEGG pathways to which the metabolites and genes were enriched. (d) Correlation (>0.8) between metabolites and transcripts. Quadrants 5 show that neither genes nor metabolites were differeitally expressed. Quadrants 3 and 7 show that the differential expression patterns of genes and metabolites are consistent. Quadrants 1 and 9 show that the differential expression patterns of genes and metabolites are opposite. Quadrants 2, 4, 6, and 8 show the metabolite expression remains unchanged, gene up- or down-regulated or gene expression remains unchanged, metabolite up- or down-regulated. (e, f) correlation network between carotenoids and differentially expressed genes
Leaf coloration is an important attribute that affects energy harvesting, pigment content, plant yield, ornamental value, and secondary metabolite composition (15–18). Therefore, leaf color diversity is considered an important trait. Yellow-leaf variants of the plants with naturally green leaves are valuable resources for understanding the key pathways associated with pigment biosynthesis, photosynthesis, carbon assimilation, and related signaling networks. In this regard, many studies from a wide range of plants have indicated that chlorophyll and carotenoids are major pigments [11,42]. Studies involving yellow leaf mutants compared to wild-type in tomato [11], wheat [42], Gingo biloba [17], and watermelon [12] have reported that the former have lower chlorophyll and carotenoid contents than the latter. Our results showing that P2 has lower total chlorophyll content than P1 (Fig. 1) are consistent with these studies. Such a difference in contents has been previously linked with differences in light harvesting, photosynthetic capacity, differential development of light-harvesting complex and antenna proteins [13,43,44]. Particularly, the significant differences in the pigment content suggest that their biosynthesis pathways function differently. In this regard, below we discuss the key differences in chlorophyll and carotenoid biosynthesis.
Chlorophyll is a tetrapyrrole that is synthesized as a part of the porphyrin metabolism pathway (KEGG pathway 00860; https://www.kegg.jp/pathway/map00860 (accessed on 01 Auguse 2025)). Chlorophyllase is an essential enzyme for chlorophyll catabolism. Its reduced expression is linked with increased chlorophyll content [45]. Our results, that P2 had lower chlorophyllase expression, suggest an alteration of the chlorophyll-to-chlorophyllide ratio [37]. Its expression also suggests that P2 is regulating reduced chlorophyll to chlorophyllides (a and b). However, future experiments should characterize this gene and explore further on its regulation. The higher hemE expression in P2 suggests increased coproporphyrinogen I and III biosynthesis [33]. Earlier studies have stated that its silencing reduces chlorophyll content [46]. Thus, the lower total chlorophyll content in P2 can also not be associated with hemE expression. It is possible that more resources are directed towards bilirubin since we also found UGT transcripts with higher expression in P2 than P1. Bilirubin is a degradative product of heme and is responsible for yellow color [47]. Several TFs have been characterized as being associated with chlorophyll biosynthesis at the transcriptional control level. The expression differences in members of 15 TF families suggest large-scale regulation differences between P1 and P2. For example, we noticed a large number of bHLH TFs with higher expression in P2. Studies have shown that bHLH, when overexpressed, can exhibit lower chlorophyll contents [48]. Similarly, when overexpressed in banana, NAC transgenic plants exhibited yellowing and de-greening of leaves [49]. Higher MYB expressions have also been linked with chlorophyll and carotenoids [50]. With reduced chlorophyll contents, yellow leaf mutants have been previously linked with poor photosynthetic performance [12]. The poor photosynthetic performance is linked with both differential carbon assimilation as well as the antenna proteins. Our results on the lower expression of several genes enriched in carbon fixation pathway propose that carbon fixation in P2 is possibly affected (Fig. 5) as noted in earlier studies [51]. Additionally, the reduced chlorophyll contents is consistent with lower expression of photosystem I and II antenna proteins (Fig. 5) [52]. However, these proposals should be further validated by studying chlorophyll fluorescence analysis under steady-state photosynthesis, antenna protein characterization, and CO2 assimilation. Nevertheless, our results demonstrate that P2 has lower chlorophyll content and that genes enriched in porphyrin metabolism, carbon fixation, photosynthesis, and photosynthesis-antenna protein pathways are differentially expressed between the two plant types.
Carotenoids accumulate in large quantities in many plant tissues, including leaves. The pattern of their accumulation in different tissues varies and depends on biosynthesis and degradation [53]. P2 leaves had lower total carotenoid content (Fig. 1), consistent with the relatively lower expression of most genes in the carotenoid biosynthesis pathway (Fig. 6). Beta-carotene isomerase is an essential gene for the production of β-carotene and xanthophylls in plants [54]. Its lower expression in P2 might be a potential reason for reduced total carotenoid content [55,56]. Leaf yellowing could be due to xanthophylls, i.e., violaxanthin (orange color) and lutein esters (lutein is yellow) [56]. The exclusive presence of five compounds in P2 indicates large-scale differences of metabolites enriched in carotenoid biosynthesis in this plant leaves. The lower violaxanthin and neoxanthin content in P2, together with the relatively higher expression of the xanthoxin dehydrogenase and ABA 8′—hydroxylase, indicate possible phytohormonal differences in the two plants. ABA 8′—hydroxylase produces phaseic acid, a catabolic product of ABA [57]. Whereas, xanthoxin dehydrogenase catalyzes the conversion of xanthoxin to abscisic aldehyde [58]. Other than the carotenoid biosynthesis pathway, genes enriched in terpenoid backbone biosynthesis, especially GPPS, suggest that P2 might allocate fewer resources to carotenoid biosynthesis [41]. Thus, our results demonstrate that P2 has a relatively lower total carotenoid content and a higher xanthophyll content. These differences are potentially due to differential expression of genes enriched in terpenoid backbone and carotenoid biosynthesis.
Together with light, phytohormones play an essential role in the biosynthesis of chlorophyll in plants. Recent studies have shown that ethylene, gibberellins, and other plant hormones regulate greening processes [59]. Ethylene, ABA, and JA signaling-mediated chlorophyll degradation have been reported [60]. Lower expression of several hormone signaling genes in P2 suggests a role for phytohormones in the observed phenotype. For example, when present in higher quantities, auxin promotes photosynthesis and chlorophyll biosynthesis [61]. Lower expression of the auxin influx carrier in P2 suggests reduced auxin influx in this plant. It is important to highlight that ABA is biosynthesized as a part of the carotenoid biosynthesis pathway. Moreover, ABA has been associated with increased carotenoid and chlorophyll concentrations in tomatoes [62]. To this regard, the lower PYR/PYL expression in P2 suggests a potential role of ABA in the observed phenotype of R. chingii (Fig. 7). Brassinosteroids are known for positively impacting photosynthetic machinery, improving the quantum yield of photosystems, and increasing the rate of electron transport [63]. Consistently, the lower expression of brassinosteroid-insensitive 1-associated receptor kinase 1 in P2 could suggest a similar role for brassinosteroids in lower chlorophyll content, as well as reduced expression of photosystem-related genes in P2. Overall, the expression changes in signaling-related genes suggest a putative role for multiple phytohormones in the observed yellow leaf phenotype.
These datasets are highly valuable and suggest several molecular mechanisms that may be responsible for the observed leaf phenotype. Key future research on the P2 yellow leaf mutant should validate these results. In particular, it should examine how chlorophyll and carotenoid biosynthesis change with leaf growth and development, as well as changes in the photosynthetic apparatus, antenna proteins, and photosynthetic efficiency. Studies could also focus on the structural features of chloroplasts and antenna proteins. Furthermore, the role of phytohormones and their signaling should be validated through the quantification of endogenous levels, the application of exogenous levels, and the characterization of biosynthesis and signaling genes.
This research reports a pigment content (chlorophyll and carotenoid), carotenoid profile, and transcriptome comparison of leaves of a wild-type and naturally found yellow leaf mutant of R. chingii. We conclude that the yellow leaf mutant plant leaves have lower total pigment contents. The carotenoid profile of the two leaves differs, with the yellowish leaves having higher xanthophylls (neoxanthin, violaxanthin, lutein dioleate, lutein myristate, lutein distearate, zeaxanthin-myristate-palmitate, lutein caprate, zeaxanthin-laurate-myristate, zeaxanthin-palmitate-stearate, and violaxanthin palmitate) and carotenoids (E/Z-phytoene and phytofluence). The transcriptome of the two leaves differs significantly and the DEGs were enriched in many primary and secondary metabolism pathways. Most importantly, we conclude that the terpenoid backbone and carotenoid biosynthesis pathway genes express differentially. Similarly, we observed expression differences in porphyrin metabolism, photosynthesis, antenna proteins, and carbon fixation pathways. The data suggest a potential role of phytohormones especially ABA, ethylene, and brassinosteroids.
Acknowledgement: Not applicable.
Funding Statement: This research was funded by the Beijing Gardening and Greening Youth Innovation Talent Support Program (kjcx202336), and the Key R&D Project of the Open Subject of the Beijing Key Laboratory for Greening Plant Breeding (YZZD202403).
Author Contributions: Conceptualization, Lina Song and Huali Zhang; Data curation, Lina Song, Yuxin Peng and Hua Zhang; Formal analysis, Lina Song, Shiwei Zhao, Yuxin Peng, Zijing Li, Yuqiang Zhang and Hua Zhang; Funding acquisition, Huali Zhang; Investigation, Lina Song, Caijie Yi, Shiwei Zhao, Zijing Li, Yuqiang Zhang, Helan Qin and Huali Zhang; Methodology, Lina Song, Caijie Yi, Shiwei Zhao, Zijing Li, Yuqiang Zhang, Hua Zhang, Helan Qin and Huali Zhang; Project administration, Huali Zhang; Resources, Caijie Yi, Shiwei Zhao, Zijing Li and Huali Zhang; Software, Caijie Yi and Yuxin Peng; Supervision, Huali Zhang; Validation, Lina Song, Yuxin Peng, Hua Zhang and Helan Qin; Visualization, Lina Song and Yuqiang Zhang; Writing—original draft, Lina Song; Writing—review & editing, Caijie Yi, Yuxin Peng, Hua Zhang, Helan Qin and Huali Zhang. All authors reviewed the results and approved the final version of the manuscript.
Availability of Data and Materials: All the data generated are presented either in the manuscript or Supplementary Material. The RNA sequencing data have been submitted to NCBI-SRA with accession PRJNA1253931.
Ethics Approval: Not applicable.
Conflicts of Interest: The authors declare no conflicts of interest to report regarding the present study.
Supplementary Materials: The supplementary material is available online at https://www.techscience.com/doi/10.32604/phyton.2025.068133/s1. Table S1: Summary statistics of transcriptome sequencing of six Rehmannia chingii libraries. Table S2: Reference sequence alignment statistics. Table S3: List of differentially expressed genes between P1 (wild-type) and P2 (yellow-leaf mutant) Rehmannia chingii plant leaves. Table S4: Expression (FPKM values) of transcription factors in P1 and P2 R. chingii leaves. Figure S1: Principal component analysis based on the overall gene expression in P1 (wild-type) and P2 (yellow-leaf mutant) Rehmannia chingii plants. Figure S2: (a) KEGG pathways to which the differentially expressed genes between P1 (wild-type) and P2 (yellow-leaf mutant) Rehmannia chingii plants were expressed. Figure S2: (b) GO terms to which the differentially expressed genes between P1 (wild-type) and P2 (yellow-leaf mutant) Rehmannia chingii plants were expressed. Figure S3: Metabolites (carotenoid and xanthophyll) and DEG enriched in carotenoid biosynthesis pathway. Blue, red, and yellow colors represent low, high, and mixed expression of DEGs in P2 compared to P1 R. chingii leaves. Figure S3: Metabolites (carotenoid and xanthophyll) and DEG enriched in carotenoid biosynthesis pathway. Blue, red, and yellow colors represent low, high, and mixed expression of DEGs in P2 compared to P1 R. chingii leaves.
References
1. Sun J, Sun M, Wang D, Xu K, Hu R, Zhang Y. Plastomes of two Rehmannia species: comparative genomic and phylogenetic analyses. Mitochondrial DNA B. 2021;6(3):753–4. doi:10.1080/23802359.2021.1878953. [Google Scholar] [PubMed] [CrossRef]
2. Xu Y, Zhang J, Ma C, Lei Y, Shen G, Jin J, et al. Comparative genomics of orobanchaceous species with different parasitic lifestyles reveals the origin and stepwise evolution of plant parasitism. Mol Plant. 2022;15(8):1384–99. doi:10.1016/j.molp.2022.07.007. [Google Scholar] [PubMed] [CrossRef]
3. Ma Y, Liu C, Li Z-H, Li J, Liu Z-L. Development of twelve nuclear microsatellites in the endemic herb Rehmannia chingii using next generation sequencing. Conserv Genet Resour. 2015;7(1):223–4. doi:10.1007/s12686-014-0340-3. [Google Scholar] [CrossRef]
4. van Wietmarschen HA, van der Greef J, Schroën Y, Wang M. Evaluation of symptom, clinical chemistry and metabolomics profiles during Rehmannia six formula (R6) treatment: an integrated and personalized data analysis approach. J Ethnopharmacol. 2013;150(3):851–9. doi:10.1016/j.jep.2013.09.041. [Google Scholar] [PubMed] [CrossRef]
5. Qin Z, Wang W, Liao D, Wu X, Xe Li. UPLC-Q/TOF-MS-based serum metabolomics reveals hypoglycemic effects of Rehmannia glutinosa, Coptis chinensis and their combination on high-fat-diet-induced diabetes in KK-Ay mice. Int J Mol Sci. 2018;19(12):3984. doi:10.3390/ijms19123984. [Google Scholar] [PubMed] [CrossRef]
6. Liu Y-F, Shi G-R, Wang X, Zhang C-L, Wang Y, Chen R-Y, et al. Bioactive iridoid glycosides from the whole plants of Rehmannia chingii. J Nat Prod. 2016;79(2):428–33. doi:10.1021/acs.jnatprod.5b01126. [Google Scholar] [PubMed] [CrossRef]
7. Zheng C-J, Wu Y, Zhu J-Y, Zhao X-X, Qin L-P. Chemical constituents of the aerial parts of Rehmannia chingii. Chem Nat Compd. 2014;50(3):560–1. doi:10.1007/s10600-014-1017-6. [Google Scholar] [CrossRef]
8. Liu Y-F, Shi G-R, Wang X, Zhang C-L, Wang Y, Chen R-Y, et al. Nine new compounds from the whole plants of Rehmannia chingii. J Asian Nat Prod Res. 2016;18(6):509–19. doi:10.1080/10286020.2016.1173680. [Google Scholar] [PubMed] [CrossRef]
9. Zhou X, Yang S, Zhou F, Xu L, Shi C, He Q. Physiological, cytological and transcriptome analysis of a yellow–green leaf mutant in Magnolia sinostellata. Plants. 2025;14(7):1037. doi:10.3390/plants14071037. [Google Scholar] [PubMed] [CrossRef]
10. Fu M, Cheng S, Xu F, Chen Z, Liu Z, Zhang W, et al. Advance in mechanism of plant leaf colour mutation. Not Bot Horti Agrobot Cluj-Napoca. 2021;49(2):12071. doi:10.15835/nbha49212071. [Google Scholar] [CrossRef]
11. Cheng M, Meng F, Mo F, Chen X, Zhang H, Wang A. Insights into the molecular basis of a yellow leaf color mutant (ym) in tomato (Solanum lycopersicum). Sci Hortic. 2022;293(2):110743. doi:10.1016/j.scienta.2021.110743. [Google Scholar] [CrossRef]
12. Xu B, Zhang C, Gu Y, Cheng R, Huang D, Liu X, et al. Physiological and transcriptomic analysis of a yellow leaf mutant in watermelon. Sci Rep. 2023;13(1):9647. [Google Scholar] [PubMed]
13. Shen J, Li X, Zhu X, Ding Z, Huang X, Chen X, et al. Molecular and photosynthetic performance in the yellow leaf mutant of Torreya grandis according to transcriptome sequencing, chlorophyll a fluorescence, and modulated 820 nm reflection. Cells. 2022;11(3):431. doi:10.3390/cells11030431. [Google Scholar] [PubMed] [CrossRef]
14. Zou Y, Huang Y, Zhang D, Chen H, Liang Y, Hao M, et al. Molecular insights into a non-lethal yellow bud mutant in Ilex × ‘Nellie R. Stevens’ Sci Hortic. 2024;329(549):113033. doi:10.1016/j.scienta.2024.113033. [Google Scholar] [CrossRef]
15. Zhao Y, Zhu M, Gao H, Zhou Y, Yao W, Zhao Y, et al. Photosynthetic characteristics and genetic mapping of a yellow-green leaf mutant jym165 in soybean. BMC Plant Biol. 2024;24(1):1009. doi:10.1186/s12870-024-05740-y. [Google Scholar] [PubMed] [CrossRef]
16. Farahmand H, Mehdikhani N. The role of pigments and the putative mechanisms involved in plants’ leaf color change and its importance in landscape. Flower Ornam Plants. 2016;1(1):60–77. [Google Scholar]
17. Wu Y, Guo J, Wang T, Cao F, Wang G. Metabolomic and transcriptomic analyses of mutant yellow leaves provide insights into pigment synthesis and metabolism in Ginkgo biloba. BMC Genom. 2020;21(1):1–12. doi:10.1186/s12864-020-07259-6. [Google Scholar] [PubMed] [CrossRef]
18. Li S, Yin M, Wang P, Gao L, Lv F, Yang R, et al. Phenolic compounds and antioxidant capacity comparison of wild-type and yellow-leaf gl1 mutant of Lagerstroemia indica. Plants. 2024;13(2):315. doi:10.3390/plants13020315. [Google Scholar] [PubMed] [CrossRef]
19. Han H, Zhou Y, Liu H, Chen X, Wang Q, Zhuang H, et al. Transcriptomics and metabolomics analysis provides insight into leaf color and photosynthesis variation of the yellow-green leaf mutant of Hami melon (Cucumis melo L.). Plants. 2023;12(8):1623. doi:10.3390/plants12081623. [Google Scholar] [PubMed] [CrossRef]
20. Li W, Li H, Shi L, Shen P, Li Y. Leaf color formation mechanisms in Alternanthera bettzickiana elucidated by metabolite and transcriptome analyses. Planta. 2022;255(3):59. doi:10.1007/s00425-022-03840-3. [Google Scholar] [PubMed] [CrossRef]
21. Chen C, Chen H, Zhang Y, Thomas HR, Frank MH, He Y, et al. TBtools: an integrative toolkit developed for interactive analyses of big biological data. Mol Plant. 2020;13(8):1194–202. doi:10.1016/j.molp.2020.06.009. [Google Scholar] [PubMed] [CrossRef]
22. Grabherr MG, Haas BJ, Yassour M, Levin JZ, Thompson DA, Amit I, et al. Trinity: reconstructing a full-length transcriptome without a genome from RNA-Seq data. Nat Biotechnol. 2011;29(7):644. doi:10.1038/nbt.1883. [Google Scholar] [PubMed] [CrossRef]
23. Kim D, Paggi JM, Park C, Bennett C, Salzberg SL. Graph-based genome alignment and genotyping with HISAT2 and HISAT-genotype. Nat Biotechnol. 2019;37(8):907–15. doi:10.1038/s41587-019-0201-4. [Google Scholar] [PubMed] [CrossRef]
24. Johnson M, Zaretskaya I, Raytselis Y, Merezhuk Y, McGinnis S, Madden TL. NCBI BLAST: a better web interface. Nucleic Acids Res. 2008;36(suppl_2):W5–9. doi:10.1093/nar/gkn201. [Google Scholar] [PubMed] [CrossRef]
25. Pruitt KD, Tatusova T, Maglott DR. NCBI reference sequences (RefSeqa curated non-redundant sequence database of genomes, transcripts and proteins. Nucleic Acids Res. 2007;35(suppl_1):D61–5. doi:10.1093/nar/gkl842. [Google Scholar] [PubMed] [CrossRef]
26. Apweiler R. Functional information in SWISS-PROT: the basis for large-scale characterisation of protein sequences. Brief Bioinform. 2001;2(1):9–18. doi:10.1093/bib/2.1.9. [Google Scholar] [PubMed] [CrossRef]
27. Ashburner M, Ball CA, Blake JA, Botstein D, Butler H, Cherry JM, et al. Gene ontology: tool for the unification of biology. Nat Genet. 2000;25(1):25–9. doi:10.1038/75556. [Google Scholar] [PubMed] [CrossRef]
28. Tatusov RL, Galperin MY, Natale DA, Koonin EV. The COG database: a tool for genome-scale analysis of protein functions and evolution. Nucleic Acids Res. 2000;28(1):33–6. doi:10.1093/nar/28.1.33. [Google Scholar] [PubMed] [CrossRef]
29. Kanehisa M, Goto S. KEGG: kyoto encyclopedia of genes and genomes. Nucleic Acids Res. 2000;28(1):27–30. doi:10.1093/nar/28.1.27. [Google Scholar] [PubMed] [CrossRef]
30. Finn RD, Bateman A, Clements J, Coggill P, Eberhardt RY, Eddy SR, et al. Pfam: the protein families database. Nucleic Acids Res. 2014;42(D1):D222–30. doi:10.1093/nar/gkt1223. [Google Scholar] [PubMed] [CrossRef]
31. Chen C, Chen H, He Y, Xia R. TBtools, a toolkit for biologists integrating various biological data handling tools with a user-friendly interface. Mol Plant. 2018;13(8):9. [Google Scholar]
32. Zhou J, Tracy TS, Remmel RP. Bilirubin glucuronidation revisited: proper assay conditions to estimate enzyme kinetics with recombinant UGT1A1. Drug Metab Dispos. 2010;38(11):1907–11. doi:10.1124/dmd.110.033829. [Google Scholar] [PubMed] [CrossRef]
33. Elder G, Roberts A. Uroporphyrinogen decarboxylase. J Bioenerg Biomembr. 1995;27(2):207–14. doi:10.1007/bf02110035. [Google Scholar] [PubMed] [CrossRef]
34. Mock H-P, Heller W, Molina A, Neubohn B, Sandermann H, Grimm B. Expression of uroporphyrinogen decarboxylase or coproporphyrinogen oxidase antisense RNA in tobacco induces pathogen defense responses conferring increased resistance to tobacco mosaic virus. J Biol Chem. 1999;274(7):4231–8. doi:10.1074/jbc.274.7.4231. [Google Scholar] [PubMed] [CrossRef]
35. Mock H-P, Grimm B. Reduction of uroporphyrinogen decarboxylase by antisense RNA expression affects activities of other enzymes involved in tetrapyrrole biosynthesis and leads to light-dependent necrosis. Plant Physiol. 1997;113(4):1101–12. doi:10.1104/pp.113.4.1101. [Google Scholar] [PubMed] [CrossRef]
36. Harpaz-Saad S, Azoulay T, Arazi T, Ben-Yaakov E, Mett A, Shiboleth YM, et al. Chlorophyllase is a rate-limiting enzyme in chlorophyll catabolism and is posttranslationally regulated. Plant Cell. 2007;19(3):1007–22. doi:10.1105/tpc.107.050633. [Google Scholar] [PubMed] [CrossRef]
37. Benedetti CE, Arruda P. Altering the expression of the chlorophyllase gene ATHCOR1 in transgenic Arabidopsis caused changes in the chlorophyll-to-chlorophyllide ratio. Plant Physiol. 2002;128(4):1255–63. doi:10.1104/pp.010813. [Google Scholar] [PubMed] [CrossRef]
38. Jenkins CL, Edwards GE, Andrews J. Reduction in chlorophyll content without a corresponding reduction in photosynthesis and carbon assimilation enzymes in yellow-green oil yellow mutants of maize. Photosynth Res. 1989;20(2):191–205. doi:10.1007/bf00034126. [Google Scholar] [PubMed] [CrossRef]
39. Sharkey TD. Pentose phosphate pathway reactions in photosynthesizing cells. Cells. 2021;10(6):1547. doi:10.3390/cells10061547. [Google Scholar] [PubMed] [CrossRef]
40. Schomburg D, Stephan D. Malate dehydrogenase (oxaloacetate-decarboxylating, NADP+). In: Enzyme handbook 9: class 11: oxidoreductases. Berlin/Heidelberg, Germany: Springer; 1995. p. 225–9. [Google Scholar]
41. Barja MV, Ezquerro M, Beretta S, Diretto G, Florez-Sarasa I, Feixes E, et al. Several geranylgeranyl diphosphate synthase isoforms supply metabolic substrates for carotenoid biosynthesis in tomato. New Phytol. 2021;231(1):255–72. doi:10.1101/2020.07.08.194076. [Google Scholar] [CrossRef]
42. Wu H, Shi N, An X, Liu C, Fu H, Cao L, et al. Candidate genes for yellow leaf color in common wheat (Triticum aestivum L.) and major related metabolic pathways according to transcriptome profiling. Int J Mol Sci. 2018;19(6):1594. doi:10.3390/ijms19061594. [Google Scholar] [PubMed] [CrossRef]
43. Li B. Study on the chlorophyll content in the leaves of Ligustrum vicaryi and L. quihoui. Sci Tech. 2005;30(3):63–5. [Google Scholar]
44. Ma ZH, Wang HT, Wei WQ, Yan YY. Change of photosynthetic pigments and enzyme activities of hot pepper (Capsicum annuum) CMS line leaves with yellow-green marker. China Cucurbits Veg. 2011;24:20–4. [Google Scholar]
45. Liu W, Liu S, Zhang K, Xie M, Sun H, Huang X, et al. Chlorophyllase is transcriptionally regulated by CsMYB308/CsDOF3 in young leaves of tea plant. Hortic Plant J. 2023;9(6):1162–76. doi:10.1016/j.hpj.2022.12.001. [Google Scholar] [CrossRef]
46. Hedtke B, Alawady A, Chen S, Börnke F, Grimm B. HEMA RNAi silencing reveals a control mechanism of ALA biosynthesis on Mg chelatase and Fe chelatase. Plant Mol Biol. 2007;64(6):733–42. doi:10.1007/s11103-007-9194-3. [Google Scholar] [PubMed] [CrossRef]
47. Pirone C, Quirke JME, Priestap HA, Lee DW. Animal pigment bilirubin discovered in plants. J Am Chem Soc. 2009;131(8):2830. doi:10.1021/ja809065g. [Google Scholar] [PubMed] [CrossRef]
48. Xu G, Lin M, Dai X, Hu J. Comparing the effectiveness of Chinese patent medicines containing red yeast rice on hyperlipidaemia: a network meta-analysis of randomized controlled trials. Endocrinol Diabetes Metab. 2022;5(1):e00314. doi:10.1002/edm2.314. [Google Scholar] [PubMed] [CrossRef]
49. Tak H, Negi S, Gupta A, Ganapathi T. A stress associated NAC transcription factor MpSNAC67 from banana (Musa x paradisiaca) is involved in regulation of chlorophyll catabolic pathway. Plant Physiol Biochem. 2018;132:61–71. doi:10.1016/j.plaphy.2018.08.020. [Google Scholar] [PubMed] [CrossRef]
50. Ampomah-Dwamena C, Thrimawithana AH, Dejnoprat S, Lewis D, Espley RV, Allan AC. A kiwifruit (Actinidia deliciosa) R2R3-MYB transcription factor modulates chlorophyll and carotenoid accumulation. New Phytol. 2019;221(1):309–25. doi:10.1111/nph.15362. [Google Scholar] [PubMed] [CrossRef]
51. Liu X, Yu W, Wang G, Cao F, Cai J, Wang H. Comparative proteomic and physiological analysis reveals the variation mechanisms of leaf coloration and carbon fixation in a xantha mutant of Ginkgo biloba L. Int J Mol Sci. 2016;17(11):1794. doi:10.3390/ijms17111794. [Google Scholar] [PubMed] [CrossRef]
52. Wang G, Zeng F, Song P, Sun B, Wang Q, Wang J. Effects of reduced chlorophyll content on photosystem functions and photosynthetic electron transport rate in rice leaves. J Plant Physiol. 2022;272(4):153669. doi:10.1016/j.jplph.2022.153669. [Google Scholar] [PubMed] [CrossRef]
53. Walter MH, Strack D. Carotenoids and their cleavage products: biosynthesis and functions. Nat Prod Rep. 2011;28(4):663–92. doi:10.1039/c0np00036a. [Google Scholar] [PubMed] [CrossRef]
54. Isaacson T, Ronen G, Zamir D, Hirschberg J. Cloning of tangerine from tomato reveals a carotenoid isomerase essential for the production of β-carotene and xanthophylls in plants. Plant Cell. 2002;14(2):333–42. doi:10.1105/tpc.010303. [Google Scholar] [PubMed] [CrossRef]
55. Lakshmi Jayaraj K, Thulasidharan N, Antony A, John M, Augustine R, Chakravartty N, et al. Targeted editing of tomato carotenoid isomerase reveals the role of 5′ UTR region in gene expression regulation. Plant Cell Rep. 2021;40(4):621–35. doi:10.1007/s00299-020-02659-0. [Google Scholar] [PubMed] [CrossRef]
56. Baranski R, Cazzonelli CI. Carotenoid biosynthesis and regulation in plants. Carotenoids Nutr Anal Technol. 2016;2016:159–89. doi:10.1002/9781118622223.ch10. [Google Scholar] [CrossRef]
57. Kim HM, Joung YH. Heterologous Eexpression of the hot pepper ABA 8′-hydroxylase in escherichia coli for phaseic acid production. J Microbiol Biotechnol. 2023;33(3):378. doi:10.4014/jmb.2301.01014. [Google Scholar] [PubMed] [CrossRef]
58. Endo A, Nelson KM, Thoms K, Abrams SR, Nambara E, Sato Y. Functional characterization of xanthoxin dehydrogenase in rice. J Plant Physiol. 2014;171(14):1231–40. doi:10.1016/j.jplph.2014.05.003. [Google Scholar] [PubMed] [CrossRef]
59. Liu X, Li Y, Zhong S. Interplay between light and plant hormones in the control of Arabidopsis seedling chlorophyll biosynthesis. Front Plant Sci. 2017;8:1433. doi:10.3389/fpls.2017.01433. [Google Scholar] [PubMed] [CrossRef]
60. Zhu X, Chen J, Qiu K, Kuai B. Phytohormone and light regulation of chlorophyll degradation. Front Plant Sci. 2017;8:1911. doi:10.3389/fpls.2017.01911. [Google Scholar] [PubMed] [CrossRef]
61. Narasimhan M, Gallei M, Tan S, Johnson A, Verstraeten I, Li L, et al. Systematic analysis of specific and nonspecific auxin effects on endocytosis and trafficking. Plant Physiol. 2021;186(2):1122–42. doi:10.1093/plphys/kiab380. [Google Scholar] [PubMed] [CrossRef]
62. Barickman TC, Kopsell DA, Sams CE. Abscisic acid increases carotenoid and chlorophyll concentrations in leaves and fruit of two tomato genotypes. J Am Soc Hortic Sci. 2014;139(3):261–6. doi:10.21273/jashs.139.3.261. [Google Scholar] [CrossRef]
63. Barros Junior UO, Lima MD, Alsahli AA, Lobato AK. Unraveling the roles of brassinosteroids in alleviating drought stress in young Eucalyptus urophylla plants: implications on redox homeostasis and photosynthetic apparatus. Physiol Plant. 2021;172(2):748–61. doi:10.1111/ppl.13291. [Google Scholar] [PubMed] [CrossRef]
Cite This Article
 Copyright © 2025 The Author(s). Published by Tech Science Press.
This work is licensed under a Creative Commons Attribution 4.0 International License , which permits unrestricted use, distribution, and reproduction in any medium, provided the original work is properly cited.
 Downloads
 Citation Tools