
 Submit a Paper
 Propose a Special lssue
 Open Access
ARTICLE

An Improved Lung Cancer Segmentation Based on Nature-Inspired Optimization Approaches
1 Chitkara University Institute of Engineering and Technology, Chitkara University, Rajpura, Punjab, 140401, India
2 Higher Polytechnic School, Universidad Europea del Atlántico, C/Isabel Torres 21, Santander, 39011, Spain
3 Department of Engineering, Universidad Internacional Iberoamericana, Arecibo, PR, 00613, USA
4 Uttaranchal Institute of Technology, Uttaranchal University, Dehradun, Uttarakhand, 248007, India
5 Computer Science Department, King Saud University, Riyadh, Saudi Arabia
6 Faculty of Medicine, Jordan University of Science and Technology, Irbid, Jordan
* Corresponding Authors: Surya Narayan Panda. Email: ; Ishu Sharma. Email:
Computer Modeling in Engineering & Sciences 2024, 138(2), 1051-1075. https://doi.org/10.32604/cmes.2023.030712
Received 19 April 2023; Accepted 06 June 2023; Issue published 17 November 2023
 View Full Text
 Download PDF
Abstract
The distinction and precise identification of tumor nodules are crucial for timely lung cancer diagnosis and planning intervention. This research work addresses the major issues pertaining to the field of medical image processing while focusing on lung cancer Computed Tomography (CT) images. In this context, the paper proposes an improved lung cancer segmentation technique based on the strengths of nature-inspired approaches. The better resolution of CT is exploited to distinguish healthy subjects from those who have lung cancer. In this process, the visual challenges of the K-means are addressed with the integration of four nature-inspired swarm intelligent techniques. The techniques experimented in this paper are K-means with Artificial Bee Colony (ABC), K-means with Cuckoo Search Algorithm (CSA), K-means with Particle Swarm Optimization (PSO), and K-means with Firefly Algorithm (FFA). The testing and evaluation are performed on Early Lung Cancer Action Program (ELCAP) database. The simulation analysis is performed using lung cancer images set against metrics: precision, sensitivity, specificity, f-measure, accuracy, Matthews Correlation Coefficient (MCC), Jaccard, and Dice. The detailed evaluation shows that the K-means with Cuckoo Search Algorithm (CSA) significantly improved the quality of lung cancer segmentation in comparison to the other optimization approaches utilized for lung cancer images. The results exhibit that the proposed approach (K-means with CSA) achieves precision, sensitivity, and F-measure of 0.942, 0.964, and 0.953, respectively, and an average accuracy of 93%. The experimental results prove that K-means with ABC, K-means with PSO, K-means with FFA, and K-means with CSA have achieved an improvement of 10.8%, 13.38%, 13.93%, and 15.7%, respectively, for accuracy measure in comparison to K-means segmentation for lung cancer images. Further, it is highlighted that the proposed K-means with CSA have achieved a significant improvement in accuracy, hence can be utilized by researchers for improved segmentation processes of medical image datasets for identifying the targeted region of interest.Keywords
Medical imaging has recently become an essential tool for screening cancer images. Recent imaging techniques provide enormous data in the form of sequential images that are difficult to evaluate manually. The precision and convergence time of segmentation algorithms determine the results [1]. Cancer is one of the leading causes of non-accidental death. Nowadays, the leading cause of death is due to Lung Cancer (LC), exclusively found in both men and women. According to World Health Organization, about 7.6 million people died due to LC worldwide [2]. An early and precise diagnosis followed by apt therapy under the guidance of professionals can significantly reduce the death rate [3]. Cancer can be characterized and understood as a group of living cells that have lost the balance between their growth and apoptosis. As a result, they exhibit uncontrolled growth and infiltration into the surrounding tissues. More specifically, there are two distinct categories of LC, namely non-small cell LC (NSCLC) and small cell LC (SCLLC). Out of these two, NSCLC is more common than SCLC. LC can only be cured if it is discovered at an early stage. LC can be diagnosed using a variety of technologies, including Medical Resonance Imaging (MRI), X-ray, and CT. Practitioners used different methods such as image processing, Artificial Neural Networks (ANN), and Pattern recognition to treat and diagnose the LC. These imaging modalities are used to diagnose various lung illnesses. Computer tomography (CT) is a common method of diagnosing and evaluating diseases [4]. However, a Computer Aided Diagnosis (CAD) system was used to identify the disease, particularly detecting cancer in the lungs. It is extremely beneficial to radiologists in terms of providing a second opinion on diagnosis, as well as improving their performance in terms of time and precision. Physicians and radiologists utilize CT images to detect and diagnose diseases, immediately view the morphologic features of cancer, define patterns of disease and its severity, and track the diseases, considering the clinical courses for medication purposes [5].
The image processing usually commences with the pre-processing of the raw images, followed by techniques involved in the identification of the tumor region, then extraction of viable features to demark the tumor, followed by the classification of type or class of tumor. To analyse the cancer images, Pre-processing of the original data has been done to extract the desired features. Further, noise and Gaussian blur in a sample image are reduced using the band pass filters and compared with the adaptive bilateral filter for better accuracy. Filtering is the most effective approach for obtaining a more accurate rate. The filtered signal has been further passed for image segmentation, in which cancer images are segmented using the existing techniques. The segmented images are used for feature extraction and classification of LC cells. The identified images were further diagnosed for the desired results. There are numerous efforts underway to revamp the detection and classification process using computer-aided diagnostic methods [6]. The development of computer-aided systems that were automatic improves the segmentation of lung cancer images [7]. But these were spurred by the need for trustworthy and objective analysis. So, it is vital to avoid the current medical imaging challenges by integrating meta-heuristic techniques. The identification of LC signs at an early stage not only saves the life of a human but also prospects the relevant treatment options [8]. The main motivation for conducting this research is to provide the precise segmentation of the lung cancer images so that the correct area can be identified for medical analysis. This research paper is an extension of our previous work, where K-means clustering with Fuzzy C-means is explored for the lung cancer image segmentation task [9]. The current paper contributes towards improved lung cancer segmentation with the integration of optimization techniques to overcome the limitations of K-means-based segmentation. This research work proposes an improved lung cancer segmentation technique based on the strengths of nature-inspired approaches. The proposed work utilizes four optimization approaches, namely, ABC, PSO, FFA, and CSA, to improve the overall lung cancer segmentation outcomes. Based on the simulation analysis, the paper demonstrated that CSA exhibited better segmentation outcomes in comparison to ABC, PSO, and FFA-based segmentation.
It is a very challenging task to segment the lung image due to homogeneity and complex pulmonary structures such as bronchi and arteries and different protocols used for analysis. Several publications have addressed lung region segmentation using CT images and chest radiograph images. The determination of healthy lung tissues in a CT image that is darkened is a challenging task. This fact has influenced many other researchers to determine the optimal threshold separating the lungs or segments of the tumor from other regions. Thus, it is difficult to refine the morphological operations in opened and closed forms. In this research, an attempt has been made to segment the tumor region using automated technology. The proposed research targets to optimally segment the accurate tumor locations in CT scan images, therefore it will help in improving the performance of deep learning methodologies for the early detection of lung cancer. The proposed research work presents the integration of nature-inspired techniques with K-means clustering to enhance the results achieved from the segmentation of lung cancer CT scan images. Though there exist various lung cancer segmentation approaches in the literature however there is still a scope to improve the accuracy by integrating segmentation algorithms with nature-inspired optimization approaches. The proposed segmentation methodology will assist the researchers in improvising the segmentation results of K-means clustering algorithms for various medical image datasets. The optimization approach of the K-means clustering technique leads the researchers to take an augmented decision for cluster centroids and other decision variables.
The rest of the paper is organized as follows. The review of the literature has been presented in Section 2 of the paper. Section 3 of the paper discusses the research methodology used in the research work, and the proposed optimization techniques for segmentation are detailed in sub-parts of this section. In Section 4, results and discussions are elaborated with comparative results. The conclusion of the research paper is drawn in Section 5.
Several LC classification and detection techniques have been developed to acquire good accuracy. The accuracy of these techniques is influenced by one of the key factors in how accurately the segmentation is performed on images, and it identifies the area which shows the lung cancer. This section elaborates on the existing LC segmentation techniques and their shortcomings.
In [4], authors Kavitha et al. proposed a technique that employed a novel stripping method that divides the image into three, four, five, and six strips. The suggested method is a marker-watershed method based on PSO and Fuzzy C-mean Clustering. The input signal was first decreased in noise and smoothed, then the filtered image was created using the proposed method, and the image was segmented using the marker watershed method. Second, the upgraded PSO technique was utilized to find the more appropriate figure for the clustering centers. The small section of the segmented image was clustered using Fuzzy C-mean in the final step, with the precise value of centers and the improved target function. In [5], the major goal of the research was to assess several CAD approaches to analyze the best technique, determine its limitations and shortcomings, and then propose a new version that improves on the existing best model. The strategy utilized aimed to filter and classify lung cancer detection techniques based on their type of detection performance. In [6], authors El-Regaily et al. determined the medical abnormalities using the automated system considering the medical images. The study includes five steps: the acquisition of data, processing, segmentation of lungs, detection of nodules, and reduction of false positives. In [7], authors Bhattacharjee et al. used the techniques such as feature extraction, pre-processing, probable nodule recognition, segmentation, and post-processing for supporting CAD systems in various stages of image processing. The primary purpose of this work was to develop an effective automated CAD system that can detect harmful nodules in the same way that a doctor can physically detect them.
In [10], authors classified the lung nodules dynamically, and the suggested method uses a complex and adaptive clustering approach termed Swarm with Fuzzy C-means (FSFCM). This method uses the FA search capabilities to discover the best initial clusters and hence enhance the segmentation performance. Although traditional unsupervised method such as fuzzy C-means is used for classifying the CT images, it still has a low rate of convergence, is prone to premature convergence, and is subject to initialization instability. The FA can be used to solve a variety of issues. The proposed system’s method is measured to that of other state-of-the-art algorithms. To evaluate the proposed strategy, an investigation was carried out utilizing real-time lung images. In 2021, authors suggested a method which had been used in conjunction with image processing techniques to create a novel diagnostic tool for medical reasons [8]. There have been two phases to implementing the proposed system. To detect infected regions in their early stages, optimization and deep learning had been applied. The data is then sent from MATLAB in the second phase. The CT picture is pre-processed with a median filter to reduce background noise after a selected database. The Otsu-Threshold technique is then used to segment an image in conjunction with CSA, and transmitted to a deep learning system, which decides whether it includes anything malignant or benign. In [11], the authors Zhao et al. considered the sections of lung parenchyma solitary pleural nodules and devised a segmentation algorithm. The authors used the split sample Davis-Putnam (DP) total least squares approach to optimize the profile after rough region expanding segmentation of the lung parenchyma. Further, the statistical method was used to get the ideal repair size bowl. The authors discussed the development of a Lung cancer detection system using image processing methods [12]. Several techniques have been used, namely Gabon filter and Super Pixel Segmentation for De-noising and segmentation of medical images, respectively. Further, MATLAB was used for simulation results for the cancer detection system.
In [13], authors Fernandes et al. focused on the early detection of LC. The authors used the CT method to record two-dimensional (2D) and three-dimensional (3D) pictures inside of the body, notably the lungs. The primary clinical problem was highlighted using a CAD system and imaging retrieval system for extracting and analyzing tumors using segmented radiological images. The authors proposed a wavelet approach using the segment using the SVM classifier and considering the Region of Interest (RoI). The accuracy of the proposed model was 94.44%, sensitivity was 100%, and specificity was 93.75%. The study is limited to evaluating the feature subsets using the optimized features. The authors had been used the CNN technique to segment the LC using the CAD system [14]. The suggested CNN includes the different layered architecture of CNN with the conjunction of filters in which lung CT image is fed as input and produces a label map. The authors used a cross-validation approach to train and test using the dataset acquired using the computer-aided technique. The training has been performed with both labelled and non-labelled image portions. The experimental results reveal a considerable performance improvement compared to the existing techniques. The proposed CNN lung lesion detection accuracy was about 82%, with an average inference time of 58 ms.
In [15], authors observed detection of lung nodules are critical in CAD systems, and the reason behind this is their contrast is familiar with other structures and low density, which generates numerous false positive results. The performance of the PSO was integrated that optimize the input set of CNN to minimize the manual searches. When the authors tested this technique on CT from the lung image, Database Consortium, and image Database resource shows the highest accuracy of 97.62%, Sensitivity of 92.20%, Specificity of 98.64%, and area under the receiver operating characteristic curve of 0.955. Thus, the result demonstrates the high-performance potential of the PSO algorithm. The CAD method has been developed in this paper to boost analytical reliability and precision in active tuberculosis visual interpretation [16]. The optimized feature selection was chosen using a wrapper approach that integrates CSA and SVM classifiers. The CSA algorithm was implemented in two ways, using entropy and then without entropy. The classifier performs training on given features, and with an entropy estimate of about 93 percent accuracy, 47 features were chosen from the 98 features retrieved from the sick regions. When the entropy criteria were not utilized, 51 features were chosen, resulting in improved accuracy.
Senthil Kumar et al. proposed an efficient LC segmentation method to reduce the work of clinical practitioners [17]. The performance of five optimization techniques was evaluated to extract the tumor from the lung images. The adaptive median filter was used that outperformed the other filters in the pre-processing step, proving best to eliminate the noise and improve the quality pre-processed image had been obtained. MATLAB was used to verify the practical findings for 20 lung pictures, and it was discovered that the PSO performed superior in terms of accuracy, which was about 96%. The authors Prabukumar et al. presented an ideal diagnosis system in this research; identification of LC also increases the accuracy. Further, data safety had been kept using the fogging technique and had been utilized to keep the data safe [18]. The authors used the hybrid technique of Fuzzy C-Means (FCM) and region-expanding segmentation algorithms to segment the Region of Interest (ROI). The classification was done using the SVM and tested to classify the LC. The accuracy of the proposed method was about 98.5%, and false alarms were about 0.109. Kamal et al. in 2020 presented a Recurrent 3D-DenseUNet-based technique, which is unique deep learning for volumetric segmentation of LC images used for learning [19]. Both blocks are made up of numerous coupled take place, and the authors used the selective threshold approach for morphological operations to better distinguish between tumorous and non-tumorous regions.
Lenin Fred et al. used to select the best concentrators of the cluster using the integrated Fuzzy C-means with a variety of optimization strategies [20]. Optimization techniques have been commonly utilized in the segmentation and classification of tasks. The authors proposed the Crow Search (CS) Optimization for segmenting an image in this paper. Further, a comparison has been made with the existing algorithms in the segmentation of abdominal CT images, the CS optimization effective control system, and promising results. In addition, the selection of relevant validation functions for clustering algorithms has been thoroughly investigated. In [21], authors used the CAD system to analyse the cancer cells, especially to recognize the nodule images automatically. The authors used the improvement filter to revamp the quality of imported images and the selection of nodules. Additionally, a neural classifier was used to avoid the false reduction, and both nodules were tested internally and externally, which was shown in a characteristic curve. Fischer et al. in 2020 presented a study to validate the AI technique for automated lobe segmentation [22]. The chronic lung disease was segmented, and 137 patients were considered for experimentation. The authors also used the deep network to quantify the lung lobe, and outcomes showed that the error is less than 0.00001 for image segmentation. In [23], authors Tian et al. used an optimized algorithm using the rescue operation and fuzzy technique to diagnose the LC images. To test the superiority of the proposed technique, four performance indicators were used to evaluate the performance of the proposed method in terms of precision, recall, and F-measure in conjunction with the classification accuracy.
The authors solved the problem of pre-treatment and post-treatment associated with the process of organ segmentation [24]. This research study provided firmly learned PSO-based neighbourhood-influenced fuzzy C-means (DLPSO-NIFCM) techniques. Further, segmentation of the liver part from the Computed Tomography (CT) images of the abdomen, the proposed segmentation technique, had been successfully applied. The performance metrics were computed over the same data set along with the restructured single variable objective function of the distance. In [25], authors optimized the portion of the lungs using the CSA optimization approach, and the active contour technique has been used to segment the lung images. Further, the Markov field technique was used to process the segmented images. In 2021, Lavanya et al. proposed a method in which histogram equalization was used to improve the contrast, and a Gaussian filter had been used to remove the noise [26]. The firefly technique fuzzy C-means (FA-FCM) identification procedure was used to carry over the nodule segmentation process. In 2021, Thakur et al. used the hybrid K-means for the segmentation of the MNIST dataset [27]. The authors used the feature extraction approach to extract the lung region, and the CNN technique was also used for classification. Finally, using the classification approach, it is easy to determine the type of lung cancer.
In 2021, Chakraborty et al. implemented PSO-based neighbourhood-influenced fuzzy C-means for the segmentation of cancer images [24]. Authors had not only focussed on lung cancer images but also the liver and other organs. The analysis and evaluation of the segmentation work were performed using the Berkeley Segmentation Dataset containing scanned images of Human Subjects and achieved a segmentation accuracy of 97.83%. In [28], author utilized meta-heuristic techniques to classify the methods. The importance of ANN in medical imaging categorization, several forms of meta-heuristic algorithms used for optimization, and their integration had been covered in this research. In 2022, Bilal et al. proposed a technique for detecting and classifying LC to minimize the noise in images, the authors used the Grey Wolf Optimization (GWO) technique using a weighted filter, followed by segmentation and dilation approaches [29]. The proposed technique used to classify LC into three categories, with 98.33% for classification accuracy, claimed 100% for sensitivity, and 93.33% for specificity. The concept of the deep neural network [30] can also ensure the authenticity of medical data for working with epidemic diseases. The authors proposed ElGamal Blind Signature [31] technique for preserving the medical database from unauthenticated users’ access. The Rearrangement-Arnold technique [32] is a significant improvement in the direction of encrypting image datasets for boosting privacy in medical health databases. In 2022, He et al. proposed a model based on the ANN algorithm to create an LC segmentation model [33]. The image segmentation technique was used to independently display the lesion area after determining the LC-affected region. The performance metrics of ANNs were utilized to detect LC, with 94.6% accuracy, about 96% sensitivity, and around 94% specificity. The object in the image was extracted from the background of the image utilizing the graph cut technique where the weight matrix was generated by fuzzy C-means and an experimental study was performed on gray scale images [34]. This method is further improvised [35] for the process of accurate extraction of foreground and background for color images [36]. The authors [37] presented image segmentation methodology with Fuzzy C-Means and Cuckoo Search algorithm for the BSD300 dataset. The initial centres of clusters are identified by the Cuckoo Search algorithm and Fuzzy C-Means continues with the computed centroids. The revised encoder in the form of U-Net encoder is utilized for segmentation and experimental study is performed on datasets like ARIA [38]. The authors employed grabcut technique with K-means clustering for enhancing the segmentation of CT scan images for various parts and deep learning techniques were used for detection of disease [39]. Authors suggested performing global average pooling, replacing the fully connected layer of the neural network to improvise the feature selection process, hence the image pre-processing procedure can be improved [40].
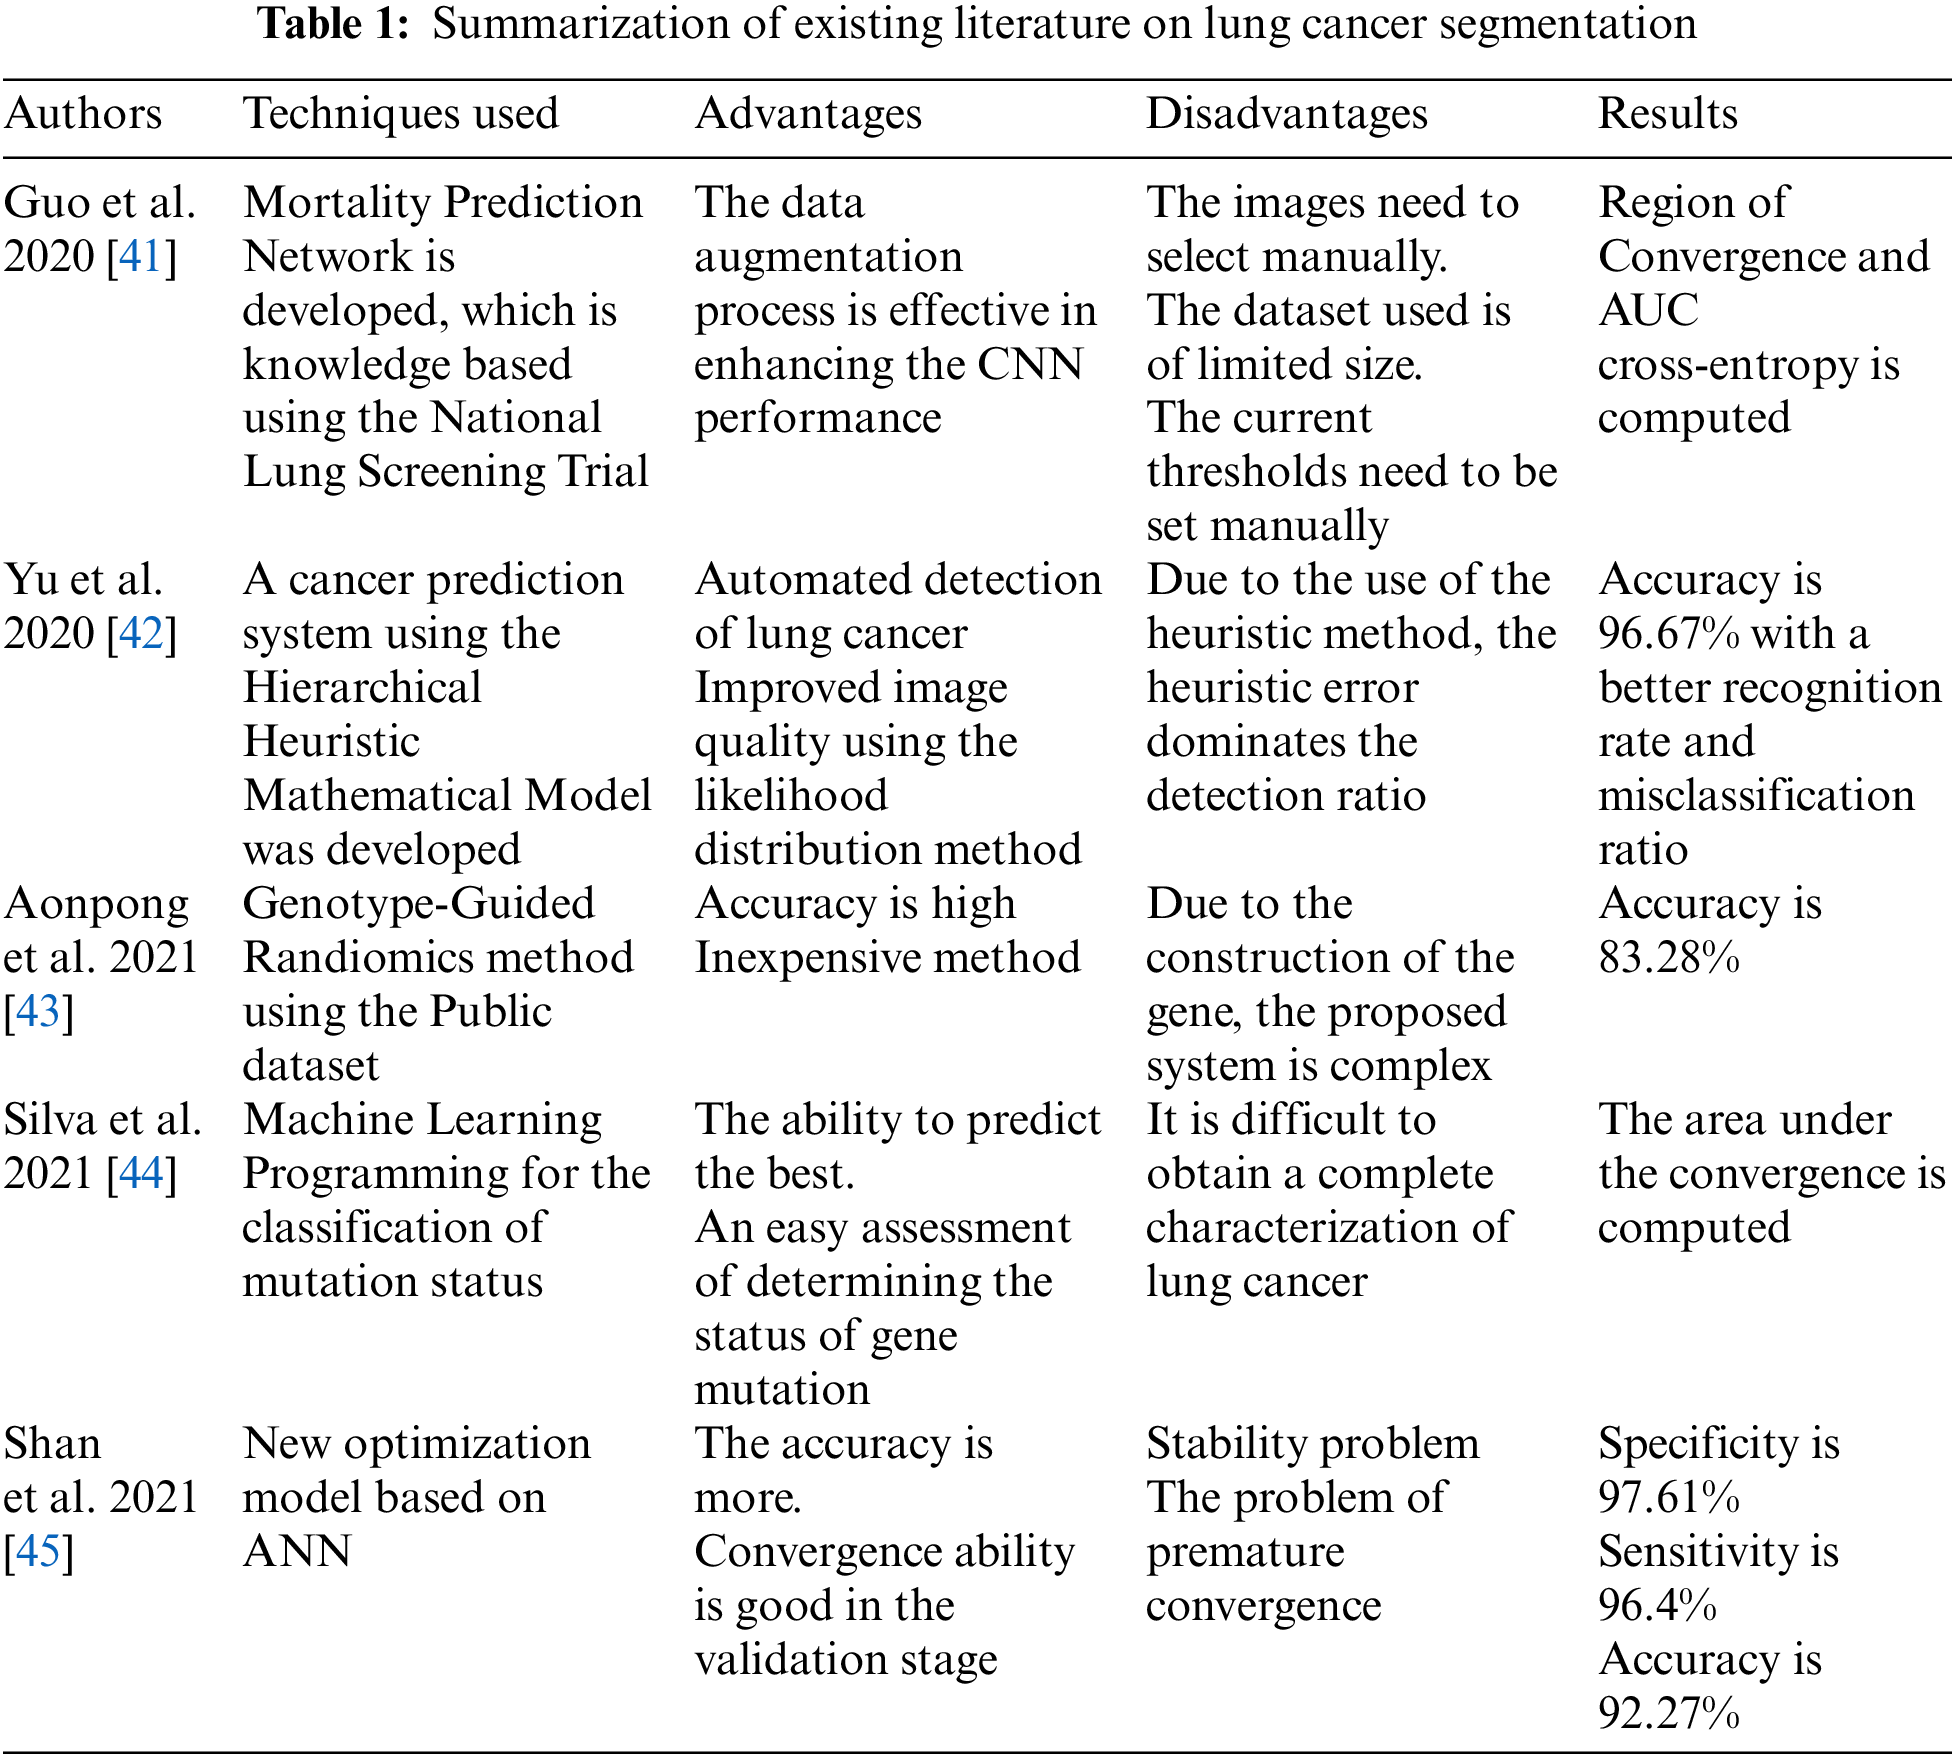
The existing research techniques for improving the segmentation of various type of image datasets utilizes multiple machine learning and deep learning techniques. It is highlighted through the literature review that the K-means clustering algorithm is widely employed by researchers for extracting foreground and background accurately for classification applications. Despite multiple existing optimization techniques for K-means clustering for the image segmentation process, there exists scope for improvement for enhancing the overall accuracy of K-means, which can lead to accurate identification of the region of interest. The nature-inspired algorithm has the capability to optimize the K-means clustering technique by improving the quality of clustering decisions. The integration of the K-means image segmentation technique with nature-inspired algorithms still has not been fully explored in the existing literature specifically for medical imaging datasets. This research paper targets to optimize the performance of the K-means image segmentation algorithm with nature-inspired solutions. Further, the summarization of existing literature on lung cancer image segmentation has been presented in Table 1.
The present research involves various salient elements, such as the dataset, the processing of the raw images obtained from the database, the process of segmentation, and techniques involved in the improvement of lung cancer segmentation.
Dataset: the dataset used here comprises 500 sample images that are obtained from the Public Lung Image Database [46]. This database was a result of collaboration between Vision and Image Analysis (VIA) and the Early Lung Cancer Action Program (ELCAP) research group. It mainly comprises 50 low doses of fully documented whole lung CT scan images made for lung cancer detection. The slice thickness of each scan is 1.25 mm and these images are also supported by the annotation for the location of nodules shared by radiologist [46,47].
Pre-processing: The consistency of the input image has been improved first to obtain high-quality diagnosis results. Data normalization has been carried out to set the minimum and maximum levels in the specified range [0, 1]. In this step, the lung cancer images (I) are pre-processed using adaptive intensity adjustment and using limited contrast stretching technique. A grayscale image has been processed as given in Eq. (1).
The assumptions had been made to normalize the image in Eq. (2).
The intensity values of the updated image have been normalized between
where,
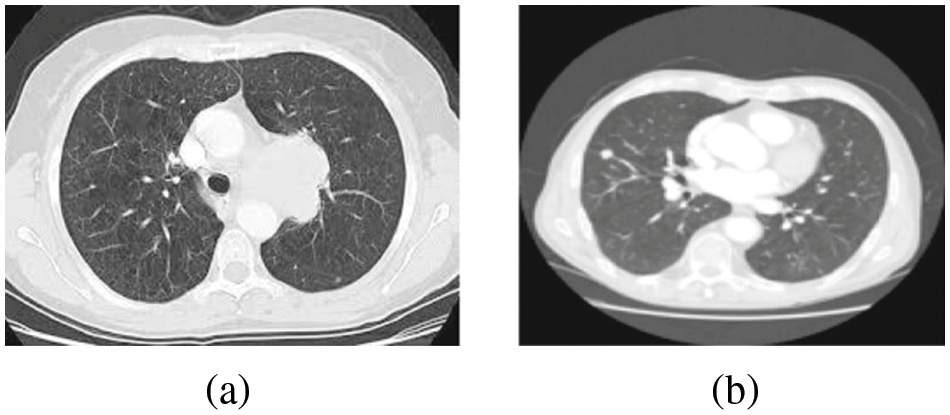
Figure 1: (a) Lung image (b) Diseased LC image
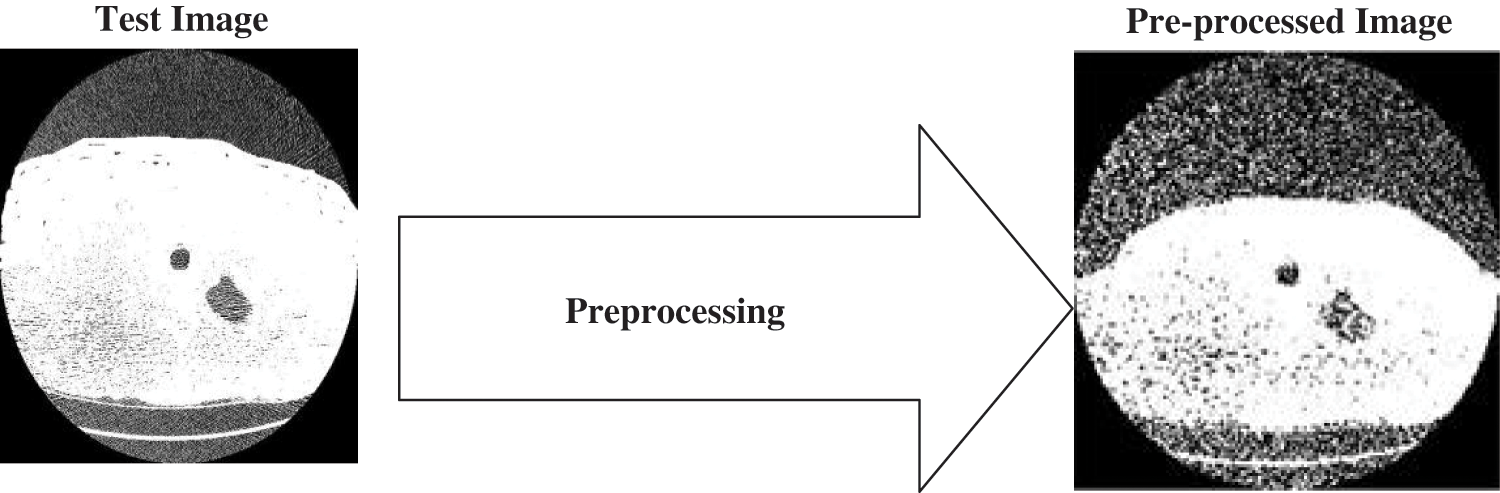
Figure 2: Pre-processing of lung cancer image
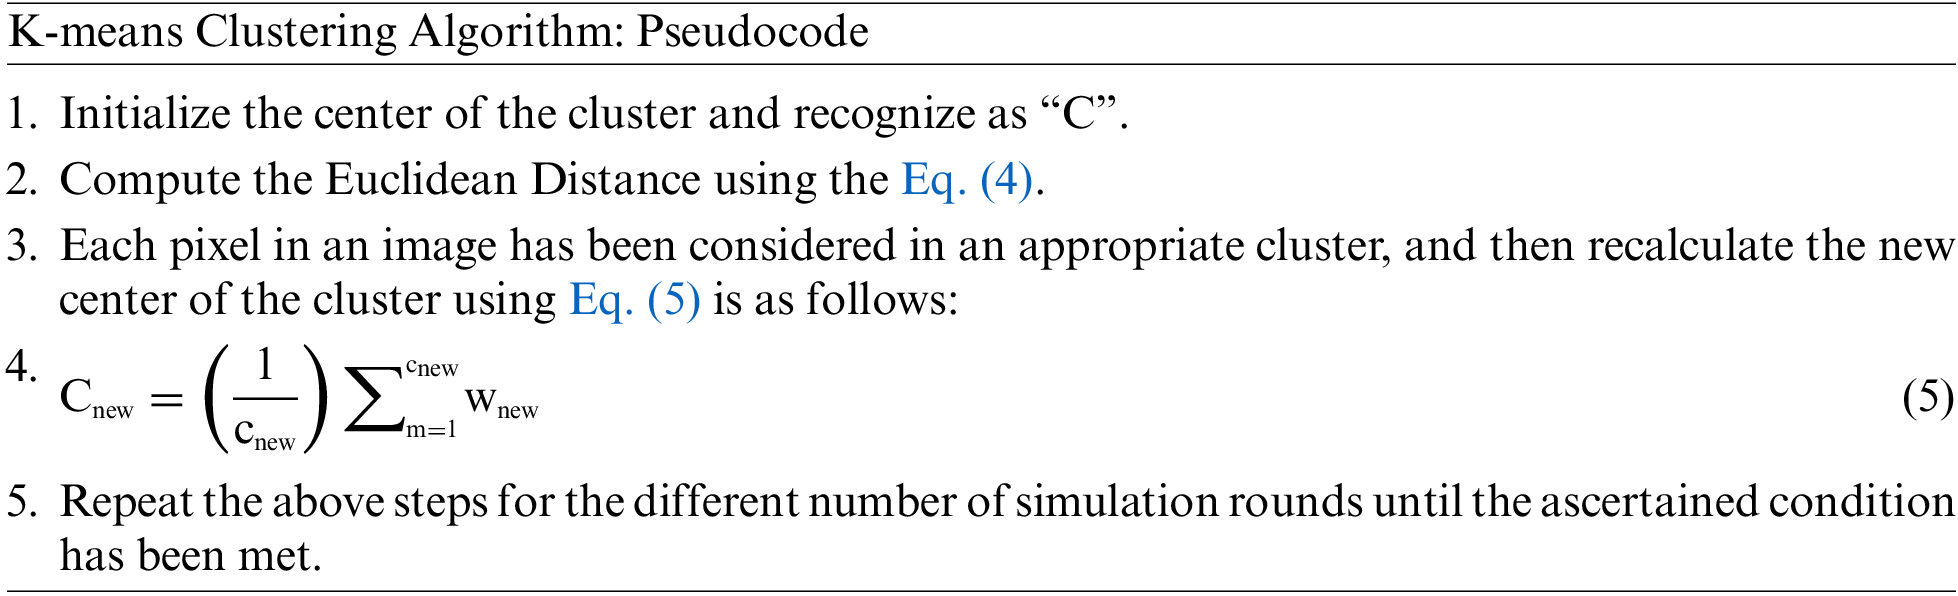
Segmentation is one of the key processes that follow any image processing protocol. It is an important process that is used to distinguish the region of interest from the other pixels present in the image. In image segmentation, the input image under consideration is divided onto smaller groups that are also termed image segments. This process also functions to minimize the complexity associated with the digital image while making image processing much simpler. In other words, segmentation is the process in which labels are assigned to pixels that belong to the same category. In a similar context, the present work involves a segmentation process to separate the cancer region from the rest of the pixels in the lung image. At this stage, first, K-means is implemented. However, it is observed that K-means could only segment the lung cancer region with approximately 75% to 80% accuracy. The K-means clustering technique is an unsupervised technique useful for collecting clusters. It allows only one type one data to collect from the cluster, and this technique gives faster results in comparison to other technique [48,49]. The K-means has the following properties as follows:
• K-means efficiently processing many datasets and working better with large datasets
• Works efficiently for the favorable points
• It works differently for numerical values and digital expressions
• The clusters formed using this technique are of sphere-like shape or convex lens. The objective function of the clustering technique is illustrated in Eq. (4).
In the given Eq. (4),
Additionally, to improve the segmentation strength of K-means, some nature-inspired algorithms, namely, PSO, FFA, CS, and ABC have been implemented in this research. Fig. 3 depicts the process of segmentation of CT scan images. The implementation process includes the test image, which is pre-processed using filters and equalization techniques. The pre-processed image is segmented using different optimization techniques such as Firefly Algorithm, Artificial Bee Colony, Particle Swarm Optimization, and Cuckoo Search Algorithm. The optimization is done to segment the tumor region from the healthy tissues.
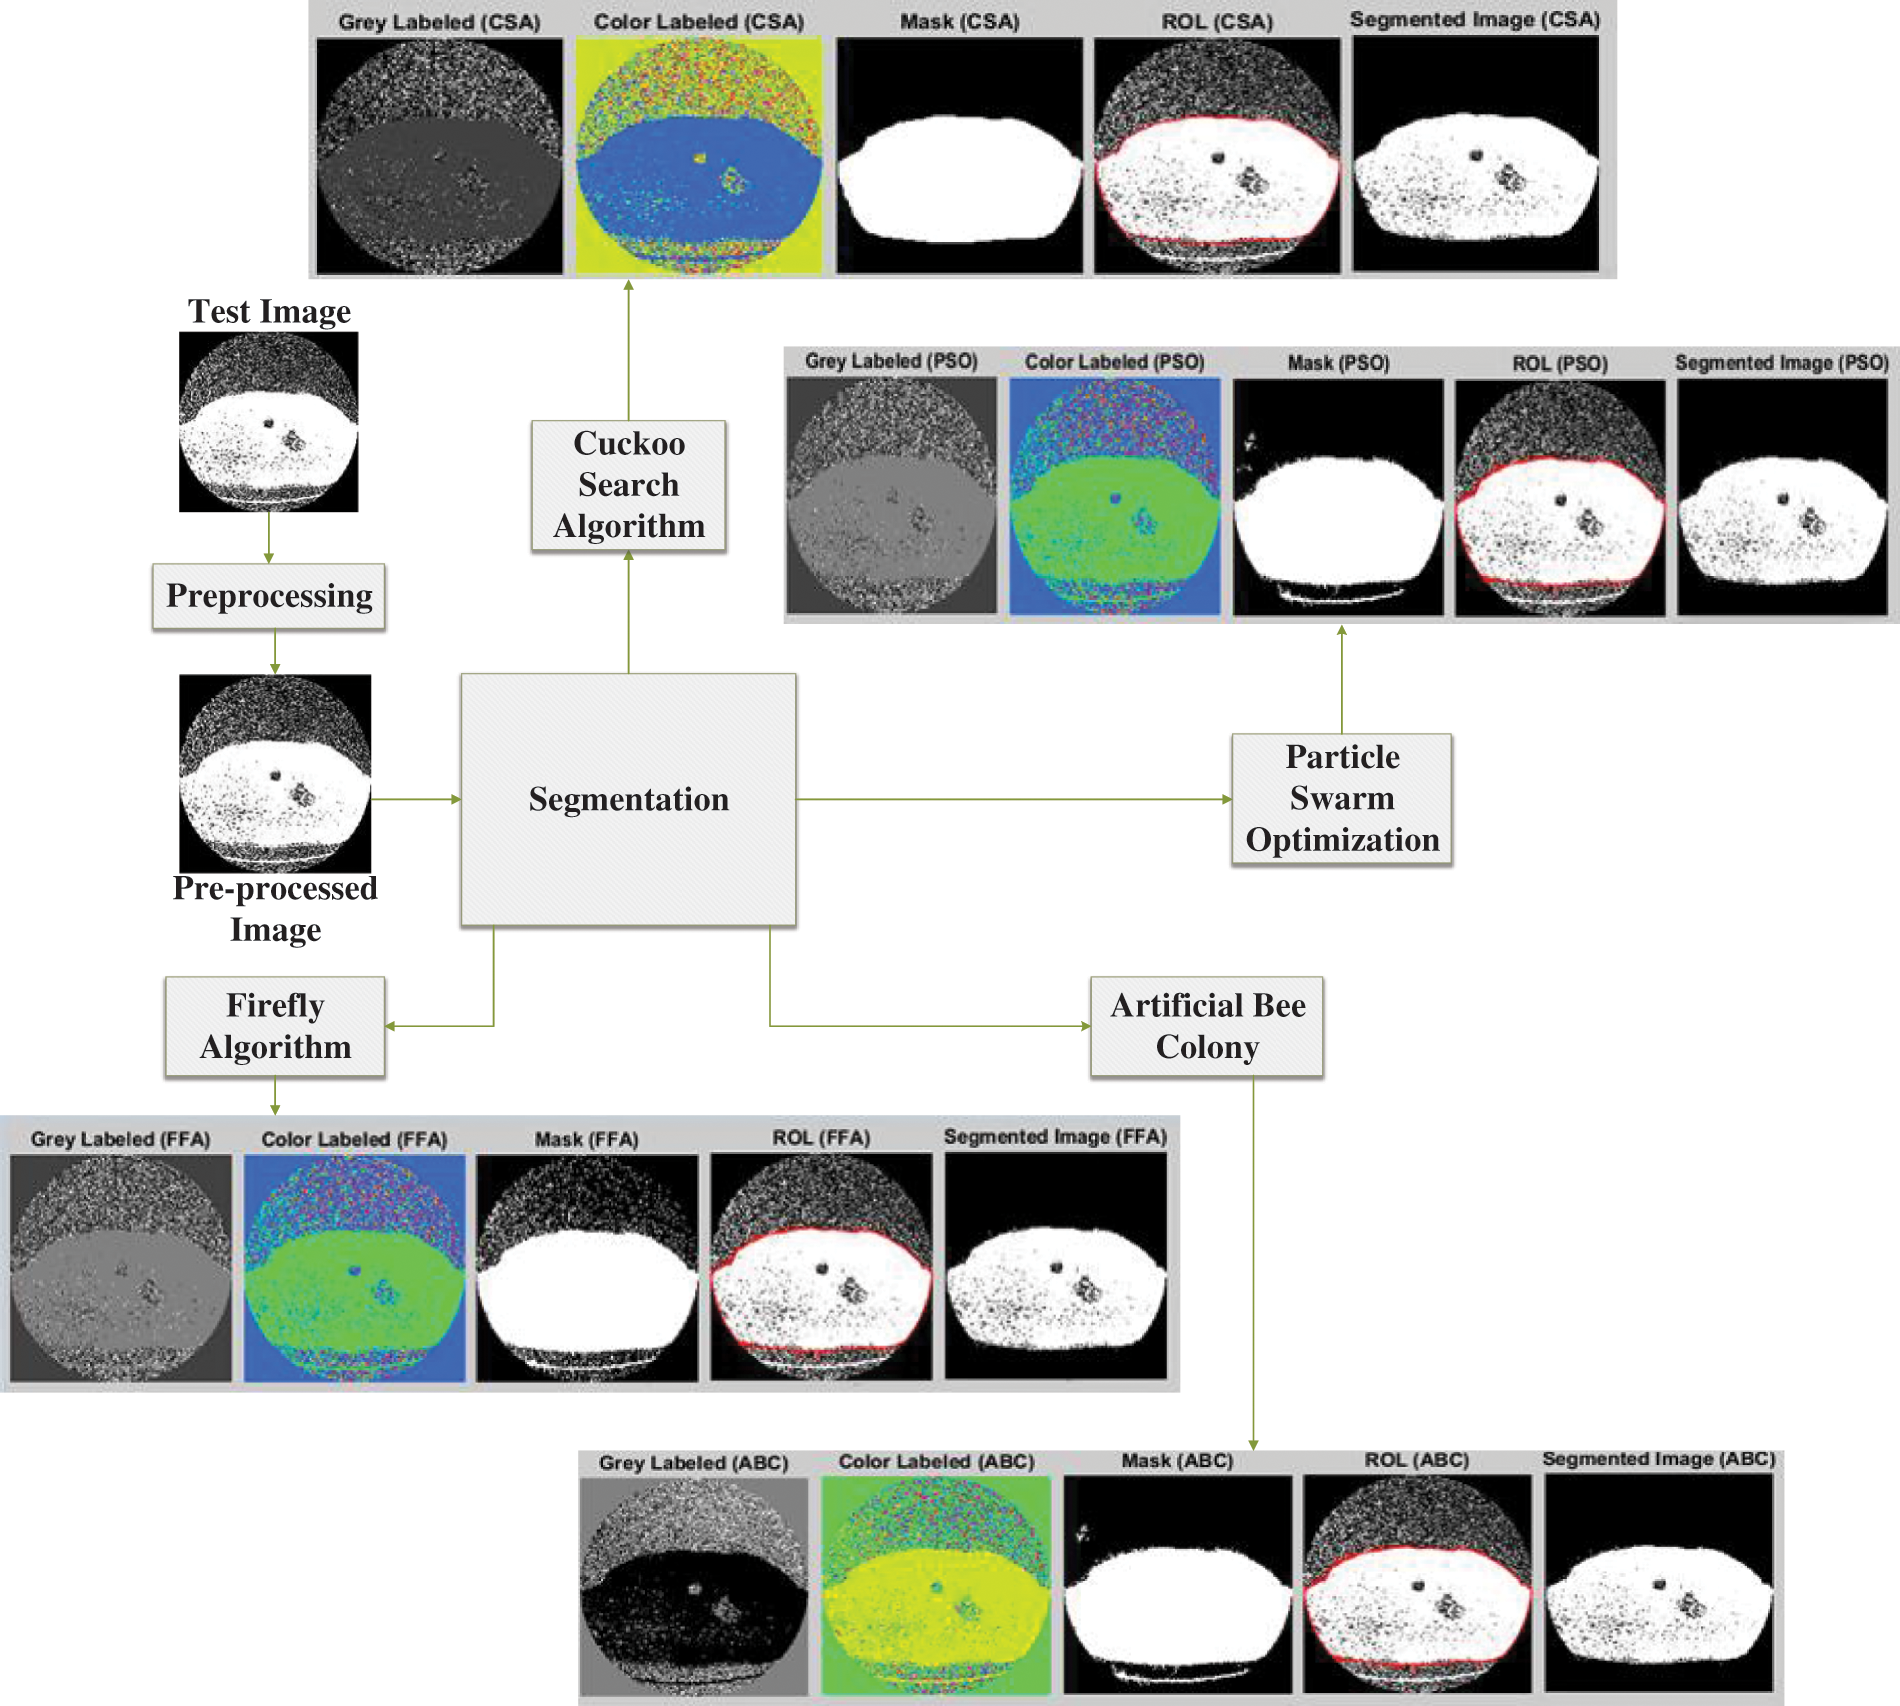
Figure 3: Workflow of the proposed research for improved segmentation of CT scan image using nature-inspired approaches
3.2 Nature-Inspired Optimization Approaches
The optimization step involves the integration of nature-inspired algorithms that focuses on improving the results of K-means clustering. Nature-inspired algorithms are strategies inspired by natural processing and have proved to be problem solvers. Some of the most popular nature-inspired optimization algorithms are derived by observing the search behaviors of insects, birds, animals, etc., and are used for different applications in construction, engineering, and many other disciplines. Among them, in the present work, ABC, CSA, PSO, and FFA have been implemented and evaluated to improve the segmentation performed using K-means.
The optimization process is involved color masking using gray and color labeling to improve the visualization and distinction of the cancer region. The illustration of image processing using different algorithms is provided in Fig. 4.
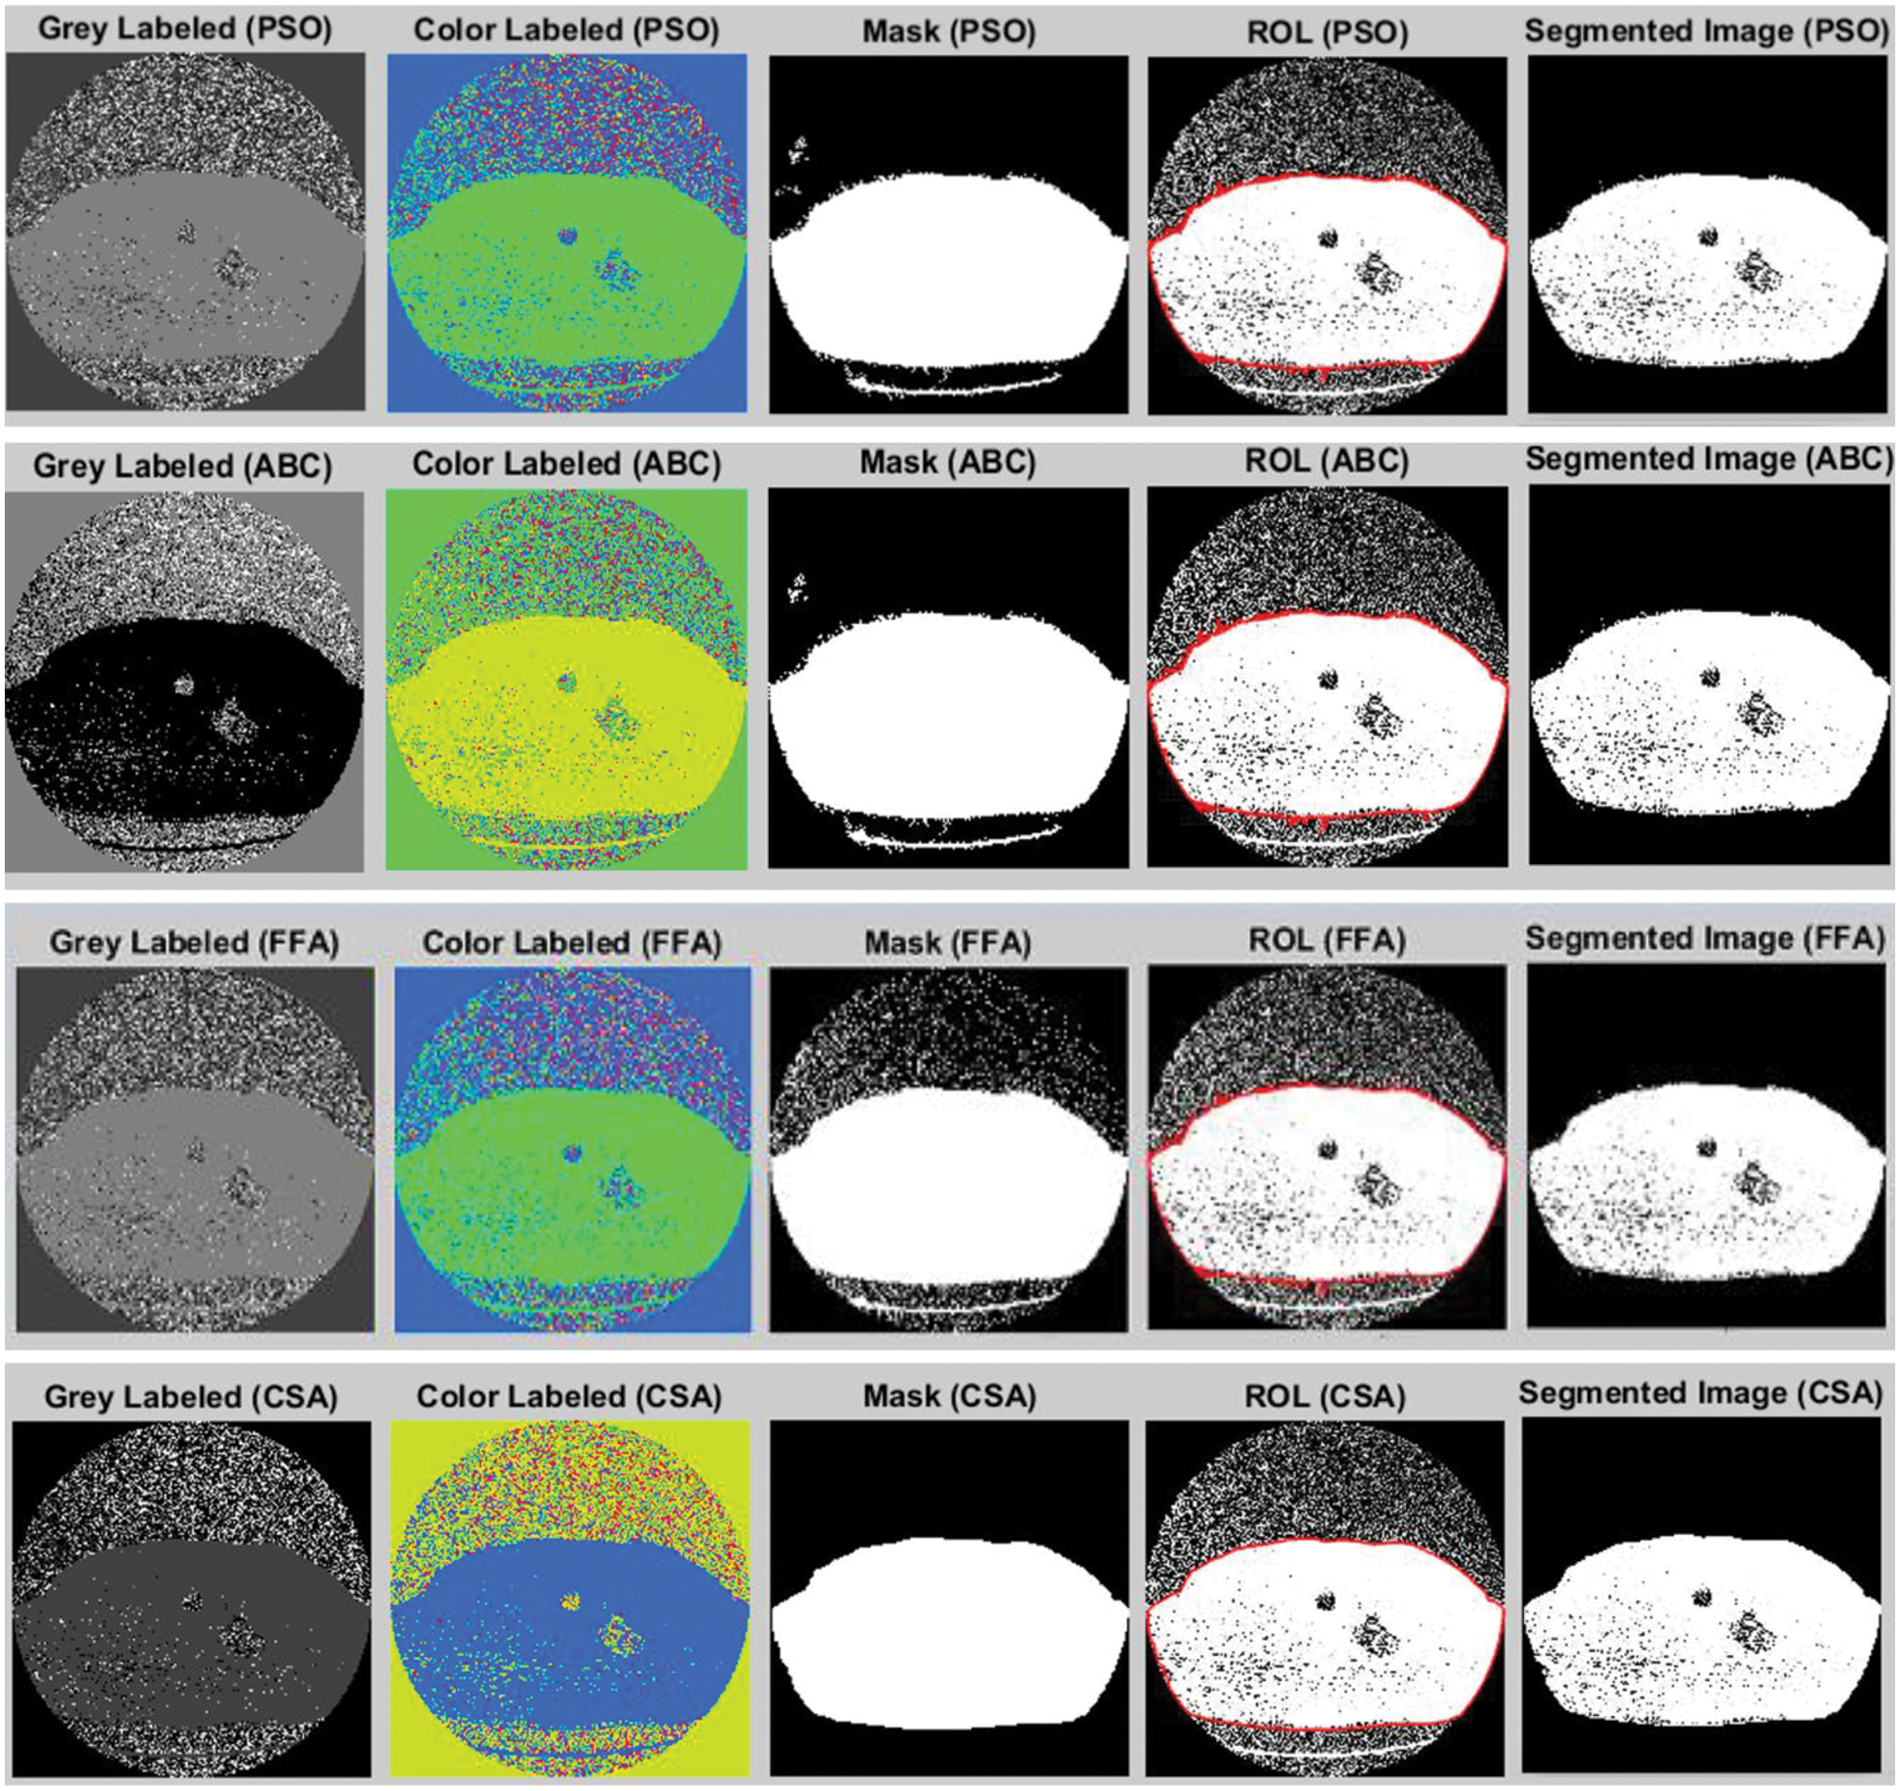
Figure 4: Lung cancer segmentation using different optimization approaches
Fig. 4 shows the output results of using the different optimization techniques in which grey labeled image defines the grey value falling between 0 to 255. The color label shows the colored image with a shaded area depicting the tumor region. The masked image is shown next to this color image in which the image pixel value lies in the range between 0 and 1. Finally, the region of interest is shown, and the segmented image shown the tumor region in the last.
Optimization using Particle Swarm Optimization (PSO): PSO is a swarm-based optimization technique worked based on the velocity of particles to move from one place to other. The algorithm works in such a manner that particles having higher velocity and near position to the food source are recognized as best and other particles having low velocity are initialized for betterment. Each particle has velocity V (k+1) and position P (k+1), which is updated based on the best fitness value as given in Eqs. (6) and (7).
In the given Eq. (6),
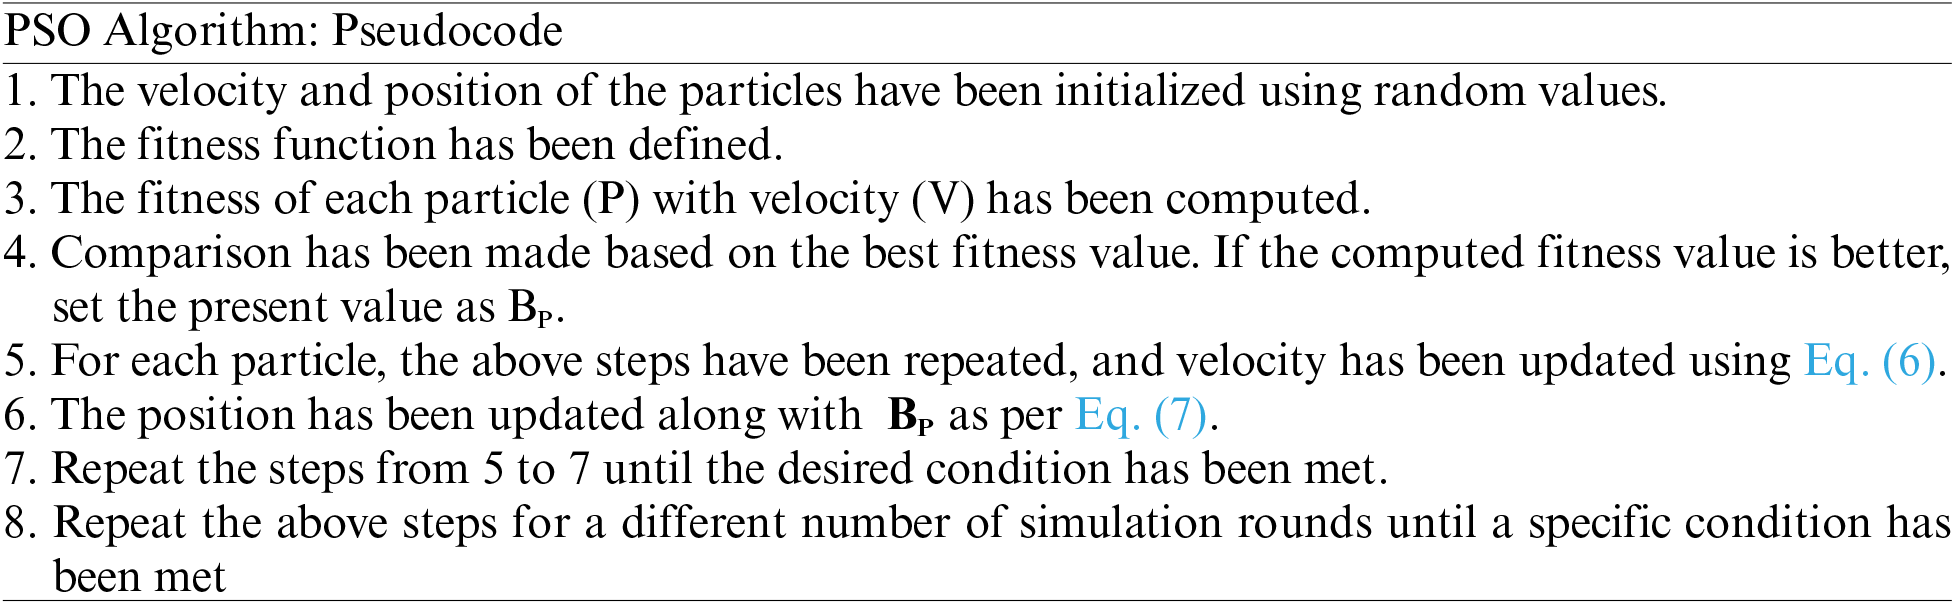
PSO algorithm work based on the velocity and position of the particles, and random values are initialized. The fitness function is defined, and fitness with particle velocity is defined. The selection was made for the random values, and then a comparison was made to select the best fitness value. The position has been updated until desired results are not obtained. Additionally, to improve K-means clustering results, the PSO technique has been applied to segment the lung cancer region from other regions.
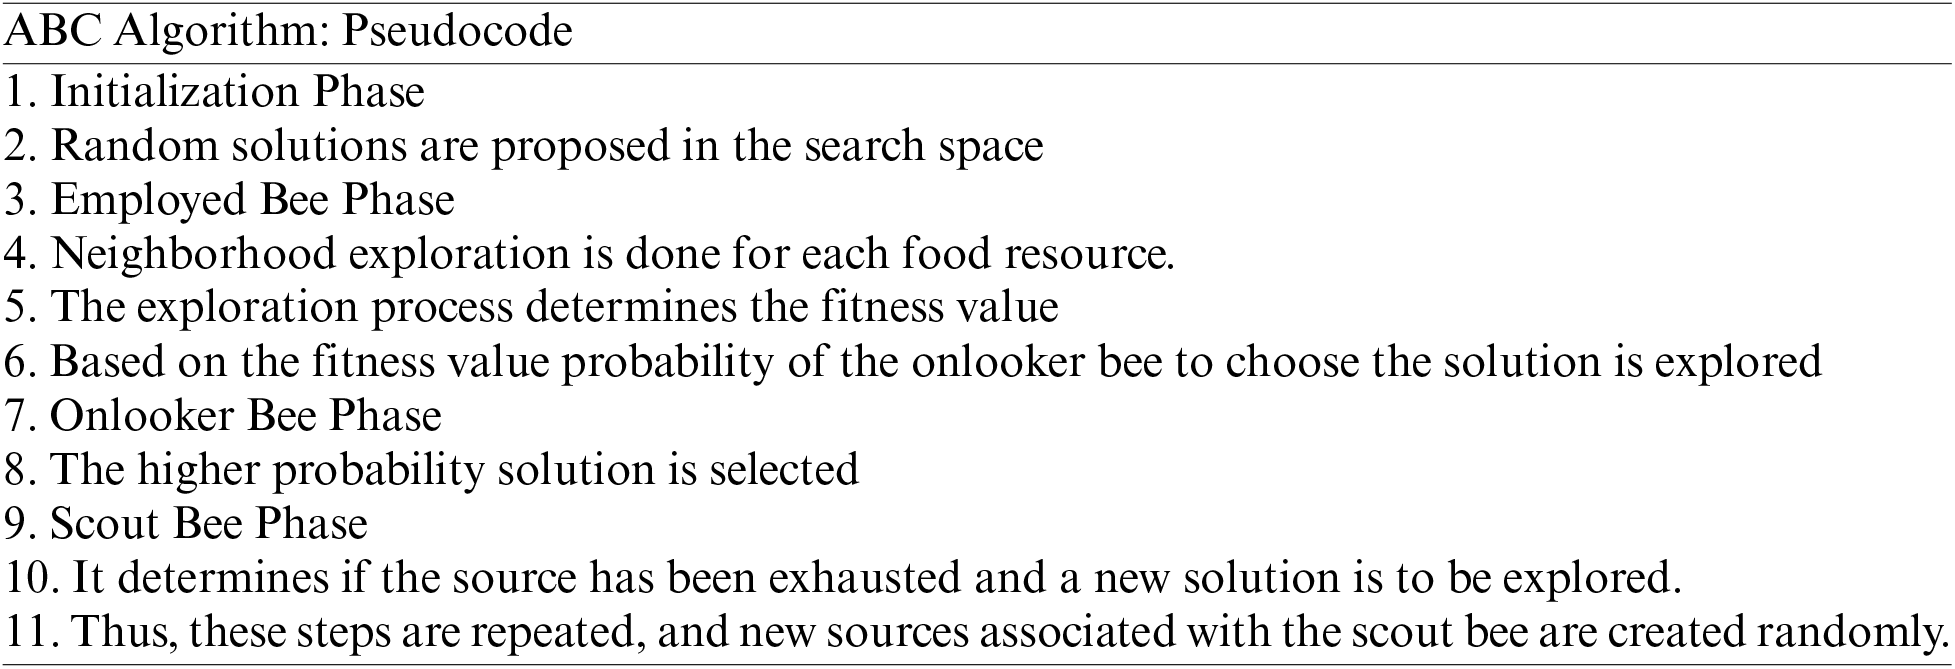
Optimization using Artificial Bee Colony (ABC) Algorithm: ABC is one of the nature-inspired optimization techniques that is inspired by the foraging nature of the honey bees over the search space. The bees randomly search the space for the finding food sources containing large amounts of nectar. Here, three types of bees are present that coordinate in the process. These are employed onlooker, and scout bees.
• Employed Bee: collect the food sources.
• Onlooker Bee: Wait for the employed bees in the hive.
• Scout Bee: These have no information about the food and are known as explorers, while employed bee and the onlooker bee are known as exploiters.
ABC algorithm work in four different phases initialization phase, employed bee phase, onlooker bee phase, and scout bee phase. The random solutions are generated in the solution space. Further, exploration of food or solution is done in the next phase. The exploration process is based on the determination of the best fitness value. Based on the fitness value, the probability of searching the space is improved for the onlooker bee. Further, the solution having a high probability is selected. The next phase work only in case of search space is exhausted.
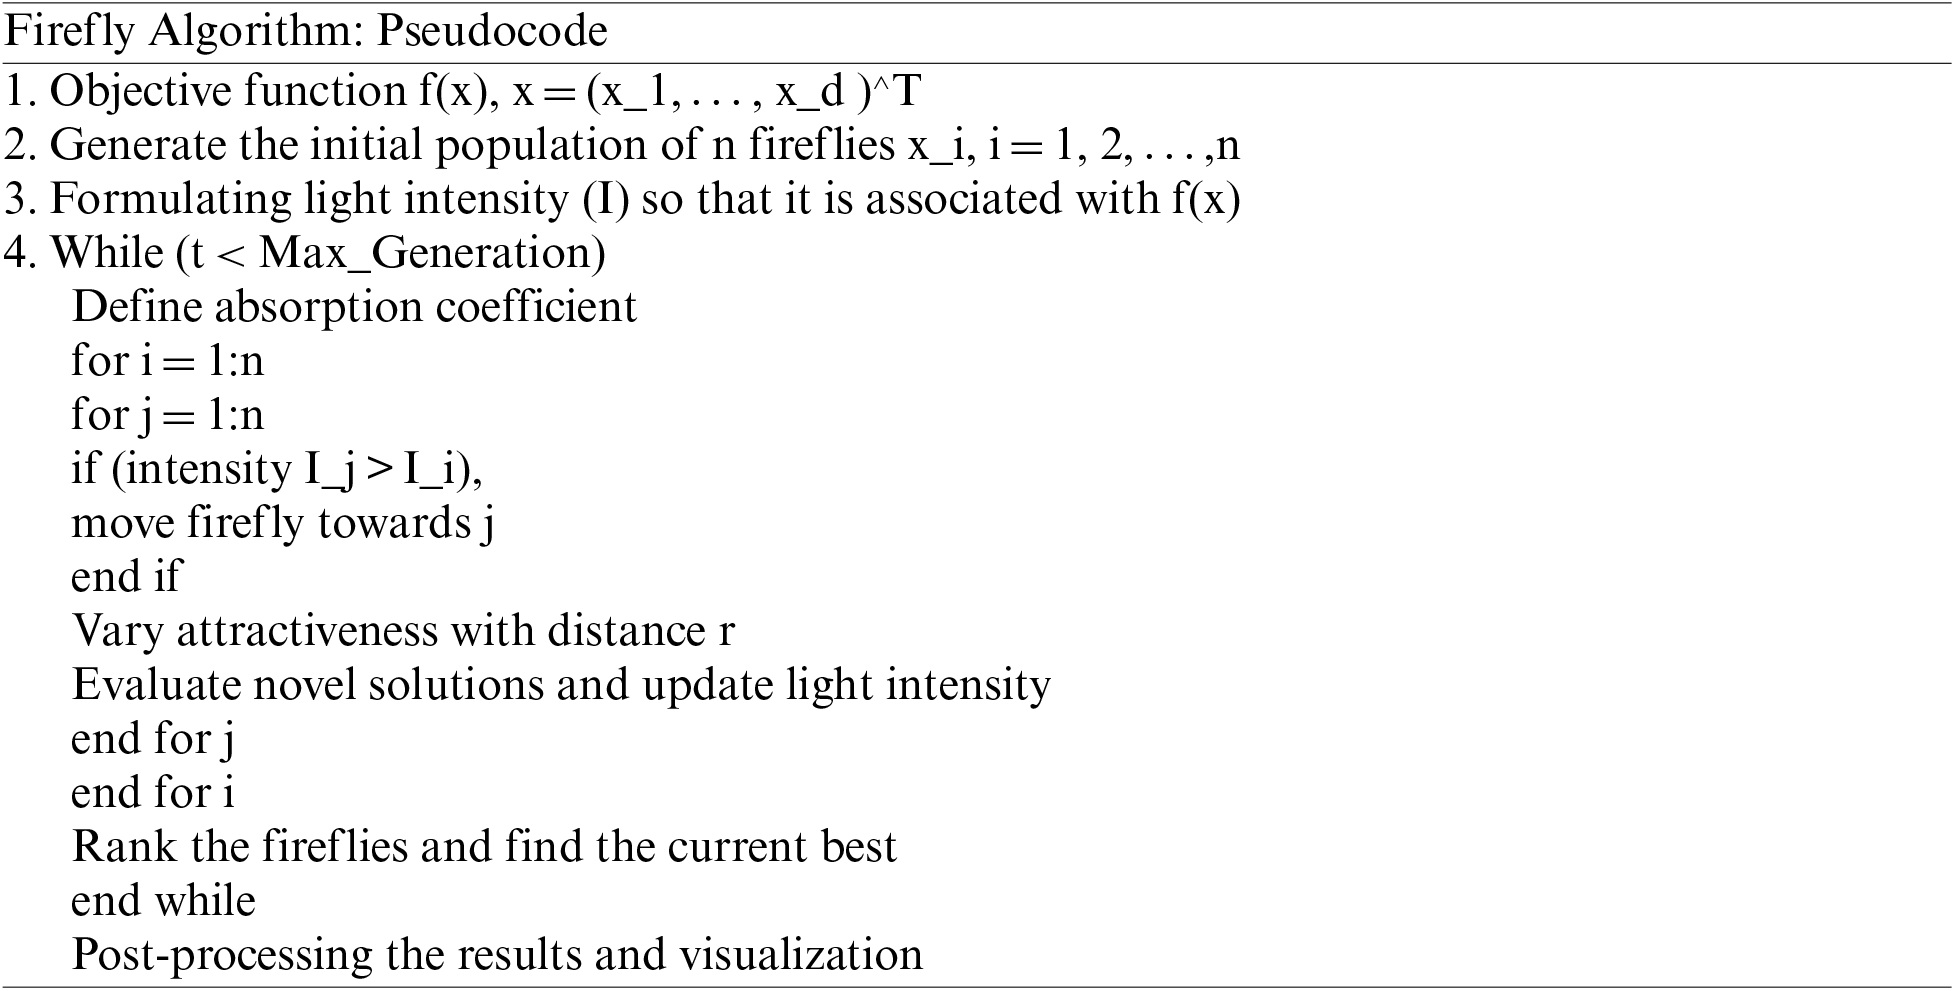
Optimization using Firefly Algorithm (FFA): The algorithm is inspired by the natural search tendency of fireflies. They are well known for their high conversion rates with relatively shorter calculative time. Therefore, it is also a popular optimization algorithm for image-based processing and segmentation. The processing involves optimizing parameters associated with maximum entropy function and time. In other words, it is also known as a nature-inspired stochastic technique used for resolving optimization problems. The optimizer used here relies on the flashing behavior of the flies. This flashing of light by flies attracts the opposition, and every fly transfers the luminance signals to another fly. Therefore, the algorithm relies on two elements, attractiveness, and brightness. Some basic rules that govern the algorithm are as follows:
• All the flies are unisexual and hence can attract other flies.
• The attractiveness is proportional to the brightness or the luminance.
• Firefly with low brightness more towards the brighter firefly.
• The brightness is computed using the cost function or fitness function consumed for searching.
Optimization using Cuckoo Search Algorithm (CSA): CSA algorithm was proposed by Yang and Deb in 2009 to retrieve the most prominent features from the segmented lung nodules. The CSA algorithm is superior in comparison to existing techniques such as FFA; its characteristics are viable, ease of implementation, capacity to engage with unskilled users, and considerably more efficient global search capabilities. The CSA, on the other hand, has a slow convergence rate, requiring more resources to reach the desired precision. The CSA has viable characteristics such as dependability and delivers a prominent result in contrast to other techniques. The concept of Levy flight has improved the CSA. This CSA technique has been used to segment the image by extracting the best features [50]. For the identification of optimal features in LC diagnosis, we used the following comparison in our proposed approach:
• Each cuckoo’s egg indicates a fresh solution for a feature subset. This is also utilized to determine whether the lung nodule is cancerous or benign.
• The egg quality indicated (feature subset) is either 1 or 0, indicating whether the feature subset is chosen for classification or not.
• The likelihood of a cuckoo egg being detected is illustrated, and removing the least significant characteristic is then removed with constant probability.
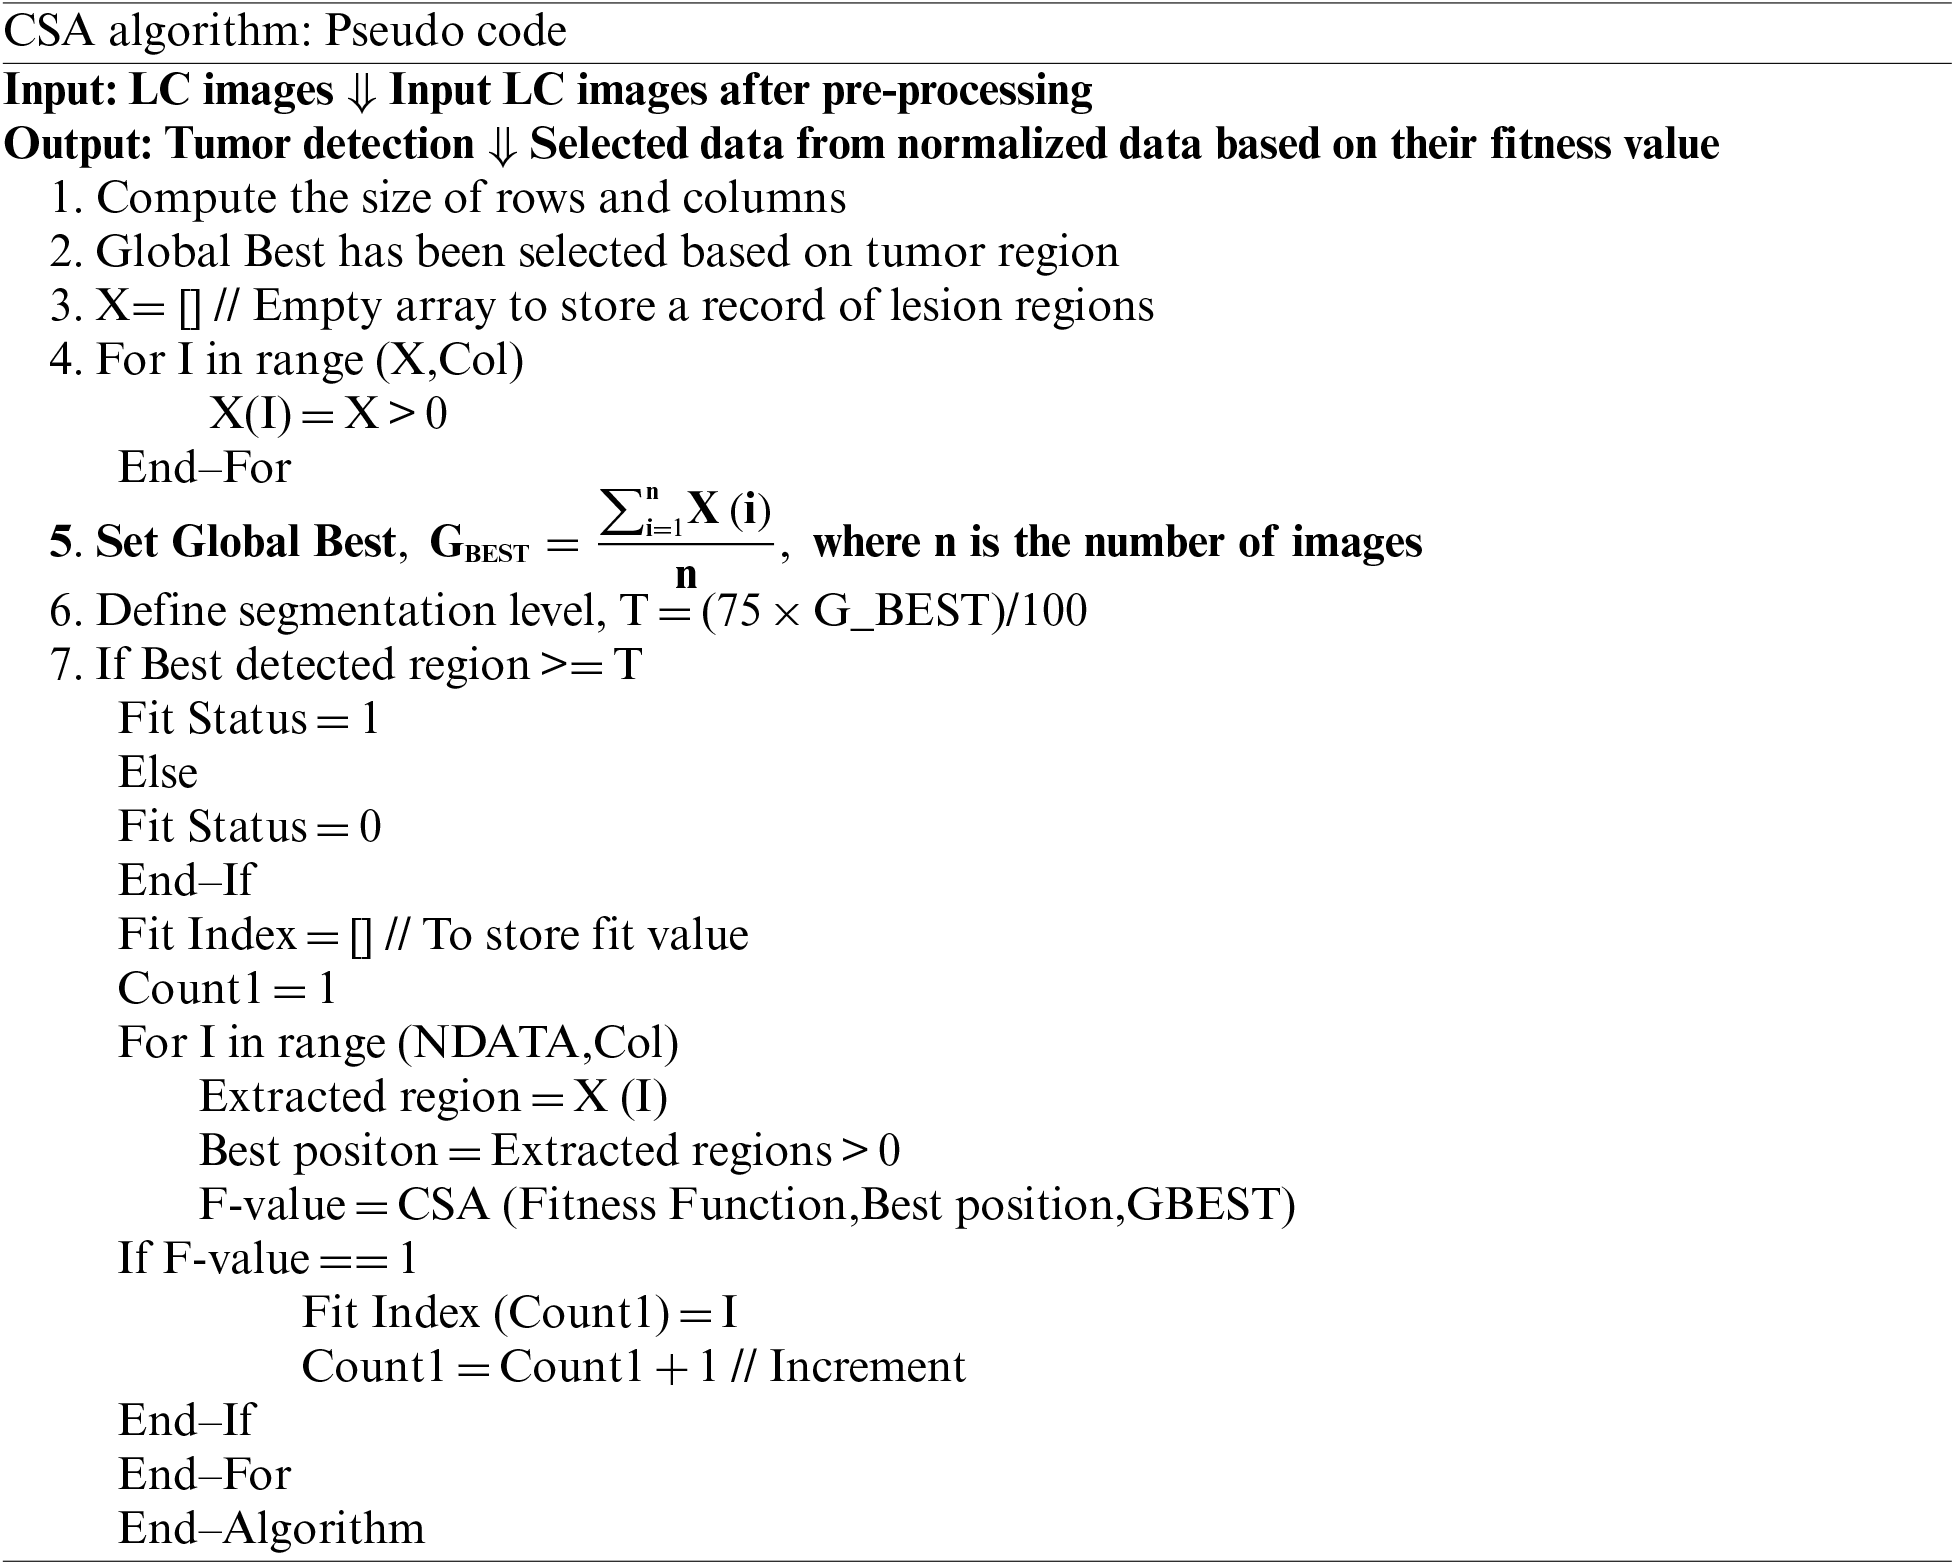
CSA algorithm employed for the extraction of desired region or detection of tumor region. The proposed algorithm is implemented to determine the global best value and fitness index. The rows and columns of an image are selected and analysed to determine the best value. The best value is further compared for evaluation of whether it is greater than or equal to a threshold value. The F-value is computed and measured as the fitness function, best position, and global best value. The implementation process further efficiently segments tumor from the Lung cancer images. The segmented tumor has been diagnosed to identify the cancer cells. The cancer region segmented using the CSA provides more accurate results with more convergence rate. The other optimization methods, such as PSO and FFA prove satisfactory results in comparison to CSA. Thus, CSA with K-means clustering shows efficiency with better fitness value and convergence rate.
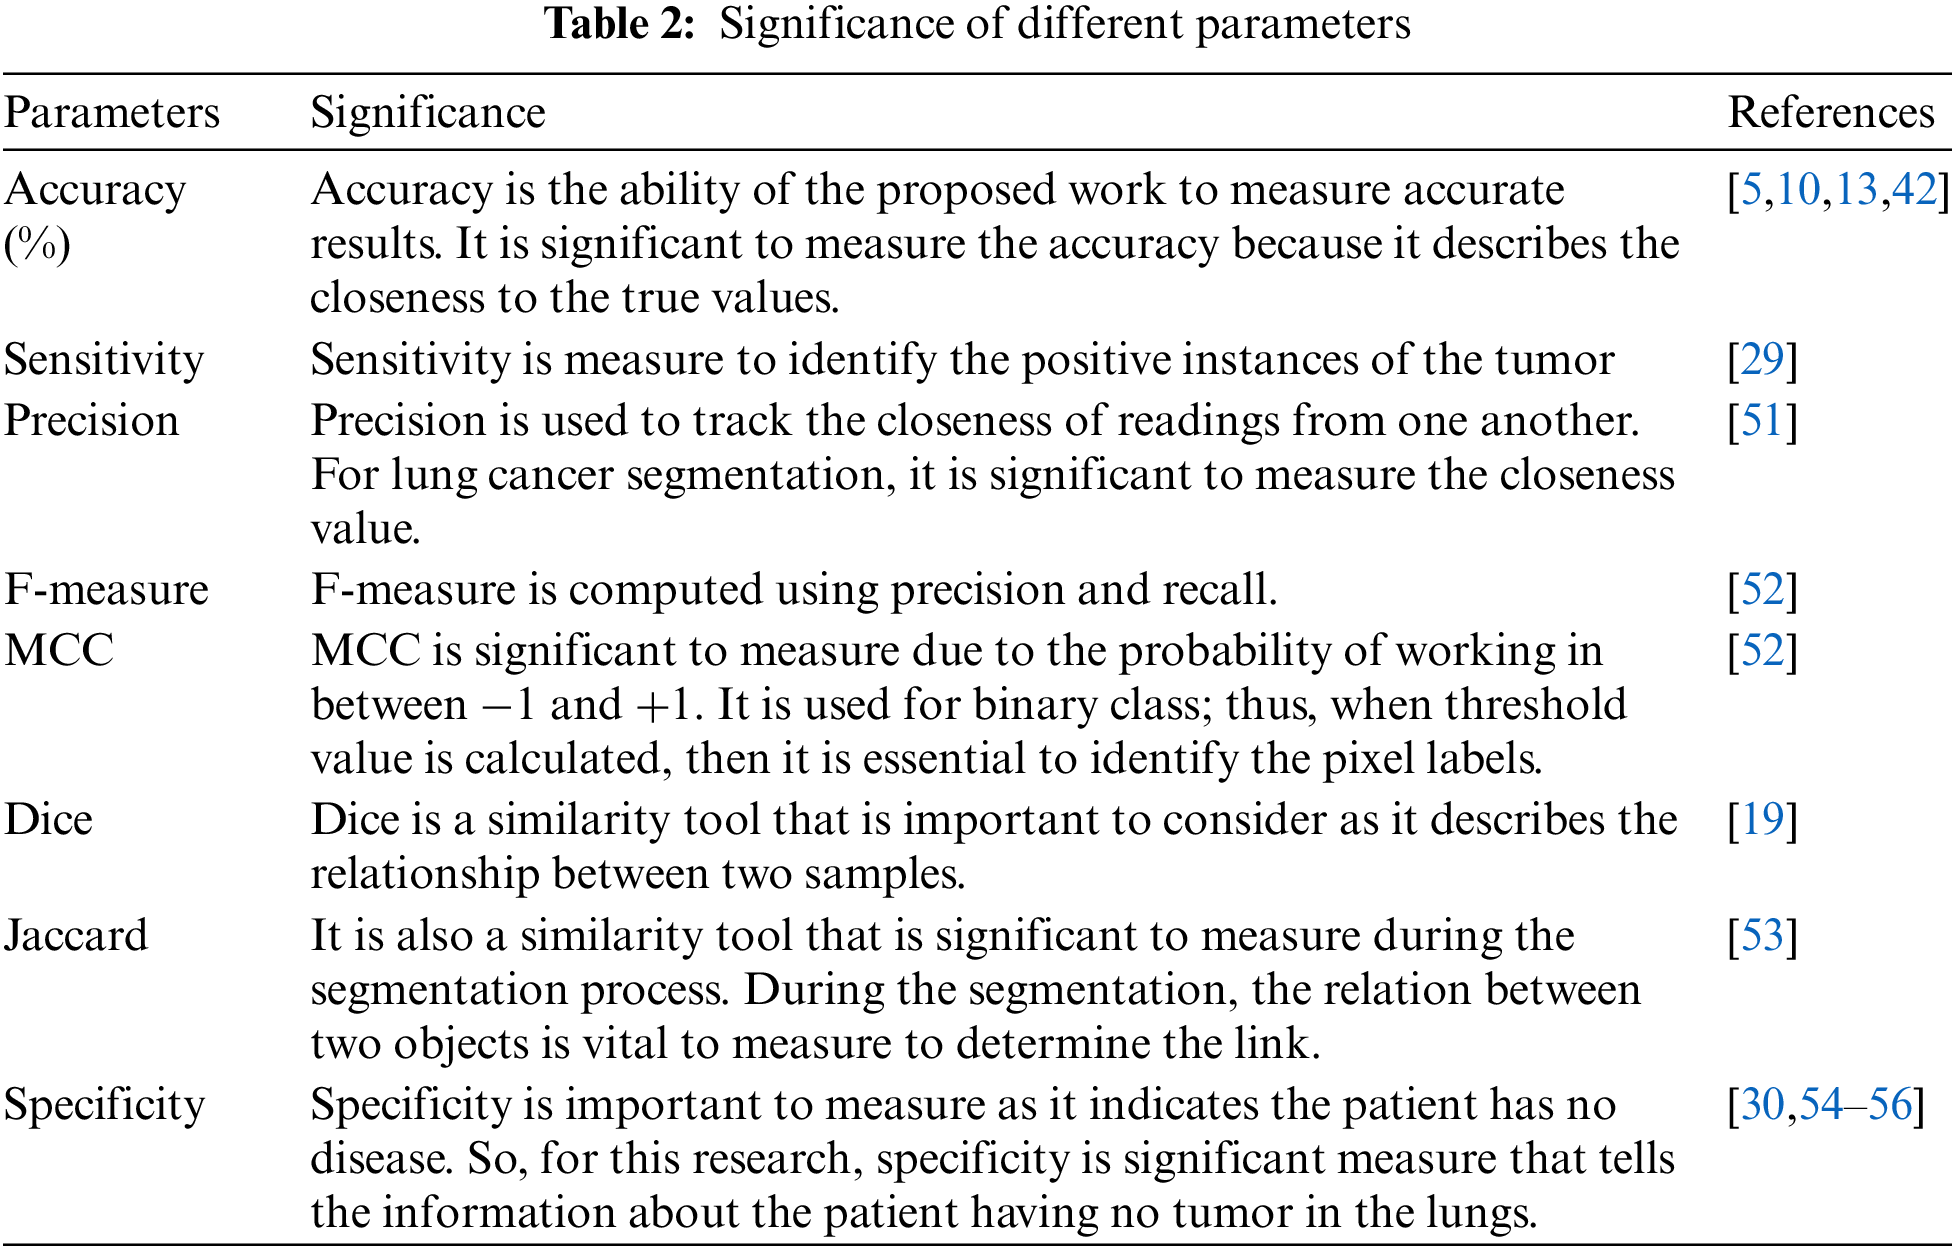
The segmentation methodology employed for lung cancer segmentation is evaluated using 8 metrics and four optimization approaches to identify the best optimization strategy that can be used at the segmentation stage for lung cancer images. The experimental study has been performed with MATLAB 2020 on Microsoft Windows 10 with 8 GB RAM and 1 TB Hard disk drive on intel core i3 530 processor. In the process, lung cancer images comprise of 500 lung cancer images are obtained from the database. The average values for each combination for all the parameters used in the analysis are summarized in Table 2. Before the analysis, it is essential to understand the significance of each parameter conducted in this research.
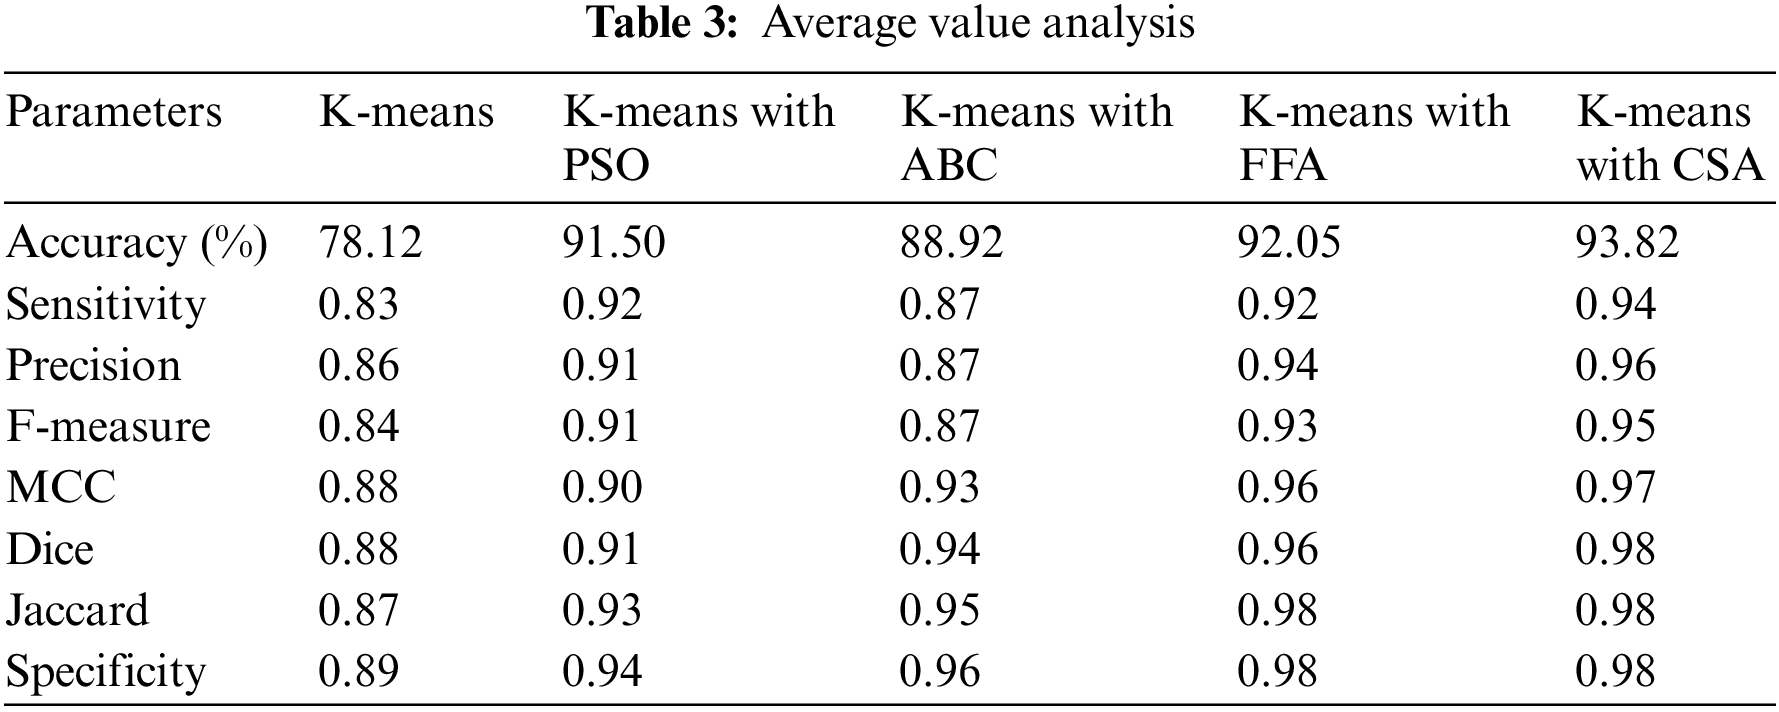
It is observed that the performance of K-means alone for lung cancer image segmentation is not up to the mark. Therefore, optimization algorithms are integrated to refine the outputs of K-means-based segmentation. The performance analysis of K-means with each optimization approach used in the paper is further listed in Table 3. Overall, it is observed that among ABC, PSO, FFA, and CSA, the K-means with CSA exhibited better performance for every parameter used for the analysis.
The precision analysis of all the techniques used to the segmentation stage is shown in Fig. 5. It is observed that as the sample size is increasing the strength of the segmentation also gets improved. Further, the least average precision is shown using the K-means approach while K-means with CSA perform better. Moreover, the graph also shows the better performance in terms of other parameters such as sensitivity, accuracy and F-measure of K-means with CSA for lung cancer segmentation.
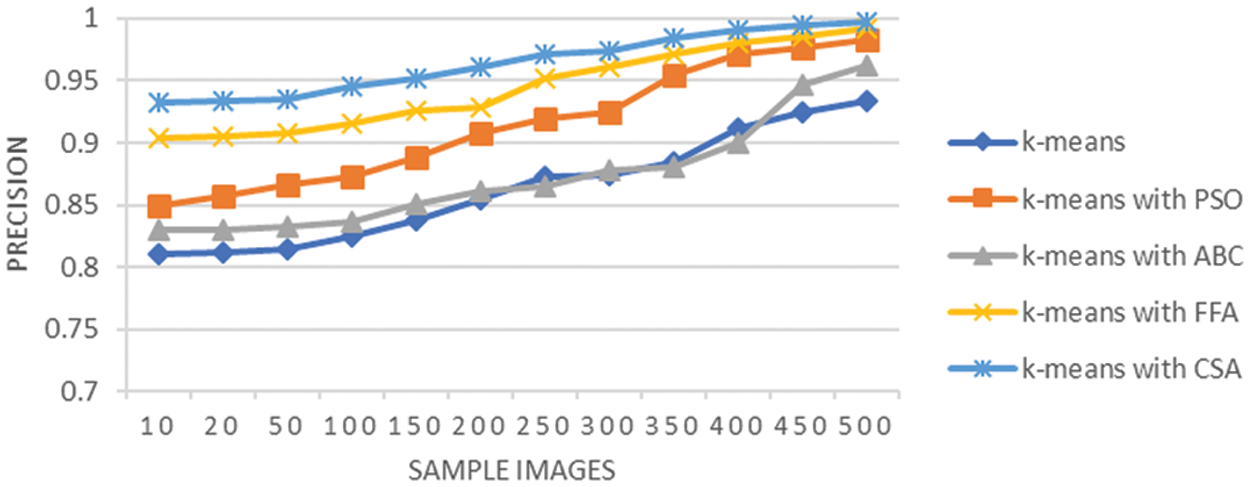
Figure 5: Precision analysis of lung cancer segmentation
Fig. 5 shows the precision of different techniques in which when there is a increase in sample size then there is an improvement in segmentation results. Further, the average precision observed here is only 0.86 using K-means alone. However, the average precision is 0.91 using the K-means with PSO, and it is 0.87 when the same integrated with ABC, it surges to 0.944 using the integration with FFA, and K-means with CSA is 0.96. Moreover, the graph also shows the better performance of K-means with CSA for lung cancer segmentation. The K-means with CSA leads to hybrid methodology to enhance the segmentation results for lung cancer CT scan images. The highest precision achieved by K-means with CSA in comparison with other alternatives indicates that CSA refines the segmentation achieved by K-means by optimizing the attributes of segmentation process. The CSA methodology is capable to adjust the cluster centers and boundaries to improve the precision of the segmented lung cancer image dataset.
Fig. 6 shows the sensitivity analysis of LC segmentation. Sensitivity of the LC segmentation using 500 LC images using various techniques used at segmentation stage. It is observed that average sensitivity is 0.83 with K-means technique, it is 0.92 when K-means integrated with PSO, it is 0.87 through K-means with ABC, it is 0.92 when K-means integrated with FFA, and it is 0.94 through K-means with CSA. This shows that segmentation using K-means with CSA outperformed the rest of the techniques used at the segmentation stage. The sensitivity analysis provides the measurement of segmentation capability of each applied algorithm for capturing true positive tumors in lung cancer image. K-means and K-means integration with ABC technique could not provide much improvement in comparison with other three utilized techniques. The K-means with PSO enhance the choice of cluster centroids for K-means based on fitness assessment, but the results achieved demonstrates that this integration is proving less effective in comparison with CSA technique for decision on cluster centroids.
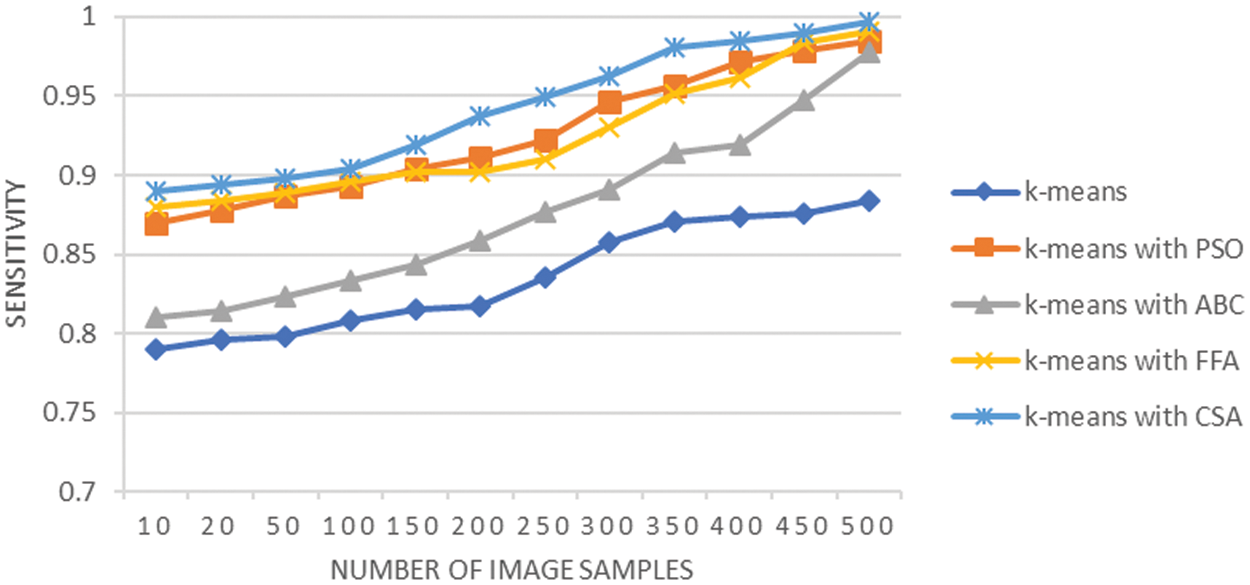
Figure 6: Sensitivity analysis of lung cancer segmentation
F-measure is also known as the harmonic mean of sensitivity and precision of segmentation performed for the LC images. Its computed values are reflected using the graph shown in Fig. 7 that computes the F-measure value. The graph shows that K-means with CSA exemplified the highest f-measure values over all the variations used in the image samples. The average F-measure obtained is 0.84 using K-means, it is 0.91 when K-means integrated with PSO, it is 0.87 when K-means integrated with ABC, it is 0.93 using FFA and it was 0.95 when K-means integrated with CSA. The analysis of F-measure metric provides balanced evaluation of the capability of the deployed technique for efficiently identifying true positive regions of tumors on the lung cancer image. The sensitivity score is minimum for results from K-means technique and highest from integration of K-means with CSA. The fitness criteria that is part of CSA approach enhances the decisions of clusters in the K-means technique and results in improved segmentation of cancer affected lung cancer CT scan image.
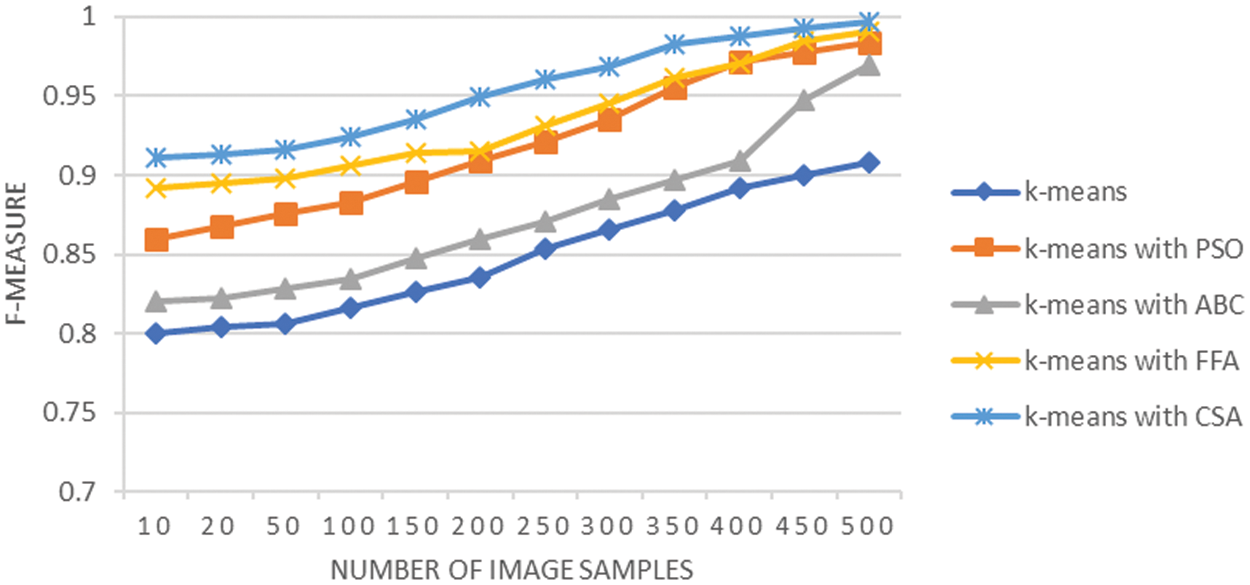
Figure 7: F-measure analysis of LC segmentation
Matthews Correlation Coefficient (MCC) tests the quality of separation of the cancer region from the rest of the regions in the LC images. The average MCC reflected by the overall analysis shown in Fig. 8 is 0.88 using K-means, it is 0.90 when K-means integrated with PSO, it is 0.93 when K-means integrated with ABC, it is 0.96 when K-means integrated with FFA, and it is 0.97 when K-means integrated with CSA. The classification task like segmentation of tumor affected region can be efficiently analyzed with Matthews Correlation Coefficient. The value of this coefficient is highest for integration of K-means with CSA, as well integration of K-means with FFA also achieves significant MCC. The results prove that the limitation of K-means methodology for working on complex image dataset with variations in the intensity of cluster centroid can be worked by the integration of CSA and FFA approaches.
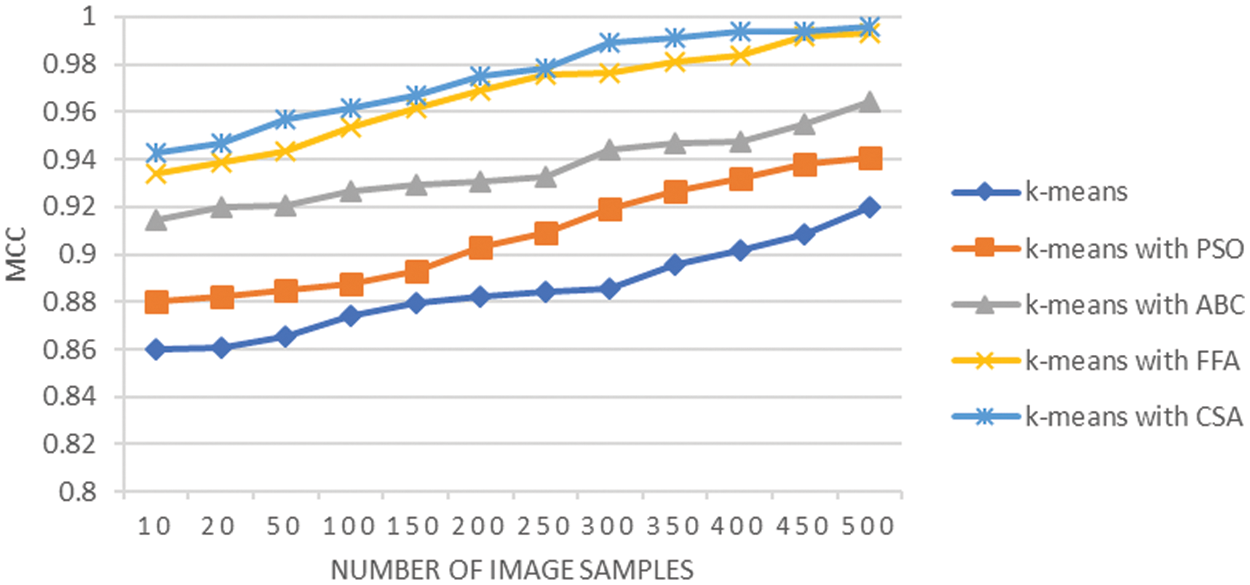
Figure 8: MCC analysis of lung cancer segmentation
The Dice analysis is shown in Fig. 9, which shows that it increases with an increase in the sample size, but it is higher in the case of K-means with CSA. It provides the descriptive evaluation of each combination of techniques implemented at the segmentation stage. The average Dice analysis is 0.88 using K-means, it is 0.91 when K-means integrated with PSO, it is 0.94 when K-means integrated with ABC, it is 0.96 when K-means integrated with FFA, and it is 0.98 when K-means integrated with CSA. This shows that the segmentation performed using CSA when K-means integrated is superior in comparison to the rest of the techniques. The results are evident that the integration of techniques CSA and FFA with K-means have enhanced the results of K-means segmentation by improving cluster centroid decisions to a greater extent. The performance of K-means methodology depends on the optimal selection of centroids that have impact on quality of the segmentation of image. The integration of CSA and FFA techniques with K-means monitors and improves the capabilities of K-means to choose the optimal starting point for the segmentation process.
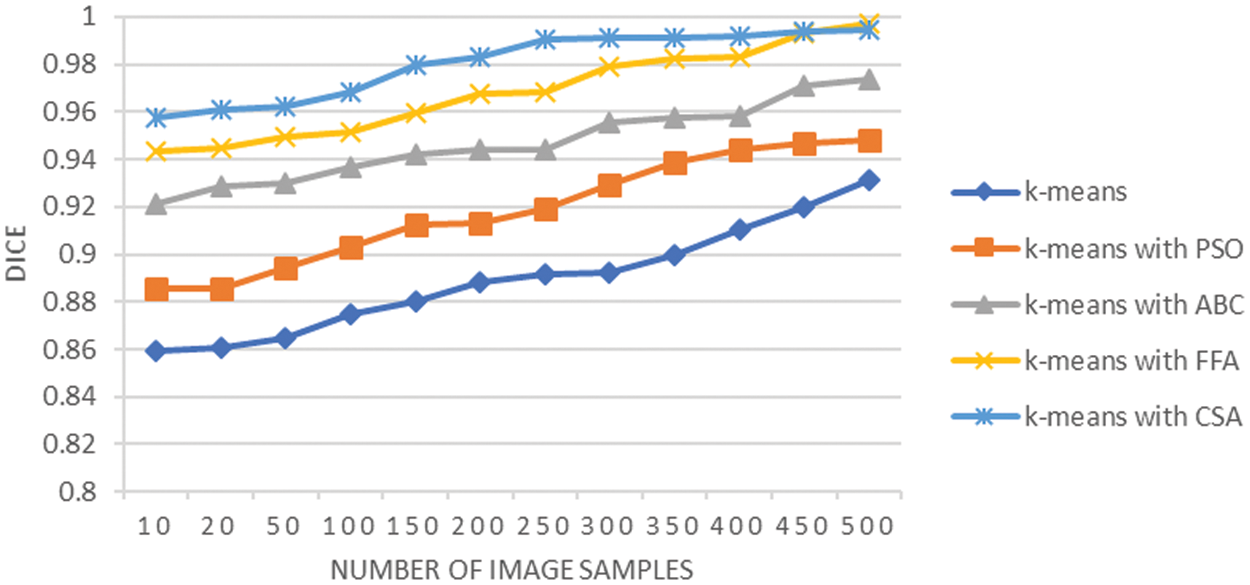
Figure 9: Dice analysis of lung cancer segmentation
Fig. 10 shows the graphical analysis of the Jaccard coefficient for various techniques used at the lung cancer segmentation stage. The observation shows that the average Jaccard is 0.87 using K-means, it is 0.93 when K-means integrated with PSO, it is 0.95 when K-means integrated with ABC, it is 0.98 when K-means integrated with FFA and results improved to 0.98 when K-means integrated with CSA. A similar analysis is also reflected by the specificity analysis shown in Fig. 11. The integration of techniques CSA and FFA have enhanced the cluster separation process of K-means and overall, this integration achieves the optimally segmented lung cancer images. The enhanced results for Jaccard analysis indicate that their exist higher co-relation between identified segmented tumor region and actual segmented region with integration of CSA and FFA techniques. The CSA methodology is capable of parameter adjustment and the same concept resulted in fine tuning of K-means clustering and it is proved through improved sensitivity analysis results as well. Moreover, the integration of FFA with K-means has considered global exploration of results that could be missed by K-means clustering techniques and this resulted in improving the segmentation task of lung cancer images.
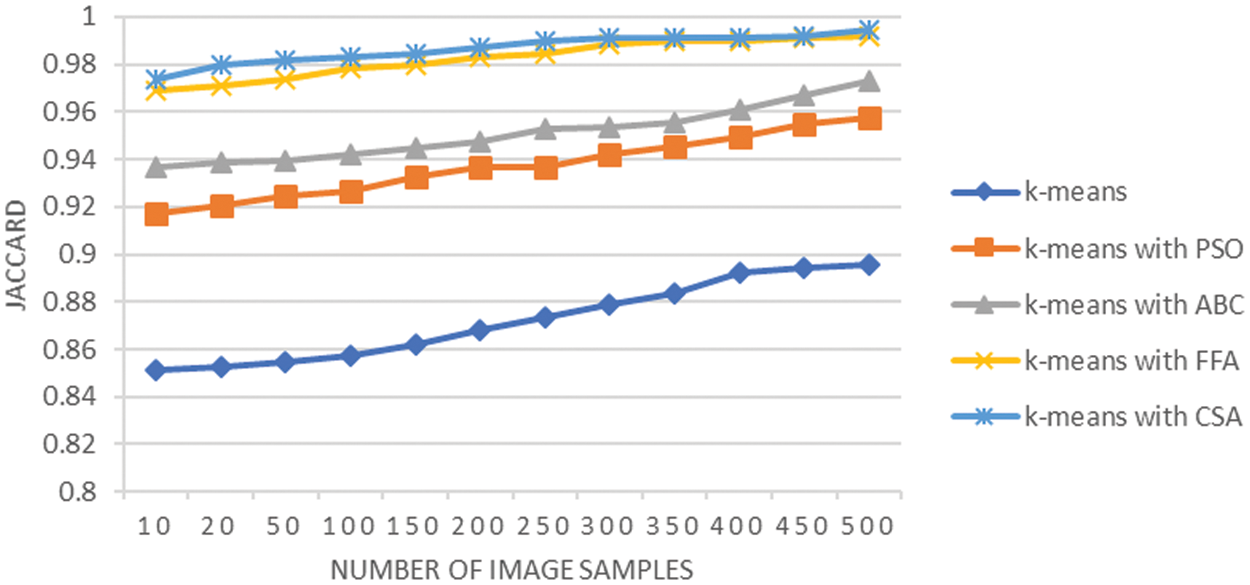
Figure 10: Jaccard analysis of lung cancer segmentation
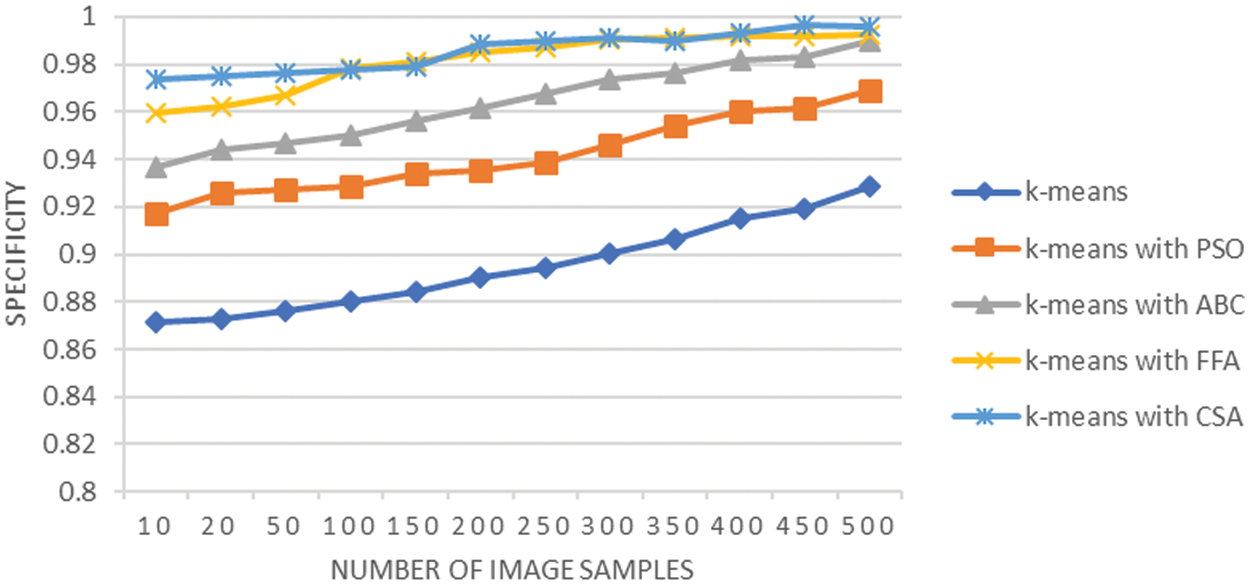
Figure 11: Specificity analysis of lung cancer segmentation
Fig. 12 reflects that the accuracy of segmentation using K-means alone is significantly less and accounts for an average value of 78.12%. However, with the involvement of optimization approaches, the accuracy of segmentation for lung cancer images gets increased and even reached 99% mark. The average accuracy is 91.50 when K-means integrated with PSO, it is 88.92 when K-means integrated with ABC, it approaches 92.05 when K-means integrated with FFA, and it is 93.82 when K-means integrated with CSA. The overall analysis shows that CSA better analyzed the regions of lung cancer image in comparison to FFA, PSO, and ABC. Hence, provide better segmentation results. These observations are further supported by the fact that CSA exhibits better search capabilities that help it to precisely identify the foreground pixels that are a part of cancer tissue. Thus, the fact and the experimental analysis justify the better lung cancer segmentation using K-means with CSA in comparison to other optimization techniques.
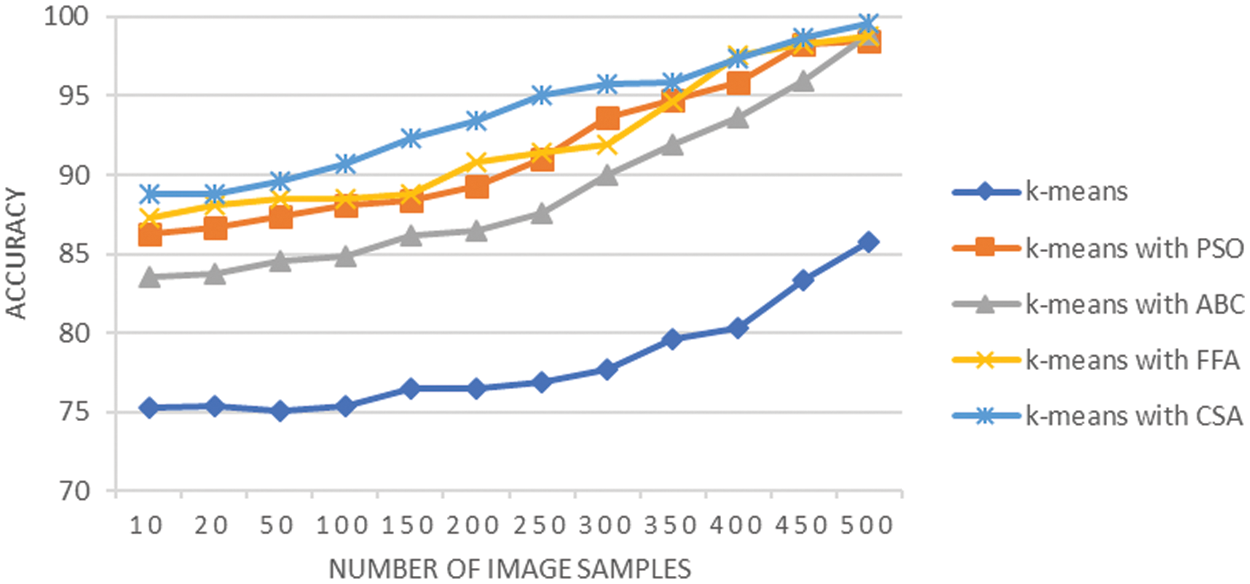
Figure 12: Accuracy analysis of lung cancer segmentation
Lung cancer is a leading cause of death in various countries worldwide. An appropriate treatment through early identification enhances the chance of saving lives. So, it is of utmost importance to segment the tumor in the lung images using robust techniques with less error, and better accuracy, which requires segmentation of tumor region in the lung cancer scanned images. This paper presented an improved K-means clustering-based image segmentation technique to segment the LC area using nature-inspired optimization. The robustness of the K-means technique has been improved using the CSA optimization technique. However, to prove its effectiveness and justify the present research work, a comparative analysis with other techniques, namely, K-means with PSO, K-means with FFA, and K-means with ABC, is also demonstrated in the paper. The overall simulation analysis performed on the publically available ELCAP database of lung cancer images shows that K-means with CSA provide more prominent results. Further, the performance evaluation shows that the K-means with CSA outperformed the other techniques while demonstrating an average precision of 0.96, a sensitivity of 0.94, f-measure of 0.95, MCC of 0.97, DICE of 0.98, specificity of 0.98, Jaccard of 0.98 with an average accuracy of 93%. This improved lung cancer segmentation obtained through K-means with CSA is due to better search capabilities of CSA technique that help to precisely distinguish the foreground and background pixels in the lung cancer samples, thereby exhibiting a better ability to segment the tumor region present in the lung cancer image.
The research findings presented in this paper demonstrated the comparative analysis of nature-inspired optimization algorithms with the K-means clustering technique for lung cancer image segmentation tasks. In future work, the proposed solution can be enhanced considering recent metaheuristic approaches like the sine-cosine technique. Furthermore, augmentation can be applied to increase the variability and diversity of the training medical image dataset, which can result in more generalized results for image segmentation tasks.
Acknowledgement: The authors would like to thank the editors and reviewers for their review and recommendations and also to extend their thanks to King Saud University for funding this work through the Researchers Supporting Project (RSP2023R395), King Saud University, Riyadh, Saudi Arabia.
Funding Statement: This work was supported by the Researchers Supporting Project (RSP2023R395), King Saud University, Riyadh, Saudi Arabia.
Author Contributions: Shazia Shamas and Ishu Sharma worked on designing the proposed methodology for segmentation of lung cancer images for early detection of lung cancer. Shazia Shamas, Ishu Sharma, and Kalpna Guleria worked on the experimentation part of the proposed framework that is based on nature-inspired techniques. Shazia Shamas, Ishu Sharma, Surya Narayan Panda, and Kalpna Guleria wrote the manuscript taking mutual decisions from all authors. Aman Singh, Ahmad Ali AlZubi, Mallak Ahmad AlZubi revised the manuscript critically for important intellectual content and improvement. All authors approved the final version of the manuscript.
Availability of Data and Materials: The research work is carried out on the publicly available Lung image dataset taken from VIA/I-ELCAP database. The link for the dataset is mentioned in the references.
Conflicts of Interest: The authors declare that they have no conflicts of interest to report regarding the present study.
References
1. Joon, P., Bajaj, S. B., Jatain, A. (2019). Segmentation and detection of lung cancer using image processing and clustering techniques. Proceedings of Progress in Advanced Computing and Intelligent Engineering, ICACIE 2017, pp. 13–23. Singapore. [Google Scholar]
2. Nie, L., Wang, M., Zhang, L., Yan, S., Zhang, B. et al. (2015). Disease inference from health-related questions via sparse deep learning. IEEE Transactions on Knowledge and Data Engineering, 27(8), 2107–2119. [Google Scholar]
3. Dhaware, B. U., Pise, A. C. (2016). Lung cancer detection using bayasein classifier and FCM segmentation. Proceedings of International Conference on Automatic Control and Dynamic Optimization Techniques, ICACDOT-2016, pp. 170–174. Pune, India. [Google Scholar]
4. Kavitha, P., Prabakaran, S. (2019). A novel hybrid segmentation method with particle swarm optimization and fuzzy C-mean based on partitioning the image for detecting lung cancer. https://www.preprints.org/manuscript/201906.0195/v1 [Google Scholar]
5. Makaju, S., Prasad, P. W. C., Alsadoon, A., Singh, A. K., Elchouemi, A. (2018). Lung cancer detection using CT scan images. Procedia Computer Science, 125, 107–114. [Google Scholar]
6. El-Regaily, S. A., Salem, M. A., Abdel Aziz, M. H., Roushdy, M. I. (2018). Survey of computer aided detection systems for lung cancer in computed tomography. Current Medical Imaging, 14(1), 3–18. [Google Scholar]
7. Bhattacharjee, A., Majumder, S. (2019). Automated computer-aided lung cancer detection system. Proceedings of Advances in Communication, Devices and Networking, ICCDN 2018, pp. 425–433. Singapore. [Google Scholar]
8. Sinha, P., Shaob, M. (2021). Detection of lung cancer in CT scans via deep learning and cuckoo search optimization and IOT. Helix-The Scientific Explorer, 11(5), 11–19. [Google Scholar]
9. Shamas, S., Panda, S. N., Sharma, I. (2022). K-means clustering using fuzzy C-means based image segmentation for lung cancer. Proceedings of International Conference on Computation, Automation and Knowledge Management, ICCAKM 2022, pp. 1–5. Dubai. [Google Scholar]
10. Parveen, S. S., Kavitha, C. (2015). Segmentation of CT lung nodules using FCM with firefly search algorithm. Proceedings of International Conference on Innovations in Information, Embedded and Communication Systems, ICIIECS-2015, pp. 1–6. Coimbatore, India. [Google Scholar]
11. Zhao, J., Ma, R., Qiang, Y., Cui, Z. (2015). Solitary pulmonary nodule segmentation based on the rolling ball method. Journal of Computational and Theoretical Nanoscience, 12(8), 1977–1983. [Google Scholar]
12. Asuntha, A., Brindha, A., Indirani, S., Srinivasan, A. (2016). Lung cancer detection using SVM algorithm and optimization techniques. Journal of Chemistry Pharmacy and Science, 9(4), 3198–3203. [Google Scholar]
13. Fernandes, S. L., Gurupur, V. P., Lin, H., Martis, R. J. (2017). A novel fusion approach for early lung cancer detection using computer aided diagnosis techniques. Journal of Medical Imaging and Health Informatics, 7(8), 1841–1850. [Google Scholar]
14. Anthimopoulos, M., Christodoulidis, S., Ebner, L., Geiser, T., Christe, A. et al. (2018). Semantic segmentation of pathological lung tissue with dilated fully convolutional networks. IEEE Journal of Biomedical and Health Informatics, 23(2), 714–722. [Google Scholar] [PubMed]
15. Da Silva, G. L. F., Valente, T. L. A., Silva, A. C., de Paiva, A. C., Gattass, M. (2018). Convolutional neural network-based PSO for lung nodule false positive reduction on CT images. Computer Methods and Programs in Biomedicine, 162, 109–118. [Google Scholar] [PubMed]
16. Sweetlin, J. D., Nehemiah, H. K., Kannan, A. (2019). Computer aided diagnosis of drug sensitive pulmonary tuberculosis with cavities, consolidations and nodular manifestations on lung CT images. International Journal of Bio-Inspired Computation, 13(2), 71–85. [Google Scholar]
17. Senthil Kumar, K., Venkatalakshmi, K., Karthikeyan, K. (2019). Lung cancer detection using image segmentation by means of various evolutionary algorithms. Computational and Mathematical Methods in Medicine, 2019, 1–16. [Google Scholar]
18. Prabukumar, M., Agilandeeswari, L., Ganesan, K. (2019). An intelligent lung cancer diagnosis system using cuckoo search optimization and support vector machine classifier. Journal of Ambient Intelligence and Humanized Computing, 10, 267–293. [Google Scholar]
19. Kamal, U., Rafi, A. M., Hoque, R., Wu, J., Hasan, M. K. (2020). Lung cancer tumor region segmentation using recurrent 3D-denseunet. Proceedings of Thoracic Image Analysis: Second International Workshop, pp. 36–47. Lima, Peru. [Google Scholar]
20. Lenin Fred, A., Kumar, S. N., Padmanaban, P., Gulyas, B., Ajay Kumar, H. (2020). Fuzzy-crow search optimization for medical image segmentation. Applications of Hybrid Metaheuristic Algorithms for Image Processing, Studies in Computational Intelligence, 890, 413–439. [Google Scholar]
21. Manoharan, S., Sathesh, A. (2020). Early diagnosis of lung cancer with probability of malignancy calculation and automatic segmentation of lung CT scan images. Journal of Innovative Image Processing, 2(4), 175–186. [Google Scholar]
22. Fischer, A. M., Varga-Szemes, A., Martin, S. S., Sperl, J. I., Sahbaee, P. et al. (2020). Artificial intelligence-based fully automated per lobe segmentation and emphysema-quantification based on chest computed tomography compared with global initiative for chronic obstructive lung disease severity of smokers. Journal of Thoracic Imaging, 35, 28–34. [Google Scholar]
23. Tian, Q., Wu, Y., Ren, X., Razmjooy, N. (2021). A new optimized sequential method for lung tumor diagnosis based on deep learning and converged search and rescue algorithm. Biomedical Signal Processing and Control, 68, 102761–102785. [Google Scholar]
24. Chakraborty, T., Banik, S. K., Bhadra, A. K., Nandi, D. (2021). Dynamically learned PSO based neighborhood influenced fuzzy C-means for pre-treatment and post-treatment organ segmentation from CT images. Computer Methods and Programs in Biomedicine, 202, 105971–105990. [Google Scholar] [PubMed]
25. Rakesh, S., Mahesh, S. (2021). Nodule segmentation of lung CT image for medical applications. Global Transitions Proceedings, 2(1), 80–87. [Google Scholar]
26. Lavanya, M., Kannan, P. M., Arivalagan, M. (2021). Lung cancer diagnosis and staging using firefly algorithm fuzzy C-means segmentation and support vector machine classification of lung nodules. International Journal of Biomedical Engineering and Technology, 37(2), 185–200. [Google Scholar]
27. Thakur, G., Wasson, V. (2021). Lung cancer segmentation and detection using cuckoo search evolutionary algorithms in early stage. Proceedings of International Conference on Smart Generation Computing, Communication and Networking, SMART GENCON-2021, pp. 1–7. Pune, India. [Google Scholar]
28. Kumar, D. (2022). Meta-heuristic techniques to train artificial neural networks for medical image classification: A review. Recent Advances in Computer Science and Communications, 15(4), 513–530. [Google Scholar]
29. Bilal, A., Sun, G., Li, Y., Mazhar, S., Latif, J. (2022). Lung nodules detection using grey wolf optimization by weighted filters and classification using CNN. Journal of the Chinese Institute of Engineers, 45(2), 175–186. [Google Scholar]
30. Sun, Y., Cui, Y., Huang, Y., Lin, Z. (2021). SDMP: A secure detector for epidemic disease file based on DNN. Information Fusion, 68, 1–7. [Google Scholar]
31. Sun, Y., Liu, J., Yu, K., Alazab, M., Lin, K. (2021). PMRSS: Privacy-preserving medical record searching scheme for intelligent diagnosis in IoT healthcare. IEEE Transactions on Industrial Informatics, 18(3), 1981–1990. [Google Scholar]
32. Sun, Y., Yu, K., Bashir, A. K., Liao, X. (2021). Bl-IEA: A bit-level image encryption algorithm for cognitive services in intelligent transportation systems. IEEE Transactions on Intelligent Transportation Systems, 24(1), 1–13. [Google Scholar]
33. He, B., Hu, W., Zhang, K., Yuan, S., Han, X. et al. (2022). Image segmentation algorithm of lung cancer based on neural network model. Expert Systems, 39(3), 12822. [Google Scholar]
34. Narayanamoorthy, S., Karthick, P. (2019). A comparative performance of gray level image thresholding using normalized graph cut based standard S membership function. Iranian Journal of Fuzzy Systems, 16(1), 17–31. [Google Scholar]
35. Karthick, P., Narayanamoorthy, S., Maheswari, S., Sowmiya, S. (2021). Efficient image segmentation performance of gray-level image using normalized graph cut based neutrosophic membership function. Journal of Electron Imaging, 30(4), 43014. [Google Scholar]
36. Karthick, P., Mohiuddine, S. A., Tamilvanan, K., Narayanamoorthy, S., Maheswari, S. (2023). Investigations of color image segmentation based on connectivity measure, shape priority and normalized fuzzy graph cut. Applied Soft Computing, 139, 110239. [Google Scholar]
37. Khrissi, L., Akkad, N. E. L., Satori, H., Satori, K. (2021). An efficient image clustering technique based on fuzzy C-means and cuckoo search algorithm. International Journal of Advanced Computer Science and Applications, 12(6), 423–432. [Google Scholar]
38. Jian, M., Wu, R., Chen, H., Fu, L., Yang, C. (2023). Dual-branch-UNet: A dual-branch convolutional neural network for medical image segmentation. Computer Modeling in Engineering & Sciences, 137(1), 705–716. https://doi.org/10.32604/cmes.2023.027425 [Google Scholar] [PubMed] [CrossRef]
39. Lee, S., Lee, A., Hong, M. (2023). Cardiac CT image segmentation for deep learning–based coronary calcium detection using K-means clustering and grabcut algorithm. Computer Systems Science and Engineering, 46(2), 2543–2554. [Google Scholar]
40. Liu, J., Yuan, G., Yang, C., Song, H., Luo, L. (2023). An interpretable CNN for the segmentation of the left ventricle in cardiac MRI by real-time visualization. Computer Modeling in Engineering & Sciences, 135(2), 1571–1587. https://doi.org/10.32604/cmes.2022.023195 [Google Scholar] [PubMed] [CrossRef]
41. Guo, H., Kruger, U., Wang, G., Kalra, M. K., Yan, P. (2019). Knowledge-based analysis for mortality prediction from CT images. IEEE Journal of Biomedical and Health Informatics, 24(2), 457–464. [Google Scholar] [PubMed]
42. Yu, H., Zhou, Z., Wang, Q. (2020). Deep learning assisted predict of lung cancer on computed tomography images using the adaptive hierarchical heuristic mathematical model. IEEE Access, 8, 86400–86410. [Google Scholar]
43. Aonpong, P., Iwamoto, Y., Han, X. H., Lin, L., Chen, Y. W. (2021). Genotype-guided radiomics signatures for recurrence prediction of non-small cell lung cancer. IEEE Access, 9, 90244–90254. [Google Scholar]
44. Silva, F., Pereira, T., Morgado, J., Frade, J., Mendes, J. et al. (2021). EGFR assessment in lung cancer CT images: Analysis of local and holistic regions of interest using deep unsupervised transfer learning. IEEE Access, 9, 58667–58676. [Google Scholar]
45. Shan, R., Rezaei, T. (2021). Lung cancer diagnosis based on an ANN optimized by improved TEO algorithm. Computational Intelligence and Neuroscience, 2021, 1–11. [Google Scholar]
46. VIA/I-ELCAP Public Access Research Database (2003). ELCAP public Lung Image Database. https://www.via.cornell.edu/lungdb.html [Google Scholar]
47. Asuntha, A., Srinivasan, A. (2020). Deep learning for lung cancer detection and classification. Multimedia Tools and Applications, 79, 7731–7762. [Google Scholar]
48. Moriya, T., Roth, H. R., Nakamura, S., Oda, H., Nagara, K. et al. (2018). Unsupervised pathology image segmentation using representation learning with spherical K-means. Medical Imaging: Digital Pathology, 10581, 278–284. [Google Scholar]
49. Singh, B., Swamy, A., Khurram, S., Regin, R., Poonkuzhali, P. et al. (2021). Detection and localization of early-stage lung tumor using K-means clustering and object counting. Proceedings of International Conference on Smart Electronics and Communication, ICOSEC, pp. 1641–1644. Trichy, India. [Google Scholar]
50. Yang, X. S., Deb, S. (2009). Cuckoo search via lévy flights. Proceedings of World Congress on Nature & Biologically Inspired Computing, NaBIC-2009, pp. 210–214. Coimbatore, India. [Google Scholar]
51. Li, Z., Zhang, J., Tan, T., Teng, X., Sun, X. et al. (2020). Deep learning methods for lung cancer segmentation in whole-slide histopathology images—the acdc@ lunghp challenge 2019. IEEE Journal of Biomedical and Health Informatics, 25(2), 429–440. [Google Scholar]
52. Jena, S. R., George, S. T., Ponraj, D. N. (2021). Lung cancer detection and classification with DGMM-RBCNN technique. Neural Computing and Applications, 33, 15601–15617. [Google Scholar]
53. Zhao, J., Dang, M., Chen, Z., Wan, L. (2022). DSU-Net: Distraction-Sensitive U-Net for 3D lung tumor segmentation. Engineering Applications of Artificial Intelligence, 109, 104649–104700. [Google Scholar]
54. Raj, R., Rajiv, P., Kumar, P., Khari, M., Verdú, E. et al. (2020). Feature based video stabilization based on boosted HAAR cascade and representative point matching algorithm. Image and Vision Computing, 101, 103957. [Google Scholar]
55. Sharma, S., Guleria, K., Tiwari, S., Kumar, S. (2022). A deep learning based convolutional neural network model with VGG16 feature extractor for the detection of Alzheimer disease using MRI scans. Measurement: Sensors, 24, 100506. [Google Scholar]
56. Guleria, K., Sharma, S., Kumar, S., Tiwari, S. (2022). Early prediction of hypothyroidism and multiclass classification using predictive machine learning and deep learning. Measurement: Sensors, 24, 100482. [Google Scholar]
Cite This Article
 Copyright © 2024 The Author(s). Published by Tech Science Press.
This work is licensed under a Creative Commons Attribution 4.0 International License , which permits unrestricted use, distribution, and reproduction in any medium, provided the original work is properly cited.
 Downloads
 Citation Tools