
 Submit a Paper
 Propose a Special lssue
 Open Access
ARTICLE

Screen for autophagy-related biomarkers in osteoarthritis based on bioinformatic analysis
Department of Huaxin Orthopedics, Hengyang Central Hospital, Hengyang, China
* Corresponding Author: CHAO LIU. Email:
BIOCELL 2024, 48(2), 339-351. https://doi.org/10.32604/biocell.2023.047044
Received 24 July 2023; Accepted 24 October 2023; Issue published 23 February 2024
 View Full Text
 Download PDF
Abstract
Introduction: Osteoarthritis (OA) is still an important health problem, and understanding its pathological mechanisms is essential for its diagnosis and treatment. There is evidence that autophagy may play a role in OA progression, but the exact mechanism remains unclear. Methods: In this study, we adopted a multi-prong approach to systematically identify the key autophagy-related genes (ARGs) associated with OA. Through weighted gene co-expression network analysis, we initially identified significant gene modules associated with OA. Subsequent differential gene analysis performed on normal and OA specimens. Further analysis later using the MCC algorithm highlighted hub ARGs. These genes were then incorporated into the prediction model of OA. In addition, the expression patterns of these DEGs were verified by in vitro experiments. Results: A total of 104 differentially expressed genes (DEGs) were identified by differential gene analysis, of which 102 were up-regulated and 2 were down-regulated. These differentially expressed genes were closely related to key signaling pathways, such as PI3K-Akt signaling pathway, IL-17 signaling pathway and osteoclast differentiation. Further MCC analysis highlighted 10 hub ARGs, among which ATF3, CYCS, FOXO3, KLF6, NFKBIA and SOCS3 were particularly significant, which were then included in the prediction model of OA, which showed robust prediction ability with an area under the curve of 0.783. In vitro experiments confirmed that the expression pattern of these DEGs was consistent with our prediction. Conclusion: In summary, our comprehensive analysis not only provides new insights into the molecular basis of OA, but also suggests potential biomarkers for its diagnosis.Keywords
Osteoarthritis (OA) is a representative chronic degenerative joint disease that primarily features cartilage degeneration and synovial inflammation. It severely affects joint function and leads to major limitations in daily life. Currently, no effective treatment method is available [1]. More than 200 million individuals worldwide are diagnosed with OA, causing a huge burden to the society [2,3]. Nevertheless, diagnosis and treatment in the early stage can assist in effectively preventing joint injury and disease progression. Imaging findings and clinical manifestations are effective diagnostic methods for OA; however, these methods can only detect severe OA [4]. Furthermore, the severity of structural degeneration does not always correspond to the clinical manifestations. No effective methods for diagnosing, staging, and monitoring joint pathology are available, which has been a major obstacle for disease modification [5]. Therefore, studies have focused on finding potential biomarkers to achieve effective OA diagnosis and treatment in the early stage.
OA can impact the entire joint tissue, such as the synovium. The synovium is an important tissue that produces synovial fluid to keep joints moving smoothly [6]. Studies [7] have shown that pathological changes in the synovium may precede visible cartilage degeneration during OA. Magnetic resonance imaging and ultrasonography can verify the synovial pathological variations in the early stage of OA, such as synovial lining thickening and joint effusion [8]. With the further development of synovitis, the release of proinflammatory cytokines caused by synovial tissue inflammation may lead to cartilage breakdown, thereby aggravating synovitis, forming a vicious circle [9,10]. However, only a few studies have focused on the molecular mechanisms underlying synovitis and OA progression. According to an increasing number of relevant studies, autophagy greatly affects OA progression [11]. Autophagy is a catabolic process that involves eukaryotic cells and exhibits strong conservative properties. It can degrade aging or injured organelles, decompose unnecessary macromolecules or pathogens, and release energy and nutrients via lysosomal mechanisms to ensure cell survival and maintain cell homeostasis [12]. Recently, bioinformatics has shown strong potential in several biomedical fields. It uses computational methods to analyze and interpret biological data, providing new perspectives on disease mechanisms, potential drug targets, and biomarker discovery. Revealing the complex molecular mechanisms of complex diseases, such as OA, may be difficult using traditional experimental methods. To date, bioinformatics can process large-scale gene expression data and identify key gene networks and pathways, providing powerful support for in-depth understanding and treatment of diseases. Autophagy dysregulation is related to the pathogenesis of various conditions, including immune disorders, neurodegenerative diseases, aging, and cancer [13]. In recent studies [14], autophagy and its associated related proteins have been shown to regulate the molecular mechanisms that affect the activation process of osteoclasts, such as osteoclastic differentiation and migration and bone resorption mediated by osteoclasts. Regarding inflammatory arthritis, precursor cells of osteoclasts can also activate autophagy, thereby aggravating disease development. Several autophagy-related genes (ARGs) and related signaling pathways are interrelated with the pathogenic process of OA. All these can help more deeply understand the role played by autophagy in OA, particularly in research areas of cartilage cells. Nevertheless, studies have not thoroughly explored the underlying mechanism related to osteoclast activation in OA, and neither have comprehensively identified useful biomarkers or gene networks representing the latent regulatory targets for OA.
In this study, the authors used the Gene Expression Omnibus (GEO) database and Single-Sample Geneset Enrichment Analysis (ssGSEA) algorithm to assess the potential value of ARGs in OA, providing potential solutions for the clinical treatment and diagnosis of OA.
The GSE55235, GSE55457, GSE77298, and GSE82107 microarrays were obtained from the GEO [15] database download dataset, where the GSE55235 and GSE55457 microarray data separately contain 10 arthritis samples and 10 control samples, the GSE77298 microarray data contain 16 arthritic samples and 7 control samples, and the GSE82107 microarray data contain 10 arthritis samples and 7 control samples. The authors used the R package sva [16] for batch processing and finally obtained a matrix of 34 control samples and 46 OA model samples. Furthermore, 232 ARGs were obtained from the Human Autophagy Database (HADb) (http://www.autophagy.lu/index.html) and the mRNA matrix from autophagy gene data.
To combine information from multiple datasets, we employed the “merge” function in R. During this process, we retained genes that were common to all datasets, ensuring a consistent gene list for downstream analyses. Genes specific to individual datasets were excluded to avoid potential biases.
Given the potential biases introduced when merging data from different sources, we took rigorous steps to correct for batch effects. We used the “ComBat” algorithm from the “sva” package in R. Parameters for this correction were set to adjust for the source of each dataset and any other potential confounding variables. The application of the “ComBat” algorithm has been widely recognized for its effectiveness in aligning the distribution of gene expression values across batches, ensuring a cohesive dataset that is free from batch-specific biases.
After gene screening, it was essential to ensure that gene expression values were comparable across different samples. To achieve this, we applied “quantile normalization” to the selected genes. This normalization method ensures that the distribution of gene expression values is consistent across samples, making downstream analyses more reliable.
Weighted gene co-expression network analysis (WGCNA)
We first performed differential gene expression analysis, and then conducted Weighted Gene Co-expression Network Analysis (WGCNA) to identify co-expression modules associating with OA. According to the gene difference between the two groups of samples in the merged dataset, the threshold was set at a false discovery rate <0.05 | folding change | > 1 for screening. And then identified co-expressed genes and modules based on the expression profiles of these DEGs using the WGCNA algorithm [17]. Weighted correlation network analysis (WGCNA) was performed through the ‘WGCNA’ R package. Gene after screening were used as input genes for WGCNA. Input genes and samples were filtered by the good genes sample test via the ‘goodSamplesGenes’ function. The soft thresholding power β was chosen as the lowest power when the scale-free fit R (2) nears 0.85. In this study, β = 12 was selected to construct the scale-free network. A weighted adjacency matrix was then formed using the power function, where the adjacency between Gene_m and Gene_n (denoted as A_mn) is equal to the absolute value of Pearson’s correlation between Gene_m and Gene_n (denoted as C_mn) raised to the power of beta. In this equation, beta serves as a soft-thresholding parameter that emphasizes strong gene correlations and penalizes weaker ones. With a chosen power of 1, the adjacency was transformed into a topological overlap matrix (TOM). The TOM provides a measure of the network connectivity of a gene, which is defined as its adjacency summation with all other genes for network generation. Simultaneously, the corresponding dissimilarity (1 minus TOM) was computed. To categorize genes with analogous expression patterns into gene modules, average linkage hierarchical clustering was performed based on the TOM-driven dissimilarity measure, setting a minimum size of 30 for the gene dendrogram with a sensitivity setting of 3. Delving deeper into the module analysis, we gauged the dissimilarity of module eigengenes, defined a cut line for the module dendrogram, and amalgamated certain modules. Moreover, modules with a distance of <0.25 were merged. Following this comprehensive analysis, we identified two co-expression modules, with the gray module characterized as a collection of genes that could not be allocated to any specific module.
Autophagy gene infiltration estimation
Next, we estimated the relative infiltration abundance of autophagy genes in OA and normal synovial tissue using the ssGSEA algorithm implemented in the GSVA R package [18]. ssGSEA is a method for estimating the degree of enrichment of a gene set within a single sample. It can determine the extent to which a biological process (BP) or pathway, defined by a set of genes, is activated in a sample. For each cluster, we calculated normalized enrichment scores (NES) of autophagy-relevant gene sets by projecting the matrix of signed multi-omic feature weights Wsigned onto hallmark pathway gene sets using ssGSEA available on: https://github.com/broadinstitute/ssGSEA2.0 (parameters:gene.set.database = “h.all.v6.2.symbols.gmt” sample.norm.type = “rank”weight = 1statistic = “area.under.RES”output.score.type = “NES”nperm = 1000global.fdr = TRUE min.overlap = 5 correl.type = “z.score”).
To apply ssGSEA for infiltrating autophagy genes, we first compiled a set of ARGs from public databases, such as the HADb. Then, ssGSEA was applied to transcriptomic data from OA and normal synovial samples to calculate enrichment scores for the autophagy gene set in each sample. The enrichment scores reflect the relative abundance of autophagy genes in each synovial sample. Comparing the scores between the OA and normal groups allowed us to determine whether autophagy gene infiltration was significantly different between the two cohorts. Higher enrichment scores imply increased presence and activity of the autophagy pathway. We used the GSVA package in R to calculate the enrichment score of each sample within the gene set. We predefined the gene ranking. Specifically, using the gene expression profiles, we adopted the method described by [19] and predefined a set of genes to assess the enrichment score across various gene sets. We set a minimum gene set size of 5 and a maximum gene set size of 5,000, thereby calculating the enrichment score for each sample within each gene set. Ultimately, we obtained an enrichment score matrix.
Regression analysis using the least absolute shrinkage and selection operator (LASSO)
The LASSO algorithm was applied with the glmnet package (https://cran.r-project.org/web/packages/glmnet/), was used to select the most informative hub genes for OA prediction. This method is particularly useful for high-dimensional data because it performs both variable selection and regularization to enhance the prediction accuracy and interpretability of the statistical model: Risk scores =
Identification of differentially expressed genes (DEGs) in arthritis-related autophagy
After performing WGCNA and ssGSEA analysis, we identified a set of genes that are highly associated with osteoarthritis (OA) and autophagy. To further refine the gene set related to OA, we conducted another screening for differential genes, this time employing improved screening conditions (|log2FC| > 2). To examine how the expression levels of ARGs affect arthritis, we used the R package “limma” [20] for differential gene expression analysis on the two aforementioned groups of samples in the merged dataset. A threshold value of log2FC > 2 and adjusted p values < 0.05 were set for DEGs. Volcano plots and heat maps demonstrate the results.
Gene Ontology (GO) and Kyoto Encyclopedia of Genes and Genomes (KEGG) pathway enrichment analysis for DEGs was performed using the clusterProfiler R package [21]. GO analysis determines which gene ontology terms, such as BPs, cellular components (CCs), and molecular functions (MFs), are overrepresented in the DEG list. Overrepresented terms indicate pathways and processes altered between the comparison groups. KEGG analysis identifies KEGG pathways with significant enrichment of DEGs. This highlights key signaling, and metabolic pathways affected by changes in DEG expression. Together, GO and KEGG enrichment paint a functional picture of the biological state associated with the DEG signature. The enriched terms represent the differential functions and mechanisms between the compared cohorts.
Protein–protein interaction (PPI) network
The protein-protein interaction (PPI) network was constructed using the Search Tool for the Retrieval of Interacting Genes (STRING, https://string-db.org/) database. Genes with a node degree of ≥5 in the PPI network were considered as hub genes. The PPI network was visualized using Cytoscape software. The hub genes of the modules were compared with those of the PPI network using the VennDiagram package in R software. STRING mines published literature to predict functional and physical interactions between proteins based on various evidence channels. DEGs were input into STRING to build a network of protein interactions with confidence scores above the threshold. The network was visualized using Cytoscape, where nodes represent proteins and edges depict predicted functional links between them. Hub genes, defined as highly interconnected central nodes, were identified from the PPI network using CytoHubba in Cytoscape. Hub genes often play important biological roles and studying them can provide insights into key DEG-associated mechanisms. PPI networks that integrate DEG-encoded proteins provide a global view of how proteins interact functionally. Identifying hub proteins highlights key players in the DEG interactome.
Acquisition and modeling of rat chondrocytes
In order to simulate the inflammatory microenvironment, we established an osteoarthritis (OA) model using healthy male Sprague-Dawley rats weighing 200–220 g (Wuhan, Hubei, China, Suntech Biologicals, No. SNP-R082). The OA model was prepared by the Hulth method, and the rats were anesthetized using 3% sodium pentobarbital (50 mg/kg) by intraperitoneal injection. The hair around both knee joints was shaved and the skin was sterilized. The epiphyseal plate of the right knee was opened by medial approach, and the cartilage layer of the epiphyseal plate was opened with microshears. After the cartilage layer of the epiphyseal plate was removed, the incision was corrected and closed. Penicillin was administered to prevent infection and the rats were modeled continuously for 2 weeks, after which the rats were executed and the cartilage tissue of the knee joints was obtained. The cartilage was removed under aseptic conditions, washed with PBS, minced, and digested with 0.2% collagenase II overnight. The precipitated chondrocytes were washed with PBS and counted and inoculated into culture flasks. The obtained OA rat chondrocytes were cultured in DMEM/F12 medium containing 10% fetal bovine serum. Subsequent steps to stimulate chondrocytes using IL-1β to verify the level of Hub gene expression were performed as described previously in the methods section. Chondrocytes from rats with OA stimulated with interleukin (IL)-1β were cultured at 37°C in Dulbecco’s Modified Eagle Medium/F12 medium containing 10% fetal bovine serum (10099, Thermo-Fisher Science, Massachusetts, USA). We established a negative control group (NC group) and an IL-1β group. cells in the NC and IL-1β groups were cultured in normal medium and medium containing IL-1β (40 ng/mL), respectively.
Quantitative real-time reverse-transcription polymerase chain reaction (qRT-PCR) verification of Hub genes
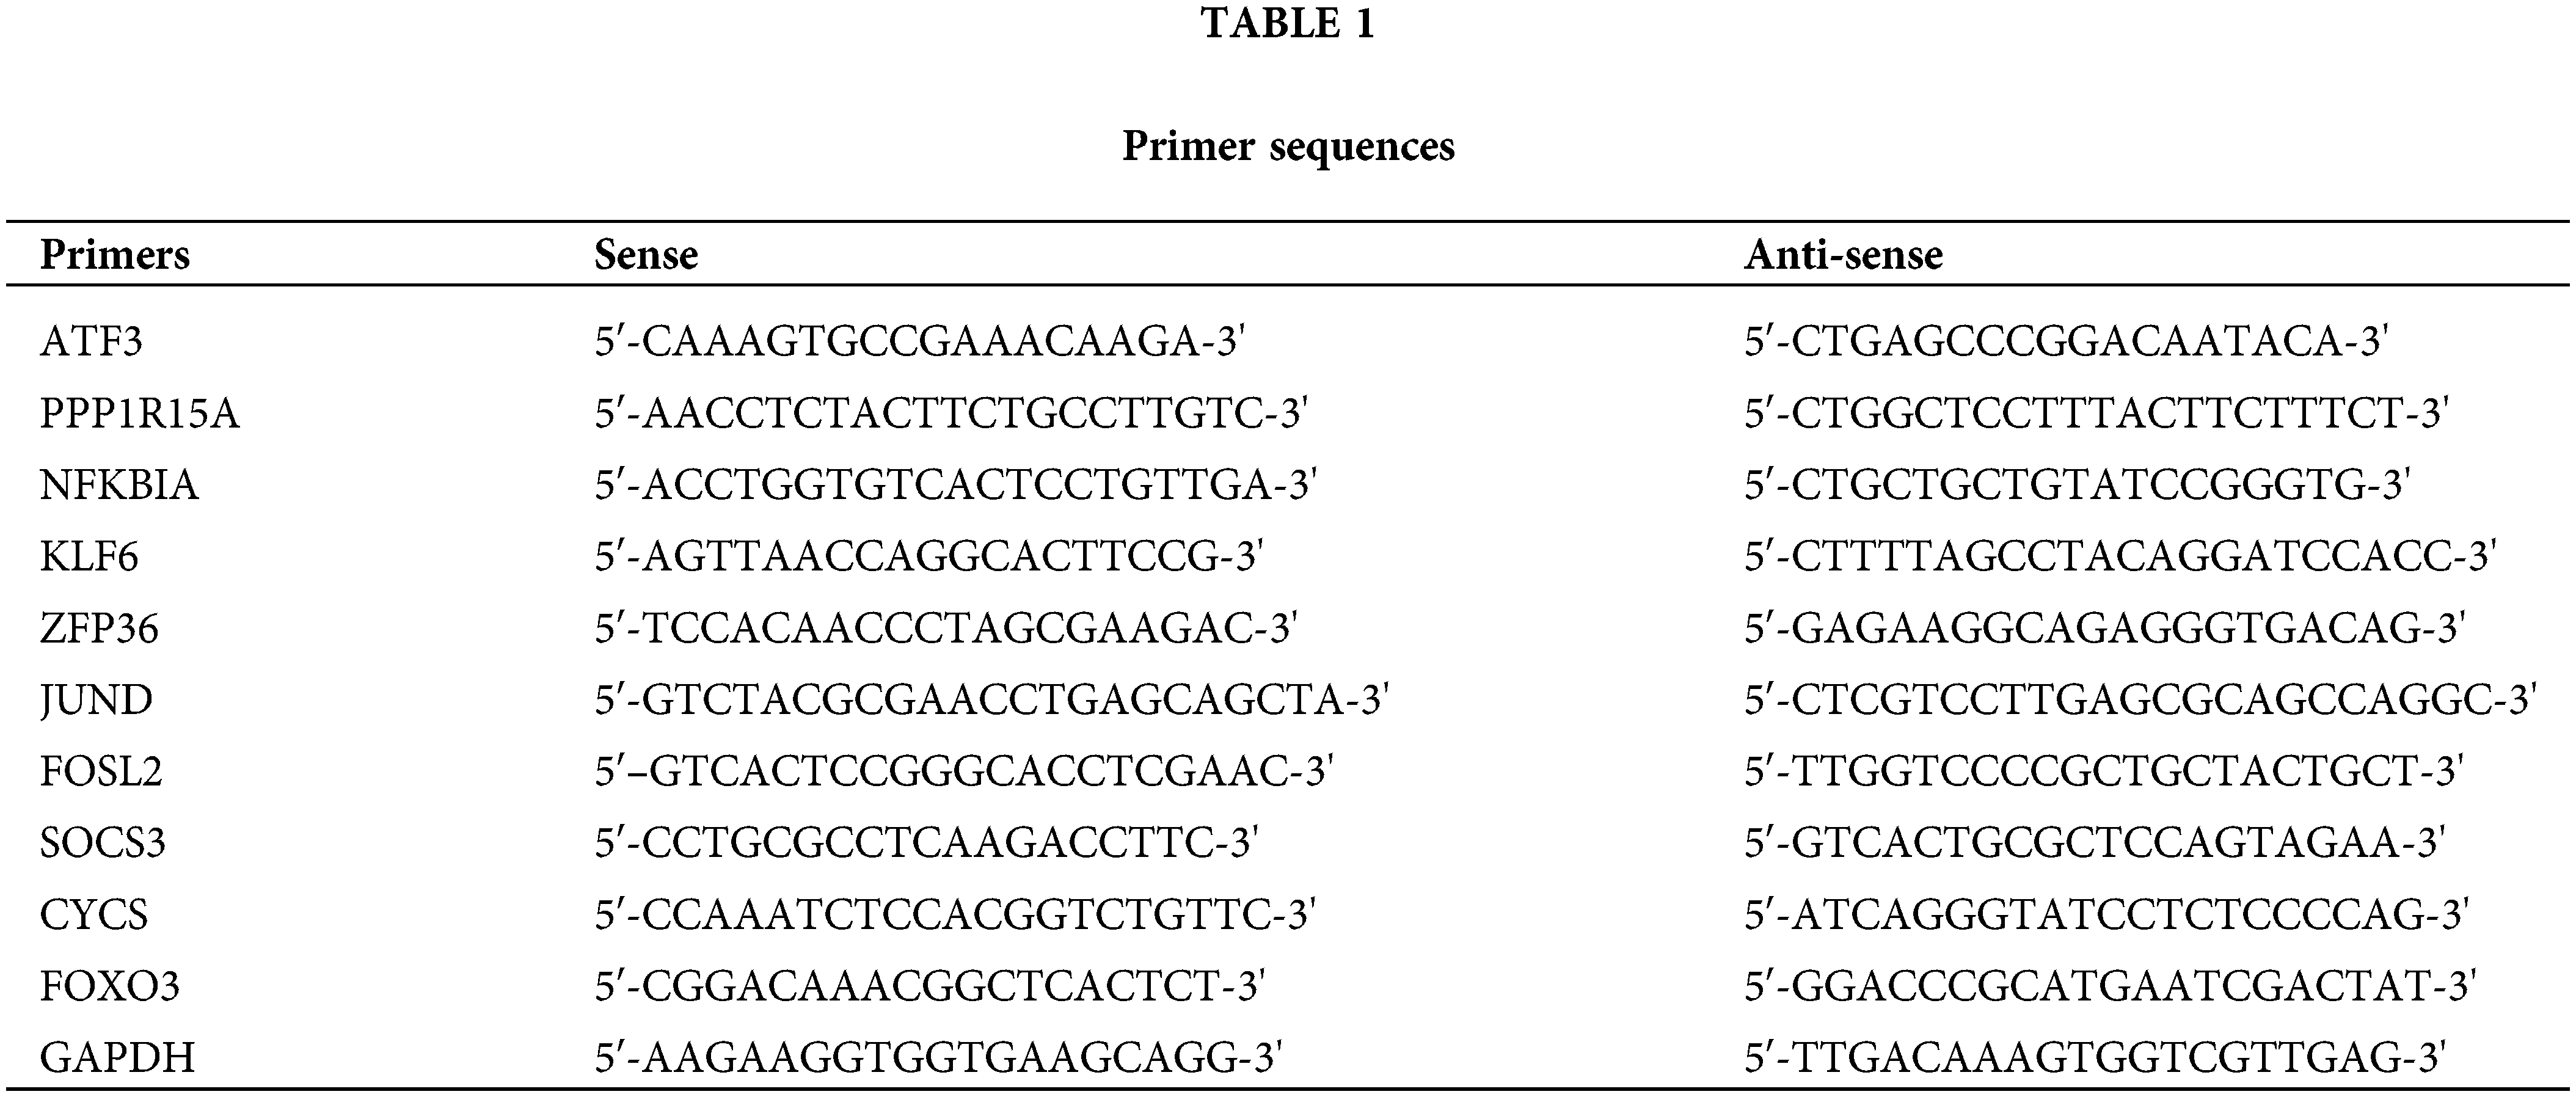
In order to confirm whether the hub gene is really highly expressed in OA rats, we conducted qRT-PCR experiments. We extracted total RNA from IL-1β-stimulated OA rat chondrocytes and reverse transcribed it into cDNA. qRT-PCR (quantitative real-time fluorescence PCR) was used to detect the expression of the following genes: ATF3, NFKBIA, KLF6, ZFP36, JUND, FOSL2, SOCS3, CYCS, FOXO3 and PPP1R15A. The qRT-PCR experiments were performed on a CFX96 real-time fluorescence quantitative PCR instrument (Bio-Rad, Hercules, California, USA) using the TransStart Green qPCR SuperMix kit (Beijing QuanStyle Gold Biotechnology Co., Ltd., China). The reaction conditions were as follows: pre-denaturation at 95°C for 3 min, denaturation at 95°C for 15 s, annealing & amplification at 60°C for 30 s, 40 cycles. melting curve 65°C–95°C, each temperature lasting 5 s. GAPDH was used as the endogenous gene. The relative expression of target genes was analyzed by 2-ΔΔCt method with GAPDH as internal reference. Three technical replicates were set for each sample. The primer sequences are shown in Table 1.
Western blot (WB) verification of Hub genes
Based on the cells in the qRT-PCR verification, we used WB experiments to detect the changes in proteins in the cells, as detailed below. Each group of cells was collected and cultured. The radioimmunoprecipitation assay lysis method was used for total protein extraction. The bicinchoninic acid method was used for protein concentration detection. After the protein concentration was adjusted to 4 μg/μL, 12% sodium dodecyl sulfate-polyacrylamide gel electrophoresis was used. The separated protein was transferred onto polyvinylidene difluoride membranes, stained with Ponceau working solution, and soaked in phosphate-buffered saline with Tween 20 for 5 min. Then, the membrane underwent 2 h of blocking treatment in 5% skimmed milk powder, followed by one night of blocking in primary antibody (1:500) at 4°C; the primary antibody was obtained from Abcam. After washing to remove the primary antibody, the membrane was added with horseradish peroxidase-labeled secondary antibody and incubated at 37°C for 1 h and rinsed with phosphate-buffered saline three times for 5 min. After developing in a dark room, a filter paper was used to blot the excess liquid, followed by development with electrochemiluminescence light. After the protein band was scanned, Quantity One was used to analyze its gray value (GV), where the protein’s relative expression level = the GV of the target protein band/the GV of the glyceraldehyde-3-phosphate dehydrogenase protein band. The expression levels of ATF3 (ab254268, 1:1000, Abcam, Cambridge, Britain), NFKBIA (SAB5700575, 1:1000, Sigma-Aldrich, Darmstadt, Germany), KLF6 (ab241385, 1:500, Abcam, Cambridge, Britain), ZFP36 (ab204922, 1:1000, Abcam, Cambridge, Britain), JUND (ab181615, 1:1000, Affinity, Cincinnati, USA), FOSL2 (SAB1411950, 1:500, Sigma-Aldrich, Darmstadt, Germany), SOCS3 (ab280884, 1:1000, Abcam, Cambridge, Britain), CYCS (ab133504, 1:5000, Abcam, Cambridge, Britain), FOXO3 (ab265069, 1:1000, Abcam, Cambridge, Britain) and PPP1R15A(SAB2500814, 1:1000, Sigma-Aldrich, Darmstadt, Germany) were analyzed.
R Studio (version 4.1.1) was used to process and analyze the data. We compared continuous variables between two groups using the independent samples t-test and Mann–Whitney U test. The chi-square test or Fisher’s exact test was used to analyze the statistical significance of categorical variables. Pearson correlation analysis was performed to estimate the gene correlation coefficient. The statistical p values were all two-sided. p values < 0.05 were used to denote statistical significance.
Gene screening and normalization
We first used the R package inSilicoMerging [22] to merge multiple datasets and matrices. After further procedures were performed to remove the batch effect, a matrix without the batch effect was finally obtained. It contains information on 80 samples and 13,228 genes (Fig. 1A). In Figs. 1B–1D, before the batch effect was removed, each dataset had a significantly different sample distribution; therefore, a batch effect existed. After the batch effect was removed, each dataset tended to present a consistent data distribution. These results indicate that the data set after cleaning was eligible for subsequent analysis.
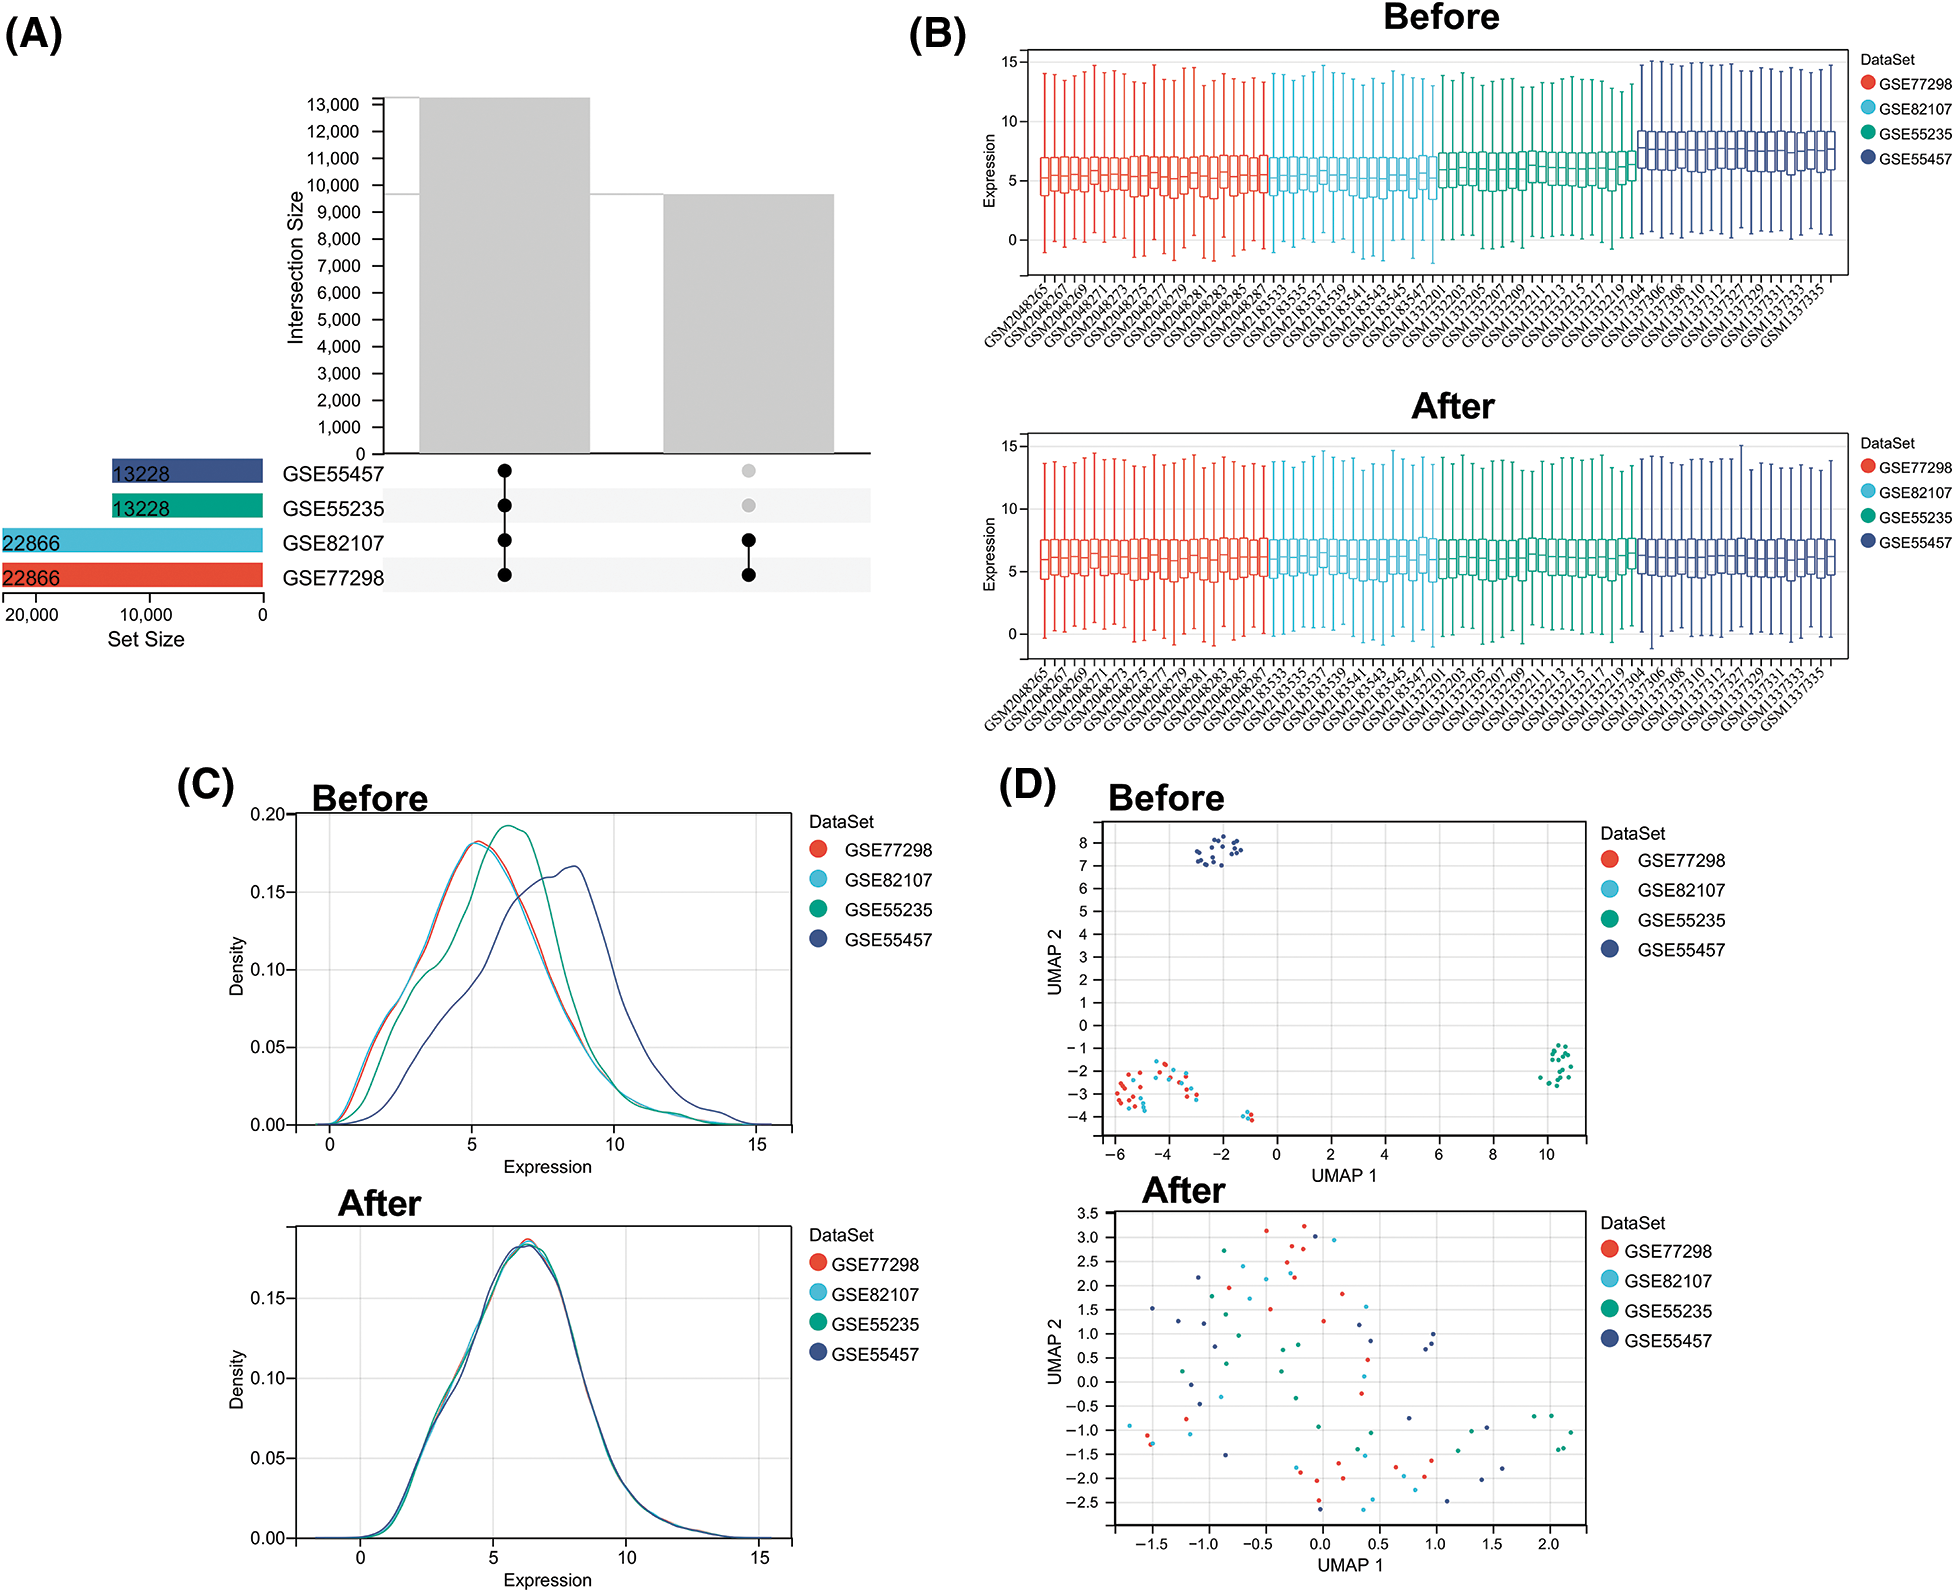
Figure 1: Data normalization processing. (A) Venn diagram showing common genes in four microarray datasets before batch removal. (B) Density plots comparing gene expression distribution before and after batch effect removal. (C) Uniform manifold approximation and projection plots showing sample distribution before and after batch effect removal. (D) Boxplots comparing expression levels across batches before and after batch effect removal.
To further obtain ARGs that are strongly related to OA, we performed WGCNA analysis on the cleaned data set. To ensure a scale-free network, β = 12 was selected (Fig. 2A). The gene expression matrix was first transformed into an adjacency matrix and then transformed into a topological matrix (Fig. 2B). Two modules were finally obtained. Further correlation analysis was performed between each module and sample type and immune scores (Figs. 2C and 2D). The turquoise module was the most significant module positively correlated with the autophagy score, which also exhibited an obviously positive relevance to OA samples (Fig. 2E).
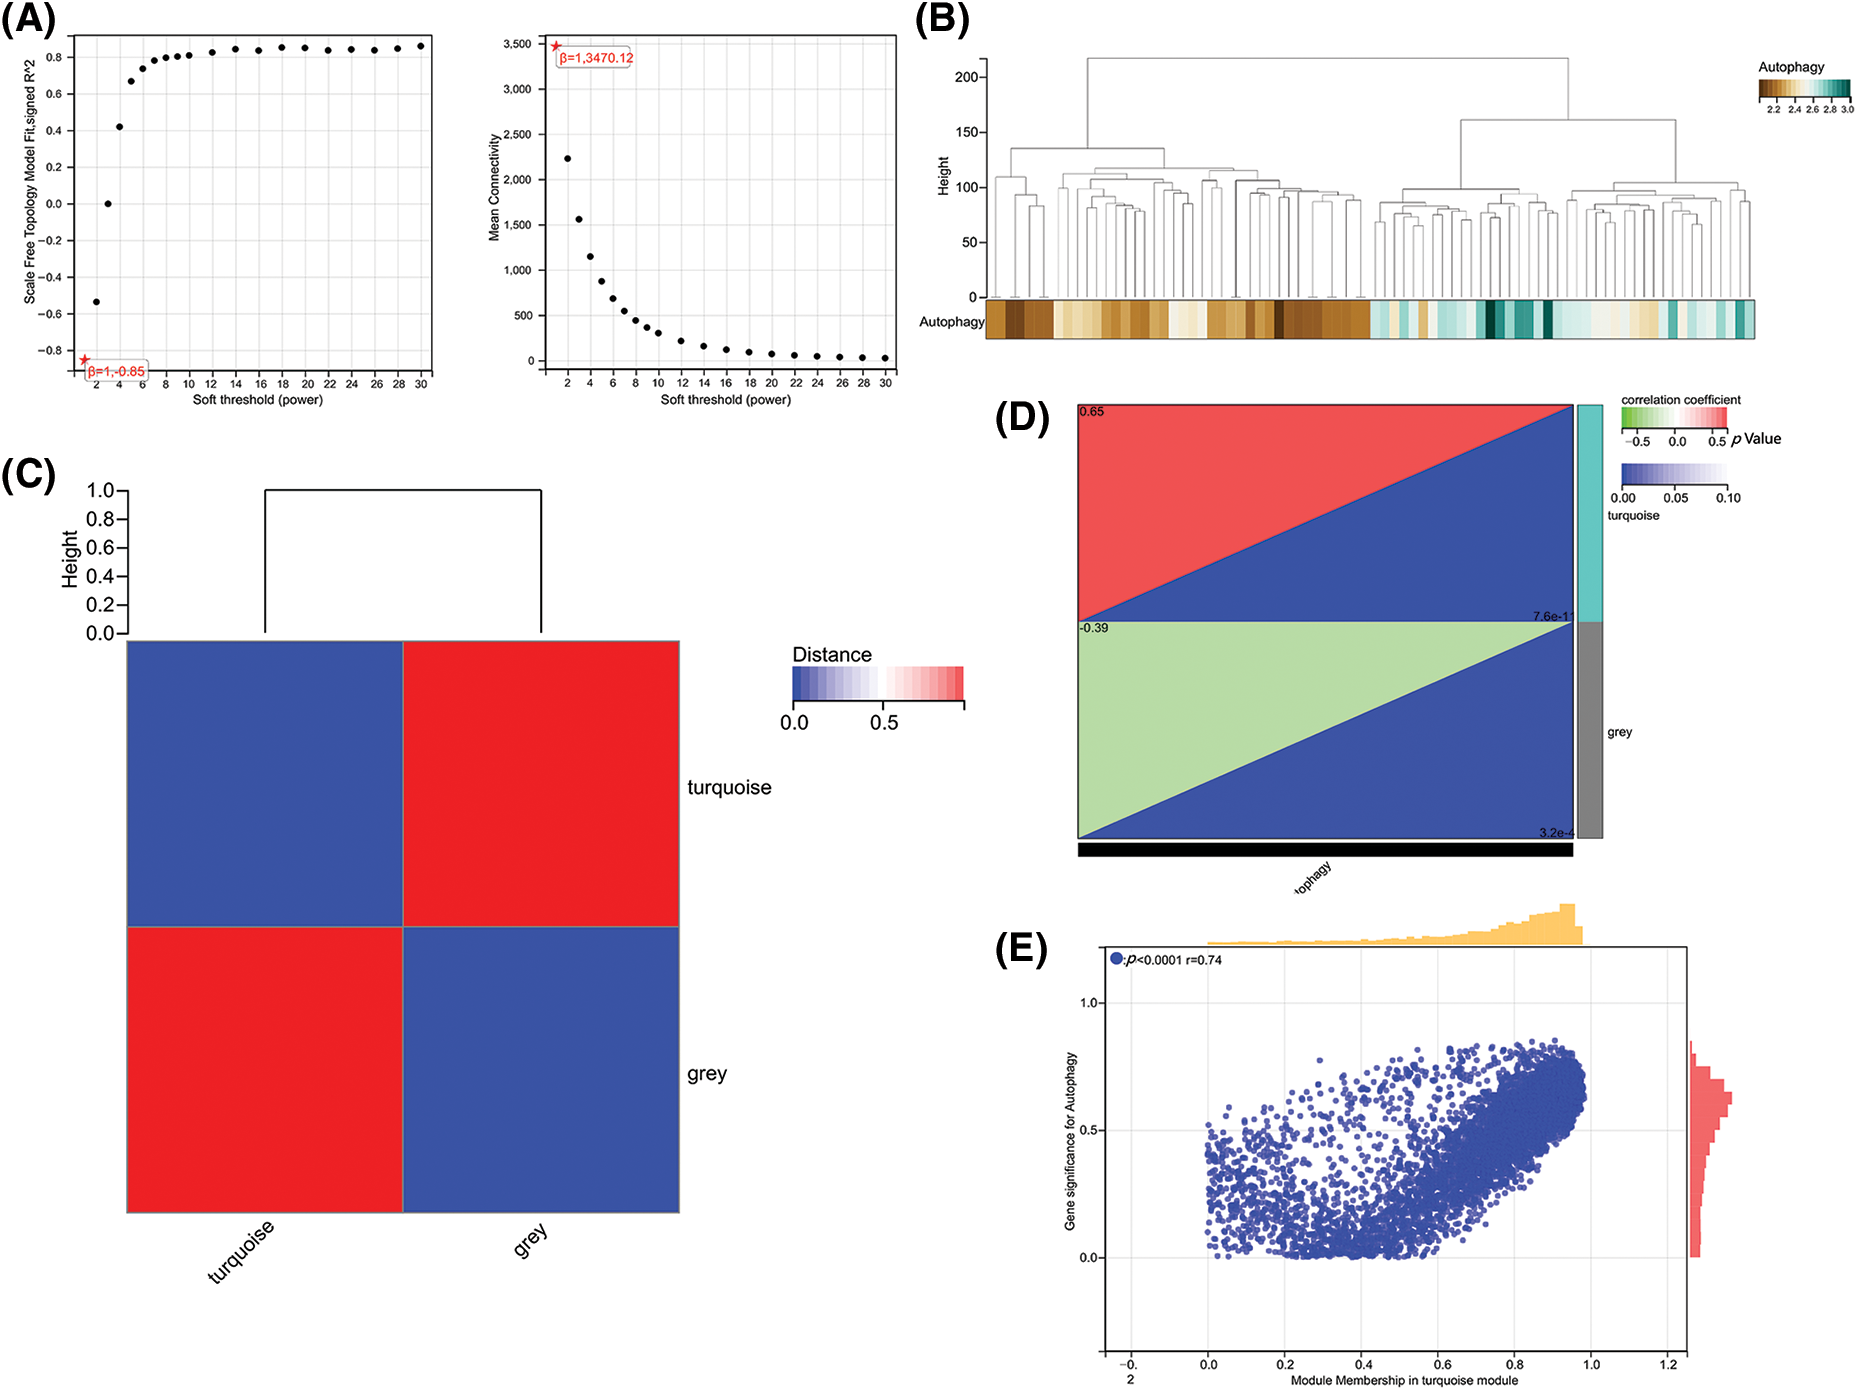
Figure 2: Gene co-expression network analysis identifies modules associated with immune activity. (A) Analysis of network topology for various soft-thresholding powers. (B) Dendrogram and colored modules from WGCNA. (C) Heatmap of module–trait correlations with immune scores. (D and E) Scatterplots of module eigengene values vs. autophagy scores.
After WGCNA and ssGSEA analysis, we obtained 3318 ARGs. To further screen hub genes, we performed differential analysis on these genes. We used |log2FC| > 2 as a new screening criterion. After the data were screened, we confirmed 104 DEGs, including 102 up-regulated genes and two down-regulated genes. In Fig. 3A, a volcano plot shows the up- and down-regulated DEGs (Fig. 3A), and a heat map displays the top 20 up- and down-regulated genes (Fig. 3B). So far, we have obtained 104 ARGs, which serve as the core ARGs gene set for subsequent analysis.
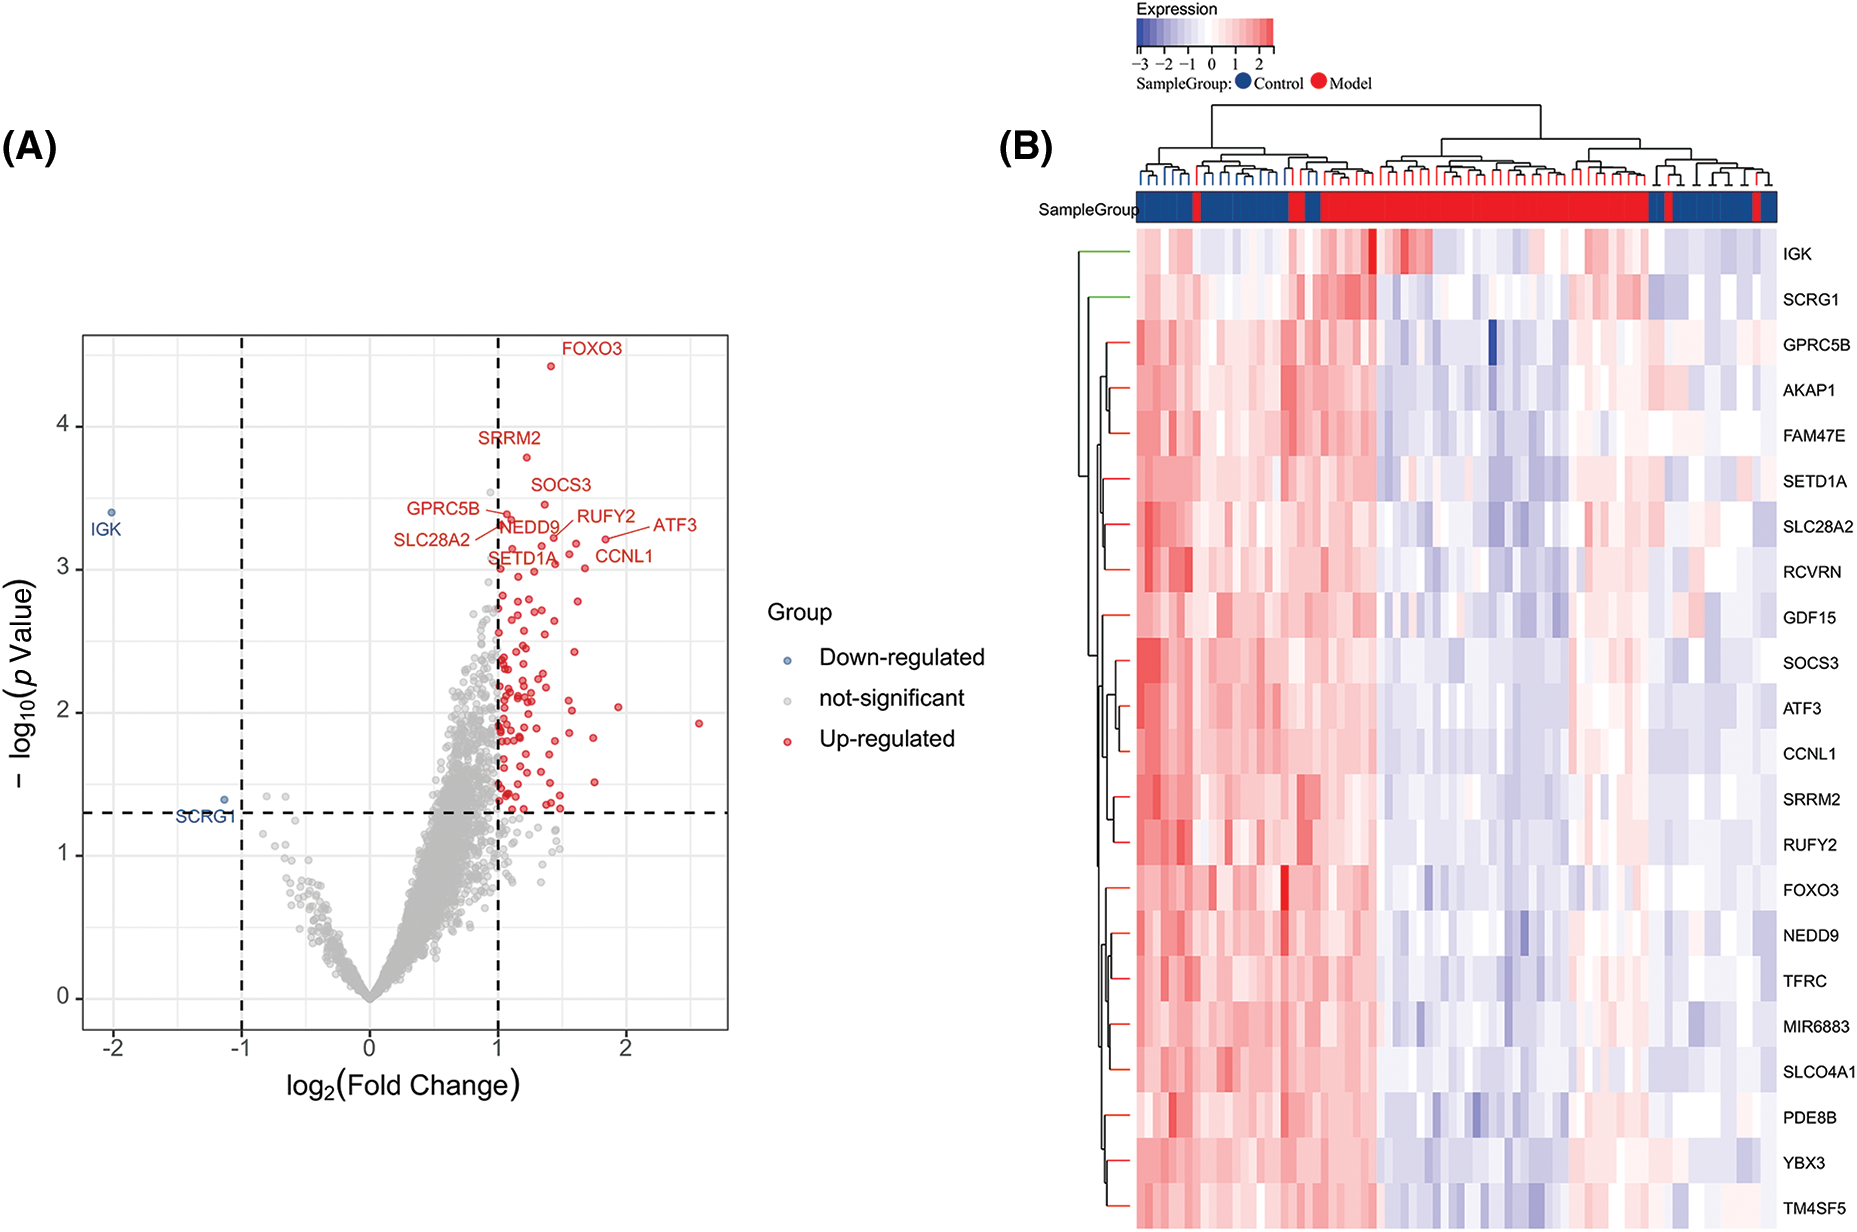
Figure 3: Volcano plot and heatmap of differentially expressed genes. (A) Volcano plot of DEGs in the integrated dataset. (B) Heatmap of DEG expression profiles.
In order to further understand the functions of these 104 ARGs, we performed KEGG and GO functional enrichment analysis on these genes. According to the KEGG enrichment analysis, DEARGs were mainly involved in the PI3K-Akt signaling pathway, osteoclast differentiation, IL-17 signaling pathway, and ferroptosis (Fig. 4A). The GO analysis confirmed the enrichment of 526 BPs, 90 MFs, 49 CCs, and four pathways (p < 0.05). For BPs, the top 10 enriched items were involved in cell growth, cell differentiation, response to stimulus between cells, metabolic regulation, and cell signal transmission (Fig. 4B). For CCs and MFs, the top 10 functional scores are illustrated in Figs. 4C and 4D.
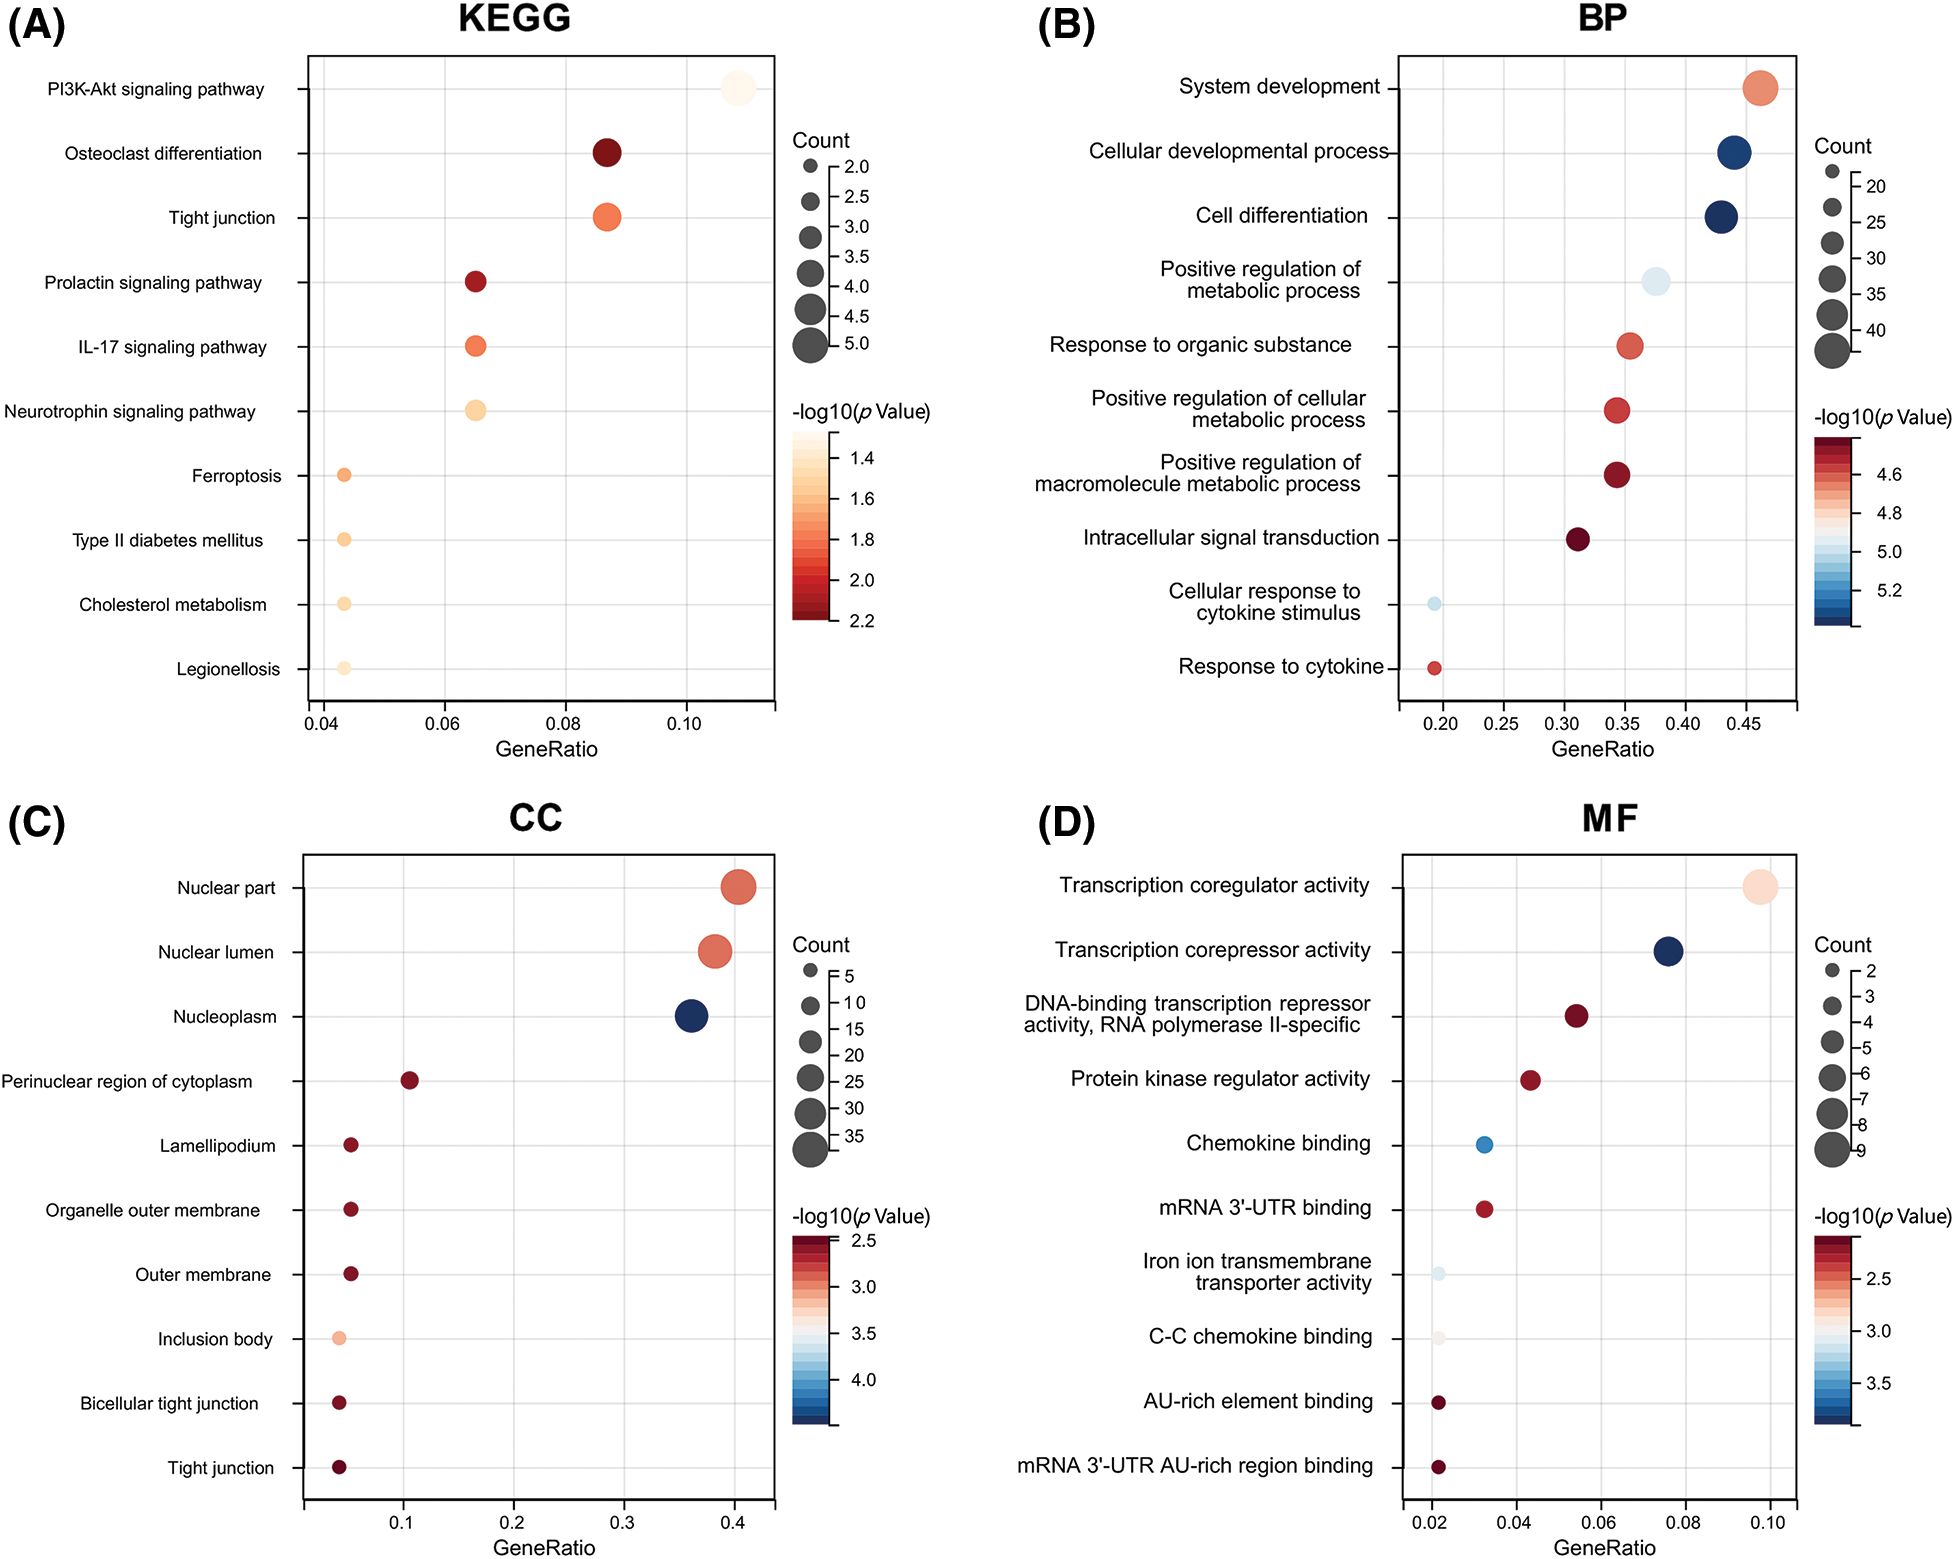
Figure 4: Functional enrichment analysis. (A) KEGG pathways enriched in the yellow module. (B) GO biological process terms enriched. (C) GO cellular component terms enriched. (D) GO molecular function terms enriched.
To further obtain the core hub genes, we constructed a PPI network for the 104 ARGs obtained. Then, 101 genes were identified by screening the database (Fig. 5A). The MCC algorithm was used to calculate the PPI network of 101 genes using the Hubba plug-in of Cytoscape (v3.7.2), and the top 10 key genes were confirmed: ATF3, NFKBIA, KLF6, ZFP36, JUND, FOSL2, SOCS3, CYCS, FOXO3, and PPP1R15A (Fig. 5B).
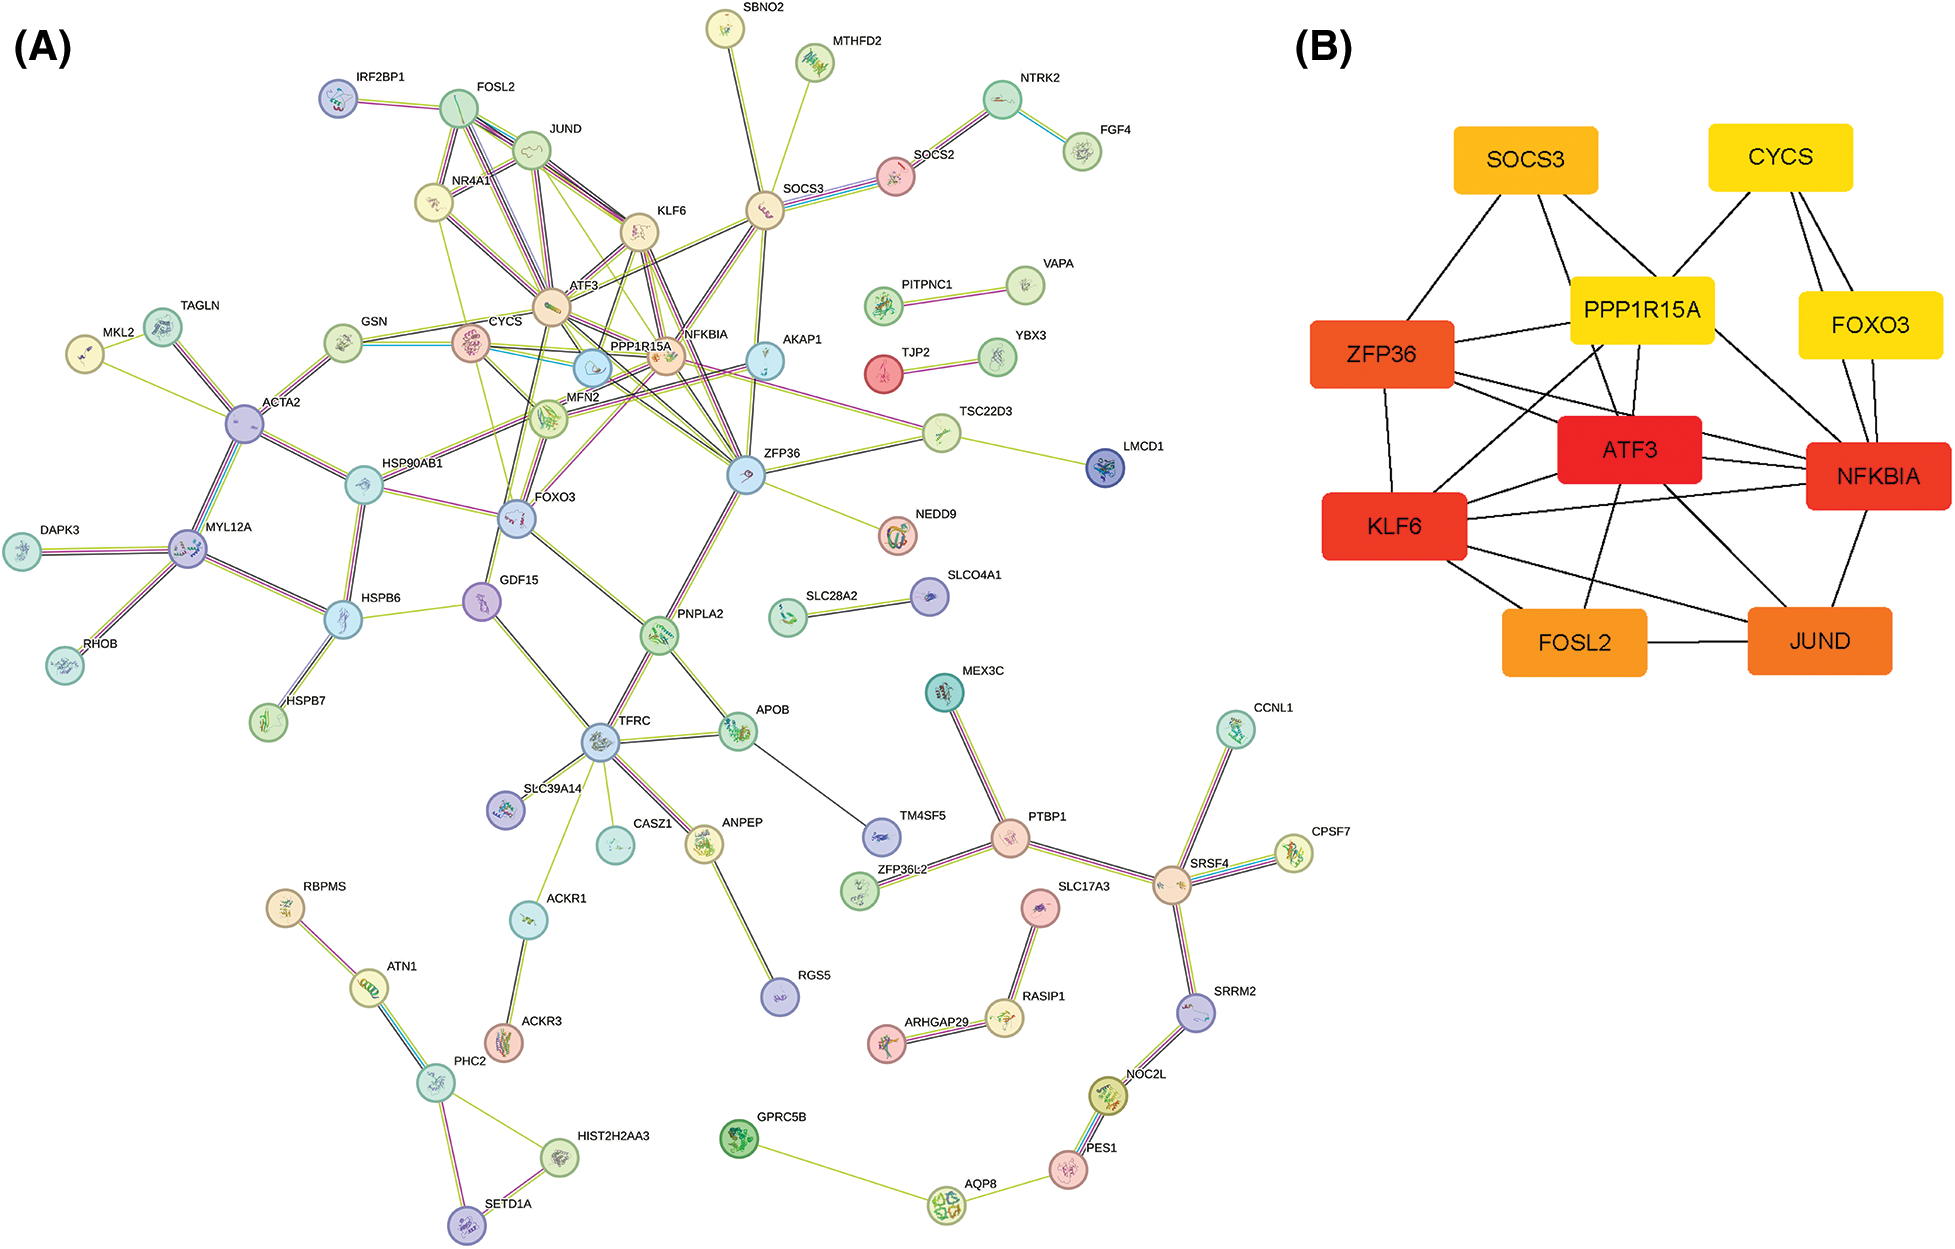
Figure 5: Protein–protein interaction network analysis. (A) STRING network of DEG-encoded proteins. (B) Hub genes identified by the MCC algorithm.
The LASSO algorithm helped select 10 feature genes that significantly affected arthritis (Figs. 6A and 6B). This procedure was screened using LASSO regression; we found that ATF3, CYCS, FOXO3, KLF6, NFKBIA, and SOCS3 were the key predictor genes. For this purpose, we built a risk prediction model based on the regression coefficient, which was expressed as follows: Formula of risk assessment score = 5.213475269 + ATF3 × (−0.480608326) + CYCS × 0.01308381 + FOXO3 × (−1.089839977) + KLF6 × 0.112793736 + NFKBIA × 0.788952533 + SOCS3 × (−0.347694604). We multiplied the gene expression level by the corresponding coefficients and added them up to obtain the arthritis score (Fig. 6C). Similarly, the ROC curve in the risk model was examined for predicting the risk of arthritis, and accordingly, the risk model had an AUC of 0.783 in predicting OA (Fig. 6D). Additionally, we plotted the ROC curve (Fig. 7) for individual genes, and the results revealed that the AUC for FOXO3 alone was not different from that for this model.
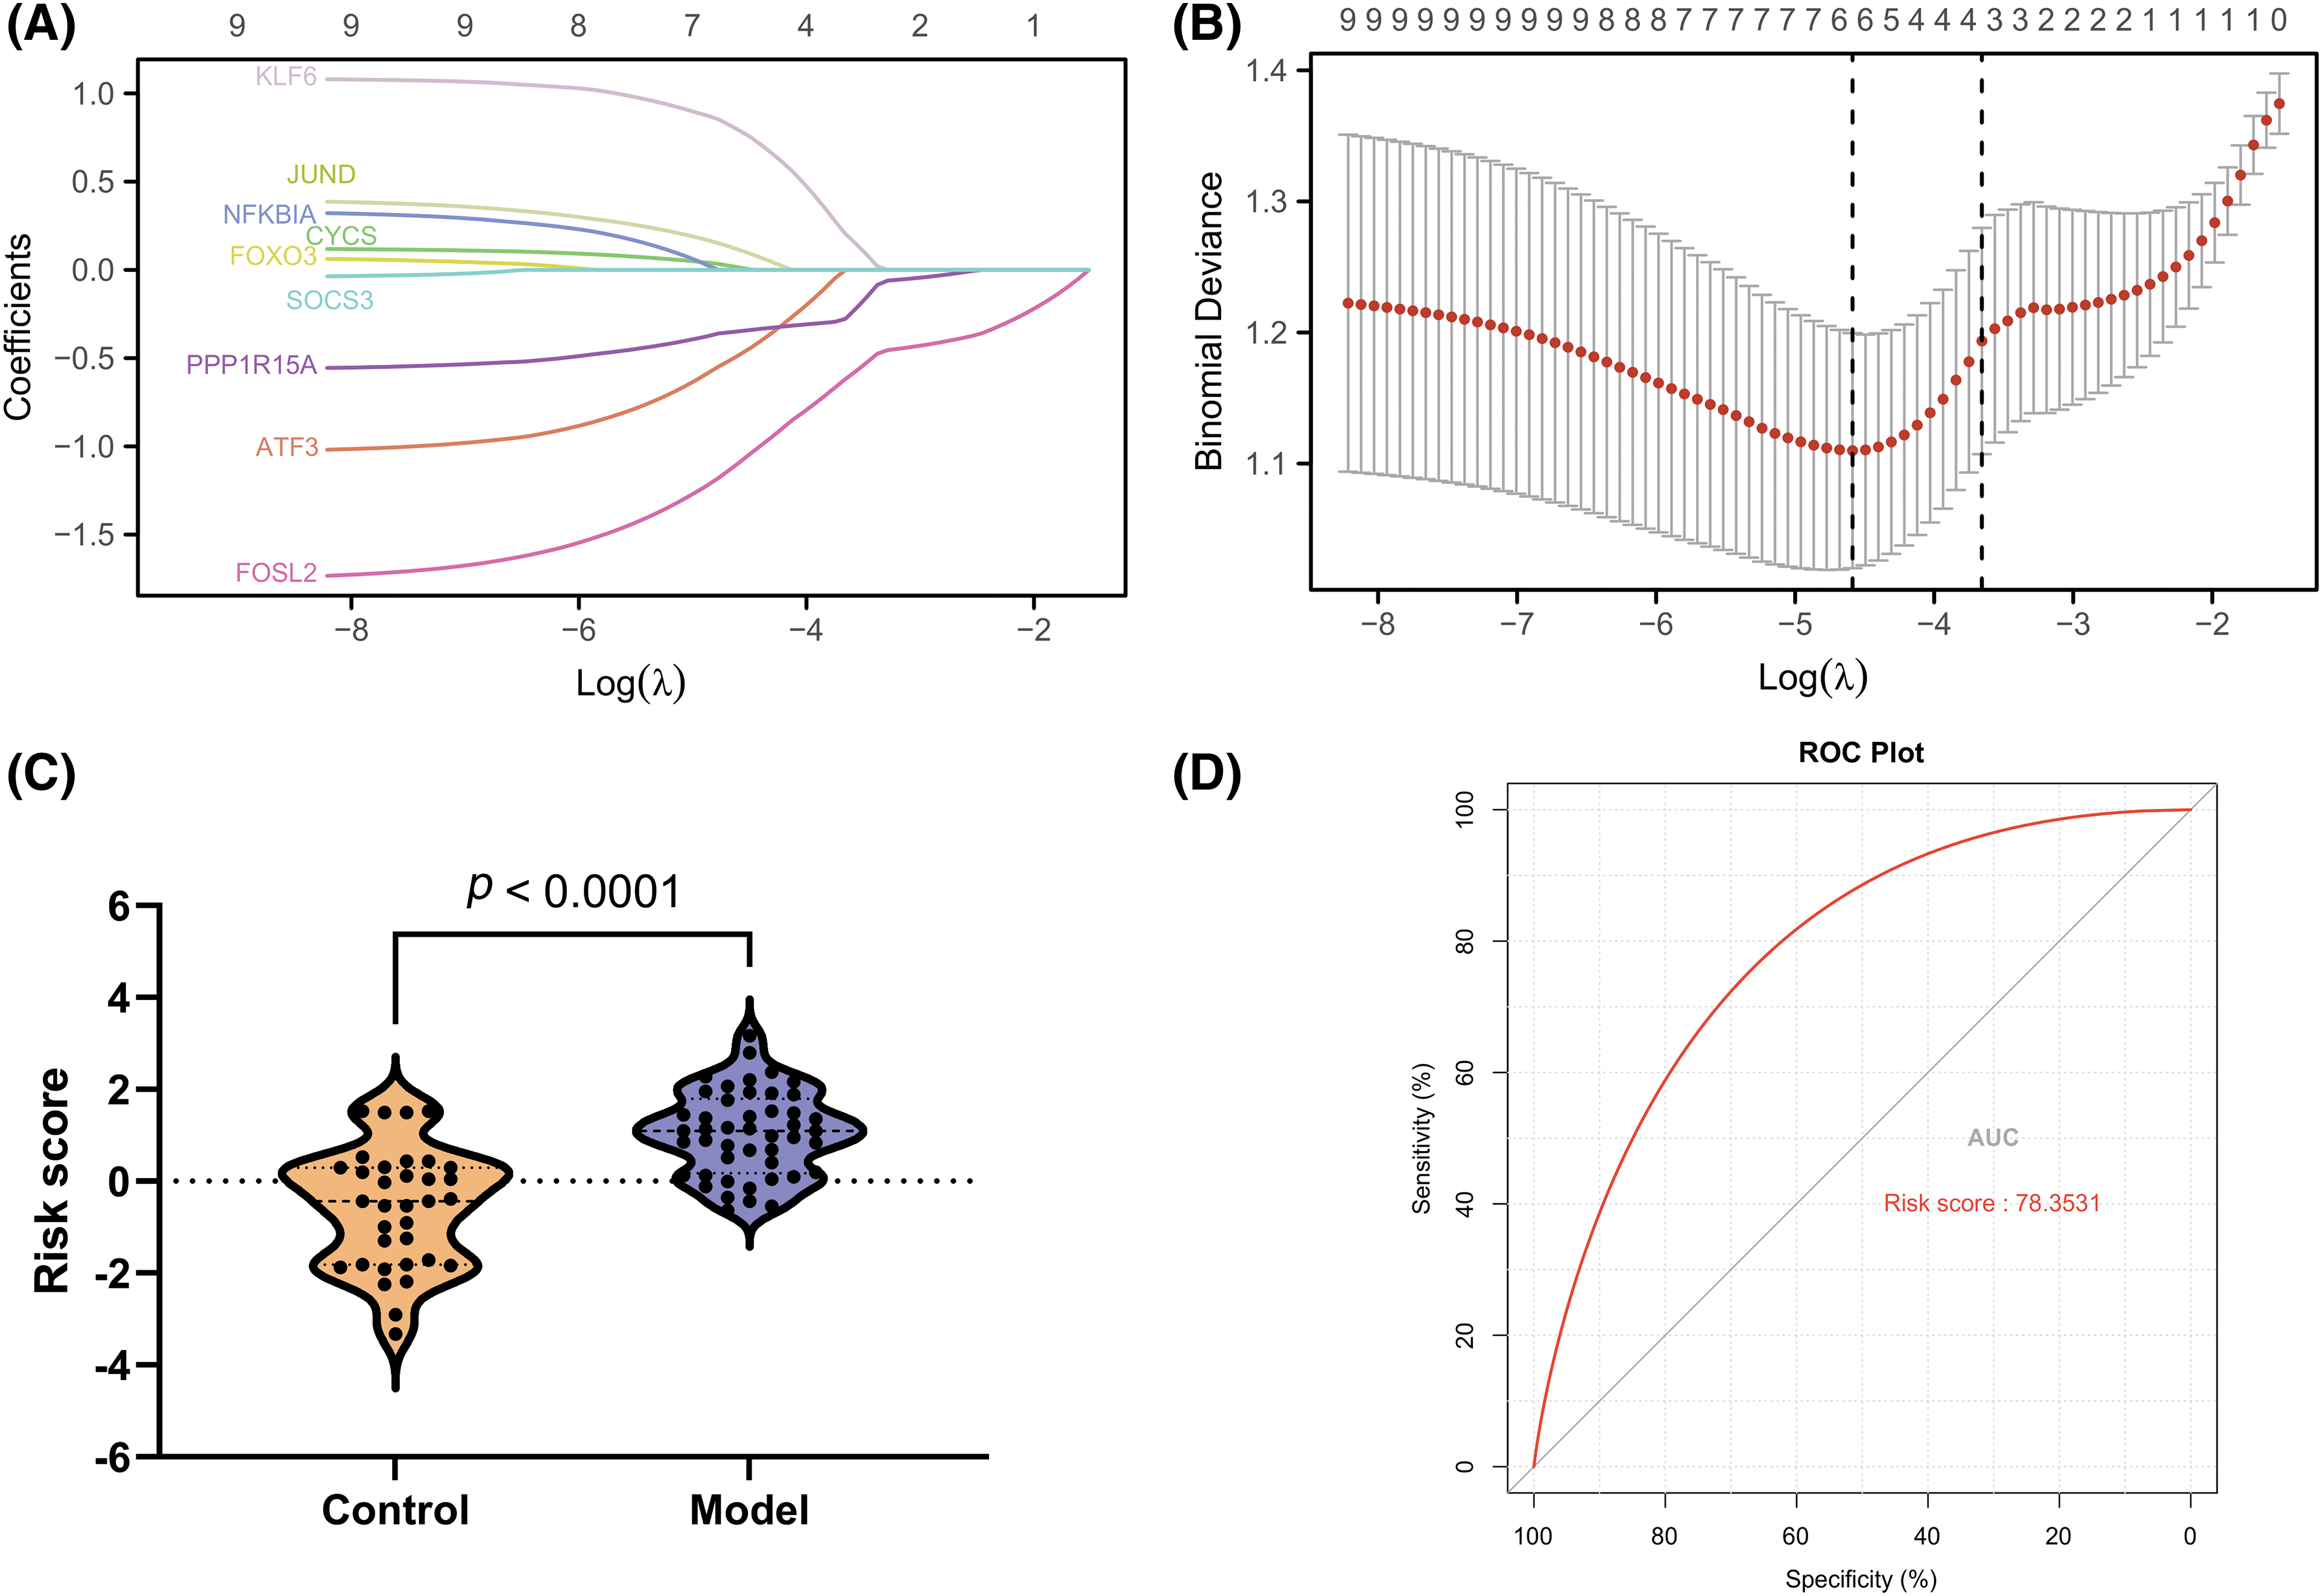
Figure 6: Development of a gene signature for osteoarthritis. (A and B) LASSO regression to select signature genes. (C) Risk score distribution. (D) ROC curve for signature performance.
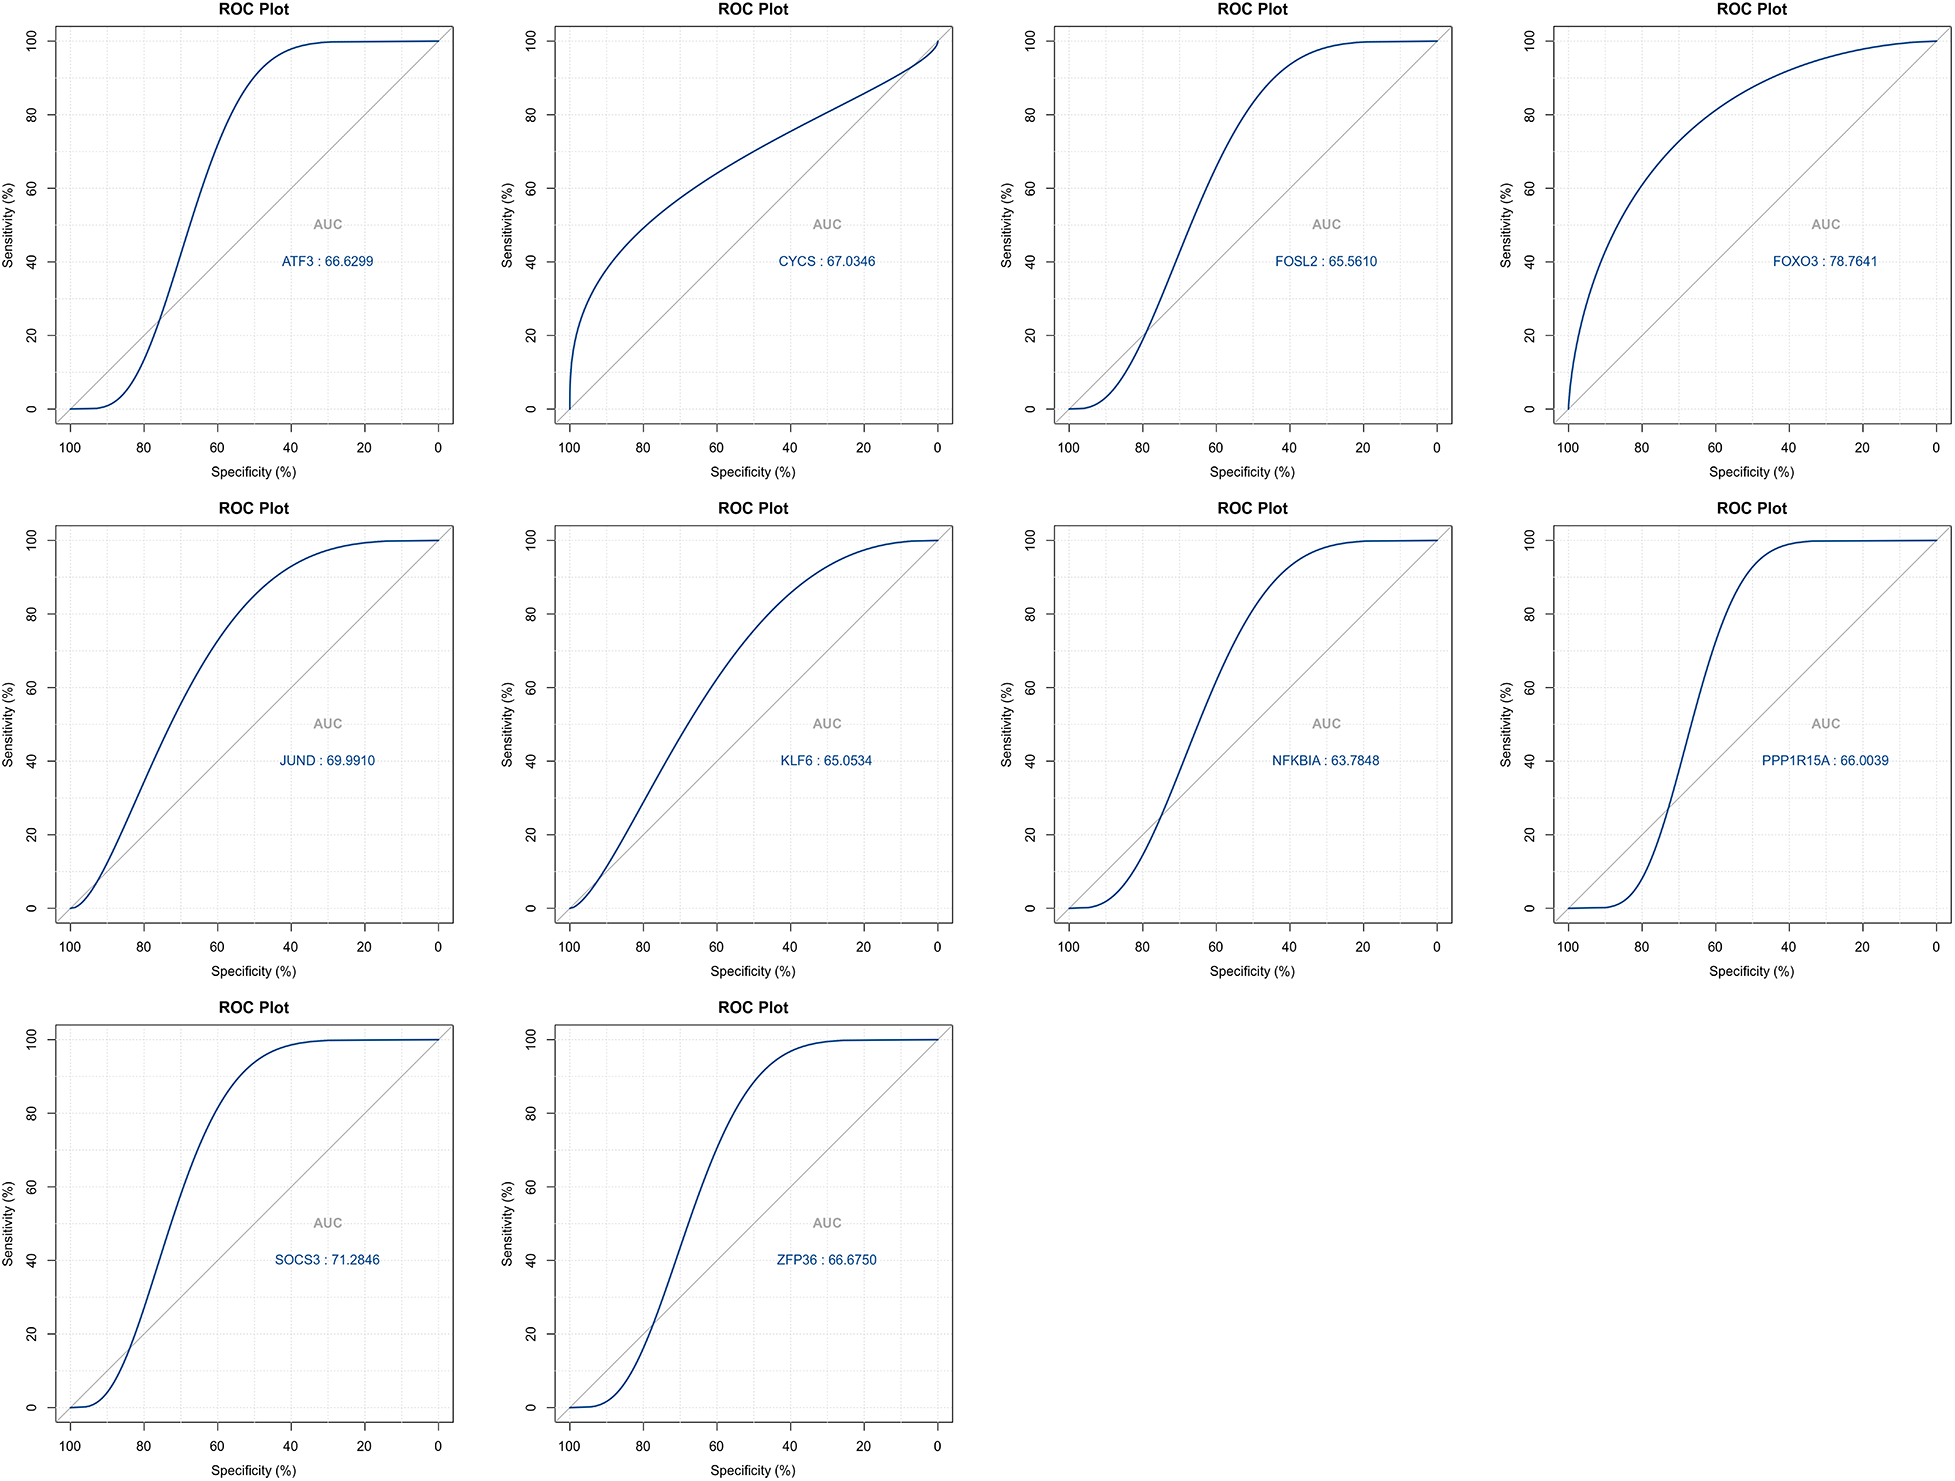
Figure 7: ROC curves for top signature genes.
Clinical verification for the top 10 ARGs
To verify the true expression of these ten hub genes in OA samples, we constructed an OA model rat. In this experiment, we used IL-1β-stimulated OA rat chondrocytes as the OA model group. qRT-PCR and WB experiments were performed to verify the bioinformatic results. The results revealed that ATF3, NFKBIA, KLF6, ZFP36, JUND, FOSL2, SOCS3, CYCS, FOXO3, and PPP1R15A exhibited high expression in OA rat cells, both at the transcription and protein levels. Among these, FOXO3 showed the most significant differential expression (p < 0.05) (Fig. 8). These results indicate that these 10 ARGs are indeed highly expressed in OA models and have the potential to serve as potential marker genes and key genes for treatment. Taken together, the data mining results were reliable with research value.
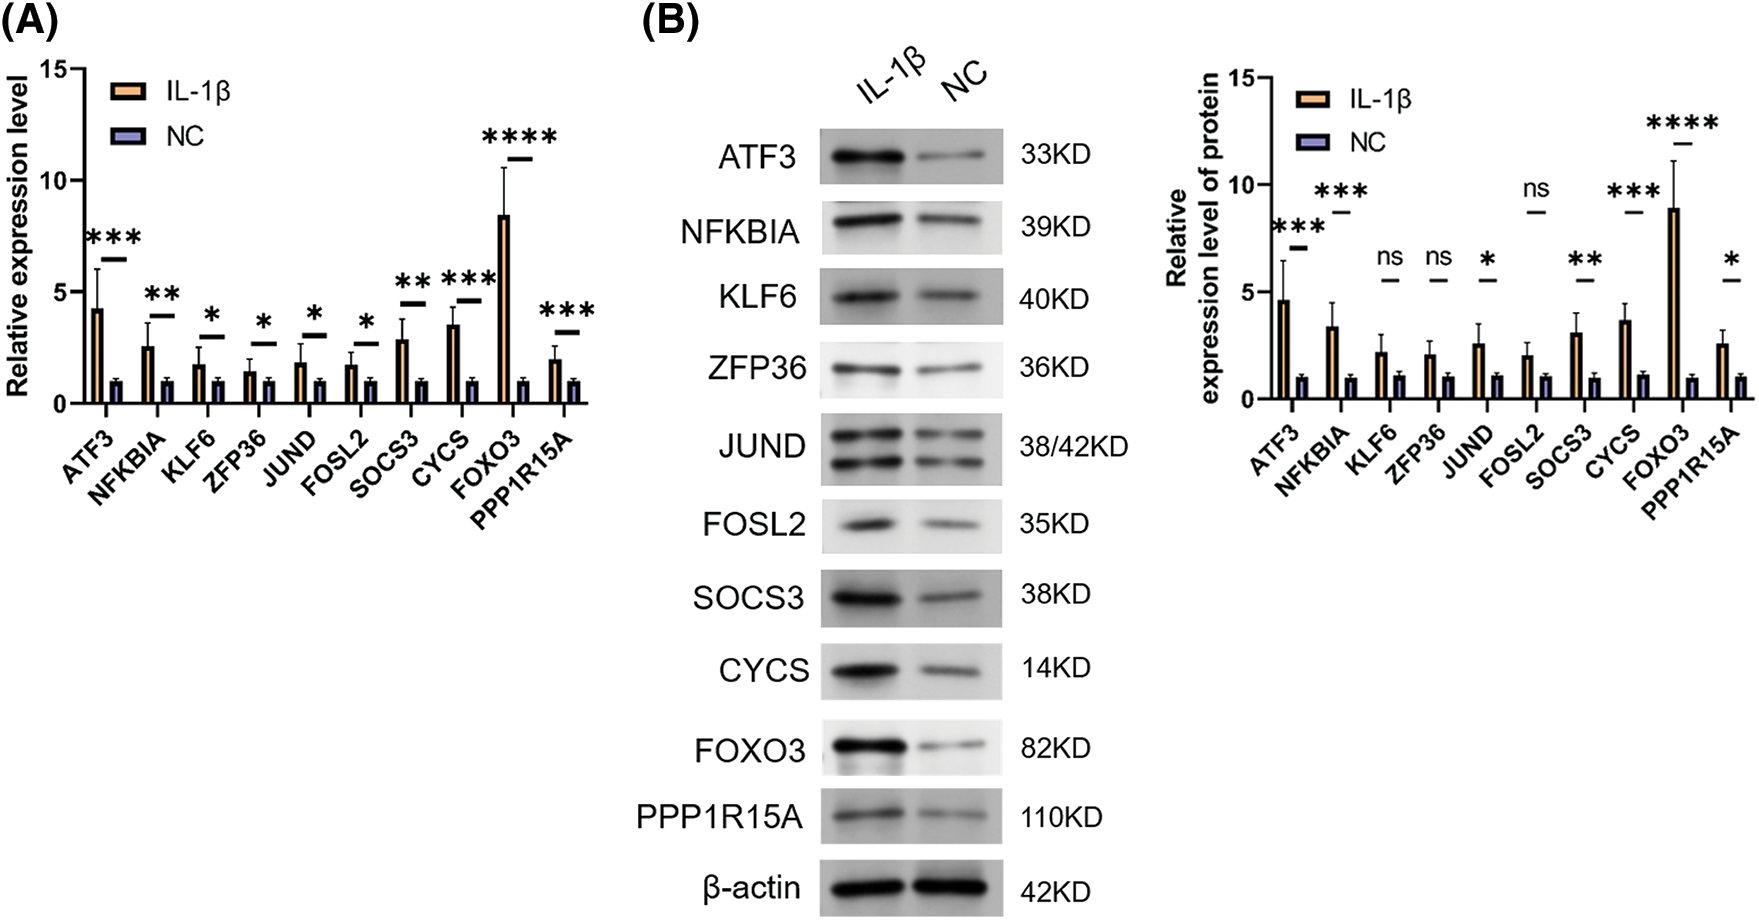
Figure 8: Expression validation of signature genes. (A) qRT-PCR result for ARGs. (B) WB result for ARGs. Note: *p < 0.05, **p < 0.01, ***p < 0.001, ****p < 0.0001.
OA is a degenerative disease that affects the entire joint and features progressive articular cartilage loss and subchondral bone remodeling (SBR), whose precise pathological mechanism remains unexplored. According to an increasing number of studies, abnormally activated osteoclasts in subchondral bone drive OA progression, whereas osteoclast activity inhibition can alter SBR and reduce articular cartilage degeneration. According to previous studies, multiple ARGs and ARPs could affect the manner in which osteoclasts are differentiated and function. Autophagy enhances osteoclast activity and promotes bone resorption mediated by osteoclasts in vitro and in vivo. Methods that combine bioinformatic analysis and experimental validation can assist in thoroughly mining and identifying biomarkers and relevant pathways, thereby opening new opportunities for research on OA.
In this study, we first screened for ARGs and identified 3,318 genes using WGCNA. We then analyzed the difference between ARGs in normal and OA samples using the “limma” software package. After the data were screened, 104 DEGs were identified, including 102 upregulated and two downregulated DEGs. In subsequent functional enrichment, DEARGs were found to be closely correlated with the PI3K-Akt signaling pathway, osteoclast differentiation, IL-17 signaling pathway, and ferroptosis. The PI3K-Akt signaling pathway can regulate autophagy. Different components of this pathway may promote or inhibit autophagy at various reactive oxygen species (ROS) levels. The PI3K α catalytic subunit suppresses autophagy, whereas the β catalytic subunit facilitates autophagy when ROS levels are altered [23]. Akt prevents the initiation of autophagy under nutrient-rich conditions by activating mTORC1 and inhibiting the expression of autophagy genes. Differentiation and function of osteoclasts largely depend on autophagy [24]. By digesting intracellular organelles, proteins, and macromolecules via autophagy, osteoclasts can remove unnecessary materials, providing nutrients and energy for the maintenance and survival of cells [25]. Dysregulation of autophagy may alter osteoclast function and increase bone loss, which remarkably impacts OA onset and progression. IL-17 can induce autophagy dysfunction through STAT3- and HIF-1α-dependent signaling pathways, thereby promoting the death and fibrosis of inflammatory cells [26]. In disease models, abnormalities in this axis may lead to defects in autophagy and increase the chronic inflammatory response in diseases [26]. Ferroptosis and autophagy are two major pathways for cell death and homeostasis [27]. Studies [28] have shown that small molecule-induced ferroptosis can be enhanced through the autophagy pathway. When autophagy is inhibited, the incidence of ferroptosis is also reduced. This is because autophagy can help remove iron from cells, thereby inhibiting the oxidative stress caused by iron overload, which is the main cause of ferroptosis. Despite this, when the autophagy process is disturbed, iron accumulates in cells, increasing oxidative stress, which may promote the occurrence of ferroptosis [29]. All these studies have suggested that the DEGs screened are closely related to autophagy.
To further screen the hub ARGs, we screened the top 10 genes using the MCC algorithm through the Hubba plug-in in Cytoscape: ATF3, NFKBIA, KLF6, ZFP36, JUND, FOSL2, SOCS3, CYCS, FOXO3, and PPP1R15A. ATF3 is a stress response gene usually upregulated when cells are subjected to inflammation, oxidative stress, viral infection, or DNA damage [30]. ATF3 can effectively assist in skeletal muscle injury repair by directly regulating ARGs, thus promoting autophagy and improving healing outcomes [31]. The NFKBIA gene encodes a subunit of the IKK protein complex, which is responsible for regulating NF-κB activity [32]. NF-κB can regulate the activities of multiple genes, including those capable of controlling the immune and inflammatory responses of the body. A study by Peng et al. [33] found that inhibiting NF-κB signaling via ATG5-mediated autophagy may limit the epithelial inflammatory response to kidney injury. As an encoded RNA-binding protein, ZFP36 helps degrade mRNA, which affects inflammatory and immune responses [34]. Reference [35] also reported that ZFP36 regulates the autophagy signaling pathway, thereby preventing ferroptosis in hepatic stellate cells. SOCS3 can negatively regulate cell growth and immune response [36] by inhibiting the JAK-STAT signaling pathway. It has been reported [37] that autophagy repression dependent on SOCS3 facilitates the survival of early-stage myeloid-derived suppressor cells in breast cancer by activating the Wnt/mTOR pathway. FOXO3 is a transcription factor that can activate various genes, including genes related to autophagy, such as LC3B and BNIP3 [38]. Furthermore, FOXO3 can induce autophagy under oxidative stress conditions. Meanwhile, FOXO3 can regulate the ability of cells to cope with oxidative stress, partly through its ability to regulate autophagy [39,40]. As a protein phosphatase, PPP1R15A significantly contributes to cellular stress responses, particularly in the response of cells to stress in protein translation and folding [41,42]. A study found that PPP1R15A can promote autophagy when cells respond to endoplasmic reticulum stress, helping cells remove accumulated misfolded proteins [43]. However, we have not examined the relationship between KLF6, JUND, FOSL2, CYCS, and autophagy; therefore, we hope to conduct deeper studies on the mechanism of these genes in autophagy in subsequent studies.
Finally, we established an OA prediction model. The results showed that the risk model with ATF3, CYCS, FOXO3, KLF6, NFKBIA, and SOCS3 had an AUC for predicting OA of 0.783; however, FOXO3 alone had an AUC of 0.787, exhibiting no difference between them. Furthermore, the study detected the expression of the top 10 genes in OA cells and found that FOXO3 had the highest expression in the OA model, indicating that FOXO3 had a high predictive value for OA.
In this study, 10 ARGs associated with OA were identified, and a prediction model of OA was successfully constructed. However, it must be recognized that this study has some limitations. In particular, the lack of clinical data in our study limits the applicability of the results to real patient populations. Furthermore, findings obtained only in an in vitro cell culture model may not be directly extrapolated to in vivo conditions because cell models do not fully mimic the complexity of living organisms. To ensure the generalizability and potential therapeutic significance of our findings, validation in larger patient cohorts and additional animal or clinical studies is necessary. Specifically, we did not collect clinical samples, which prevented the external validation of the predictive model. We have only examined gene expression in an in vitro OA cell model, and the expression patterns of these genes in humans must be examined in depth. In conclusion, we hope that subsequent clinical and basic studies will be conducted to compensate for the limitations of this study and provide more reliable evidence to support our findings.
In this study, we screened and identified ARGs that significantly affect OA pathogenesis using bioinformatics methods. These genes play key roles in the PI3K-Akt signaling pathway, osteoporotic differentiation, IL-17 signaling pathway, and ferroptosis. Through these analyses, we identified 10 core ARGs and successfully constructed an OA prediction model. Despite certain limitations, such as the lack of clinical data and experimental validation, these preliminary findings undoubtedly provide new clues and possibilities for further understanding the pathogenesis of OA, screening biomarkers, and developing new therapeutic strategies. We hope that future studies will build on these findings and explore the exact roles of these genes and pathways in OA, thus providing a stronger basis for the diagnosis and treatment of OA.
Acknowledgement: None.
Funding Statement: Not applicable.
Author Contributions: Chao Liu confirms sole responsibility for the following: Data collection and analysis, interpretation of the results, draft manuscript preparation, review of the results, and manuscript polishing.
Availability of Data and Materials: The datasets generated and analyzed during this study are available from the corresponding author on reasonable request.
Ethics Approval: This study was approved by Hengyang City Central Hospital Administration Committee of Experimental Animals (No. 2023-10-41), Hunan Province, China.
Conflicts of Interest: The authors have no conflicts of interest to declare.
References
1. Abramoff B, Caldera FE. Osteoarthritis: pathology, diagnosis, and treatment options. Med Clin N Am. 2020;104:293–311. [Google Scholar] [PubMed]
2. Jiang Y. Osteoarthritis year in review 2021: biology. Osteoarthritis Cartilage. 2022;30:207–15. [Google Scholar] [PubMed]
3. Martel-Pelletier J, Barr AJ, Cicuttini FM, Conaghan PG, Cooper C, Goldring MB, et al. Osteoarthritis. Nat Rev Dis Primers. 2016;2(1):16072. [Google Scholar] [PubMed]
4. Pereira D, Ramos E, Branco J. Osteoarthritis. Acta Medica Port. 2015;28(1):99–106. [Google Scholar]
5. Mandl LA. Osteoarthritis year in review 2018: clinical. Osteoarthritis Cartilage. 2019;27:359–64. [Google Scholar] [PubMed]
6. van den Bosch MHJ. Osteoarthritis year in review 2020: biology. Osteoarthritis Cartilage. 2021;29(2):143–50. [Google Scholar] [PubMed]
7. Oei EHG, van Zadelhoff TA, Eijgenraam SM, Klein S, Hirvasniemi J, van der Heijden RA. 3D MRI in osteoarthritis. Semin Musculoskelet Radiol. 2021;25(3):468–79. [Google Scholar] [PubMed]
8. Li J, Fu S, Gong Z, Zhu Z, Zeng D, Cao P, et al. MRI-based texture analysis of infrapatellar fat pad to predict knee osteoarthritis incidence. Radiol. 2022;304(3):611–21. [Google Scholar]
9. Hall M, van der Esch M, Hinman RS, Peat G, de Zwart A, Quicke JG, et al. How does hip osteoarthritis differ from knee osteoarthritis? Osteoarthritis Cartilage. 2022;30:32–41. [Google Scholar] [PubMed]
10. Wang LJ, Zeng N, Yan ZP, Li JT, Ni GX. Post-traumatic osteoarthritis following ACL injury. Arthritis Res Ther. 2020;22(1):57. [Google Scholar] [PubMed]
11. Arias C, Salazar LA. Autophagy and polyphenols in osteoarthritis: a focus on epigenetic regulation. Int J Mol Sci. 2021;23:421. [Google Scholar] [PubMed]
12. Duan R, Xie H, Liu ZZ. The role of autophagy in osteoarthritis. Front Cell Dev Biol. 2020;8:608388. [Google Scholar] [PubMed]
13. Xu K, He Y, Moqbel SAA, Zhou X, Wu L, Bao J. SIRT3 ameliorates osteoarthritis via regulating chondrocyte autophagy and apoptosis through the PI3K/Akt/mTOR pathway. Int J Biol Macromol. 2021;175:351–60. [Google Scholar] [PubMed]
14. Chen X, Gong W, Shao X, Shi T, Zhang L, Dong J, et al. METTL3-mediated m6A modification of ATG7 regulates autophagy-GATA4 axis to promote cellular senescence and osteoarthritis progression. Ann Rheum Dis. 2022;81:87–99. [Google Scholar] [PubMed]
15. Guo A, Wang W, Shi H, Wang J, Liu T. Identification of hub genes and pathways in a rat model of renal ischemiareperfusion injury using bioinformatics analysis of the gene expression omnibus (GEO) dataset and integration of gene expression profiles. Med Sci Monitor. 2019;25:8403–11. [Google Scholar] [PubMed]
16. Chen S, Yang D, Lei C, Li Y, Sun X, Chen M, et al. Identification of crucial genes in abdominal aortic aneurysm by WGCNA. PeerJ. 2019;7(10):e7873. [Google Scholar] [PubMed]
17. Tian Z, He W, Tang J, Liao X, Yang Q, Wu Y, et al. Identification of important modules and biomarkers in breast cancer based on WGCNA. Oncotargets Ther. 2020;13:6805–17. [Google Scholar] [PubMed]
18. Zhao K, Ma Z, Zhang W. Comprehensive analysis to identify SPP1 as a prognostic biomarker in cervical cancer. Front Genet. 2021;12:732822. [Google Scholar] [PubMed]
19. Barbie DA, Tamayo P, Boehm JS, Kim SY, Moody SE, Dunn IF, et al. Systematic RNA interference reveals that oncogenic KRAS-driven cancers require TBK1. Nature. 2009;462:108–12. [Google Scholar] [PubMed]
20. Zhou RS, Zhang EX, Sun QF, Ye ZJ, Liu JW, Zhou DH, et al. Integrated analysis of lncRNA-miRNA-mRNA ceRNA network in squamous cell carcinoma of tongue. BMC Cancer. 2019;19(1):779. [Google Scholar] [PubMed]
21. Wu T, Hu E, Xu S, Chen M, Guo P, Dai Z, et al. clusterProfiler 4.0: a universal enrichment tool for interpreting omics data. Innov. 2021;2(3):100141. [Google Scholar]
22. Tian J, Bai Y, Liu A, Luo B. Identification of key biomarkers for thyroid cancer by integrative gene expression profiles. Exp Biol Med. 2021;246(14):1617–25. [Google Scholar]
23. Kma L, Baruah TJ. The interplay of ROS and the PI3K/Akt pathway in autophagy regulation. Biotechnol Appl. 2022;69(1):248–64. [Google Scholar]
24. Nnah IC, Wang B, Saqcena C, Weber GF, Bonder EM, Bagley D, et al. TFEB-driven endocytosis coordinates MTORC1 signaling and autophagy. Autophagy. 2019;15(1):151–64. [Google Scholar] [PubMed]
25. Montaseri A, Giampietri C, Rossi M, Riccioli A, Del Fattore A, Filippini A. The role of autophagy in osteoclast differentiation and bone resorption function. Biomolecules. 2020;10(10):1398. [Google Scholar] [PubMed]
26. Lee SY, Lee AR, Choi JW, Lee CR, Cho KH, Lee JH, et al. IL-17 induces autophagy dysfunction to promote inflammatory cell death and fibrosis in Keloid Fibroblasts via the STAT3 and HIF-1α dependent signaling pathways. Front Immunol. 2022;13:888719. [Google Scholar] [PubMed]
27. Gao W, Wang X, Zhou Y, Wang X, Yu Y. Autophagy, ferroptosis, pyroptosis, and necroptosis in tumor immunotherapy. Signal Transduct Target Ther. 2022;7(1):196. [Google Scholar] [PubMed]
28. Liu J, Kuang F, Kroemer G, Klionsky DJ, Kang R, Tang D. Autophagy-dependent ferroptosis: machinery and regulation. Cell Chem Biol. 2020;27:420–35. [Google Scholar] [PubMed]
29. Kang R, Tang D. Autophagy and ferroptosis—what’s the connection? Curr Pathobiol Rep. 2017;5(2):153–9. [Google Scholar] [PubMed]
30. Zhang J, Wang H, Chen H, Li H, Xu P, Liu B, et al. ATF3-activated accelerating effect of LINC00941/lncIAPF on fibroblast-to-myofibroblast differentiation by blocking autophagy depending on ELAVL1/HuR in pulmonary fibrosis. Autophagy. 2022;18(11):2636–55. [Google Scholar] [PubMed]
31. Yang X, Li M, Ji Y, Lin Y, Xu L, Gu X, et al. Changes of gene expression patterns of muscle pathophysiology-related transcription factors during denervated muscle atrophy. Front Physiol. 2022;13:923190. [Google Scholar] [PubMed]
32. Yang W, Li J, Zhang M, Yu H, Zhuang Y, Zhao L, et al. Elevated expression of the rhythm gene NFIL3 promotes the progression of TNBC by activating NF-κB signaling through suppression of NFKBIA transcription. J Exp Clin Cancer Res. 2022;41(1):67. [Google Scholar] [PubMed]
33. Peng X, Wang Y, Li H, Fan J, Shen J, Yu X, et al. ATG5-mediated autophagy suppresses NF-κB signaling to limit epithelial inflammatory response to kidney injury. Cell Death Dis. 2019;10(4):253. [Google Scholar] [PubMed]
34. Makita S, Takatori H, Nakajima H. Post-transcriptional regulation of immune responses and inflammatory diseases by RNA-binding ZFP36 family proteins. Front Immunol. 2021;12:711633. [Google Scholar] [PubMed]
35. Zhang Z, Guo M, Li Y, Shen M, Kong D, Shao J, et al. RNA-binding protein ZFP36/TTP protects against ferroptosis by regulating autophagy signaling pathway in hepatic stellate cells. Autophagy. 2020;16(8):1482–505. [Google Scholar] [PubMed]
36. Liu ZK, Li C, Zhang RY, Wei D, Shang YK, Yong YL, et al. EYA2 suppresses the progression of hepatocellular carcinoma via SOCS3-mediated blockade of JAK/STAT signaling. Mol Cancer. 2021;20:79. [Google Scholar] [PubMed]
37. Zhang W, Li X, Jiang M, Ji C, Chen G, Zhang Q, et al. SOCS3 deficiency-dependent autophagy repression promotes the survival of early-stage myeloid-derived suppressor cells in breast cancer by activating the Wnt/mTOR pathway. J Leukocyte Biol. 2023;113(5):445–60. [Google Scholar] [PubMed]
38. Lin Z, Niu Y, Wan A, Chen D, Liang H, Chen X, et al. RNA m6A methylation regulates sorafenib resistance in liver cancer through FOXO3-mediated autophagy. EMBO J. 2020;39:e103181. [Google Scholar] [PubMed]
39. Audesse AJ, Dhakal S, Hassell LA, Gardell Z, Nemtsova Y, Webb AE. FOXO3 directly regulates an autophagy network to functionally regulate proteostasis in adult neural stem cells. PLoS Genet. 2019;15:e1008097. [Google Scholar] [PubMed]
40. Salcher S, Hermann M, Kiechl-Kohlendorfer U, Ausserlechner MJ, Obexer P. C10ORF10/DEPP-mediated ROS accumulation is a critical modulator of FOXO3-induced autophagy. Mol Cancer. 2017;16(1):95. [Google Scholar] [PubMed]
41. Crespillo-Casado A, Chambers JE, Fischer PM, Marciniak SJ, Ron D. PPP1R15A-mediated dephosphorylation of eIF2α is unaffected by Sephin1 or Guanabenz. eLife. 2017;6:e26109. [Google Scholar] [PubMed]
42. Song Y, Liu S, Zhao Z, Zhang Y, Yang Y, Luo B. Relationship between PPP1R15A gene polymorphism (rs611251) and Epstein-Barr virus-associated tumors. Acta Virol. 2017;61(4):445–52. [Google Scholar] [PubMed]
43. Li S, Zhang Y, Shi S, Guo D, Chang T. Identification of immune characteristic landscapes related to autophagy in ischemic stroke. Front Cell Dev Biol. 2022;10:1026578. [Google Scholar] [PubMed]
Cite This Article
 Copyright © 2024 The Author(s). Published by Tech Science Press.
This work is licensed under a Creative Commons Attribution 4.0 International License , which permits unrestricted use, distribution, and reproduction in any medium, provided the original work is properly cited.
 Downloads
 Citation Tools