
 Submit a Paper
 Propose a Special lssue
 Open Access
ARTICLE
Crops Leaf Diseases Recognition: A Framework of Optimum Deep Learning Features
1 Department of Computer Science, HITEC University, Taxila, Pakistan
2 Computer Sciences Department, College of Computer and Information Sciences, Princess Nourah bint Abdulrahman University, Riyadh 11671, Saudi Arabia
3 College of Computer Engineering and Science, Prince Sattam Bin Abdulaziz University, Al-Kharaj, 11942, Saudi Arabia
4 Department of Electrical Engineering, College of Engineering, Jouf University, Sakakah, Saudi Arabia
5 Faculty of Engineering, Imperial College London, London, SW7 2AZ, UK
6 College of Arts, Media, and Technology, Chiang Mai University, Chiang Mai, 50200, Thailand
* Corresponding Author: Orawit Thinnukool. Email:
Computers, Materials & Continua 2023, 74(1), 1139-1159. https://doi.org/10.32604/cmc.2023.028824
Received 18 February 2022; Accepted 04 May 2022; Issue published 22 September 2022
 View Full Text
 Download PDF
Abstract
Manual diagnosis of crops diseases is not an easy process; thus, a computerized method is widely used. From a couple of years, advancements in the domain of machine learning, such as deep learning, have shown substantial success. However, they still faced some challenges such as similarity in disease symptoms and irrelevant features extraction. In this article, we proposed a new deep learning architecture with optimization algorithm for cucumber and potato leaf diseases recognition. The proposed architecture consists of five steps. In the first step, data augmentation is performed to increase the numbers of training samples. In the second step, pre-trained DarkNet19 deep model is opted and fine-tuned that later utilized for the training of fine-tuned model through transfer learning. Deep features are extracted from the global pooling layer in the next step that is refined using Improved Cuckoo search algorithm. The best selected features are finally classified using machine learning classifiers such as SVM, and named a few more for final classification results. The proposed architecture is tested using publicly available datasets–Cucumber National Dataset and Plant Village. The proposed architecture achieved an accuracy of 100.0%, 92.9%, and 99.2%, respectively. A comparison with recent techniques is also performed, revealing that the proposed method achieved improved accuracy while consuming less computational time.Keywords
Agriculture contributes significantly to economic growth and poverty reduction. This sector, which accounts for 26% of total revenue, provides direct assistance to the country’s citizens. Cotton, wheat, rice, sugar beets, fruits, and vegetables are among the most important agricultural crops [1]. Changes in agricultural production and quality have a significant financial impact on the country. As a result, detecting illnesses in plants at an early stage is critical, because crop output has a significant impact on them. Plant diseases reduce agricultural productivity and quality. Computer vision approaches can greatly aid in early stage disease diagnosis [2]. With advancements in the field of Computer vision (CV), it is high chance to detect and recognize plant diseases [3]. Climate change is to blame for the apparent global spread of plant diseases. When new diseases emerge in different parts of the world, they are rarely discovered [4]. Plant diseases pose significant challenges to food security and early detection of infection symptoms. This is still a challenge in many parts of the world, resulting in a shortage of high operational and maintenance personnel [5]. Early detection of these plant diseases can aid in the prevention of national economic losses. As a result, it is critical to protect crops against diseases from the beginning [6]. In recent years, agricultural innovation has focused on increasing agricultural production supply while lowering costs and improving profitability. Manual disease detection can take a long time and may necessitate extra work. One of the most perplexing factors impeding plant magnification is disease assault. According to extensive agricultural research, plant disease-related issues may reduce the quality and quantity of agricultural goods. A machine learning methodology, rather than a manual method, can identify many infections more quickly [7]. Tomato, potato, and cucumber are among the most important vegetables in several nations, including India, Pakistan, and Algeria. However, illnesses have an adverse influence on the production of these crops, resulting in a food scarcity. Because of the lack of specialist availability, the manual process of treating these crops’ leaf diseases is complex and time-consuming [8]. Plant diseases detection using an automated technique is advantageous since it reduces the amount of supervision necessary in big local farmers and identifies disease signs immediately, i.e., when they first appear on leaf tissue [9].
Lately, computer vision (CV) shows much interest in the domain of agriculture for plant diseases detection and classification at the early stage [10]. The manual processing of plant diseases is a time consuming and required an expert person. Therefore, a computerized method is widely required for diseases detection and classification [11]. A computerized method includes some important steps such as preprocessing of original images, detection of infected parts using image processing techniques, features extraction, reduction of redundant features, and classification using machine learning algorithms [12]. Preprocessing is an important step in agriculture for better visualization of infected part of the crop leaf. The better contrast images helped in the important features extraction. Features are extracted through some important techniques such as shape, texture, and named a few more. However, these traditional features extraction methods are not performed well once the numbers of training data increased. Recently, deep learning (DL) demonstrated outstanding performance in the agriculture domain for both disease detection and classification [13]. The performance of deep learning methods is better than the traditional techniques [14]. Convolutional neural network (CNN) is a type of deep learning consists of some important layers such as input layer, convolutional layer, normalization and activation layers, fully connected layer, and finally a Softmax layer. Using a CNN model, features are extracted from the fully connected layers. However, sometimes redundant features are also extracted that misleads the classification process. Therefore, the researchers developed some features reduction techniques such as entropy based approach, Genetic Algorithm (GA), and named a few more [15]. Finally, the selected features are classified using machine learning classifiers such as support vector machine (SVM), K-Nearest Neighbor (KNN), and named a few more [16].
Many techniques have been introduced in the literature for crops leaf diseases using deep learning and features optimization. Ma et al. [17] presented a projected deep convolutional neural network (DCNN) based method for recognition of cucumber leaf diseases such as anthracnose, downy mildew, powdery mildew, and target leaf spots. Data augmentation methods were used to reduce the likelihood of imbalanced datasets by the segmented symptom images. They used total 14,208 symptom images from augmented datasets for the experimental process and attained an accuracy of 93.4%. Singh et al. [18] multi-class classification technique for tomato ripened analysis. In the presented method, features are extracted from the images and reduced using Principal Component Analysis (PCA) that later classified using machine learning classifiers such as SVM and named a few more. The experimental procedure was performed on 250 images and attained an accuracy of 90.80% by employing multi-class SVM. Sravan et al. [19] presented a CNN based method for crops leaf diseases recognition. In the presented method, ResNet50 model was employed for features extraction through transfer learning (TL). They collected 20,639 images from the database of Plant Village and attained 99.26% accuracy. Chakraborty et al. [20] presented a hybrid CNN based framework for potato leaf diseases recognition. They used four pre-trained CNN models named MobileNet, VGG16, ResNet, and VGG19 and trained on Plant Village dataset. The results are computed on each model and VGG16 gives better results of 97.8%. Khalifa et al. [21] presented a 14-layered CNN architecture for potato leaf diseases recognition. They used 2 convolutional layers having different window sizes that followed by two 2 FC layers. The features are extracted from the convolutional layers for the final classification. They also employed a data augmentation step to increase the number of images for better testing accuracy. On the selected dataset, the presented method attained an accuracy of 98%. Rashid at al. [22] presented a yoloV5 and CNN based framework for potato leaf diseases recognition. They collected more than 4000 images for the experimental process and attained an accuracy of 99%. Thangaraj et al. [23] presented a deep transfer learning based architecture for tomato leaf diseases recognition. They used three optimization methods for the training of a CNN model such as Adam, stochastic gradient descent (SGD), and Rgprops. Based on the analysis, they conclude that Rgprops attained better accuracy.
Motivation and Problem Statement: Manual inception of crop leaf diseases is not an easy task. There are many manual techniques available but they are costly and time consuming. The diseases in the crops, impact on the both quality and quantity of foods. The use of computerized techniques is widely required for early detection and classification of crops diseases. Many computerized techniques have been introduced in the literature but still they are facing the challenges-i) contrast and noise in the original images extracts the irrelevant and noisy features that in the outcome recognition accuracy is stained; ii) normally, the researchers extracted deep features from the fully connected layers but after the visualization process, some important features are seems missing. Due to the missing features, incorrect predication results are retrieved, and iii) several extracted features includes some redundant information; therefore, it affects the classification accuracy and consume more time during the training and testing process. In this paper, a deep learning and feature optimization-based architecture for crop leaf disease recognition is proposed. Our most significant contributions are as follows:
• A hybridization-based contrast enhancement technique is proposed.
• Tweaked the Darknet19 CNN model and trained it with transfer learning. Weights from 50% of the layers are considered for training instead of 20% in the learning process.
• A new Cuckoo Search algorithm is introduced for selecting the best features. A fitness function and MSER loss are used to evaluate the selected features.
The remainder of this article is divided into the sections listed below. Section 2 discusses the datasets used in the experimental process in detail. The deep learning and optimization methodologies are presented in Section 3. Section 4 presents the findings and comparisons. Finally conclude the manuscript.
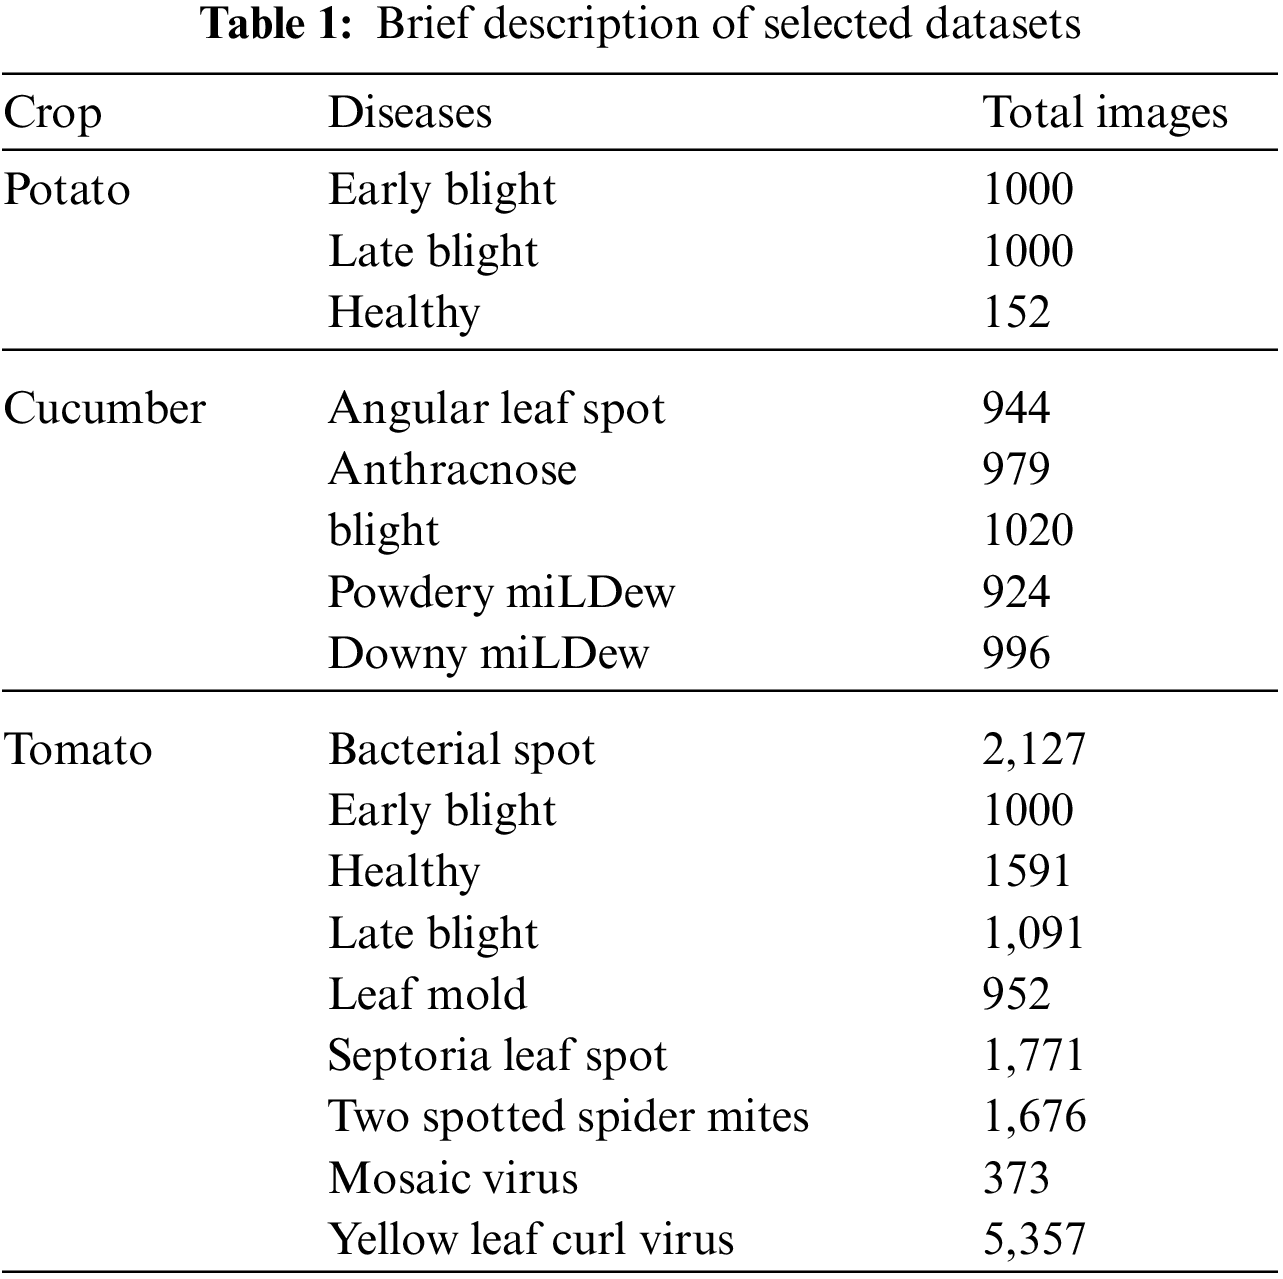
In this work, two publically available datasets are utilized named–China National Cucumber (CNC) dataset [24] and Plant Village [25]. The CNC dataset includes five cumber diseases, as illustrated in Fig. 1. The Plant Village dataset includes more than 30 diseases classes but in this work, we only consider the Potato and Tomato crops. A few sample images are illustrated in Fig. 2. Both datasets includes RGB images having different dimension. The detail of diseased leaf images of each crop is presented in Tab. 1.
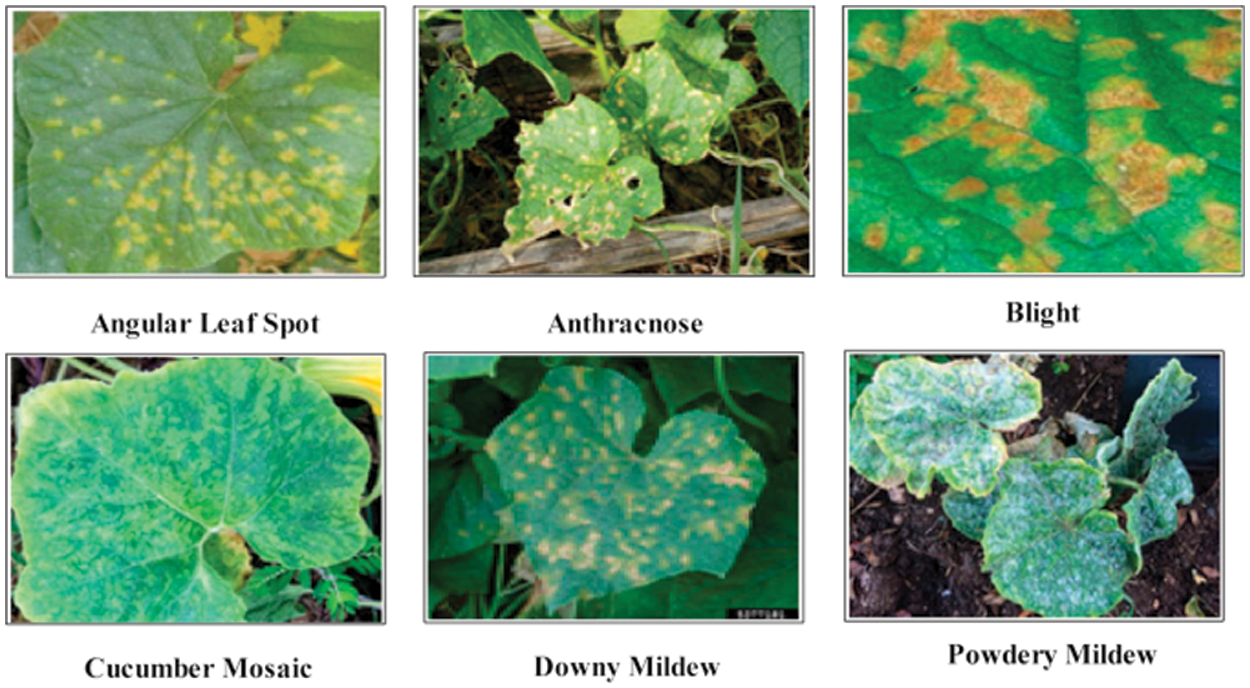
Figure 1: Sample images of cucumber leaf diseases
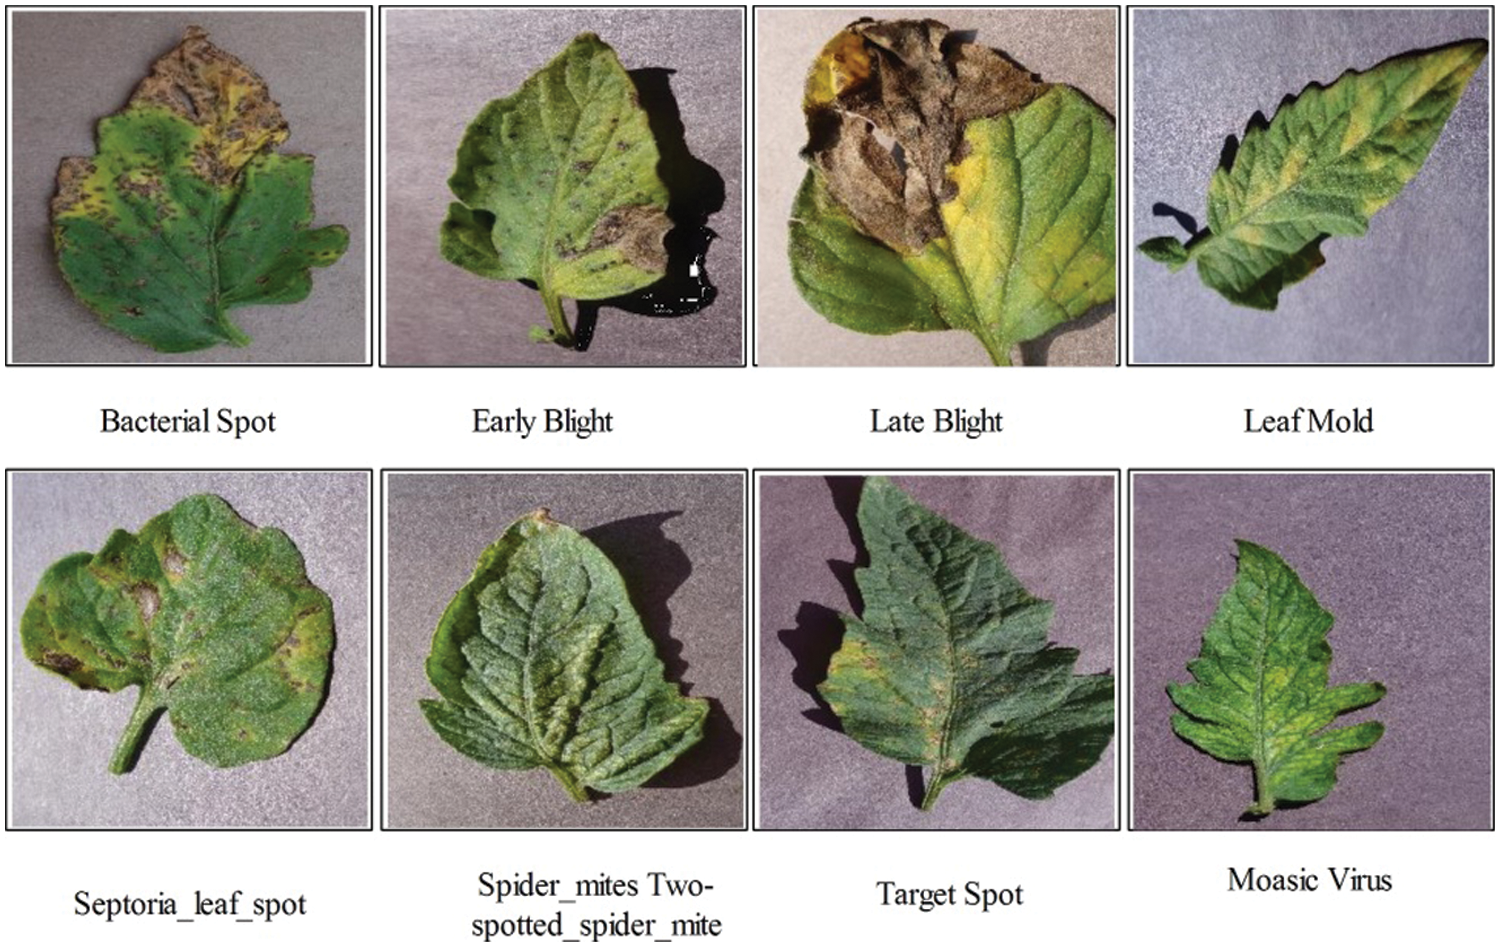
Figure 2: Sample images of Tomato leaf diseases recognition
The proposed crops leaf diseases recognition framework is illustrated in Fig. 3. The proposed framework includes the following important steps. In the first step, data augmentation is performed to increase the numbers of training samples. In the second step, pre-trained DarkNet19 deep model is opted and fine-tuned. The fine-tuned model is trained using transfer learning in the third step and deep features are extracted from the global pooling layer. In the fourth step, Improved Cuckoo search algorithm is applied on extracted deep feature vector and selects the best features. Finally, the best selected features are classified using machine learning classifiers in the fifth step. The explanation of each step is given below.
3.1 Contrast Enhancement and Data Augmentation
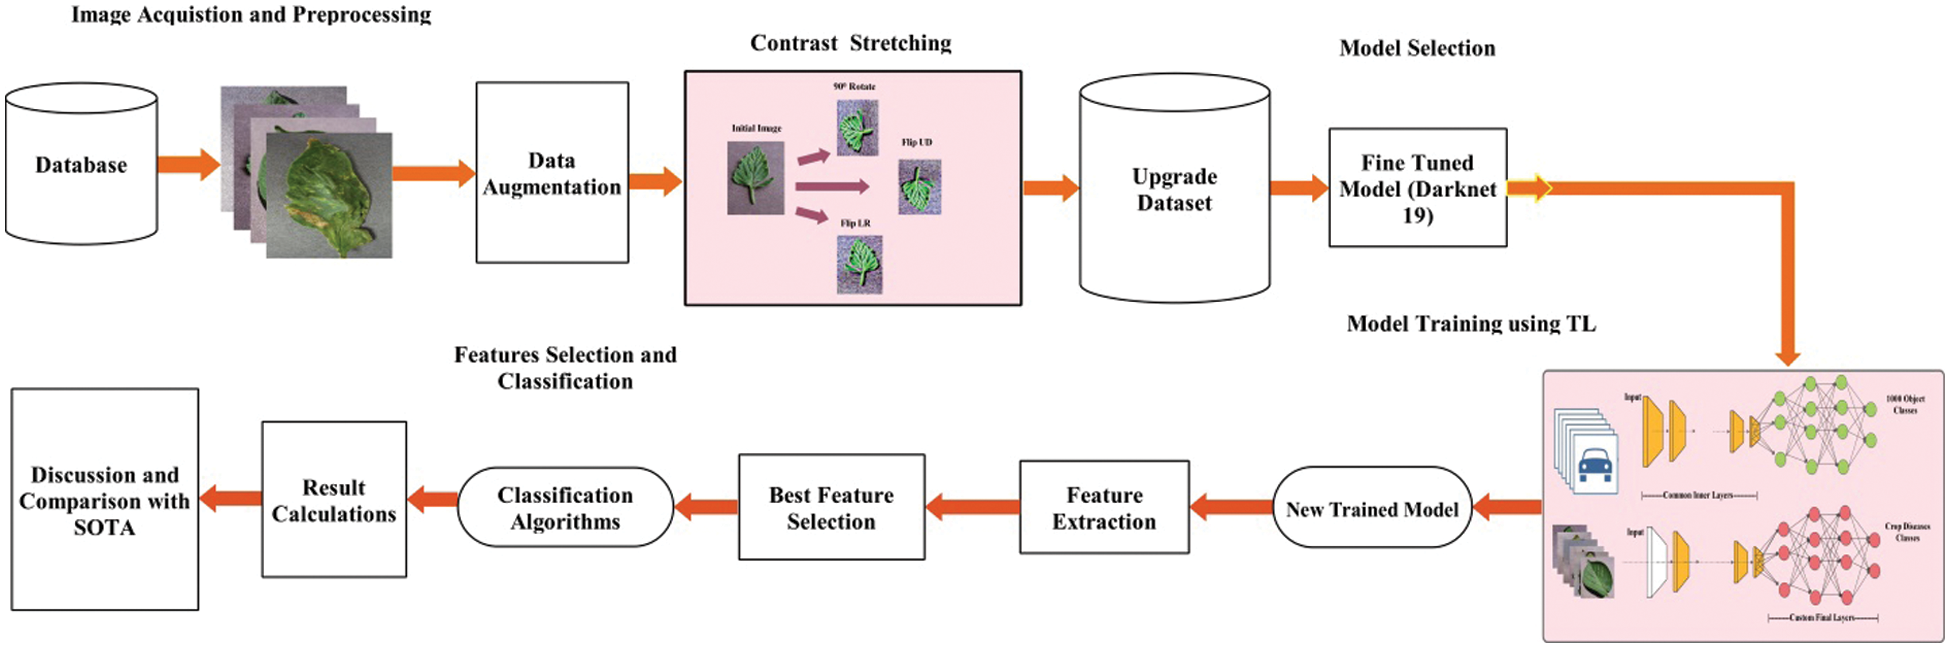
Figure 3: Proposed flow of crops leaf diseases recognition using deep learning and features optimization
Enhancement of an image is an important research area in image processing form the last decade. Many techniques are introduced in the literature for contrast enhancement such as histogram equalization, filtering, and named a few more. The main purpose of this step is to improve the contrast of original image for better visualization. In the domain of agriculture, the core idea behind the use of contrast enhancement is to highlight the infected regions that later utilized for accurate features extraction.
In this article, we implemented a hybrid approach for contrast enhancement. Three steps based hybrid approach is implemented: i) image is processed through 3D box filter of filter size
where,
After that, we applied a data augmentation step to increase the numbers of images of each dataset for the sake of better training of a CNN model. Through this step, the Over fitting challenge is efficiently controlled. The process modifies the actual images so that the new images have the same properties as the originals. The benefit of data augmentation is that it allows you to train a model on a single image in several directions. Three well known operations such as left to right flip (LR), vertical flip (UD), and rotate 90 are applied on each image.
These above mentioned operations applied on selected crops such as Tomato, Cucumber, and Potato. The each crop originally consists of 15,938 images, 4863 images, and 2152 images, respectively. As given in Tab. 1, the each class is showing imbalanced; therefore, we applied three aforementioned operations. After these operations, each class images of tomato disease increased to 6000, cucumber class reached to 2000, and potato class reached to 4000, respectively. This augmented dataset is alter utilized for the training of a CNN model. A few sample image of data augmentation operations are illustrated in Fig. 4.
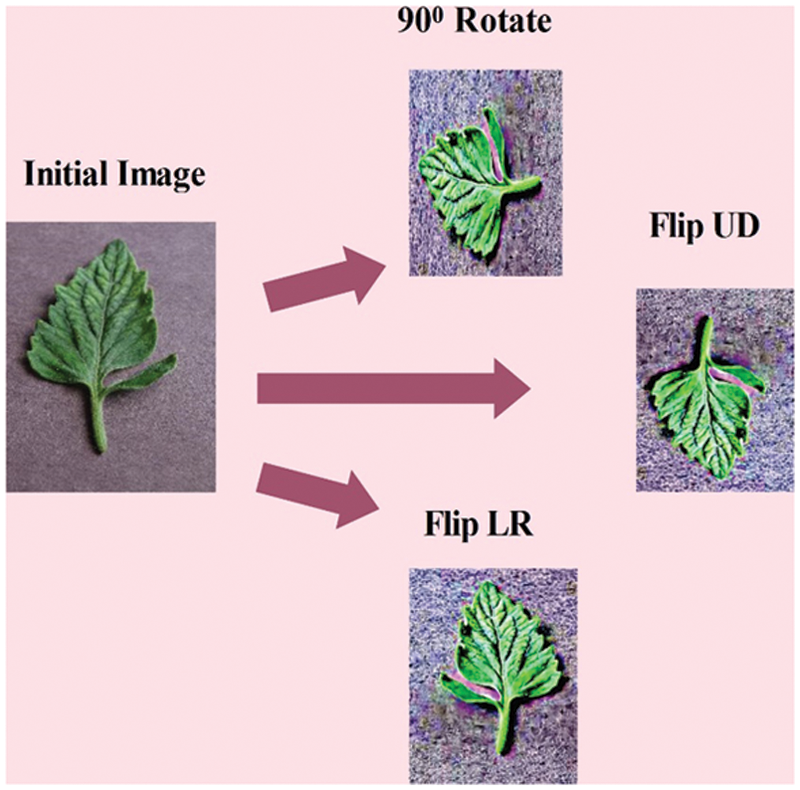
Figure 4: Visual samples of data augmentation process
3.2 Convolutional Neural Networks (CNN)
Convolutional neural network (CNN) is powerful technique in machine learning for features extraction and image classification. A CNN model includes several layers such as convolutional, pooling, ReLu activation, normalization, fully connected, and softmax. Convolutional layer is the first layer known as feature extracted layer. It has finite number of filters. This layer joins a bunch of
A full image/filer combination’s output can be represented as:
where the two-dimensional relationship is denoted by *. ReLU is the activation layer stands for Rectified linear unit. ReLU’s goal is to increase the CNN’s nonlinear behavior. It mark zero to all negative weight values and for the next phase, the subsequent positive weights will indeed be processed in the same way.
where the
Update weight is denoted by
Maximum pooling represented with
where, the output represented by
In transfer learning, a model created for one problem is repurposed for a different problem based on a set of requirements. Its allow us to use knowledge from previously trained model to train newer model. It is the most frequent strategy in Computer Vision where models are employed as a starting point for solving other problems to consume less time. Mathematically, the TL is formulated as follows:
A domain
Visually, the this above process is presented in Fig. 5. In this figure, it is described that knowledge of original pre-trained deep model is transfer to the newly target model. The original pre-trained deep model consists of 1000 object classes, whereas the target model includes only crops disease classes. During the training of the newly trained model, the following hyper parameters are included-learning rate is 0.05, mini batch size is 64, total epochs are 100, and learning method is ADAM.
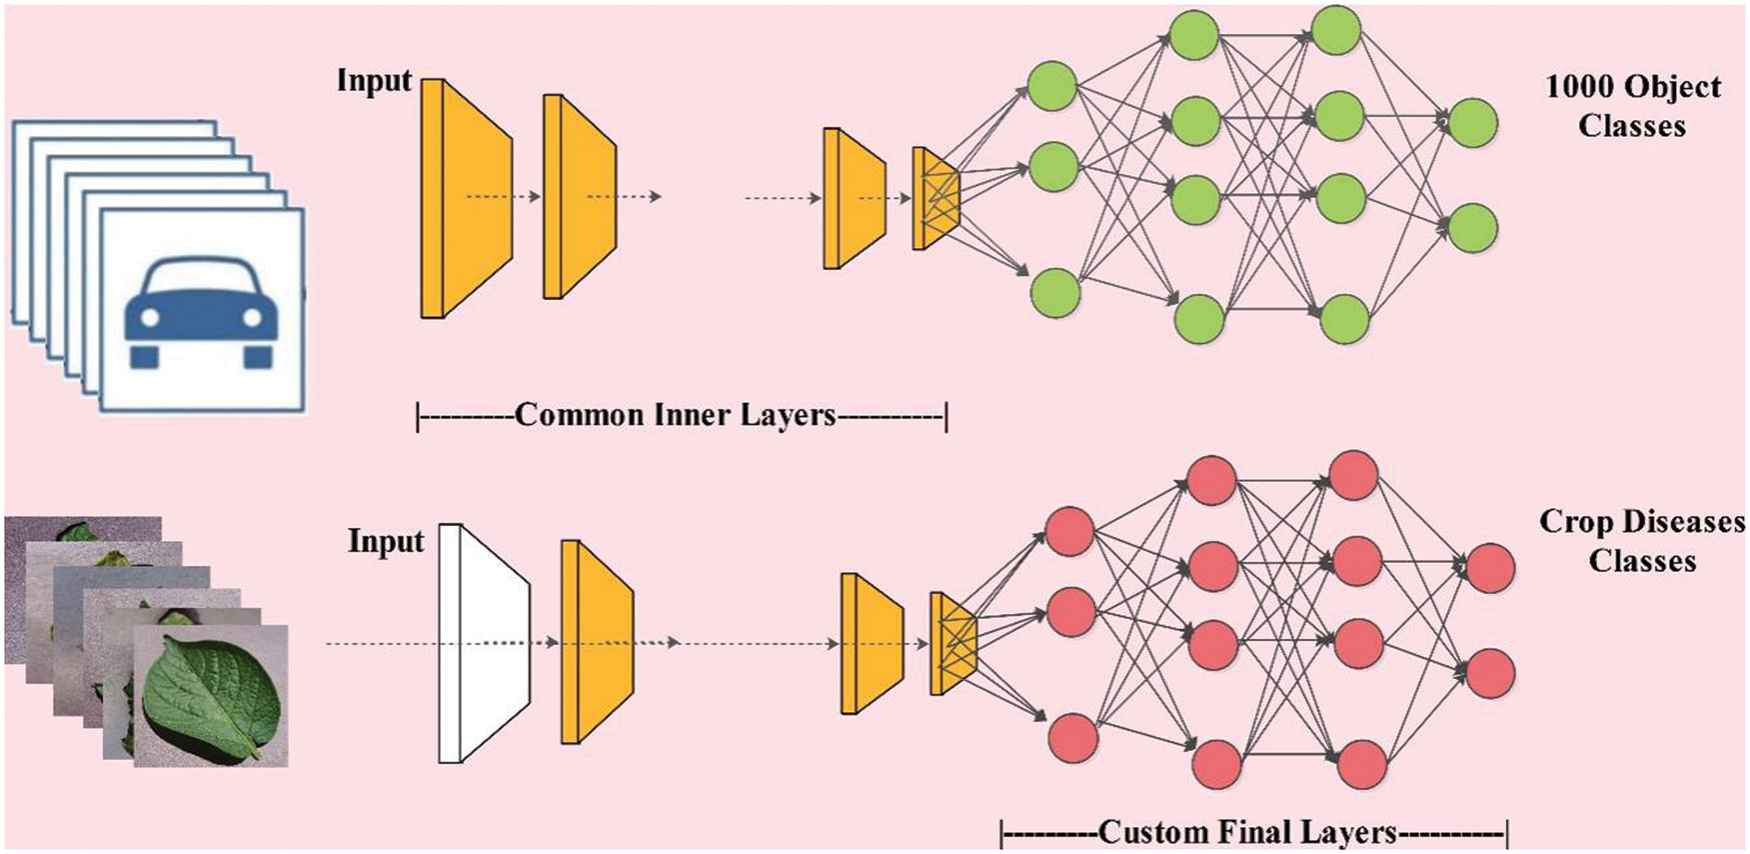
Figure 5: Process of transfer learning for crops leaf diseases
3.4 Fine-Tuned Darknet 19 Deep Features
As a feature extractor, the DarkNET-19 pre-trained CNN model is utilized in this work. Darknet-19 is the backbone of YOLOv2. To create estimates, system which was uses before
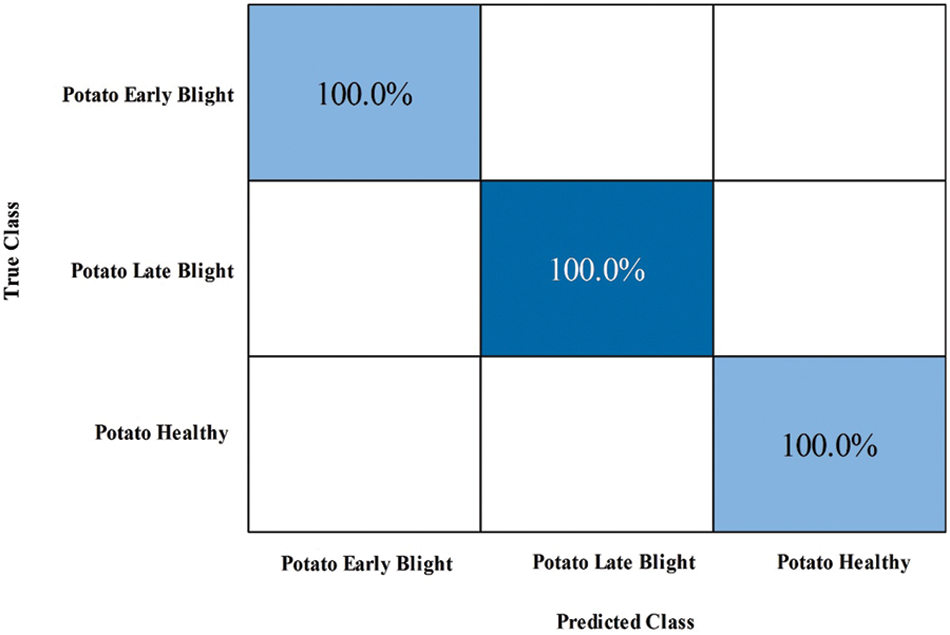
Figure 6: Confusion matrix of GN Bayes classifier for potato leaf diseases recognition using proposed architecture
3.5 Hybrid Improved Cuckoo Newton Raphson Optimization
In this work, we proposed a Hybrid Improved Cuckoo Newton Raphson Optimization (HICNRO) algorithm for best features selection. The purpose of this algorithm is to minimize the redundancy in the features and increase in the accuracy. Moreover, computational time can be reducing using HICNRO. Originally, the cuckoo search algorithm is proposed by Gandomi et al. [26] in 2013. But the convergence rate of this algorithm is not very fast that is improved in this work using Newton Raphson formulation.
Consider, the bird nests count is
The position vectors of the bird’s nest i at the
The step size factor is calculated using the following equation:
Based on
where
By integrating
The stochastic number
where
where L represents the Levy distribution regulates step length,
where α will be in the same range as [0, 2],
where,
4 Experimental Results and Discussion
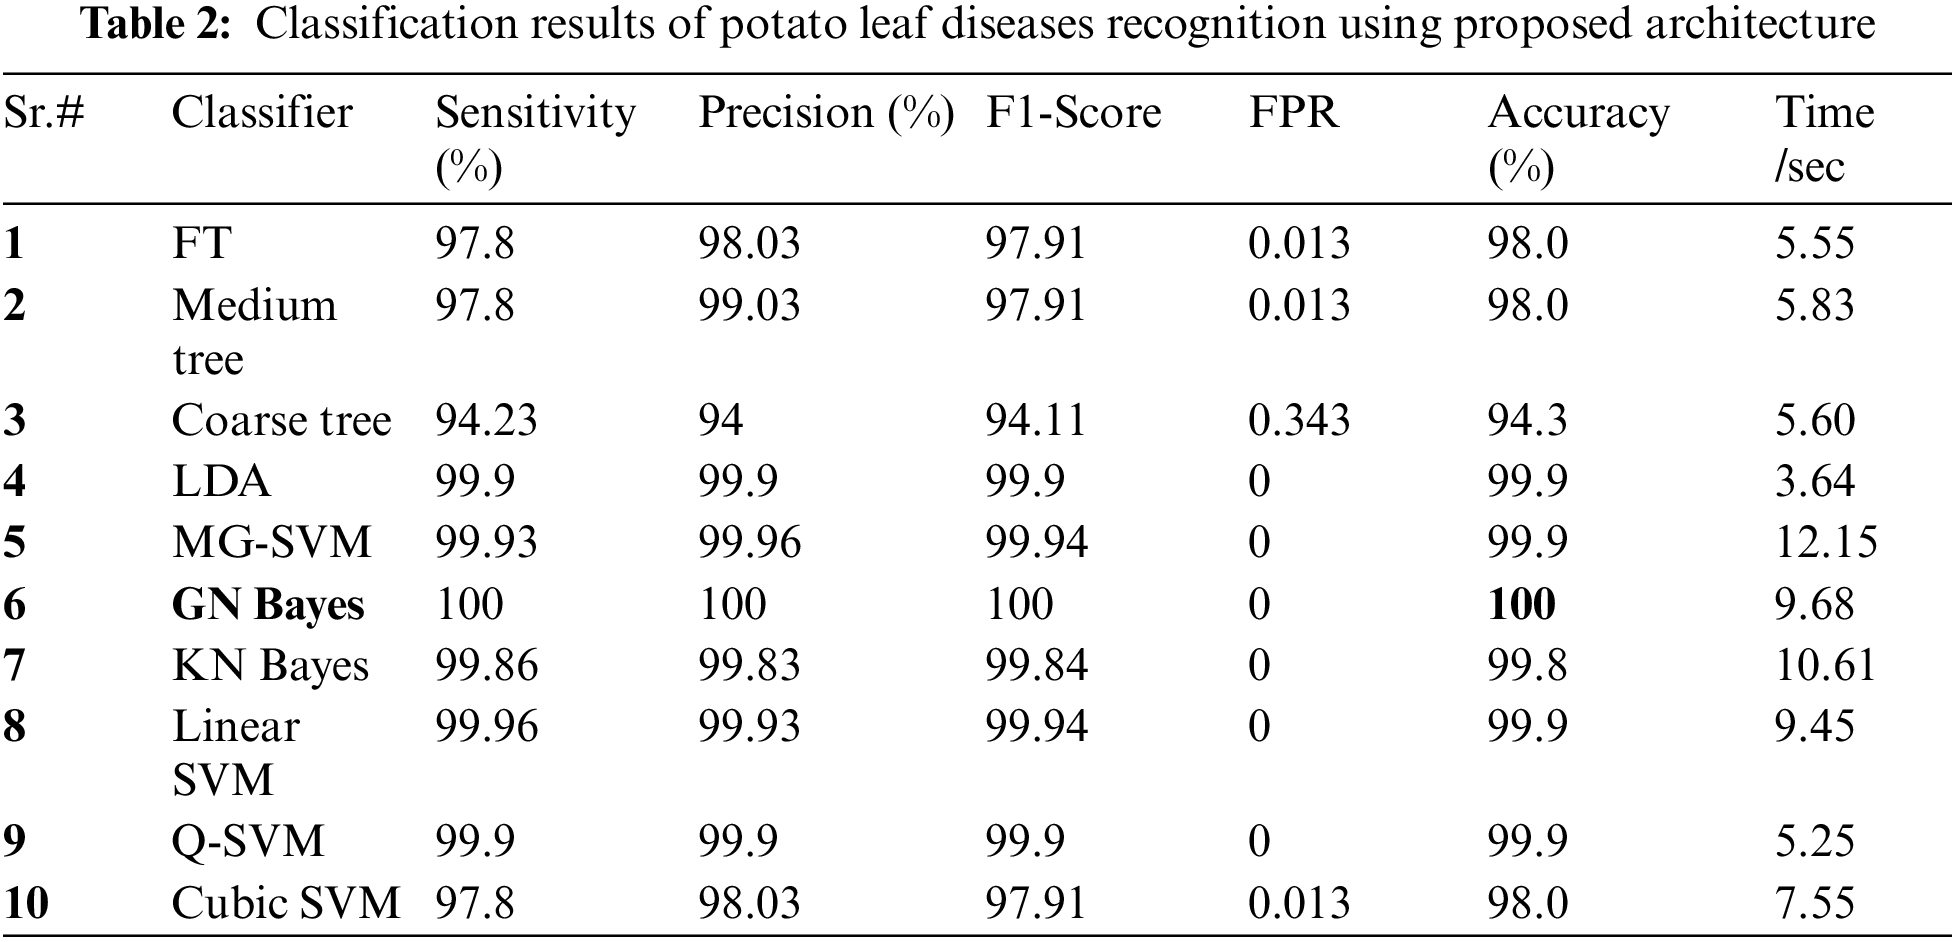
Two publically available datasets named Plant village and Cucumber Leaf Images are utilized in this work for the experimental process. The 50% of the images of each dataset are utilized for the training purpose, whereas the 50% of the rest of the images are employed for the testing purpose. After that, the 10-Fold cross validation is opted for the classification results. Ten different classifiers such as fine tree (FT), Medium tree (MT), Linear Discriminant (LD), Coarse tree, Medium Gaussian SVM (MG-SVM), Gaussian Naive Bayes (GN Bayes), Kernel Naive Bayes (KN Bayes), Linear support vector machine (SVM), Q-SVM, and Cubic SVM are employed for the classification comparison. The each classifier performance is computed based on the six performance measures such as sensitivity, precision, F1-Score, False-Positive rate (FPR), accuracy, and testing time per second. The entire proposed architecture is implemented on MATLAB 2021a using a Corei7 processor with 32GB of RAM and a 64-bit operating system. Moreover, a 8GB graphics card is also employed.
Potato Leaf Diseases Classification Results: The numerical results of tomato leaf diseases recognition are presented in Tab. 2. This table presents the best accuracy of 100% for GN Bayes classifier. The other calculated measures such as sensitivity rate are 100, precision rate is 100, and F1-Score is 100%, respectively. Fig. 6 showing the confusion matrix of GN Bayes that can utilized to verify the sensitivity rate. The computation time of the testing process is 9.68 (sec) for GN Bayes classifier. The rest of the classifiers listed in this table also performed well and attained an accuracy of above 98%.
To analyze the performance of proposed framework, we also computed the results of all extracted deep features and compared with proposed framework in terms of accuracy and time. Fig. 7 showing the accuracy based comparison of proposed framework and all extracted features of fine-tuned DarkNet19. This figure showing that the accuracy is improved almost 2%–3% after employing proposed feature selection algorithm. Fig. 14 showing the testing time based comparison of proposed framework with original fine-tuned DarkNet19 extracted features. Based on this figure, it is observed that the time is significantly reduced after applying feature selection algorithm.
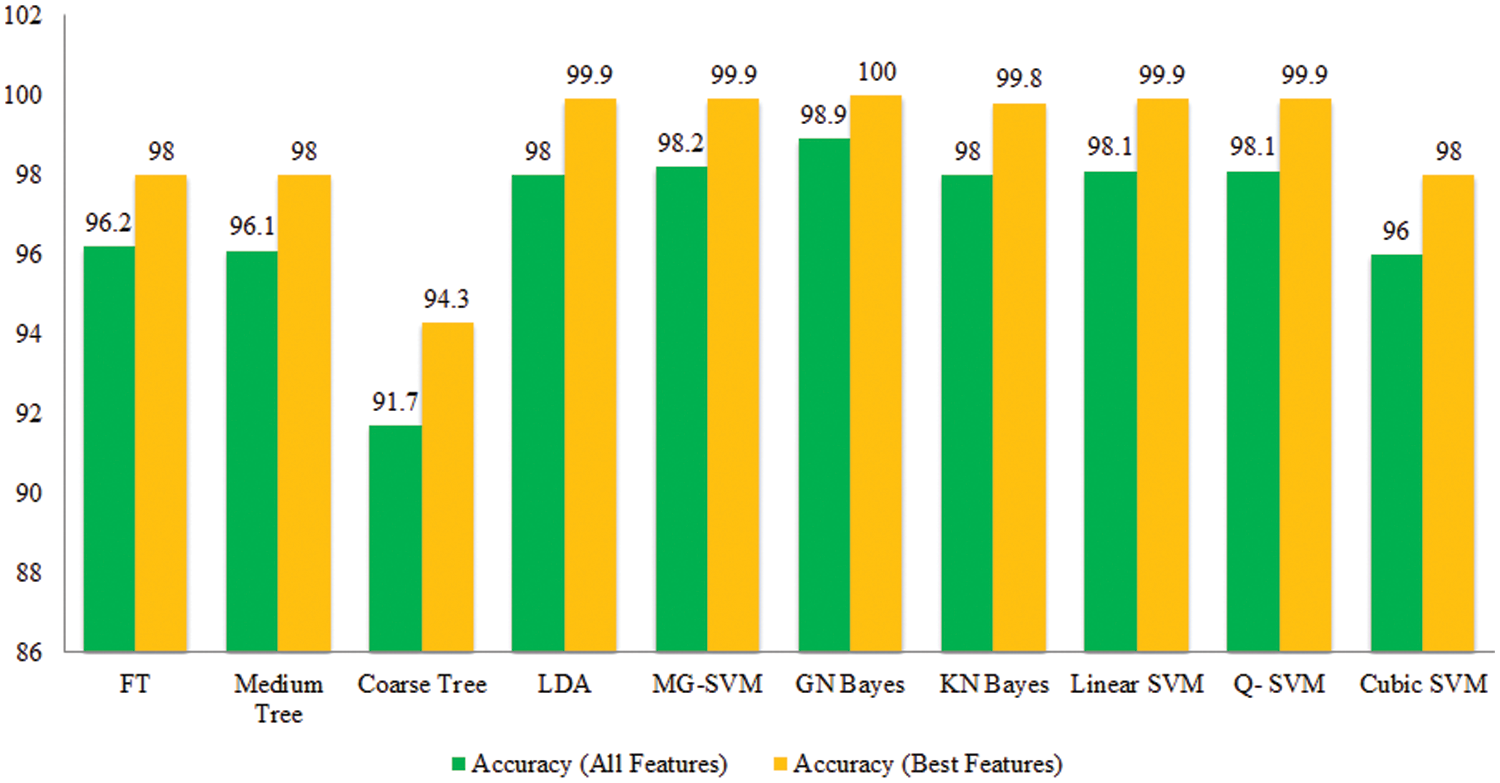
Figure 7: Comparison among all features and best selected features for Potato leaf diseases in terms of accuracy
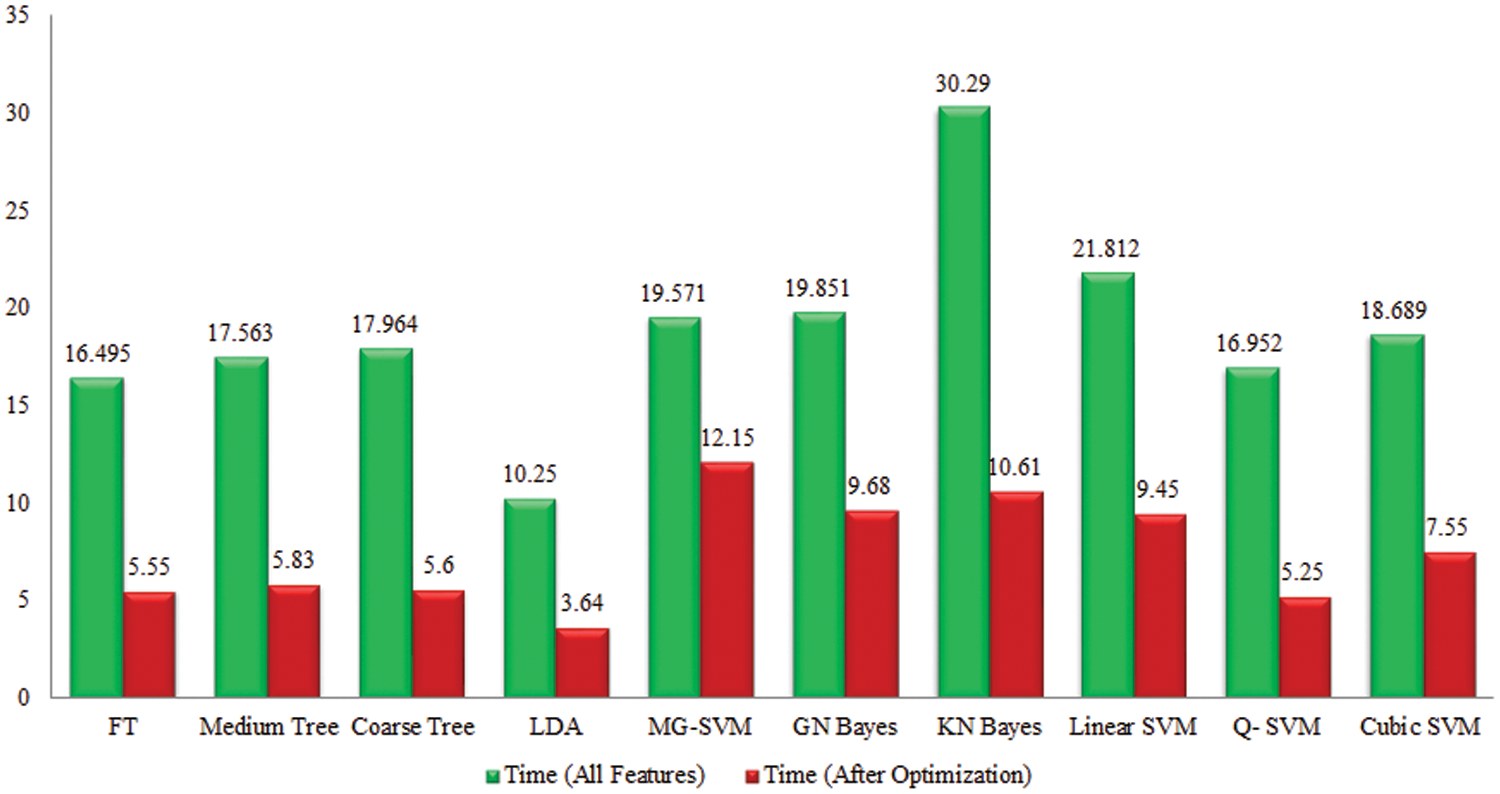
Figure 8: Comparison among all features and best selected features for Potato leaf diseases in terms of testing time
Tomato Leaf Diseases Classification Results: Potato leaf diseases recognition results are presented in Tab. 3. In this table, the best attained accuracy of 92.9% for GN Bayes classifier. The sensitivity rate of GN Bayes is 94.49%, whereas the precision rate and F1-Score values are 94.19% and 94.33%. Fig. 9 showing the confusion matrix of GN Bayes that can utilized to verify the sensitivity rate. The computation time of the GN Bayes during the testing process is 21.433 (sec). The minimum noted computational time for this experiment is 9.359 (sec). The recognition accuracy for the rest of the classifiers listed in this table attained an average accuracy of 90%. The performance of proposed framework is also compared with the original features extraction from fine-tuned DarkNet19 CNN model in terms of accuracy and time. Fig. 10 showing the accuracy based comparison of propose framework and all extracted features of fine-tuned DarkNet19. This figure showing that the accuracy is improved almost 3%–4% after employing proposed feature selection algorithm. Fig. 11 showing the testing time based comparison of proposed framework with original fine-tuned DarkNet19 extracted features. This figure shows that the testing time is significantly reduced after using proposed optimization algorithm.
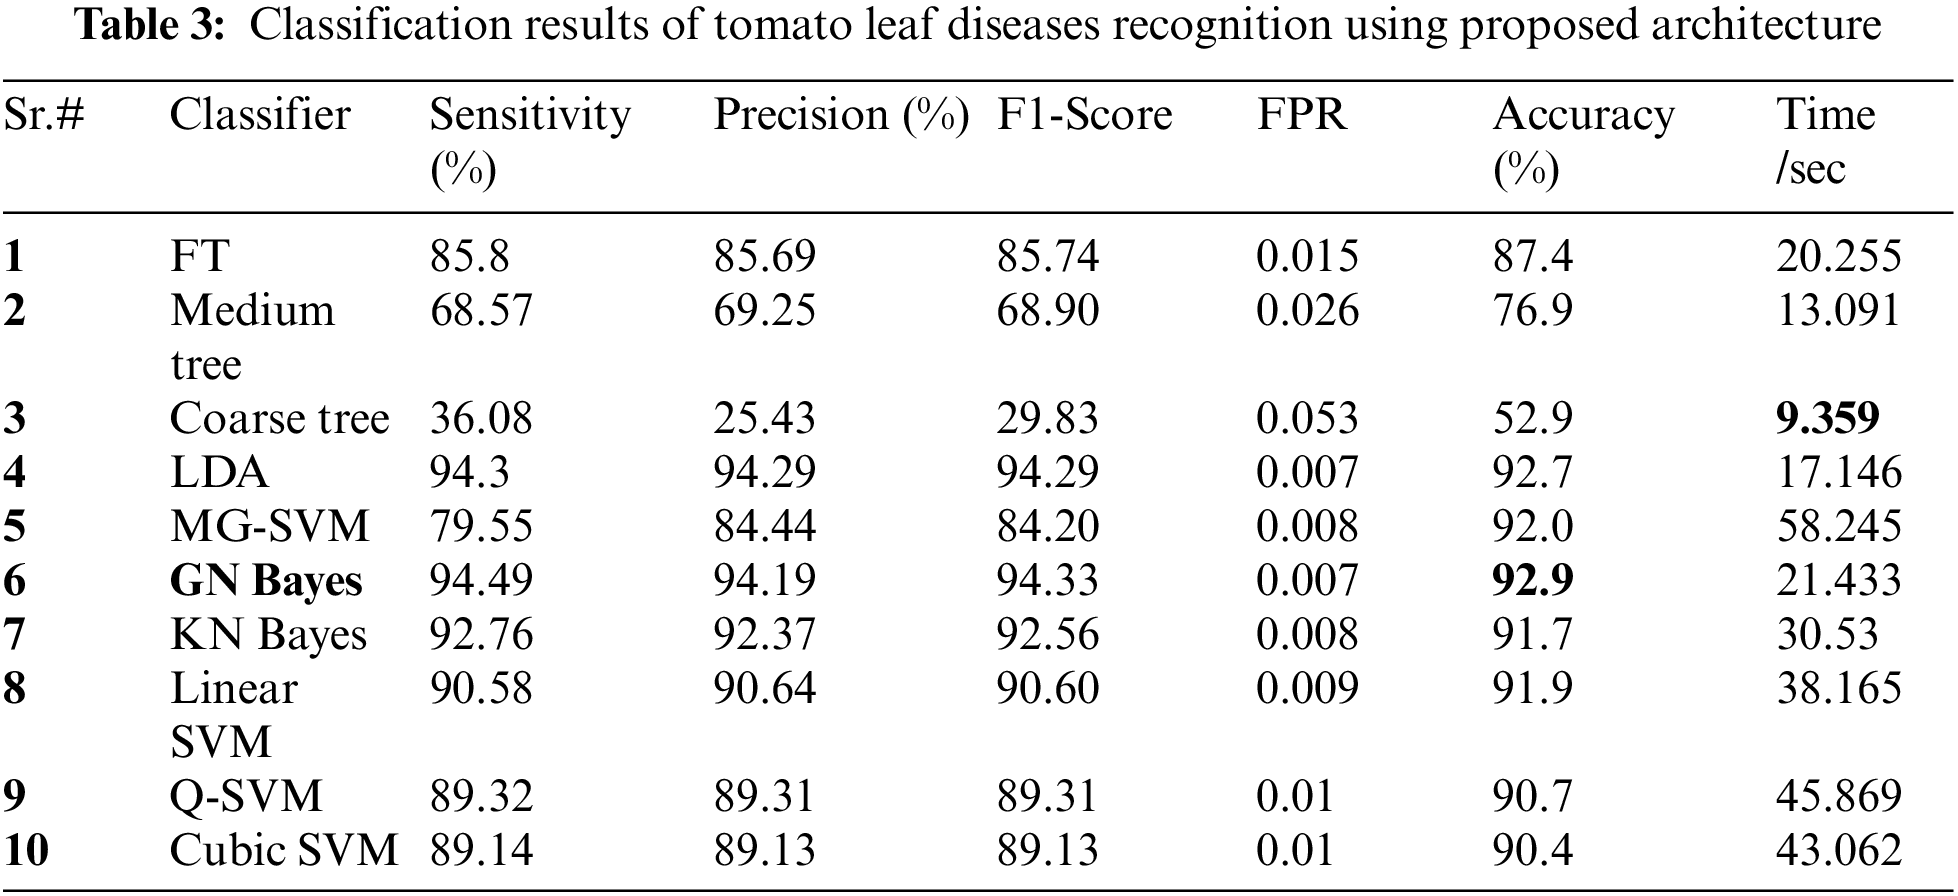
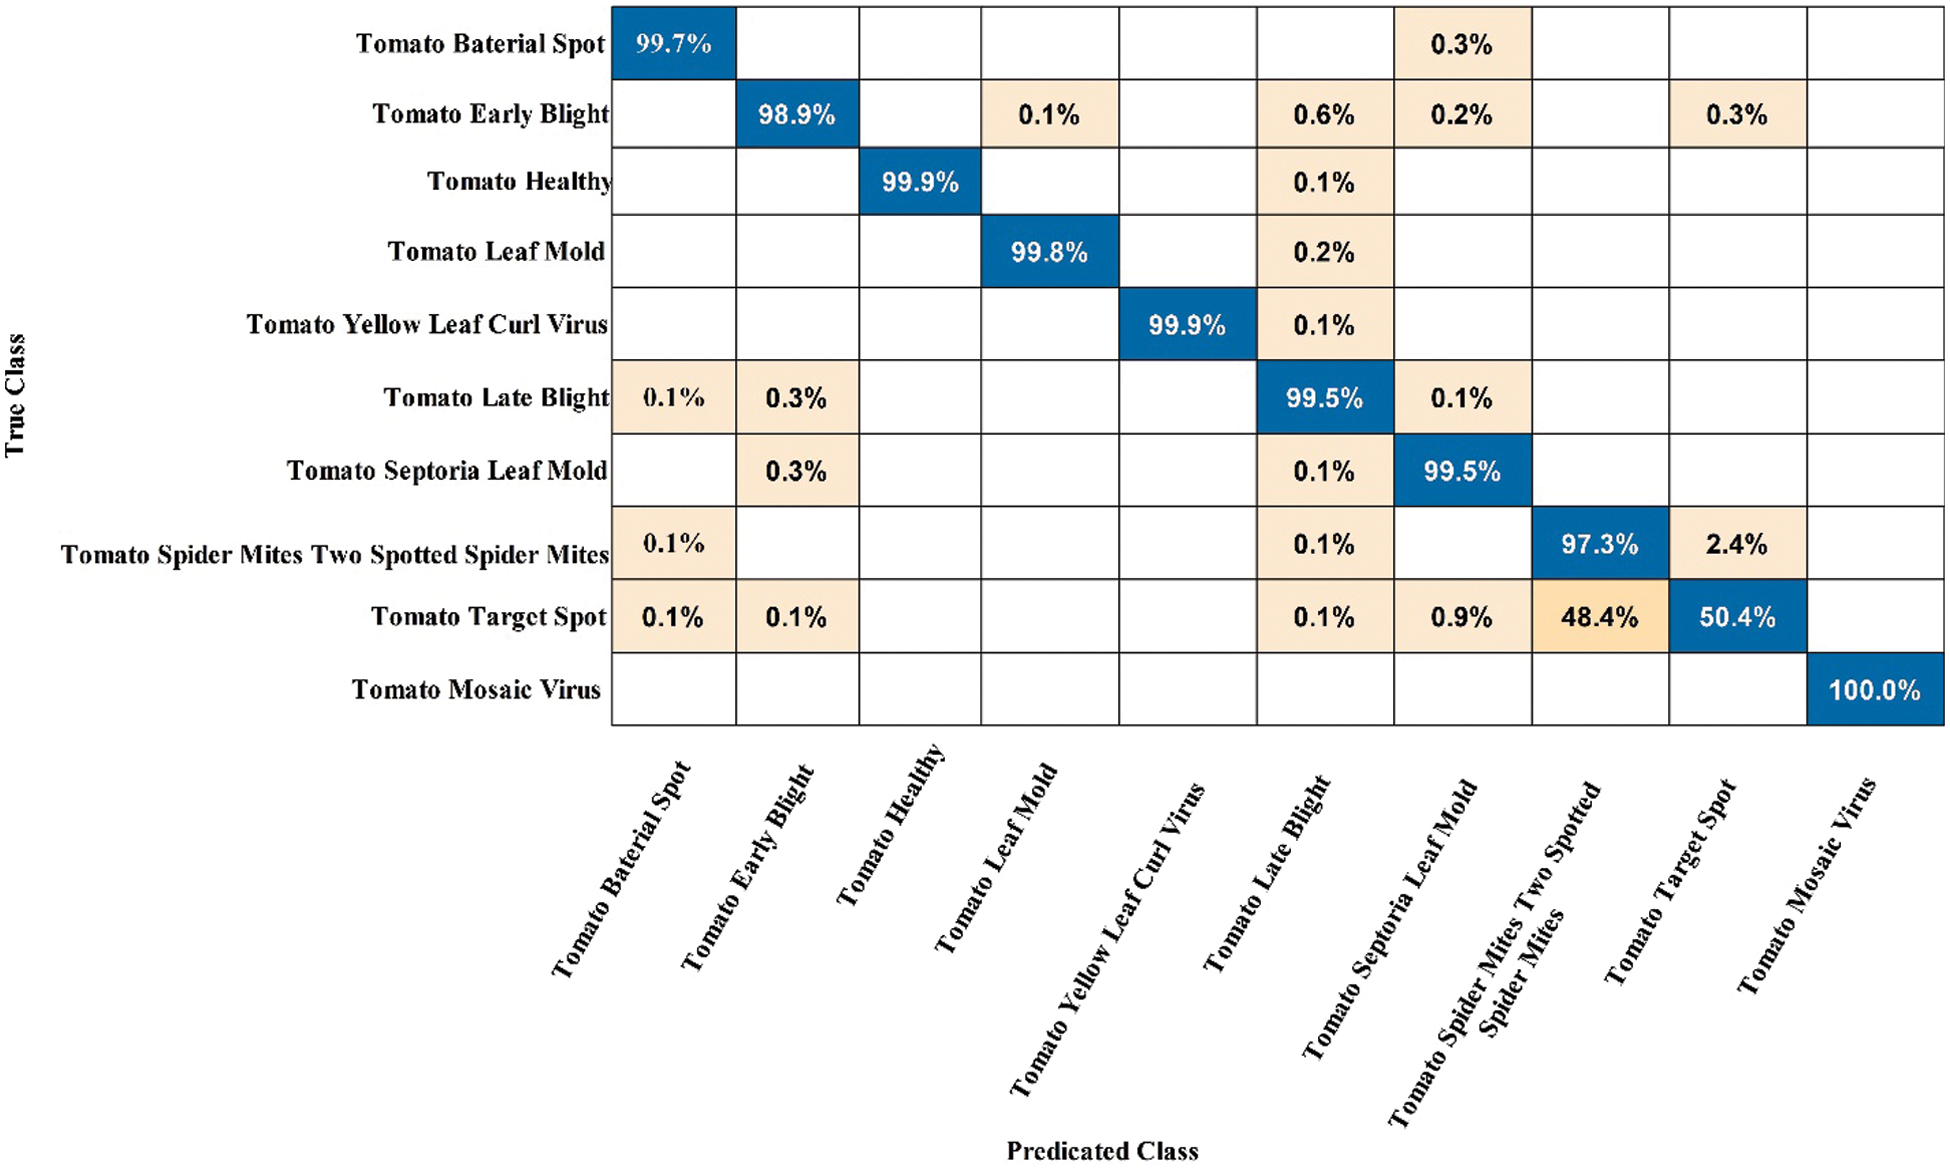
Figure 9: Confusion matrix of GN Bayes classifier for Tomato leaf diseases recognition using proposed architecture
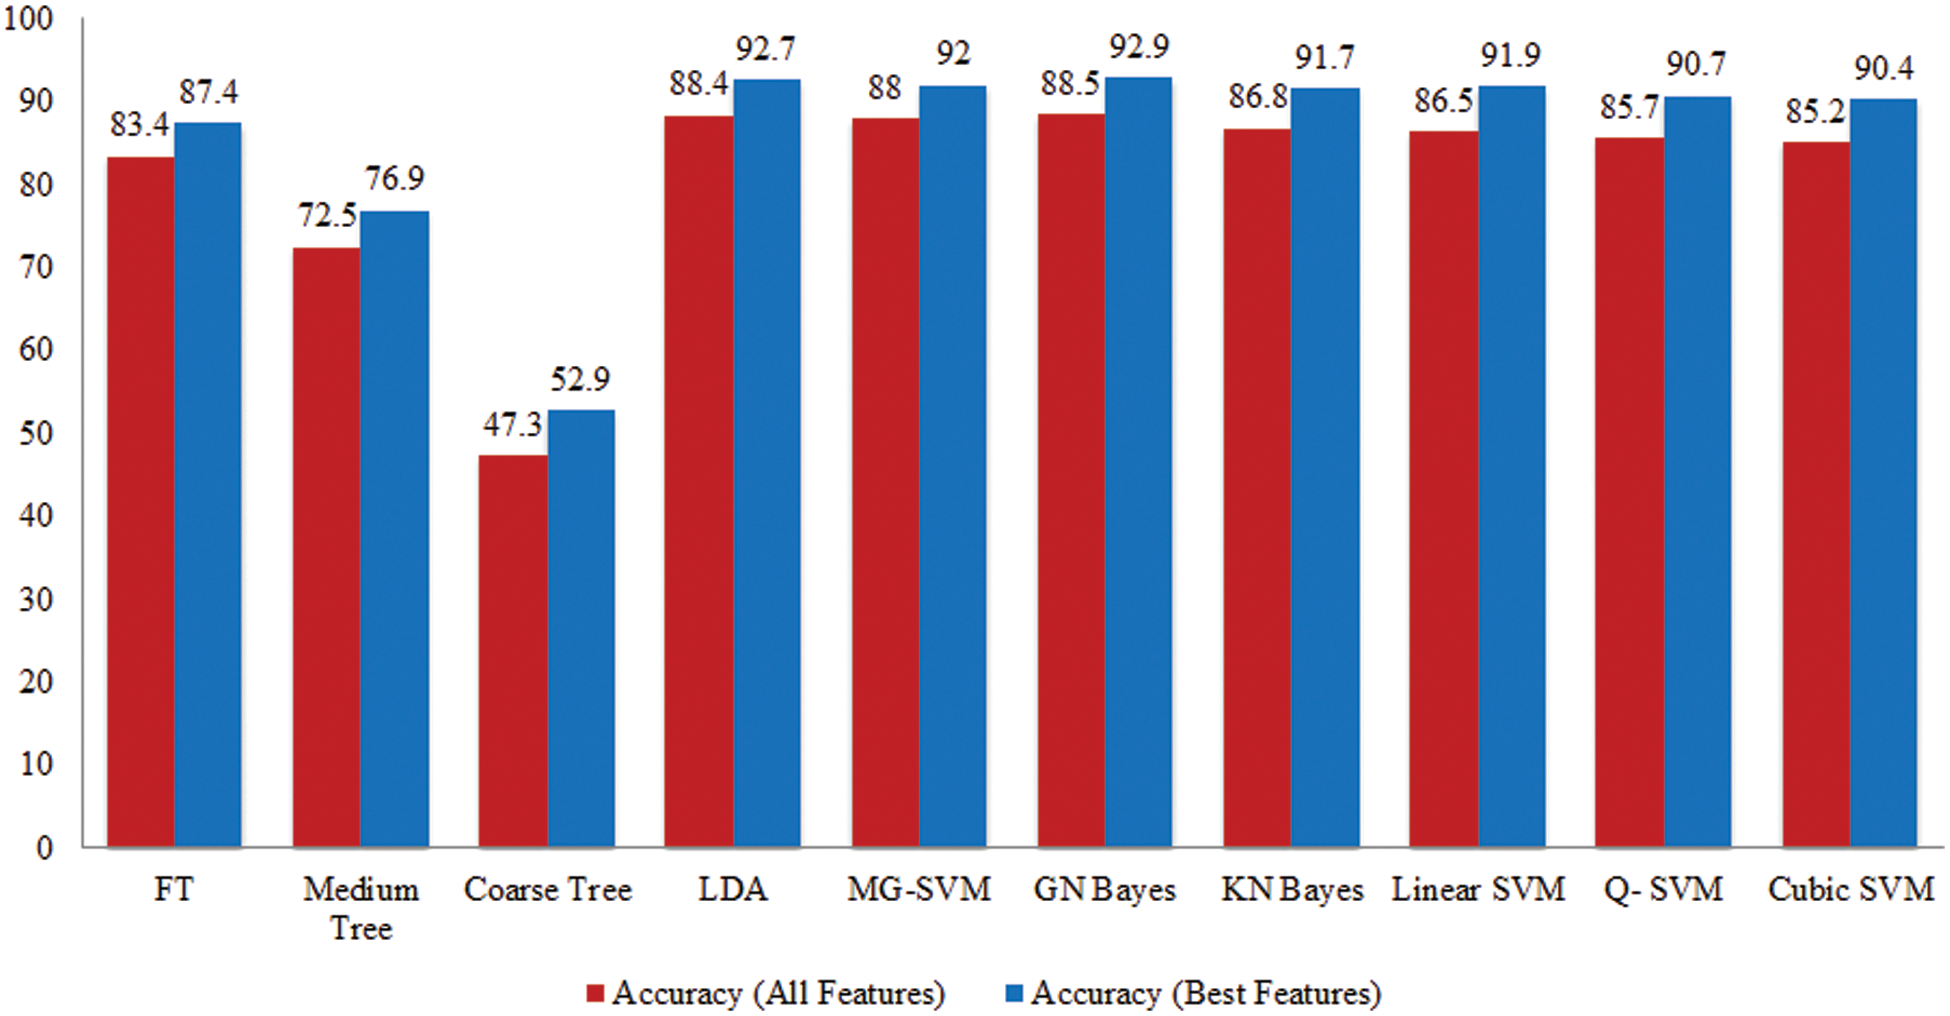
Figure 10: Comparison among all features and best selected features for Tomato leaf diseases in terms of accuracy
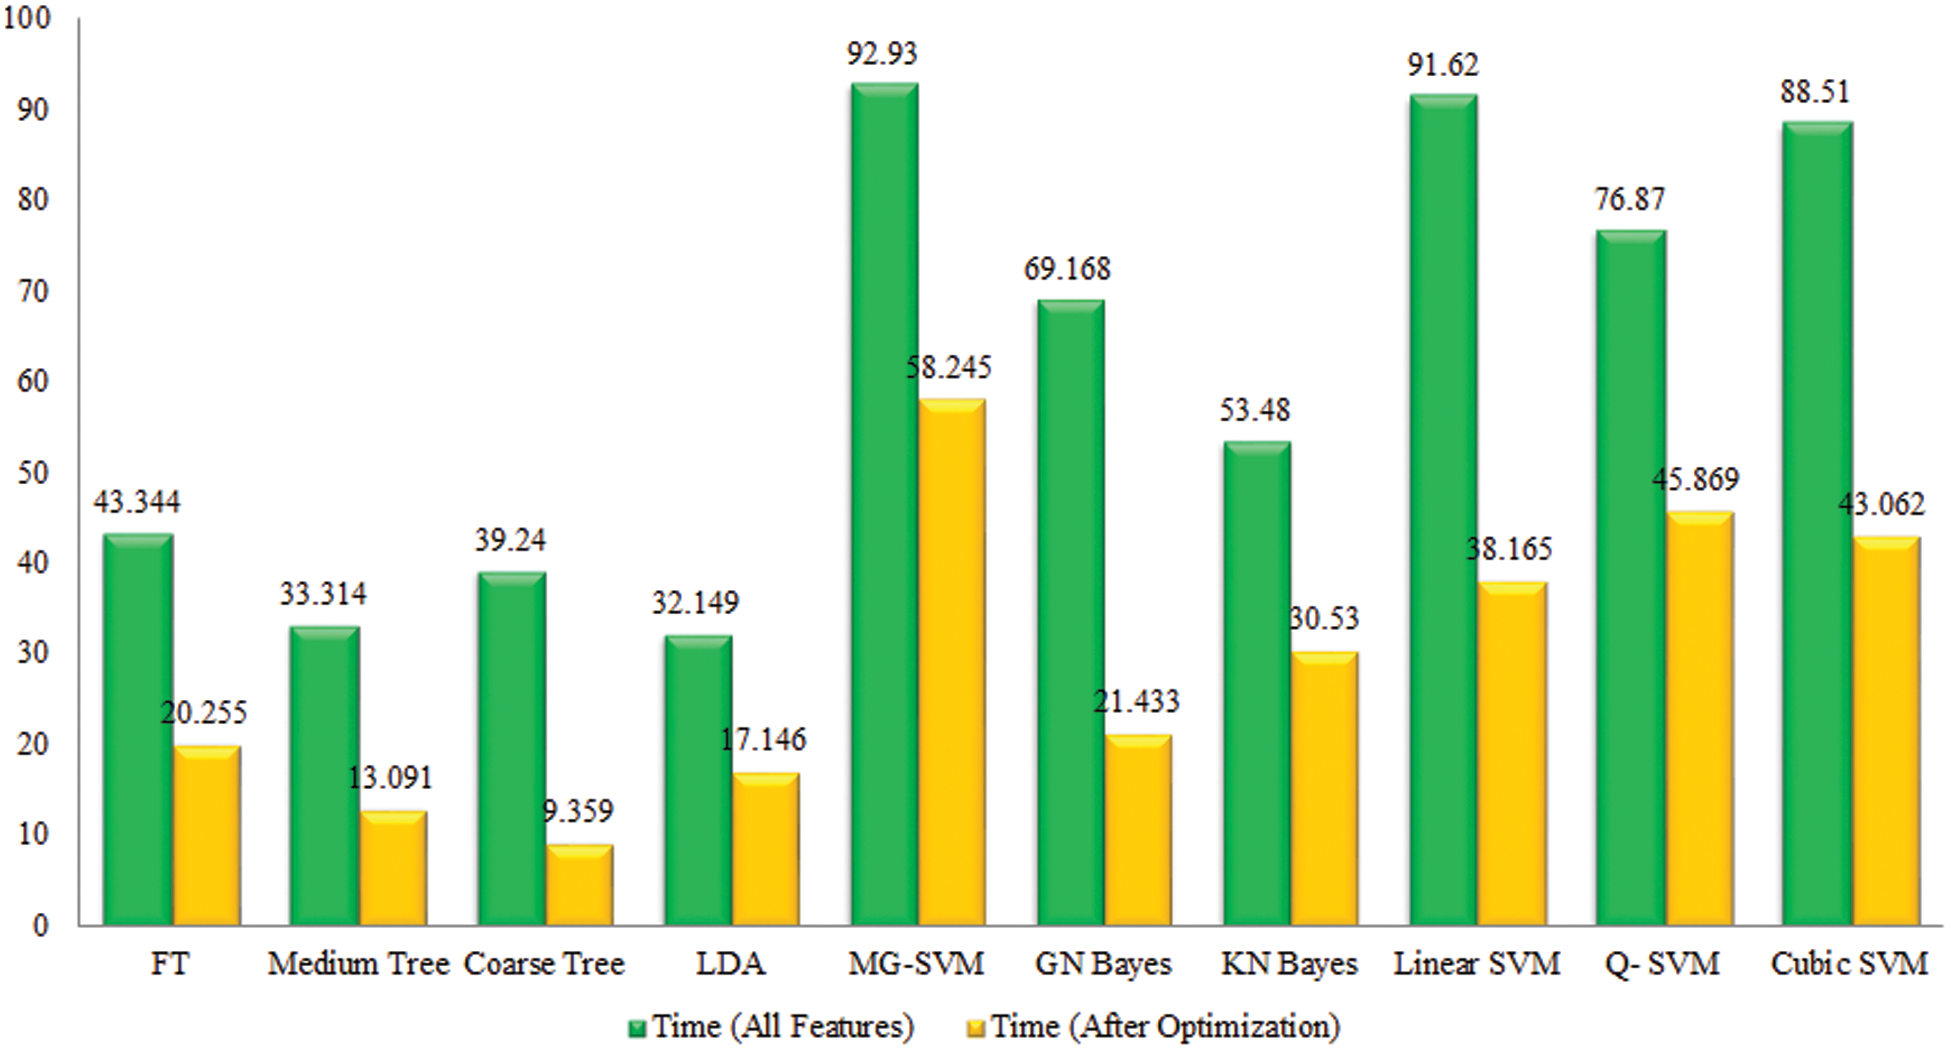
Figure 11: Comparison among all features and best selected features for Tomato leaf diseases in terms of testing time
Cucumber Leaf Diseases Classification Results: Tab. 4 presented the results of proposed framework for cucumber leaf diseases recognition. This table presents the best attained accuracy of 99.2% for LSVM classifier. The other calculated measures of LSVM classifier such as sensitivity rate of 99.14, precision rate of 99.16, and F1-Score is 99.14%, respectively. The sensitivity rate of LSVM is verified by a confusion matrix, illustrated in Fig. 12. In this figure, the diagonal values represent the correct prediction rate of each class. The computation time of LSVM is 6.861 (sec), whereas the minimum noted time is 2.045 (sec) of Coarse tree classifier. The average classification accuracy for rest of the classifier is above 95% except Coarse Tree.
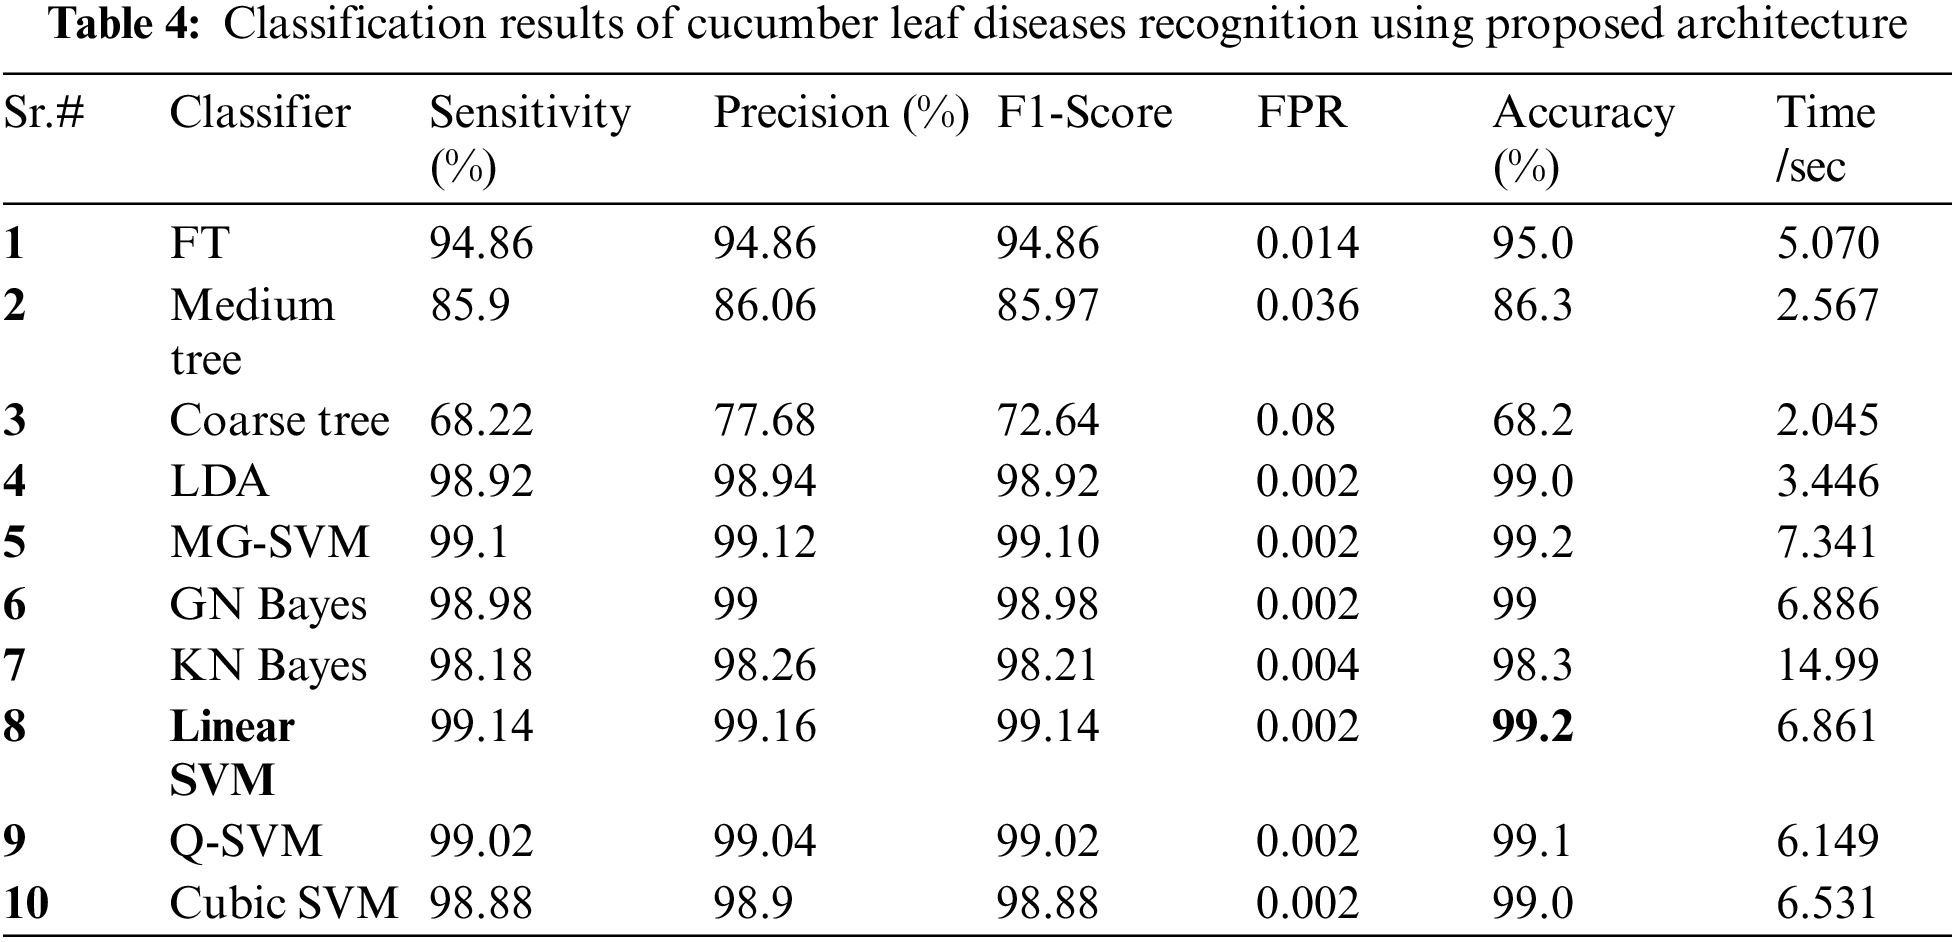
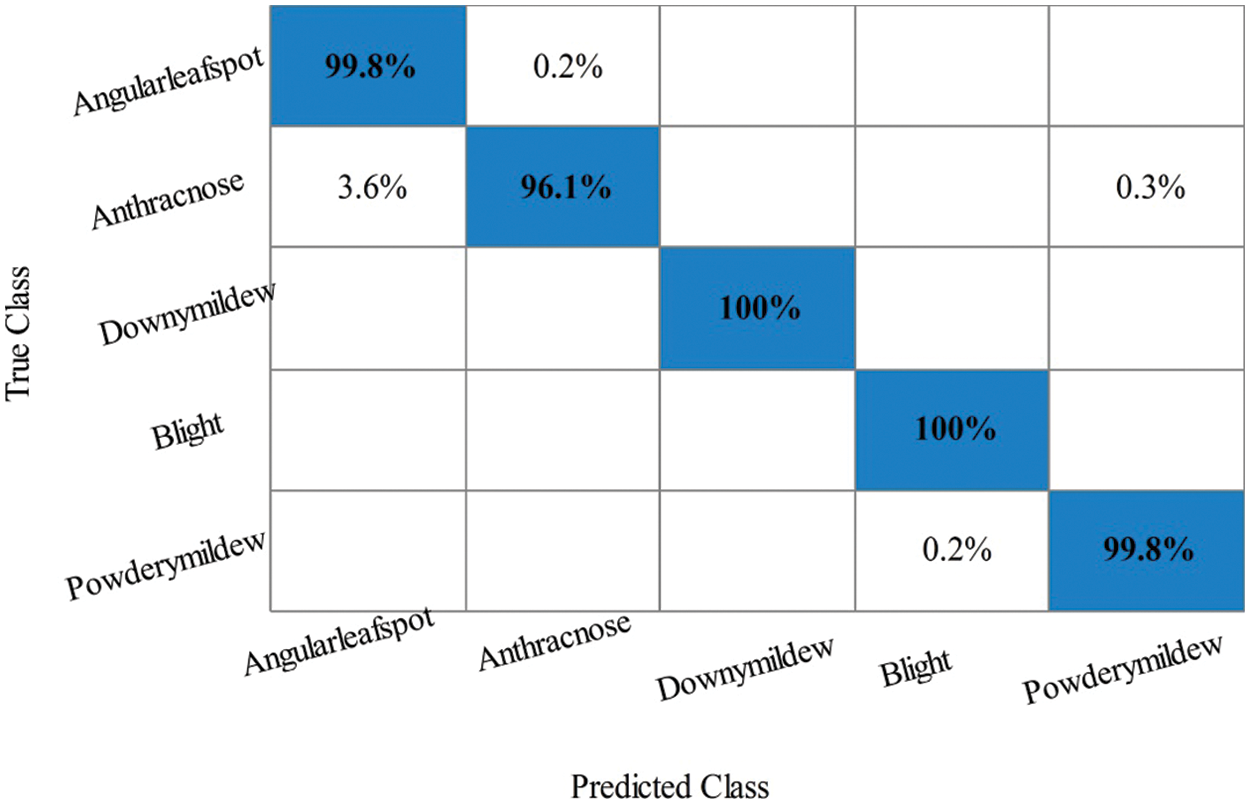
Figure 12: Confusion matrix of Linear SVM classifier for Cucumber leaf diseases recognition using proposed architecture
The performance of proposed framework is also analyzed based on the accuracy computed for all extracted deep features of fine-tuned DarkNet19 in terms of accuracy and time. Fig. 13 showing the accuracy based comparison of propose framework and all extracted features of fine-tuned DarkNet19 model. This figure showing that the accuracy is improved almost 4%–5% for proposed features optimization algorithm. Fig. 14 showing the testing time based comparison of proposed framework with original fine-tuned DarkNet19 extracted features. This figure represent that the computational time of proposed framework (best features) is better than the originally extracted deep features of DarkNet19.
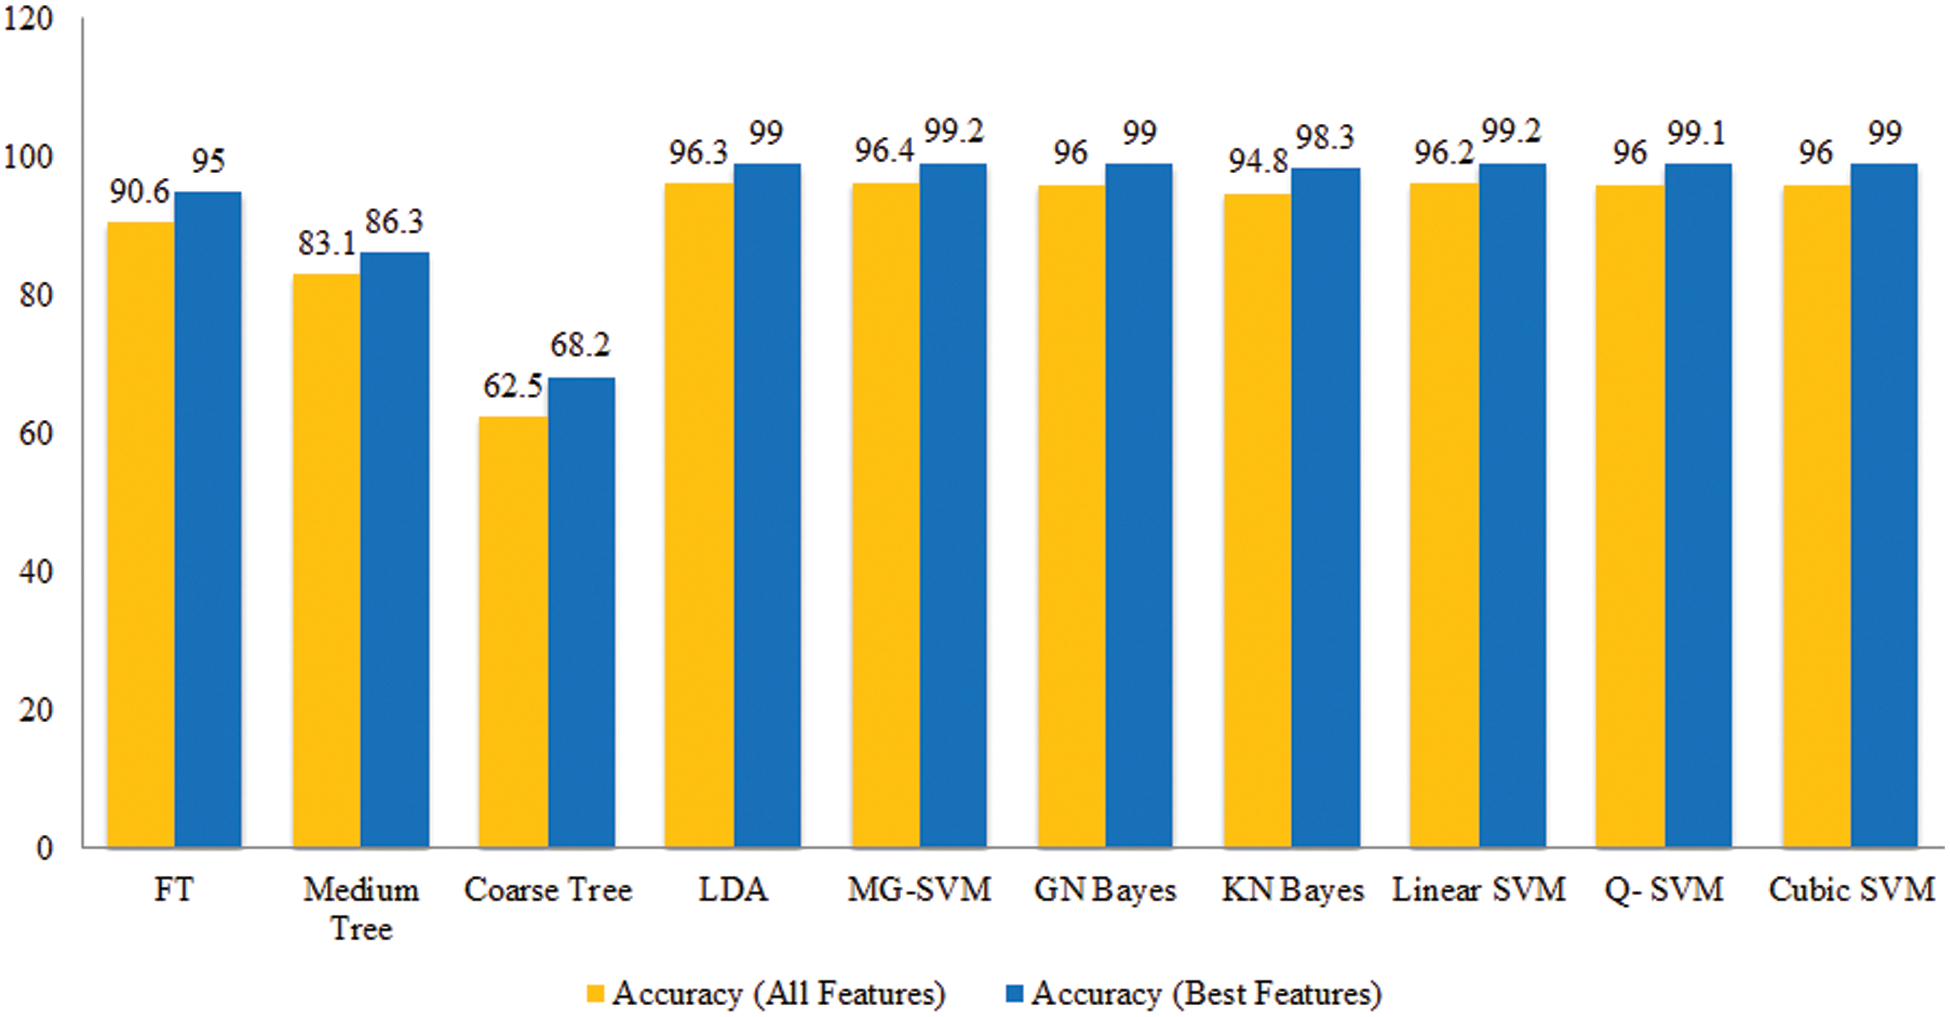
Figure 13: Comparison among all features and best selected features for Cucumber leaf diseases in terms of accuracy
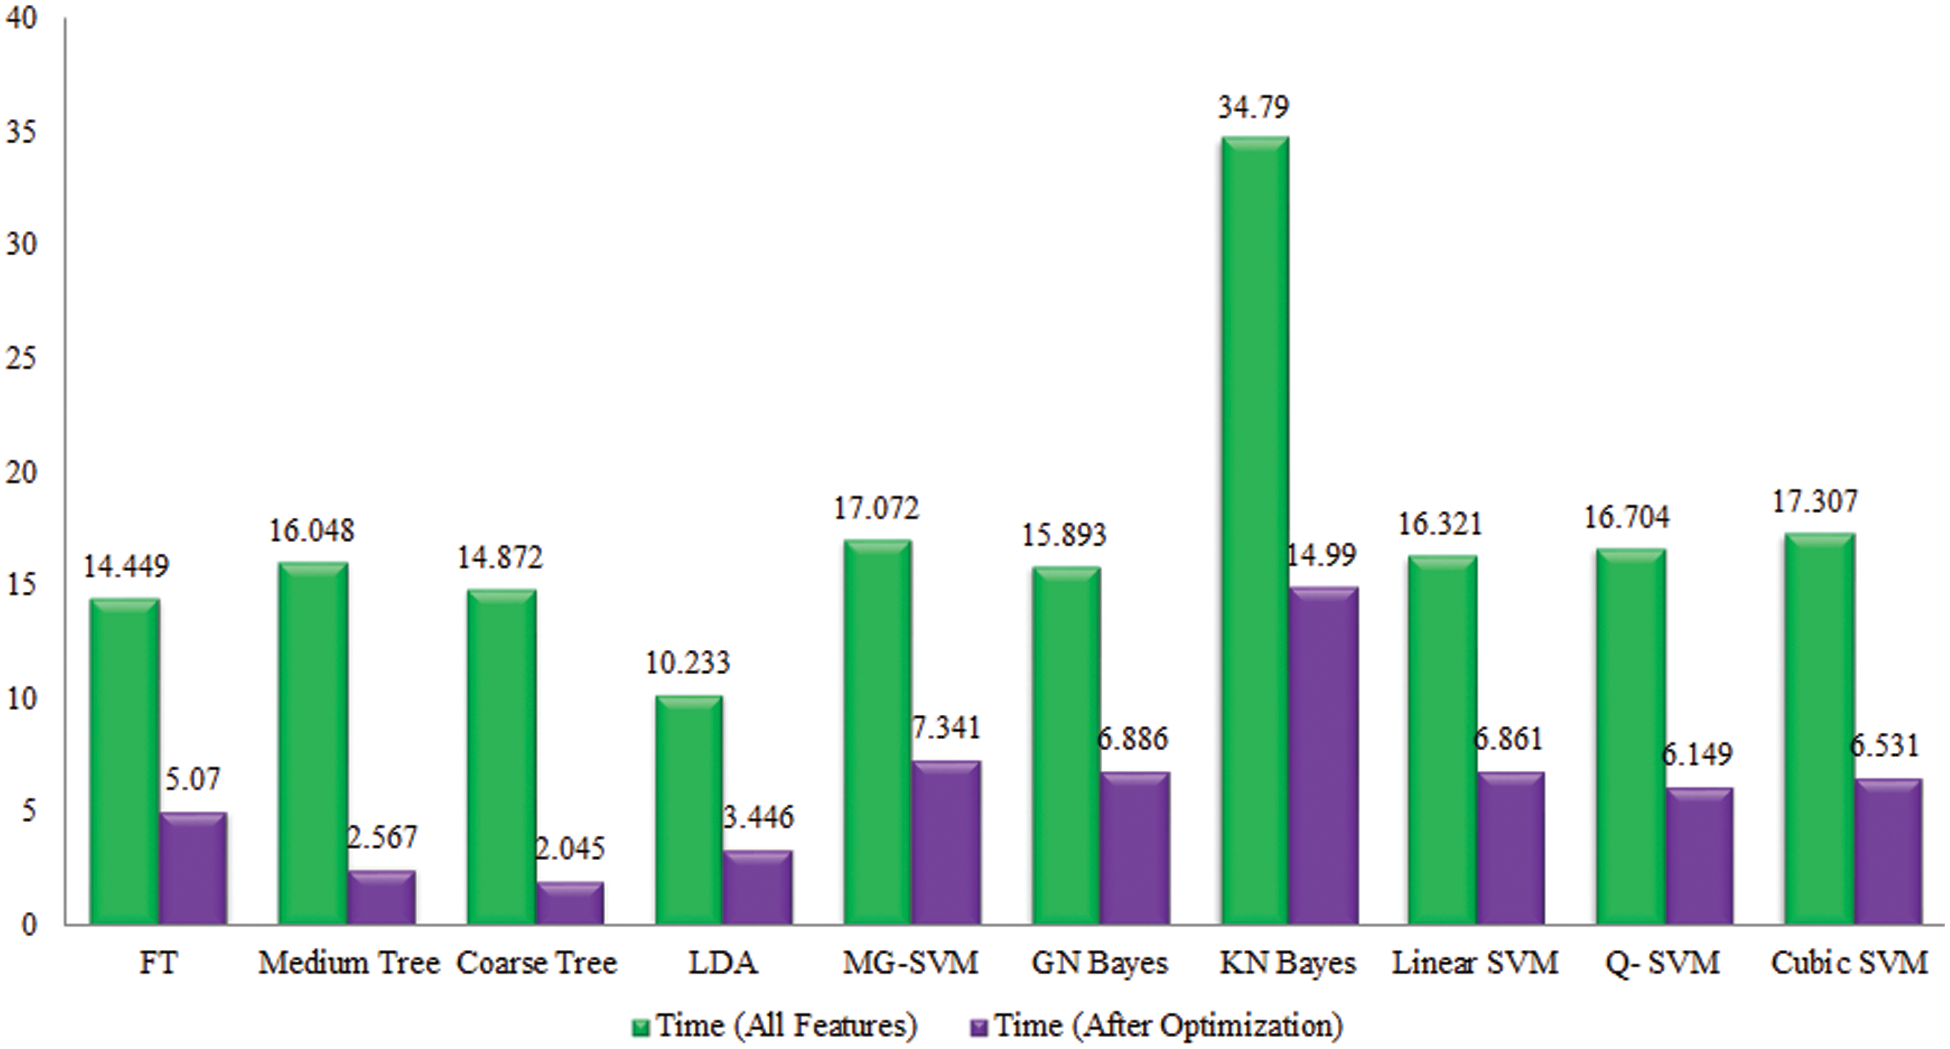
Figure 14: Comparison among all features and best selected features for Cucumber leaf diseases in terms of testing time
At the end, the proposed method is discussed and shows the importance of each step. Fig. 3 illustrated the proposed framework that based on the contrast enhancement and data augmentation. Contrast enhancement visual results are illustrated in Fig. 15 that shows the improvement after the proposed enhanced technique. The resultant enhanced images are utilized for the training of fine-tuned DarkNet19 model that later exploited for the deep features extraction. After that, the proposed optimization algorithm is applied and results are given in above tables and plots. The results show that the proposed framework gives better results.
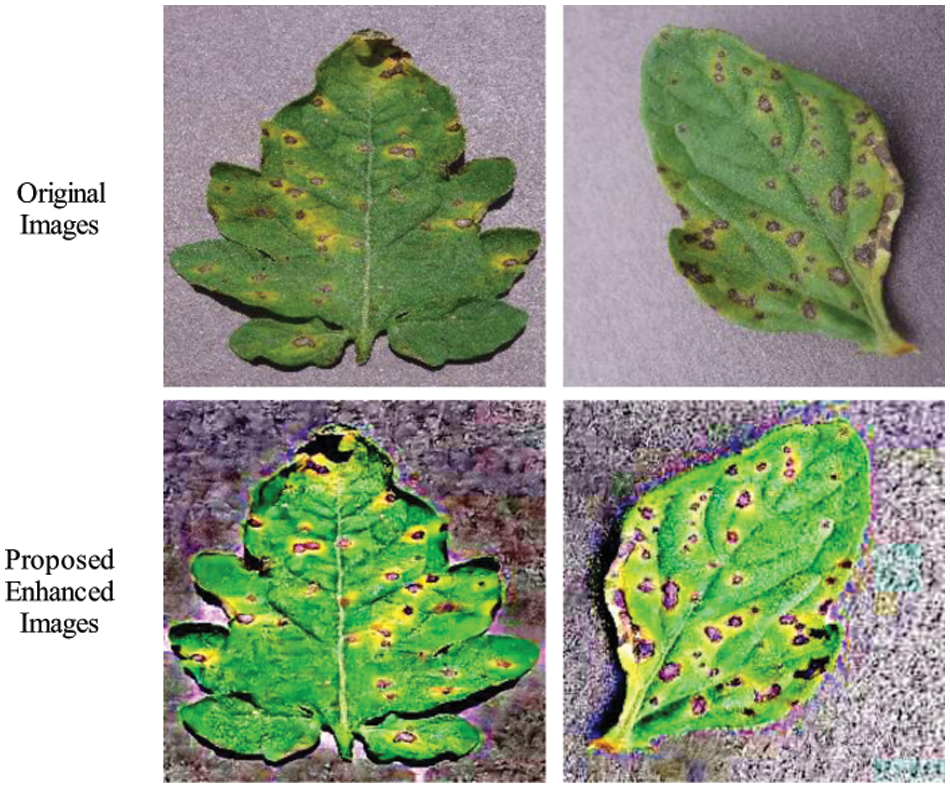
Figure 15: Visual results of contrast enhancement technique
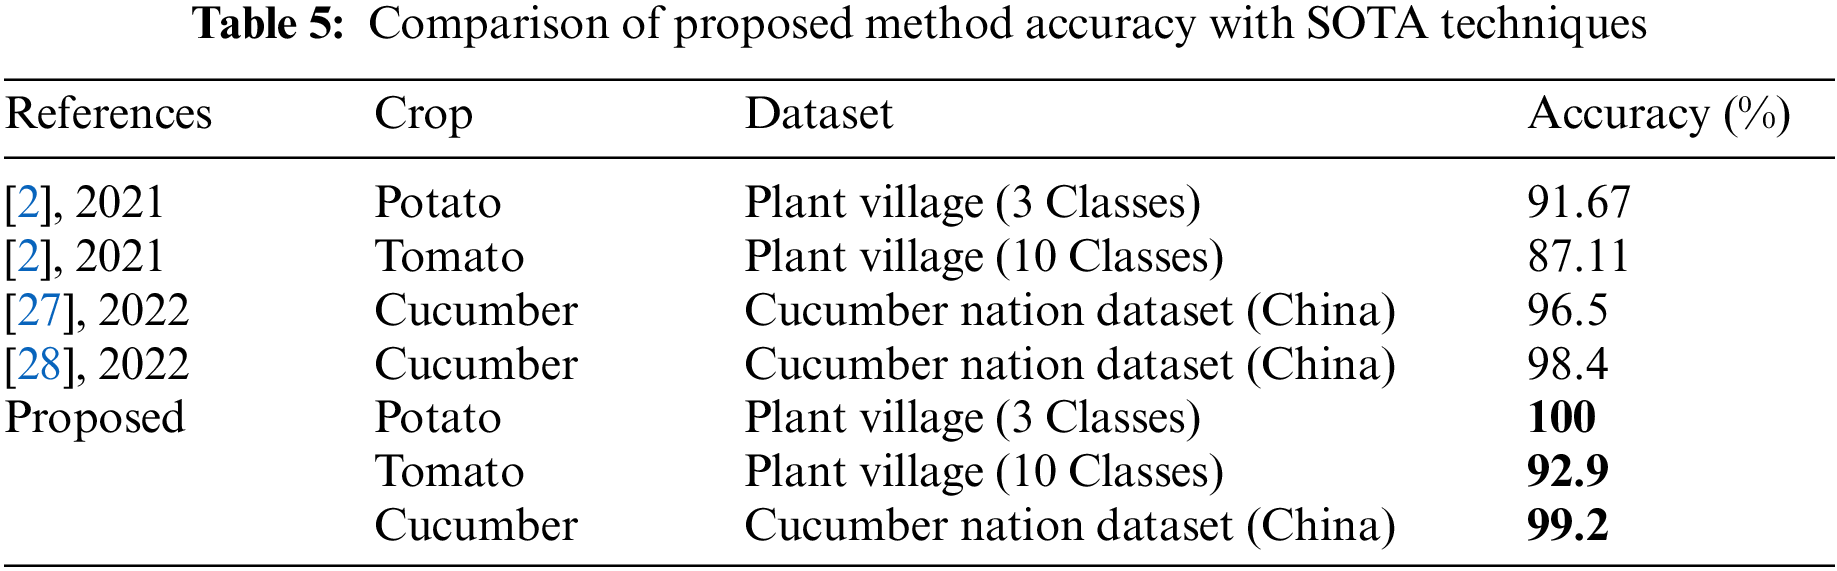
Finally, the proposed method accuracy is compared with recent state of the art (SOTA) techniques, as presented in Tab. 5. In this table, it is noted that the recently published techniques attained the maximum accuracy of 91.67% for potato leaf diseases, 87.11 for tomato, and 98.4% for cucumber. The proposed method achieved an improved accuracy of 100%, 92.9%, and 99.2%, respectively of each crop.
In this article, we proposed a deep learning and optimization based sequence architecture for crops leaf diseases recognition. The developed architecture consists of five sequential steps. In the first step, data augmentation is performed based on the contrast enhancement and rotation operations to increase the numbers of training samples. In the next step, a pre-trained DarkNet19 deep model is opted and fine-tuned based on the last layers. In third step, fine-tuned model is trained using transfer learning and deep features are extracted from the global pooling layer. In the fourth step, Improved Cuckoo search algorithm based best features are selected that are finally classified in fifth step using machine learning classifiers. The experimental process of the proposed series architecture is conducted on publically available datasets and shows the improved accuracy. Based on the results, we conclude that the data augmentation step improves the learning capability of a CNN model. The main aim behind the selection of DarkNet19 is less number of parameters than few other pre-trained models. However, during the analysis, it is noted that few irrelevant features are also extracted. Therefore, the improved optimization algorithm is developed. In the future, the following points shall be considered: i) Advanced CNN model shall be opted for deep features extraction [29,30]; ii) Model shall be train on noisy and clean images to check the capability of designed CNN architecture [31–33], and iii) More datasets will be utilized for the experimental process and consider reinforcement learning technique.
Acknowledgement: The authors are grateful to the ERAWAN project for high-performance computers. This research work was partially supported by Chiang Mai University and HITEC.
Funding Statement: The authors received no specific funding for this study.
Conflicts of Interest: The authors declare that they have no conflicts of interest to report regarding the present study.
References
1. A. Rehman, L. Jingdong, B. Shahzad, A. A. Chandio and I. Hussain, “Economic perspectives of major field crops of Pakistan: An empirical study,” Pacific Science Review B: Humanities and Social Sciences, vol. 1, no. 2, pp. 145–158, 2015. [Google Scholar]
2. F. Saeed, M. Sharif, M. Mittal, L. M. Goyal and S. Roy, “Deep neural network features fusion and selection based on PLS regression with an application for crops diseases classification,” Applied Soft Computing, vol. 103, no. 11, pp. 107164, 2021. [Google Scholar]
3. S. Sladojevic, M. Arsenovic, A. Anderla, D. Culibrk and D. Stefanovic, “Deep neural networks based recognition of plant diseases by leaf image classification,” Computational Intelligence and Neuroscience, vol. 16, no. 5, pp. 1–21, 2016. [Google Scholar]
4. J. M. Cohen, D. J. Civitello, M. D. Venesky, T. A. McMahon and J. R. Rohr, “An interaction between climate change and infectious disease drove widespread amphibian declines,” Global Change Biology, vol. 25, no. 13, pp. 927–937, 2019. [Google Scholar]
5. A. Kamilaris and F. X. Prenafeta-Boldú, “Deep learning in agriculture: A survey,” Computers and Electronics in Agriculture, vol. 147, no. 17, pp. 70–90, 2018. [Google Scholar]
6. Y. Zheng, Q. Zhu, M. Huang, Y. Guo and J. Qin, “Maize and weed classification using color indices with support vector data description in outdoor fields,” Computers and Electronics in Agriculture, vol. 141, no. 26, pp. 215–222, 2017. [Google Scholar]
7. G. Bhadane, S. Sharma and V. B. Nerkar, “Early pest identification in agricultural crops using image processing techniques,” International Journal of Electrical, Electronics and Computer Engineering, vol. 2, no. 7, pp. 77–82, 2013. [Google Scholar]
8. A. Adeel, M. A. Khan, T. Akram, A. Sharif and T. Saba et al., “Entropy-controlled deep features selection framework for grape leaf diseases recognition,” Expert Systems, vol. 11, no. 3, pp. 1–23, 2020. [Google Scholar]
9. V. Singh and A. K. Misra, “Detection of plant leaf diseases using image segmentation and soft computing techniques,” Information Processing in Agriculture, vol. 4, no. 4, pp. 41–49, 2017. [Google Scholar]
10. Y. Abbaspour, A. Aghabara, M. Davari and J. M. Maja, “Feasibility of using computer vision and artificial intelligence techniques in detection of some apple pests and diseases,” Applied Sciences, vol. 12, no. 11, pp. 906, 2022. [Google Scholar]
11. A. M. Mostafa, S. A. Kumar, T. Meraj, H. T. Rauf and A. A. Alnuaim, “Guava disease detection using deep convolutional neural networks: A case study of guava plants,” Applied Sciences, vol. 12, no. 26, pp. 239, 2022. [Google Scholar]
12. R. Saleem, J. H. Shah, M. Sharif, M. Yasmin and J. Cha, “Mango leaf disease recognition and classification using novel segmentation and vein pattern technique,” Applied Sciences, vol. 11, no. 4, pp. 11901, 2021. [Google Scholar]
13. Y. Sun, Y. Liu, H. Zhou and H. Hu, “Plant diseases identification through a discount momentum optimizer in deep learning,” Applied Sciences, vol. 11, no. 21, pp. 9468, 2021. [Google Scholar]
14. Z. Iqbal, M. Sharif, J. H. Shah, M. H. ur Rehman and K. Javed, “An automated detection and classification of citrus plant diseases using image processing techniques: A review,” Computers and Electronics in Agriculture, vol. 153, no. 5, pp. 12–32, 2018. [Google Scholar]
15. I. D. Raji, H. BelloSalau, I. J. Umoh, A. J. Onumanyi and A. T. Salawudeen, “Simple deterministic selection-based genetic algorithm for hyperparameter tuning of machine learning models,” Applied Sciences, vol. 12, no. 26, pp. 1186, 2022. [Google Scholar]
16. D. Bender, D. J. Licht and C. Nataraj, “A novel embedded feature selection and dimensionality reduction method for an SVM type classifier to predict periventricular leukomalacia (PVL) in neonates,” Applied Sciences, vol. 11, no. 2, pp. 11156, 2021. [Google Scholar]
17. J. Ma, K. Du, F. Zheng, L. Zhang and Z. Sun, “A recognition method for cucumber diseases using leaf symptom images based on deep convolutional neural network,” Computers and Electronics in Agriculture, vol. 154, no. 4, pp. 18–24, 2018. [Google Scholar]
18. M. K. Singh, S. Chetia and M. Singh, “Detection and classification of plant leaf diseases in image processing using MATLAB,” International Journal of Life Sciences Research, vol. 5, no. 6, pp. 120–124, 2017. [Google Scholar]
19. V. Sravan, K. Swaraj, K. Meenakshi and P. Kora, “A deep learning based crop disease classification using transfer learning,” Materials Today: Proceedings, vol. 4, no. 1, pp. 1–10, 2021. [Google Scholar]
20. K. K. Chakraborty, R. Mukherjee, C. Chakroborty and K. Bora, “Automated recognition of optical image based potato leaf blight diseases using deep learning,” Physiological and Molecular Plant Pathology, vol. 117, no. 4, pp. 101781, 2022. [Google Scholar]
21. N. E. M. Khalifa, M. H. N. Taha, A. ElMaged and A. E. Hassanien, “Artificial intelligence in potato leaf disease classification: A deep learning approach,” Machine Learning and Big Data Analytics Paradigms, vol. 5, no. 12, pp. 63–79, 2021. [Google Scholar]
22. J. Rashid, I. Khan, G. Ali, S. H. Almotiri and K. Masood, “Multi-level deep learning model for potato leaf disease recognition,” Electronics, vol. 10, no. 2, pp. 2064, 2021. [Google Scholar]
23. R. Thangaraj, S. Anandamurugan and V. K. Kaliappan, “Automated tomato leaf disease classification using transfer learning-based deep convolution neural network,” Journal of Plant Diseases and Protection, vol. 128, no. 8, pp. 73–86, 2021. [Google Scholar]
24. S. Zhang, S. Zhang, C. Zhang, X. Wang and Y. Shi, “Cucumber leaf disease identification with global pooling dilated convolutional neural network,” Computers and Electronics in Agriculture, vol. 162, no. 13, pp. 422–430, 2019. [Google Scholar]
25. S. P. Mohanty, D. P. Hughes and M. Salathé, “Using deep learning for image-based plant disease detection,” Frontiers in Plant Science, vol. 7, no. 2, pp. 1419, 2016. [Google Scholar]
26. A. H. Gandomi, X.-S. Yang and A. H. Alavi, “Cuckoo search algorithm: A metaheuristic approach to solve structural optimization problems,” Engineering with Computers, vol. 29, no. 4, pp. 17–35, 2013. [Google Scholar]
27. N. Hussain, U. Tariq, S. Kadry, M. A. E. Yar and A. M. Mostafa, “Multiclass cucumber leaf diseases recognition using best feature selection,” Computers, Material and Continua, vol. 70, no. 1, pp. 3281–3294, 2022. [Google Scholar]
28. M. A. Khan, A. Alqahtani, A. Khan, S. Alsubai and A. Binbusayyis, “Cucumber leaf diseases recognition using multi level deep entropy-elm feature selection,” Applied Sciences, vol. 12, no. 14, pp. 593, 2022. [Google Scholar]
29. A. Aqeel, A. Hassan, S. Rehman, U. Tariq and S. Kadry, “A long short-term memory biomarker-based prediction framework for Alzheimer’s disease,” Sensors, vol. 22, no. 7, pp. 1475, 2022. [Google Scholar]
30. F. Afza, M. Sharif, U. Tariq, H. S. Yong and J. Cha, “Multiclass skin lesion classification using hybrid deep features selection and extreme learning machine,” Sensors, vol. 22, no. 3, pp. 799, 2022. [Google Scholar]
31. K. Jabeen, M. Alhaisoni, U. Tariq, Y. D. Zhang and A. Hamza, “Breast cancer classification from ultrasound images using probability-based optimal deep learning feature fusion,” Sensors, vol. 22, no. 11, pp. 807, 2022. [Google Scholar]
32. K. Muhammad, M. Sharif, T. Akram and S. Kadry, “Intelligent fusion-assisted skin lesion localization and classification for smart healthcare,” Neural Computing and Applications, vol. 4, no. 2, pp. 1–16, 2021. [Google Scholar]
33. M. Sharif, T. Akram, S. Kadry and C. H. Hsu, “A two-stream deep neural network-based intelligent system for complex skin cancer types classification,” International Journal of Intelligent Systems, vol. 1, no. 3, pp. 1–23, 2021. [Google Scholar]
Cite This Article
 Copyright © 2023 The Author(s). Published by Tech Science Press.
This work is licensed under a Creative Commons Attribution 4.0 International License , which permits unrestricted use, distribution, and reproduction in any medium, provided the original work is properly cited.
 Downloads
 Citation Tools