
 Submit a Paper
 Propose a Special lssue
 Open Access
ARTICLE
Fusion of Feature Ranking Methods for an Effective Intrusion Detection System
1 School of Computer Science and Engineering, VIT-AP University, Andhra Pradesh, India
2 Center of Excellence, AI, and Robotics, VIT-AP University, Andhra Pradesh, India
* Corresponding Author: Seetha Hari. Email:
Computers, Materials & Continua 2023, 76(2), 1721-1744. https://doi.org/10.32604/cmc.2023.040567
Received 23 March 2023; Accepted 19 May 2023; Issue published 30 August 2023
 View Full Text
 Download PDF
Abstract
Expanding internet-connected services has increased cyberattacks, many of which have grave and disastrous repercussions. An Intrusion Detection System (IDS) plays an essential role in network security since it helps to protect the network from vulnerabilities and attacks. Although extensive research was reported in IDS, detecting novel intrusions with optimal features and reducing false alarm rates are still challenging. Therefore, we developed a novel fusion-based feature importance method to reduce the high dimensional feature space, which helps to identify attacks accurately with less false alarm rate. Initially, to improve training data quality, various preprocessing techniques are utilized. The Adaptive Synthetic oversampling technique generates synthetic samples for minority classes. In the proposed fusion-based feature importance, we use different approaches from the filter, wrapper, and embedded methods like mutual information, random forest importance, permutation importance, Shapley Additive exPlanations (SHAP)-based feature importance, and statistical feature importance methods like the difference of mean and median and standard deviation to rank each feature according to its rank. Then by simple plurality voting, the most optimal features are retrieved. Then the optimal features are fed to various models like Extra Tree (ET), Logistic Regression (LR), Support vector Machine (SVM), Decision Tree (DT), and Extreme Gradient Boosting Machine (XGBM). Then the hyperparameters of classification models are tuned with Halving Random Search cross-validation to enhance the performance. The experiments were carried out on the original imbalanced data and balanced data. The outcomes demonstrate that the balanced data scenario knocked out the imbalanced data. Finally, the experimental analysis proved that our proposed fusion-based feature importance performed well with XGBM giving an accuracy of 99.86%, 99.68%, and 92.4%, with 9, 7 and 8 features by training time of 1.5, 4.5 and 5.5 s on Network Security Laboratory-Knowledge Discovery in Databases (NSL-KDD), Canadian Institute for Cybersecurity (CIC-IDS 2017), and UNSW-NB15, datasets respectively. In addition, the suggested technique has been examined and contrasted with the state of art methods on three datasets.Keywords
The rapid advancement of network-based technologies and their applications has resulted in many risks and illegal activities. Cyber scamming, crypto trojans, and phishing are examples of frequent yet dangerous cyber assaults that deliberately seek out and exploit the user’s sensitive data [1]. Innovation in security mechanisms is required to address these issues. According to an IBM security report, the overall average cost of a data breach worldwide climbed to $4.35 million in 2022, as shown in Fig. 1 [2]. By observing Fig. 1, it is evident that the average cost of the data breach increased by 12.7% from 2020 to 2022, from $3.86 million to $4.35 million.
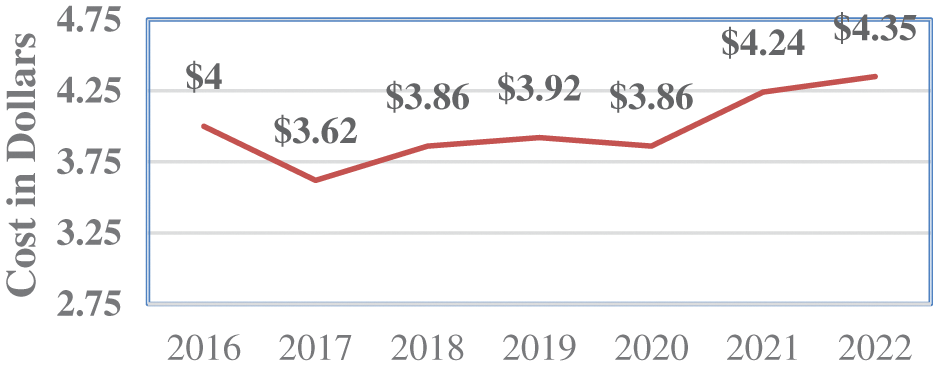
Figure 1: The total average cost of a data breach globally [2]
Furthermore, according to checkpoint research [3], education and research are still the most targeted sectors. These organizations experience an average of 2,297 attacks per week, a rise of 44% from 2021. Furthermore, healthcare remains one of the most targeted sectors globally, with a 69% rise from 2021.
Even though security procedures are now more widely recognized, no network can be completely secure with current technologies. Various security mechanisms, including firewalls, data encryption, and user authentication, are employed to stop cyberattacks, yet the frequency of attacks is rising daily rather than decreasing [4]. In this regard, intrusion detection systems are one of the solutions regularly used to monitor the network, identify potential threats, and find security flaws [5]. The two primary classes of attack identification are signature-based and anomaly-based.
Signature-Based: The attack signatures that distinguish legitimate traffic from malicious traffic are identified using signature-based detection techniques, which depend on known attack patterns for identification. Popular signature-based detection methods are Spectral analysis, SNORT, and Bro network analysis framework [6].
Anomaly-Based: This approach is based on characterizing network behaviour. If network behaviour follows the established behaviour, it is either acknowledged or triggered by an anomaly detection event. The anomaly-based IDSs thought to be adaptable, although they have a significant risk of generating false positives [7].
Network traffic has increased significantly in quantity, features, and frequency. Thus, it is challenging to classify network traffic. Various IDS datasets are generated by collecting unprocessed network traffic to analyze the network traffic [8]. Several networking tools, including Wireshark and Nmap, are utilized [9] and stored as Tcpdump or PCAP files to record raw network data. As a result, the IDS datasets used to evaluate performance include high-dimensional network feature space [10]. Bellman observed that the “curse of dimensionality” is a slew of issues caused when processing high-dimensional data [11].
In recent years, the dimensionality of datasets utilized in machine learning (ML) applications has grown significantly [12]. Because of the enormous search space, it is challenging to retrieve pertinent information about a particular area of interest [13]. Therefore, feature selection is essential in dealing with massive datasets by discarding irrelevant and duplicated data. The added benefits of feature selection are conserving storage space, improving computation time, boosting the classification models’ predictive accuracy, and making them easier to understand [14].
Feature selection (FeS) approaches shrink the initial feature space without transforming it, preserving the original attributes and allowing for coherent interpretation. Other advantages of FeS include producing models with fewer attributes that are simpler to interpret, easier to visualize, and require less memory [15]. Feature selection methods are of three categories such as filter, wrapper, and embedded forms. Filter techniques utilize statistical data-dependent methods to choose the best feature subset for classification. These approaches are computationally quick and independent of the classifier type, but they overlook the significance of various dimensions when selecting the best feature set [16].
On the other hand, wrapper-based feature selection techniques use the classification model to identify optimal feature subsets. But these wrapper methods have limitations, including a high computational cost and the possibility of overfitting. Finally, embedded-based approaches handle feature selection and classification simultaneously, and they do so as a part of the training process. Based on the significance of the extracted characteristics, it chooses the best features [17].
An IDS can detect anomalies depending on how many features it has. Data mining and ML approaches aim to improve detection accuracy and decrease the false positive rate for IDS. The current algorithms failed to identify the network breach despite employing all the attributes. Therefore, we proposed a fusion of feature selection methods for determining the most significant features contributing to a model’s predictive accuracy. This strategy combines the results of multiple feature selection methods to generate more robust and precise features. The scientific basis of the proposed method is that a fundamental hypothesis says that merging the outcomes of various feature selection methods can produce more trustworthy features. The fusion of feature selection methods mitigates the risk of overfitting, removes irrelevant features and enhances the model performance.
Therefore, in this work, we propose a fusion of feature ranking methods based on the feature importance, such as mutual information importance (MI), permutation importance (PI), random forest importance (RFI), SHAP feature importance (SFI), and statistical methods like the difference between mean and median (DMM) and standard deviation (SD).
The critical contributions of this proposed work are as follows:
• This research aims to provide a fast and efficient Intrusion detection mechanism.
• Handled imbalanced data by generating synthetic samples for better classification performance.
• Proposed a fusion of feature ranking techniques to select the optimal subset of features.
• The detection performance of the suggested technique was compared with the existing state-of-the-art methods.
The structure of the article is as follows. Section 2 reflects the literature survey. Section 3 states the proposed method. Section 4 shows the experimental results and analysis. Section 5 shows the summary of the proposed work.
Several IDS and classification strategies have been used in recent decades to produce quicker and more accurate results.
Osanaiye et al. [18] proposed a filter-based ensemble feature selection method for detecting cloud Distributed Denial of Service attacks. They used filter-based methods like chi-squared (Chi2), gain ratio (GR), information gain (IG), and Relief techniques to identify essential features. Then 13 attributes are selected from four feature selection methods. Finally, the optimal features are trained using a decision tree (DT) classifier and detected attacks accurately. But they have not addressed the class imbalance in the NSL-KDD dataset. Bansal et al. [19] proposed an IDS based on XGBM for detecting Denial-of-Service attacks in the network. They further tweaked the XGBM parameters to optimize performance by employing a sparse matrix and flags on every potential value. They have conducted multiple experiments on the CIC-IDS 2017 dataset.
Kannari et al. [20] proposed an IDS to reduce the detection model computation time and resource usage. Initially, they used recursive feature elimination to remove the irrelevant features, and they selected 21 most essential attributes out of 42 of the NSL-KDD Dataset. The optimal features are passed to RF to detect attacks in the network effectively. Najar [21] proposed an IDS to detect attacks on the NSL-KDD Dataset. They used Random Forest (RF) and multilayer perceptron (MLP) to classify the attack. Initially, they used principal component analysis and extracted ten optimal features. Further, the optimal features are passed to RF to identify binary attacks. Kasongo et al. [22] proposed a wireless IDS for providing security to various communication infrastructures by applying a wrapper-based feature extraction unit with a base classifier as an ET. Then the optimal feature vector is trained using the feed-forward deep neural network. They tested the model on UNSW-NB15 and the AWID datasets. Their experimental results proved that their model performs better.
Saha et al. [23] proposed an ensemble feature selection technique to train various machine learning, deep learning, and unsupervised learning methods by using them. They have conducted multiple experiments on UNSW-NB 15, and their results proved that neural networks (NN), long-short-term memory networks (LSTM), and Gated Recurrent Units (GRU) outperformed other methods. Mhawi et al. [24] proposed a hybrid feature selection method by combining correlation feature selection with RF. The optimal features fed to K-Nearest Neighbor (KNN), SVM, RF, and Naive Bayes (NB). These four improved classifiers have been used as AdaBoosting and bagging by employing the average voting method. They tested the model with two feature subsets containing 13 and 30 features on CIC-IDS 2017 data set. Their results showed that with 30 optimal features, the model detects attacks accurately.
Ali et al. [25] proposed a soft voting mechanism using an AutoML concept to identify network intrusions. Initially, they used various sampling methods to handle class imbalance. Gradient Boost, RF, Extra Tree, and MLP were employed to create a soft-voting model for classification. They tested the model on UNSW-NB 15 and CIC-IDS 2017 datasets. Henry et al. [26] suggested an IDS based on Convolution neural networks and Gated Recurrent Unit (CNN-GRU). Pearson’s Correlation is applied to remove the correlated features. Then the optimal features are trained by using (CNN-GRU). They have conducted multiple experiments on CIC-IDS 2017 dataset. Table 1 shows the summary of the literature survey.

Selecting relevant features is a challenging task in IDS since no single feature selection algorithm gives optimal features that would show predictive performance and be robust changes to the input data. Various ensemble feature approaches have been explored in the literature, but the novel fusion of feature selection methods could still enhance the model’s performance. Further, most studies did not consider the classification’s training (Tr.) and testing (Te.) time. Therefore, to overcome these issues in the proposed work, we used various feature ranking methods and determined the most frequently contributed features, which enhanced the prediction accuracy.
This section includes a detailed discussion of the suggested methodology. Fig. 2 provides the framework of the proposed model.
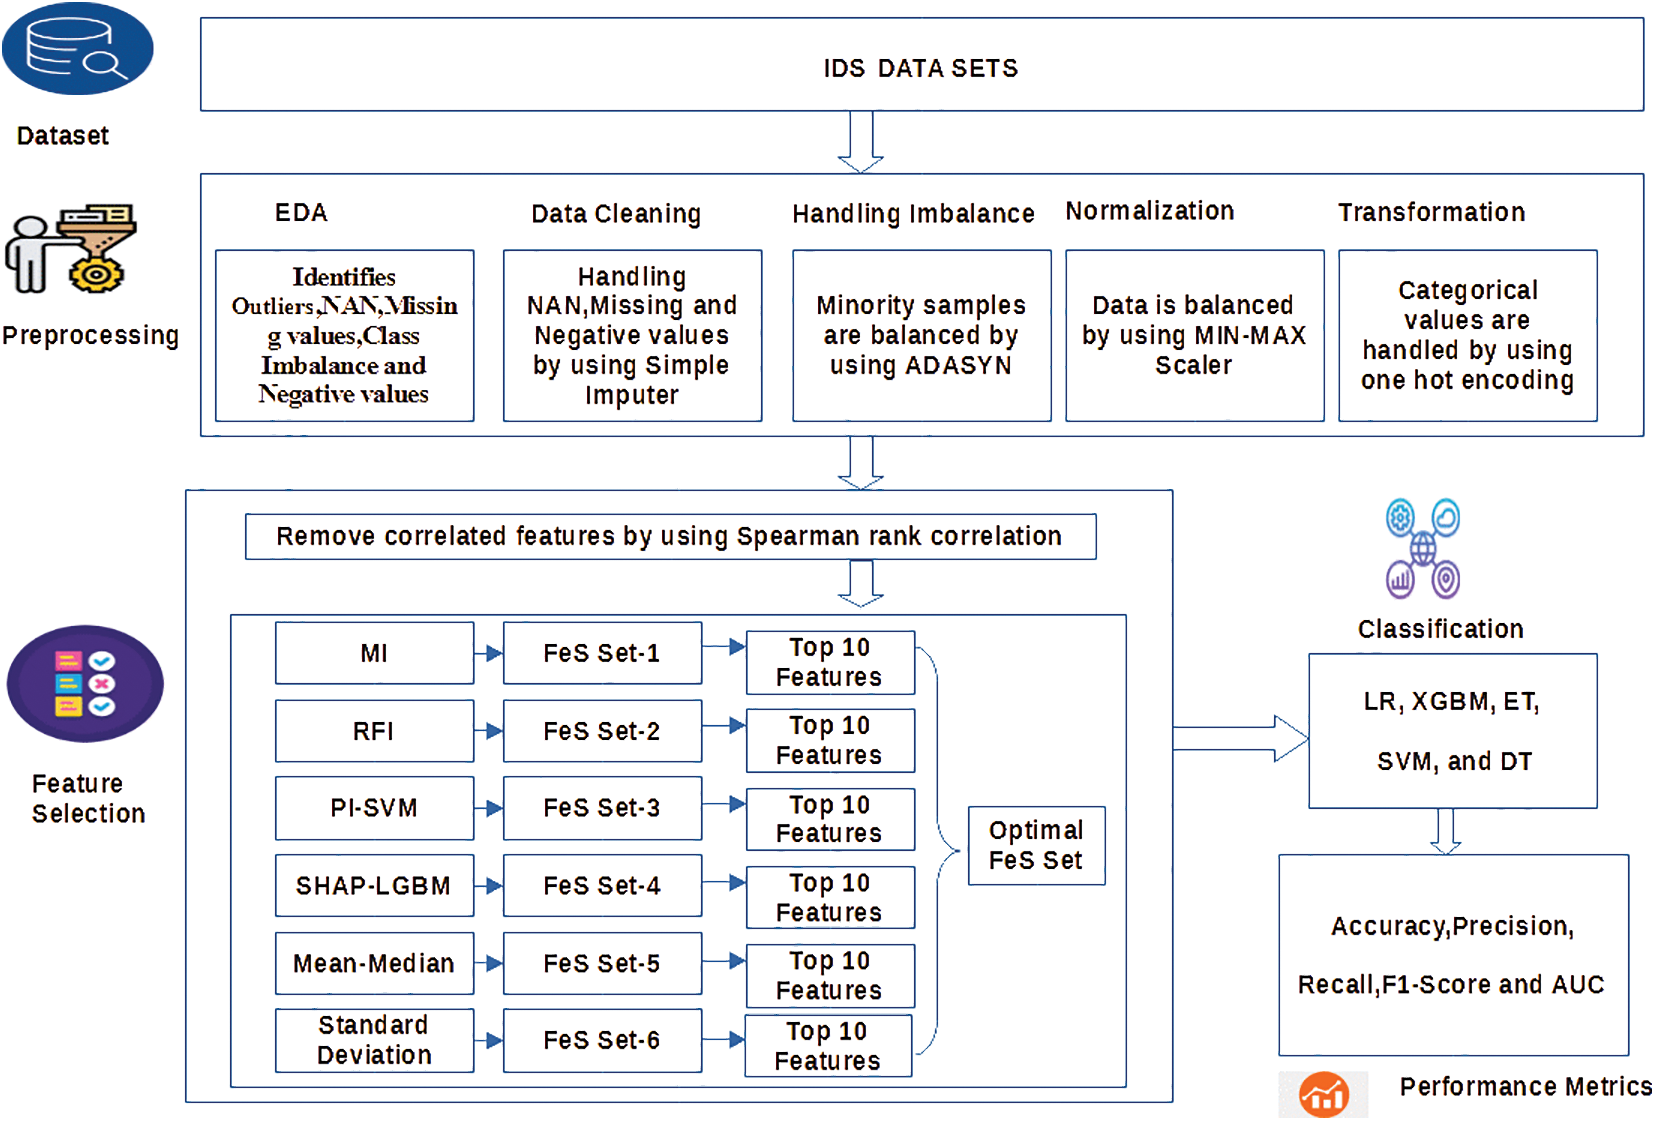
Figure 2: The proposed IDS framework
NSL-KDD, UNSW NB-15, and CICIDS-2017 are three intrusion detection datasets used to evaluate the effectiveness of the proposed method. These datasets comprised various network characteristics generated by multiple network configurations. Additionally, these datasets include both synthetic and authentic network traffic. As a result, the effectiveness of the suggested approach can be unambiguously supported by employing diverse network traffic from three independent datasets. The following is a quick explanation of each dataset.
Tavallaee et al. [27] suggested NSLKDD as a replacement for KDD Cup 99. NSL-KDD has developed from the KDD CUP 99 dataset by eliminating missing and redundant samples to reduce classifier bias. It contains 42 features, including class labels, divided into four main categories: time-based network traffic statistical features, Transmission Control Protocol Connection features, host-based operating features, and host-based network traffic statistical features. The NSL-KDD Dataset includes separate training and test datasets with 125,973 and 22,544 data samples, respectively. Further, it contains four different types of attacks Denial of Service (DoS), Probe, Remote to Local (R2L), and User to Root (U2R) attacks. This work considers a training data set for experimental analysis.
Moustafa [28] generated this dataset by setting up the synthetic infrastructure at the Australian Centre for Cyber Security using the IXIA tool. ‘Tcpdump’ was used to record 100 GB of unprocessed network traffic. Twelve models are used to extract the features using the Argus and Bro-IDS tools. The dataset comprises 2.5 million records, covering nine attack classes and one normal class: backdoor, analysis, DoS, Fuzzers, generic, reconnaissance, exploits, worms, and shellcode. It has 49 features divided into six categories: time, flow, content, basic, labelled, and additional generated features. For experimental analysis, we have considered UNSW-NB 15 training and testing datasets which contain 175341 and 82332 records.
Sharafaldin et al. [8] generated CIC-IDS 2017 IDS dataset by producing and collecting network traffic. The dataset includes regular traffic and traffic generated by fourteen attacks collected in five days. They used the B-profile technique to produce benign human web activity and generate standard Hypertext Transfer Protocol Secure (HTTPS), Hypertext Transfer Protocol (HTTP), Secure Shell (SSH), and File Transfer Protocol (FTP) traffic. The entire CICIDS-2017 dataset comprises eight CSV files comprising 22,73,097 normal and 5,57,646 attack samples. It contains 80 features collected with the CICFlowMeter. Further, it has seven attack categories: DoS, Distributed Denial-of-Service (DDoS), Patator, Web attacks, Infiltration, Bot, and Portscan attacks. As the original dataset was more, this work considers a subset for experimental evaluation.
It is a crucial phase in any ML model that aids in enhancing data quality and extracts insightful knowledge from the data. Preprocessing entails cleaning and organizing raw data to make it suitable for building and training ML models. It consists of the following stages, which are detailed more below.
3.2.1 Exploratory-Data-Analysis (EDA)
It interprets datasets by summarizing their essential properties and frequently visualizing them. This process is crucial, especially when modelling the data using machine learning. We identified the data type by performing EDA on NSL-KDD, UNSW-NB15, and CIC-IDS2017. They contain duplicate records and class imbalance. Further, the CIC-IDS 2017 dataset has Not a Number (NaN), missing and negative values.
3.2.2 Data Cleaning/Handling Noisy Data
Most machine learning algorithms demand samples with no missing data. Because model accuracy is affected when data contains missing values or noise. The suggested work eliminates duplicates to reduce computation overheads. Then missing or NaN, inf, and negative values are handled using mean imputation, where mean imputation minimizes the variance of the imputed values.
The datasets include categorical features. Non-numerical data is converted into numerical ones using the Label Encoding approach because machine learning algorithms can interpret numerical values. It will change every distinct non-numerical value of an attribute to an integer, starting from 0 to n−1.
Data normalization entails scaling the value of each feature into a well-proportioned range to remove the bias in favour of characteristics with higher values from the dataset. In this study, we employed a Min-Max scaler, which shortens the attributes to a range while preserving the actual distribution. The values are tweaked to have the highest value be one and the lowest value is zero. The mathematical notation form is
where S is the sample.
When performing EDA, we observed that the three datasets contain a class imbalance (CIb). The classifier’s performance drops when there are proportionally more negative samples than positive ones. Various methods are used in literature for balancing minority classes, which improves the misclassification penalty. In this work, we used Adaptive synthetic sampling (ADASYN) [29], an oversampling method, to balance the minority class samples.

3.3 Proposed Feature Selection
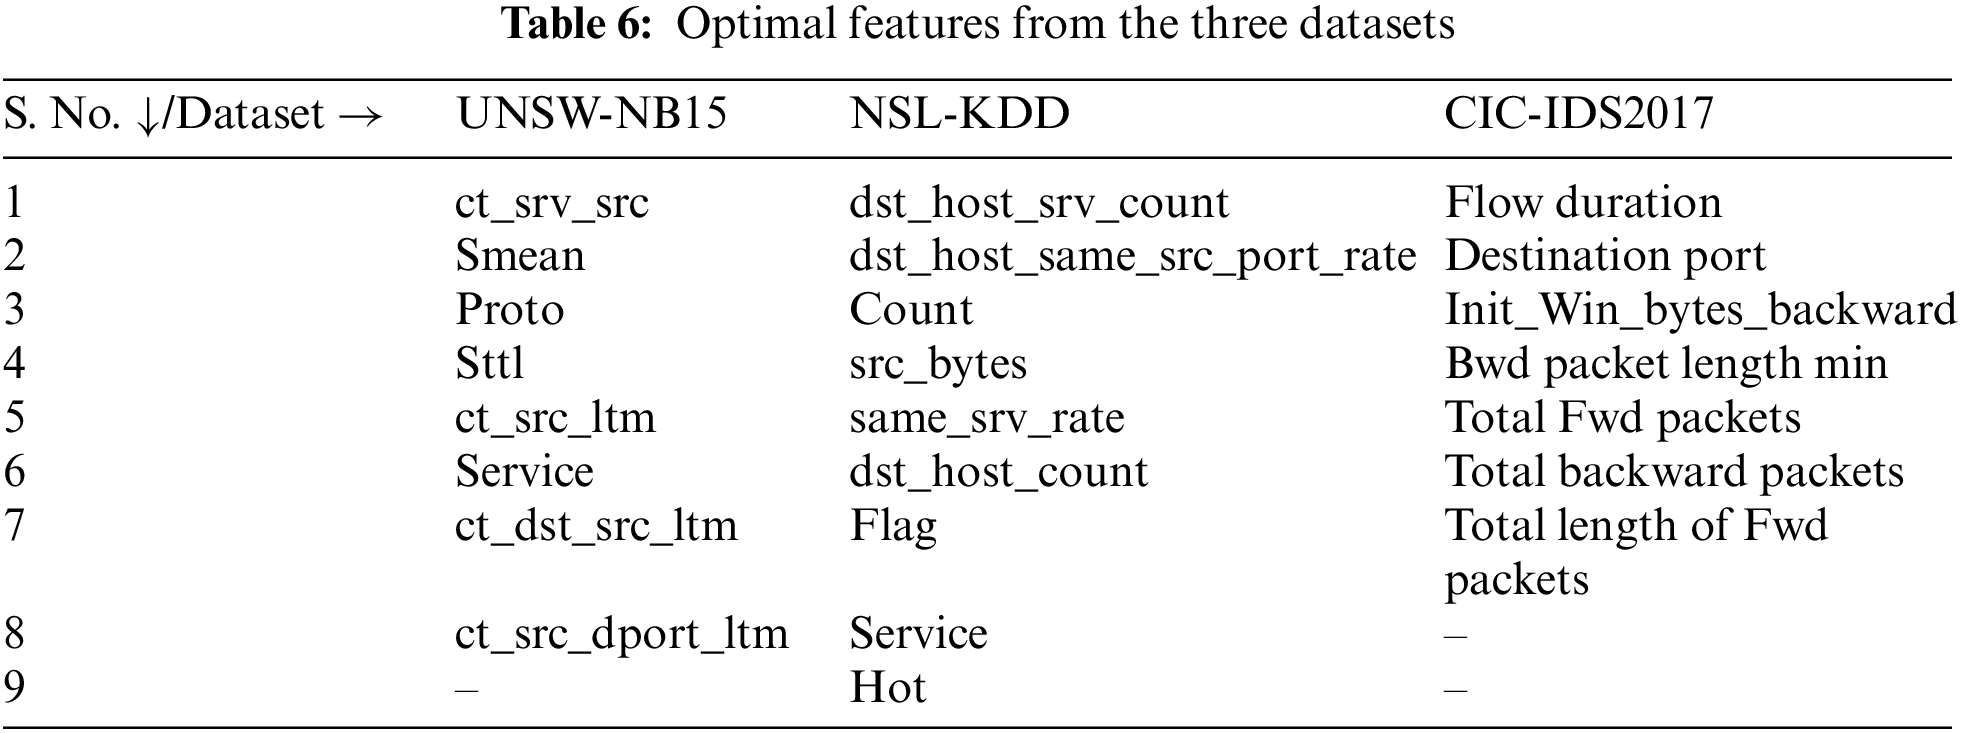
Previous studies showed that single feature selection techniques could have distinct biases, whereas fusion of feature ranking has the advantage of mitigating and compensating for these biases. We used Spearman rank correlation to remove the correlated features in the proposed work. Further, we employed feature ranking methods like mutual information, permutation, random forest, SHAP feature importance, and statistical techniques like the difference between mean, median, and standard deviation. The hyper paraments of feature ranking methods are tuned using Halving Random Search CV. Table 2 shows the optimal parameters. The top contributed features of each feature importance method are depicted in Tables 3–5 for the three datasets. The attributes common in the four ranking techniques are selected as optimal features and shown in Table 6. The proposed feature selection process is in Algorithm 2.


3.3.1 Feature Selection Methods Used for Fusion
a) Mutual Information (MI)
MI can be employed in information theory to evaluate any arbitrary dependency between random variables [30]. It specifically evaluates the average amount of information transmitted between two random variables. If two random variables, S and Y, are independent, if S does not contain any information about Y and vice versa, then MI is zero. The mathematical form of MI is
where H(S), H(T) are the entropy of the random variables.
Entropy is the degree of uncertainty in its information, and its mathematical form is
where P(s) is the probability distribution.
The entropy of a combined probability distribution or a multi-valued random variable is known as joint entropy, and its mathematical form is
where
Conditional entropy
where
b) Standard Deviation (SD)
It is a statistical technique that measures how far attributes deviate from the mean. The examination of SD reveals that a high value for the SD says that the feature values are dispersed across an extensive range of values. A low value for the SD suggests that the feature values are nearer to the mean [31]. As a result, feature selection using SD selects features with a high SD value because successful prediction outcomes can be determined when the values are over a broad spectrum. The SD of a feature sm is determined by
where k = 1, 2, 3,..., d; i = 1, 2, 3,..., n;
c) Difference Between Mean and Median (DMM)
They are descriptive statistical indicators used to characterize data distribution. Furthermore, these statistical metrics represent the relative magnitude of variation in a data distribution [32]. De Nijs et al. [33] stated that the difference between the mean and median can use as feature selection. The mathematical form is
Examining the mean-median difference reveals that a high difference value implies variance over an extensive range of values. Hence attributes with a high difference value can be regarded as a significant feature for successful prediction and classification [34].
d) Random Forest Feature Importance (RFI):
An ensemble classifier known as Random Forest supports a variety of feature relevance metrics and is constructed using several decision trees [35]. Feature selection is made directly by Random Forest while a classification rule is applied. Gini significance index (GI) and permutation importance index are the two typically employed feature importance measures in RFI. We used GI-based RFI to extract the feature importance in the proposed work. Gini impurity illustrates how effectively a split divides the total samples of binary classes in a given node. The mathematical form of GI is
The drop in Gini impurity caused by the best split
where GI(f) is the gini importance of a feature f.
e) Permutation Importance (PI)
Breiman [35] suggested PI for RFI. Using this methodology, Fisher et al. [36] presented a model-agnostic feature importance. According to that approach, a model
1) Calculate model error on the feature set S;
2) For every feature,
3) Permute feature
It dissociates the feature from the actual outcome y.
4) Using the permuted data’s predictions as a basis, estimate error
5) Evaluate the permutation importance (
f) Shapley Additive exPlanations (SHAP)
An idea from game theory [37] was adapted to create the unified model SHAP framework, which was put forth by Lundberg et al. [38] for interpreting predictions. Regarding computing, SHAP results in Shapley values, linear combinations of binary variables representing model predictions. Consider a scenario S is a subset of n features. X = {xi/lɛ[1,…n]} reflects the dataset’s feature values vector. The payout of the S features values is denoted by
The Shapely value measures the average strength with which an attribute influences predictions. SHAP aims to calculate each feature’s contribution to the forecast, and the mathematical form is
where M is the ML model. In this work, we used a Light gradient boosting machine (LGBM) as a base classifier, y’ ɛ {0, 1}M is the coalition vector of the attributes utilized, M represents the largest coalition size, and
The proposed model was executed on Windows 10 Pro, Intel Core i7–10750H processor running at 2.60 GHz with 64 GB RAM and contains 2 GB of GeForce GTX 1080 Ti graphics. The experimental environment uses Python 3.8 programming language and libraries. The proposed model was analyzed using three publicly available datasets mentioned in Section 3.1. To analyze the performance of the proposed model, we carried out experiments in two cases as
1) Performance evaluation on imbalanced data with optimal features.
2) Performance evaluation on balanced data with optimal features
4.1 Performance Evaluation of Imbalanced Data with Optimal Features
The fusion of feature ranking method is used to select the essential features, where the top contributed attributes are chosen based on the occurrence frequency specified by the threshold (

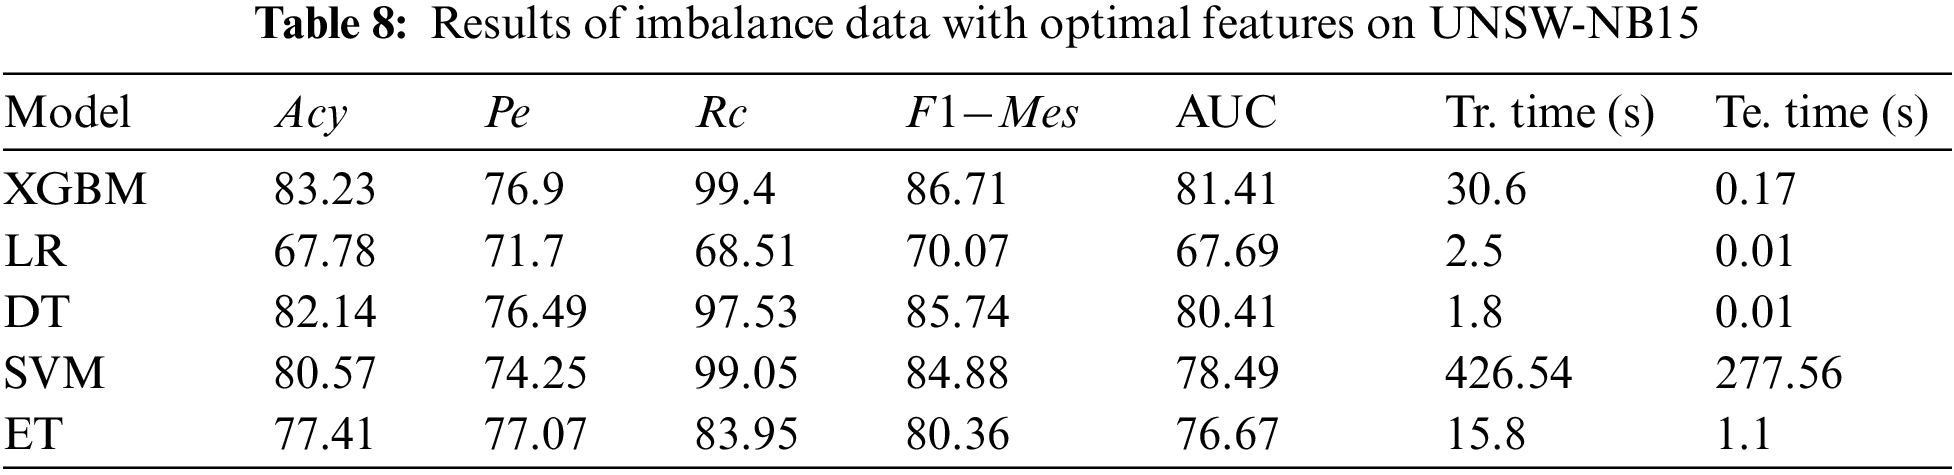

It is observed from Table 7–9 most of the model’s accuracy was reasonable and, in some cases, even better than balanced data. However, due to an imbalance in the data, the models in this instance are skewed towards the majority class samples. Data is to be unreliable, noisy, and unpredictable, with variations in format.
However, dealing with unbalanced data F1-Mes is also a crucial measure to consider. Among the models, XGBM performs better with an accuracy of 99.02%, 83.23%, and 99.93% with NSL-KDD, UNSW-NB15, and CIC-IDS 2017 datasets, respectively. But by observing F1-Mes, and Rc, they are not up to the mark; this may happen due to fewer minority samples. On the other hand, LR performance was not good compared to other models due to fewer minority instances. LR claims 87.33%, 67.78%, and 98.23% accuracy for the three datasets, NSL-KDD, UNSW-NB15, and CIC-IDS 2017.
4.2 Performance Evaluation on Balanced Data with Optimal Features
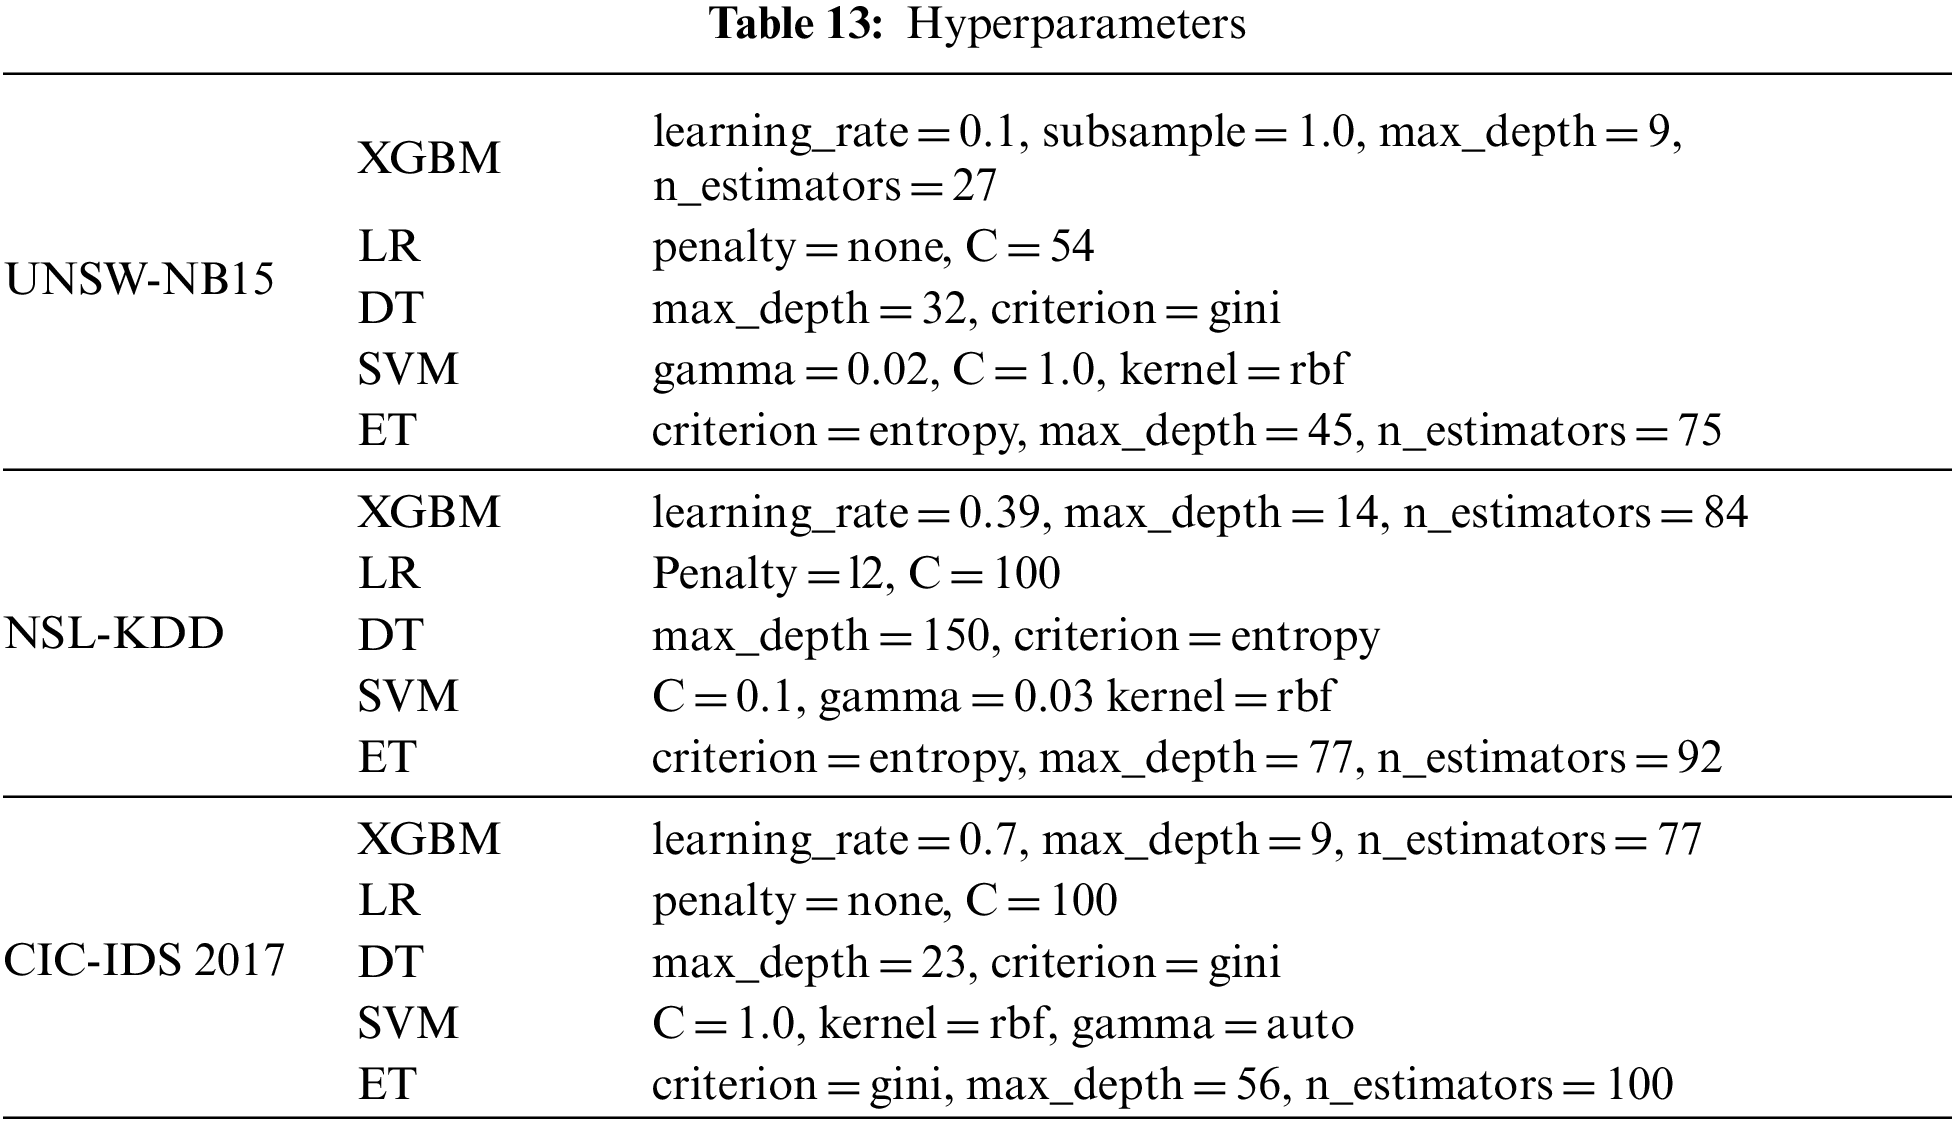
To improve the performance of Acy, Pe, Rc, and F1-Mes, we balanced the minority samples by using an over-sampling ADASYN technique, which increases the minority class samples, to address the imbalance issues. Tables 10–12 show the results obtained on balanced data with optimal features. The ADASYN approach not only minimizes the learning bias brought on by the initial imbalanced data distribution, but it may also adaptively adjust the decision boundary. Further, the ML models’ hyperparameters are tuned using a halving random search CV to enhance the performance, as shown in Table 13. Halving Random Search CV employs sequential halving (SH) to search parameter space. SH is similar to a game among possible parameter combinations. SH is an iterative selection procedure considering all parameter combinations with limited resources during the first iteration. Then a subset of these parameters is used for the following iteration, which will receive more resources. The number of training samples is often the resource for parameter tweaking.

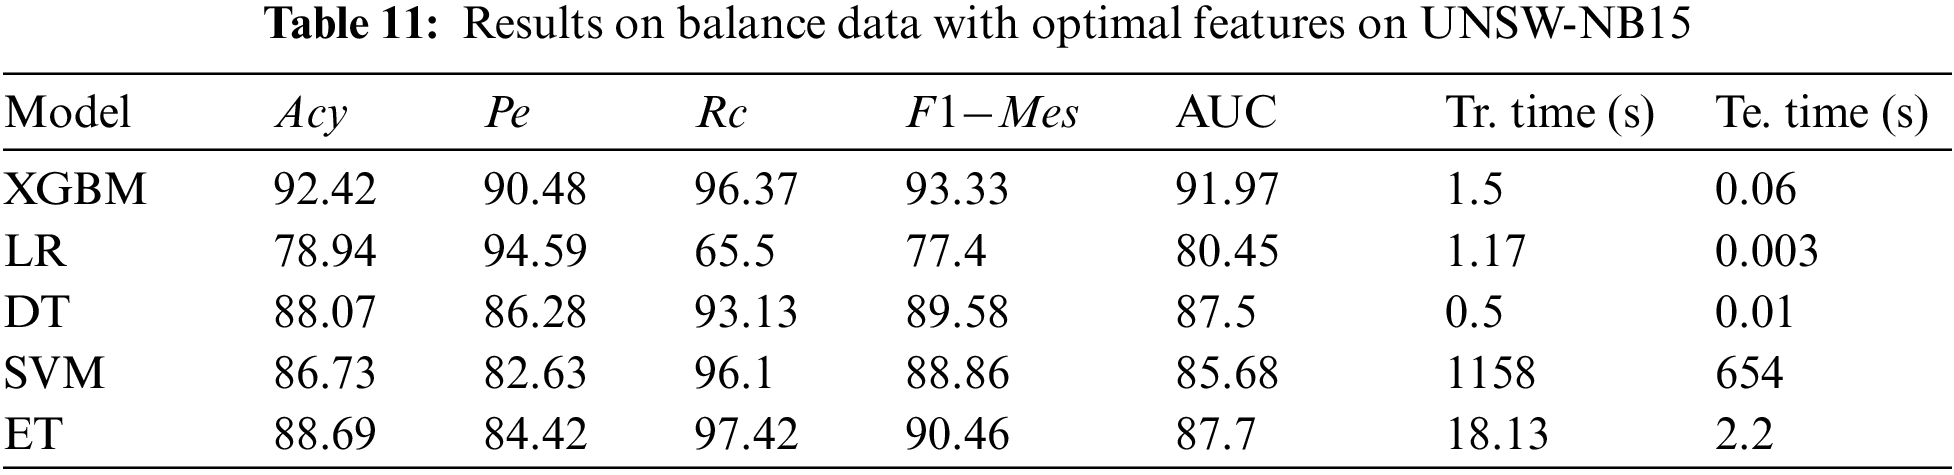

Once the data is balanced and hyperparameters are tuned, we observed the detection rate improved in three data sets. By analyzing experimental results, SVM takes more training time when compared with imbalanced data. Because when there is an imbalance in the data, the SVM can get biased towards the majority class samples, resulting in poor classification results. To solve this problem, we applied an oversampling technique ADASYNC to balance the dataset. This method raises the number of minority samples in the dataset, which can lengthen the time required for SVM training. It may happen because the SVM needs to consider all the instances in the dataset to locate the decision border between the classes during training. When there are more samples, the SVM’s computational complexity increases, making the training process take significantly longer. At the same time, DT and LR take less training time. But when compared with other performance metrics, XGBM performs better. XGBM performs better with all three datasets by comparing imbalance and balanced data cases because the XGBM tree employs a series of decision trees, each learning from the tree before it and influencing the currently processed tree.
Consequently, they make the model more robust and produce an effective learner. By observing the experimental results of the CIC-IDS 2017 data set from Tables 9 and 12, In the case of imbalanced data, the accuracy of XGBM, SVM, ET, and DT was higher when compared to the balanced data. It may happen due to more majority samples, and the models are biased towards majority samples, but when observing precision, recall,
Fig. 3 shows accuracy and F1-Mes comparison on the three datasets with the XGBM classifier. When ADASYN increased the minority samples, accuracy improved by 9.19% on UNSW-NB15% and 0.84% on NSL-KDD datasets. F1-Mes raises by 6.62% on UNSW-NB15%, 0.95% on NSL-KDD, and 1.98% on CIC-IDs 2017 data sets, respectively.
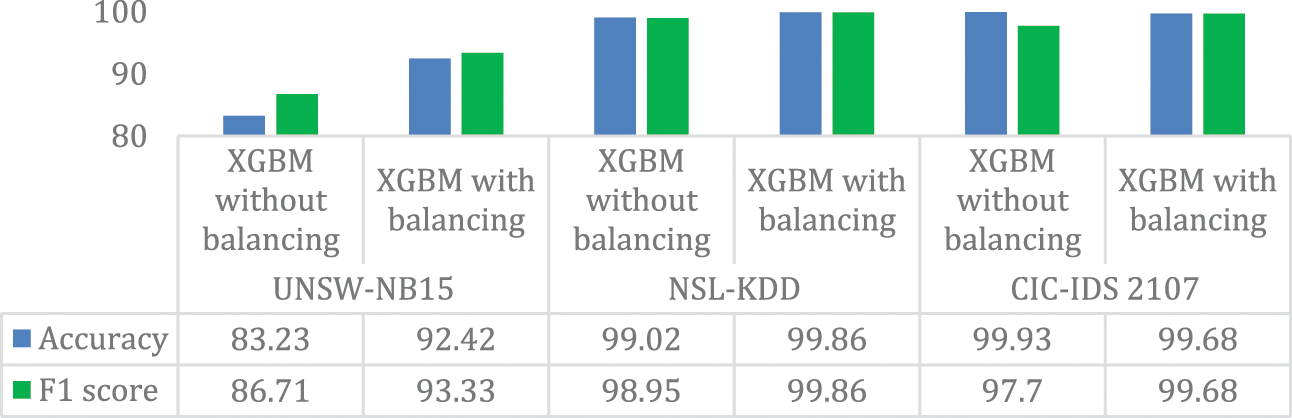
Figure 3: Analysis of the proposed model on imbalance and balanced data
To examine the proposed model detection, we plot AUC (Area Under the Curve) and ROC (Receiver Operating Characteristic) curves as depicted in Figs. 4–6 for the three balanced datasets. The AUC-ROC curve is a statistic for evaluating binary classification tasks. Where ROC is a probability curve, AUC represents the degree of separability. It illustrates the True Positive Rate (TPR) against False Positive Rate (FPR) on the y and x-axis at various threshold levels. Hence, a higher AUC suggests that a model has an excellent detecting capabilities rate.

Figure 4: ROC curve proposed feature selection with XGBM on NSL-KDD
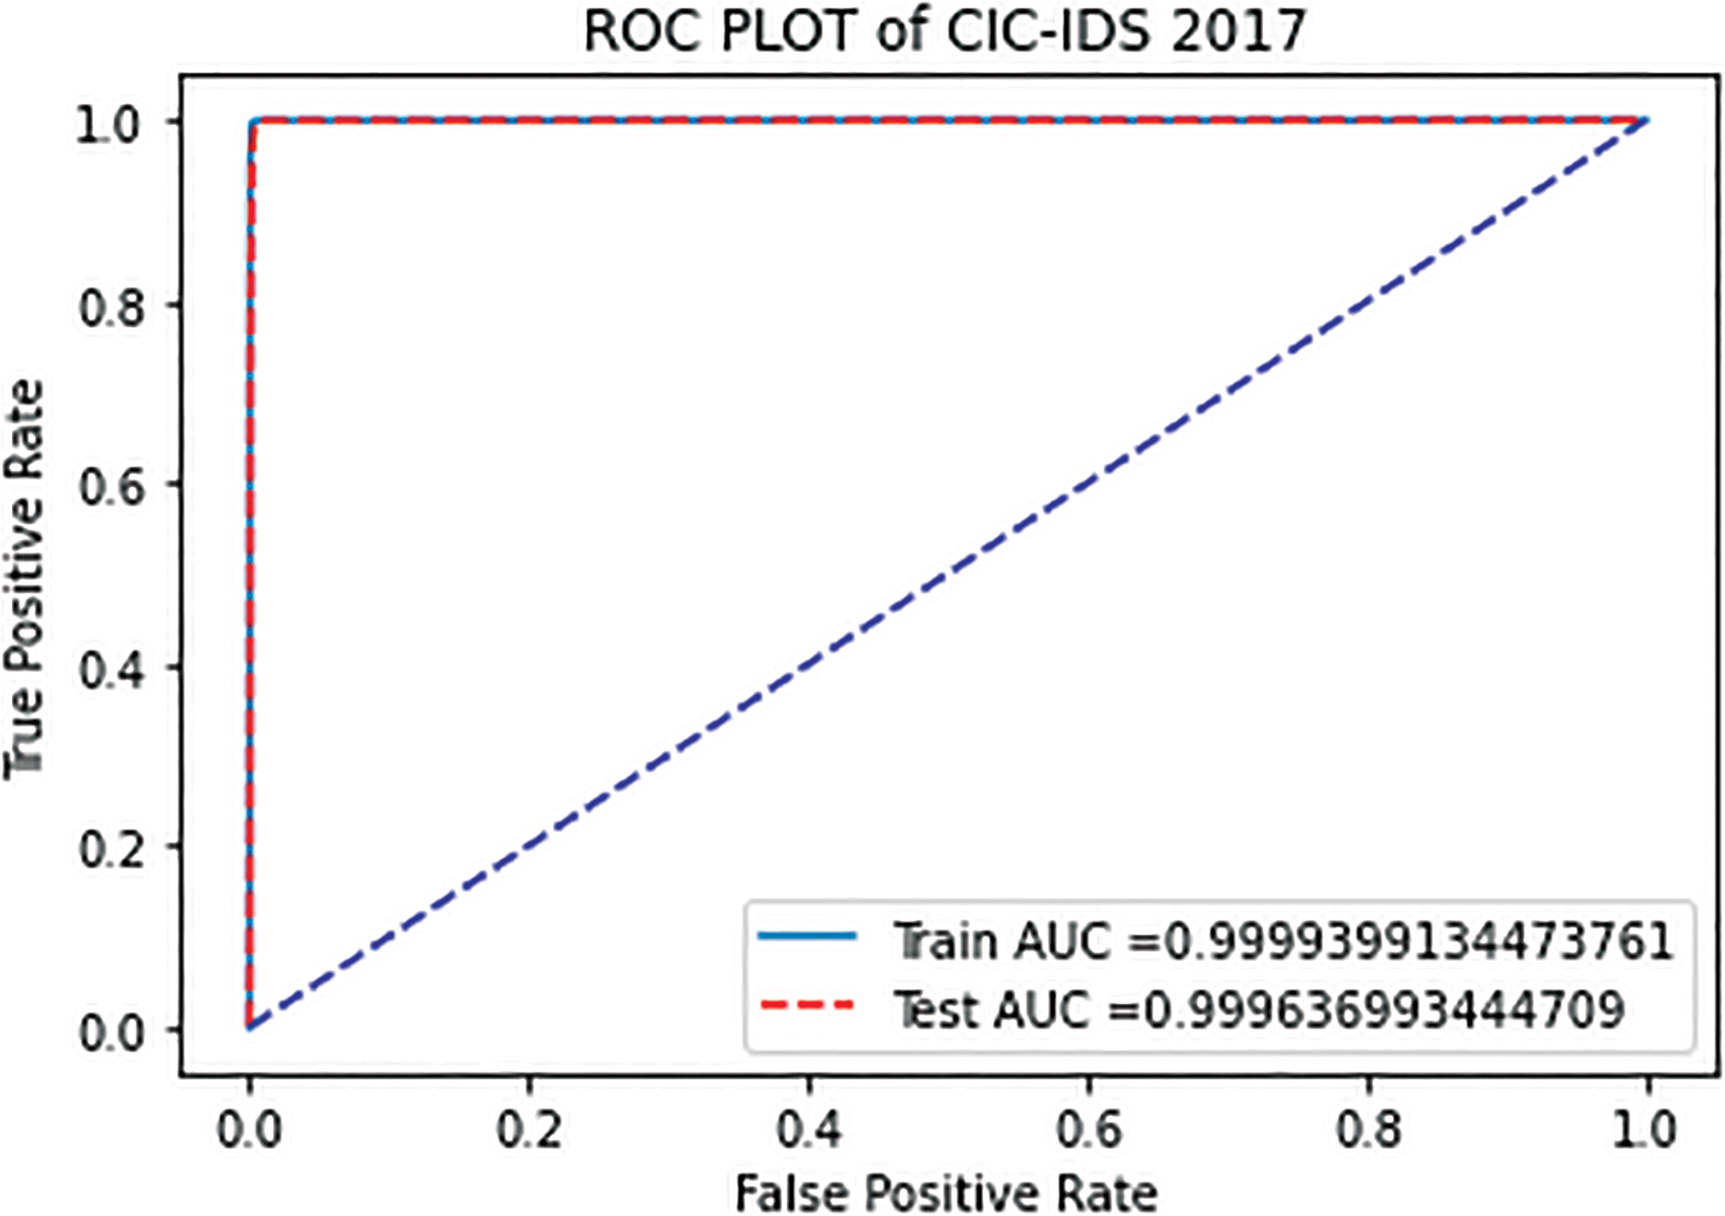
Figure 5: ROC curve proposed feature selection with XGBM on CIC-IDS 2017

Figure 6: ROC curve proposed feature selection with XGBM on UNSW-NB 15
By observing Figs. 4–6, ROC curves of the three datasets are in the upper left corner of the graph, indicating the detection rate is higher with less false alarm rate. We observed that AUC values are more than 0.9 for three data sets implying that our proposed feature selection model functions most effectively using XGBM with optimal features. Based on the findings, it is possible to conclude that the performance of the proposed model is superior in terms of accuracy, precision, and recall.
Further, we compare the proposed feature selection method with existing feature extraction and selection methods [39], like Pearson correlation coefficient (PCC), Information Gain (IG), and Principal component analysis (PCA). Table 14 shows the comparison results.
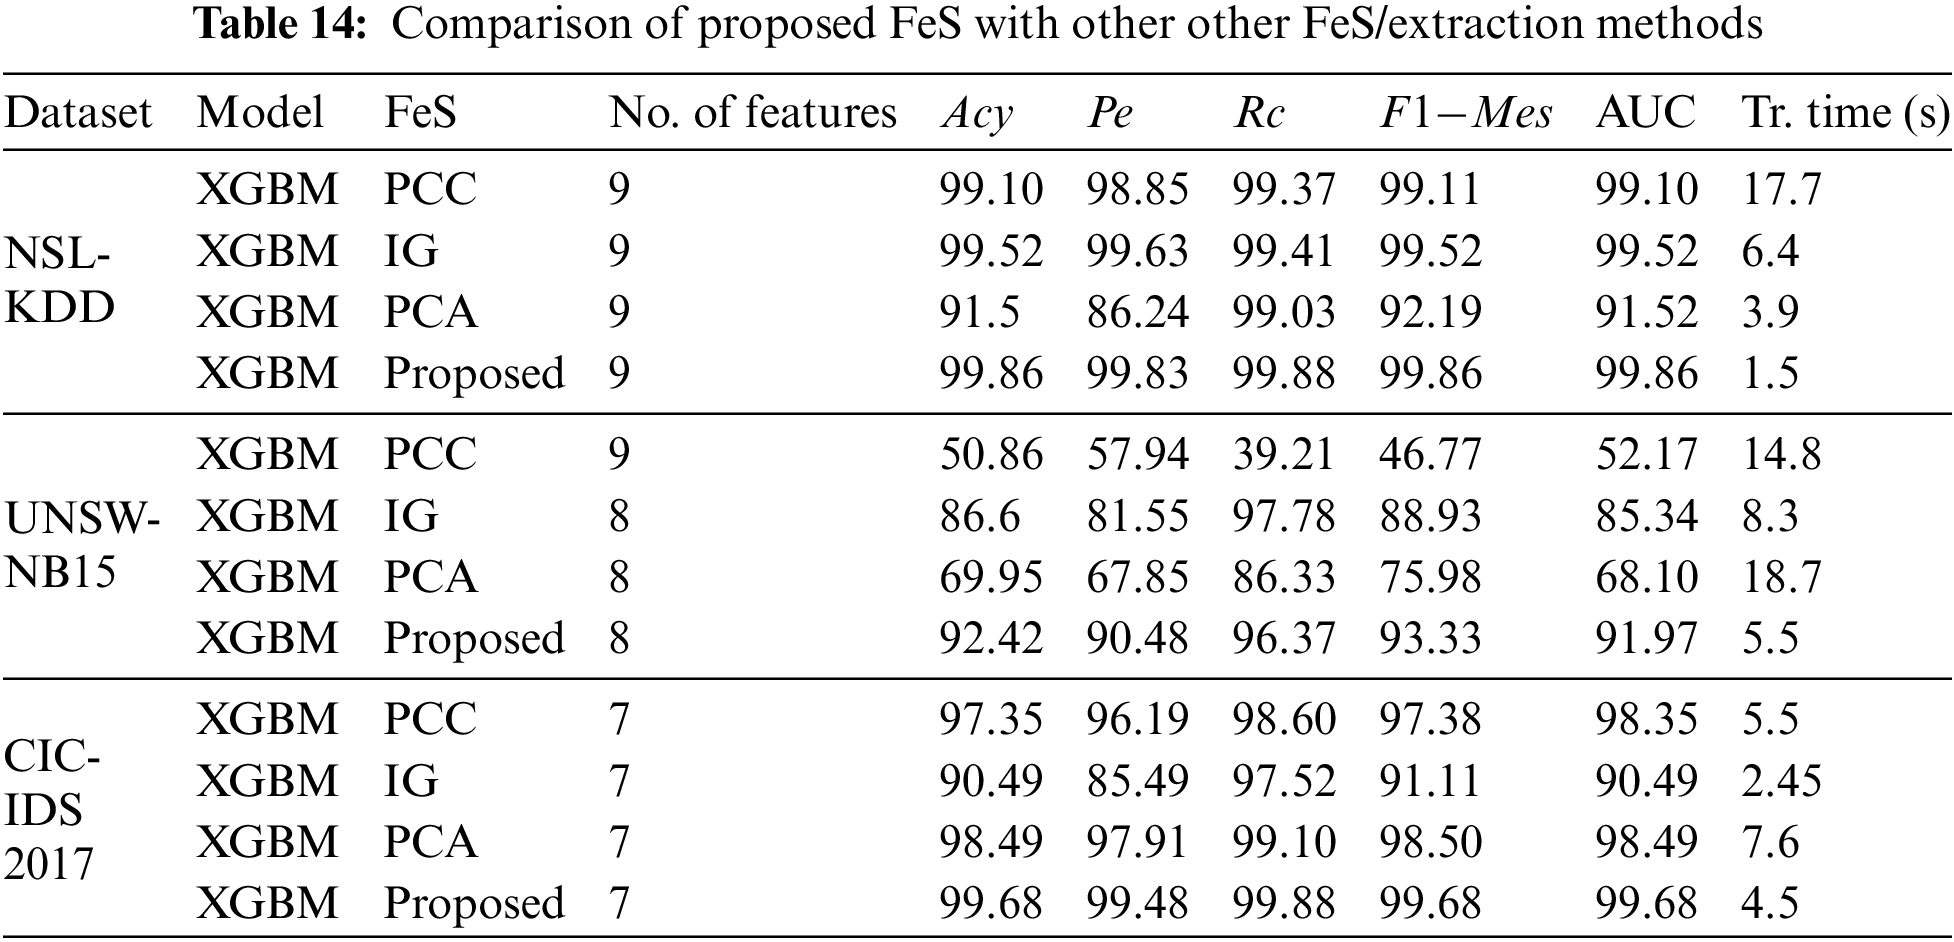
We have obtained 9, 8, 7 optimal features for NSL-KDD, UNSW-NB 15 and CIC-IDS 2017 datasets in our proposed method. So, we compared the existing feature selection methods such as PCC, IG and PCA, respectively, with 9, 8, 7 on NSL-KDD, UNSW-NB 15 and CIC-IDS 2017 datasets. By observing Table 14, we can infer that the proposed feature selection method outperformed the existing techniques with XGBM classifier for three datasets.
This section compares the proposed model metrics with various existing techniques for attack detection using the three datasets. Table 15 shows the comparative analysis of the proposed model with existing models.
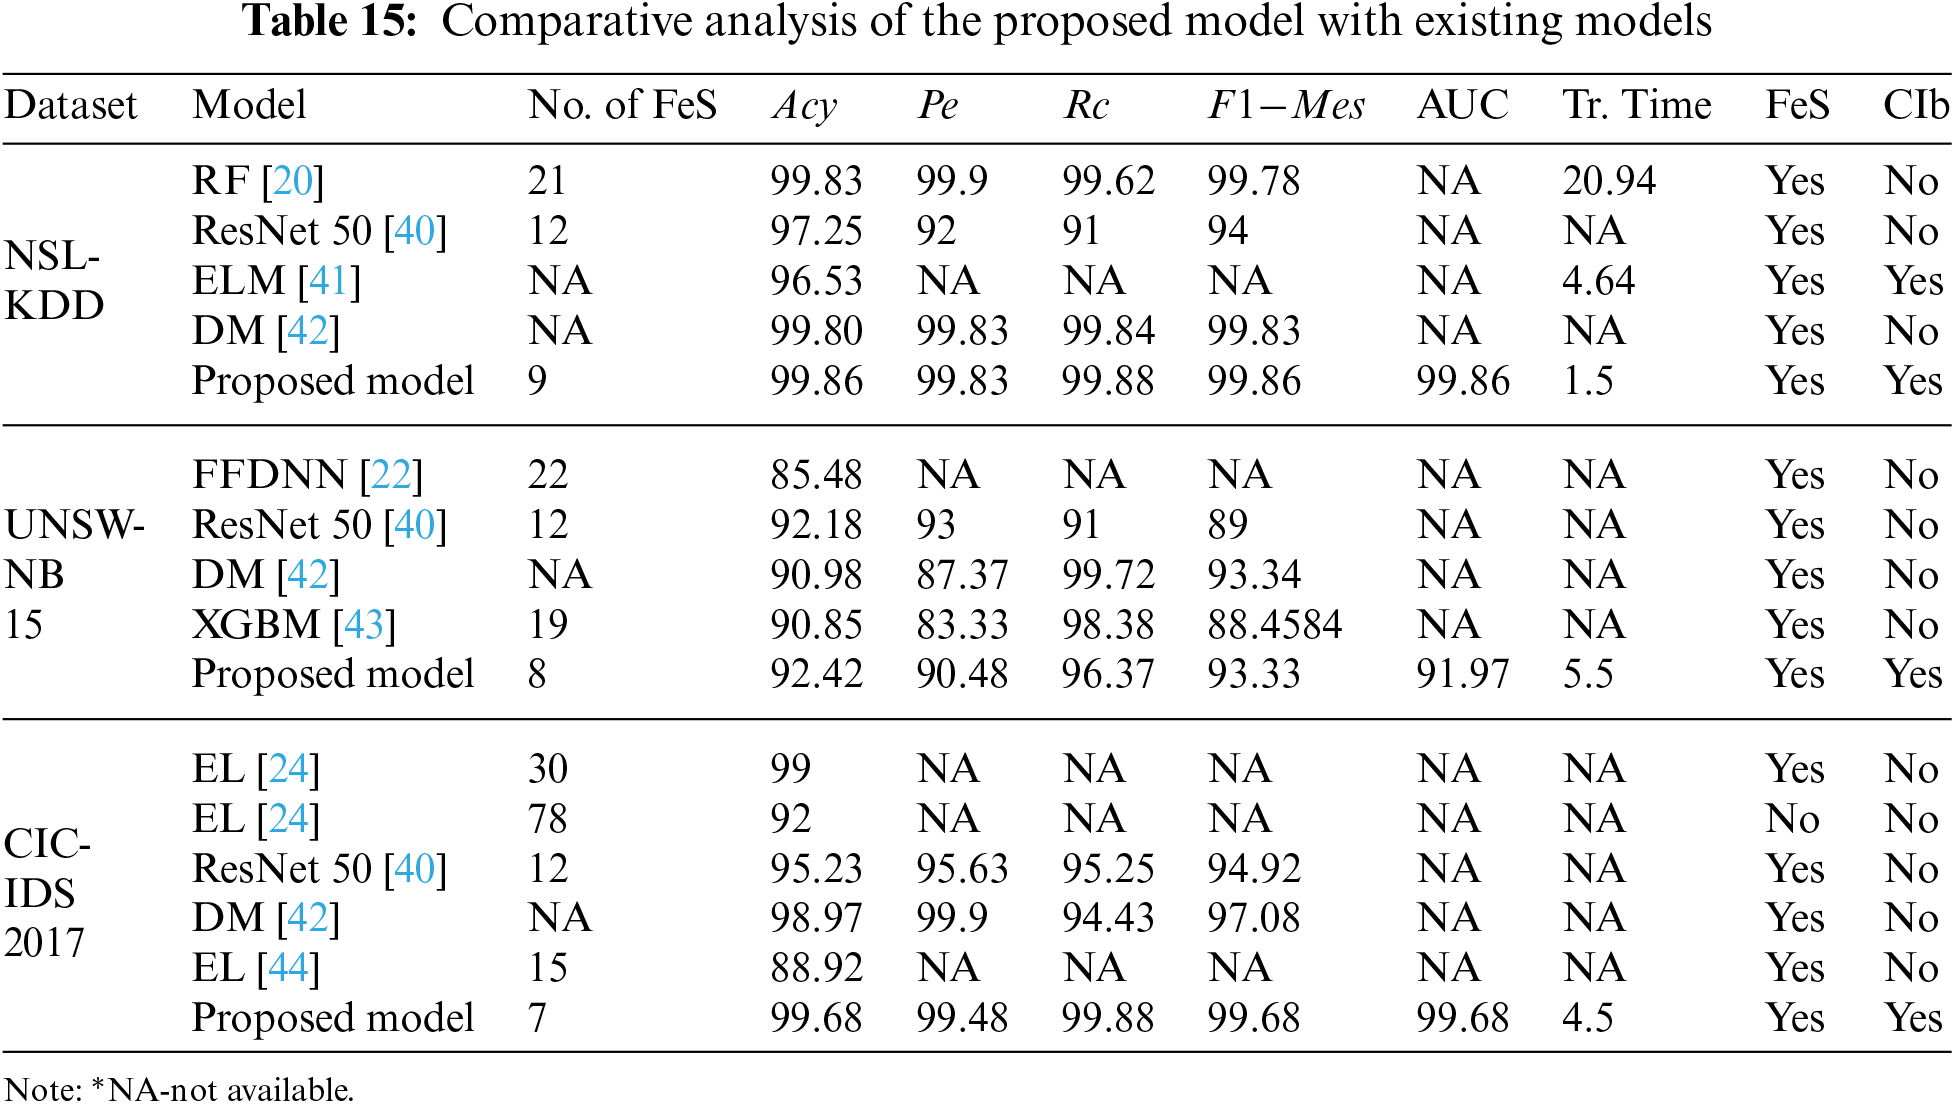
To reduce resource utilization and computational time, Kannari et al. [20] suggest an IDS model using Recursive feature elimination with RF classifier to identify attacks. They tested their model on the NSL-KDD data set. Shaikh et al. [40] suggested an IDS detect attacks in the network by using CNN and resnet50. They evaluated their model on NSL-KDD, UNSW-NB15, and CIC-IDS 2017. To prevent intrusion in a cloud-based IoT environment, Lin et al. [41] developed an IDS using multi-feature extraction Extreme Learning Machine (MELM) to detect attacks on the NSL-KDD dataset. Yousefnezhad et al. [42] increased the detection rate and reduced the false alarm rate by proposing an ensemble classification model using Dempster–Shafer technique (DM) to detect assaults in the network traffic. They trained their model on datasets like NSL-KDD, UNSW-NB 15, and CIC-IDS2017.
Kasongo et al. [22] recommended wrapper-based feature extraction by using an Extra tree (ET) to select optimal features. Then they used a feed-forward deep neural network to detect attacks in the wireless networks and trained their model on the UNSW-NB15 dataset. Mhawi et al. [24] suggested a hybrid feature selection using correlation feature selection and Forest Panelized Attributes (CFS–FPA). Further, the optimal features are given to an ensemble classifier to identify attacks in the network. They tested their model on CIC-IDS 2017 dataset. Kasongo et al. [43] suggested a feature selection model using XGBoost to select the optimal features. Then they are fed to the DT classifier to classify the attacks. Finally, they evaluated their model on UNSW-NB 15 dataset. Abbas et al. [44] proposed ensemble-based (EL) IDs to detect threats in IoT networks using CIC-IDS 2017.
Even Mhawi et al. [24] have obtained an accuracy of nearly 99% on the CIC-IDS 2017 dataset, but their model uses 30 attributes which is more when compared to our proposed model. Moreover, Kannari et al. [20] attained an accuracy of nearly 99% on the NSL-KDD dataset, but compared with our proposed model, the training time and the number of features are more for their models. Compared to earlier techniques, our suggested method outperforms the others since most solutions did not address the class imbalance. In the proposed work, we addressed class imbalance by using ADASYN. It is evident from the experimental results that when the data is balanced, our model outperforms other models with less training time and fewer features.
Finally, with less number of optimal features, our model performed well with an accuracy of 99.85%, 92.4%, and 99.68%, the precision of 99.85%, 90.48%, 99.48%, recall of 99.83%, 96.37%, 99.88%,
Intrusion detection systems with redundant and irrelevant features significantly impact the results. To counteract the considerable influence, we proposed a fusion of feature ranking to select the most contributed features. Initially, the network traffic is preprocessed by removing duplicate records and handling missing NaN and negative values using mean imputation. The uneven distribution of data is balanced. Further, the fusion of feature importance is applied to retrieve the top ten features from each feature selection method. Then plurality voting is used to select the optimal features. Then the optimal features are fed to various ML models. Among them, XGBM outperforms other ML models. Hyperparameters are tuned to enhance the model performance by halving the random search CV. The proposed model was evaluated using publicly accessible IDS datasets such as NSL-KDD, UNSW-NB15, and CIC-IDS 2107. Finally, our proposed IDS produced superior outcomes with fewer features than existing approaches. The limitation of the proposed work is it can be computationally expensive, especially for big datasets, to run numerous feature selection methods for fusion which could be challenging. In the future, we will expand our methodology to distinguish multiple attacks by considering metaheuristic algorithms on IoT datasets.
Funding Statement: The authors received no specific funding for this study.
Conflicts of Interest: The authors declare that they have no conflicts of interest to report regarding the present study.
References
1. V. S. D. Priya and S. S. Chakkaravarthy, “Containerized cloud-based honeypot deception for tracking attackers,” Scientific Reports, vol. 13, no. 1, pp. 1–14, 2023. [Google Scholar]
2. IBM, “IBM security’s cost of a data breach report 2022,” 2022. [Google Scholar]
3. CYBER ATTACK check point’ s 2022 Mid-year report, 2022. [Google Scholar]
4. S. B. Mallampati and H. Seetha, “A review on recent approaches of machine learning, deep learning, and explainable artificial intelligence in intrusion detection systems,” Majlesi Journal of Electrical Engineering, vol. 17, no. 1, pp. 29–54, 2023. [Google Scholar]
5. K. S. Babu and Y. N. Rao, “Improved monarchy butterfly optimization algorithm (IMBOIntrusion detection using MapReduce framework based optimized ANU-net,” Computers, Materials & Continua, vol. 75, no. 3, pp. 5887–5909, 2023. [Google Scholar]
6. T. Mahjabin, Y. Xiao, G. Sun and W. Jiang, “A survey of distributed denial-of-service attack, prevention, and mitigation techniques,” International Journal of Distributed Sensor Networks, vol. 13, no. 12, pp. 1–33, 2017. [Google Scholar]
7. V. Jyothsna, V. V. Rama Prasad and K. Munivara Prasad, “A review of anomaly-based intrusion detection systems,” International Journal of Computer Applications, vol. 28, no. 7, pp. 26–35, 2011. [Google Scholar]
8. I. Sharafaldin, A. H. Lashkari and A. A. Ghorbani, “Toward generating a new intrusion detection dataset and intrusion traffic characterization,” in Proc. ICISSP 2018, Funchal, Madeira, Portugal, pp. 108–116, 2018. [Google Scholar]
9. G. Bagyalakshmi, G. Rajkumar, N. Arunkumar, M. Easwaran, K. Narasimhan et al., “Network vulnerability analysis on brain signal/image databases using Nmap and wireshark tools,” IEEE Access, vol. 6, pp. 57144–57151, 2018. [Google Scholar]
10. M. Ring, S. Wunderlich, D. Scheuring, D. Landes and A. Hotho, “A survey of network-based intrusion detection data sets,” Computers and Security, vol. 86, pp. 147–167, 2019. [Google Scholar]
11. R. E. Bellman, “Preface,” in Dynamic Programming. Princeton, New Jersey: Princeton University Press, 1957. [Google Scholar]
12. P. Hui Li, J. Xu, Z. Yi Xu, S. Chen, B. Wei Niu et al., “Automatic botnet attack identification based on machine learning,” Computers, Materials & Continua, vol. 73, no. 2, pp. 3847–3860, 2022. [Google Scholar]
13. B. Pes, “Ensemble feature selection for high-dimensional data: A stability analysis across multiple domains,” Neural Computing and Applications, vol. 32, no. 10, pp. 5951–5973, 2020. [Google Scholar]
14. B. Seijo-Pardo, I. Porto-Díaz, V. Bolón-Canedo and A. Alonso-Betanzos, “Ensemble feature selection: Homogeneous and heterogeneous approaches,” Knowledge-Based Systems, vol. 118, pp. 124–139, 2017. [Google Scholar]
15. P. Drotár, M. Gazda and L. Vokorokos, “Ensemble feature selection using election methods and ranker clustering,” Information Sciences, vol. 480, pp. 365–380, 2019. [Google Scholar]
16. A. Tiwari and A. Chaturvedi, “A hybrid feature selection approach based on information theory and dynamic butterfly optimization algorithm for data classification,” Expert Systems and Applications, vol. 196, no. February, pp. 116621, 2022. [Google Scholar]
17. R. K. Batchu and H. Seetha, “A generalized machine learning model for DDoS attacks detection using hybrid feature selection and hyperparameter tuning,” Computer Networks, vol. 200, pp. 108498, 2021. [Google Scholar]
18. O. Osanaiye, H. Cai, K. K. R. Choo, A. Dehghantanha, Z. Xu et al., “Ensemble-based multi-filter feature selection method for DDoS detection in cloud computing,” Eurasip Journal on Wireless Communications and Networking, vol. 2016, no. 130, pp. 1–10, 2016. [Google Scholar]
19. A. Bansal and S. Kaur, “Extreme gradient boosting based tuning for classification in intrusion detection systems,” in Proc. ICACDS 2018, Dehradun, India, vol. 905, pp. 372–380, 2018. [Google Scholar]
20. P. R. Kannari, N. S. Chowdary and R. Laxmikanth Biradar, “An anomaly-based intrusion detection system using recursive feature elimination technique for improved attack detection,” Theoretical Computer Science, vol. 931, pp. 56–64, 2022. [Google Scholar]
21. A. A. Najar, “DDoS attack detection using MLP and random forest algorithms,” International Journal of Information Technology, vol. 14, no. 5, pp. 2317–2327, 2022. [Google Scholar]
22. S. M. Kasongo and Y. Sun, “A deep learning method with wrapper-based feature extraction for wireless intrusion detection system,” Computers and Security, vol. 92, pp. 101752, 2020. [Google Scholar]
23. S. Saha, A. T. Priyoti and A. Sharma, “Towards an optimized ensemble feature selection for DDoS detection using both supervised and unsupervised method,” Sensors, vol. 22, no. 23, pp. 1–17, 2022. [Google Scholar]
24. D. N. Mhawi, A. Aldallal and S. Hassan, “Advanced feature-selection-based hybrid ensemble learning algorithms for network intrusion detection systems,” Symmetry, vol. 14, no. 7, pp. 1–17, 2022. [Google Scholar]
25. M. Ali, N. Iqbal, H. Jamil and D. Kim, “An optimized ensemble prediction model using AutoML based on soft voting classifier for network intrusion detection,” Journal of Network and Computer Applications, vol. 212, pp. 103560, 2023. [Google Scholar]
26. A. Henry, S. Gautam, S. Khanna, K. Rabie, T. Shongwe et al., “Composition of hybrid deep learning model and feature optimization for an intrusion detection system,” Sensors, vol. 23, no. 2, pp. 890, 2023. [Google Scholar] [PubMed]
27. M. Tavallaee, E. Bagheri, W. Lu and A. A. Ghorbani, “A detailed analysis of the KDD CUP 99 data set,” in IEEE Symp. on CISDA 2009, Ottawa, Canada, pp. 1–6, 2009. [Google Scholar]
28. J. S. Moustafa Nour, “UNSW-NB15: A comprehensive data set for network intrusion detection systems (UNSW-NB15 network data Set),” in Proc. MilCIS, Canberra, ACT, Australia, pp. 1–6, 2015. [Google Scholar]
29. H. He, Y. Bai, E. A. Garcia and S. Li, “ADASYN: Adaptive synthetic sampling approach for imbalanced learning,” in Proc. of the Int. Joint Conf. on Neural Networks, Hong Kong, China, March, pp. 1322–1328, 2008. [Google Scholar]
30. M. V. Brahmam, S. Gopikrishnan, K. R. Sravan and M. S. Bhavani, “Pearson correlation based outlier detection in spatial-temporal data of IoT networks,” in Proc. ICIDCA 2021, Coimbatore, India, vol. 96, pp. 1019–1028, 2022. [Google Scholar]
31. J. Xie, M. Wang, S. Xu, Z. Huang and P. W. Grant, “The unsupervised feature selection algorithms based on standard deviation and cosine similarity for genomic data analysis,” Frontiers in Genetics, vol. 12, no. May, pp. 1–17, 2021. [Google Scholar]
32. U. De Moncton, N. Brunswick, T. L. Hung and V. Nam, “The mean and median absolute deviations,” Mathematical and Computer Modelling, vol. 34, no. 7–8, pp. 921–936, 2001. [Google Scholar]
33. R. De Nijs and T. L. Klausen, “On the expected difference between mean and median introduction,” Electronic Journal of Applied Statistical Analysis, vol. 6, no. 1, pp. 110–117, 2014. [Google Scholar]
34. A. Thakkar and R. Lohiya, “Fusion of statistical importance for feature selection in deep neural network-based intrusion detection system,” Information Fusion, vol. 90, pp. 353–363, 2023. [Google Scholar]
35. L. Breiman, “Random forests,” Machine Learning, vol. 45, pp. 5–32, 2001. [Google Scholar]
36. A. Fisher, C. Rudin and F. Dominici, “All models are wrong, but many are useful: Learning a variable’s importance by studying an entire class of prediction models simultaneously,” Journal of Machine Learning Research, vol. 20, pp. 1–81, 2019. [Google Scholar]
37. L. S. Shapley, “A value for N-person games,” in Classics in Game Theory, 1. New Jersey, United States: Princeton University Press, pp. 69, 1997. [Google Scholar]
38. S. M. Lundberg and S. I. Lee, “A unified approach to interpreting model predictions,” in Proc. NIPS, Long Beach, CA, USA, pp. 4766–4775, 2017. [Google Scholar]
39. C. Do Xuan, H. Thanh and N. T. Lam, “Optimization of network traffic anomaly detection using machine learning,” International Journal of Electrical and Computer Engineering, vol. 11, no. 3, pp. 2360–2370, 2021. [Google Scholar]
40. A. Shaikh and P. Gupta, “Real-time intrusion detection based on residual learning through ResNet algorithm,” International Journal of Systems Assurance Engineering and Management, 2022. https://doi.org/10.1007/s13198-021-01558-1 [Google Scholar] [CrossRef]
41. H. Lin, Q. Xue and D. Bai, “Internet of things intrusion detection model and algorithm based on cloud computing and multi-feature extraction extreme learning machine,” Digital Communication Networks, vol. 9, no. 1, pp. 111–124, 2022. [Google Scholar]
42. M. Yousefnezhad, J. Hamidzadeh and M. Aliannejadi, “Ensemble classification for intrusion detection via feature extraction based on deep learning,” Soft Computing, vol. 25, no. 20, pp. 12667–12683, 2021. [Google Scholar]
43. S. M. Kasongo and Y. Sun, “Performance analysis of intrusion detection systems using a feature selection method on the UNSW-NB15 dataset,” Journal of Big Data, vol. 7, no. 105, pp. 1–20, 2020. [Google Scholar]
44. A. Abbas, M. A. Khan, S. Latif, M. Ajaz, A. A. Shah et al., “A new ensemble-based intrusion detection system for internet of things,” Arabian Journal for Science and Engineering, vol. 47, no. 2, pp. 1805–1819, 2022. [Google Scholar]
Cite This Article
 Copyright © 2023 The Author(s). Published by Tech Science Press.
This work is licensed under a Creative Commons Attribution 4.0 International License , which permits unrestricted use, distribution, and reproduction in any medium, provided the original work is properly cited.
 Downloads
 Citation Tools