
 Submit a Paper
 Propose a Special lssue
 Open Access
ARTICLE

Malicious Traffic Compression and Classification Technique for Secure Internet of Things
1 Department of Future Convergence Technology Engineering, Sungshin Women’s University, Seoul, 02844, Korea
2 Department of Convergence Security Engineering, Sungshin Women’s University, Seoul, 02844, Korea
* Corresponding Author: Il-Gu Lee. Email:
(This article belongs to the Special Issue: Innovative Security for the Next Generation Mobile Communication and Internet Systems)
Computers, Materials & Continua 2023, 76(3), 3465-3482. https://doi.org/10.32604/cmc.2023.041196
Received 14 April 2023; Accepted 07 July 2023; Issue published 08 October 2023
 View Full Text
 Download PDF
Abstract
With the introduction of 5G technology, the application of Internet of Things (IoT) devices is expanding to various industrial fields. However, introducing a robust, lightweight, low-cost, and low-power security solution to the IoT environment is challenging. Therefore, this study proposes two methods using a data compression technique to detect malicious traffic efficiently and accurately for a secure IoT environment. The first method, compressed sensing and learning (CSL), compresses an event log in a bitmap format to quickly detect attacks. Then, the attack log is detected using a machine-learning classification model. The second method, precise re-learning after CSL (Ra-CSL), comprises a two-step training. It uses CSL as the 1st step analyzer, and the 2nd step analyzer is applied using the original dataset for a log that is detected as an attack in the 1st step analyzer. In the experiment, the bitmap rule was set based on the boundary value, which was 99.6% true positive on average for the attack and benign data found by analyzing the training data. Experimental results showed that the CSL was effective in reducing the training and detection time, and Ra-CSL was effective in increasing the detection rate. According to the experimental results, the data compression technique reduced the memory size by up to 20% and the training and detection times by 67% when compared with the conventional technique. In addition, the proposed technique improves the detection accuracy; the Naive Bayes model with the highest performance showed a detection rate of approximately 99%.Keywords
The development of wireless communication and 5G has increased the utilization of the Internet of Things (IoT) [1]. Furthermore, IoT devices are used in various industrial fields such as agriculture, medical care, and manufacturing, and real-time management and automation have improved the efficiency of the related processes [2]. In addition, online services have become common because of COVID-19, and there has been rapid growth in areas such as remote working and remote learning [3]. Consequently, the scale of damage caused by the leakage of personal information and industrial secrets is increasing, which has highlighted the importance of endpoint security for personal computers (PCs) and smartphones [4]. Regarding endpoint security, endpoint detection and response systems, that is, digital forensic tools that monitor a system, have been attracting attention [5]. They analyze event logs to detect external intrusions and respond to them.
As the amount of data received by IoT devices and the communication speed increase, the number of attacks targeting these devices also increases, as does the need for rapid identification of vast amounts of data. Particularly, attacks that take advantage of limited resources such as memory and batteries frequently occur [6]. Among them, distributed denial-of-service (DDoS) and ransomware are the most powerful attacks. DDoS and denial-of-service attacks cause a high load because of excessive network traffic to the IoT, thus interrupting the regular operation of the victim device; additionally, ransomware encrypts the victim’s data to disturb legitimate user access [7–9]. Furthermore, IoT devices cannot perform their normal operations, making it difficult for organizations to provide smooth services. Moreover, personal information and state secrets may be leaked, which can have spillover effects that include terrorism and war. Therefore, endpoints, such as IoT devices, need to be more secure [4].
However, it is challenging for a conventional network security solution to apply machine-learning techniques to network traffic data because this requires considerable money and time [10]. In addition, the overhead associated with storing and managing large volumes of data continuously collected in a network is significant [11,12]. Because IoT has limited storage, installing network monitoring and intrusion detection tools and managing logs are more challenging than that in the case of a general PC. Because security solutions balance security, performance, and resource requirements, they cannot be deployed on devices with limited resources or storage; even if they are implemented, their performance will not be the same as that in a typical PC environment [13]. Therefore, a security solution applicable to the IoT environment is needed, and its capability to detect malicious traffic quickly and accurately should be verified. In addition, lightweight data processing and detection techniques are necessary to prevent overload when applying the latest security solutions and reduce the cost of storing big data and cost of improving the specifications of IoT devices.
This study proposes two techniques to process event logs more efficiently in terms of accuracy and time and detect malicious traffic under environmental restrictions. An experiment was conducted using the UNSW-NB15 dataset of malicious and benign traffic [14–18]; the features (string) were excluded. The bitmap rule was set by comparing the values of the features between benign and attack, and all data were expressed as 0 or 1 according to the rule. The first of the proposed methods, the compressed sensing and learning (CSL) technique, performs binary classification with a compressed dataset and then compares the inference results of the machine-learning model with a dataset that has not been converted to the bitmap format. The second method, re-learning after CSL (Ra-CSL), classifies the original dataset of the log that the CSL model predicted as malicious. In the experiment, five machine-learning models were trained and compared to identify models that can effectively detect malicious traffic.
The contributions of this study are as follows:
• A compression technique that minimizes the information loss of the original log data is proposed, which can be applied to IoT environments with limited resources.
• A compression technique that can reduce memory usage and detection time is proposed.
• According to the characteristics of an application, either one of the techniques—lightweight or high-precision—can be selected.
The remainder of this paper is organized as follows. Section 2 analyzes the related works and Section 3 describes the compression-based log data analysis method. Section 4 describes the experimental method and analyzes the results. Finally, Section 5 discusses the conclusions and future research directions.
This section discusses the literature on detecting and classifying malicious attacks in IoT environments. Table 1 summarizes the proposals and analysis results of previous studies.

The characteristics of IoT allow various devices to be assembled. These devices are vulnerable to attacks, such as DDoS, which can destroy multiple devices simultaneously. Therefore, a study performed static and dynamic analysis on the behavior of DDoS attacks on IoT and detected malicious files based on the behavioral signatures [19]. However, the method proposed in this previous study does not improve the detection accuracy but only analyzes the characteristics of the malicious codes. Its main limitation is that it is challenging to utilize a static analysis that uses function call graphs and extracts host and network behavior in real-time monitoring and detection. However, in this study, after analyzing the distribution of the malicious and normal data, the detection accuracy was improved by applying two-step training and inference. Another behavior-based detection study proposed a system-level IDS named E-Spion that performs anomaly detection for IoT devices [20]. In this study, malicious files were detected by analyzing the behavior information at the system level, such as process parameters and system calls; the detection accuracy and overhead cost were then compared and analyzed. However, the experimental results were expressed at a low/high/moderate level rather than as an accurate value. In addition, this previous study utilized system information, whereas the proposed technique utilizes packet and network information. Because this study focuses on the problem of increased vulnerability of IoT systems to attacks such as DDoS when compared with that of other environments owing to the constrained environment of the IoT, it is appropriate to monitor and analyze the network information rather than the system information.
In addition to behavior analysis-based studies, some studies have been conducted to extract features automatically by applying artificial intelligence techniques [21,22]. A study proposed an intelligent detecting, recognizing, and predicting (i-DRP) framework that converts log files and binary datasets into image files and then classifies malicious files using the generalized multilayer perceptron [21]. However, they used MNIST—a typical handwritten dataset—rather than a dataset that imaged the actual log files or binary data. The experimental results indicated a high F1-score, which reached 0.979 after performing parameter optimization, but it was difficult to identify the result of classifying the handwritten dataset as the result of malware classification. However, this study used actual malicious and normal traffic datasets to prove the effectiveness of the proposed method. Another study proposed a dynamic analysis for the IoT malware detection (DAIMB) technique that trains malware using a convolutional neural network (CNN). It dynamically analyzes the IoT malware in a nested cloud environment [22]. This previous study extracted processes, system calls, virtual file systems, memory, and network-related behaviors and converted them to images. Then, the images were learned and classified on a CNN. However, in this previous study, although an overhead was expected in imaging the extracted behavior, the training time was not measured. In addition, the study had a limitation in that real-time monitoring and processing were difficult owing to the imaging step. In this study, the cumulative time required for training and testing was measured, and the proposed method aimed to shorten the total time, false detection rate, and miss detection rate.
Several studies have classified malicious packets by training the UNSW-NB15 dataset with machine-learning algorithms [23–25]. A study applied the stacking results of four models—random forest, logistic regression, support vector machine (SVM), and K-nearest neighbor (KNN)—using UNSW-NB15 and the flow-based URG’16 datasets [23]. This prior study attempted to enhance the generalization ability through an ensemble of three machine-learning algorithms, and multiple classifications were performed. However, in the classification result of the UNSW-NB15 dataset, the precision ranged from 41.6% to 99.42%, the recall ranged from 10.79% to 98.32%, and the deviation was too high. Therefore, applying this method to various cases was difficult; moreover, the study failed to measure the training time. In contrast, in this study, the measured training and testing times demonstrated the effectiveness of the method in terms of speed. In addition, a study performed a binary classification of the KDD-Cup’99, NSL-KDD, and UNSW NB15 datasets frequently used in malware classification studies using a DNN [24]. Nonetheless, it did not propose a technique for processing the dataset efficiently but only showed the prediction result of the DNN; moreover, it did not measure the training and testing times. In contrast, this study proposes a method for efficiently processing logs and detecting malicious logs in a constrained environment. It requires less data processing than deep learning by employing machine-learning algorithms. In another study using UNSW-NB15, multiple classifications were performed using C5, CHAID, CART, and QUEST based on the decision tree (DT) algorithm [25]. This previous study analyzed the dataset, set the rules for each attack, and integrated them to train the algorithm. However, this algorithm is difficult to use and has a high processing overhead because the set rule varies depending on the classification model. In addition, the deviation between precision and recall was significant depending on the attack, and the training time was not considered. In contrast, because the rules were set depending on the characteristics of each feature, they could be set regardless of the model in this study. Additionally, the total performance time was measured. The technique proposed in this study shows a higher accuracy, and appropriate algorithms may be utilized depending on the required detection environment. Other studies [26–28] have proposed a low-power, lightweight data processing method for the IoT environment. In a study [26] that proposed a lightweight log anomaly detection algorithm, real-time processing speed was achieved using word2vec and PPA, and the detection time and size of the model were reduced by using fewer parameters. However, sufficient detection performance is not guaranteed if the parameters are excessively reduced to reduce the model size. When the data size is large, the model size may inevitably increase as the parameters increase. In contrast, because the method proposed in this study is intended to process data, not parameters of the model, both log processing speed and malicious behavior detection performance are improved. A study [27] that proposed a data compression technology for IoT using the TinyML perspective showed that real-time data processing was possible while achieving a compression rate of up to 98.33% using a TinyML-based compression technology. However, this previous study considered only the real-time data analysis aspect; the anomaly detection aspect was not considered, and the analysis time was not measured. However, in this study, not only is the compression rate considered but it is also used at an appropriate point in the trade-off between data loss and detection rate because of compression. In addition, it was demonstrated to be a lightweight method by measuring the training and testing time. In another study [28], data collected in chronological order were grouped into different univariate time series and then compressed using a lifting scheme. After linearizing the input array, a squeeze algorithm was applied, which compressed the unpredicted data through adaptive curve fitting. This technology allows data to be compressed while reducing errors. However, malicious traffic classification can be difficult with this technology because malicious and normal traffic can be combined into one. In addition, even if malicious traffic is detected, a problem of blocking normal traffic may occur in the response stage. In contrast, in this study, because compression is performed by reducing the range of values of each feature, there is no problem with combining the data of different records. In addition, it is possible to determine whether each unit of data is malicious, even if the data do not exist in chronological order.
3 Proposed Malicious Traffic Classification Techniques
In this section, two malicious traffic detection techniques—CSL and Ra-CSL—are proposed, which ensure less storage and resource requirements in environments with data storage constraints, such as IoT. The CSL technique compresses the log data in a bitmap format and detects malicious traffic using a machine-learning model. The Ra-CSL technique performs re-learning after decompressing the data that are detected as an attack. Among the proposed methods, the bitmap rule setting method was developed by referring to the “range encoding” used in a previous study, which applies the bitmap according to the range of values [29]. The “range encoding” used in this study analyzes the distribution of values of each feature by label and then expresses all values within a specific range as an attack or normal. For example, if a feature value is [1, 6, 0, 2, 7], and the label of this feature is [normal, attack, normal, normal, attack], then range encoding sets a bitmap rule as an attack if the value is 5 or higher. Therefore, all values of each feature can simply be processed with only short conditional statements. The CSL technique enables lightweight data processing through data compression techniques, which can speed up processing and reduce the training and testing times. In contrast, the Ra-CSL technique consists of two stages, including the CSL stage; hence, data processing is slower than with CSL. However, it detects malicious traffic more accurately by performing two-stage detection through the process of verifying the compressed data and original traffic data. Therefore, the CSL or Ra-CSL techniques can be selected according to the characteristics of the application of an IoT device. For example, CSL is suitable for IoT devices that perform manufacturing and automation services where speed is important, and Ra-CSL is suitable for IoT devices that perform mission-critical services where accuracy is important [30].
The CSL technique is a method for malicious traffic detection based on machine-learning algorithms after converting the log data collected from endpoints to a bitmap format. The basic process of the CSL technique is shown in Fig. 1.
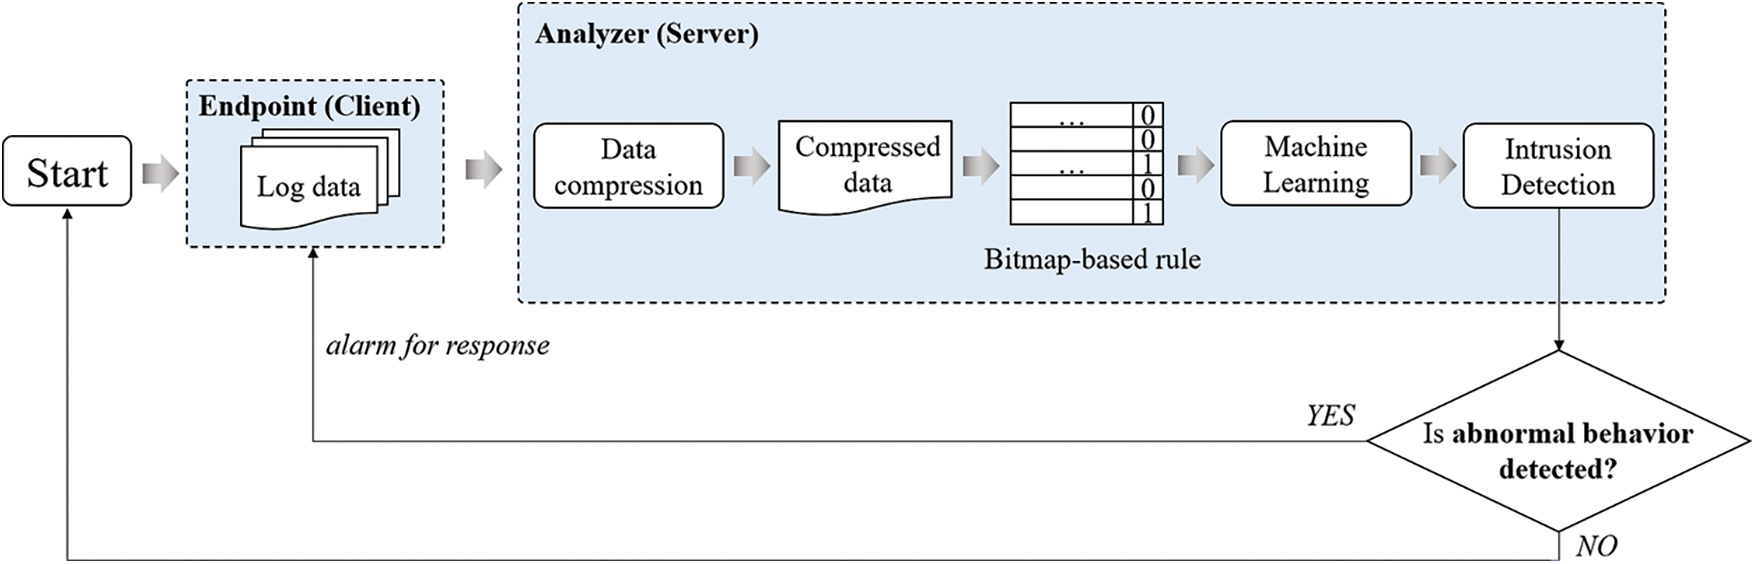
Figure 1: Process of CSL technique
The CSL technique involves compressing the accumulated data, training from the compressed data, and inferring the labels of the compressed logs. The received log data pertain to network traffic, which includes numerical data such as the number of communication bytes, number of connections, and flag values. The client’s log data can be collected using tools or equipment, such as a network intrusion detection system (NIDS) (e.g., Snort) or Wireshark, to capture incoming and outgoing TCP/IP packets.
Before new log data are received, the server (analyzer) has a bitmap rule set using the accumulated dataset. The bitmap rules can vary depending on the computing environment and the user’s normal usage history, and the accumulated dataset can be analyzed and set in consideration of the average value and deflection level of each feature in the normal state. For example, if an IoT sensor that transmits and receives approximately 10 bytes of data on average in the normal state receives 100 bytes of data in the attack state, the boundary between the two labels is specified based on a value between 10 and 100. In data compression, the received log data are compressed by converting the value of each feature of the log data to 1 for the attack range or 0 for the benign range. If the boundary value between two labels is 55, the values below 55 are converted to 0 and those above 55 are converted to 1. Thus, each feature has a label of 0 or 1 in the compressed log data. In addition, a machine-learning classification model is trained by utilizing the result of compressing the accumulated dataset.
If new log data are received at the endpoint (client) side, data compression is performed according to the bitmap rules stored in the server. The bitmap rule is not complicated and is performed for each feature. Hence, the compression step is a simple task and can be applied to real-time received data. The server performs inference using the machine-learning classification model to determine whether the compressed data of the received log data represent an attack. If specific log data are determined to be an attack by the model, the client that sent the log data can be notified of the attack detection and response. This compression technique can reduce the data size while retaining important information about the attack from the log data. Therefore, it is possible to change the malicious traffic classification problem to a simple binary classification problem and reduce the memory and data processing overhead.
3.2 Re-Learning After CSL Technique
Ra-CSL is a method for improving the accuracy of CSL. It performs a precision re-examination based on conventional machine-learning only on the log data determined to be an attack through the compression process. The basic process of the Ra-CSL technique is shown in Fig. 2.
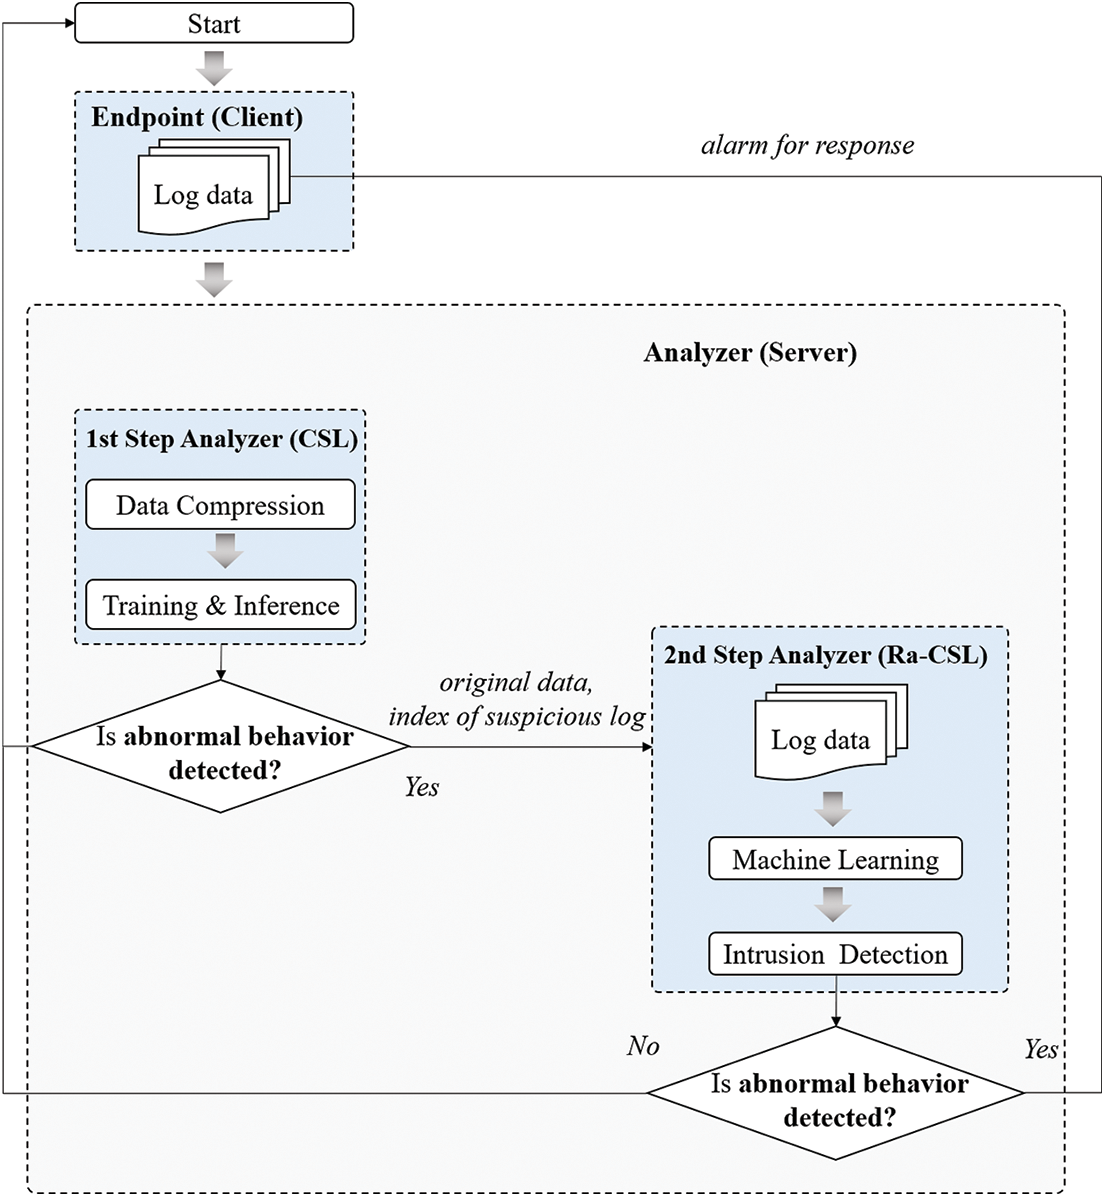
Figure 2: Process of Ra-CSL technique
The CSL technique described in Section 3.1 is a method for extracting and training a significant part of the entire data. Thus, the data can be trained in a short time while maintaining accuracy. However, this is performed at the risk of some data loss. Therefore, Ra-CSL allows quick identification of suspicious data using CSL and enables their sophisticated analysis while alleviating the data loss problem of CSL.
In Ra-CSL, the CSL model first selects suspicious data and then trains with the entire data to enable sophisticated inference with a model that has been trained with the entire dataset. Therefore, the proposed methods enable the rapid identification and sophisticated analysis of suspicious data.
In Ra-CSL, the processes of training with a compressed dataset according to the bitmap rule as a machine-learning model and performing intrusion detection are the same as those in the CSL technique. However, in Ra-CSL, the CSL process is performed in the 1st step analyzer, and the 2nd step analyzer is additionally utilized according to the 1st inference result. In addition, the classification model trained from the original dataset without data compression is stored in the 2nd step analyzer in advance.
If the 1st step analyzer determines a specific log data as an attack, it sends the original data received from the endpoint and index of that specific log data to the 2nd step analyzer. In addition, because a large amount of log data is collected in a short time in the real world, the client generally sends multiple log data simultaneously. Therefore, index information enables the extraction of only the suspected logs from the log data received from the endpoint.
Then, the 2nd step analyzer utilizes a machine-learning classification model trained with the original dataset to detect whether this log is an attack. Finally, to determine whether the specific log data represent an attack, the 2nd step analyzer extracts the suspected log using the index information from the data sent by the 1st step analyzer. The client is notified of the log data that is determined to indicate an abnormal behavior by the 2nd step analyzer so that the client, who has transmitted the corresponding log data, can respond.
In the experiment, a VMware workstation-based virtual machine environment was used to compare the performances of the proposed and conventional methods. The server operating system was Ubuntu 18.04 LTS with a dual Intel Core i7-97003.00 GHz CPU, 2 GB RAM, and 20 GB hard disk. The endpoint operating system was Ubuntu 18.04 LTS with a dual Intel Core i7-97003.00 GHz CPU, 1 GB RAM, 1 processor, and 15 GB hard disk to represent a low-resource IoT environment. All machine-learning algorithms used in the experiment were implemented in Python 3 using Jupyter Notebook.
In this study, it was assumed that IoT devices collect data and transmit the processed data to a data center. In this scenario, data collection using the IoT devices should not be interrupted, necessitating a lightweight security solution. Therefore, a method to efficiently process the data and effectively detect malicious behavior is proposed. In addition, the network traffic dataset was used because the network must remain connected while transmitting and receiving data.
The UNSW-NB15 dataset was used to take advantage of network traffic data. UNSW-NB15 dataset contains network traffic data, including both benign and attack traffic data, in the raw pcap format, collected using the tcpdump tool. In this study, to confirm the attack detection rate of the proposed technique, the label was classified into the normal state (0) and attack state (1) without distinguishing the attack type, and binary classification was performed. In the experiment, the number of normal and attack labels was equally set to 37,000 samples by undersampling the training data to prevent the effect of data imbalance.
If the attack data correspond to a small range of attacks, the characteristics not expressed in the given data but expressed in other common attacks can be judged to be normal in the bitmap rules. Therefore, even if binary classification is performed, various attack types must be included in the attack data. Accordingly, in the experiment, binary classification was performed using the UNSW-NB15 dataset containing attack data from nine attack families and 205 types of attacks; because it includes various types of attacks, it is a widely used attack traffic dataset.
The UNSW-NB15 dataset comprises 49 features. Among them, only 21 features were utilized while setting the bitmap rule because the binary classification of the features was difficult or they comprised string types that required additional preprocessing before compression, thus causing overhead. Table 2 shows the data types and the dataset’s feature descriptions.
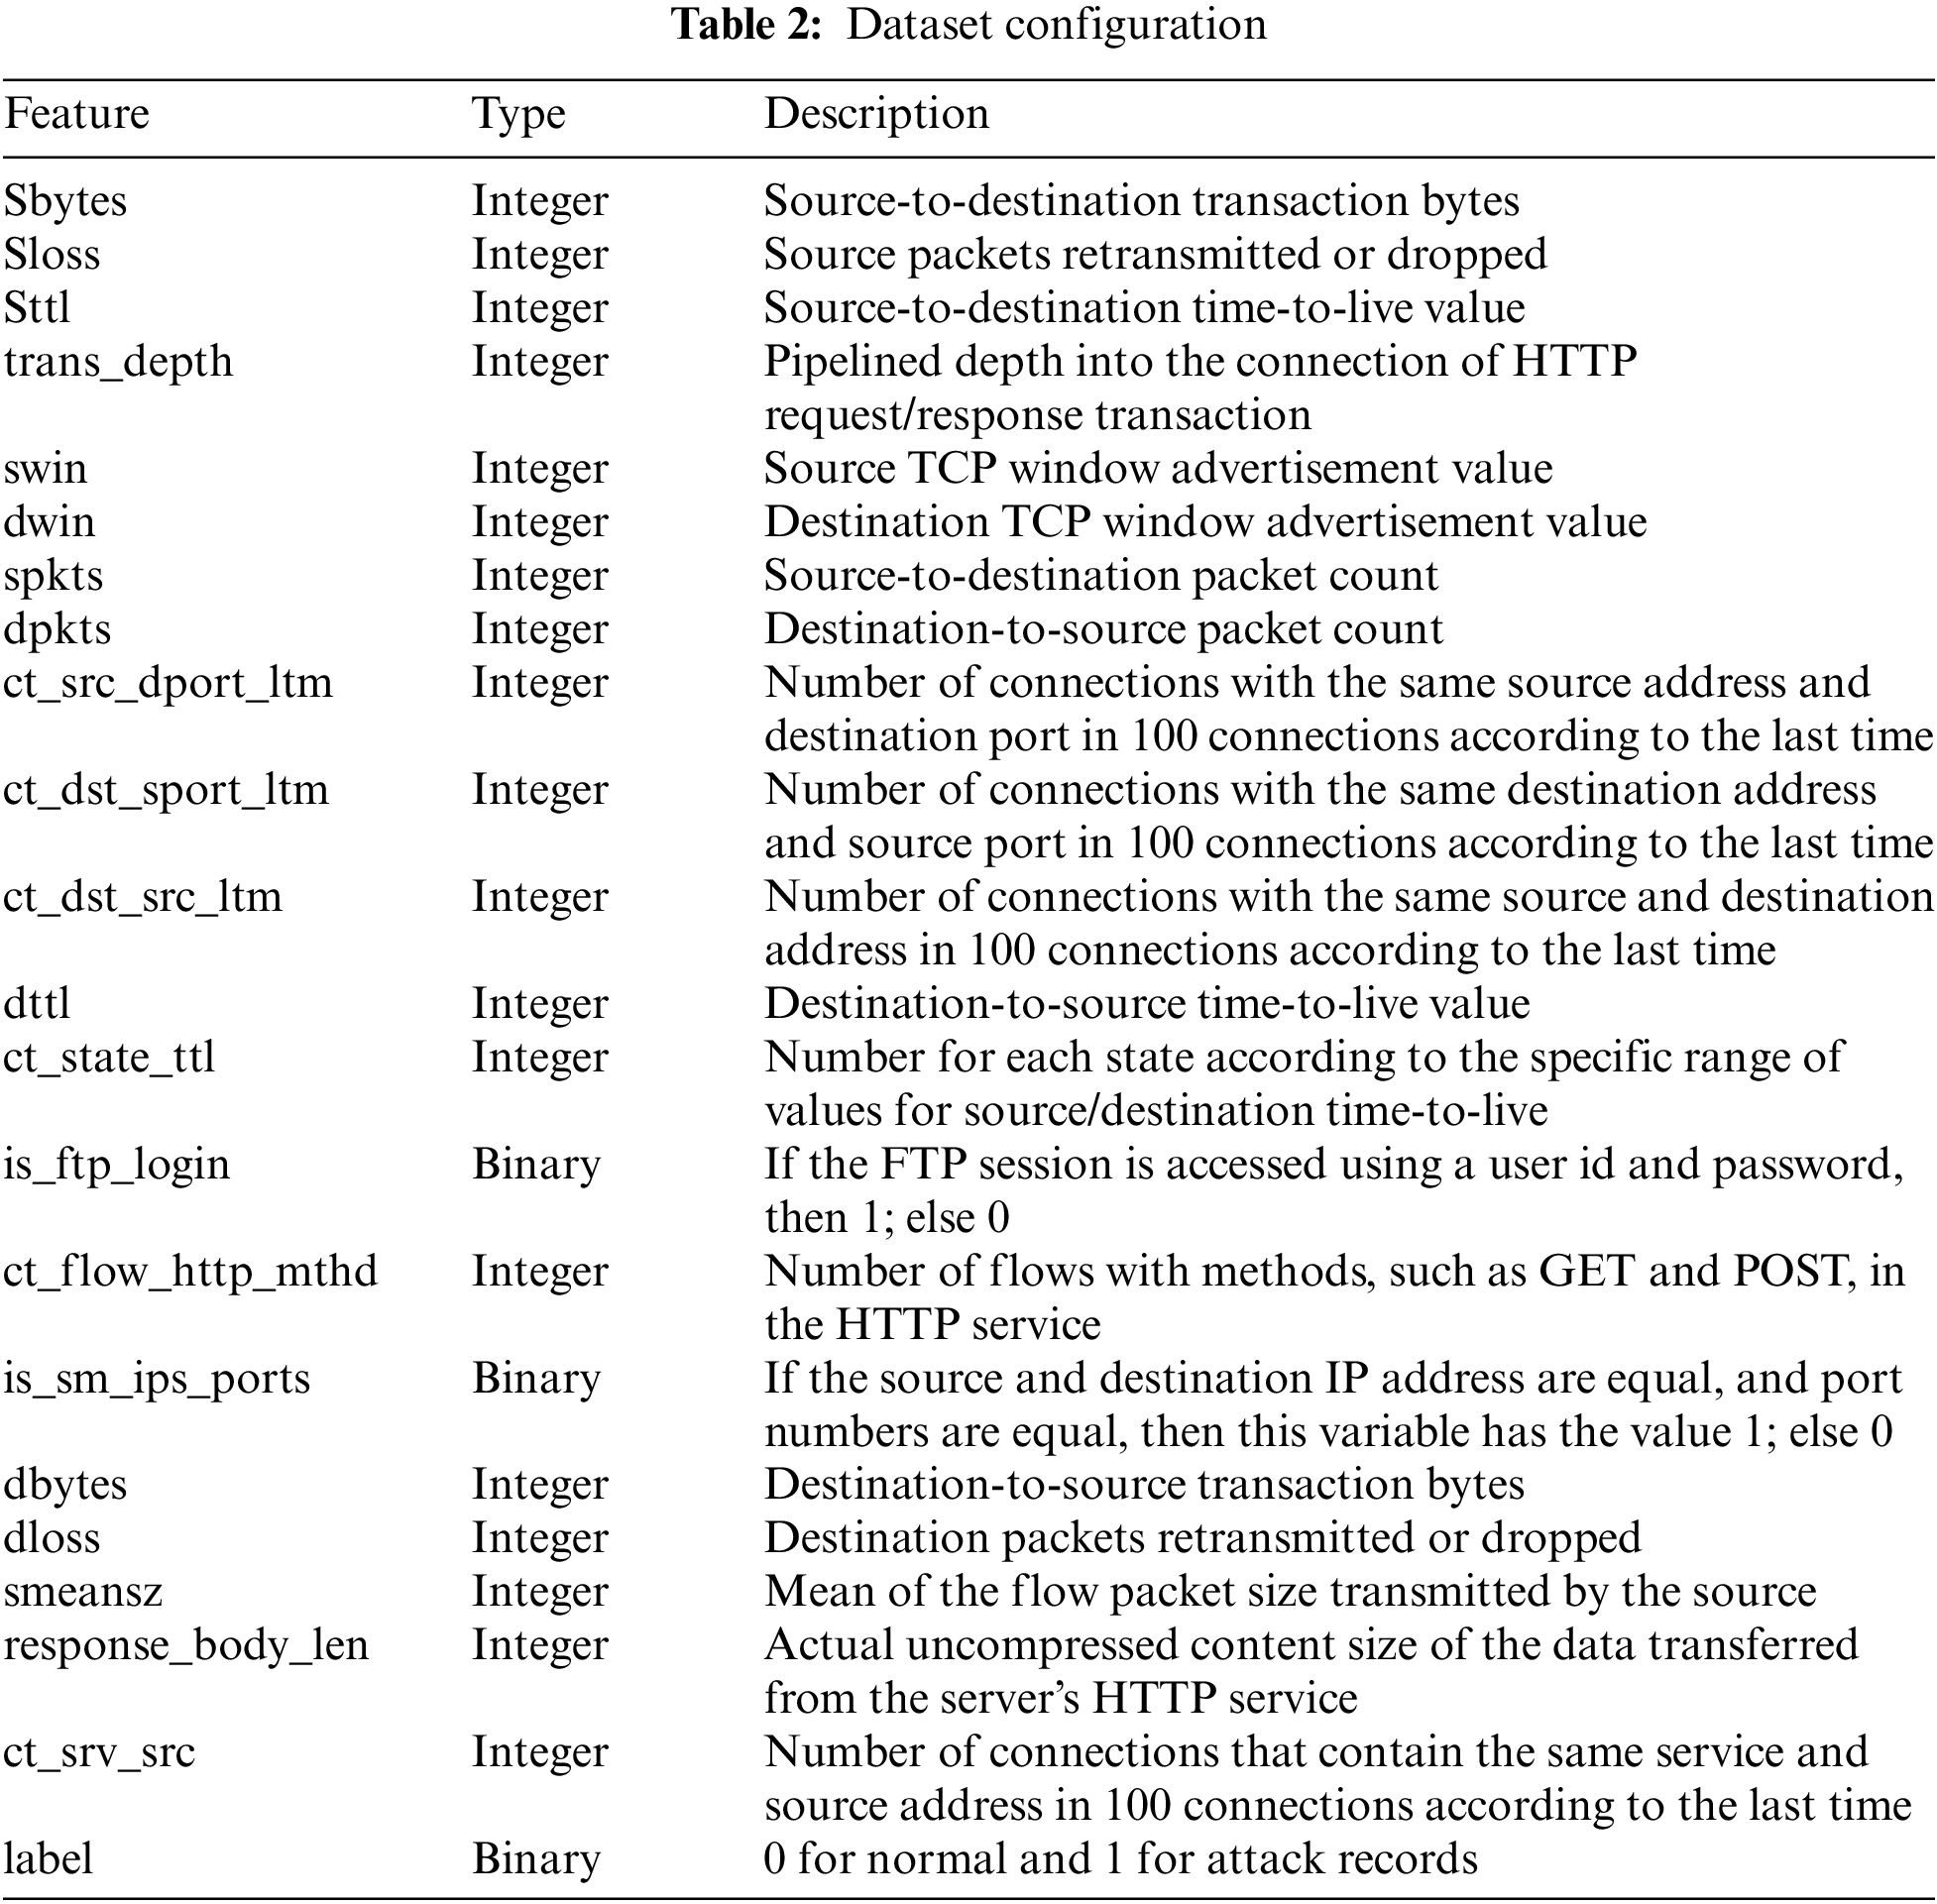
Table 3 summarizes the value ranges of the original data and bitmap rules of the proposed compression method. The boundary between attack and benign is decided by analyzing the training set. In a bitmap rule, the boundary value is valid in the dataset used in the experiment and may have to be changed to different values depending on the environment. In this study, the bitmap rule was set by directly analyzing the training data. When setting the bitmap rule, it was impossible to separate the attack from benign by analyzing a single feature independently. Therefore, the bitmap rule was set based on a boundary value, which was 99.6% true positive on average for the classification as attack or benign. Even in a different environment than the dataset used in the experiment, the bitmap rule can be set easily by selecting the boundary value that increases the true positive for one label of the log dataset collected in each environment, as suggested in this study. In addition, once a bitmap rule is set, a large amount of data can be compressed; thus, malicious traffic can be efficiently processed and detected.

The swin and dwin columns were 0 or 255 in the attack, and other values, including 0 and 255, in the benign. For binary classification, 0 and 255 were set as an attack. spkts and dpkts are the number of packets sent from the source to the destination and from the destination to the source, respectively. When analyzing the data in both features, the number of packets sent and received during an attack increased significantly. Therefore, according to the range of each feature, spkts greater than or equal to 691 and dpkts greater than or equal to 1,433 were set as attacks. For ct_flw_http_mthd, the values of 0, 1, 2, 4, and 16 for attack and 0, 1, 2, 4, 6, 12, and 16 for benign were displayed; the values of 0, 1, 2, 4, and 16 appeared as overlapped. In the experiment, overlapped values were set as an attack to prevent the influx of malicious traffic, and the rest were set as normal. In the case of is_sm_ips_ports, when the source and destination IP addresses and port numbers matched, the value was 1; otherwise, when the IP address and port number did not match, it was 0. In the attack case, the value was 0, but in the case of the normal state, both 0 and 1 appeared. Therefore, this feature was also set as an attack when it was 0 and as a normal state when it was 1 to prevent the influx of malicious traffic.
4.2 Evaluation Results and Analysis
In the experiment, the efficiency of the proposed data processing method was demonstrated and its performance was compared with those of the conventional, CSL, and Ra-CSL methods. As this study proposes a bitmap-based compression technique that expresses the log data simply, simple machine-learning models are used to classify the log data. The conventional method refers to a study that classifies malicious IoT traffic data using various machine-learning algorithms [31]. The random forest (RF), DT, Naive Bayes (NB), and gradient boosting algorithms were used in the comparative study. In addition to the four algorithms used in the previous study, a data processing method that can reliably classify malicious traffic even with a simple algorithm was proposed in this study; hence, the boosting algorithm was excluded. Furthermore, two additional models, which were representative supervised learning classification models, were used. In the experiment, five classification models were compared: logistic regression (LR), SVM, RF, DT, and NB. The evaluation metrics were dataset size, accrual, and training and testing time. The dataset size refers to the capacity of the .csv file; accuracy was calculated by dividing the sum of the true positives and true negatives by the total number of logs. The training and testing time was measured using Python’s time() function. The two techniques proposed in this study include the processing and compressing of data between the training and inference steps. Therefore, to demonstrate the performance of the proposed methods, the time required for the entire process to be performed was measured, that is, the time from training to completion of inference was measured.
For the performance evaluation of CSL and Ra-CSL, 30%, 50% and 100% of the data were randomly selected from the original dataset and converted into a bitmap format to compare the accuracy according to the compression rate (CR). A CR of 30% indicates that 7 features were compressed, 50% indicates that 10 features were compressed, and 100% indicates that all 21 features were compressed; the remaining uncompressed features were the same as in the original data. Therefore, the compressed features may vary depending on the CR, but all compressed features have a value of 0 or 1 because the same bitmap rule is applied.
Fig. 3 shows the dataset size of the conventional and proposed methods according to the CR. Except for the deleted features, which were of the string type or were difficult to binary classification (as explained in Section 4.2), the number of features used in each technique was the same. In CSL, because each value is expressed in the binary form (0 or 1), the size of the dataset decreases as the CR increases. Compared with the conventional technique, the size of the training set decreased by approximately 10.77%, 12.92%, and 20.48%, respectively. Further, the size of the test set decreased by approximately 10.92%, 12.94%, and 20.29%, respectively, after compression.
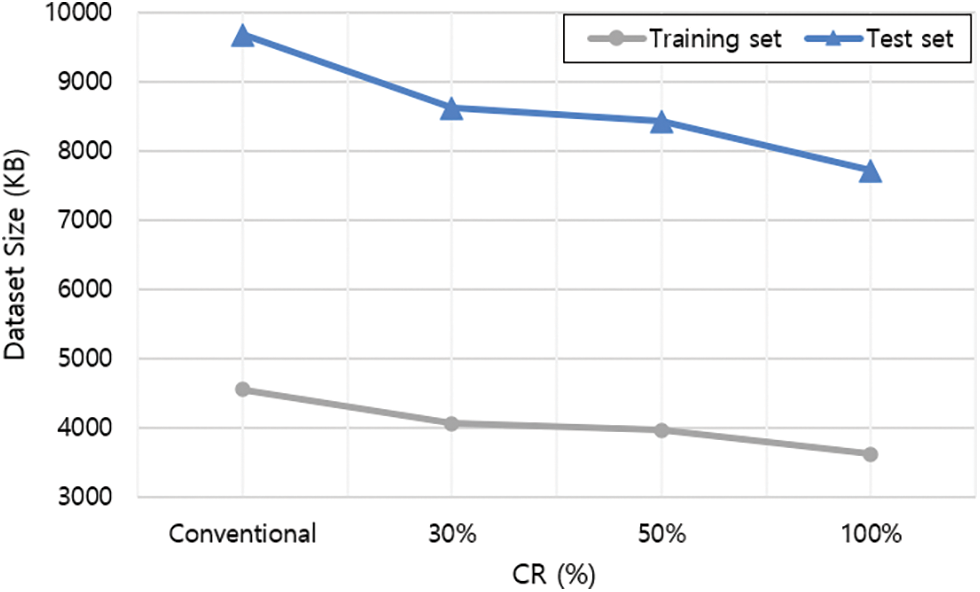
Figure 3: Dataset size comparison
In the following experiments, the dataset shown in Fig. 3 was used, and the accuracy and detection time were compared for each technique. The performance of the Ra-CSL technique was compared in terms of the CR, and the CR showing the best performance for each algorithm was adopted and compared with those of the conventional and Ra-CSL techniques.
Fig. 4 shows the detection accuracies of the conventional technique for each classification model and those of the CSL technique according to the CR.
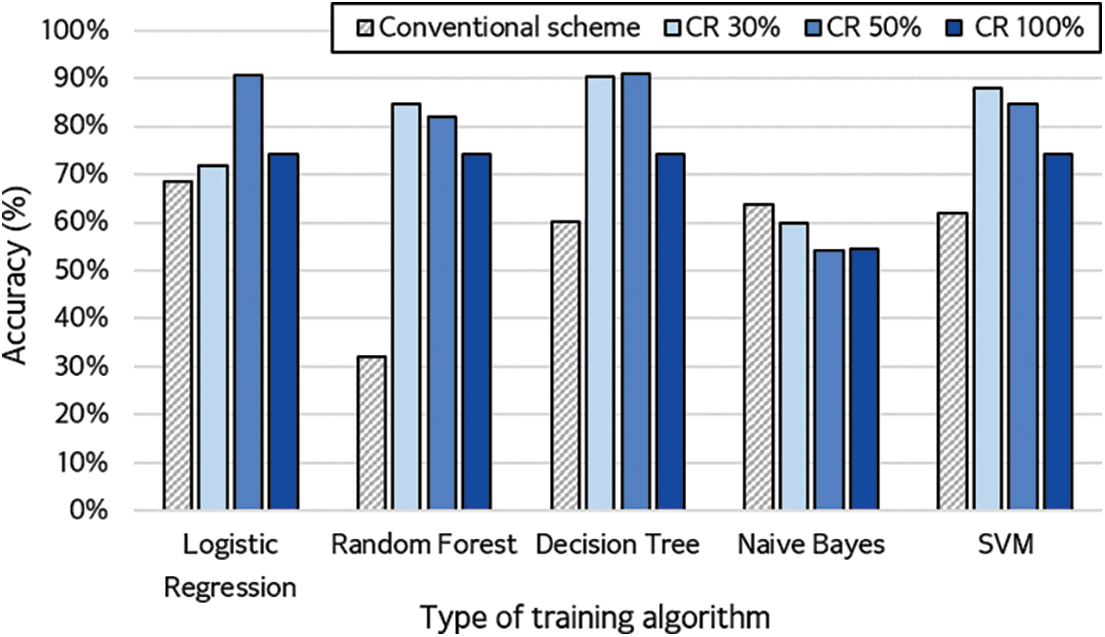
Figure 4: Accuracy of training algorithms for different compression rates
The results of the experiment showed that the CSL technique had excellent performance with all models except NB. In addition, RF, NB, and SVM showed the highest performance when the CR was 30%, and LR and DT showed the best performance when the CR was 50%. It was estimated that the performance would decrease by 100% under a high CR when compared with the performance obtained with the original data owing to data loss. However, at 30% CR, the algorithm acquired the highest accuracy because the data loss was the smallest. At 50% CR, the data loss exceeded 30%, but this was the only CR with more than 90% overall accuracy. Specifically, the best CR differed depending on the characteristic of each algorithm; however, the best detection rate was achieved when the conventional technique and compression method were used in combination.
The detection performance of the CSL technique also differed according to the CR of each classification model. LR and DT showed the best performance when compressed by 50%, and the other models performed the best when compressed by 30%. Additionally, the proposed CSL method (except for NB) showed a higher performance than the conventional technique. Particularly, LR and DT showed the highest accuracy of 91%. In the case of RF, which had the lowest detection rate in the conventional technique, CSL showed 85% accuracy, which was an improvement of 53% when compared with that of the conventional technique. Some of the original data were lost while compressing the data, but the detection rate was improved in some cases. This seems to have minimized the loss of important information, as the characteristics for classifying the malicious traffic were retained. The average accuracy of the proposed method was improved by approximately 26% when compared with that of the conventional technique.
Fig. 5 compares the conventional technique with CSL and Ra-CSL at the CR with the best performance.
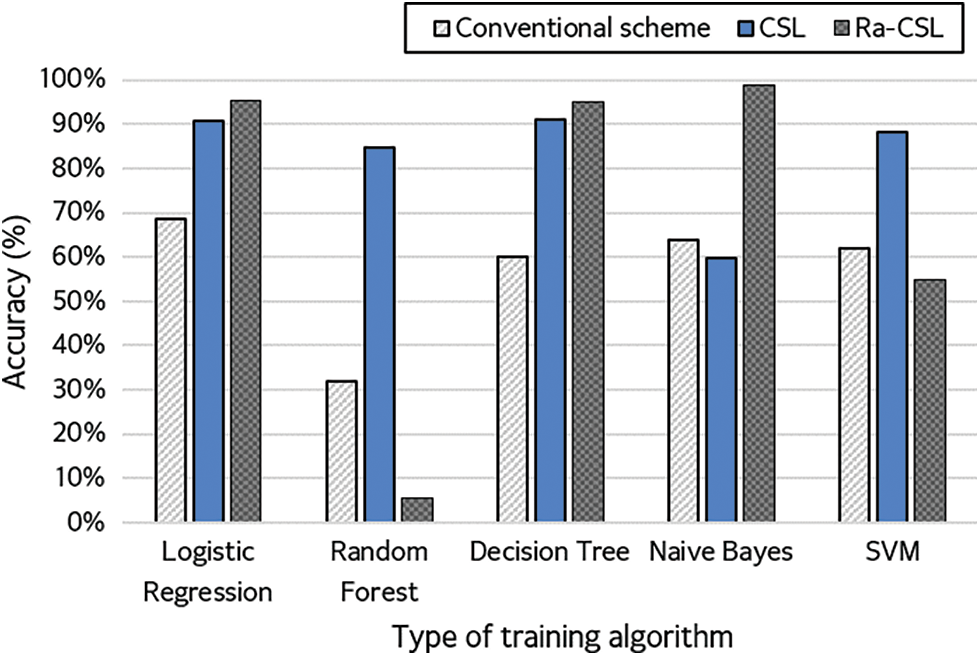
Figure 5: Accuracy of conventional, CSL, and Ra-CSL techniques
In the case of the CSL technique, the expressed CR in Fig. 5 was 30% for RF, NB and SVM, and 50% for LR and DT. In the case of Ra-CSL, SVM was compressed by 30%, RF was compressed by 50%, and LR, DT and NB were compressed by 100%. The experimental results showed that the proposed model performed with a higher detection accuracy than the conventional technique for all classification models. In addition, in the case of LR, DT and NB, the detection accuracy was the highest for Ra-CSL. Particularly, in the case of NB, the detection accuracy was less than 65% for the conventional and CSL techniques. However, the detection accuracy of Ra-CSL was approximately 99%, which was an improvement of more than 30% and the best performance among all experimental results. Nevertheless, Ra-CSL showed a lower classification accuracy for RF and SVM.
Table 4 shows the training and testing times.

The experimental results showed that the time required for the CSL technique was the shortest among the three models, excluding the DT and SVM models. However, in the case of DT and SVM, it took longer than the conventional technique to generate a classification model with limited data owing to the model characteristics.
Ra-CSL required approximately 646 s longer than the conventional method on average because it performed an additional process of importing original data using index and classification twice. The first step of classification was the pre-testing step with the CSL, and the second was the re-testing step with the conventional technique on the log detected as positive in the pre-testing step. However, as shown in Fig. 5, because the detection rate of Ra-CSL was higher, it is advisable to utilize Ra-CSL in an environment where detection time is not a concern.
In addition, the results show that the two proposed techniques, CSL and Ra-CSL, have advantages in terms of detection accuracy and speed when compared with the conventional method, but are disadvantageous in terms of model complexity. However, the complexity of the model is not a significant concern when considering the performance improvement, that is, up to 30% and 8 s improvements in accuracy and speed, respectively.
Therefore, different techniques can be used depending on the application. If detection time is important, CSL with LR, RF and NB would be the best combinations because they are faster than the conventional and Ra-CSL techniques. Furthermore, if detection accuracy is important, Ra-CSL with LR, DT and NB can be used to detect malicious traffic efficiently.
The widespread use of IoT devices in various industrial fields has resulted in increased cyber-attacks targeting them. Particularly, IoT devices are often part of a network with various other devices; hence, the damage caused by a cyber-attack is significant. At the same time, they are vulnerable to attacks owing to the limitations of resources such as memory and batteries. However, it is challenging to introduce traditional network monitoring methods and threat detection systems into IoT with constrained environments because of the significant overhead of storing and managing a large amount of constantly collected data.
This study proposed a bitmap-based data compression method for efficient attack detection in the IoT environment. By comparing the experimental results under data compression rates of 30%, 50% and 100%, the detection rate changed according to the degree of data loss, and the optimal degree of compression for each model was confirmed. As the compression rate increased, the data size decreased by up to 20%, proving that it is a suitable method in a constrained IoT environment. In addition, data compression techniques reduced the training time by up to 67% in LR. Moreover, the training and testing time in the CSL technique was reduced by 8 s when compared with that of the conventional methods. The average detection rate of the conventional method was 57.4%, whereas those of the CSL and Ra-CSL were 76.6% and 66.8%, respectively, which demonstrated the improved detection rate of the proposed methods. Particularly, the highest accuracy of 99% was obtained with the NB model of Ra-CSL under a CR of 100%. However, in the case of Ra-CSL, the detection time was increased because of training with the first detected traffic through the compression process and the process of importing the original dataset using the index information. Therefore, based on the characteristics of the application, one of the two proposed methods can be selected. For example, in the case of IoT devices that require real-time data collection and processing, such as in climate change and traffic conditions, the CSL technique can be used to detect malicious traffic quickly. In the case of IoT devices that need to be used for major infrastructure or for collecting research data, it is possible to accurately detect malicious traffic by utilizing the Ra-CSL technique.
However, this study had a limitation: the training and detection time increases because of the two-model training in Ra-CSL. In future studies, a pre-trained model and a more efficient algorithm to import the original dataset will be used to shorten the training time; further, the performance will be compared with that of the existing state-of-the-art. Another limitation of the current study is that the effect of the dataset or feature used in the experiment was not measured. For example, the feature and data values may vary depending on the dataset type, and the attack label may vary depending on the attack scenario. Hence, the bitmap rule and performance may change. Therefore, a future study will be conducted to analyze the effect of the proposed technique when using various datasets and features.
Acknowledgement: This paper is a supplementary and extended version of the paper presented at the 6th International Symposium on Mobile Internet Security (MobiSec’22).
Funding Statement: This work was partly supported by a Korea Institute for Advancement of Technology (KIAT) Grant funded by the Korean Government (MOTIE) (P0008703, The Competency Development Program for Industry Specialists) and the MSIT under the ICAN (ICT Challenge and Advanced Network of HRD) program (No. IITP-2022-RS-2022-00156310) supervised by the Institute of Information Communication Technology Planning and Evaluation (IITP).
Author Contributions: Conceptualization: Yu-Rim Lee, Il-Gu Lee; Methodology: Yu-Rim Lee, Na-Eun Park; Software: Yu-Rim Lee, Na-Eun Park, Seo-Yi Kim; Validation: Yu-Rim Lee, Na-Eun Park, Il-Gu Lee; Resources: Na-Eun Park, Seo-Yi Kim; Investigation: Yu-Rim Lee, Na-Eun Park; Visualization: Yu-Rim Lee, Seo-Yi Kim; Supervision: Il-Gu Lee; Project administration: Il-Gu Lee; Funding acquisition: Il-Gu Lee; Writing-original draft: Yu-Rim Lee, Na-Eun Park, Seo-Yi Kim; Writing-review and editing: Il-Gu Lee.
Availability of Data and Materials: Data openly available in a public repository. The data that support the findings of this study are openly available in UNSW-NB15 at https://research.unsw.edu.au/projects/unsw-nb15-dataset.
Conflicts of Interest: The authors declare that they have no conflicts of interest to report regarding the present study.
References
1. N. Gupta, S. Sharma, P. K. Juneja and U. Garg, “SDNFV 5G-IoT: A framework for the next generation 5G enabled IoT,” in Proc. of the Int. Conf. on Advances in Computing, Communication & Materials, Dehradun, India, pp. 289–294, 2020. [Google Scholar]
2. Y. Siriwardhana, G. Gur, M. Ylianttila and M. Liyange, “The role of 5G for digital healthcare against COVID-19 pandemic: Opportunities and challenges,” ICT Express, vol. 7, no. 2, pp. 244–252, 2021. [Google Scholar]
3. S. Y. Kim, S. W. Yun, E. Y. Lee, S. H. Bae and I. G. Lee, “Fast packet inspection for end-to-end encryption,” Electronics, vol. 9, no. 11, pp. 1937, 2020. [Google Scholar]
4. H. Kaur and R. Tiwari, “Endpoint detection and response using machine learning,” Journal of Physics: Conference Series, vol. 2062, pp. 12–13, 2021. [Google Scholar]
5. N. E. Park, Y. R. Lee, S. Joo, S. Y. Kim, S. H. Kim et al., “Performance evaluation of a fast and efficient intrusion detection framework for advanced persistent threat-based cyberattacks,” Computers and Electrical Engineering, vol. 105, pp. 108548, 2023. [Google Scholar]
6. J. S. Gomez, D. G. Carrillo, R. S. Iborra, J. H. Ramos, J. Granjal et al., “Integrating LPWAN technologies in the 5G ecosystem: A survey on security challenges and solutions,” IEEE Access, vol. 8, pp. 216437–216460, 2020. [Google Scholar]
7. A. Verma and V. Ranga, “Machine learning based intrusion detection systems for IoT applications,” Wireless Personal Communications, vol. 111, pp. 2287–2301, 2020. [Google Scholar]
8. M. Humayun, N. Jhanjhi, A. Alsayat and V. Ponnusamy, “Internet of Things and ransomware: Evolution, mitigation and prevention,” Egyptian Informatics Journal, vol. 22, pp. 105–117, 2021. [Google Scholar]
9. I. Varalakshmi, M. Thenmonzhi and R. Sasi, “Detection of distributed denial of service attack in an internet of things environment-a review,” in Proc. of the Int. Conf. on System, Computation, Automation and Networking (ICSCAN), Puducherry, India, pp. 1–6, 2021. [Google Scholar]
10. S. Udipi, “The event data management problem: Getting the most from network detection and response,” Network Security, vol. 2021, no. 1, pp. 12–14, 2021. [Google Scholar]
11. P. Fei and Z. Li, “SEAL: Storage-efficient causality analysis on enterprise logs with query-friendly compression,” in Proc. of the 30th USENIX Security Symp. (USENIX Security 21), Online, pp. 2987–3004, 2021. [Google Scholar]
12. S. Eswaran, A. Srinivasan and P. Honnavalli, “A Threshold-based, real-time analysis in early detection of endpoint anomalies using SIEM expertise,” Network Security, vol. 2021, no. 4, pp. 7–16, 2021. [Google Scholar]
13. V. Panchami and M. M. Mathews, “A substitution Box for lightweight ciphers to secure Internet of Things,” Journal of King Saud University-Computer and Information Sciences, vol. 35, no. 4, pp. 75–89, 2023. [Google Scholar]
14. N. Moustafa and J. Slay, “UNSW-NB15: A comprehensive data set for network intrusion detection systems (UNSW-NB15 network data set),” in Proc. of the Military Communications and Information Systems Conf., Canberra, Australia, pp. 166, 2015. [Google Scholar]
15. N. Moustafa and J. Slay, “The evaluation of network anomaly detection systems: Statistical analysis of the UNSW-NB15 data set and the comparison with the KDD99 data set,” Information Security Journal: A Global Perspective, vol. 25, no. 1–32016, pp. 18–31, 2016. [Google Scholar]
16. N. Moustafa, J. Slay and G. Creech, “Novel geometric area analysis technique for anomaly detection using trapezoidal area estimation on large-scale networks,” IEEE Transactions on Big Data, vol. 5, no. 4, pp. 481–494, 2019. [Google Scholar]
17. N. Moustafa, G. Creech and J. Slay, “Big data analytics for intrusion detection system: Statistical decision-making using finite dirichlet mixture models,” in Data Analytics and Decision Support for Cybersecurity: Trends, Methodologies and Applications. Berlin/Heidelberg, Germany: Springer Cham, no. 5, pp. 127–156, 2017. [Google Scholar]
18. M. Sarhan, S. Layeghy, N. Moustafa and M. Portmann, “NetFlow datasets for machine learning-based network intrusion detection systems,” in Proc. of the 10th Int. Conf. on Big Data Technologies and Applications (BDTA) 2020, 13th EAI Int. Conf. on Wireless Internet, WiCON 2020 Big Data Technologies and Applications, Online, pp. 117–135, 2021. [Google Scholar]
19. Z. Liu, L. Zhang, Q. Ni, R. Wang, Y. Li et al., “An integrated architecture for IoT malware analysis and detection,” in Proc. of the Int. Conf. on Internet of Things as a Service, Xi’an, China, vol. 271, pp. 127–137, 2019. [Google Scholar]
20. A. Mudgerikar, P. Sharma and E. Bertino, “E-Spion: A system-level intrusion detection system for IoT devices,” in Proc. of the ACM Asia Conf. on Computer and Communications Security, New York, NY, United States, pp. 493–500, 2019. [Google Scholar]
21. O. Eboya, J. B. Juremi and M. Shahpasand, “An intelligent framework for malware detection in Internet of Things (IoT) ecosystem,” in Proc. of the IEEE 8th R10 Humanitarian Technology Conf., Kuching, Malaysia, pp. 1–6, 2020. [Google Scholar]
22. J. Jeon, J. H. Park and Y. S. Jeong, “Dynamic analysis for IoT malware detection with convolution neural network model,” IEEE Access, vol. 8, pp. 96899–96911, 2020. [Google Scholar]
23. S. Rajagopal, P. P. Kundapur and K. S. Hareesha, “A stacking ensemble for network intrusion detection using heterogeneous datasets,” Security and Communication Networks, vol. 2020, pp. 9, 2020. [Google Scholar]
24. S. Choudhary and N. Kesswani, “Analysis of KDD-Cup’99, NSL-KDD and UNSW-NB15 datasets using deep learning in IoT,” Procedia Computer Science, vol. 167, pp. 1561–1573, 2020. [Google Scholar]
25. V. Kumar, D. Sinha, A. K. Das, S. C. Pandey and R. T. Goswami, “An integrated rule-based intrusion detection system: Analysis on UNSW-NB15 data set and the real time online dataset,” Cluster Computing, vol. 23, pp. 1397–1418, 2020. [Google Scholar]
26. Z. Wang, J. Tiam, H. Fang, L. Chen and J. Qin, “LightLog: A lightweight temporal convolutional network for log anomaly detection on the edge,” Computer Networks, vol. 203, pp. 108616, 2022. [Google Scholar]
27. G. Signoretti, M. Silva, P. Andrade, I. Silva, E. Sisinni et al., “An evolving TinyML compression algorithm for IoT environments based on data eccentricity,” Sensors, vol. 21, no. 12, pp. 4153, 2021. [Google Scholar] [PubMed]
28. J. Azar, A. Makhoul, R. Counturier and J. Demerjian, “Robust IoT time series classification with data compression and deep learning,” Neurocomputing, vol. 398, pp. 222–234, 2020. [Google Scholar]
29. B. Yildiz, “Optimizing bitmap index encoding for high performance queries,” Concurrency and Computation: Practice and Experience, vol. 33, no. 18, pp. 1–9, 2020. [Google Scholar]
30. M. Alabadi, A. Habbal and X. Wei, “Industrial internet of things: Requirements, architecture, challenges, and future research directions,” IEEE Access, vol. 10, pp. 66374–66400, 2022. [Google Scholar]
31. S. Susanto, D. Stiawan, M. A. S. Arifin, M. Y. Idris and R. Budiarto, “IoT botnet malware classification using weka tool and scikit-learn machine learning,” in Proc. of the 7th Int. Conf. on Electrical Engineering, Computer Sciences and Informatics, Yogyakarta, Indonesia, pp. 15–20, 2020. [Google Scholar]
Cite This Article
 Copyright © 2023 The Author(s). Published by Tech Science Press.
This work is licensed under a Creative Commons Attribution 4.0 International License , which permits unrestricted use, distribution, and reproduction in any medium, provided the original work is properly cited.
 Downloads
 Citation Tools