
 Submit a Paper
 Propose a Special lssue
 Open Access
ARTICLE

Diagnosis of Autism Spectrum Disorder by Imperialistic Competitive Algorithm and Logistic Regression Classifier
1 Department of Computer Science, College of Computer Engineering and Sciences, Prince Sattam bin Abdulaziz University, Al Kharj, 16274, Saudi Arabia
2 Department of Computer Science, College of Computer Science and Engineering, Taibah University, Madinah, 41411, Saudi Arabia
3 Department of Information Systems, College of Computer Engineering and Sciences, Prince Sattam bin Abdulaziz University, Al Kharj, 16274, Saudi Arabia
* Corresponding Author: Shabana R. Ziyad. Email:
Computers, Materials & Continua 2023, 77(2), 1515-1534. https://doi.org/10.32604/cmc.2023.040874
Received 02 April 2023; Accepted 25 July 2023; Issue published 29 November 2023
 View Full Text
 Download PDF
Abstract
Autism spectrum disorder (ASD), classified as a developmental disability, is now more common in children than ever. A drastic increase in the rate of autism spectrum disorder in children worldwide demands early detection of autism in children. Parents can seek professional help for a better prognosis of the child’s therapy when ASD is diagnosed under five years. This research study aims to develop an automated tool for diagnosing autism in children. The computer-aided diagnosis tool for ASD detection is designed and developed by a novel methodology that includes data acquisition, feature selection, and classification phases. The most deterministic features are selected from the self-acquired dataset by novel feature selection methods before classification. The Imperialistic competitive algorithm (ICA) based on empires conquering colonies performs feature selection in this study. The performance of Logistic Regression (LR), Decision tree, K-Nearest Neighbor (KNN), and Random Forest (RF) classifiers are experimentally studied in this research work. The experimental results prove that the Logistic regression classifier exhibits the highest accuracy for the self-acquired dataset. The ASD detection is evaluated experimentally with the Least Absolute Shrinkage and Selection Operator (LASSO) feature selection method and different classifiers. The Exploratory Data Analysis (EDA) phase has uncovered crucial facts about the data, like the correlation of the features in the dataset with the class variable.Keywords
Autism spectrum disorder is a neurological disorder that results in developmental setbacks affecting the children’s social, communication, and behavioral activities. Children affected by ASD have difficulty interacting with parents, teachers, and friends. They show restricted interest in communicating with others. Such children suffer from maintaining eye contact with the people that they interact with. They have poor attention-holding ability, making it difficult to listen to others. According to statistics, 16 to 18 percent of children diagnosed with Down syndrome have autism [1]. Autism-affected children are oversensitive to noise and insensitive to pain. They seem lost in their thoughts, show difficulty recognizing their emotions, and sometimes have unusual memory. ASD starts in childhood but persists even when the person reaches adulthood. In 2021, the Center for Disease Control and Prediction, United States of America, reported that approximately 1 in 44 children is diagnosed with ASD. Children are usually diagnosed with ASD at the age of 3 years [2]. Autism can be detected in children under three years, and language delays can be seen in children as early as 18 months [3]. Children detected with ASD below five years, when trained with occupational and speech therapies, find remarkable improvement in their communication skills. Repetitive and stereotyped behavior, lack of social and language skills, poor eye contact, and delayed speech are warning alarms of autism to the parents. In very young children, a social skills assessment is challenging. Therefore, the limited eye contact with the parents, inability to bring an object, and inability to imitate the parent are the critical factors in identifying a child affected with ASD. In ASD, children aged 15 to 24 months encounter a degradation in language development. The child should maintain joint attention with the caregiver in sharing a social interaction between 8 to 16 months. ASD children generally lack this joint attention skill, and it is a critical feature in identifying ASD at an early age. All these signs and symptoms aid the parents or guardians in detecting ASD at an early stage [4]. Early detection of ASD helps in early intervention, improving the children’s learning ability, communication, and social skills.
The study collected ASD children data studying in special schools under the age of 15 and was named as Questionnaire based ASD (QBASD) dataset. The QBASD dataset has been carefully selected to include questions about the vital features to detect autism in children. The study identifies the most discriminating features from the dataset by feature selection methods of LASSO and the ICA. The selected feature set improves efficiency in classifying the test data by diagnosing the child as ASD or non-ASD. LR, Decision tree, KNN, and RF classifiers classify ASD from non-ASD subjects. The novelty of this research work lies in the design of CADx, and the questionnaire-based dataset collected from parents of ASD and normal children. The proposed methodology with the ICA algorithm for feature selection in the QBASD dataset and LR as a classifier is a novel methodology for diagnosing autism with machine learning. This CADx aims to detect autism early by training the model with data samples of children under five.
This section discusses the related study on early diagnosis of ASD in children. Researchers have identified several biomarkers to detect ASD at an early age. Any neuroimaging modality that discovers abnormal patterns in brain activity could detect ASD. Children with autism have typical morphological patterns in the Electroencephalogram (EEG) signals. One-dimensional local binary pattern extracts the features from EEG signals. The spectrogram images are generated from feature-extracted images using a short-time Fourier transform. The Relief algorithm carries out feature ranking and selection. With the SVM classifier, the model achieved an accuracy of 96.44% [5]. Magnetic Resonance Imaging (MRI) and resting state functional Magnetic Resonance Imaging (fMRI) images are studied to represent anatomical and functional connectivity abnormalities. The classification accuracy is 75% and 79% for fMRI and MRI data. The fusion of both datasets gives a higher accuracy of 81% [6]. The shortcoming of the above research work is that children must undergo neuroimaging tests, which is an unpleasant experience for them. Sixty acoustic features were extracted from the audio recording of 712 ASD children, and the feature selection method selected twenty-one deterministic features. Convolution Neural Network (CNN) showed improved results compared to Support Vector Machine (SVM) and Linear Regression in this study [7]. Facial expressions and vocal characteristics are biomarkers and detect ASD with 73% accuracy. The signs like reduced social smiling, higher voice frequency, and harmonic-to-noise ratio are significant biomarkers for ASD detection [8]. The eye movement data of ASD children is analyzed to distinguish between autism and non-autism subjects. The eye gaze feature used in the supervised machine learning model aids in ASD detection. The model achieved an accuracy of 86% and a sensitivity of 91% [9]. This study investigated the gaze behavior with classifiers such as SVM, Decision tree, Linear discriminant analysis, and RF. Classification accuracy for the visual fixation feature is 82.64% [10]. The features extracted from acoustic, video, and handwriting time series classified ASD children and children with neurotypical development. Eigenvalues of this correlation presented the coordination of speech with handwriting as a potential biomarker for classifying subjects [11]. The ASD subjects have unusual facial expressions and gaze patterns when they look at complex scenes. The authors have leveraged this fact to classify healthy subjects from ASD subjects. Classification accuracy is 85.8% for studying facial expressions from photographs [12]. The research studies discussed so far have the shortcoming of being expensive to develop, time-consuming, and exhibiting unsatisfactory accuracy rates. This research study aims to collect data from parents regarding their children’s behavior to identify the most deterministic biomarkers for ASD detection. Selecting a highly deterministic feature set can improve the classification model performance to a great extent.
2.1 Proposed Methodology for Diagnosis of ASD
The proposed methodology is a novel ICA feature selection algorithm with an LR classifier. The proposed study is a promising methodology based on the data collected through a parent-reported questionnaire based on the child’s behavior. A diligent study of the biomarkers for ASD resulted in the questionnaire. The signs identified with the natural evolutionary history of ASD in infants are categorized. The first category is Prenatal, to study preconception through the gestation period and identifies biomarkers that trigger the development of ASD in offspring. The questionnaire includes questions on the mother’s health condition, socio-economic status, and medication details to study this biomarker. The second category is pre-symptomatic, where the child shows chances of developing ASD [13]. The questions based on social interactions and emotional responses predict the child’s potential risk of developing ASD. The communication and cognitive components are the questionnaires confirming the diagnosis of ASD in children. The questionnaire in this novel study included questions in line with the biomarkers that identify the signs of ASD in infants from the prenatal stage to the toddler stage. This study aims at developing a CADx that classifies ASD children from non-ASD children. The proposed methodology is compared with the LASSO feature selection method, followed by LR for the classification of the QBASD dataset. Fig. 1 is the block diagram for the proposed CADx for the autism diagnosis.
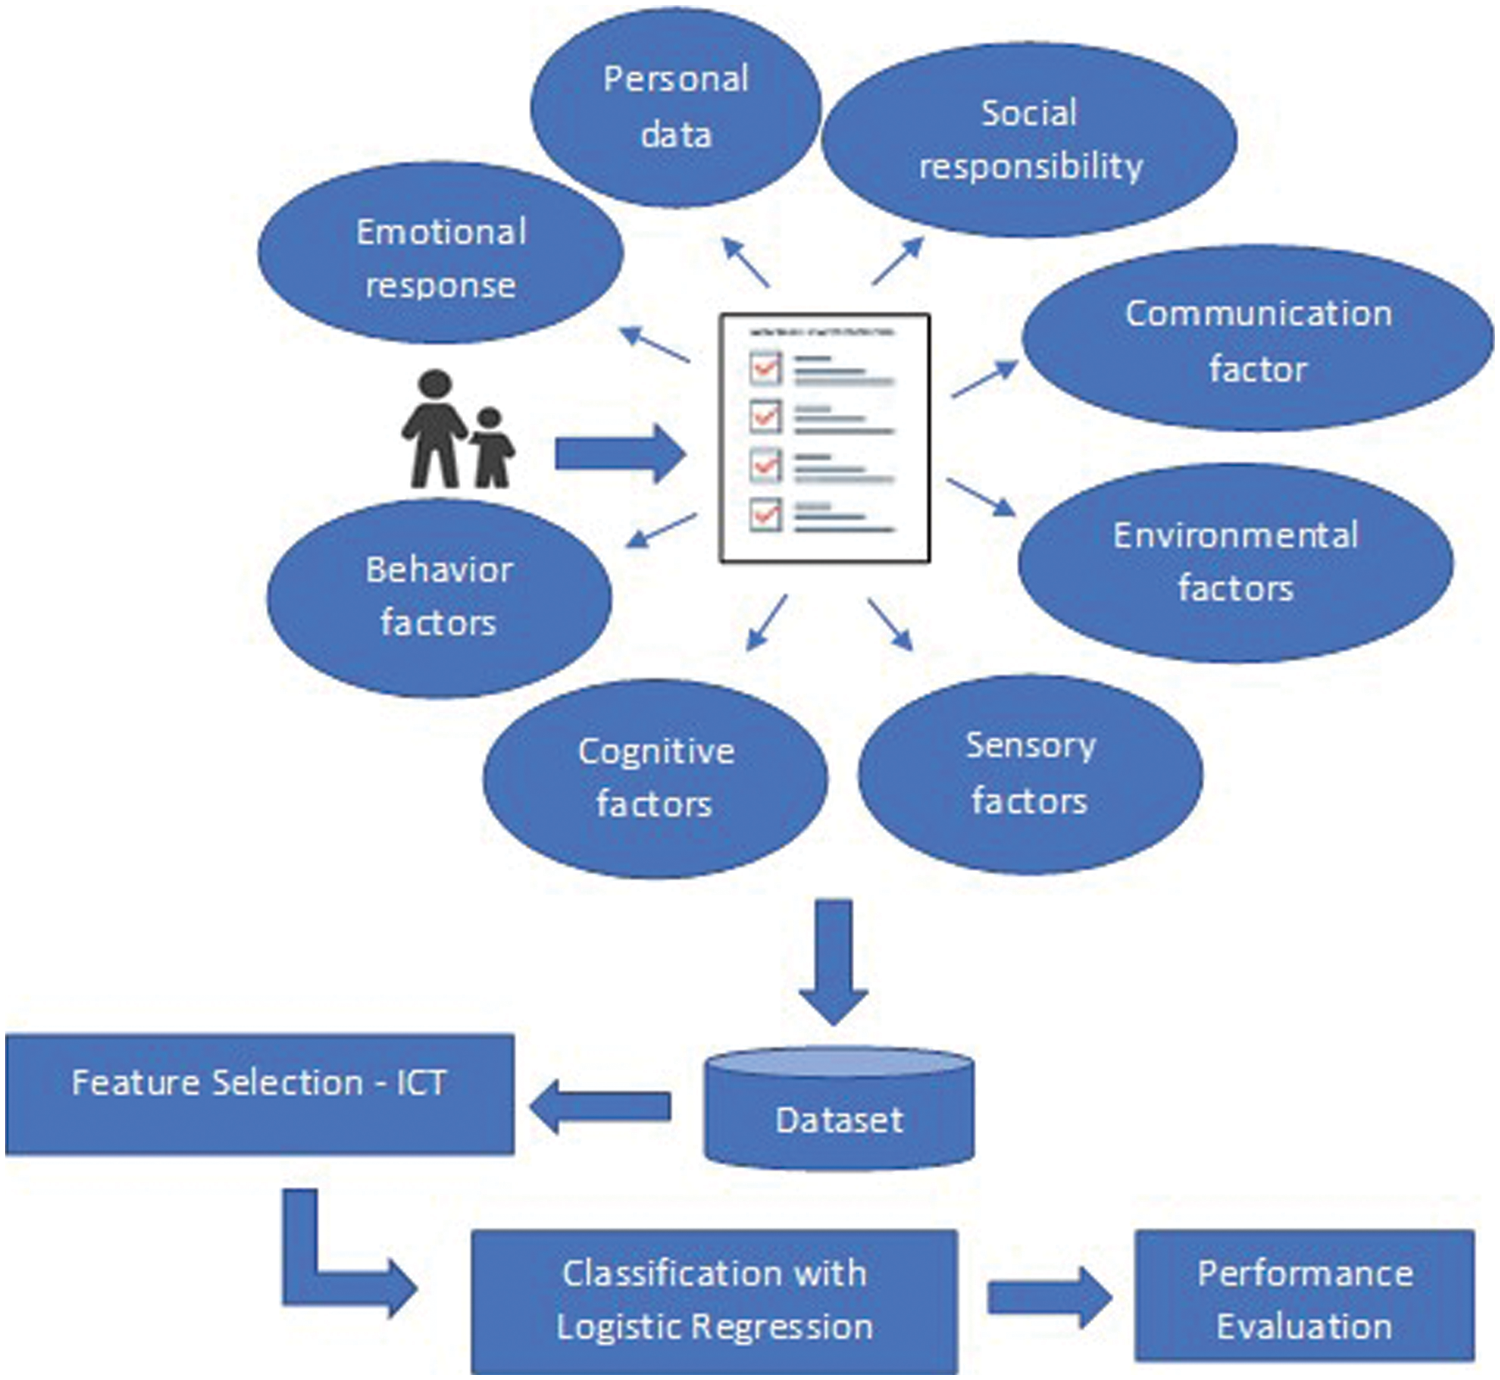
Figure 1: Proposed methodology for AI-based ASD detection tool
The QBASD dataset is the questionnaire filled out by parents of children under 15. The questionnaire was designed after discussions with medical practitioners and experts giving therapy and help to ASD children. The questionnaire includes all questions related to the vital signs of ASD detection in children. The questions included in the questionnaire are the child’s social skill assessment, emotional response to parents or caregivers, communication skills, behavior issues, sensory impulses, the cognitive component, and history of the mother’s medications. The dataset has many samples of responses from parents of ASD-detected children under five years. Parents of special education schools and individuals filled out the QBASD questionnaire. A short description of the research study informed the parents the objective of the research study and motivated them to fill out the questionnaire accurately. The dataset QBASD is the downloaded responses from QBASD questionnaire. The dataset has a sample size of 321 and is balanced data. The dataset excluding personal information like age, gender, and nationality of the child has questions from Q1 to Q29.
Machine Learning (ML) algorithms detect patterns and make accurate classifications and predictions about the data. The performance of the ML algorithm depends on the dataset’s quality. Noisy, inadequate, and redundant data negatively impact classification or prediction accuracy. The response variable specifies the class for a particular data sample in any labeled dataset. It is optional that all the features strongly correlate with the response variable. Certain features are redundant, insignificant, and correlate poorly with the response variable. Elimination of in-significant features results in dimensionality reduction. Filter, wrapper, and hybrid methods are conventional feature selection methods [14]. In the high-dimension dataset, certain features have a low correlation with the response variable of the dataset. Feature selection aims to construct a new dataset from the original dataset with features highly correlated with the response variable [15]. For high dimensional data sets, penalized regression is a promising approach for most deterministic variable selection. LASSO penalization is an excellent method for feature selection in the high-dimensional dataset. This study compares the Imperialistic competitive algorithm with the LASSO feature selection method. The methods are studied experimentally by common classifiers, and results are recorded in the result and discussion section.
2.3.1 Least Absolute Selection and Shrinkage Operator
In logistic lasso if n is the number of samples collected for the dataset D. Let
where
Some of the coefficients of
The critical factor is the selection of penalization parameter λ. The penalization parameter directly impacts the number of selected feature variables and the degree to which they are penalized to zero [16]. A higher value of λ reduces all the coefficients of feature variable
A feature selection step before classification shows significant improvement in classification performance. LASSO feature selection method selects the feature variable set
2.3.2 ASD Detection Algorithm with LASSO
The following subsection is the algorithm for the proposed methodology:
Input: QBASD dataset.
Output: Classification of the test sample data.
Step 1: Convert the text dataset into a numerical dataset and represent it as QBASD.
Step 2: The feature selection is carried out on the dataset QBASD using LASSO.
Step 3: The reduced feature set QBASD’ is the input to the LR classifier.
Step 4: Evaluate the proposed methodology using standard metrics.
Step 5: Compare the proposed methodology with the other ML algorithms.
2.3.3 Imperialist Competitive Algorithm
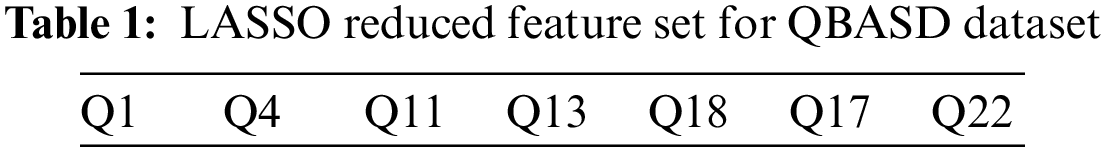
Atashpaz-Gargari et al. developed the ICA algorithm, a metaheuristic algorithm with improved convergence ability, in 2007 [19]. The ICA algorithm leverages the idea of colonization, a simulation of the political process of imperialism. The powerful countries overpowered the weaker countries with their military resources, making them part of their colonies. ICA is an optimization algorithm based on the concept of political conquer. ICA algorithms find their application in networking and industrial engineering. In Industrial engineering, ICA is an optimization algorithm that optimizes the problems on U-type stochastic assembly line balancing [20], model sequencing [21], assembly sequence planning [22], engineering design, and production planning [23]. One of the latest research works uses the ICA and Bat algorithm for feature selection before applying the ML algorithm for breast cancer prediction [24]. The algorithm considers all the entities in the population as countries. Some strong countries in the population are imperialist empires, and others are colonies of the selected imperialists. Initially, colonies were distributed to the imperialist states according to their power. In each competition, the colonies move towards the relevant imperialistic empire. The competition is assessed by the imperialistic empire’s total cost and the percentage of the mean cost of colonies. The empires grew in power by attracting the colonies of competitor empires. The power of the empire is calculated based on the cost function. The empire that has power lesser than the previous competition is eliminated from the competition. As the rounds of competitions progress some empires become stronger in power, and others become weaker. This gradual process of imperialistic empires becoming stronger, some getting weaker, and finally converging as a single large empire is characteristic of an optimization algorithm [25]. This algorithm is effective in selecting the most discriminating features for the dataset. In the proposed study, there are 28 features in the dataset. Three significant features from the feature set are assigned as initial imperialistic states. The selected feature set extracted by the LASSO method are listed in Table 1. Table 2 shows the list of features selected by ICA as the best-discriminating feature set for the QBASD dataset.
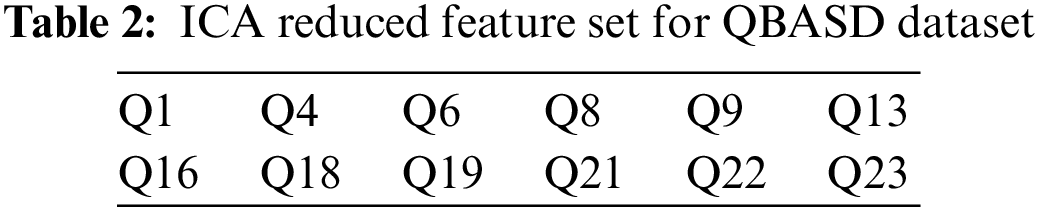
According to the feature importance ranking, Q11, Q13, and Q22 are set as imperialistic states. The remaining 25 features are set as colonies. The significant features or countries based on their ability to increase the classification performance are retained in the imperialistic states. The cost function for the metaheuristic algorithm should be a multimodal function with many minima location and just one global minima. The metaheuristic algorithm tries to find the ideal solution in a landscape; hence, multimodal cost functions are suitable for testing the searchability of any metaheuristic algorithm. Michalewicz is a multimodal cost function suitable for problems with fewer global optimum solutions in the search space [26].
where
2.3.4 Algorithm for Feature Selection Using ICA
Step 1: Set
Step 2: Set
Set
Step 3: Initialize the country list as a binary string with len{
Step 4: Repeat until k <
Step 4.1: For each of the empires
Step 4.1.1: Assimilate colonies.
where
Step 4.1.2: Compute the cost of colonies in the empire.
where f is the cost of nth imperialist
Step 4.1.3: Compute the cost of new colony
Step 4.1.4: If
Step 4.1.5: Compute the total cost
Step 4.1.6: End of loop
Step 4.2: Compute the distance between the empires.
Step 4.3: If the distance < threshold value
Step 4.3.1: Unite the empires.
Step 4.3.2: Update the position and cost of the colonies. The new position is
Step 4.4: Update the cost of new list of the empires
Step 4.5: Computer the Normalized cost
Step 4.6: Compute the Power
Step 4.7: Eliminate the empire with the weakest power or no colonies.
Step 4.8: If (
end loop
Step 5: Select the best feature set
Step 6: Classification is performed with the most common classifiers.
Step 7: Evaluate the performance of the classifiers with metrics of accuracy, precision, and F1-score.
2.3.5 ASD Detection Algorithm with ICA
Input: QBASD dataset.
Output: Classification of the test data.
Step 1: Convert the text ASD dataset into a numerical dataset and represent it as
Step 2: The feature selection is made on dataset
Step 3: The reduced feature set is given as the input to the LR classifier.
Step 4: Evaluate the proposed methodology using standard metrics.
Step 5: Compare the proposed methodology with the other ML algorithms.
The classification task aims to classify the new data sample into one of the labeled classes based on the pattern of the training dataset. Given a dataset Đ with a unique feature set
The linear model of the problem is
The logistic function is
The logit transformation is
The logit function implicitly places a separating hyperplane in the input space between the two instances [28]. Decision tree algorithms is a supervised learning algorithm that makes effective classification of the data based on multiple covariates. The decision tree classifier is a tree-structured classifier suitable for classifying medical data. The decision tree algorithm selects the most discriminating feature from the dataset and sets one of these features as the tree’s root. The tree is built by choosing the best attributes in the feature set as the decision nodes. As the tree grows, it splits the data samples into groups based on the decision nodes. The leaf nodes divide the data into classes. In medical data, there are chances of developing skewed trees; hence the decision tree is the best classification method to split the heavily skewed trees into ranges [29]. The root node classifies the dataset into disjoint sets. Selecting relevant features for each disjoint set and applying the same procedure constructs the complete tree. Any decision node generates nonoverlapping sub-datasets that are finally grouped as labeled classes by leaf nodes [30]. Based on the features, the decision tree can classify the data sample as ASD or non-ASD. KNN is a classification algorithm that labels the test data based on the similarity index of the nearby k, an odd number of labeled data samples. The test data is classified as a class frequently occurring among the k data samples close to the test data. The RF is the most popular ensemble method that creates multiple base learners to classify a new data sample. The base learner models are decision trees. Dataset D has feature set f and sample size s. The row sampling with replacement is a technique that selects multiple data samples from D as input to the multiple base learners denoted as DTi. The feature sampling selects random features to be an input to the DTi. The base learners are trained with data samples. The trained base learner classifies the new test data sample and gives the output. As each base learner predicts different outputs, the final decision is based on a majority voting scheme. Row sampling and feature sampling improve the classification accuracy. The multiple decision trees convert new sample data with high variance to low variance [31]. Fig. 2 represents the flow chart for the proposed ASD detection system with the ICA algorithm.
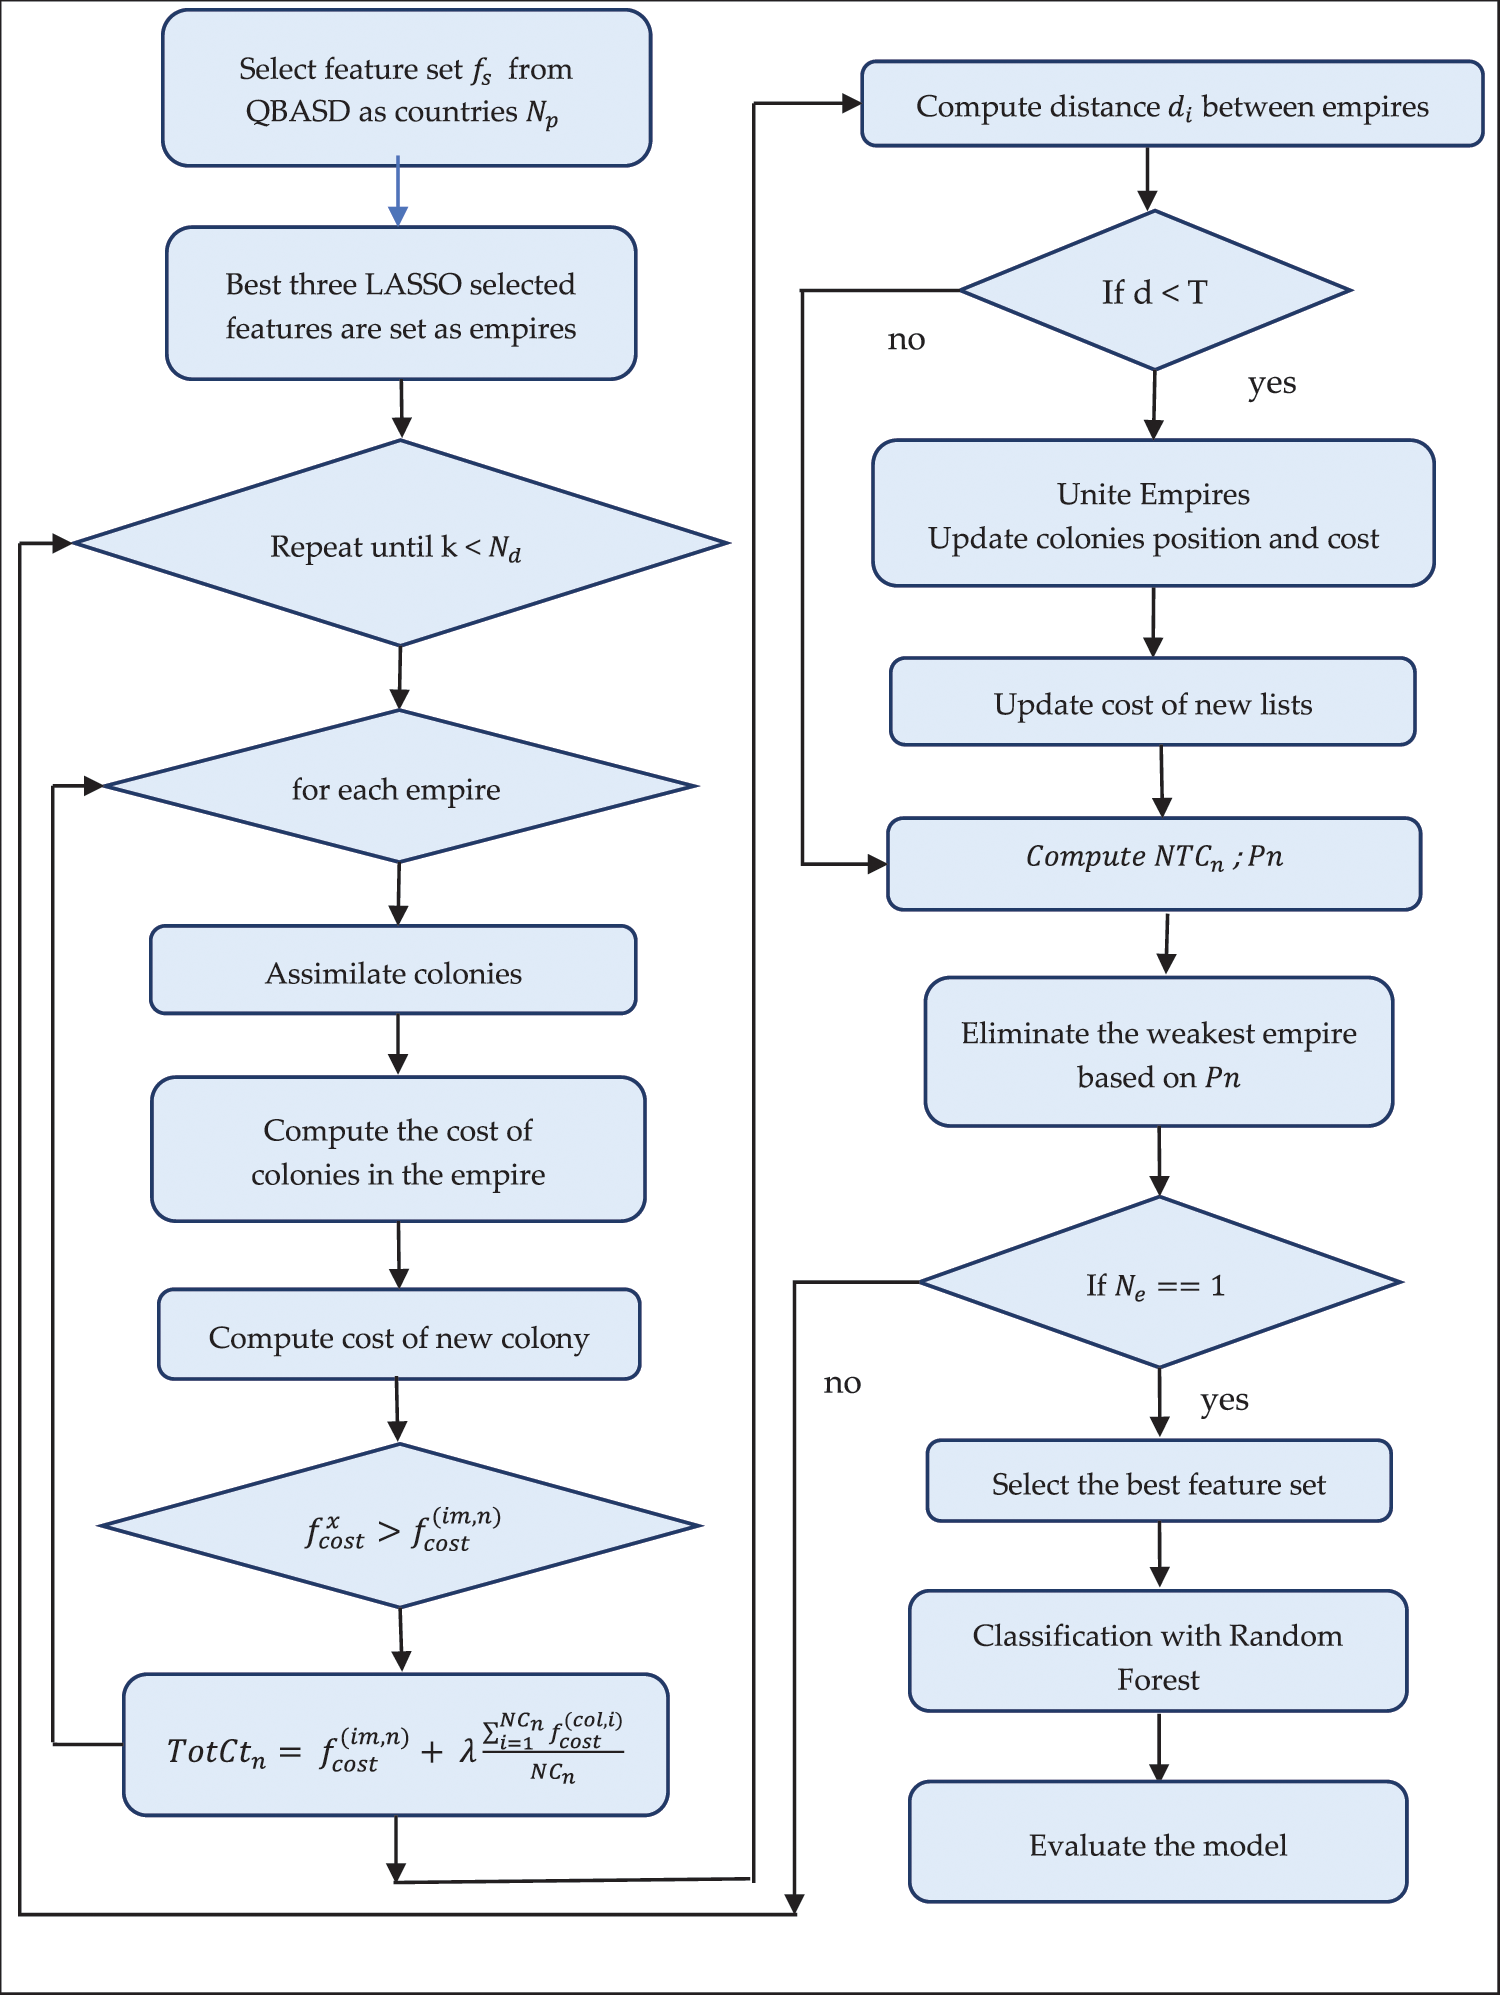
Figure 2: Flow chart for the proposed ASD detection system with ICA algorithm
The feature selection method, a preprocessing phase to classification, escalates the model’s performance by avoiding the overfitting of the data [32]. In this research, an experimental study analyzes the model performance with the proposed feature selection algorithm. The proposed algorithms are implemented in Python using the dataset QBASD. The classification accuracy of common classifiers on the QBASD without feature reduction are tabulated in Table 3.
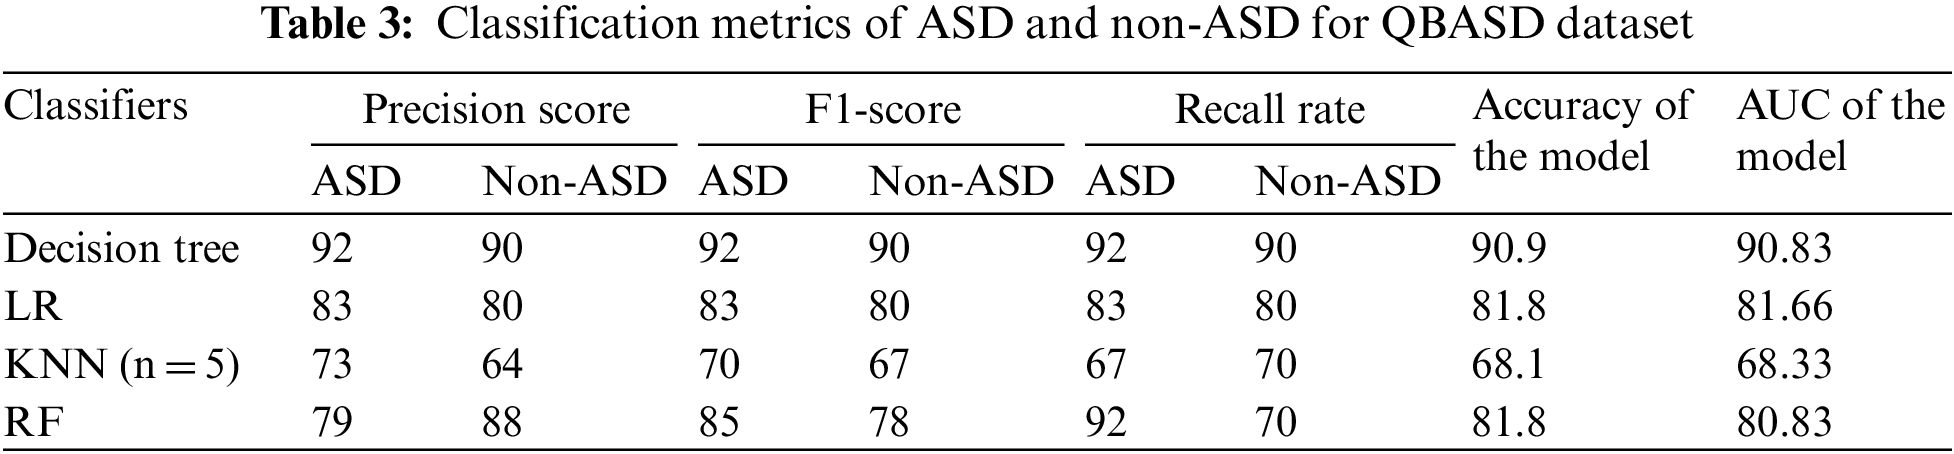
The receiver operating characteristics (ROC) curve is the graph showing the performance of the classification model. The graph plots the false positive rate along the x-axis and the true positive rate along the y-axis. The area under the curve (AUC) measures the area under the ROC curve. Fig. 3 shows the ROC curve results for the QBASD dataset. Fig. 3a shows the decision tree classifier has the highest performance metric compared to other classifiers. The decision tree performs best as the features at each node classify the dataset into two sets. LR performance could be better than the performance of the decision tree, as it is a more efficient prediction model than the classification model. KNN is a victim of the curse of dimensionality; hence, the performance is inferior for a complete QBASD dataset. High k values result in underfitting; low k values will result in overfitting. In RF, the recall rate is high as the true positives are high and false negatives are negligible for ASD class detection. The precision of the ASD detection model is low as false positives are high.
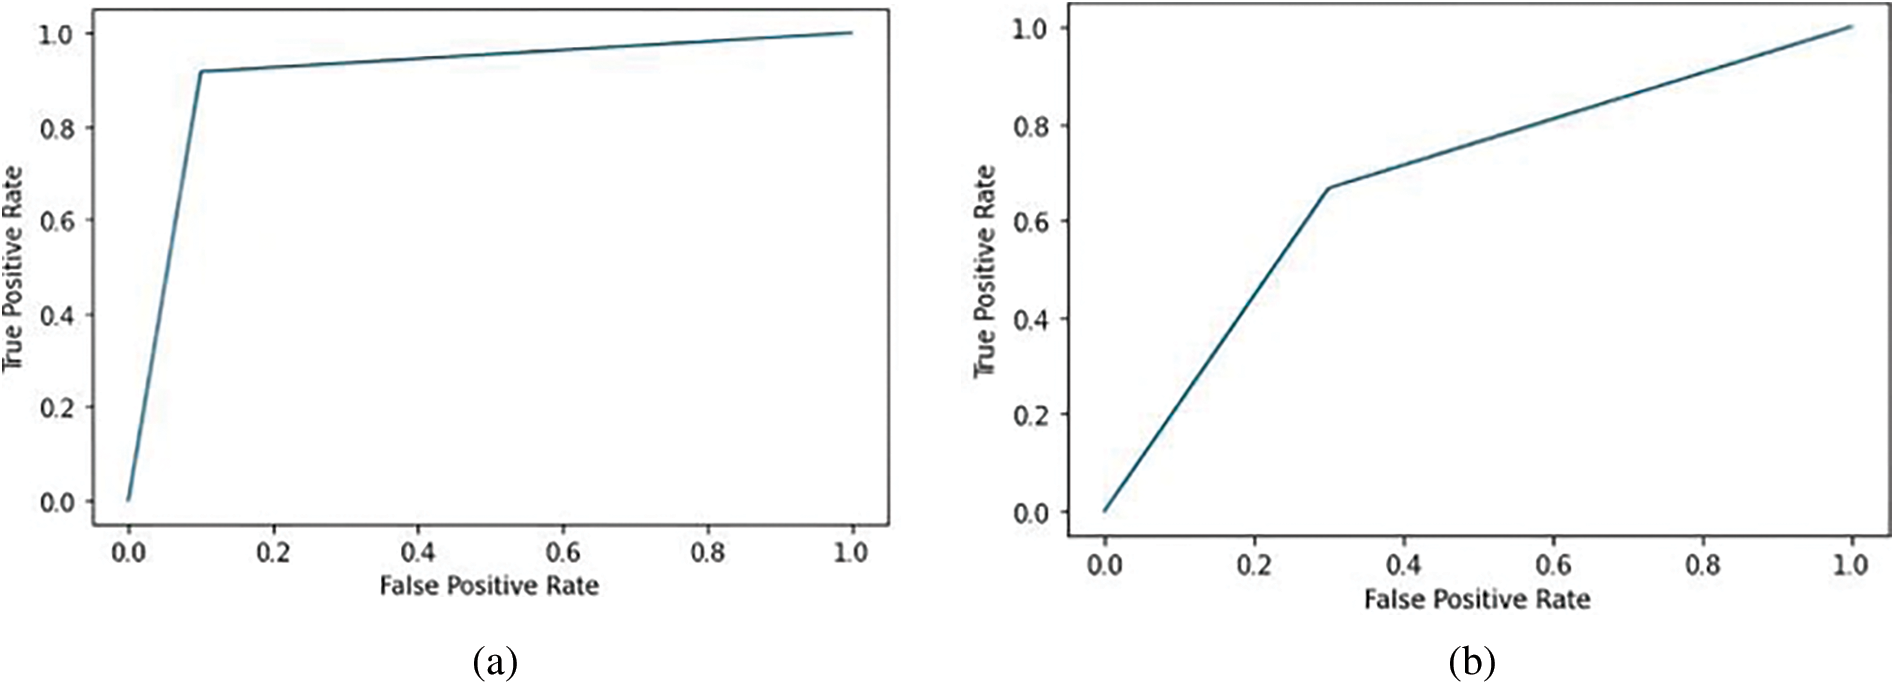
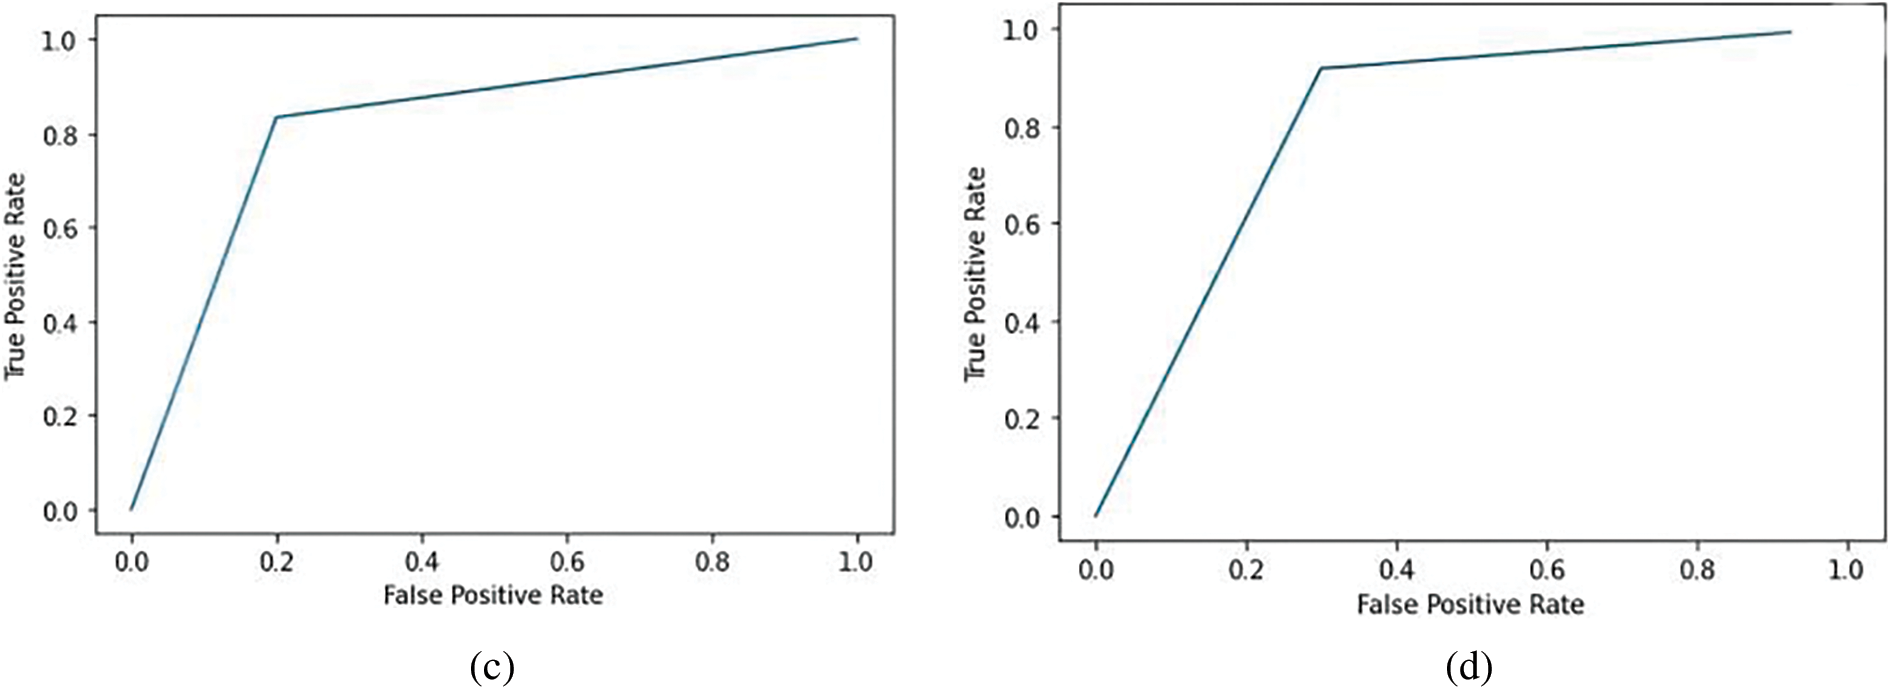
Figure 3: ROC curve for the classifiers based on QBASD (a) decision tree classifier (b) KNN classifier (c) LR classifier (d) RF classifier
Table 4 shows the classification metrics for the proposed ASD detection model with the ICA feature reduction algorithm. The LR and RF classifiers outperform the other classifiers. RF has the advantage of being robust to outliers; hence this algorithm performs well with QBASD data. The data may have outliers as the data is based on the child’s behavior and social interactions.
Fig. 4 shows the ROC curves after implementing the LASSO feature reduction algorithm and building classifiers in Python. The decision tree classifier works on a greedy approach; the decision at each level affects the next level, so the features affect the tree’s shape. The classifier performance could be better for small datasets. KNN is sensitive to outliers so a single outlier can change the classification boundary. It performs poorly as there may be outliers in the reduced dataset. LR performs exceptionally well for linear separable datasets. QBASD is a simple, linearly separable dataset; hence, LR performs exceptionally well. The Random Forest can handle outliers by binning the variables. It performs feature selection and builds its decision trees; therefore, the accuracy is high.
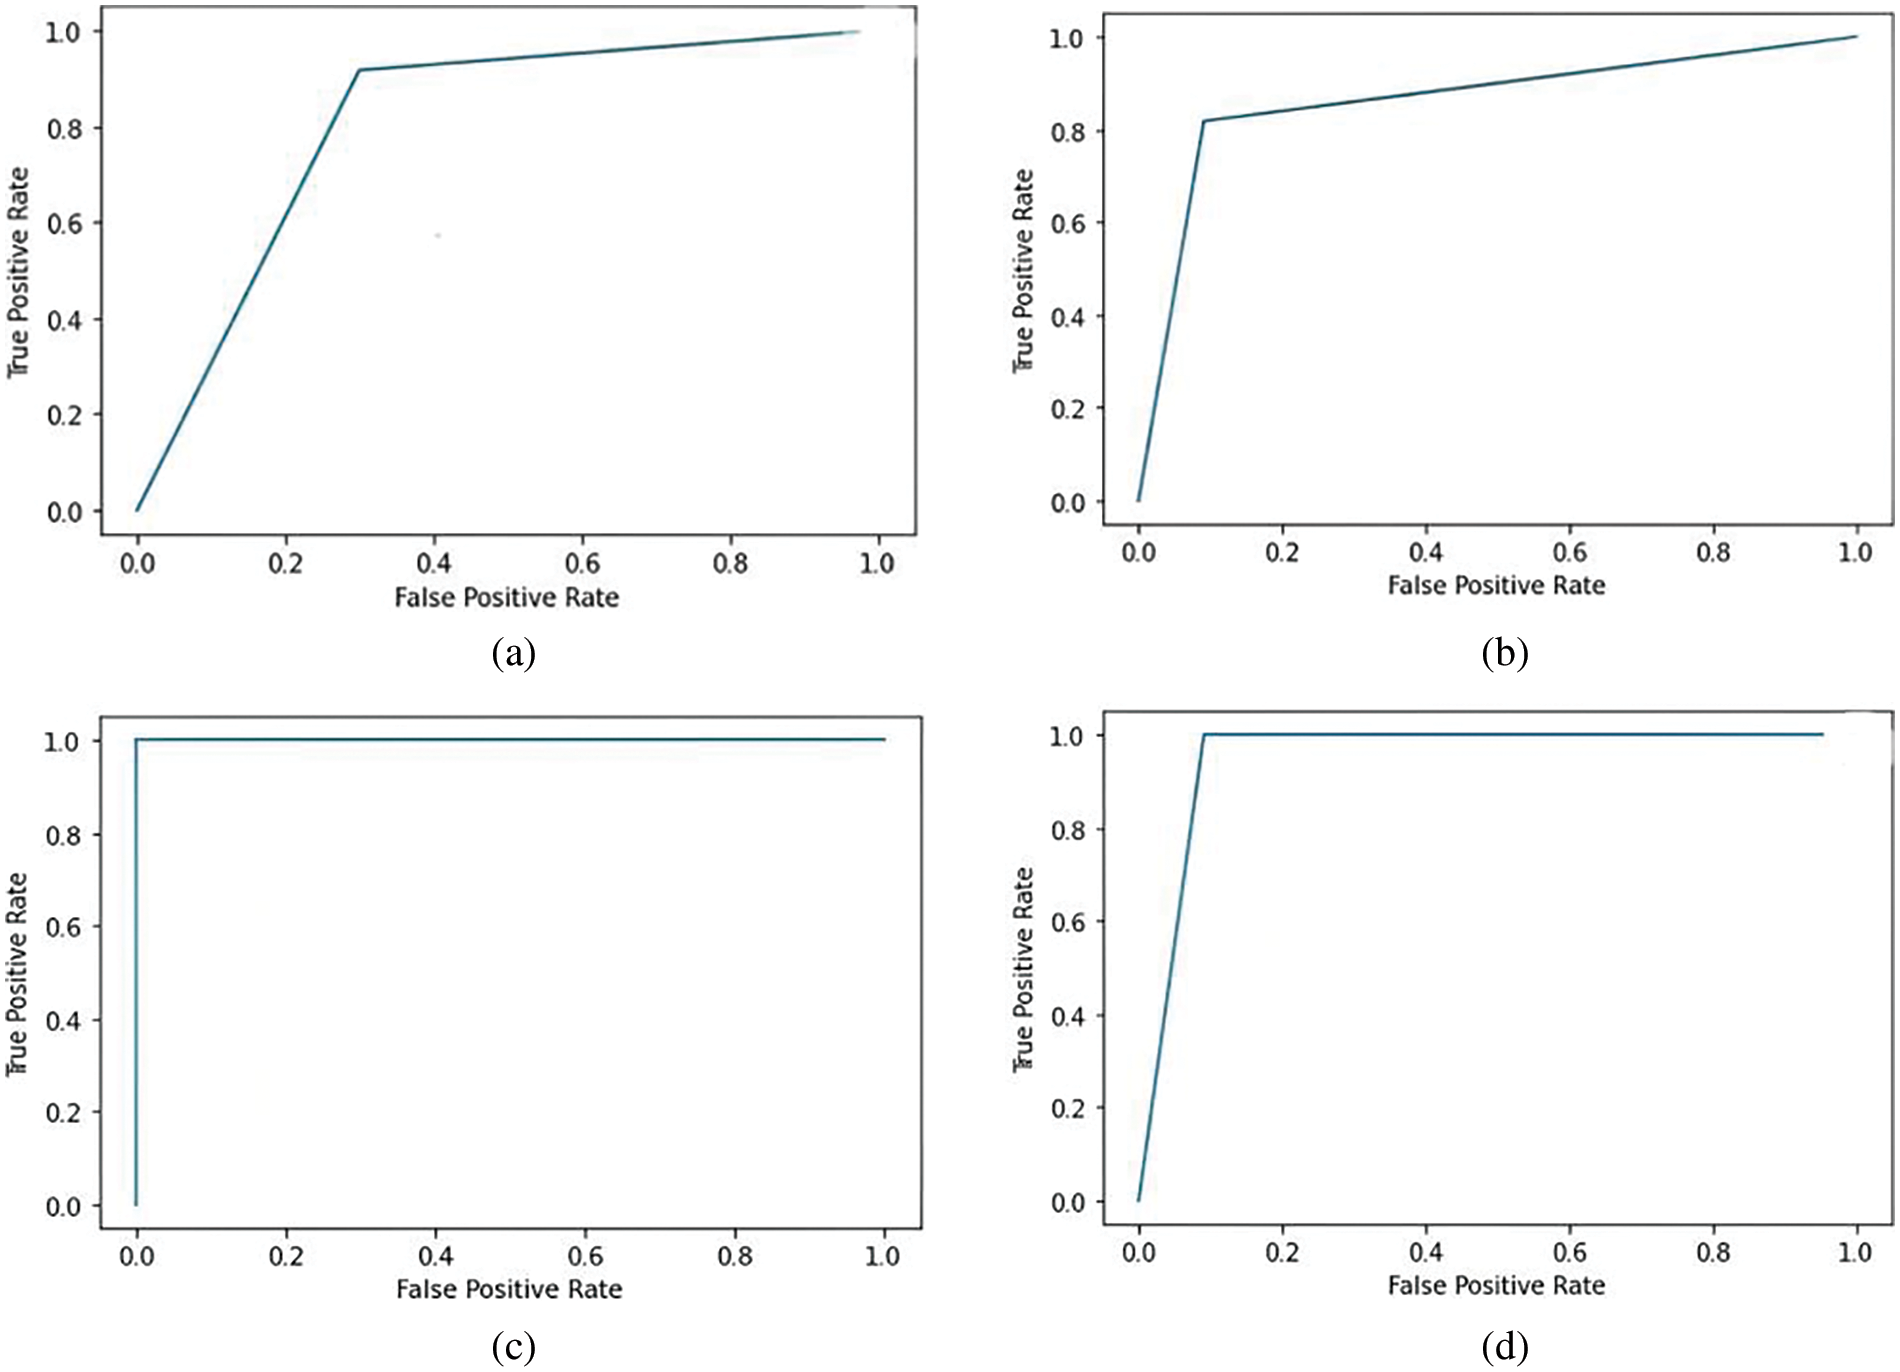
Figure 4: ROC curve for LASSO-based algorithm on QBASD dataset (a) decision tree classifier (b) KNN classifier (c) LR classifier (d) RF classifier
Table 5 shows the classification metrics for the proposed ASD detection model with the LASSO feature reduction algorithm. LR shows improved performance compared to other classifiers. LR has the risk of overfitting in high-dimensional datasets. LR model shows increased accuracy for the QBASD dataset reduced by the LASSO method as the few features selected are highly correlated with the target class.
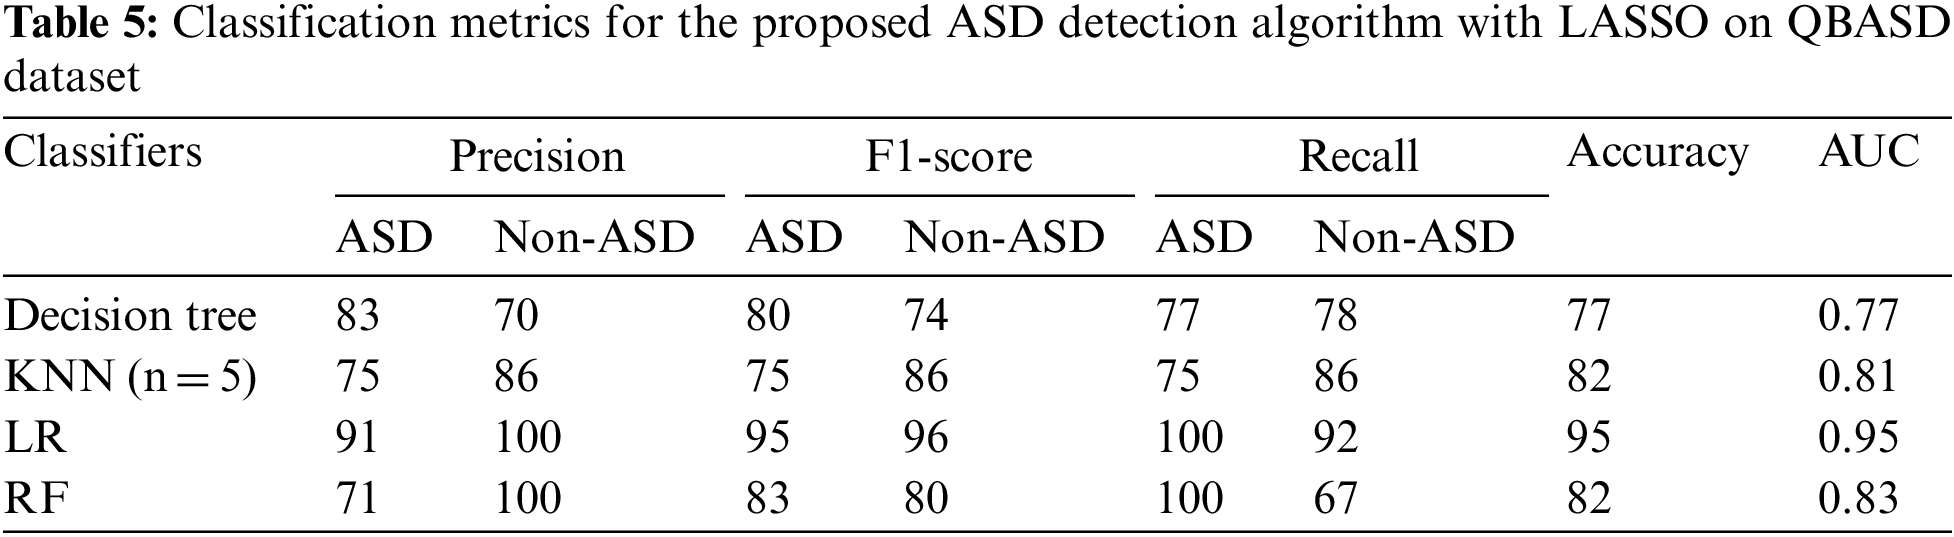
Fig. 5 shows the ROC curves after implementing the ICA feature reduction algorithm and building classifiers in Python. The ROC curve for the decision tree shows a poor recall rate as the false negatives are high in the dataset. The precision rate is affected by the false positive rate. The LR shows high precision and recall rate as the false positives and negative counts are less for the classification model.
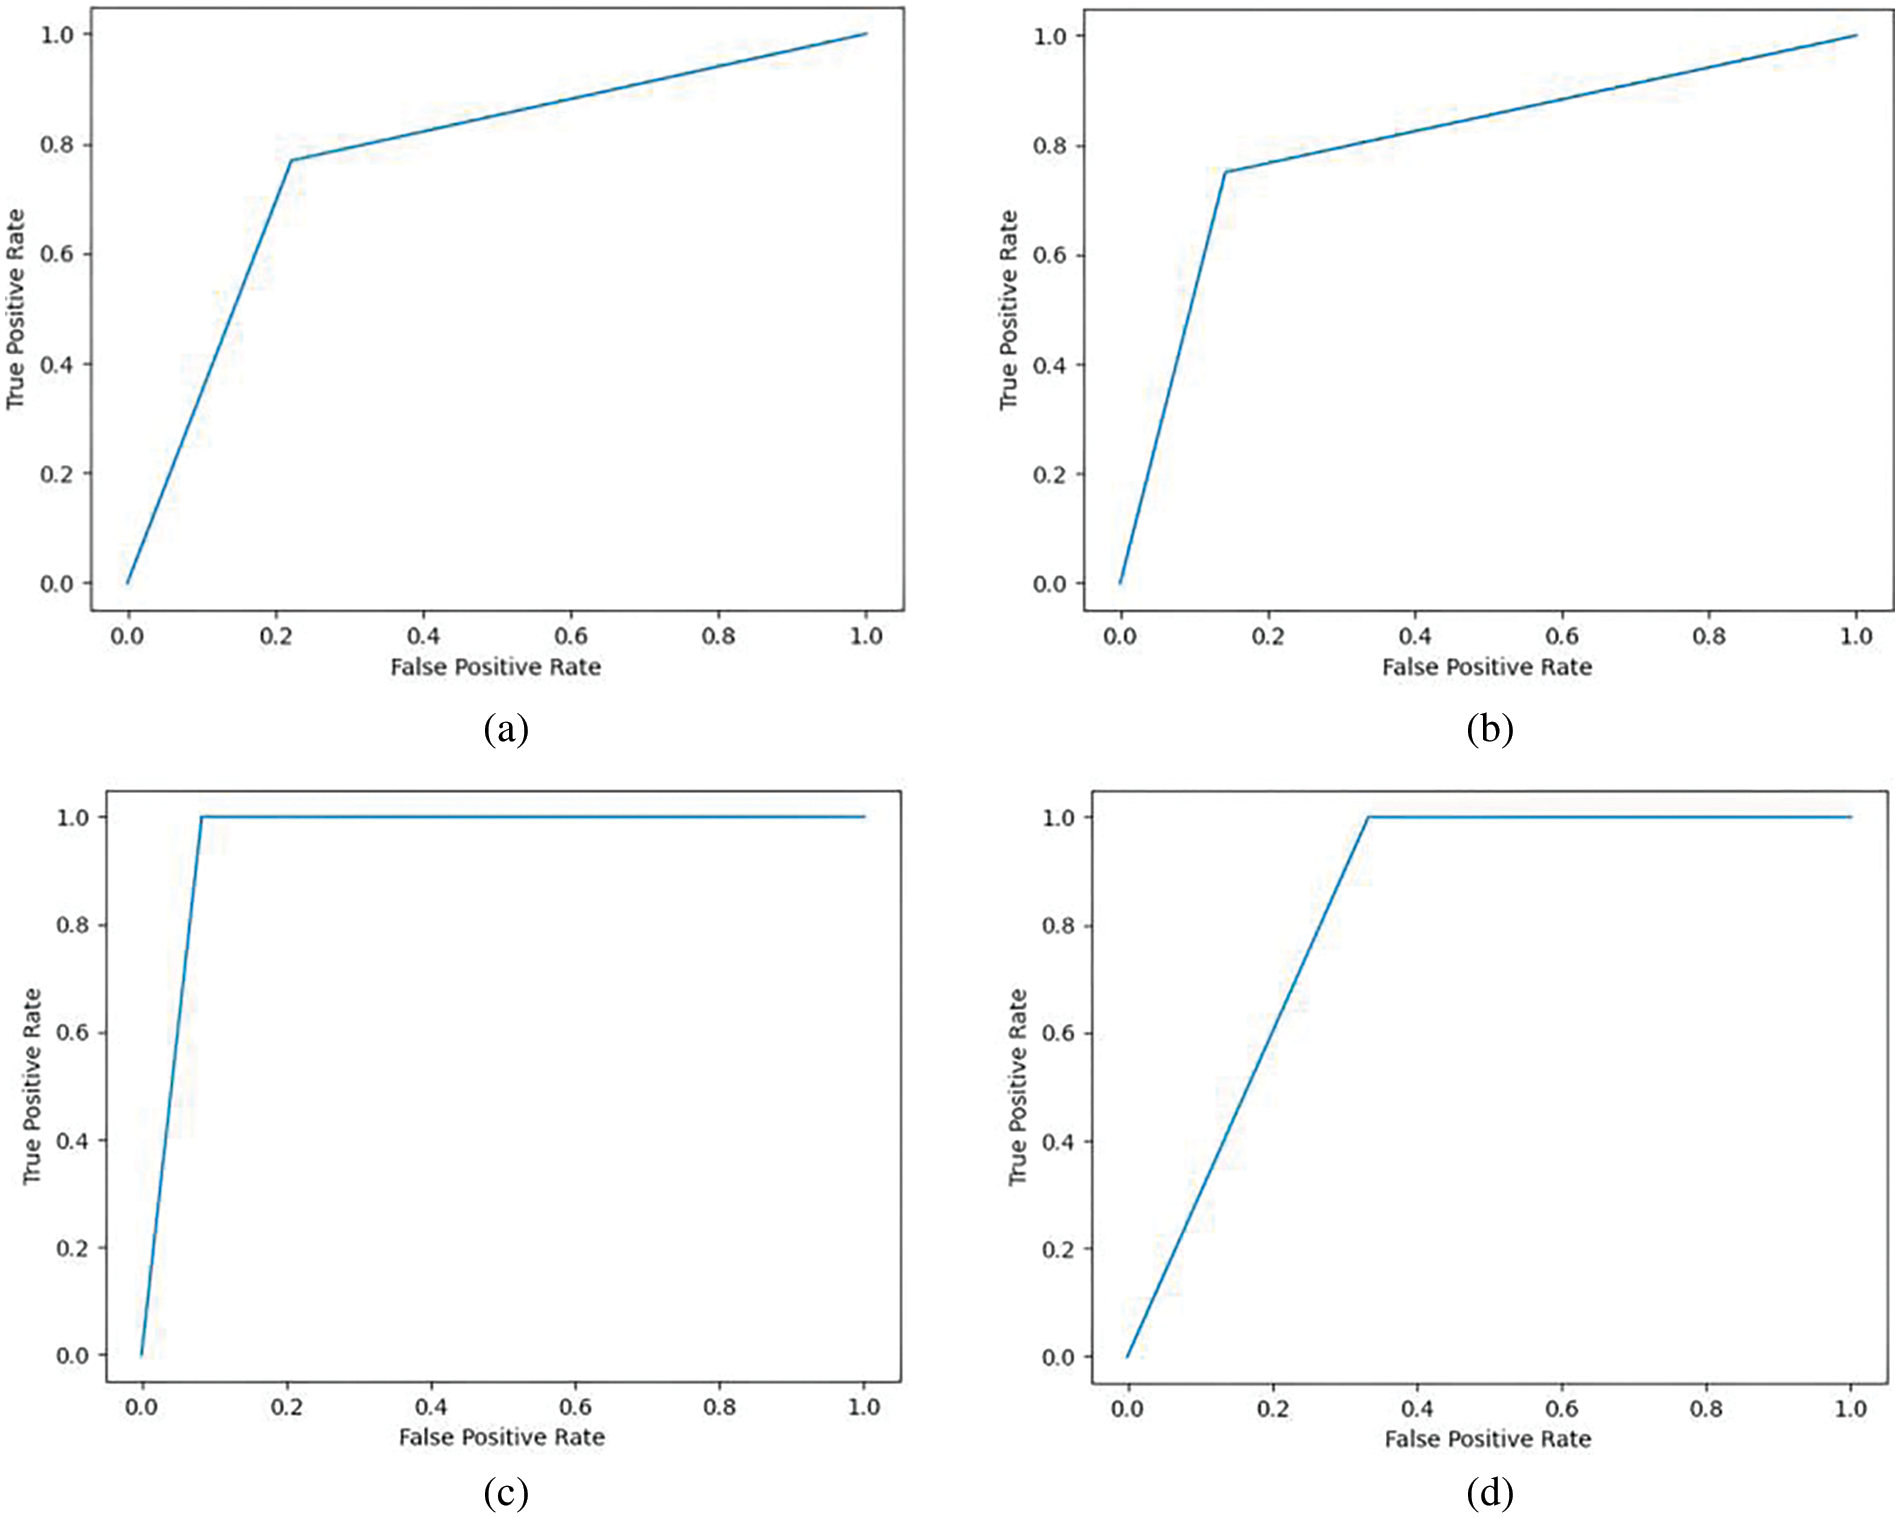
Figure 5: ROC curve for LASSO-based algorithm on QBASD dataset (a) decision tree classifier (b) KNN classifier (c) LR classifier (d) RF classifier
The RF classifier gives a poor precision rate as the false positives are high. A simple KNN classifier is robust with noisy data and performs well compared to sophisticated classifiers [33]. KNN gives average accuracy for the ICA-based ASD detection algorithm. The optimum value of k also has an impact on the accuracy of the model. This study chooses the k value as five based on the trial-and-error method. The precision value is lower for non-ASD class detection than for ASD. In the medical field, precision in diagnosis is a significant factor. The LR gives improved accuracy, F1 score, and precision compared to other classifiers. The feature selection by LASSO and ICA modifies the dataset as a crisp dataset with few independent, uncorrelated features. Hence LR algorithm shows high performance for data with the feature set having independent variables [28]. The reduced feature set includes features that make the dataset linearly separable, and LR gives improved results with QBASD [34].
4 Exploratory Data Analysis Phase
The data visualization of the QBASD dataset reveals some interesting facts regarding the questions in the QBASD questionnaire and ASD detection. Table 6 tabulates the essential questions related to the significant ASD signs in children under five. The CADx proposed in this study can detect ASD in children under five years as the symptoms analyzed are specifically for the age group of 3 months to five years. Fig. 6 shows the data visualizations of the correlation of features of the QBASD dataset. The figures show how strongly and weakly the features are correlated with the response variables. All the significant features of the QBASD dataset are listed in Table 6.
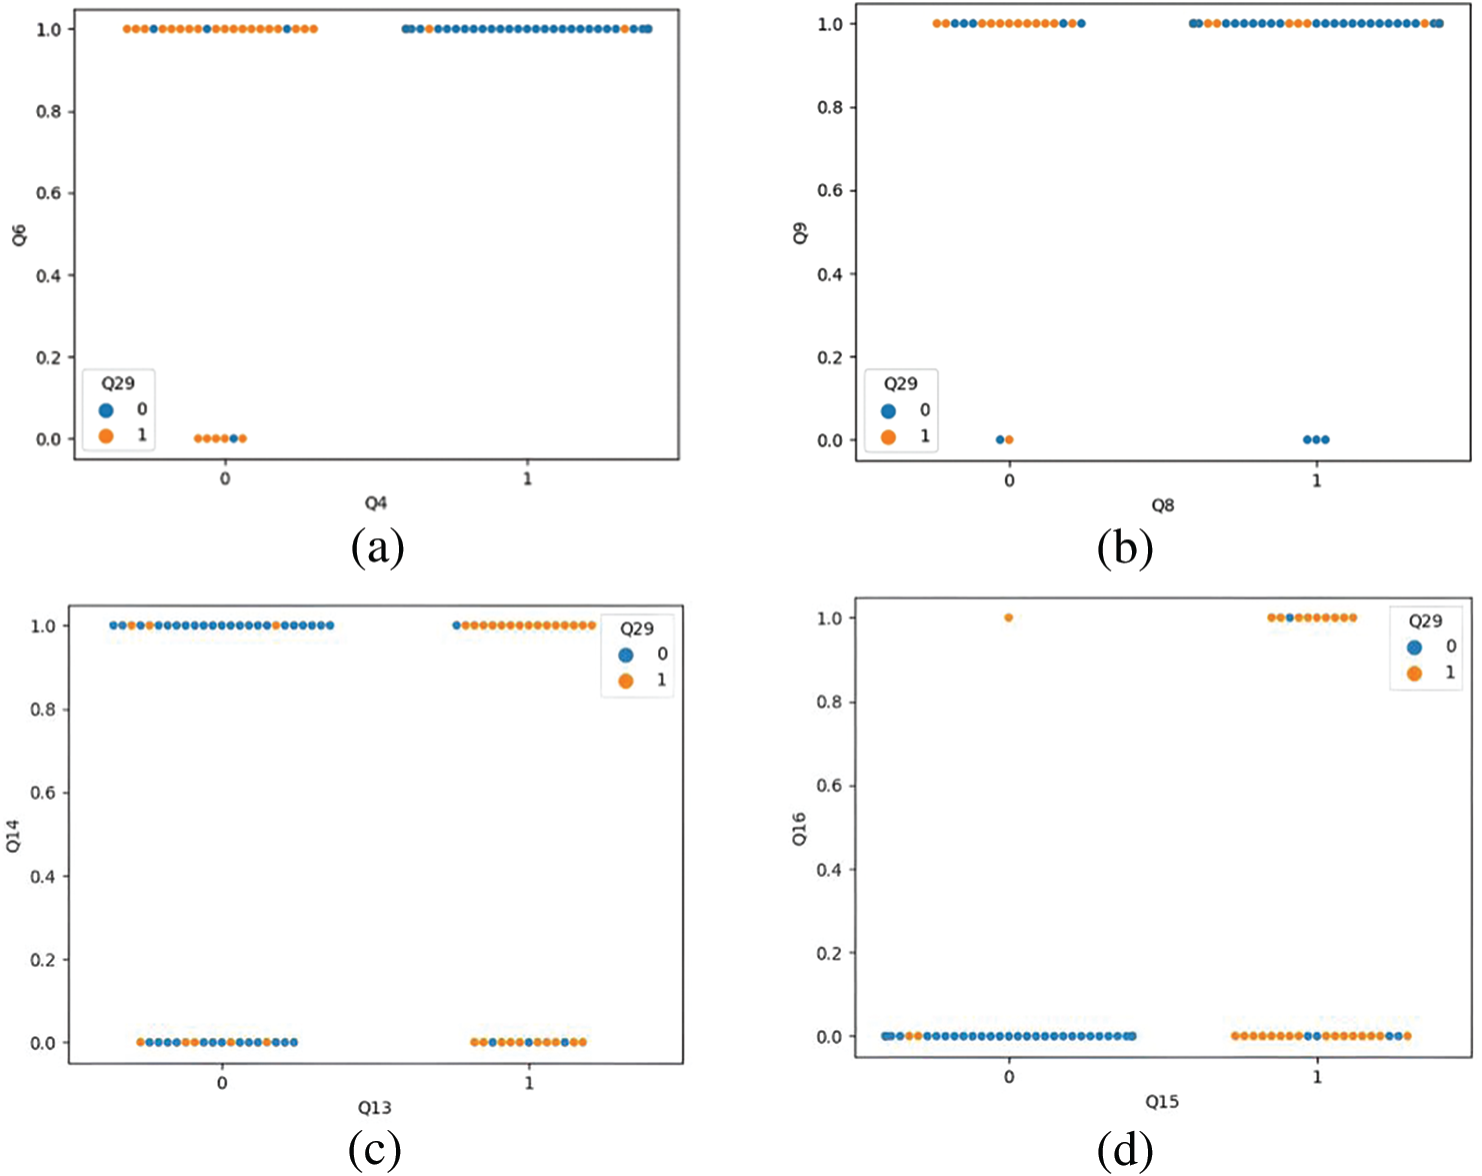
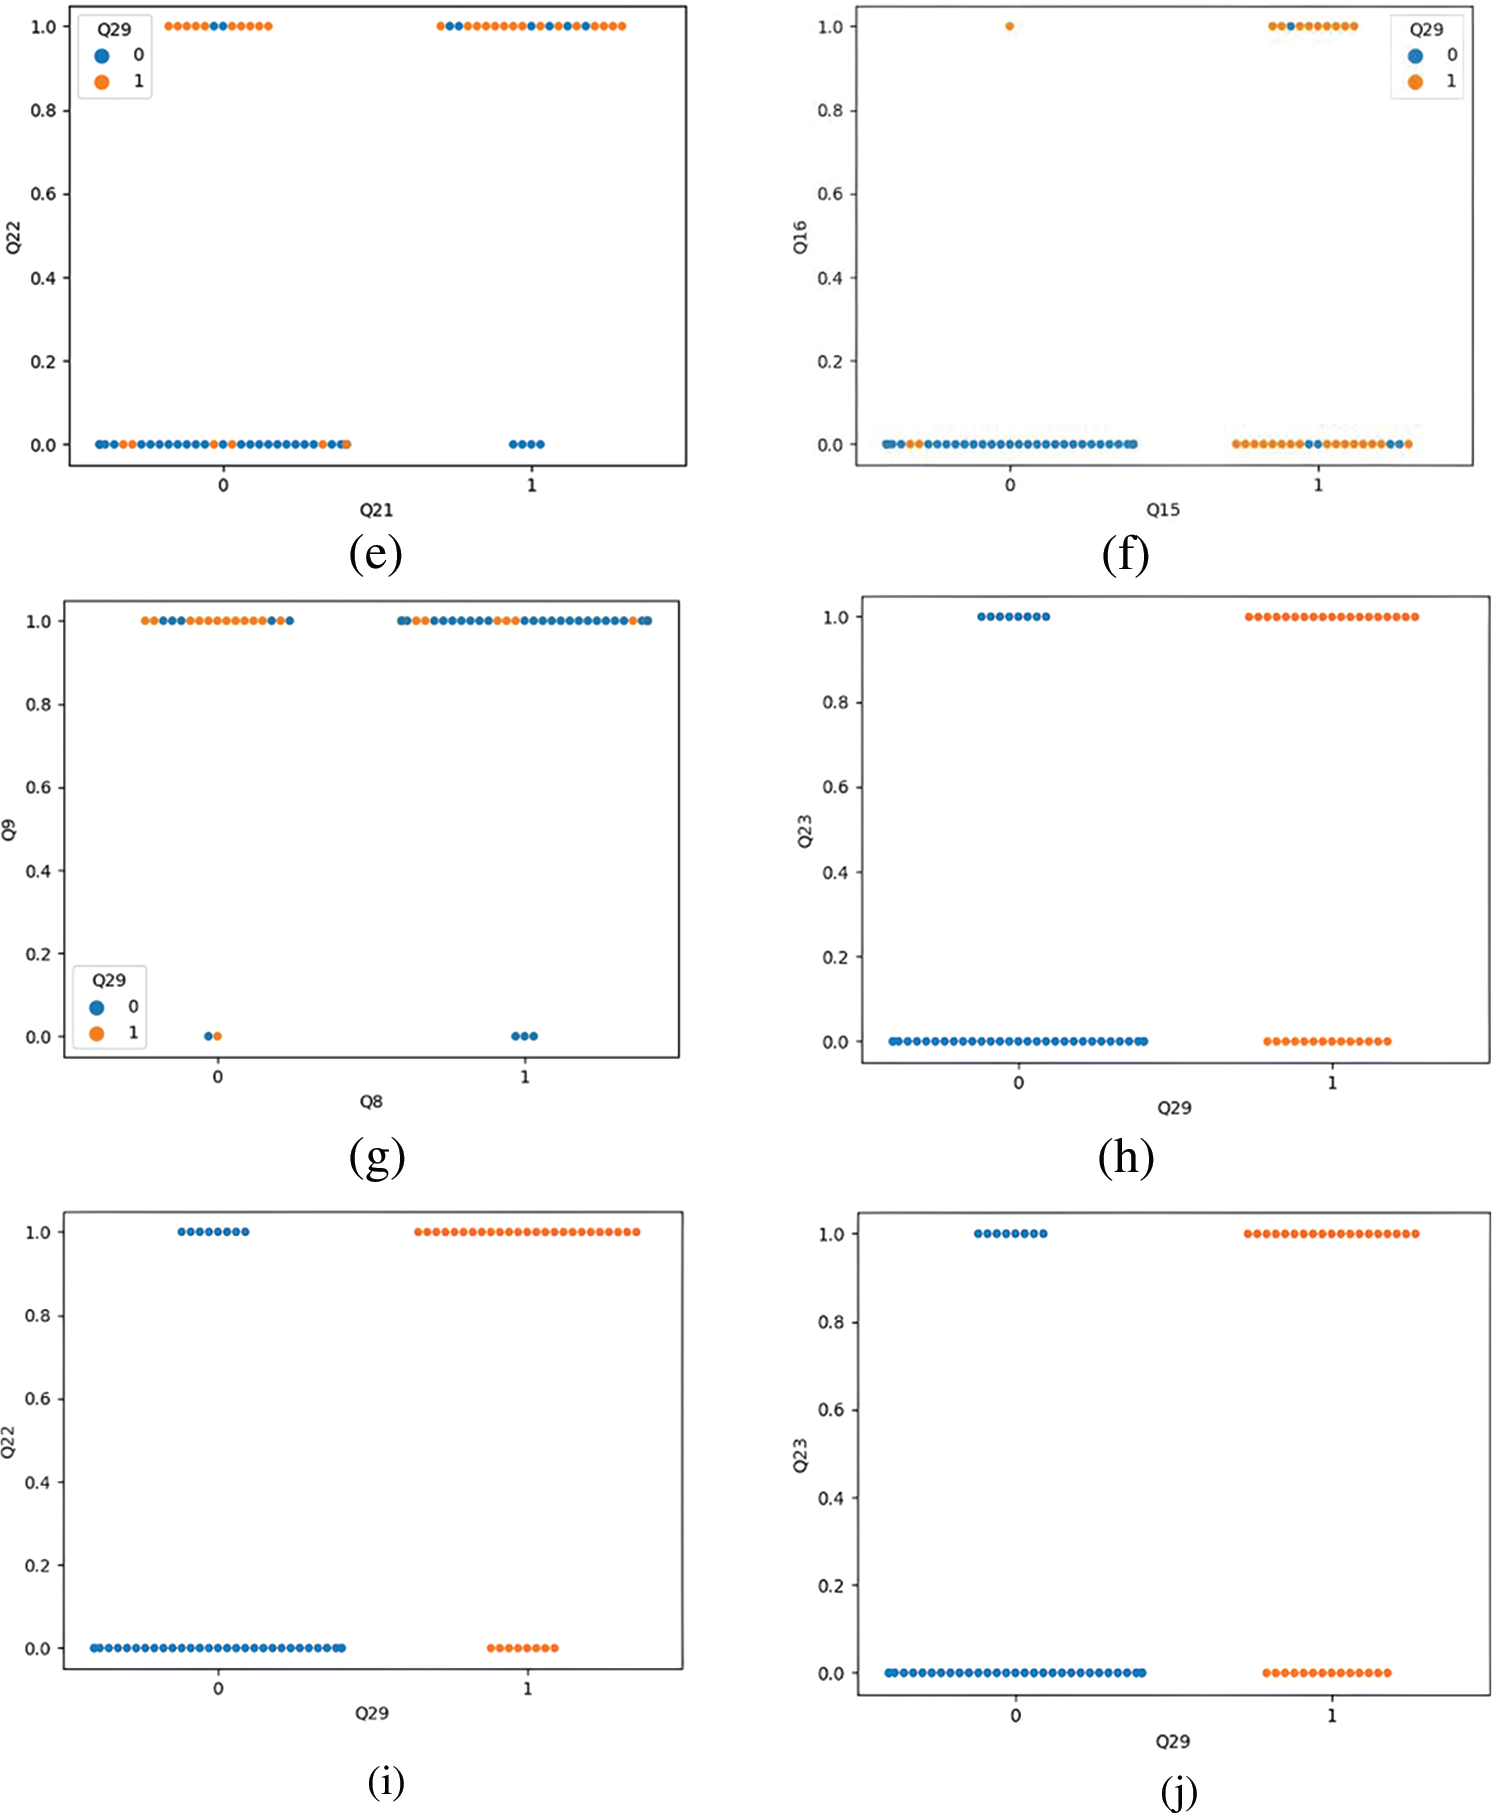
Figure 6: Data visualization on QBASD dataset (a) data visualization of questions Q4 and Q6 (b) data visualization of questions Q8 and Q6 (c) data visualization of questions Q13 and Q14 (d) data visualization of questions Q15 and Q16 (e) data visualization of questions Q21 and Q22 (f) data visualization of questions Q25 and Q26 (g) data visualization of Q5 and Q29 (h) data visualization of Q18 and Q29 (i) data visualization of question Q22 and Q29 (j) data visualization of questions Q23 to Q29
Fig. 6a represents the visualization for questions Q4 and Q6 in the QBASD dataset. If the child shows restricted interest in playing or interacting with another child, irrespective of the smile factor, the child is classified as belonging to the ASD class. In contrast, if the child shows interest in playing with other children, the child belongs to the non-ASD class. Fig. 6b is the visualization of questions Q8 and Q9.
A child with ASD often has difficulty pointing to objects with the index finger. Fig. 6b shows a child that cannot point the finger at anything interesting irrespective of being able to maintain eye contact, is diagnosed with ASD. A child capable of pointing fingers to indicate interest in objects and maintaining eye contact for a second or two falls under non-ASD class. Fig. 6c is a visual analysis of Q13 and Q14. Children who make unusual noises and have stereotyped movements are classified as ASD. However, all ASD children do not need to make an unusual noise. Some children detected with ASD are free of stereotyped repetitive movements.
Fig. 6d is the visualization of Q15 and Q16. The graph shows that the child’s hyperactivity and self-injurious behavior classifies it as ASD. The child with no symptoms of hyperactivity or self-injurious behavior belongs to the non-ASD class. Children with hyperactivity could have attention deficit hyperactivity disorder (ADHD), not mandatorily ASD. In the visualization, non-ASD children are found to have symptoms of hyperactivity. Fig. 6e is the visualization of Q21 and Q22. Most children having inconsistent attention are classified as having ASD. The child’s delay in responding to the call is a essential biomarker for ASD detection. The visualization of questions Q25 and Q26 is shown in Fig. 6f.
The visualization’s conclusions are unclear on whether nutrient deficiency during pregnancy can cause ASD. There are very few samples where mothers are on medication; hence, it is difficult to conclude whether the mother’s medications cause ASD in the child. Fig. 6g shows the most significant symptom of responding to social cues as a biomarker for ASD detection. Classification of a child as ASD or non-ASD depends on the ability to respond to the social cue. Fig. 6h shows the strong correlation between the biomarker Q18 and ASD detection. The swarm plot shows that the children unable to follow the gaze are diagnosed with ASD.
Fig. 6i shows inconsistent attention is found more in ASD children than the non-ASD children. Fig. 6j is the swarm plot between Q23 to Q29. Children with ASD have unusual memory, but children without ASD have a good memory. Hence, it cannot be a robust independent biomarker for ASD detection. The common signs of autism include not responding to social cues, not following the parent’s gaze, not pointing to objects, not following simple instructions, repetitive movements, unusual memory, inconsistent attention, and not maintaining eye contact [35]. The visualization shows the strong correlation between the signs of autism specified by experts and those automatically detected by the proposed ASD detection system.
In this research, we have experimentally studied the performance of the proposed automated detection tool for ASD detection. The proposed CADx selects the best features from the QBASD dataset using the ICA feature selection algorithm. The performance of the model built with LASSO as the feature selection method and LR classifier gives 95% accuracy for ASD detection. The evaluation of models with standard metrics shows that the ICA-based ASD detection algorithm provides 100% accuracy with LR as the classifier. The proposed CADx can detect ASD in children under five years, as the features included in the dataset are signs of ASD for children under five. The logistic regression as a classifier gives high accuracy as it can handle outliers. LR is suitable for linearly separable datasets. The model shows improved accuracy compared to the state-of-the-art methodologies. The exploratory data analysis phase shows the relations between vital symptoms of ASD identified in the study and collected as a dataset. The visualization of the dataset reveals that the features selected by the ICA algorithm are significant features for ASD detection at an early age. This research is novel as the dataset is a self-collected dataset from special schools for autism. The future direction of research is to study the neuroimages to detect autism.
Acknowledgement: We sincerely thank Kaumaram Prashanthi Academy, a special education school in Tamil Nadu, India for their valuable support in data collection. We thank Parvathi Ravichandran, Coordinator, WVS Special School, Koundampalayam, Coimbatore, Tamil Nadu, India, for their suggestions in preparing the questionnaire and valuable support in data collection. We thank Dr. Sofia Devagnanam, founder and director of Liztoz Preschool and Litz Child development center, Coimbatore, Tamil Nadu, India for her valuable inputs in preparing the questionnaire for the data collection of QBASD dataset.
Funding Statement: The authors extend their appreciation to the Deputyship for Research & Innovation, Ministry of Education in Saudi Arabia for funding this research work through the Project Number (IF2-PSAU-2022/01/22043).
Author Contributions: Study conception and design: Shabana R. Ziyad; Data collection: Shabana R. Ziyad; Analysis and interpretation of results: Shabana R. Ziyad, I. A. Saeed, Liyakathunisa; Manuscript preparation: Shabana R. Ziyad, Liyakathunisa, I. A. Saeed; Review & editing: Shabana R. Ziyad, Eman Aljohani.
Availability of Data and Materials: The data collected is a confidential dataset that was self-collected from special education schools.
Ethics Approval: The study involves the responses from parents of ASD and non-ASD children studying in schools. The dataset used in this study related to Project Number IF2-PSAU-2022/01/22043, has received IRB approval from the Ethical Review and Approval Committee, Prince Sattam bin Abdulaziz, Al Kharj. The reference ID for approval is SCBR-085-2022 dated 16/11/2022.
Conflicts of Interest: The authors declare that they have no conflicts of interest to report regarding the present study.
References
1. “Down Syndrome and Autism Spectrum Disorder (DS-ASD),” Autism Speaks, 2022. [Online]. Available: https://www.autismspeaks.org/down-syndrome-and-autism-spectrum-disorder-ds-asd (accessed on 02/12/2022). [Google Scholar]
2. “Autism Statistics and Facts,” Autism Speaks, 2022. [Online]. Available: https://www.autismspeaks.org/autism-statistics-asd (accessed on 02/12/2022). [Google Scholar]
3. “The Kids First,” Kids first, 2022. [Online]. Available: https://kids-first.com.au/5-ways-speech-therapy-can-help-children-with-autism/ (accessed on 02/12/2022). [Google Scholar]
4. J. Chuthapisith and N. Ruangdaragano, “Early detection of autism spectrum disorders,” in Autism Spectrum Disorders: The Role of Genetics in Diagnosis and Treatment, 1st ed., USA: IntechOpen, 2011. [Online]. Available: https://www.intechopen.com/chapters/17274 (accessed on 02/12/2022). [Google Scholar]
5. M. Baygin, S. Dogan, T. Tuncer, P. D. Barua, O. Faust et al., “Automated ASD detection using hybrid deep lightweight features extracted from EEG signals,” Computers in Biology and Medicine, vol. 134, pp. 104548, 2021. [Google Scholar] [PubMed]
6. O. Dekhil, M. Ali, Y. Nakieb, A. Shalaby, A. Soliman et al., “A personalized autism diagnosis CAD system using a fusion of structural MRI and resting-state functional MRI data,” Frontiers in Psychiatry, vol. 10, pp. 392, 2021. [Google Scholar]
7. M. Eni, I. Dinstein, M. Ilan, I. Menashe, G. Meiri et al., “Estimating autism severity in young children from speech signals using a deep neural network,” IEEE Access, vol. 8, pp. 139489–139500, 2020. [Google Scholar]
8. H. Drimalla, T. Scheffer, N. Landwehr, I. Baskow, S. Roepke et al., “Towards the automatic detection of social biomarkers in autism spectrum disorder: Introducing the simulated interaction task (SIT),” Digital Medicine, vol. 3, pp. 25, 2020. [Google Scholar] [PubMed]
9. M. Alcañiz, I. A. Chicchi-Giglioli, L. A. Carrasco-Ribelles, J. Marín-Morales, M. E. Minissi et al., “Eye gaze as a biomarker in the recognition of autism spectrum disorder using virtual reality and machine learning: A proof of concept for diagnosis,” Autism Research, vol. 15, pp. 131–145, 2022. [Google Scholar]
10. Z. Zhao, H. Tang, X. Zhang, X. Qu, X. Hu et al., “Classification of children with autism and typical development using eye-tracking data from face-to-face conversations: Machine learning model development and performance evaluation,” Journal of Medical Internet Research, vol. 23, no. 8, pp. e29328, 2021. [Google Scholar] [PubMed]
11. T. Talkar, J. R. Williamson, D. Hannon, H. M. Rao and S. Yuditskaya, “Assessment of speech and fine motor coordination in children with autism spectrum disorder,” IEEE Access, vol. 8, pp. 127535–127545, 2020. [Google Scholar] [PubMed]
12. A. Z. Guo, “Automated autism detection based on characterizing observable patterns from photos,” IEEE Transaction on Affective Computing, vol. 14, pp. 836–841, 2020. [Google Scholar]
13. R. Grzadzinski, D. Amso, R. Landa, L. Watson, M. Guralnick et al., “Pre-symptomatic intervention for autism spectrum disorder (ASDDefining a research agenda,” Journal of Neurodevelopment Disorder, vol. 13, pp. 49, 2021. [Google Scholar] [PubMed]
14. G. S. Thejas, R. Garg, S. S. Iyengar, N. R. Sunitha, P. Badrinath et al., “Metric and accuracy ranked feature inclusion: Hybrids of filter and wrapper feature selection approaches,” IEEE Access, vol. 9, pp. 128687–128701, 2021. [Google Scholar]
15. X. Wang, B. Guo, Y. Shen, C. Zhou and X. Duan, “Input feature selection method based on feature set equivalence and mutual information gain maximization,” IEEE Access, vol. 7, pp. 151525–151538, 2019. [Google Scholar]
16. L. Freijeiro-González, M. Febrero-Bande and W. González-Manteiga, “A critical review of LASSO and its derivatives for variable selection under dependence among covariates,” International Statistical Review, 2021. [Online]. Available: https://onlinelibrary.wiley.com/doi/full/10.1111/insr.12469 (accessed on 21/12/2022). [Google Scholar]
17. R. Tibshirani, “Regression shrinkage and selection via the lasso: A retrospective,” Journal of Statistical Methodology, vol. 73, pp. 273–282, 2011. [Google Scholar]
18. E. Courtois, P. Tubert-Bitter and I. Ahmed, “New adaptive lasso approaches for variable selection in automated pharmacovigilance signal detection,” BMC Medical Research Methodology, vol. 21, pp. 271, 2021. [Google Scholar] [PubMed]
19. E. Atashpaz-Gargari and C. Lucas, “Imperialist competitive algorithm: An algorithm for optimization inspired by imperialistic competition,” in Proc. of IEEE Congress of Evolutionary Computation, Singapore, pp. 4661–4667, 2007. [Google Scholar]
20. S. Hosseini and A. Al Khaled, “A survey on the imperialist competitive algorithm metaheuristic: Implementation in engineering domain and directions for future research,” Applied Soft Computing, vol. 24, pp. 1078–1094, 2014. [Google Scholar]
21. K. Lian, C. Zhang, L. Gao and X. Shao, “A modified colonial competitive algorithm for the mixed-model U-line balancing and sequencing problem,” International Journal of Production Research, vol. 50, pp. 1–15, 2012. [Google Scholar]
22. B. Deepak, B. Gunji, M. V. A. R. Bahubalendruni and B. Biswal, “Assembly sequence planning using soft computing methods: A review,” in Proc. of Institution of Mechanical Engineers, Part E: Journal of Process Mechanical Engineering, vol. 233, no. 3, pp. 653–683, 2019. [Google Scholar]
23. F. Sarayloo and R. Tavakkoli-Moghaddam, “Imperialistic competitive algorithm for solving a dynamic cell formation problem with production planning,” in Proc. of Int. Conf. of Intelligent Computing, Heidelberg, Berlin, vol. 6215, pp. 266–276, 2010. [Google Scholar]
24. K. Karimi, A. Ghodratnama and R. Tavakkoli-Moghaddam, “Two new feature selection methods based on learn-heuristic techniques for breast cancer prediction: A comprehensive analysis,” Annals of Operation Research, 2022. [Online]. Available: https://doi.org/10.1007/s10479-022-04933-8 [Google Scholar] [CrossRef]
25. A. Kaveh and S. Talatahari, “Imperialist competitive algorithm for engineering design problems,” Asian Journal of Civil Engineering, vol. 11, pp. 675–697, 2010. [Google Scholar]
26. K. Hussain, M. Salleh, S. Cheng and R. Naseem, “Common benchmark functions for metaheuristic evaluation: A review,” International Journal of Informatics Visualization, vol. 1, pp. 218–223, 2017. [Google Scholar]
27. S. Dreiseitl and L. Ohno-Machado, “Logistic regression and artificial neural network classification models: A methodology review,” Journal of Biomedical Informatics, vol. 35, pp. 352–359, 2002. [Google Scholar] [PubMed]
28. M. Maalouf, “Logistic regression in data analysis: An overview,” International Journal of Data Analysis Techniques and Strategies, vol. 3, pp. 281–299, 2011. [Google Scholar]
29. Y. Song and Y. Lu, “Decision tree methods: Applications for classification and prediction,” Shanghai Archives of Psychiatry, vol. 27, pp. 130–135, 2015. [Google Scholar] [PubMed]
30. J. Fürnkranz, “Decision tree,” in Encyclopedia of Machine Learning and Data Mining, Boston, USA: MA, Springer, pp. 330–335, 2017. [Google Scholar]
31. S. R. Ziyad, “Early lung cancer detection a new automated approach with improved diagnostic performance,” Ph.D. dissertation, Avinashilingam University for Women, India, 2020. [Google Scholar]
32. S. Latha, P. Muthu, S. Dhanalakshmi, R. Kumar, K. W. Lai et al., “Emerging feature extraction techniques for machine learning-based classification of carotid artery ultrasound images,” Computational Intelligence and Neuroscience, vol. 2022, pp. 1847981, 2022. [Google Scholar] [PubMed]
33. H. Liu and S. Zhang, “Noisy data elimination using mutual k-nearest neighbor for classification mining,” Journals of Systems and Software, vol. 85, pp. 1067–1074, 2012. [Google Scholar]
34. J. Shen and S. Gao, “A solution to separation and multicollinearity in multiple logistic regression,” Journal of Data Science, vol. 6, pp. 515–531, 2008. [Google Scholar] [PubMed]
35. “Signs of Autism,” Autism Association of Western Australia, 2022. [Online]. Available: https://www.autism.org.au/what-is-autism/signs-of-autism/ (accessed on 11/01/2023). [Google Scholar]
Cite This Article
 Copyright © 2023 The Author(s). Published by Tech Science Press.
This work is licensed under a Creative Commons Attribution 4.0 International License , which permits unrestricted use, distribution, and reproduction in any medium, provided the original work is properly cited.
 Downloads
 Citation Tools