
 Submit a Paper
 Propose a Special lssue
 Open Access
ARTICLE

Deep Learning-Enhanced Brain Tumor Prediction via Entropy-Coded BPSO in CIELAB Color Space
1 Department of Computer Engineering, Bahauddin Zakariya University, Multan, 60000, Pakistan
2 Department of Computer Science, Kansas State University, Manhattan, KS, 66506, USA
3 Department of Computer Science, University of Management and Technology, Lahore, 54000, Pakistan
4 Independent Researcher, Bradford, BD8 0HS, UK
5 Industrial Engineering Department, Collage of Engineering, King Saud University, PO Box 800, Riyadh, 11421, Saudi Arabia
* Corresponding Authors: Muhammad Imran Sharif. Email: ; Hafiz Tayyab Rauf. Email:
Computers, Materials & Continua 2023, 77(2), 2031-2047. https://doi.org/10.32604/cmc.2023.043687
Received 10 July 2023; Accepted 26 September 2023; Issue published 29 November 2023
A correction of this article was approved in:
Correction: Deep Learning-Enhanced Brain Tumor Prediction via Entropy-Coded BPSO in CIELAB Color Space
Read correction
 View Full Text
 Download PDF
Abstract
Early detection of brain tumors is critical for effective treatment planning. Identifying tumors in their nascent stages can significantly enhance the chances of patient survival. While there are various types of brain tumors, each with unique characteristics and treatment protocols, tumors are often minuscule during their initial stages, making manual diagnosis challenging, time-consuming, and potentially ambiguous. Current techniques predominantly used in hospitals involve manual detection via MRI scans, which can be costly, error-prone, and time-intensive. An automated system for detecting brain tumors could be pivotal in identifying the disease in its earliest phases. This research applies several data augmentation techniques to enhance the dataset for diagnosis, including rotations of 90 and 180 degrees and inverting along vertical and horizontal axes. The CIELAB color space is employed for tumor image selection and ROI determination. Several deep learning models, such as DarkNet-53 and AlexNet, are applied to extract features from the fully connected layers, following the feature selection using entropy-coded Particle Swarm Optimization (PSO). The selected features are further processed through multiple SVM kernels for classification. This study furthers medical imaging with its automated approach to brain tumor detection, significantly minimizing the time and cost of a manual diagnosis. Our method heightens the possibilities of an earlier tumor identification, creating an avenue for more successful treatment planning and better overall patient outcomes.Keywords
A brain tumor is a treacherous disease and may cause death [1]. It originates within the brain due to the abnormal growth of brain cells, with the collective action of these aberrant cells being the leading cause of its occurrence. Numerous research articles have discussed primary and secondary brain tumors, elaborating on the different phases of their development [2]. Deep Learning (DL), a machine learning subfield, has recently garnered considerable attention. Its efficacy in addressing complex problems through machine learning is evidenced by its widespread implementation across various applications. This study selected a dataset comprising 66 brain MRIs to apply a Deep Neural Network (DNN) classifier. This classifier categorizes the data into four classes: (1) normal, (2) glioblastoma, (3) sarcoma, and (4) metastatic bronchogenic carcinoma. The classifier’s performance, evaluated in conjunction with powerful feature extraction techniques such as Principal Components Analysis (PCA) and Discrete Wavelet Transform (DWT), was found to be favorable across all performance metrics [3]. A brain tumor is maand can be fatal if not detected early in the disease’s progression. After identifying a brain tumor, proper classification is vital to develop an appropriate treatment strategy. This research facilitates the categorization and diagnosis of various forms of brain cancers using Convolutional Neural Networks (CNN) and DL techniques, enhancing the accuracy and speed of MRI equipment. The training was conducted on a brain tumor dataset utilizing five previous models: Xception, ResNet50, InceptionV3, VGG16, and MobileNet. The quality of unseen pictures is assessed using an F1 score, with results ranging from 98.75% to 97.25%. These advancements assist in the early detection of malignancies, preventing the onset of debilitating symptoms such as paralysis and amputation [4,5].
Brain tumors can be harmful when found in some brain regions, while they may be harmless in other cases. Harmful brain tumors are classified as malignant, while others are categorized as benign. Unlike malignant tumors, benign tumors are not cancerous. Consequently, various techniques for identifying brain tumors have been developed. The World Health Organization (WHO) classification methodology is currently regarded as the standard [6,7]. This classification has grades 1 and 2 brain tumors from class benign, which are not cancerous; grades 3 and 4 are from class malignant and cancerous tumors. Brain imaging technologies are growing very fast and playing a substantial role in assessing and emphasizing fresh views on the function and architecture of the brain. Getting an accurate diagnosis of a brain tumor is critical to enhance treatment results and the chance of patient survival. Usually, it is done by manually analyzing the many magnetic resonance imaging (MRI) pictures generated in a medical institution, which might be error-prone. As a concern, there is a greater need for more accurate automatic computer-based tumor identification systems. In recent years, a lot of energy and attention has been spent finding machine learning algorithms that can manage this process. Recently, there has been interest in using DL as an effective and reliable method for detecting brain tumors. Imaging is widely used in medical research to improve early diagnosis and treatment. Deep Neural Networks (DNNs) have been very successful at classifying tasks. MRI scans are data sets to identify different types of brain cancer. Brain MRI scans are collected in the model for training and evaluation with superior accuracy [8]. Diagnosing brain tumors manifest in various forms, each with unique characteristics and treatment options, is complex. Effective treatment planning and higher patient survival rates hinge significantly on the early diagnosis of these malignant growths, particularly in their initial stages. Identifying brain tumors can be challenging given their diverse presentations, each harboring distinct characteristics and therapeutic avenues. Prompt detection, especially during the early phases of development, is crucial for devising effective treatment strategies and, ultimately, saving lives.
This research uses data augmentation to increase low-volume brain tumor data for tumor identification selected tumor ROIs using the CIELAB color space. Feature extraction is achieved using DarkNet-53 and AlexNet. Serial feature fusion is employed to merge the features derived from DarkNet-53 and AlexNet, forming a comprehensive classification feature vector. We utilized entropy-coded Particle Swarm Optimization (PSO) to identify the most pertinent attributes, as some features may be irrelevant for accurate categorization. These selected attributes are then classified using various SVM kernels. Fig. 1 showcases MRI images of both a tumor and a normal brain taken from the dataset.

Figure 1: The MRI images of tumor and normal brain
The contributions of this work are as follows:
• A significant contribution of this research is the development of Entropy-coded Particle Swarm Optimization (PSO) for feature selection. This allows the system to prioritize the most valuable characteristics for classification intelligently. Subsequently, multiple SVM kernels are applied to these selected features, enhancing the robustness of the decision boundary.
• In the preprocessing stage, low-volume data enhancement is carried out using various data augmentation techniques. These techniques include flip-vertical, flip-horizontal, rotation by 90 degrees, and rotation by 180 degrees for data enhancement. Subsequently, the CIELAB color space is employed for ROI selection in tumor images.
• Feature attainment is facilitated through the utilization of DarkNet-53 and AlexNet. The architecture includes fully connected layers; global average pooling is performed to extract the features.
• Serial feature fusion is employed to create a singular, comprehensive feature vector for classification.
• Lastly, to identify the most beneficial features for classification, employ entropy-coded Binary Particle Swarm Optimization (BPSO) in conjunction with SVM.
The remaining structure of this paper is organized as follows: Section 1 serves as the introduction, setting the stage by delineating the background and objective of our study, followed by Section 2, which further elaborates on the scope and purpose. Section 3 offers an in-depth analysis of the underlying theories and relevant literature, shedding light on our methodology and research strategy. Section 4 subsequently unfolds the results and discussions, drawing parallels with other studies and elucidating their broader implications. In conclusion, we synthesize the primary findings and contributions of our work.
Brain tumors can be cured when detected in their early stages. Treating brain tumors using machine learning, convolutional neural networks (CNNs), generative adversarial networks (GANs), and DL. The longer processing times and error estimation require additional methods for efficient results. Nanda et al. [9] used the significance-K-mean-SSO-RBNN classification model. It is a new hybrid Salience-K-mean segmentation method and Social Spider Optimization (SSO) algorithm in radial neural network (RBNN). Graphs are put together using tumor segmentation based on common K-words. The saliency map shows the prominent areas in the target image. Then, the fragmented image is extracted to enter the feature extraction stage. Subtract multi-resolution wavelet transform (MRWT), kurtosis, skewness, mean value, time contrast (IDM), and cosine transform. SSO optimizes the cluster space for RBNN classification of vectors. RBNNs with a Gaussian kernel can be easily classified. Key-K-mean-SSO-RBNN and new hybrid segmentation were applied to the given data and compared with existing methods for specificity, F1 score, MCC, accuracy, Kappa coefficient, sensitivity, and complexity. Critical-K-mean-SSO-RBNN can classify 96%, 92%, and 94% of data [9–11].
DL identifies tumors and maps brain tumor shapes and textures. It estimates patient survival using the MR image dataset. Many CNN models have been developed for mental health [12]. The researchers used machine learning to predict tumor grade and size from CT scans of primary tumors. Naive Bayes and k-neighbors methods achieve an accuracy of up to 92.9% [13]. In this study, pituitary adenomas were classified by MR using multiple logistic regression techniques and the k-slot nearest neighbor algorithm. The accuracy of the Multinomial Logistic regression is 83%, the accuracy of the k-nearest neighbor method is 92%, and the accuracy of the AUC curve is 98.4% [14].
Researchers have developed a CNN-based method for brain diagnosis. This new system has two basic steps. Brain segmentation using DL models and generation of segmentation models using the DRLBP fusion second part of the particle swarm optimization (PSO) algorithm. Softmax is used for classification in this study. Contrast enhancement makes it compatible with image classification, and DRLBP adds classification to the system. The results showed that in the BRAST2018 dataset, the score was 88.34% for CT, 91.2% for WT, and 81.84% for ET, which is higher than the 92% accuracy of the BRATS2013-BRATS2018 dataset [15].
DL has been used in most brain tumor research using MRI data over the past six years. Most of them have 2D data ready. 3D models have more tumor-free slice pictures than 2D models, lowering classification performance. 2D models employ the best tumor slice picture, making them inappropriate for practical usage. This article presents a new 3ACL DL model for brain tumor classification using MRI data. The end-to-end learning architecture of the 3ACL models includes control, convolution, and LSTM components. Therefore, the ability to select features can increase. Since the proposed model is 3D, the 3D MR image was used directly in the 3ACL model without converting it to 2D data. The 3ACL model’s fully connected layer yields realistic deep features. SVM receives a feature set. Weighted majority voting, which incorporated SVM prediction results from all slices, also improved categorization. This research uses BRATS 2015 and 2018. The suggested method yielded 98.90% and 99.29% accuracy for BRATS 2015 and 2018 [16]—MCCNN-based method for brain tumor segmentation and extracting more specific multiple features for other CRFs. Three 2D block models are created and analyzed segmentally. The method is tested in all three public records. In the BRATS2013 dataset, complete tumor (CT), tumor (TC), and advanced tumor (ET) of DSC were 0.88, 0.81, and 0.76, PPV 0.86, 0.81 and 0.69 and PPV 0, 0.94 and 0.86, respectively. For precision. The BRATS 2015 dataset shows DSC CT 0.87, TC 0.76, and ET 0.75; PPV 0.88, 0.83 and 0.75; 0.87, 0.74 and 0.80 precision. In the BRATS 2018 dataset, DSC is ET 0.7178, WT 0.8824, TC 0.7481, especially WT 0.9918, ET 0.9947 and TC 0.9969; ET is 0.86 [17].
Especially in medical and agricultural images, DL can identify, identify, and classify objects in the field [18,19]. This work introduces the Dragonfly Algorithm (DA) to resolve tumor and size changes—preprocessing 3D-MR images to remove tumor cells. Finally, stage set segmentation and two-stage DA clustering rescued the tumor from the entire volumetric MR image. The publicly available BRATS2017 dataset demonstrates and tests the proposed method. This method achieves 98.20% accuracy, 95.13% recall, and 93.21% accuracy [20]. Examining images of brain tumors is expensive and complicated. Radiologists use machine learning to diagnose cancer without surgery. However, it is challenging to develop the most advanced DL model for brain tumor classification, and it is also challenging to find experts in brain tumor classification based on DL models. These researches and challenges motivate us to find new and valuable methods based on DL. An evolutionary algorithm that automatically creates a ResNet architecture to identify three brain tumors from an extensive library of MRI images. We propose a deep convolutional ResNet architecture in conjunction with a transformation strategy to enhance the accuracy of the brain tumor classification model. Augmented Ant Colony Optimization (IACO) uses different Evolutionary techniques and multiple agents. These two methods balance different solutions, avoid optimization, fast convergence, and local optimization of the DL ResNet model. Their proposed method achieved an accuracy of 0.98694, demonstrating that the IACO-ResNet algorithm can classify brain cancer [21]. They compared the model accuracy with Google Net, AlexNet, and ResNet50 by removing the previous five layers from the original ResNet50 CNN model and adding eight more.
The improved ResNet50 model achieved 97.2% accuracy, proving its effectiveness [22]. In this study [23], tumor features (size, starting location, and form) are used as a guide to enhance tumor segmentation in MRI scans. The most accurate MRI slice is selected based on these attributes to improve accuracy. Tests for the Active Contour and Otsu Thresholding methods are conducted on the BRATS dataset. The outcomes highlight the greater accuracy of the Active Contour algorithm. Effectively choosing the best regions for segmentation is the method. Arunkumar et al. [24] used texture, and HOG features for image augmentation, segmentation, and non-ROI filtering. They utilized an automated methodology utilizing artificial neural networks for precise ROI identification and texture-based tumor classification. The method beat manual segmentation, obtaining 92.14% identification accuracy, 89% sensitivity, and 94% specificity using ROI texture data on 200 MRI instances. This study [25] provided a sophisticated automated method for segmenting and identifying brain tumors that do not require human interaction. The approach employs ANN for precise object selection and K-means clustering to improve MR images and tumor region texture information extraction. Grayscale characteristics make the distinction between benign and malignant instances. The significant findings include the establishment of automated segmentation and identification assessment, the emphasis on region selection techniques, and the comparison of ANN and SVM results. 94.07% accuracy, 90.09% sensitivity, and 96.78% specificity are attained using the ANN classifier.
This work presents a new and valuable method for DL to classify brain tumors. Brain tumor data is utilized for tumor identification in the recommended architecture. In the first dataset, various data augmentation techniques to make the data small enough to be analyzed. These methods include rotating 90 degrees and 180 degrees, reversing vertical and horizontal lines, rotating 180 degrees, and more. In this paper, selecting the region of interest (ROI) in the tumor image is performed using the CIELAB color space. AlexNet and DarkNet-53 are used to perform tasks. All layers are the foundation of features. The collected features are combined to form a unique vector for classification. While some of these features are suitable for good classification, the most helpful features are selected using the effective feature selection method known as Entropy Particle Swarm Optimization (PSO). These chosen characteristics are ultimately classified after being run through many SVM kernels. Fig. 2 shows the recommended technique’s overall structure.

Figure 2: Overview of the proposed methodology
In the preprocessing step, we develop low-volume data by flipping vertically and horizontally by 90-degree and 180-degree flips [26,27]. This study classifies clinical imaging brain tumors. The vertically flipped dataset contains flipped images of tumor plaques moving vertically from the original data. Merge two files double the size of the original file. The translated vertical dataset is larger than the image dataset.
When creating a horizontally flipped document, every image in the original file is flipped horizontally, and the plate’s position is changed to that of the found plate. All images in the original file are rotated 90 degrees. It will create a dataset rotated 90 degrees. The “function” parameter in the pass is set to “rotate”. The min/max degree tab in the settings tab is set to 900 degrees because the output image should be placed at 900 degrees. Raw data is developed by combining the generated data with the raw image data. All original dataset images are rotated 180 degrees and combined to create the 180-rotated dataset. The original data is expanded by merging the generated data with the data containing the original image. Fig. 3 shows dataset augmentation. The CIE L* a* b* location uses a threshold to select the ROI region in the tumor image. Color detection based on the color of image pixels assumes that similar colors in an image are similar to different groups, thus conveying similarity.

Figure 3: Data augmentation
In other words, each packet defines an array of pixels that share the same color. Because the discovery takes place depending on the discarded color space. Nonetheless, here is a significant circumstance, color spaces in dissimilar schemes are not exactly similar. After applying the threshold value, the targeted area is detected as shown in Fig. 4 accordingly. After CIE Lab color space, morphological operations like filling and dilation are used to make the region more visible and clearer, as shown in Fig. 4. ‘X*’ represents the grade of color.
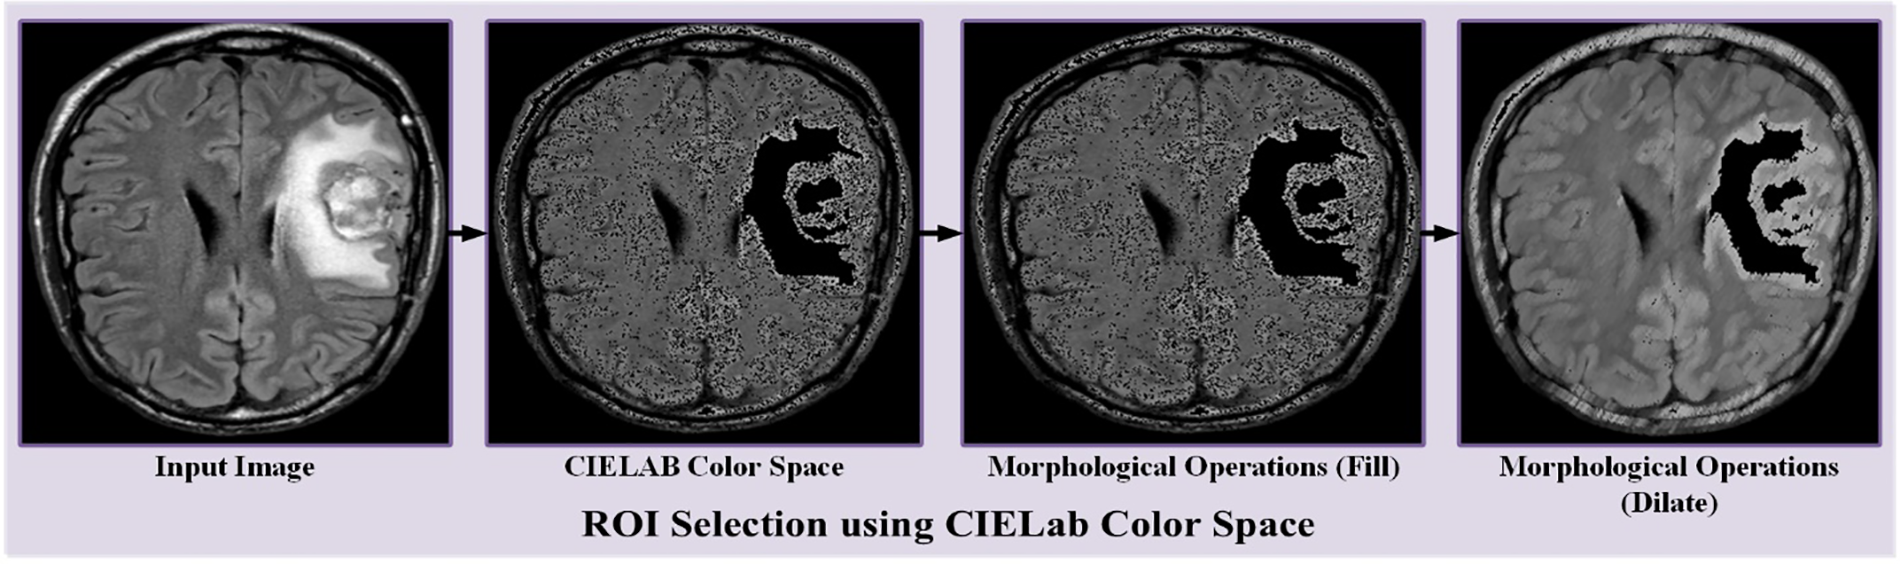
Figure 4: Demonstration of RoI selection using CIELab
The
The DarkNet-53 [28,29] and AlexNet [30–32] are convolutional neural networks that possess multiple layers of depth and are commonly employed for image recognition. Pre-existing links can be loaded using training from over a million images using the ImageNet database. In addition to dividing images into 1000 objects, the existing network can also categorize images by different types of animals and objects, such as keyboards, mice, and pens. After training, the neural network creates representations of various images. While the DarkNet-53 network can process images with a 224 × 224 pixels resolution, the AlexNet network is designed to process images with 227 × 227 pixels. AlexNet and DarkNet-53 were used to extract essential features from brain tumor data. This work uses AlexNet’s “FC7” fully connected layer and DarkNet-53’s “average” global pooling layer for feature extraction. The former layer contained 4096 features, while the latter had 1024 features. The diagram depicted in Fig. 5 illustrates the comprehensive process of feature engineering utilizing DarkNet-53 and AlexNet. Serial feature fusion is a technique that involves the amalgamation of various features to form a unified feature representation. This technique enables the capture of intricate associations and interdependencies among features, resulting in enhanced efficacy in machine-learning endeavors. The formulation of the mathematical equation for serial feature fusion is contingent upon the particular fusion technique employed. Several fusion techniques and their corresponding equations are presented below. The concatenation process involves merging individual features into a unified feature vector. Obtaining the fused feature vector, referred to as fusion, involves concatenating the two distinct feature vectors. From a mathematical perspective, the operation of concatenation can be denoted as follows:

Figure 5: Depicts features engineering in the proposed methodology
Furthermore, the characteristics are aggregated through an element-wise addition process. Two distinct features exist, x1 and x2, which are denoted as vectors. The fusion, represented as the fused feature vector, is acquired by summating the two distinct feature vectors. Mathematically, the addition action can be symbolized as:
The process of multiplication involves the element-wise multiplication of the respective features. The process of obtaining the fused feature vector, referred to as fusion, involves the multiplication of the two feature vectors:
The process of weighted fusion entails the allocation of weights to individual features, followed by their linear combination. Suppose there are two features, namely x1 and x2, which are both expressed as vectors. The fusion of feature vectors is achieved through a weighted linear combination, represented as the fused feature vector:
The variables w1 and w2 denote the weights allocated to x1 and x2, correspondingly. The aforementioned equations offer a comprehensive understanding of the mathematical representation of serial feature fusion. Notably, the fusion technique and equation utilized may differ based on the particular problem, context, and desired objectives.
3.3 Dimension Selection Using Entropy Coded BPSO
Entropy is a method employed in machine learning and feature selection to evaluate the significance or relevance of individual features within a given dataset. The underlying principle of this concept is rooted in the notion of entropy as defined in information theory. Entropy can be defined as a metric that quantifies the level of unpredictability or disorderliness present in a given set of data. Entropy is a measure utilized in feature selection to quantify the quantity of information each feature provides regarding the target variable or class labels. As entropy increases, the level of uncertainty or randomness of the target variable about the feature also increases. The computation of feature entropy involves an assessment of the target variable’s distribution across all feasible feature values. The formula for entropy commonly employed in feature selection is generally founded on Shannon’s entropy, which is explicitly characterized as such defined as:
The equation above involves the utilization of dataset S, where in p(i) denotes the probability of class i. The summation is executed across all the classes. Entropy ranges from 0 to log2(C), where C represents all classes. A larger entropy value indicates a higher degree of randomness or randomness in the variable of interest. Entropy feature selection entails computing the entropy of each feature. Higher entropy values demonstrate more informative or discriminating power, providing extended and unpredictable knowledge about the target variable. Subsequently, the characteristics above are chosen for subsequent examination or construction of a model, whereas the features that provide less information can be eliminated. Entropy is a highly beneficial asset in numerous machine-learning algorithms, including decision trees and random forests. It helps narrow down the most pertinent features for forecasting or categorizing purposes. This operation assists with minimizing dimensionality, improving model proficiency, and obtaining insights into the interrelationships between features and the target variable. BPSO is a commonplace meta-heuristic algorithm for selecting features. The BPSO procedure requires a binary particle swarm traversing through a search area to locate the ideal set of characteristics that maximize execution. The following provides an arithmetic representation of the BPSO algorithm. Initially, parameters are initialized for population optimization; this includes N, which denotes population size, and D, which stands for search radius magnitude. Before beginning the project of binary items denoted by P_i, where I is a number from 1. Each position P_i is portrayed as a binary string with a length of D. The velocities V_i of the binary particles should be set to zero initially. In order to figure out the fitness of particles in a given population, it necessitates computing the fitness value F_i for each particle P_i, which is attained by utilizing a fitness function. The metric known as the fitness function evaluates the efficacy of a subset of features. Initiate the optimal location. Establish the optimal placement for each particle as its initial position. B_i = P_i. The first step is to initialize the Global Best Position. This involves identifying the particle P_g with the highest fitness value and setting G equal to P_g. Revise the parameters of particle velocity and position. For each particle P_i, update the velocity.
where C_1 and C_2 are acceleration coefficients, R_1 and R_2 are random values between 0 and 1. Update the position:
The sigmoid function is utilized to map the velocity to a binary position. Assess the fitness value F_i of every particle P_i by utilizing the fitness function for every particle denoted as P_i. If the fitness value of F_i surpasses that of B_i, it is necessary to update B_i to equal P_i. If the fitness value of a given particle, denoted as P_i, surpasses that of G, the global best fitness value, then G is updated to equal P_i. Iterate the process outlined in steps 5–8 until a termination criterion is satisfied, such as reaching the maximum number of iterations or achieving convergence of the fitness values. The binary position denoted by G signifies the feature subset chosen to optimize the fitness function. The model depicted above utilizes XOR to represent the exclusive OR operation while employing the sigmoid function to map velocity values to binary positions. The particle’s movement is influenced by the acceleration coefficients (c_1 and c_2), which determine the impact of the individual best position (B_i) and the global best position (G). The proposed methodology algorithms are as follows:
Begin
End
Constructing an automated deep CNN framework is the objective of this research and study, which aims to improve the diagnostic accuracy of brain cancers. This proposal’s goals are accomplished by using DarkNet-53 and AlexNet, respectively. The collected features are combined to form custom vectors for classification. However, some of these features are not important for correct classification, so then decided to use the best option, practical population optimization with entropy code, to make the best decision—behavior to arrive at the correct classification. Finally, various SVM kernels are used for final classification by merging the kernels. This section describes the study’s findings and an analysis of the proposed methodology. It begins with an explanation of the experiments performed, then an explanation of the data used, and finally, an explanation of the tests performed.
The plan is executed on a Windows 11 operating system, i7-4710MQ core CPU (8 CPUs), running at 2.5 GHz, with 8 GB of random-access memory (RAM). A MATLAB 2021a variant of the language’s programming environment is used to evaluate the proposed model. To set up the experiment, we employed a dataset of brain tumor MRI scans. This dataset contains a pair of binary classifications we refer to as normal and tumor. This dataset includes 253 images of brain tumors detected by MRI. To apply augmentation methods to prepare our dataset since there is only a small amount of data. During the data augmentation process, then used a horizontal flop, a vertical flip, a rotation of 90 degrees, and a rotation of 180 degrees. Following a significant enhancement, I turned the original 253 images into a new total of 1270 images. The experimental design is shown in full in Table 1.

In order to determine the categorization outcomes of the suggested method, this study uses a wide variety of performance assessment criteria. Accuracy (Acr), Sensitivity (Se), and Specificity (Sp) are all parameters that may be calculated using these values. These parameters are then represented mathematically in the following section:
This research used five-fold cross-validation to evaluate the proposed model selected 250, 550, and 750 features using entropy coding for population optimization. Selected deep CNN features are evaluated using different SVM classifiers such as fine, medium, coarse Gaussian, linear, quadratic, and cubic. Precision, recall, and F1 scores are provided as tests for comparison and easy evaluation. We used DarkNet-53 and AlexNet to extract features. The DarkNet-53 model is trained for 50 epochs with a batch size of 32 and a learning rate 0.001. The Adam optimizer is employed for optimization, and the ReLU activation function is utilized.
Similarly, the AlexNet architecture is used, training for 40 epochs with a batch size of 64 and a learning rate 0.0005. The results are shown in Table 2 (for 250 features), Table 3 (for 550 features) and Table 3 (for 750 features). Over 250 characteristics are analyzed by Cubic and Quadratic (SVM), which shows a higher accuracy of 99%. The highest accuracy of 99.9% is achieved on 750 features through the utilization of Cubic and Quadratic (SVM).


Brain tumors display various characteristics, making manual diagnosis complex, labor-intensive, and subjective. Fast identification is compulsory for neurologists and radiologists. Using MRI for tumor identification can be error-prone and time-consuming. Thus, implementing automated computerized brain tumor detection is essential. Further preprocessing of MRI is also important to facilitate the machine learning methods such as transformations that refer to rotating an item by 90 or 180 degrees or reversing the vertical and horizontal axes. The present research employs the CIELAB color space model to detect tumors in digital images, leveraging the DarkNet-53 and AlexNet architectures. These models generate distinguishing features through their fully connected layers. By integrating the strengths of both DarkNet-53 and AlexNet, this research seeks to optimize tumor detection. The study adopts entropy coding within the Particle Swarm Optimization (PSO) process for feature optimization. Feature recognition is further optimized by various SVM kernels, including linear, quadratic, cubic, precision Gaussian, medium Gaussian, and coarse Gaussian.
In Experiment Setting 1, the methodology’s validity is assessed using a five-fold cross-validation technique. The entropy-coded PSO was pivotal in selecting 250 critical features for a more detailed evaluation. These features, derived from convolutional neural network outputs, were then assessed using several variants of SVM classifiers. As highlighted in Table 2, the Cubic and Quadratic SVM classifiers stand out, achieving an accuracy of 99% with the 250 selected features. Experiment Settings 2 and 3 followed a similar evaluation structure. The objective was to evaluate the approach’s effectiveness by employing entropy-coded PSO to select different attribute attributes for assessment. According to the results presented in Table 3, it is observed that a Cubic SVM yielded a high level of accuracy, precisely 99%, when applied to the 550 selected features. The findings show the effective execution of the chosen characteristics and the implemented categorizers in attaining good precision rates. The process of selecting 750 features is executed through entropy-coded PSO. The selected deep CNN features are evaluated using fine Gaussian, average Gaussian, coarse Gaussian, and various SVM classifier variants. Refer to Table 4, the SVM models utilizing Cubic and Quadratic variations achieved the highest accuracy of 99.9% when applied to the chosen set of 750 features.

We illustrate the prediction speed and training time in Table 4 to better understand the classifiers’ performance. Although the proposed research offers a potential automatic brain tumor diagnosis method, several shortcomings must be acknowledged. The size of our dataset is one major drawback. The diversity of brain tumor images, comprising diverse tumor types, sizes, and locations, might be further increased to improve the model’s generality to a broader range of clinical circumstances. Furthermore, using tumor images for ROI selection alone in CIELAB color space may generate biases in situations where minute color differences serve as critical indicators. This restriction might be lessened by looking into alternative color spaces or fusing different color representations.
Early detection of brain tumors can improve treatment planning and improve patient survival. Although tumor symptoms and treatments are different, the diagnostic process is still difficult and can be uncertain. Manual diagnosis via MRI scans is time-consuming and prone to errors. In this context, our research emphasizes the importance of automated computerized detection systems for timely tumor identification. This study employed data augmentation techniques to enrich the diagnostic data, such as 90-degree and 180-degree rotations and inversion along vertical and horizontal axes. Region of Interest (ROIs) were determined using the CIELAB color space, and features are extracted from DL models DarkNet-53 and AlexNet. then both DarkNet-53 and AlexNet models extract features. Subsequently, entropy-coded Particle Swarm Optimization (PSO) was employed to select the most prominent features, which were then classified using multiple SVM kernels. Our findings highlight the potential of such automated systems, but there are several avenues for future exploration. An in-depth comparative performance analysis against other methods is necessary.
Furthermore, expanding the training dataset regarding size and diversity can improve the system’s generalizability. In collaboration with medical professionals, comprehensive clinical validation will establish the system’s efficacy using real-world patient data. Additionally, alternative DL architectures beyond DarkNet-53 and AlexNet can further refine the accuracy of tumor detection. In conclusion, while our research underscores the need for early and efficient brain tumor diagnosis methods, it also delineates a roadmap for further advancements in the field. As proposed, integrating automated systems demands thorough validation within larger patient cohorts and alignment with clinical procedures to demonstrate their therapeutic impact.
Acknowledgement: None.
Funding Statement: The authors extend their appreciation to King Saud University for funding this work through Researchers Supporting Project Number (RSPD2023R711), King Saud University, Riyadh, Saudi Arabia.
Author Contributions: Study conception and design: Mudassir Khalil, Muhammad Imran Sharif; data collection: Ahmed Naeem; analysis and interpretation of results: Muhammad Umar Chaudhry, Hafiz Tayyab Rauf; draft manuscript preparation: Adham E. Ragab, Muhammad Imran Sharif. All authors reviewed the results and approved the final version of the manuscript.
Availability of Data and Materials: This study used the publically available dataset: https://www.kaggle.com/navoneel/brain-mri-images-for-brain-tumor-detection.
Conflicts of Interest: The authors declare no conflicts of interest to report regarding the present study.
References
1. J. Alyami, A. Rehman, F. Almutairi, A. M. Fayyaz, S. Roy et al., “Tumor localization and classification from MRI of the brain using deep convolutional neural network and Salp Swarm Algorithm,” Cognitive Computation, vol. 13, pp. 1–11, 2023. [Google Scholar]
2. M. I. Sharif, M. A. Khan, M. Alhussein, K. Aurangzeb and M. Raza, “A decision support system for multimodal brain tumor classification using deep learning,” Complex & Intelligent Systems, vol. 8, pp. 1–14, 2021. [Google Scholar]
3. H. Mohsen, A. El-Dahshan, E. M. El-Horbaty and A. M. Salem, “Classification using deep learning neural networks for brain tumors,” Future Computing and Informatics Journal, vol. 3, no. 1, pp. 68–71, 2018. [Google Scholar]
4. H. Abdullah Mengash and H. A. Hosni Mahmoud, “Brain cancer tumor classification from motion-corrected mri images using convolutional neural network,” Computers, Materials & Continua, vol. 68, no. 2, pp. 1551–1563, 2021. [Google Scholar]
5. M. A. Naser and M. J. Deen, “Brain tumor segmentation and grading of lower-grade glioma using deep learning in MRI images,” Computers in Biology and Medicine, vol. 121, pp. 103758, 2020. [Google Scholar] [PubMed]
6. S. Iqbal, M. U. G. Khan, T. Saba and A. Rehman, “Computer-assisted brain tumor type discrimination using magnetic resonance imaging features,” Biomedical Engineering Letters, vol. 8, pp. 5–28, 2018. [Google Scholar] [PubMed]
7. N. M. Dipu, S. A. Shohan and K. M. A. Salam, “Deep learning-based brain tumor detection and classification,” in Int. Conf. on Intelligent Technologies (CONIT), Hubli, India, IEEE, pp. 1–6, 2021. [Google Scholar]
8. A. B. Abdusalomov, M. Mukhiddinov and T. K. Whangbo, “Brain tumor detection based on deep learning approaches and magnetic resonance imaging,” Cancers, vol. 15, no. 16, pp. 4172, 2023. [Google Scholar] [PubMed]
9. A. Nanda, R. C. Barik and S. Bakshi, “SSO-RBNN driven brain tumor classification with Saliency-K-means segmentation technique,” Biomedical Signal Processing and Control, vol. 81, pp. 104356, 2023. [Google Scholar]
10. W. R. Khan, T. M. Madni, U. I. Janjua, U. Javed, M. A. Khan et al., “A hybrid attention-based residual unet for semantic segmentation of brain tumor,” Computers, Materials & Continua, vol. 76, no. 1, pp. 647–664, 2023. [Google Scholar]
11. A. Naeem, M. S. Farooq, A. Khelifi and A. Abid, “Malignant melanoma classification using deep learning: Datasets, performance measurements, challenges and opportunities,” IEEE Access, vol. 8, pp. 110575–110597, 2020. [Google Scholar]
12. A. Tiwari, S. Srivastava and M. Pant, “Brain tumor segmentation and classification from magnetic resonance images: Review of selected methods from 2014 to 2019,” Pattern Recognition Letters, vol. 131, pp. 244–260, 2020. [Google Scholar]
13. V. Romeo, R. Cuocolo, C. Ricciardi, L. Ugga, S. Cocozza et al., “Prediction of tumor grade and nodal status in oropharyngeal and oral cavity squamous-cell carcinoma using a radiomic approach,” Anticancer Research, vol. 40, no. 1, pp. 271–280, 2020. [Google Scholar] [PubMed]
14. C. Ricciardi, R. Cuocolo, G. Cesarelli, L. Ugga, G. Improta et al., “Distinguishing functional from non-functional pituitary macroadenomas with a machine learning analysis,” in XV Mediterranean Conf. on Medical and Biological Engineering and Computing–MEDICON 2019, Coimbra, Portugal, Springer International Publishing, pp. 1822–1829, 2020. [Google Scholar]
15. M. I. Sharif, J. P. Li, M. A. Khan and M. A. Saleem, “Active deep neural network features selection for segmentation and recognition of brain tumors using MRI images,” Pattern Recognition Letters, vol. 129, pp. 181–189, 2020. [Google Scholar]
16. F. Demir, Y. Akbulut, B. Taşcı and K. Demir, “Improving brain tumor classification performance with an effective approach based on a new deep learning model named 3ACL from 3D MRI data,” Biomedical Signal Processing and Control, vol. 81, pp. 104424, 2023. [Google Scholar]
17. K. Hu, Q. Gan, Y. Zhang, S. Deng, F. Xiao et al., “Brain tumor segmentation using multi-cascaded convolutional neural networks and conditional random field,” IEEE Access, vol. 7, pp. 92615–92629, 2019. [Google Scholar]
18. S. Gull, S. Akbar and H. U. Khan, “Automated detection of brain tumor through magnetic resonance images using convolutional neural network,” BioMed Research International, vol. 2021, pp. 3365043, 2021. [Google Scholar] [PubMed]
19. A. M. Fayyaz, M. I. Sharif, S. Azam, A. Karim and J. El-Den, “Analysis of diabetic retinopathy (DR) based on deep learning,” Information, vol. 14, no. 1, pp. 30, 2023. [Google Scholar]
20. H. A. Khalil, S. Darwish, Y. M. Ibrahim and O. F. Hassan, “3D-MRI brain tumor detection model using a modified version of level set segmentation based on dragonfly algorithm,” Symmetry, vol. 12, no. 8, pp. 1256, 2020. [Google Scholar]
21. H. Mehnatkesh, S. M. J. Jalali, A. Khosravi and S. Nahavandi, “An intelligent-driven deep residual learning framework for brain tumor classification using MRI images,” Expert Systems with Applications, vol. 213, pp. 119087, 2023. [Google Scholar]
22. A. Çinar and M. Yildirim, “Detection of tumors on brain MRI images using the hybrid convolutional neural network architecture,” Medical Hypotheses, vol. 139, pp. 109684, 2020. [Google Scholar]
23. S. Husham, A. Mustapha, S. A. Mostafa, M. K. Al-Obaidi, M. A. Mohammed et al., “Comparative analysis between active contour and Otsu thresholding segmentation algorithms in segmenting brain tumor magnetic resonance imaging,” Journal of Information Technology Management, vol. 12, pp. 48–61, 2020. [Google Scholar]
24. N. Arunkumar, M. A. Mohammed, S. A. Mostafa, D. A. Ibrahim, J. J. Rodrigues et al., “Fully automatic model-based segmentation and classification approach for MRI brain tumor using artificial neural networks,” Concurrency and Computation: Practice and Experience, vol. 32, no. 1, pp. e4962, 2020. [Google Scholar]
25. N. Arunkumar, M. A. Mohammed, M. K. A. Ghani, D. A. Ibrahim, E. Abdulhay et al., “K-means clustering and neural network for object detecting and identifying abnormality of brain tumor,” Soft Computing, vol. 23, pp. 9083–9096, 2019. [Google Scholar]
26. M. F. Safdar, S. S. Alkobaisi and F. T. Zahra, “A comparative analysis of data augmentation approaches for magnetic resonance imaging (MRI) scan images of brain tumor,” Acta Informatica Medica, vol. 28, no. 1, pp. 29–36, 2020. [Google Scholar] [PubMed]
27. M. Irshad, M. Yasmin, M. I. Sharif, M. Rashid, M. I. Sharif et al., “A novel light u-net model for left ventricle segmentation using MRI,” Mathematics, vol. 11, no. 14, pp. 3245, 2023. [Google Scholar]
28. S. Ahuja, B. K. Panigrahi and T. K. Gandhi, “Enhanced performance of dark-nets for brain tumor classification and segmentation using colormap-based superpixel techniques,” Machine Learning with Applications, vol. 7, pp. 100212, 2022. [Google Scholar]
29. Y. Eroglu, M. Yildirim and A. Cinar, “mRMR-based hybrid convolutional neural network model for classification of Alzheimer’s disease on brain magnetic resonance images,” International Journal of Imaging Systems and Technology, vol. 32, no. 2, pp. 517–527, 2022. [Google Scholar]
30. O. Russakovsky, J. Deng, H. Su, J. Krause, S. Satheesh et al., “ImageNet large scale visual recognition challenge,” International Journal of Computer Vision, vol. 115, pp. 211–252, 2015. [Google Scholar]
31. A. Krizhevsky, I. Sutskever and G. E. Hinton, “ImageNet classification with deep convolutional neural networks,” Communications of the ACM, vol. 60, no. 6, pp. 84–90, 2017. [Google Scholar]
32. T. Zhang, S. Ye, K. Zhang, J. Tang, W. Wen et al., “A systematic DNN weight pruning framework using alternating direction method of multipliers,” in Proc. of the European Conf. on Computer Vision (ECCV), Munich, Germany, pp. 184–199, 2018. [Google Scholar]
Cite This Article
 Copyright © 2023 The Author(s). Published by Tech Science Press.
This work is licensed under a Creative Commons Attribution 4.0 International License , which permits unrestricted use, distribution, and reproduction in any medium, provided the original work is properly cited.
 Downloads
 Citation Tools