
 Submit a Paper
 Propose a Special lssue
 Open Access
ARTICLE

DL-Powered Anomaly Identification System for Enhanced IoT Data Security
Department Computer Science, Prince Sattam Bin Abdulaziz University, Wadi Ad-Dawaser, 11990, Saudi Arabia
* Corresponding Author: Manjur Kolhar. Email:
Computers, Materials & Continua 2023, 77(3), 2857-2879. https://doi.org/10.32604/cmc.2023.042726
Received 09 June 2023; Accepted 13 September 2023; Issue published 26 December 2023
 View Full Text
 Download PDF
Abstract
In many commercial and public sectors, the Internet of Things (IoT) is deeply embedded. Cyber security threats aimed at compromising the security, reliability, or accessibility of data are a serious concern for the IoT. Due to the collection of data from several IoT devices, the IoT presents unique challenges for detecting anomalous behavior. It is the responsibility of an Intrusion Detection System (IDS) to ensure the security of a network by reporting any suspicious activity. By identifying failed and successful attacks, IDS provides a more comprehensive security capability. A reliable and efficient anomaly detection system is essential for IoT-driven decision-making. Using deep learning-based anomaly detection, this study proposes an IoT anomaly detection system capable of identifying relevant characteristics in a controlled environment. These factors are used by the classifier to improve its ability to identify fraudulent IoT data. For efficient outlier detection, the author proposed a Convolutional Neural Network (CNN) with Long Short Term Memory (LSTM) based Attention Mechanism (ACNN-LSTM). As part of the ACNN-LSTM model, CNN units are deployed with an attention mechanism to avoid memory loss and gradient dispersion. Using the N-BaIoT and IoT-23 datasets, the model is verified. According to the N-BaIoT dataset, the overall accuracy is 99%, and precision, recall, and F1-score are also 0.99. In addition, the IoT-23 dataset shows a commendable accuracy of 99%. In terms of accuracy and recall, it scored 0.99, while the F1-score was 0.98. The LSTM model with attention achieved an accuracy of 95%, while the CNN model achieved an accuracy of 88%. According to the loss graph, attention-based models had lower loss values, indicating that they were more effective at detecting anomalies. In both the N-BaIoT and IoT-23 datasets, the receiver operating characteristic and area under the curve (ROC-AUC) graphs demonstrated exceptional accuracy of 99% to 100% for the Attention-based CNN and LSTM models. This indicates that these models are capable of making precise predictions.Keywords
Several Information and Communications Technology (ICT) infrastructures are becoming increasingly dependent on the IoT. There are several new service paradigms that have emerged from this technology, including wearable medical technology, driverless cars, and other applications for smart cities [1]. According to recent research, there are currently over 26 billion operational IoT devices in use around the world [2]. IoT technologies are being used by businesses to improve efficiency and security. Through the use of IoT solutions, manufacturers can avoid and foresee significant and real-time problems like engine failures and other mishaps by analyzing massive amounts of data collected by sensor devices incorporated into their equipment. Because of this, factories can dramatically improve output and worker security [3,4]. Security flaws exist in each of these tiers [5–9]. The data that IoT devices create, collect, and analyze typically consists of sensitive information, leaving them open to significant security vulnerabilities. Cybercriminals and attackers have been able to exploit these widespread adoption [10] and deployment of information and communication technologies for the purpose of accessing patient information and confidential digital health records [11]. As a result, designing efficient anomaly detection systems is crucial to ensuring the trustworthiness of data collected by IoT devices in an immediate fashion [12]. Both statistical and machine learning methodologies are used for anomaly detection in the IoT [13]. For data analytics and creating control options for cyber-physical systems, IoT devices should be equipped with sensors capable of transmitting data to the cloud. To train a model, statistical methods merely use typical IoT traffic [14]. In contrast, machine learning techniques employ excellent and bad data to create a trained model. Based on the nature of the training data, these methods can be classified as supervised, unsupervised, or semi-supervised [15]. Through supervised learning, we can determine if a given flow of communication is benign or malicious based on its characteristics. By identifying intriguing patterns in the data, the unsupervised learning technique can learn the traffic characteristics independently of the traffic class. Because the study uses IoT traffic records with defined class labels, supervised learning may be utilized to train the model. Rapid technological advancement has also provided new entry points for attackers seeking to breach network security. Information stored in the cloud or on a device connected to the internet, security has thus become the first and foremost issue. Millions of apps rely on internet connectivity, all of which need to be protected. Since most work now depends on incorporating contemporary technology, a trustworthy, quick, and suitably robust security solution is urgently required to safeguard their information [16]. The prevalence of Network Intrusion Detection Systems (NIDS) allows for identifying assaults based on signatures and anomalies [17]. Signature-based anomaly detection approaches compare network events to a library of known attack signatures to determine if a compromise attempt has been attempted and to notify the network administrator of the attack and its specifics [18,19]. In contrast, anomaly-based systems can identify previously unidentified assaults in network data by comparing them to a predefined norm [20].
With the increasing volume and diversity of data, deep learning outperforms traditional machine learning methods. When dealing with complex and high-dimensional data, such as images or time series, CNNs can be particularly helpful for outlier detection. The outlier detection process can be improved by leveraging the CNN’s ability to automatically extract relevant features. Deep learning-based anomaly detection systems have gained significant traction due to their effectiveness. This research focuses on developing a deep learning-enabled framework for accurately identifying anomalies in IoT, addressing the challenges posed by the diverse nature of IoT systems. Our study presents a communication-efficient on-device deep learning system that performs accurate and timely anomaly detection at the edge. This system leverages a CNN-LSTM (ACNN-LSTM) model with an attention mechanism. Specifically, LSTM modules are employed for time series prediction, while attention-based CNNs extract fine-grained characteristics from historical observation sensing time-series data. The proposed model mitigates issues such as gradient dispersion and memory loss. We highlight our main contributions, emphasizing the development of an efficient on-device anomaly detection system that enhances IoT data security.
• By establishing a robust anomaly detection framework for the Internet of Things (IoT), the capacity to identify malicious data generated by compromised and diverse IoT devices is significantly enhanced.
• In this study, we introduce a CNN-LSTM model for anomaly detection, combining the strengths of both architectures to effectively capture the intricate characteristics of time series data. The CNN component enables the extraction of fine-grained properties, while the LSTM component ensures reliable and swift detection of abnormalities. The incorporation of an attention mechanism further enhances the model’s ability to focus on relevant features, optimizing the anomaly detection process.
• Our objective was to evaluate the performance of our model in comparison to other supervised deep learning algorithms. For this purpose, the author conducted experiments based on the N-BaIoT and IoT-23 datasets. By analyzing the results, we aimed to assess the effectiveness of our model and determine its superiority over alternative approaches based on different supervised deep learning algorithms. It will speed up the review and typesetting process.
Intrusion detection systems based on machine learning are considered for protecting IoT networks. For the past decade, experts have delved deeply into Artificial Intelligence (AI) techniques like Machine Learning (ML) and Deep Learning (DL) to develop effective NIDS solutions. Trends in NIDS over the last three years have shown that DL algorithms have surpassed ML in popularity because the fast-computing requirement of DL algorithms has been met by the development of Graphical Processing Units (GPUs) technology [21]. In response, the researchers have developed adequate security solutions for IoT networks that process large volumes of raw data. Through its deep structure, DL can understand the intricate pattern, which in turn aids in distinguishing between normal and abnormal data flows. An IDS was created by Thamilarasu et al. [22] to detect black-hole, opportunistic, Distributed Denial of Service (DDoS), sinkhole, and wormhole attacks in the Internet of Things. An attack detection method based on deep learning is used. Each layer of the DNN is responsible for selecting characteristics to use in the proposed system. When tested against various attack types, the suggested Deep Learning model achieved an impressive 97% True Positive Rate and 95% average accuracy. For each possible form of cyberattack, five distinct models are created. However, our research shows that a single model can accurately anticipate many different types of assaults. An IoT routing attack detection solution is presented in [23,24]. A series of simulations in the realistic COOJA simulator generate the dataset.
To detect network probing and low-level Denial of Service (DoS) attacks [25] suggested a system based on a machine learning classifier. The proposed system has poor detection accuracy (high FP) and poor recall (high FN) regarding DoS attacks. Thereby not providing encouraging findings for threat detection. Similar to the synthetic dataset [26] utilized by Hussain et al., this one also included 357,952 samples, 13 characteristics (data type: small, persistent, separate, conventional), and 8 classes. To help machine learning classifiers, static features are used. The suggested IDS is in charge of detecting attacks such as DoS, data-type searching, mischievous control (MC), malicious operation (MO), scan (Spy), and wrong setup (Wrong). The supervised Random Forest method achieved the best detection accuracy across all attack types (99.4%). An intrusion detection system based on the NSL-KDD dataset was developed by Pahl and Aubet [27]. Considering the dataset can be altered, added to, and replicated. There are four types of assaults in this data collection (probe, R2L, U2R, and DoS), however, contemporary attack vectors and IoT traces are absent.
In [28], a Bidirectional LSTM based Recurrent Neural Network (BLSTM-RNN) is used in tandem with Word Embedding (WE) techniques to improve the identification of IoT botnets utilizing DL methodologies. A lab network with an Internet of Things (IoT) surveillance cameras and a Mirai botnet C2 server was used to develop and test the suggested detection algorithm. Only four of the ten attack routes unique to the simulated Mirai botnet were employed in their studies, with the remaining six being filed away for possible future use. We use WE to do preliminary processing on the collected data, which converts the tokenized strings to integer values. The BLSTM detection model receives them with the appropriate labels. While the results of the evaluations (accuracy and loss) are hopeful, there is still room for improvement in the research concerning the dataset, the attack vectors, and the assessed parameters. In [29], the authors proposed employing neural networks to categorize IoT-based assaults. Researchers developed, tested, and validated a method for identifying and categorizing IoT threats based on information available from the Network Security Laboratory-Knowledge Discovery Databases (NSL-KDD). Ge et al. offered a model based on Feed-Forward Neural Networks (FNN) for the binary and multi-class classification of other assaults on IoT devices in their recent study [30], which demonstrates the use of Deep Learning (DL) techniques for IoT network intrusion detection. The Bot-IoT dataset [31] was selected as a testbed for the authors’ work, as it was for ours. While the suggested method had generally satisfactory results, the authors noted certain challenges they ran across during their assessment, as well as some ways in which their system may be improved.
A Neural Network (NN) was introduced for multi-task training by Huang et al. [32]. The NN is initially employed to determine the aggressiveness of a particular binary or malicious action. Next, they utilized NN to label an intrusion’s familial group. To investigate the various forms of infiltration, Kolosnjaji et al. [33] developed a CNN that collaborated with LSTM networks. A convolution layer is used to learn how the intrusion-related properties are connected. With CNN’s output, the LSTM is trained to detect feature dependencies. A deep learning model technique was recently presented for identifying abnormal activity in IoT networks by Ullah et al. [34]. Anomaly detection in IoT was accomplished by switching to a recurrent neural network fed by LSTM and Gated Recurrent Unit (GRU). A CNN was also employed to examine IoT-related input properties to retain relevant data. Combining the two approaches, they created a lightweight deep-learning model for binary classification. Zhou et al. [35] developed DB-CGAN using generative adversarial networks (GANs) [36]. Through adversarial training, they improved their classification and detection methods. Kale et al. [37] proposed a three-stage approach to identifying anomalies in IoT based on deep learning. With the aid of K-means, GANomal, and convolutional neural networks, they were able to create a cohesive structure. The authors [38] demonstrated that biometric authentication-based intrusion detection can be effective in smart cities through the use of artificial intelligence. To implement block-chain-based IoT security [39–41], it is imperative to take into account factors such as scalability, interoperability, and energy efficiency. It may also be necessary to integrate other security mechanisms, including encryption and secure hardware [42], to provide comprehensive IoT security.
The increasing prevalence of IoT devices has necessitated the development of robust anomaly detection frameworks to identify malicious data generated by compromised devices. In this study, we propose a CNN-LSTM model for anomaly detection in IoT, leveraging the strengths of both architectures to effectively capture the intricate characteristics of time series data. The CNN component extracts fine-grained properties, while the LSTM component enables reliable and swift detection of abnormalities. Additionally, an attention mechanism enhances the model’s ability to focus on relevant features, optimizing the anomaly detection process. We evaluated the model’s performance on the N-BaIoT and IoT-23 datasets and compared it to other supervised deep learning algorithms. The results demonstrated the superiority of our model, showcasing its effectiveness in accurately detecting anomalies in IoT networks. This research contributes to enhancing IoT security by enabling the identification of malicious data generated by compromised and diverse IoT devices.
Deep learning-based anomaly detection in IoT networks is a promising approach to detecting and mitigating abnormal behavior and potential security threats within the IoT ecosystem. The use of deep learning and anomaly detection models has greatly benefited computer vision, NLP, and other applications. Gathering pertinent data from networked IoT devices is the first step. Sensor readings, network traffic records, device metadata, and anything else useful might fall under this category. Pre-processing is sometimes necessary to transform raw data acquired from IoT devices into a format appropriate for deep learning models. Data normalization, feature extraction, and dimensionality reduction are all possible steps in this process. Several deep learning models are available for use in IoT network anomaly detection. Fig. 1 shows the overall structure of the proposed model. A comprehensive architecture is employed to achieve the objectives of the Deep Learning-Powered Anomaly Identification System for Enhanced IoT Data Security. This architecture consists of the following components:
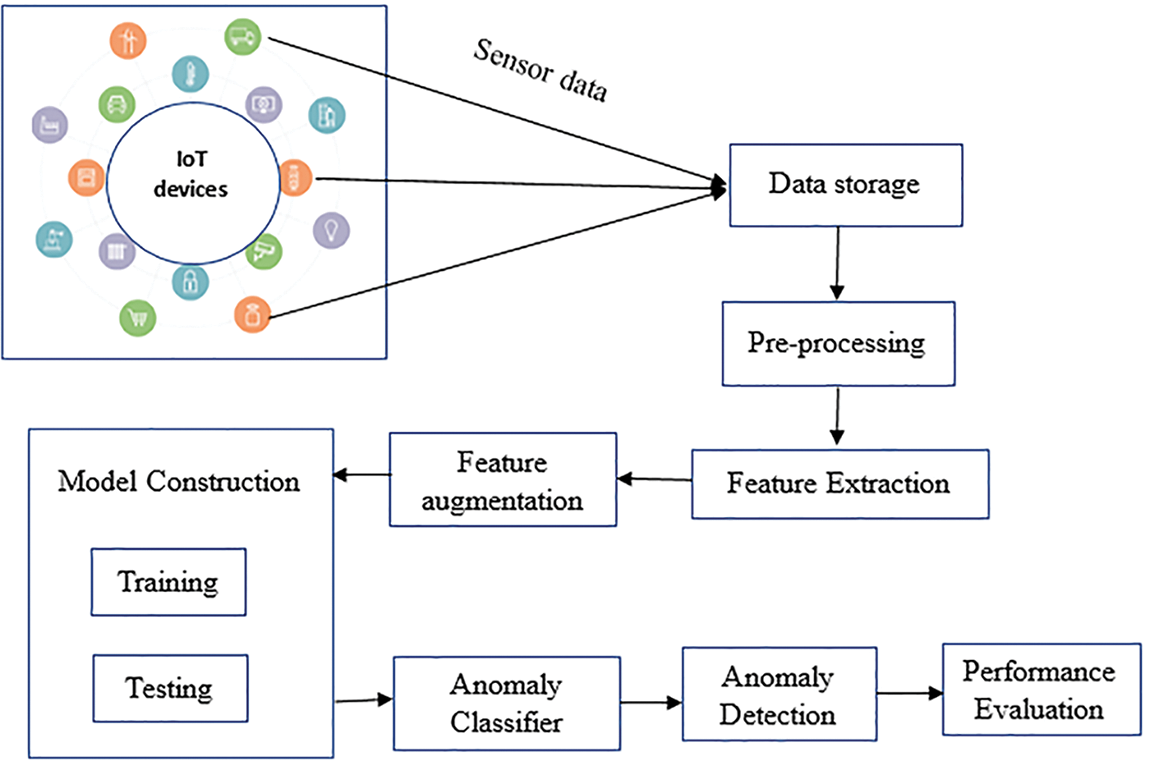
Figure 1: The overall structure of the proposed model
1. Input data: A variety of IoT devices provide input to the system, including data from sensors, network traffic data, or any other relevant data.
2. Preprocessing: During preprocessing, input data is cleaned, normalized, and features are extracted. As a result, the data will be in a format that is suitable for further analysis.
3. Deep learning models: The system relies on a deep learning model to identify anomalies in IoT data. A neural network is typically built using CNNs and LSTMs.
4. Training: Anomalies are explicitly identified in labeled data. Data instances with normal and anomalous characteristics are identified during the training phase.
5. Detection of anomalies: Once the model has been trained, it is deployed for the detection of anomalies. Input data is taken from new, unlabeled IoT sensors, and anomaly scores or probabilities are calculated for each data point. Scores indicate the likelihood that a data point is anomalous.
6. Threshold and decision making: A predefined threshold is used to compare the anomaly scores obtained from the model with a decision point. An anomaly is defined as a data point whose score exceeds the threshold. In response to this classification, appropriate actions can be taken, such as issuing alerts, initiating security measures, or notifying the system administrator.
7. Continuous learning and improvement: The system can be designed to learn and adapt to new patterns and anomalies as they emerge. To achieve this, the model may need to be periodically retrained with updated data or online learning techniques may be applied to dynamically update the model in real-time. The system enhances IoT data security by utilizing deep learning techniques and a well-defined architecture to identify anomalies, enable timely responses, and minimize potential risks.
LSTM, CNNs, and Generative Adversarial Networks (GANs) are only a few of the most popular types of models now in use. The data and the job must be considered while deciding on a model for anomaly detection. Labeled data includes typical and unusual activity in the IoT infrastructure. During the model’s training phase, it learns to reflect typical behavior accurately. Once the model has been trained, it may be produced for real-time anomaly detection. It gathers information from the Internet of Things and converts it into either a prediction or an anomaly score. High-scoring outliers are potential anomalies that should be investigated further or addressed. Metrics like accuracy, recall, and F1-score may be used to gauge how well a deep learning model performs. The assessment findings may be used to hone and retrain the model for enhanced anomaly identification.
The modules from Fig. 1, are as follows, collecting the Sensor Data module involves collecting sensor data from various sources such as IoT devices, sensors, or other data sources. The data could include measurements, readings, or observations from different sensors. Once the sensor data is collected, it must be stored for further processing. This module focuses on keeping the data in a suitable format or database for easy access and retrieval during subsequent stages. The collected sensor data is pre-processed in the pre-processing module to ensure its quality and prepare it for further analysis. Pre-processing steps may include data cleaning, removing noise or outliers, handling missing values, and normalizing or scaling the data. Feature extraction involves selecting or deriving relevant features from the pre-processed data. This module aims to identify the most informative and discriminative features that can capture essential patterns or characteristics of the sensor data. Feature augmentation is the process of enhancing the extracted features by incorporating additional information or creating new features. This module may involve techniques such as feature engineering, dimensionality reduction, or generating synthetic features to improve the data representation. The DL Model Construction module focuses on building a model that can effectively learn from the augmented features. Deep learning models, such as neural networks, are constructed with multiple layers of interconnected nodes to capture complex patterns in the data. To classify normal and anomalous patterns, the deep learning model is trained with labeled data once it has been built. This module trains the model to recognize normal behavior based on the labeled training data. In the Anomaly Detection module, the trained deep learning model is applied to detect anomalies in real-time or on new, unseen data. The model analyses the input data and identifies patterns or instances that deviate significantly from the normal learned behavior. The performance of the anomaly detection model is assessed in this module. Various evaluation metrics, such as accuracy, precision, recall, or F1-score, are calculated to measure the model’s effectiveness in detecting anomalies. This evaluation helps understand the model’s reliability and identifies areas for improvement.
The IoT-23 dataset is an updated data collection on network activity generated by IoT gadgets. There are 20 malware samples captured while running on IoT devices and three benign IoT traffic samples. The earliest release date is January 2020, containing images from 2018 and 2019. Avast Software, located in Prague, is supporting this study and dataset. Twenty-three samples, or “scenarios”, of varying IoT network traffic make up the IoT-23 dataset. These situations comprise twenty network grabs from infected IoT and three network captures from actual IoT devices. For each attack scenario, we utilized a Raspberry Pi to run a malware sample that used many protocols and varied methods of operation. We considered the N-BaIoT dataset [43], partly because it is based on actual data flow from various IoT and non-IoT devices. This dataset contains data from nine affected devices, however, because the attack flow was unique to the Mirai and Bashlite botnets, we opted to focus on a dataset that covers a broader range of threats. The N-BaIoT (Network-Based IoT) dataset is a publicly available dataset designed explicitly for evaluating anomaly detection techniques in IoT networks. It was created by researchers from the University of New Brunswick and contains network traffic data captured from a real IoT network environment. Taking into account the characteristics of the N-BaIoT dataset and the specific anomaly detection algorithm, a suitable anomaly detection algorithm is selected. To provide insight into the effectiveness of the imbalance handling technique, the author has also evaluated the performance of the model using appropriate metrics, such as precision, recall, F1-score, or AUC-ROC.
In machine learning, the first step is pre-processing data so that the relevant classifier can deliver error-free, optimal results. NaN removal, duplicate instance clean-up, and normalization/scaling come first in the pre-processing phase. This procedure entails rescaling the data to a predetermined interval (say, 0 to 1) to guarantee the model is independent of the absolute values of numeric attributes. We use MinMax scaling to normalize features because the dataset has minimal variance and ambiguity. An equation illustrating how MixMax scaling is used to normalize data can be found below:
where
Figure 2: Proposed attention-based CNN and LSTM method
CNN Feature Extraction: The cleaned data is fed into the CNN to extract high-level representations of the data. The CNN consists of 1-D convolution layers, batch normalization layers, and non-linear layers stacked together to produce the CNN module. These layers capture fine details from the time series data and generate m feature sequences of length n. LSTM Temporal Connection: The output of the CNN is then passed to an LSTM network to extract more nuanced temporal connections between features. The LSTM is capable of capturing temporal dependencies and patterns in the data, contributing to the overall anomaly detection process. Attention Mechanism: To focus on key details and enhance feature extraction, the model incorporates an attention mechanism. Inspired by the concept of human perception, the attention mechanism enables the model to pay attention to the most relevant information and ignore less relevant details. This attention process is applied in parallel with the CNN feature extraction to extract additional meaningful features from the time-series data. The attention mechanism includes feature aggregation and scale restoration processes. Feature aggregation uses a 1 × 1 convolution kernel to mine linear connections and stack multiple convolutions and pooling layers to extract essential characteristics from the data. Scale restoration ensures that the extracted features are properly rescaled to maintain their significance in the anomaly detection process. By combining the strengths of CNN and LSTM and incorporating the attention mechanism, the proposed architecture can efficiently detect anomalies in IoT data by capturing both local patterns and temporal dependencies in the time series data. This approach enhances the model’s performance in identifying important features and contributes to improved anomaly detection accuracy. The sigmoid function is used to confine the values to [0, 1] after the scale restoration section has restored the key features to (n × m), which is in line with the size of the output features of the CNN module. For a particular training dataset,
Lastly, the local optimum solution is as follows, after the local characteristic matrix
The entire connection layer then forms a link between the vectors
The LSTM receives its input from the convolution network’s output
The key characteristics generated by the associated attention mechanism module are multiplied by the CNN module’s output attributes element-wise. For simplicity, let’s suppose that
For the model to learn the salient properties of the present local sequence, we apply the attention mechanism to broaden the receptive field of the input. To further address the issue that the model cannot discern the relevance of the time series data characteristics, we employ the attention module to reduce the model's exposure to irrelevant information. After CNN’s output is received, a memory unit consisting of the hidden state
The information is first sent through a forgetfulness gate. The forgetting gate’s sigmoid unit produces a vector in the range 0–1 via the calculation
The forget gate is indicated by
The next two actions determine the proportion of newly acquired data that will be stored in the memory module. In the first place, we obtain the input gate by solving for
Memory unit
The data is sent into an LSTM, which generates an output
The target weight is denoted as
The weight probability vectors are denoted by
The weighted average is calculated by

We begin by splitting the processed data into a training dataset and a test dataset. Second, a convolutional neural network is used to extract data features from the training dataset that was used to build the model. Following this, the data is fed into a Long Short-Term Memory (LSTM) model to be transformed into time series features; the fault characteristics of each time segment are combined into a unified sequence fault feature; and an attention mechanism is included in the model. Prediction results are then sent out over the whole network’s connections, and the model’s parameters are automatically adjusted as necessary to minimize the loss function. In this study, we specify a target number of iterations as the training’s final condition and stop when the model hits that amount. The testing step begins with loading the trained model. The model is then used to forecast failures based on the test dataset. At long last, we have data from our experiments.
In the suggested model, CNN, LSTM, and an attention mechanism are all combined. Among these, CNN may speed up the model’s calculations by reducing the number of parameters it needs to run by sharing convolution kernel parameters. By utilizing a memory unit, LSTM can address the issue of gradient disappearance due to a too-long-time step and handle the long-time sequence dependency of data. An attention mechanism may be employed to direct the model’s attention to the characteristics that have the greatest correlation with the error. To further enhance the model’s accuracy and generalizability, an attention mechanism can help diminish the weight of irrelevant details.
Our whole process was carried out in Python, and we relied on the TensorFlow framework, Pandas, and the Scikit-learn packages to accomplish our goals. Our study was done on a PC equipped with an Intel Core i7 processor, 16 GB of RAM, and an NVIDIA GeForce graphics card. The hyper-parameters used in this proposed model are shown in Table 1. The magnitude of the filters (or kernels) applied to the layers of a Convolutional Neural Network. Each filter with a size of 3 will be 3 square inches in size. The magnitude of the convolutional kernels employed by CNN’s neural network. Each kernel with a size of 3 will be 3 by 3, therefore the total size of the kernel will be 9. The stride controls how quickly the filters in the CNN layers advance over the input data. When the stride is set to 1, the filter pixels advance by a factor of 1. Padding occurs when extra pixels are added to the input data’s boundaries before convolution is used. If you specify a padding value of 1, then the input data will be surrounded by a border that is 1 pixel wide. The number of filters (or feature maps) incorporated into the CNN architecture. The input data is used to teach each filter unique characteristics. In a CNN, this is the activation function used in the layers that follow the convolutional one. One such option that does so by introducing non-linearity is ReLU (Rectified Linear Unit). The pooling technique used in CNN’s last layer, follows the activation function. To reduce the dimensionality of the feature maps, max pooling chooses the largest value inside an area. The number of cells that make up the LSTM layer in a neural network’s memory. LSTM Recurrent Neural Networks (RNNs) are effective at modeling temporal relationships in sequences. The regularization method used to prevent overfitting in the LSTM layer, is expressed as a dropout rate. With a dropout rate of 0.20, 50% of the LSTM units will be arbitrarily disregarded during training. The attention mechanism is utilized to prioritize the information in the input sequence. The attention mechanism uses the tanh activation function. During training, the optimizer makes adjustments to the model’s parameters, and the magnitude of those updates depends on the learning rate. Convergence may be slower, but parameter updates are more precise with a slower learning rate.

Several metrics were used to evaluate the effectiveness of the planned system. These parameters may be used to determine which method is best suited to a particular task based on the parameters. It is a standard technique that sums up a categorization model’s performance on test data with properly annotated labels. The method makes it easier to identify cases of miscommunication between classes. In most cases, this is the baseline from which additional performance indicators are calculated. A confusion matrix is a summary of the results of a classification task’s forecast. True positive (
Precision in forecasting is measured in terms of its degree of precision. It is the proportion of the model’s successes relative to the entire number of its forecasts. The following equation provides the value of Precision for a single class:
A model’s performance may also be quantified using the F1-score. The Weighted average of a model’s accuracy and reliability. The formula for a single-class F1-score is as follows:
ROC is a popular graph that summarizes how well a classifier does across different cutoffs. To create it, we compare the True Positive Rate (Tpr) to the False Positive Rate (Fpr) as we change the threshold for classifying data and plot the two alongside one another. To get the True Positive Rate and the False Positive Rate, we may use the following formulas:
Each projected class’s threshold value is its associated probability. ROC curves may be plotted with simple yes/no categories. The one-vs.-the-rest approach, however, allows for its generalization to further classes. Both the genuine positive rate and the false positive rate might be anything from 0 to 1 for any given category.
Fig. 3 illustrates the confusion matrix for different models evaluated on the N-BaIoT dataset. The confusion matrix displays the true positive, false positive, true negative, and false negative rates, and is therefore helpful for assessing the accuracy of classification algorithms. In this figure, four different models are compared: (a) Attention-based CNN and LSTM, (b) CNN and LSTM without attention, (c) LSTM with attention, and (d) CNN with attention. Each model has been trained and tested on the N-BaIoT dataset, which is a dataset specifically designed for evaluating Internet of Things (IoT) security. ’Benign’ classification accuracy is 97%. The model properly detected 97% of no-attack cases. Benign IoT devices behave normally and without malice. The model’s excellent accuracy in categorizing benign cases shows its ability to differentiate harmful IoT device behaviors. The ‘Mirai ACK’ attack is 100% classifiable. The model correctly recognized all ‘Mirai ACK’ attacks. Mirai virus targets IoT devices with DDoS assaults. ‘Mirai ACK’ attacks flood the target device’s network with TCP ACK packets. The model’s 100% accuracy in identifying this assault type shows its ability to accurately identify it. The ‘Mirai Scan’ assault classifies 98%.
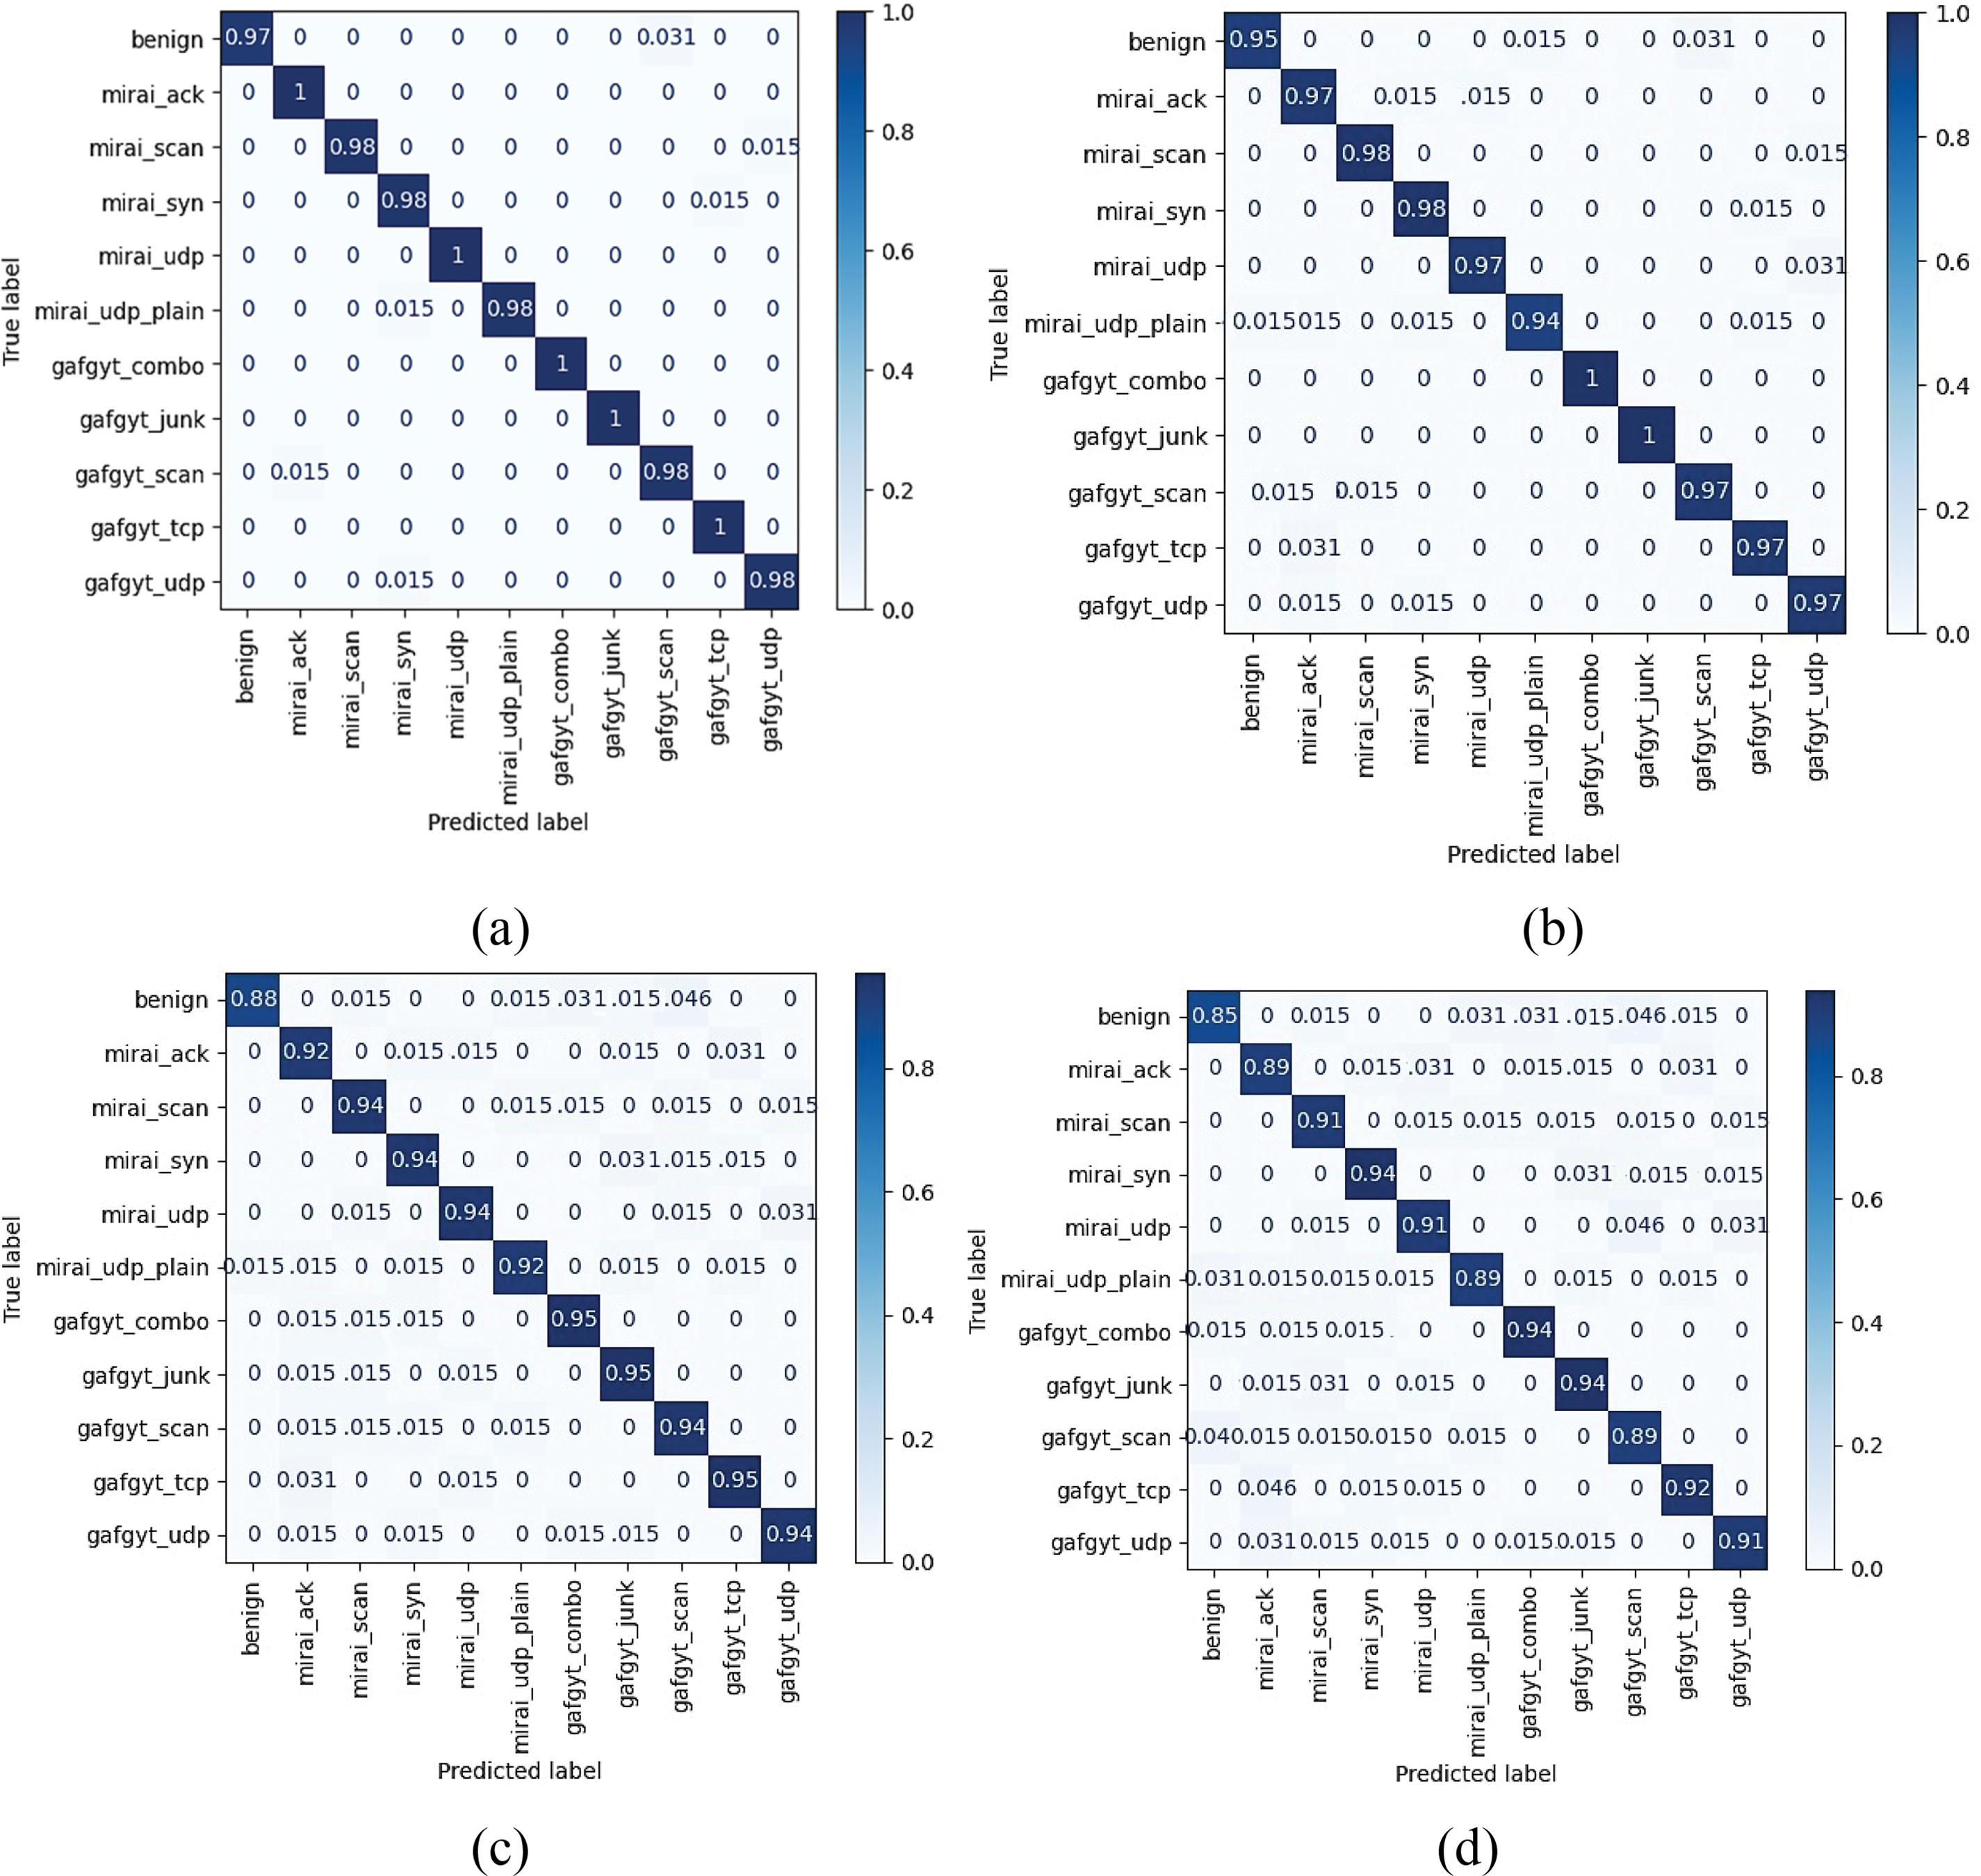
Figure 3: The confusion matrix on N-BaIoT dataset (a) Attention-based CNN and LSTM (b) CNN and LSTM without attention (c) LSTM with attention (d) CNN with attention
‘Mirai SYN’ assault categorization accuracy is 98%. The Mirai botnet floods the target device with TCP SYN packets in a “Mirai SYN” assault, making it unreachable. The model detected and classified 98% of this assault. The model successfully identified 100% of these assault type, demonstrating its ability to recognize and distinguish it. ‘Mirai UDP Plain’ attack categorization accuracy is 98%. Sending plain UDP packets to the target device overloads its network and disrupts service. The model correctly identified 98% of ‘Mirai UDP Plain’ assaults. ‘Gafgyt Combo’ categorization accuracy is 100%. Another botnet for IoT DDoS assaults is Gafgyt. ‘Gafgyt Combo’ attacks use TCP and UDP floods. The model correctly identified and categorized this assault pattern with 100% accuracy. ‘Gafgyt Junk’ attack categorization accuracy is 100%. ‘Gafgyt Scan’ assault categorization accuracy is 98%. The Gafgyt botnet uses a “Gafgyt Scan” attack to exploit susceptible IoT devices. The model properly identified 98% of ‘Gafgyt Scan’ assaults. ‘Gafgyt TCP’ attack categorization accuracy is 100%. The ‘Gafgyt TCP’ attack overwhelms the target device with TCP packets to disable its services. The model successfully identified 100% of this assault type, proving its ability to recognize and categorize it. ‘Gafgyt UDP’ attack categorization accuracy is 98%.
Fig. 4 shows IoT-23 confusion matrix findings from several models. The confusion matrix shows classification results across classes to evaluate each model’s performance. The model outperforms in classifying the attack with 99% and other file types with 99% to 100% accuracy. Subfigure (a) examines the attention-based CNN/LSTM model. This model uses dynamic attention processes to classify features. The confusion matrix shows the distribution of property and erroneously identified examples across classes for this model. Subfigure (b) shows CNN and LSTM outcomes without attention. The attention-based model preferentially processes important features, whereas this variation does not. The confusion matrix assesses the model’s classification accuracy and identifies potential biases. Subfigure (c) shows the attention-LSTM model findings. Attention mechanisms and LSTM networks capture temporal relationships and highlight important characteristics in this paradigm. The confusion matrix shows the model's classification performance and class prediction dispersion. Finally, Subfigure (d) shows the CNN model with attention confusion matrix. This model uses CNNs and an attention techniques to extract spatial data and highlight important areas during categorization. The confusion matrix evaluates the model's class separation and misclassification abilities.
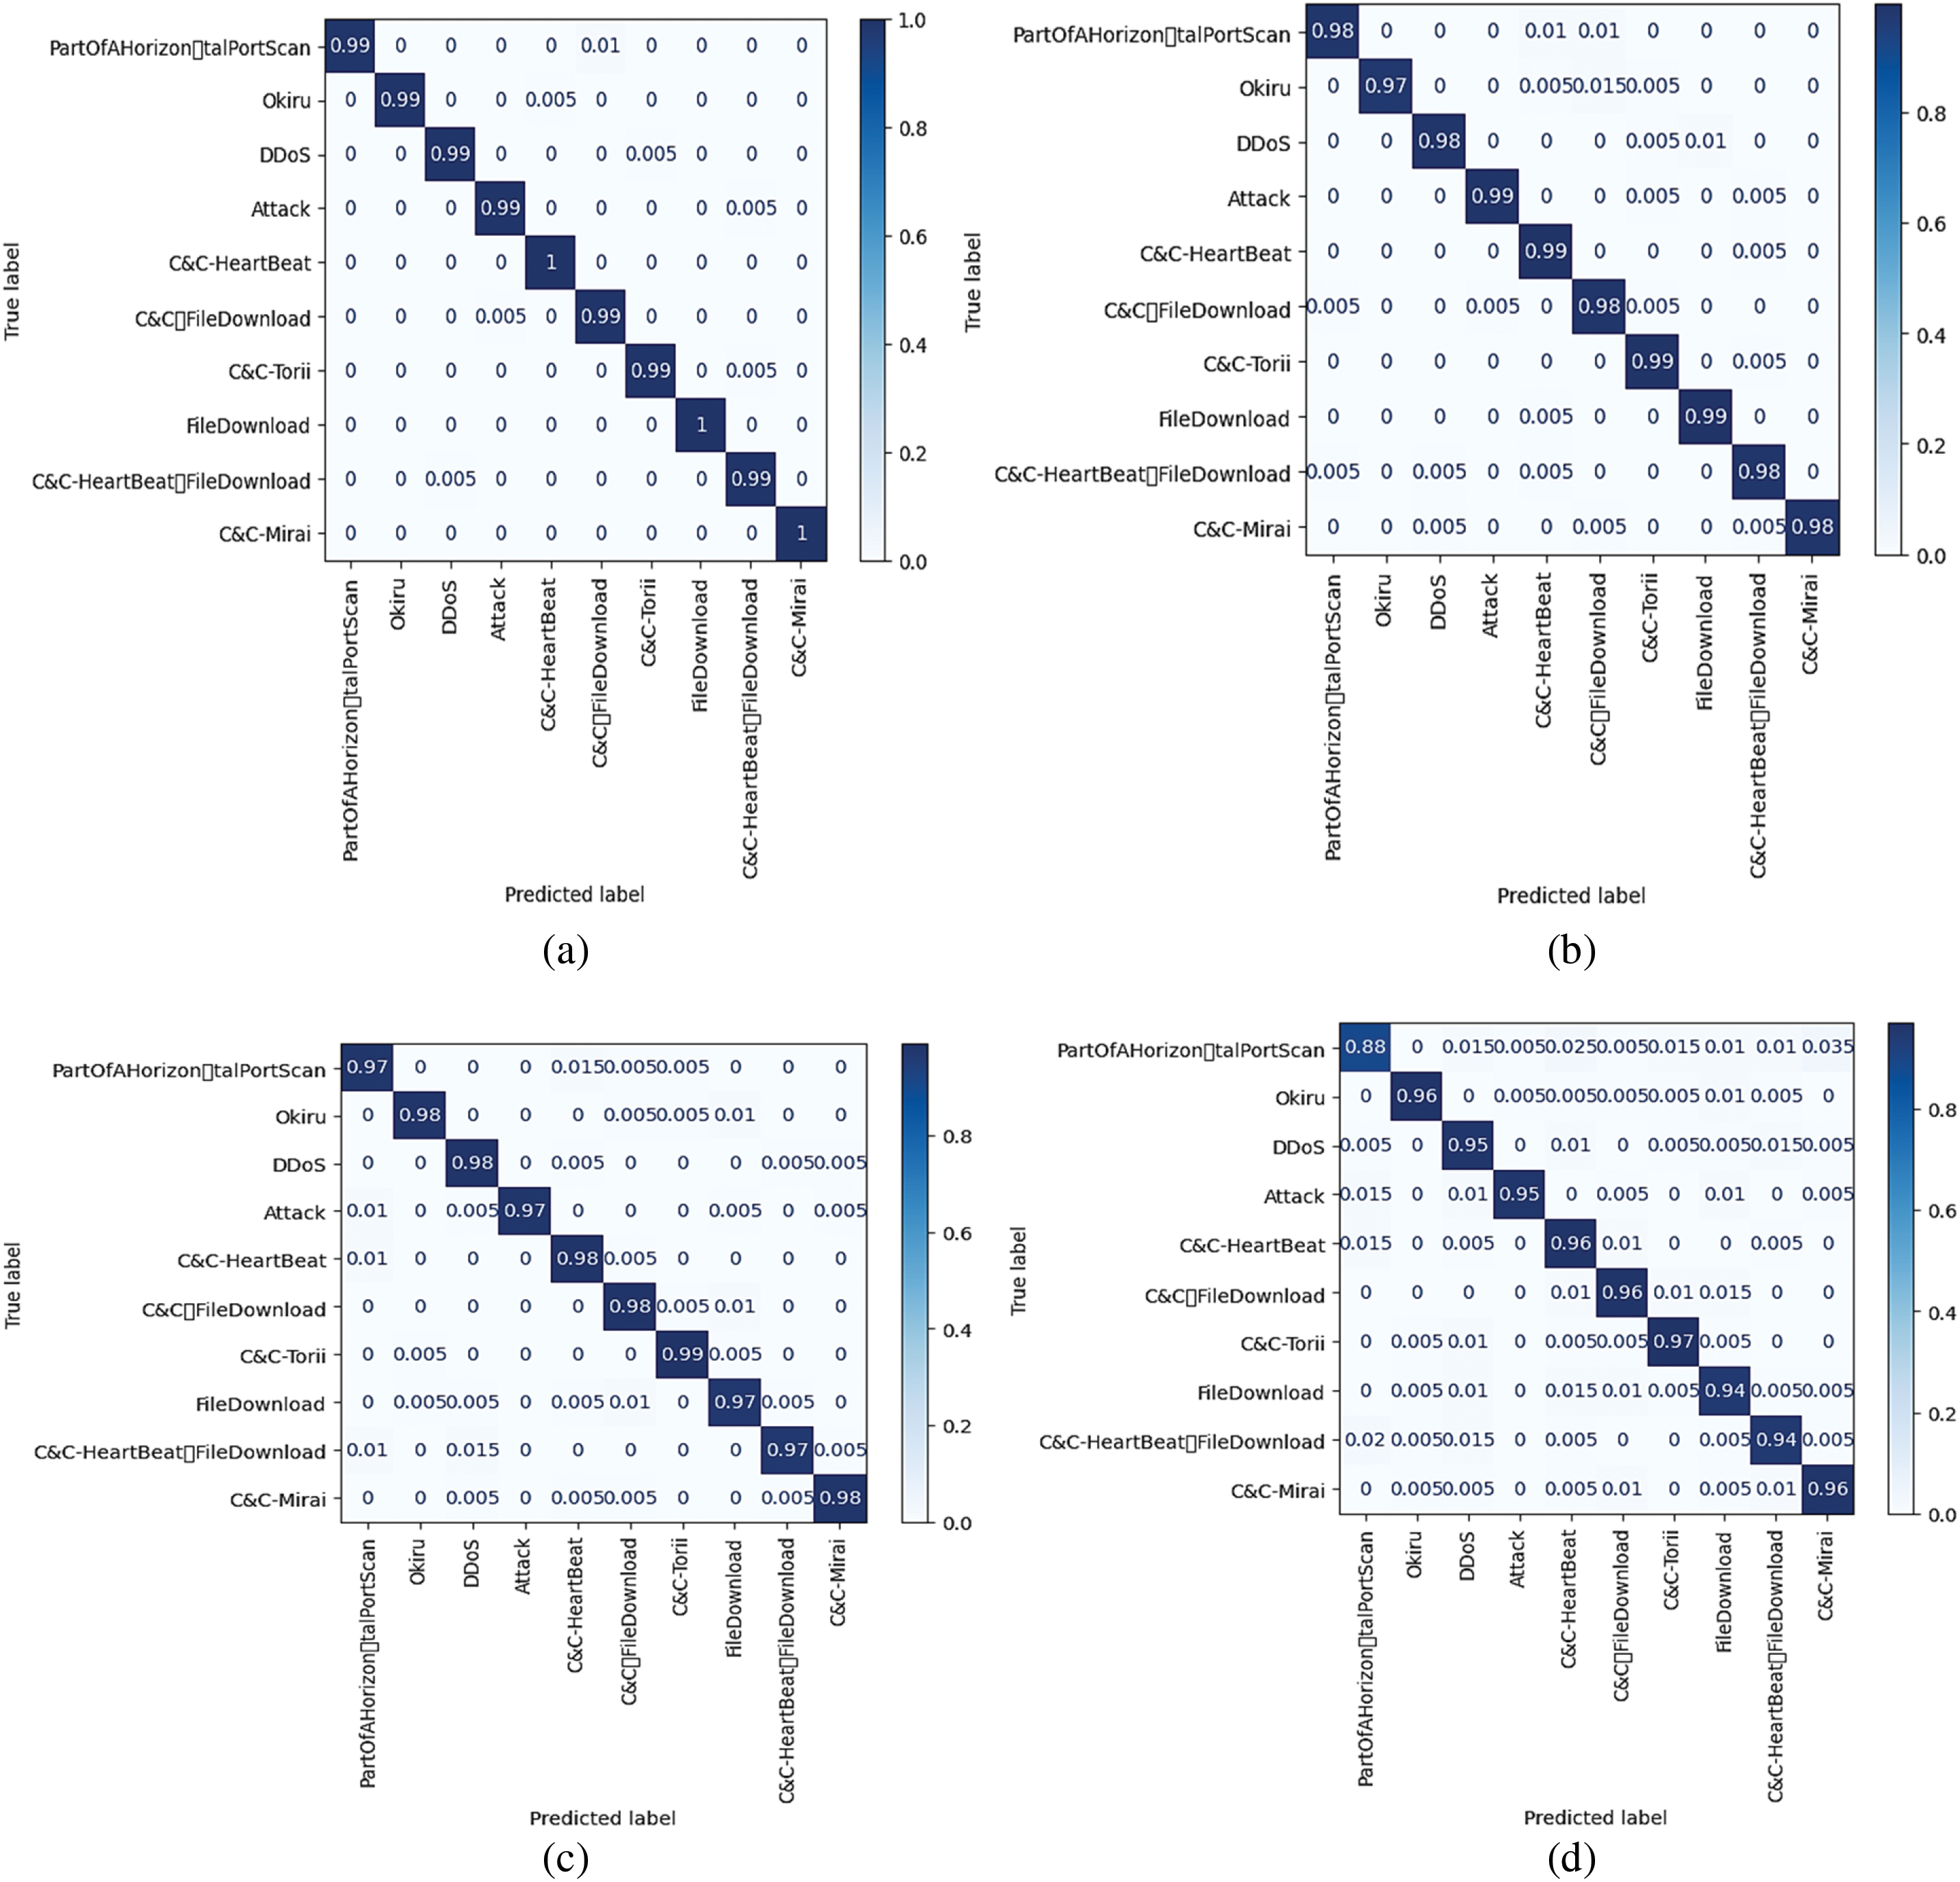
Figure 4: The confusion matrix on IoT-23 dataset (a) Attention-based CNN and LSTM (b) CNN and LSTM without attention (c) LSTM with attention (d) CNN with attention
Table 2 shows the accuracy, precision, F1-score, and recall on both datasets. The overall accuracy of the dataset N-BaIoT is 99%, precision is 0.99, Recall is 0.99 and F1-score is 0.99. The accuracy on the dataset IoT-23 is 99%, precision is 0.99, Recall is 0.98 and F1-score is 0.98. Fig. 5 shows the accuracy graph from N-BaIoT dataset-trained models. The graph compares architectural and configuration accuracy percentages. Subfigure (a) shows a 99%-accurate attention-based CNN and LSTM model. The attention method helps the model focus on essential characteristics and capture interesting dataset patterns. In Subfigure (b), an unattended CNN and LSTM model obtained 98% accuracy.

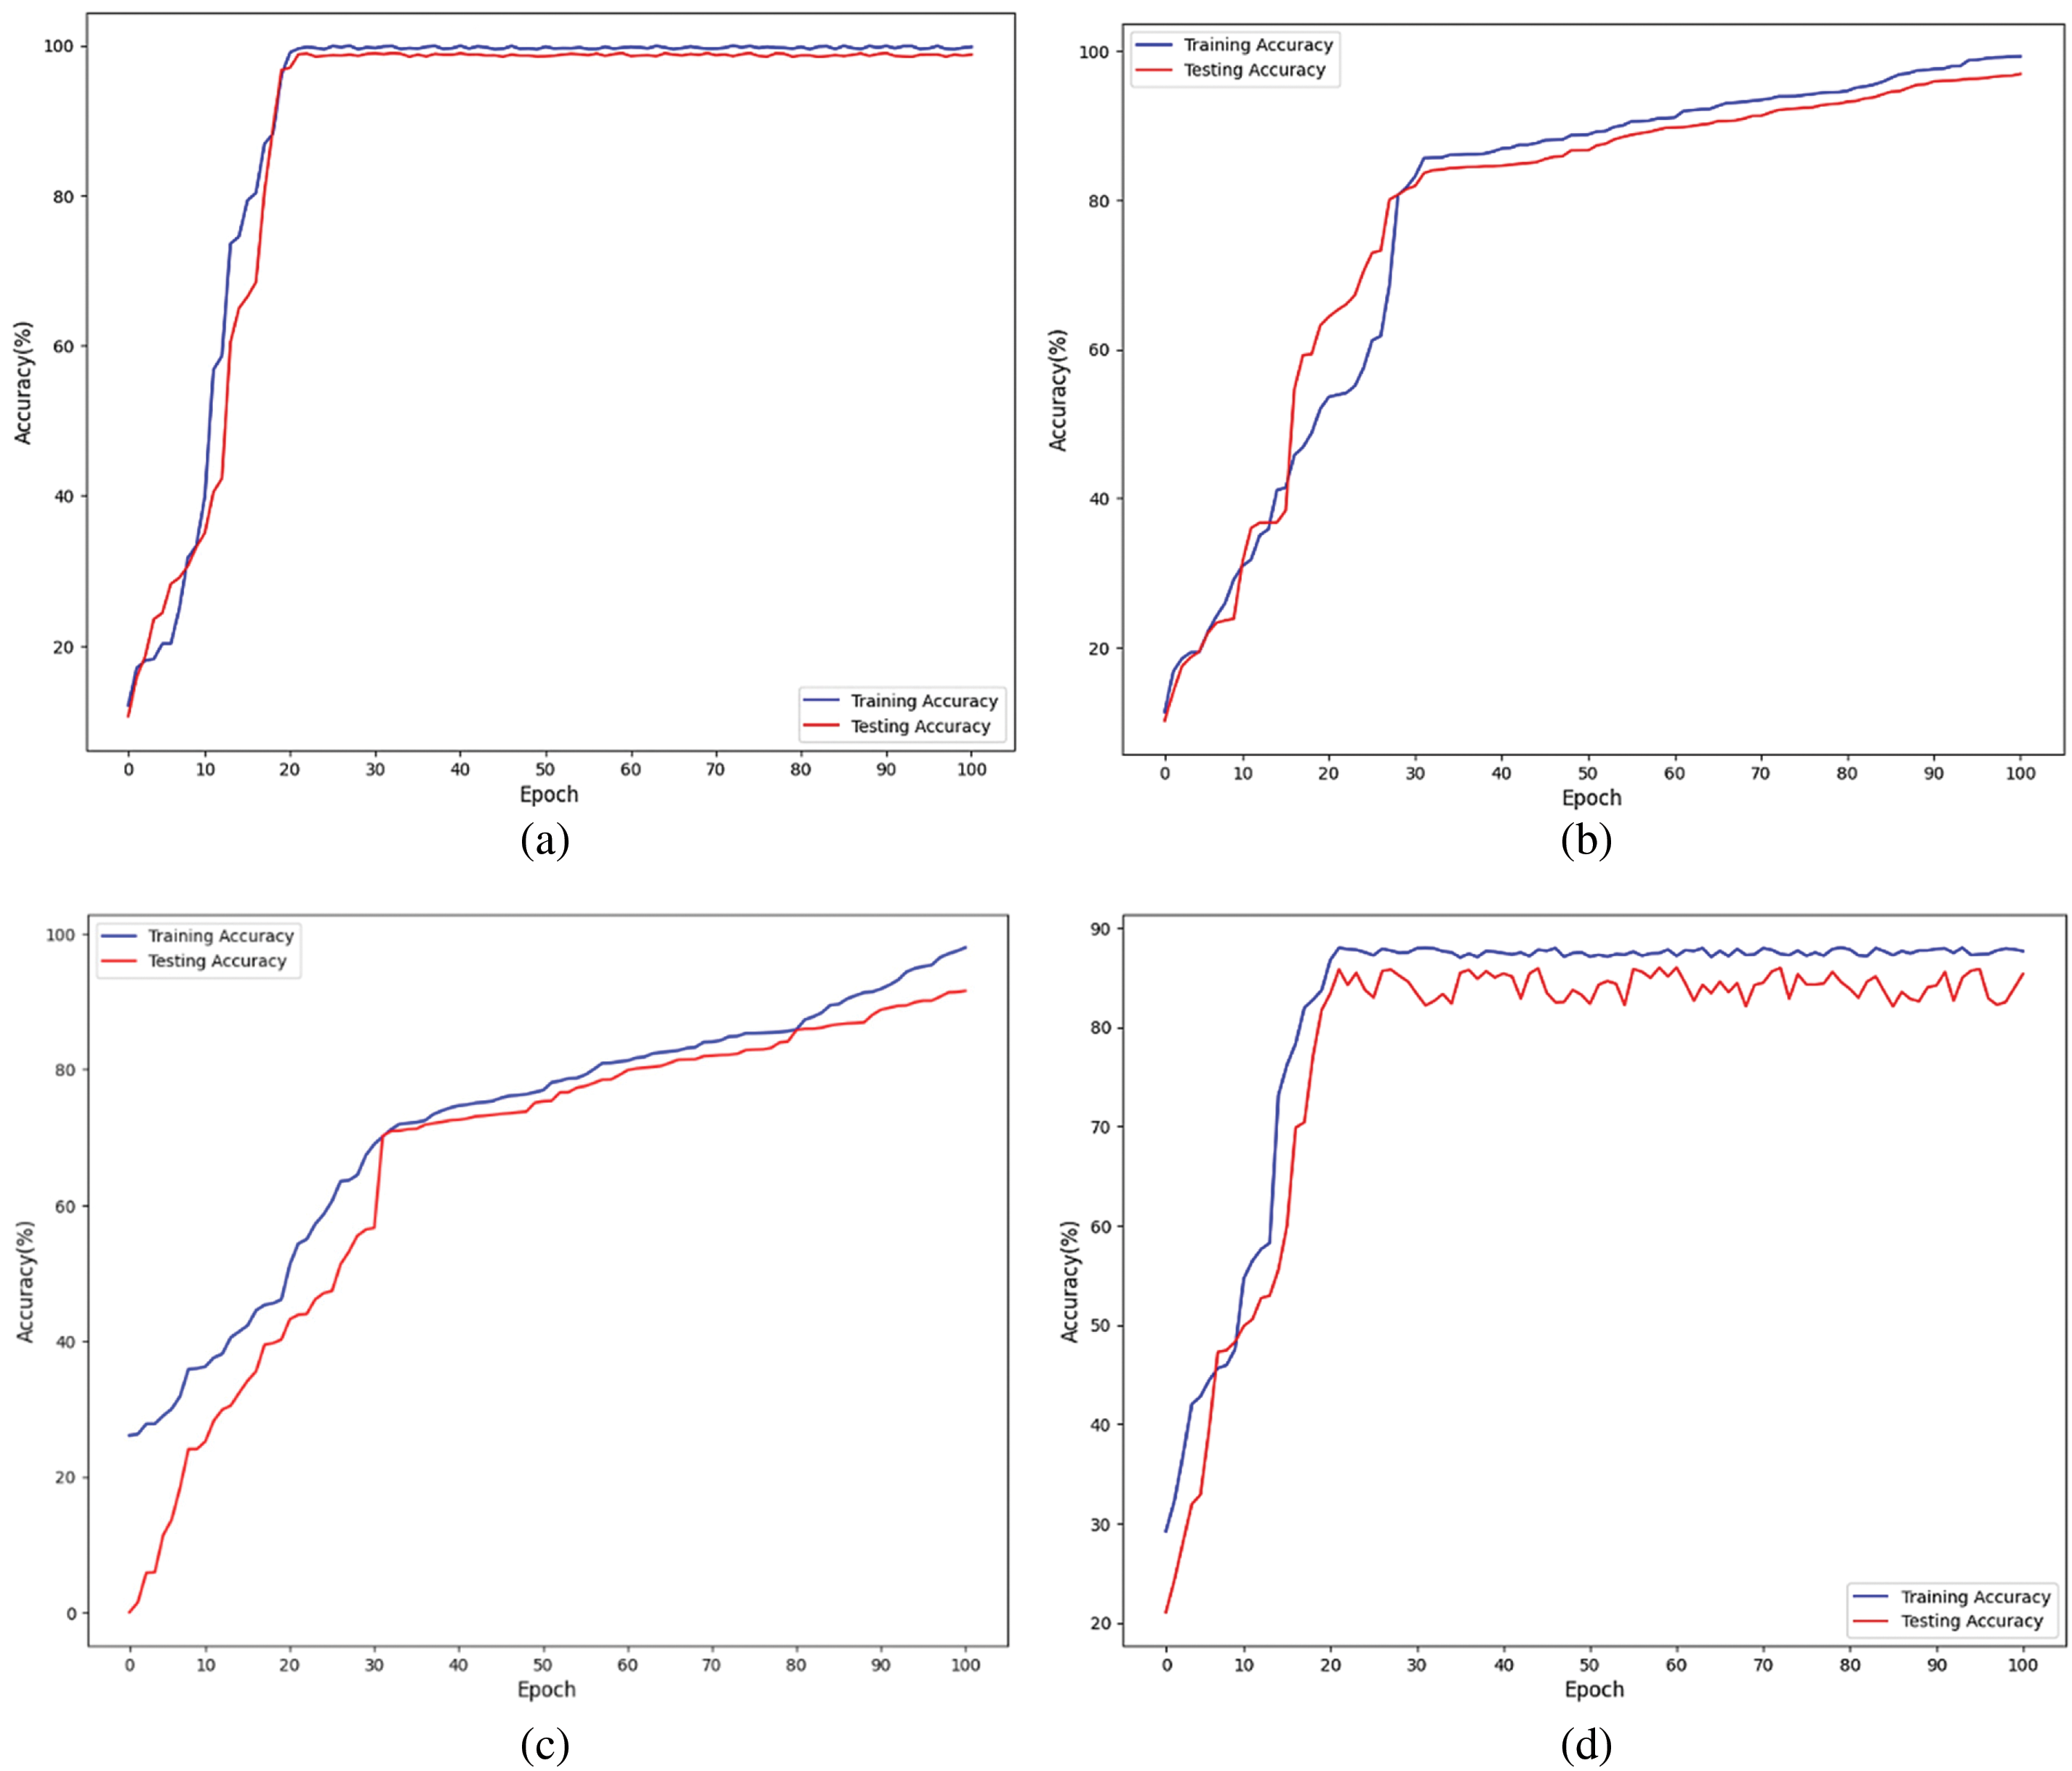
Figure 5: The accuracy graph on N-BaIoT dataset (a) Attention-based CNN and LSTM (b) CNN and LSTM without attention (c) LSTM with attention (d) CNN with attention
CNN and LSTM layers extracted significant information and achieved good prediction accuracy without the attention mechanism. Subfigure (c) shows a 95%-accurate LSTM model with attention. The LSTM architecture’s attention mechanism enabled the model to selectively pay to significant temporal information, improving accuracy compared to the CNN with attention model. Finally, Subfigure (d) shows an 88%-accurate CNN model with attention. The CNN architecture’s attention mechanism helped the model focus on prominent spatial elements, although it was less successful than other models in this investigation.
Fig. 6 shows the N-BaIoT loss graph for anomaly detection algorithms. The graph shows each model configuration’s loss values, revealing how well they detect dataset abnormalities. Subfigure (a) shows the Attention-based CNN and LSTM model’s 0.2 loss value. This anomaly detection model uses CNN and LSTM networks with attention algorithms. Subfigure (b) shows the CNN and LSTM model’s loss values without attention, 0.3. This model uses CNN and LSTM networks for anomaly detection but lacks attention methods to focus on key features, perhaps resulting in a larger loss than the attention-based model. The attention-LSTM model has a loss value of −2.0 in subfigure (c). An LSTM network with attention mechanisms captures temporal relationships and detects abnormalities. This model detects abnormalities well due to its negative loss value. Finally, subfigure (d) shows the CNN model with attention’s 2.6 loss value. With attention techniques to improve anomaly detection, this model uses CNN networks alone. The positive loss value shows this model may not capture anomalies as effectively as LSTM-based models.

Figure 6: The loss graph on the N-BaIoT dataset (a) Attention-based CNN and LSTM (b) CNN and LSTM without attention (c) LSTM with attention (d) CNN with attention
Fig. 7 showcases the ROC-AUC graphs for two distinct datasets: (a) the N-BaIoT dataset and (b) the IoT-23 dataset. The graphs depict the performance evaluation of an Attention-based CNN and LSTM model applied to these datasets. The ROC-AUC curve is a widely used evaluation metric for binary classification tasks. It shows the compromise between categorization criteria in terms of sensitivity (how often a test is correct) and specificity (1 minus sensitivity). Better model efficacy in differentiating between positive and negative examples is indicated by a higher ROC-AUC value. In both subplots, the Attention-based CNN and LSTM model exhibits exceptional accuracy, ranging from 99% to 100%. This remarkable accuracy suggests that the model achieves highly precise predictions on both the N-BaIoT and IoT-23 datasets.
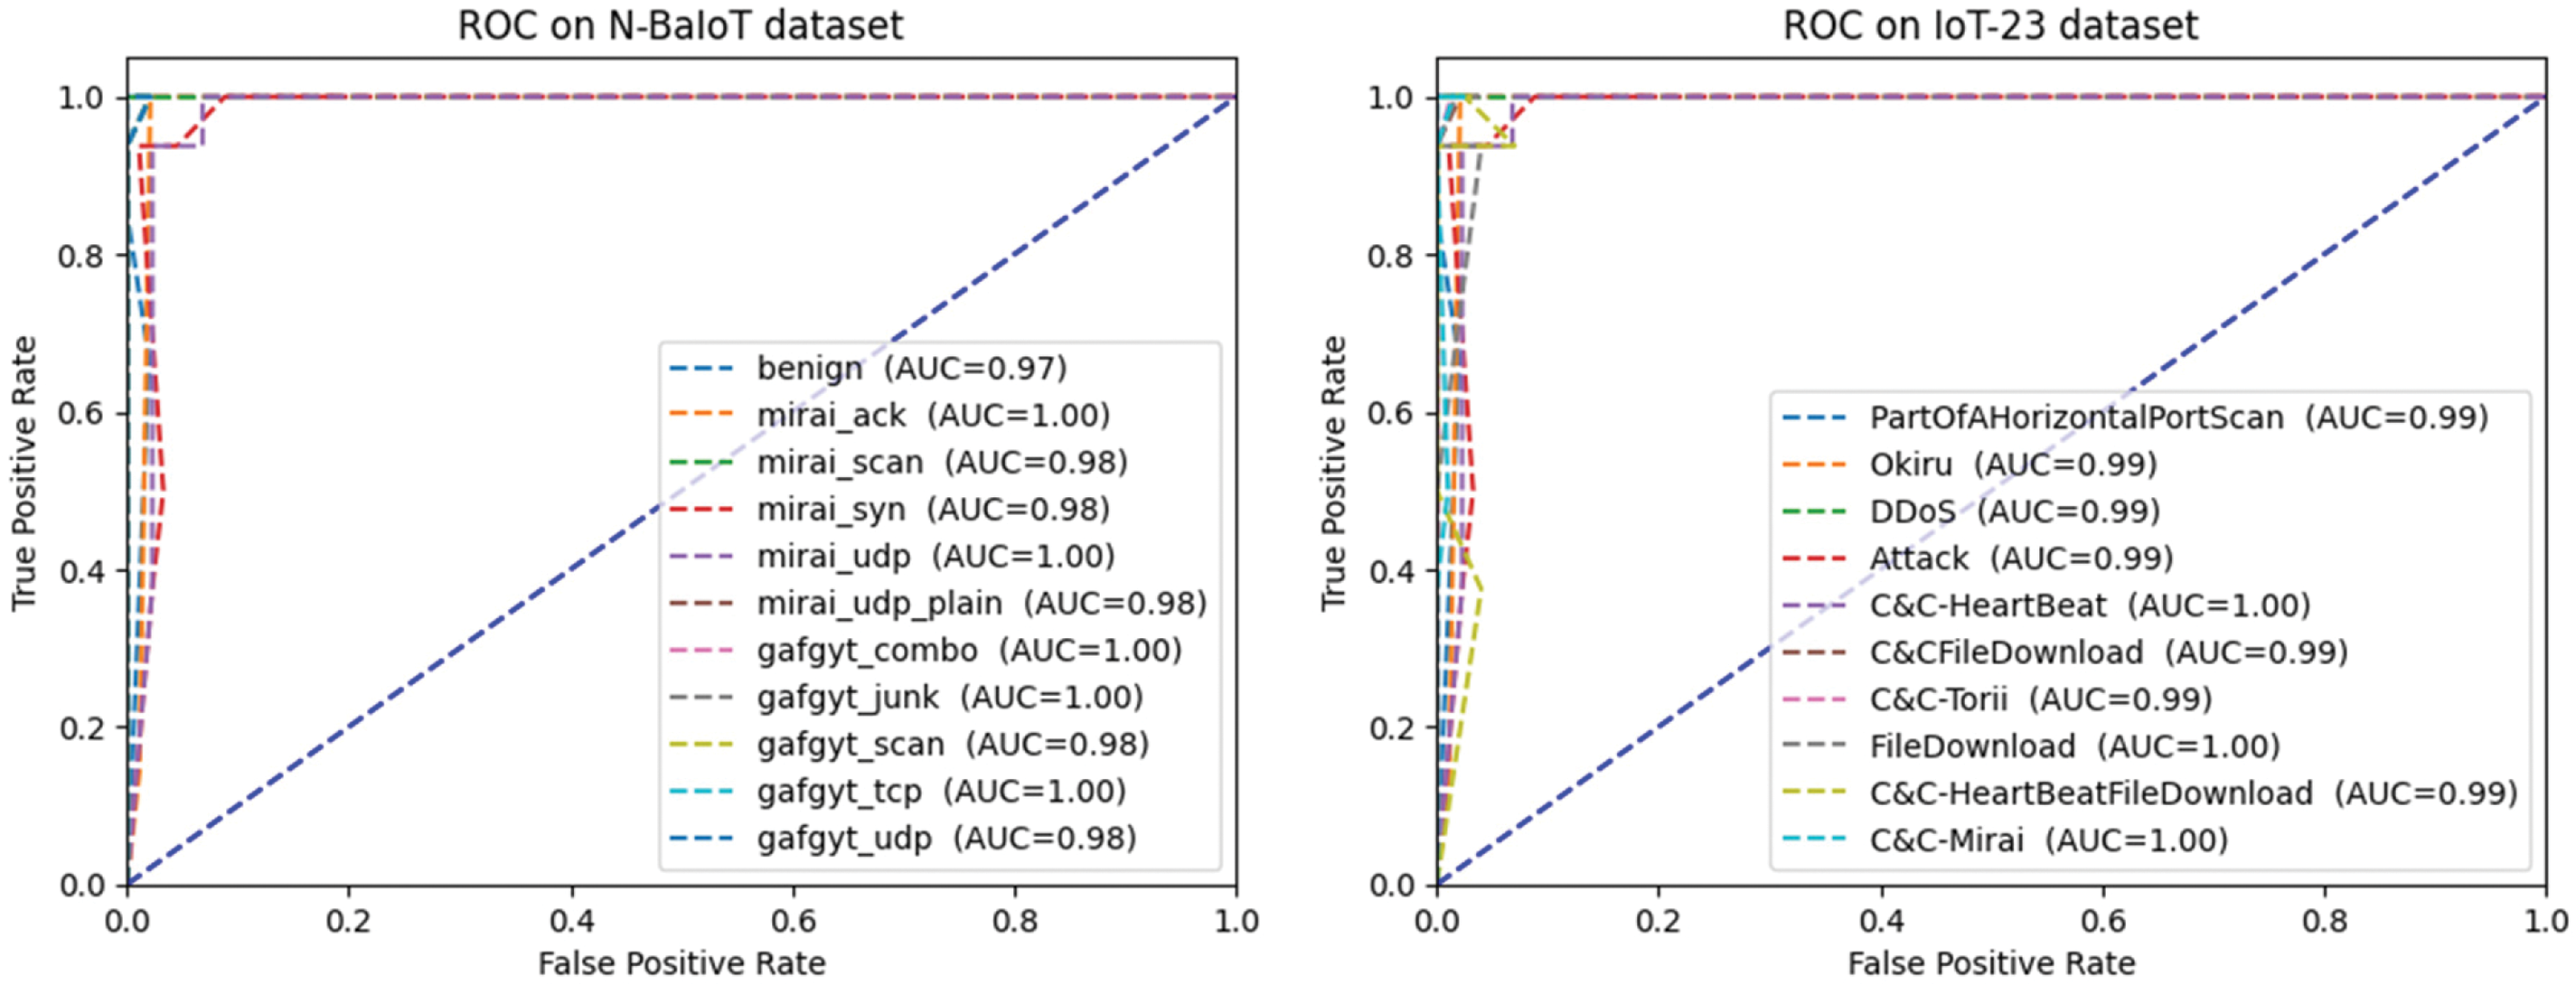
Figure 7: The ROC-AUC graph on (a) the N-BaIoT dataset (b) the IoT-23 dataset using Attention-based CNN and LSTM model
In conclusion, this study presents a system for identifying anomalies, ACNN-LSTM, which is specifically designed for use in the IoT. Throughout the paper, the critical topic of security threats in IoT systems is discussed, as well as the challenges associated with detecting aberrant behavior and compromised nodes within these systems. By developing an efficient and reliable framework for anomaly detection, this study enhances the security and reliability of IoT-based systems for decision-making. The ACNN-LSTM model combines CNN units with an LSTM-based attention mechanism, leveraging the advantages of both architectures. The CNN units with the attention mechanism address memory loss and gradient dispersion issues, ensuring robust performance in capturing relevant characteristics of IoT data. The LSTM unit, known for its effectiveness in time series prediction, is also integrated into the model, preserving its benefits. To check out the proposed structure, two real-world IoT datasets, namely N-BaIoT and IoT-23, were used for experimentation. The results demonstrate remarkable performance, with the N-BaIoT dataset achieving an impressive overall accuracy of 99% and precision, recall, and F1-score reaching 0.99. Similarly, the IoT-23 dataset exhibits a commendable accuracy of 99%, with precision and recall at 0.99 and 0.98, respectively. Comparing the experimental findings with state-of-the-art IoT-based anomaly detection methods, the proposed ACNN-LSTM framework proves its effectiveness in improving the accuracy of detecting malicious data in IoT systems. The high accuracy, precision, recall, and F1 scores obtained from the experiments underscore the robustness and reliability of the proposed model. The proposed ACNN-LSTM model has shown promising results in detecting anomalies in IoT data. However, further investigation can be done to explore its scalability to larger and more complex IoT systems. This could involve experimenting with larger datasets or real-world deployments to evaluate the model’s performance under different scales and network conditions. Transfer learning can be a valuable approach in anomaly detection, especially when labeled anomaly data is limited. Future research can explore the potential of leveraging pre-trained models on related tasks or datasets to boost the efficiency of the ACNN-LSTM model. IoT data anomalies can be detected by fine-tuning the model using transfer learning techniques.
Acknowledgement: The authors would like to acknowledge Prince Sattam Bin Abdulaziz University for their valuable support. Further, the authors would like to acknowledge Prince Sattam Bin Abdulaziz University for paying the Article Processing Charges (APC) of this publication.
Funding Statement: This study is supported via funding from Prince Sattam Bin Abdulaziz University Project Number (PSAU/2023/R/1444).
Author Contributions: The authors confirm contribution to the paper as follows: study conception and design: M.K., S.M.; data collection: M.K. and S.M.; analysis and interpretation of results: M.K. and S.M.; draft manuscript preparation: M.K. and S.M. All authors reviewed the results and approved the final version of the manuscript.
Availability of Data and Materials: The data is on website https://www.stratosphereips.org/datasets-iot23.
Conflicts of Interest: The authors declare that they have no conflicts of interest to report regarding the present study.
References
1. I. Makhdoom, M. Abolhasan, J. Lipman, R. P. Liu and W. Ni, “Anatomy of threats to the Internet of Things,” IEEE Communications Surveys & Tutorials, vol. 21, no. 2, pp. 1636–1675, 2018. [Google Scholar]
2. I. Cvitić, D. Peraković, M. Periša and M. Botica, “Novel approach for detection of IoT generated DDoS traffic,” Wireless Network, vol. 27, no. 3, pp. 1573–1586, 2021. [Google Scholar]
3. Y. Q. Chen, B. Zhou, M. Zhang and C. M. Chen, “Using IoT technology for computer-integrated manufacturing systems in the semiconductor industry,” Applied Soft Computing, vol. 89, no. 1, pp. 1–16, 2020. [Google Scholar]
4. Y. Tan, W. Yang, K. Yoshida and S. Takakuwa, “Application of IoT-aided simulation to manufacturing systems in cyber-physical system,” Machines, vol. 7, no. 1, pp. 1–10, 2019. [Google Scholar]
5. O. A. Wahab, “Intrusion detection in the IoT under data and concept drifts: Online deep learning approach,” IEEE Internet Things Journal, vol. 9, no. 20, pp. 19706–19716, 2022. [Google Scholar]
6. J. Giraldo, D. Urbina, A. Cardenas, J. Valente, M. Faisal et al., “A survey of physics-based attack detection in cyber-physical systems,” ACM Computer Survey, vol. 51, no. 4, pp. 1–36, 2018. [Google Scholar]
7. J. E. Rubio, C. Alcaraz and J. Lopez, “Preventing advanced persistent threats in complex control networks,” in Proc. of ESRICS, Oslo, Norway, pp. 402–418, 2017. [Google Scholar]
8. O. A. Wahab, J. Bentahar, H. Otrok and A. Mourad, “How to distribute the detection load among virtual machines to maximize the detection of distributed attacks in the cloud,” in Proc. of IEEE SCC, San Francisco, CA, USA, pp. 316–323, 2016. [Google Scholar]
9. A. R. Sadeghi, C. Wachsmann and M. Waidner, “Security and privacy challenges in industrial internet of things,” in Proc. of ACM/EDAC/IEEE DAC, San Francisco, California, USA, pp. 1–6, 2015. [Google Scholar]
10. F. K. Sufi, M. Alsulami and A. Gutub, “Automating global threat-maps generation via advancements of news sensors and AI,” Arabian Journal for Science and Engineering, vol. 48, no. 2, pp. 2455–2472, 2023. [Google Scholar]
11. H. Samkari and A. Gutub, “Protecting medical records against cybercrimes within Hajj period by 3-layer security,” Recent Trends in Information Technology and its Application, vol. 2, no. 3, pp. 1–21, 2019. [Google Scholar]
12. M. A. Al-Garadi, A. Mohamed, A. K. Al-Ali, X. Du, I. Ali et al., “A survey of machine and deep learning methods for Internet of Things (IoT) security,” IEEE Communications Surveys & Tutorials, vol. 22, no. 3, pp. 1646–1685, 2020. [Google Scholar]
13. L. Weiming, “Integrating data mining with internet of things to build the music project management system,” Journal of Ambient Intelligence and Humanized Computing, vol. 1, no. 1, pp. 1–13, 2020. [Google Scholar]
14. N. Moustafa, B. Turnbull and K. R. Choo, “An ensemble intrusion detection technique based on proposed statistical flow features for protecting network traffic of Internet of Things,” IEEE Internet Things Journal, vol. 6, no. 3, pp. 4815–4830, 2018. [Google Scholar]
15. S. Rathore and J. H. Park, “Semi-supervised learning based distributed attack detection framework for IoT,” Applied Soft Computing, vol. 72, no. 1, pp. 79–89, 2018. [Google Scholar]
16. P. Kumar, G. P. Gupta and R. Tripathi, “Design of anomaly based intrusion detection system using fog computing for iot network,” Automatic Control and Computer Sciences, vol. 55, no. 2, pp. 137–147, 2021. [Google Scholar]
17. V. Ponnusamy, M. Humayun, N. Z. Jhanjhi, A. Yichiet and M. F. Almufareh, “Intrusion detection systems in Internet of Things and mobile ad-hoc networks,” Computer System Scientific Engineering, vol. 40, no. 3, pp. 1199–1215, 2022. [Google Scholar]
18. S. Bhattacharya, P. K. Maddikunta, R. Kaluri, S. Singh, T. R. Gadekallu et al., “A novel PCA-firefly based XGBoost classification model for intrusion detection in networks using GPU,” Electronics, vol. 9, no. 2, pp. 219–250, 2020. [Google Scholar]
19. S. Zargari and D. Voorhis, “Feature selection in the corrected kdd-dataset,” in Proc. of EIDWT, Bucharest, Romania, pp. 174–180, 2012. [Google Scholar]
20. A. R. Javed, M. Usman, S. U. Rehman, M. U. Khan and M. S. Haghighi, “Anomaly detection in automated vehicles using multistage attention-based convolutional neural network,” IEEE Transactions on Intelligent Transportation Systems, vol. 22, no. 7, pp. 4291–4300, 2021. [Google Scholar]
21. K. Balan, A. S. Khan, A. A. Julaihi, S. Tarmizi, K. S. Pillay et al., “RSSI and public key infrastructure based secure communication in autonomous vehicular networks,” International Journal of Advance Computer Science Application, vol. 9, no. 1, pp. 298–304, 2018. [Google Scholar]
22. G. Thamilarasu and S. Chawla, “Towards deep learning-driven intrusion detection for the Internet of Things,” Sensors, vol. 19, no. 9, pp. 1–19, 2019. [Google Scholar]
23. F. Y. Yavuz, D. Ünal and E. Gül, “Deep learning for detection of routing attacks in the Internet of Things,” International Journal of Computational Intelligence Systems, vol. 12, no. 1, pp. 39–58, 2018. [Google Scholar]
24. F. Hussain, R. Hussain, S. A. Hassan and E. Hossain, “Machine learning in IoT security: Current solutions and future challenges,” IEEE Communications Surveys & Tutorials, vol. 22, no. 3, pp. 1686–1721, 2019. [Google Scholar]
25. E. Anthi, L. Williams and P. Burnap, “Pulse: An adaptive intrusion detection for the Internet of Things,” in Proc. of Living in the Internet of Things: Cybersecurity of the IoT–2018, London, UK, pp. 1–4, 2018. [Google Scholar]
26. M. Pahl and F. Aubet, “All eyes on you: Distributed multi-dimensional IoT microservice anomaly detection,” in Proc. of CNSM, Rome, Italy, pp. 72–80, 2018. [Google Scholar]
27. A. A. Diro and N. K. Chilamkurti, “Distributed attack detection scheme using deep learning approach for Internet of Things,” Future Generation Computer Systems, vol. 82, no. 1, pp. 761–768, 2018. [Google Scholar]
28. C. D. McDermott, F. Majdani and A. V. Petrovski, “Botnet detection in the Internet of Things using deep learning approaches,” in Proc. of IJCNN, Rio de Janeiro, Brazil, pp. 8–13, 2018. [Google Scholar]
29. A. Al-Haija and Q. Zein-Sabatto, “An efficient deep-learning-based detection and classification system for cber-attacks in IoT communication networks,” Electronics, vol. 1, no. 1, pp. 21–52, 2020. [Google Scholar]
30. M. Ge, X. Fu, N. Syed, Z. Baig and G. Teo, “A deep learning-based intrusion detection for IoT networks,” in Proc. of PRDC, Piscataway, NJ, USA, pp. 256–260, 2019. [Google Scholar]
31. N. Koroniotis and N. Moustafa, “The Bot-IoT dataset Sydney,” Australia. [Online]. Available: https://research.unsw.edu.au/projects/bot-iot-dataset (accessed on 09/08/2023) [Google Scholar]
32. W. Huang and J. W. Stokes, “MtNet: A multi-task neural network for dynamic malware classification,” in Proc. of ICDIMVA, San Sebastián, Spain, pp. 399–418, 2016. [Google Scholar]
33. B. Kolosnjaji, A. Zarras, G. Webster and C. Eckert, “Deep learning for classification of malware system call sequences,” in Proc. of AJCAI, Hobart, TAS, Australia, pp. 137–149, 2016. [Google Scholar]
34. I. Ullah and Q. H. Mahmoud, “Design and development of RNN anomaly detection model for IoT networks,” IEEE Access, vol. 10, no. 1, pp. 62722–62750, 2022. [Google Scholar]
35. X. Zhou, Y. Hu, J. Wu, W. Liang, J. Ma et al., “Distribution bias aware collaborative generative adversarial network for imbalanced deep learning in industrial IoT,” IEEE Transactions on Industrial Informatics, vol. 19, no. 1, pp. 570–580, 2022. [Google Scholar]
36. I. Goodfellow, J. Pouget-Abadie, M. Mirza, B. Xu, D. Warde-Farley et al., “Generative adversarial networks Communication,” Communications of the ACM, vol. 63, no. 11, pp. 139–144, 2020. [Google Scholar]
37. R. Kale, Z. Lu, K. W. Fok and V. L. Thing, “A hybrid deep learning anomaly detection framework for intrusion detection,” in Proc. of HPSC, Jinan, China, pp. 137–142, 2022. [Google Scholar]
38. C. Annadurai, I. Nelson, K. N. Devi, R. Manikandan, N. Z. Jhanjhi et al., “Biometric authentication-based intrusion detection using artificial intelligence internet of things in smart city,” Energies, vol. 15, no. 19, pp. 74–90, 2022. [Google Scholar]
39. J. Leng, W. Sha, Z. Lin, J. Jing, Q. Liu et al., “Blockchained smart contract pyramid-driven multi-agent autonomous process control for resilient individualised manufacturing towards Industry 5. 0,” International Journal of Production Research, vol. 1, no. 1, pp. 1–20, 2022. [Google Scholar]
40. J. Leng, X. Zhu, Z. Huang, K. Xu, Z. Liu et al., “ManuChain II: Blockchained smart contract system as the digital twin of decentralized autonomous manufacturing toward resilience in Industry 5.0,” IEEE Transactions on Systems, Man, and Cybernetics: Systems, vol. 1, no. 1, pp. 1–20, 2023. [Google Scholar]
41. A. Singh, A. Gutub, A. Nayyar and K. Muhammad, “Redefining food safety traceability system through blockchain: Findings, challenges and open issues,” Multimedia Tools and Applications, vol. 82, no. 14, pp. 21243–21277, 2023. [Google Scholar] [PubMed]
42. N. Farooqi, A. Gutub and O. K. Mohamed, “Smart community challenges: Enabling IoT/M2M technology case study,” Life Science Journal, vol. 16, no. 7, pp. 11–17, 2019. [Google Scholar]
43. Y. Meidan, M. Bohadana, Y. Mathov, Y. Mirsky, A. Shabtai et al., “N-BaIoT—Network-based detection of IoT botnet attacks using deep autoencoders,” IEEE Pervasive Computing, vol. 17, no. 3, pp. 2–12, 2018. [Google Scholar]
Cite This Article
 Copyright © 2023 The Author(s). Published by Tech Science Press.
This work is licensed under a Creative Commons Attribution 4.0 International License , which permits unrestricted use, distribution, and reproduction in any medium, provided the original work is properly cited.
 Downloads
 Citation Tools