
 Submit a Paper
 Propose a Special lssue
 Open Access
ARTICLE

Efficient Crack Severity Level Classification Using Bilayer Detection for Building Structures
1 Department of Electronics and Communication Engineering, Central Polytechnic College, Chennai, 600113, India
2 Department of Electronics and Communication Engineering, Sri Sivasubramaniya Nadar College of Engineering, Chennai, 603110, India
* Corresponding Author: M. J. Anitha. Email:
Computer Systems Science and Engineering 2023, 46(1), 1183-1200. https://doi.org/10.32604/csse.2023.031888
Received 29 April 2022; Accepted 27 July 2022; Issue published 20 January 2023
 View Full Text
 Download PDF
Abstract
Detection of cracks at the early stage is considered as very constructive since precautionary steps need to be taken to avoid the damage to the civil structures. Moreover, identifying and classifying the severity level of cracks is inevitable in order to find the stability of buildings. Hence, this paper proposes an efficient strategy to classify the cracks into fine, medium, and thick using a novel bilayer crack detection algorithm. The bilayer crack detection algorithm helps in extracting the requisite features from the crack for efficient classification. The proposed algorithm works well in the dark background and connects the discontinued cracks too. The first layer is used to detect cracks under texture variations and manufacturing defects, through segmented adaptive thresholding and morphological operations. The residual noise present in the output of the first layer is removed in the second layer of crack detection. The second layer includes the double scan and the noise reduction algorithms and is used to join the missed crack parts. As a result, a segmented crack is formed. Further classification is done using an ensemble classifier with bagging, and decision tree techniques by extracting the geometrical features and the weaker crack criterion from the segmented part. The results of the proposed technique are compared with the existing techniques for different datasets and have obtained a rise in True Positive Rate (TPR), accuracy and precision value. The proposed technique is also implemented in Raspberry Pi for further real-time evaluation.Keywords
A crack is a complete or partial separation of the concrete into two or more parts produced by breaking or fracturing. The cracks disturb the appearance and elegance of structure which also affect the structure’s safety and even decrease the durability of the structure [1]. The various reasons for development of cracks are elastic deformation, thermal movement, chemical reaction and shrinkage etc. [2]. Even for visible cracks, its width determination is much difficult, which in turn determines its severity. According to the European Union Code EN 1992-1-1:2004 (E) and the American Concrete Institute ACI 224R-01-Control of cracking in civil structures, the maximum acceptable crack width is 0.4 mm. A crack with a width of more than 0.4 mm should be addressed as soon as possible.
Inspecting the damages of ancient buildings and bridges are mostly impossible for the human beings, because of its elevation and age of those structures. It is crucial to monitor them to prevent them from damages with minimal or without human employment [3]. Some of the non-destructive testing methods of crack detection are manual inspection methods, electromagnetic methods and image processing techniques [4]. The problems of manual inspection methods are their dependency of detection accuracy on specialist’s knowledge, lack of experience and objectivity in the quantitative analysis, crack misidentification, slow detection and data management inefficiency [5]. These drawbacks could be eliminated by automating all manual practices. Also classifying the severity level of cracks is essential for in-depth analysis and prediction.
Recently, several image-based crack detection techniques have been developed. High pass filter’s threshold [6] derived from histogram peak and particle filter [7] with fixed threshold has been introduced to detect defects. The value of threshold has to be fixed manually which is not same for all types of images. Hence, it is necessary to develop an algorithm with adaptive threshold value.
Dijikstra and graphical search method [5], linear percolation method with morphological operations and distance transform [8], shape descriptor-based crack detection algorithm [9], adaptive nonlinear grayscale transformation with OTSU thresholding [10], enhanced binarization and shape analysis technique [11], segmentation using fuzzy C means clustering [12] , crack width transform technique [13] using width map and propagation of crack path, Graphical User Interference (GUI) [14] to calculate length and width of cracks using Matlab, Digital Image Correlation (DIC) [15], are used to detect finer cracks and reliable crack locations. GRS (Geodesic Shadow Removal) algorithm and Gaussian filter [16] are used to detect cracks and anomalies present in civil structures. But, these algorithms failed to connect crack segments when the pixels between them are missing.
Segmentation algorithm based on weighted neighborhood pixels with Gaussian cumulative density function as adaptive threshold [17], crack detection algorithm using the parabolic property on the first derivative of pixel values with SVM (Single Vector Machine) [18] and wavelet transform with Finite Element model [19] are used for identification of defects. The efficiency of these crack detection techniques depend on the quality of the input image and the lighting conditions and the complex backgrounds. Chun et al. [20] developed a crack detection technique calculate 37 features for Gaussian filters and 21 features for median filters and 15 features for Canny filters. Due to the calculation of so many features, the computation time is high.
The various types of feature extraction approaches are summarized here. Bu et al. [21] proposed a two-stage technique with wavelet features, which are used as input to the SVM classifier and gained 92% average accuracy. Li et al. [22], used crack boundary as input to the Naive Bayes Fusion algorithm and achieved a reduction in error rate compared with other techniques. But these methodologies failed to locate the fracture width, which is necessary for determining the state and stability of civil structures. Hence, it is essential to devise a strategy with which the crack details could be extracted and classified using minimum features which can lead to achieve a better accuracy. The proposed technique should be capable of combating all these issues and act as an indicator to show the end-user the seriousness of cracks available in civil structures which are difficult to access by human beings.
Hence, the proposed work has an efficient bilayer crack detection algorithm to identify crack features followed by an ensemble bagged tree classifier. In the existing techniques, only one layer of crack detection technique is used to detect the cracks [6,7]. In single layer crack detection, even though the crack is detected, more residual noises are present in the output and some actual cracks are also removed. If features are extracted from single layer crack detection, it will increase the possibility of misclassification in the classifier output and reduce the accuracy. Moreover, from the literature survey discussed so far, thresholding, connecting disjoint crack segments and maintaining accuracy under different working conditions are the main drawbacks of existing crack detection techniques. The proposed algorithm utilizes a threshold value which is adaptively varied based on pixel values independent of the image size. It devises a new labeling and noise reduction algorithm for combining the isolated crack segments using geometrical properties of crack segments. It also overcomes the barriers for achieving a higher accuracy. In order to maintain the safety of building, the cracks are classified into three classes based on their widths: fine crack (width less than 1 mm), medium crack (width between 1 mm to 4 mm), and severe crack (more than 4 mm).
The rest of the paper is organized as follows. Proposed System is elaborated in Section 2. Section 3 describes the performance evaluation. Section 4 explains about Raspberry Pi implementation for real time execution. Section 5 concludes the paper.
2 Crack Severity Level Classifier with Bilayer Crack Detection
The block diagram of the proposed crack severity classifier with bi-layer crack detection technique is shown in Fig. 1. The input images are then preprocessed and the useful information is extracted using a bilayer crack detection technique. The obtained data is posted on the cloud and further analysis is carried out on the cloud and the cracks are classified based on their width. End users are intimated about the severity level through a mail and a SMS for carrying out the preventive measures.

Figure 1: Block diagram of the proposed crack severity level classifier with bilayer crack detection
The input image is preprocessed to magnify the crack details by suitably modifying the second order derivative Laplacian filter. The segmentation and post processing are then done in two levels to improve the efficiency of crack detection. The first level acts as a basic crack detection layer which consists of segmented adaptive thresholding as segmentation technique and morphological operations as post processing. The preprocessed image is applied to segmented adaptive thresholding which is an adaptive thresholding technique that alters the pixel values based on the intensity values and distinct the crack. The binary output image which contains the cracks is improved by morphological operations. Though cracks are detected, some noises are also increased at this stage.
In order to remove the additional noises and select the strong features needed to classify the cracks correctly, the second level of crack detection technique is used. The second level is the enhanced crack detection layer that has a novel double scan labeling algorithm, and a noise reduction algorithm based on the common properties of cracks. It generates a uniquely labeled image using a double scan labeling algorithm. The labeled image has cracks and noise segments. The noise segments are eliminated by using the noise reduction algorithm based on the geometrical properties of the segments. The segments with separate labels are used to calculate the area, eccentricity and aspect ratio of each segment individually. A weaker crack criterion (WCC) is used to combine the disjoined cracks. The WCC of detected cracks is selected as one of the features which improve the separation between classes and also increases accuracy. By extracting geometrical features of the identified cracks, ensemble classifiers are used to classify the cracks based on their width into fine, medium and severe cracks which enable us to instruct the user about the seriousness of the crack. The real-time implementation of the proposed technique is done on the Raspberry Pi with the cloud and Application Programming Interface (API). The workflow of the proposed crack severity level classifier is shown in Fig. 2.

Figure 2: Workflow of the proposed crack severity level classifier with bilayer crack detection
The input image acquired from the Pi camera could be disturbed by the light available in the image acquisition area. The distractions in this acquisition can affect the crack detection process. Such issues are reduced by preprocessing [23].
The input colour image is converted into grayscale to reduce the storage memory space and complexity of the process.
It is important to differentiate cracks from the background with uneven illumination conditions and other defects for detecting the cracks accurately [24]. In this work, the enhancement of crack features is achieved by LaBoost filter. It aims to blur the noise and improve the crack features using the Laboost filter. The LaBoost filter output is attained by combining upgraded Laplacian filtered output (Ilaplacian) with the low pass filtered output (Ilowpass) as per Eq. (1).
The low pass filter is used to smooth the noise details. The upgraded Laplacian filter is a second order derivative filter used to highlight the crack edges. The dissimilarity between crack and background is increased further by adding a scalar to its centre value of kernel. The kernel for upgraded Laplacian filter is given by Eq. (2). Where A is a constant.
The crack detection capability of LaBoost filter compared with other edge detection filters is shown in Fig. 3. The Robert filter extracts the clear cracks with low intensity while Sobel and Prewitt filters fail to do it. Sobel and Prewitt filters identify the crack but amplifies the noise too. It is also evident that Laboost filter separates the crack with increased intensity and rejects the noises.

Figure 3: Filtered outputs (using Robert, Sobel, Prewitt and LaBoost filters)
2.2 Basic Crack Detection Layer
The basic crack detection layer uses adaptive thresholding as the segmentation procedure and morphological operation as post processing.
2.2.1 Segmented Adaptive Thresholding
Thresholding is used to separate and interpret the crack [25]. Commonly used thresholding techniques like global and local thresholding are suitable only for noise free and low noise images respectively [26]. Many existing crack detection methods [27–29] provide better results only for a specific value of threshold. This drawback is eliminated by the proposed segmented adaptive thresholding, in which the threshold value is robust and dynamic. The threshold value is derived from adaptively varying values based on pixel intensities. The algorithm for segmented adaptive thresholding is as follows.
1. Divide the image into m regions of size n × n.
2. Calculate the adaptive threshold value for each region.
3. Each sub block is binarized
4. The entire binary image is obtained as
The image is split into sub blocks of size 8 × 8, and an adaptive threshold for each subblock is calculated by Eq. (3). The image is binarized by comparing the pixel value against the threshold Tj as shown in Eq. (4). The entire binary image is acquired by Eq. (5). Due to the subblock based binarization the noise effects are reduced and the crack edges are improved. This is achieved by removing the noises below the threshold value and maintaining the crack above the threshold values.
2.2.2 Morphological Operations
Post processing operations remove islands and small objects so that only substantive objects remain. It can be achieved by morphological operation which is the simple and efficient method used for enhancing an image [30]. Out of several morphological operations available, erosion and thinning operations are utilized in this work, as represented by Eqs. (6) and (7) respectively.
After applying thinning over erosion output, the crack information is retained along with noise details. Due to the noise present in the thinned image the defects are not detected exactly and the accuracy is also reduced.
2.3 Enhanced Crack Detection Layer
In the basic crack detection layer output, the noise also becomes significant along with the crack information. So, the possibility for detecting the magnified noise as a crack is increased. Some disconnected cracks appear as noise, and it decreases the probability of detecting exact cracks. These drawbacks of the basic crack detection layer are eliminated by using enhanced crack detection layer. It consists of a double scan algorithm to label the output image of the basic crack detection layer [31] followed by a noise reduction algorithm to remove noises from the labeled image.
The image from the basic crack detection layer includes stronger cracks, enhanced noises and weaker cracks. The enhanced noises are removed by analyzing the characteristics of noise and crack. This can be done initially by segmenting the image by using a double scan algorithm. The double scan algorithm labels the images by scanning it two times in the forward direction
During the first scan, the kernel is applied to scan the image. For a foreground pixel, if it has no neighbors, a new provisional label is assigned. If the foreground pixel is already connected to some other foreground pixel, assign the same provisional label of the neighbor. All the provisional labels are recorded for processing in the second scan. The kernel used for the double scan algorithm with the current pixel F(x, y), along with the input, first and second scan values are shown in Fig. 4.

Figure 4: Double scan algorithm
For example, let r(u) and r(v) be the different provisional labels in the same connected component. If r(u) < r(v), then the equivalent label will be r(u). The connected component with equivalent label r(u)is S[r(u)] obtained by the union of connected components with r(u) and connected components with r(v). If r(v) < r(u), then the equivalent label will be r(v). The connected component S[r(v)]with equivalent label r(v) is obtained by the union of connected components with r(u) and connected component r(v). In Fig. 4 during the first scan, components 1 and 2 are denoted with different provisional labels. Since 1 < 2, both components are relabeled as 1 in second scan. Similarly 4 < 6, the components 4 and 6 are relabeled as 6. The flowchart of double scan algorithm during the first scan is shown in Fig. 5 and the second scan is shown in Fig. 6.

Figure 5: Flowchart for first scan process
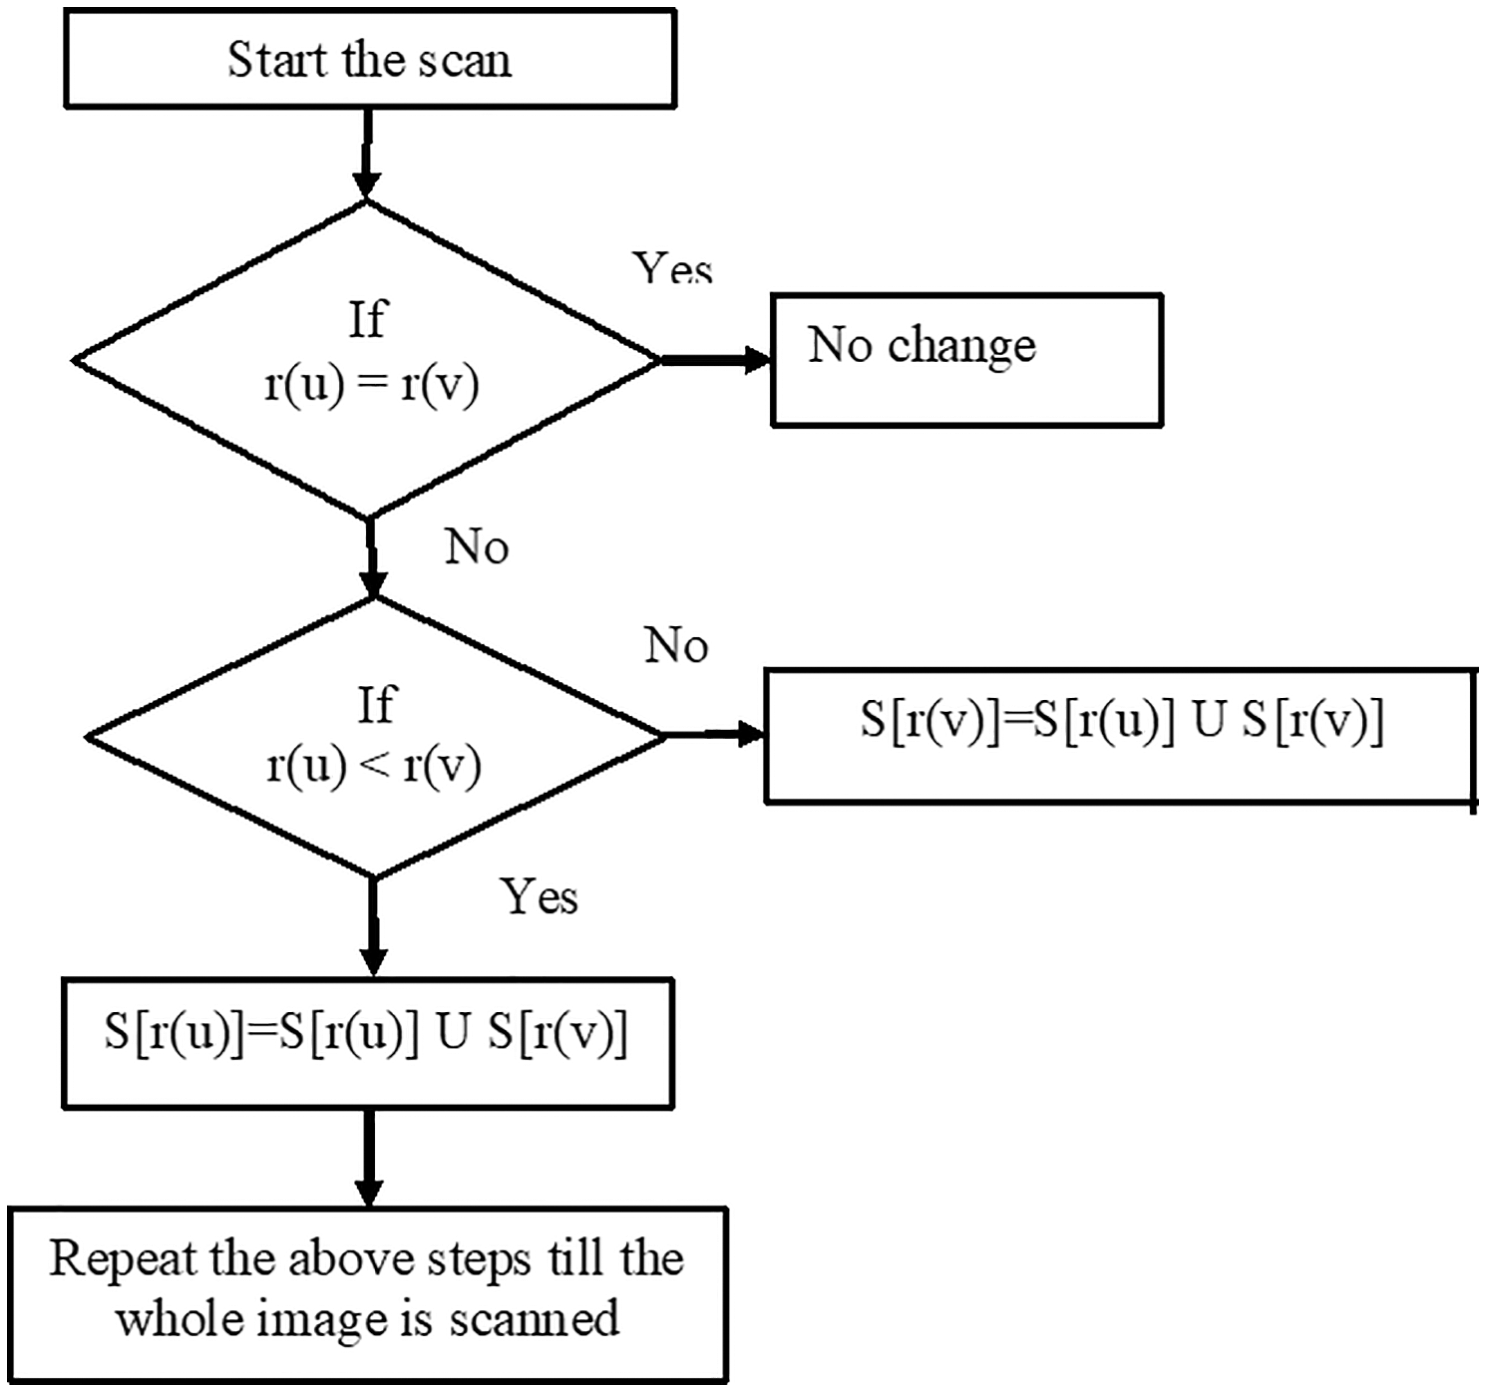
Figure 6: Flowchart for second scan process
The double scan algorithm labels the image based on their connectivity. The labeled connected component is called a segment. The segments may have different size, area and orientation but the pixels in a segment are connected. In the segmented image the calculation of geometrical properties will be more accurate than normal image. These characteristics are used in noise reduction algorithms to remove noise segments and retain only the crack segments.
2.3.2 Noise Reduction Algorithm
The post processing of the enhanced crack detection layer is achieved by noise reduction algorithm. It is used to eliminate the remaining noise in the labeled image and join the disconnected crack segments. The parameters area, eccentricity and WCC are selected based on the characteristics of cracks. If the crack is longer and thinner than the noise then the area of crack will be larger than the area of noise [6,9,10]. The procedure to calculate the thresholding parameters is described below
Let Di be the ith segment consists of ni pixels with co-ordinate (xij, yij), area (Ai), eccentricity (Ei) and weaker crack criterion (WCC i) for a ‘m’ no. of segments.
Area:
The area of each segment is calculated as the number of pixels in that segment. The segment is spotted as crack if it satisfies the Eq. (8)
where At-Threshold value for area. An area criterion is used to remove additional noises in the image.
Eccentricity:
Eccentricity is used to define the thin and long nature of crack. It is defined as the ratio of major axis length to the minor axis length. Eccentricity is otherwise called aspect ratio.
Detected segment is identified as crack if the segment satisfies the Eq. (9)
where Et-Threshold value for eccentricity. An eccentricity criterion is used to distinguish cracks from noises.
Weaker Crack criterion:
The WCC is calculated as per the following the Eqs. (10) and (11).
The segment is established as crack if it satisfies Eq. (12).
where WCCt-Threshold value for WCC. The WCC is used to increase the probability of detecting weaker cracks by multiplying area with its aspect ratio. The weaker crack segment has high WCC value even if the crack has less area due to its high aspect ratio.
The WCC, area and eccentricity are calculated for each segment. The segments are arranged in descending order based on area. The stronger segments will have area larger than the threshold. So, the stronger segments will be selected as crack. This implies the stronger cracks are extracted using Area criteria.
Along with noises, thin cracks with smaller areas are also rejected by area criteria. The extraction of these cracks can be achieved by combining all three thresholding strategies. The eccentricity value of the slim and lengthy segment is equal to 1 in ideal case. So, the eccentricity threshold is chosen as 0.95. The segment with eccentricity value greater than threshold is detected as crack.
The WCC value is calculated to find the crack with less area and to select the disjoined cracks. The aspect ratio of the crack segment is greater than the noise segment because of its elongation in nature. The crack with less area will have more WCC. So, the segment with WCC above the threshold will be detected as crack. The flowchart for the noise reduction algorithm is shown in Fig. 7.

Figure 7: Flowchart for noise reduction algorithm
The image created by the double scan labeling algorithm is labeled based on connectivity. So, the disjoined cracks will have adjacent labeling because of neighboring pixel positions. These adjacent weaker cracks are easily identified by Segmented Adaptive Thresholding technique. The crack is detected by using three thresholds as given by Eq. (13)
The WCC is used to find the weaker crack which has a high eccentricity value. The threshold value of WCC is selected in such a way that it will filter the weaker, disjoined crack and reject the noise. Each image has segments with different WCC values. Only very few segments have high WCC values and many of them have less WCC values. To separate crack segments from noise a threshold value suitable for all images has been arrived at from the graph shown in Fig. 8 which plots the WCC values of different segments of sample images in the dataset. The WCC values of all segments fall into a very low value below a particular value. This implies that below threshold, the eccentricity and area of segments will be very less. This denotes that only noises are present below threshold and all noises are eliminated by choosing the threshold value for WCC as 500.
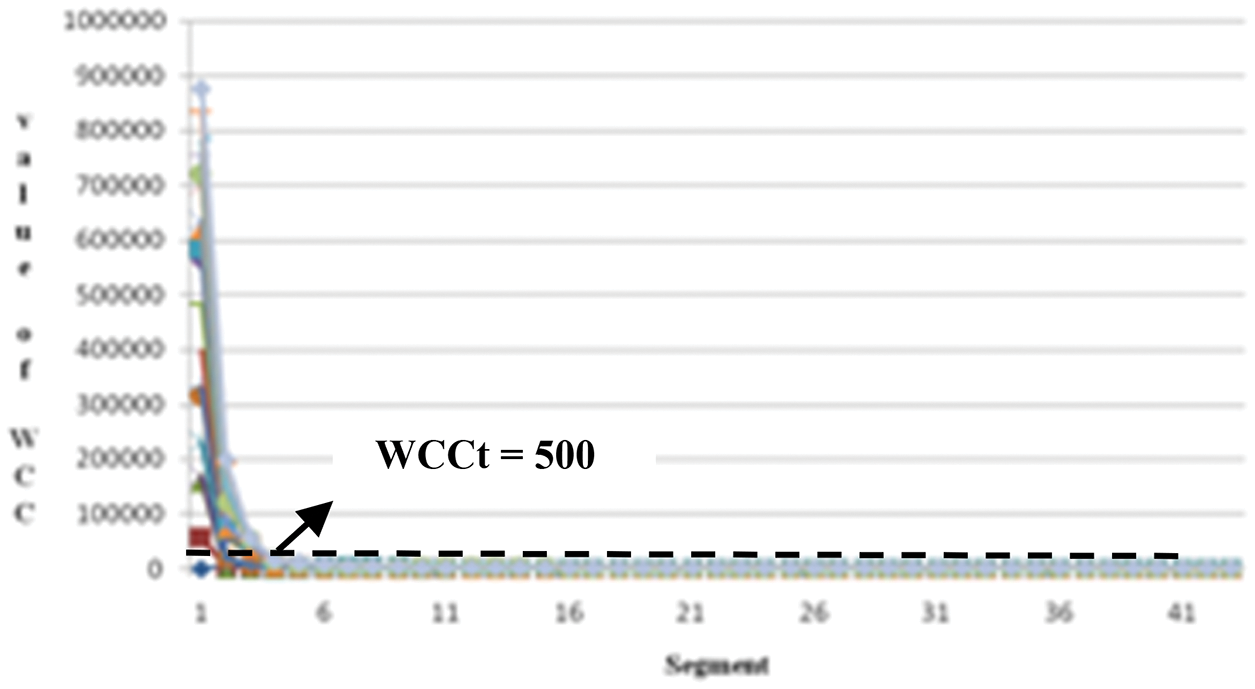
Figure 8: Selection of threshold for WCC
The classifier is used to classify the crack images into three categories: thin, medium, and severe cracks, depending on the width of the crack.
Feature extraction is a process in which important features are identified from images to create feature vectors. Using these feature vectors, the classifiers can fit the crack image to different target classes. The geometrical features extracted from detected cracks are area, eccentricity, perimeter, and orientation of the extracted cracks. While using these features for classification, the accuracy is not up to the level. To improve the accuracy, WCC is also added as one of the features. Since WCC gives distinct feature values based on crack width, it increases the accuracy.
The feature vectors are applied to the ensemble classifier. An ensemble of classifier is a set of classifiers where multiple weak learners are integrated together to form a strong learner that uses either bagging or boosting techniques. Bagging is a bootstrap ensemble technique that generates weak learners from its ensemble by training each learner on a random selection of the dataset and aggregates their outputs. The ensemble bagging classifiers are robust, with less variance and parallel processing of weak learners. It also uses the decision tree technique called a random forest, which randomly selects the features instead of a dataset to build a tree and train it. It easily trains the data with high dimensionality. Even though missing values are present, it will not affect the accuracy. So, the ensemble classifier uses bagging and decision tree techniques to classify the cracks effectively.
The dataset used in this technique is formed by collecting the complex images from the ELCI (Edge based labeled crack image) dataset [32], SDNET 2018 dataset [33], Mandley dataset [34]. This dataset consists of 1350 images under different illumination conditions with various textures, strains, and cracks which are used for classification. This data set has various crack images under dark, coarse, and fine background. This dataset is also used to validate the proposed algorithm by calculating the accuracy, precision, sensitivity, and Emeasure.
The precision, sensitivity, accuracy and Emeasure are used to achieve more quantitative results than subjective results of proposed technique.
The precision, true positive rate, F score and accuracy are measured by using the expressions given in Eqs. (14)–(17).
The above metrics consider only the pixel level properties. But, Emeasure (
where w and h are the width and height of the map respectively.
The output of the proposed crack detection algorithm for single and multiple cracks at various levels are shown in Fig. 9. The precision and TPR values of the proposed technique is calculated and compared with the CWT transform for all images in the ELCI dataset and the sample data is tabulated in Table 1.
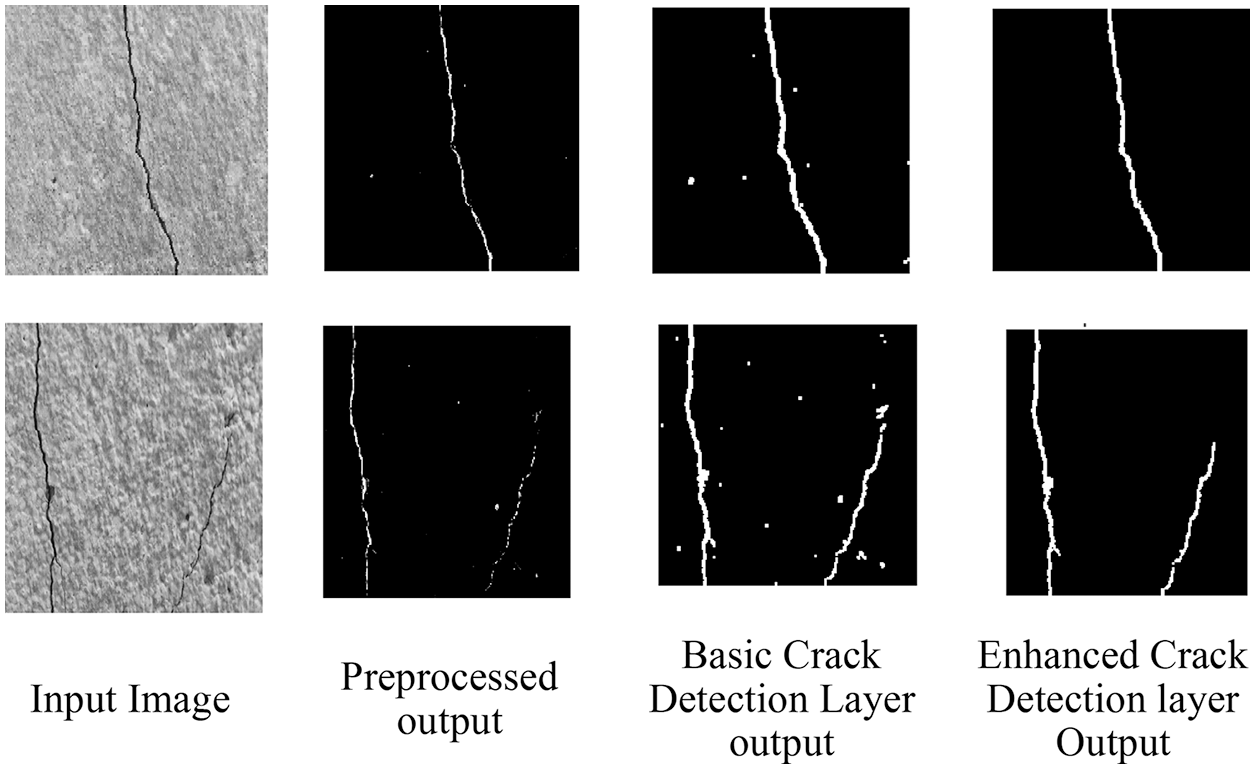
Figure 9: Sample output at various stages for single and multiple crack images

From Table 1, it is observed that the average precision and TPR values of the proposed technique is improved over the CWT technique by 22.4% and 16.7% respectively. The crack width transform along with aspect ratio filtering [13] is used to extract the crack. The thresholding value depends on contrast values of foreground and background. The contrast values are affected by uneven illumination conditions and low contrast. In the proposed method, the threshold value of noise reduction algorithm does not depend on contrast values and rely on geometrical properties of crack segments. Hence, the average TPR and precision values are improved by 16.7% and 22.4% respectively.
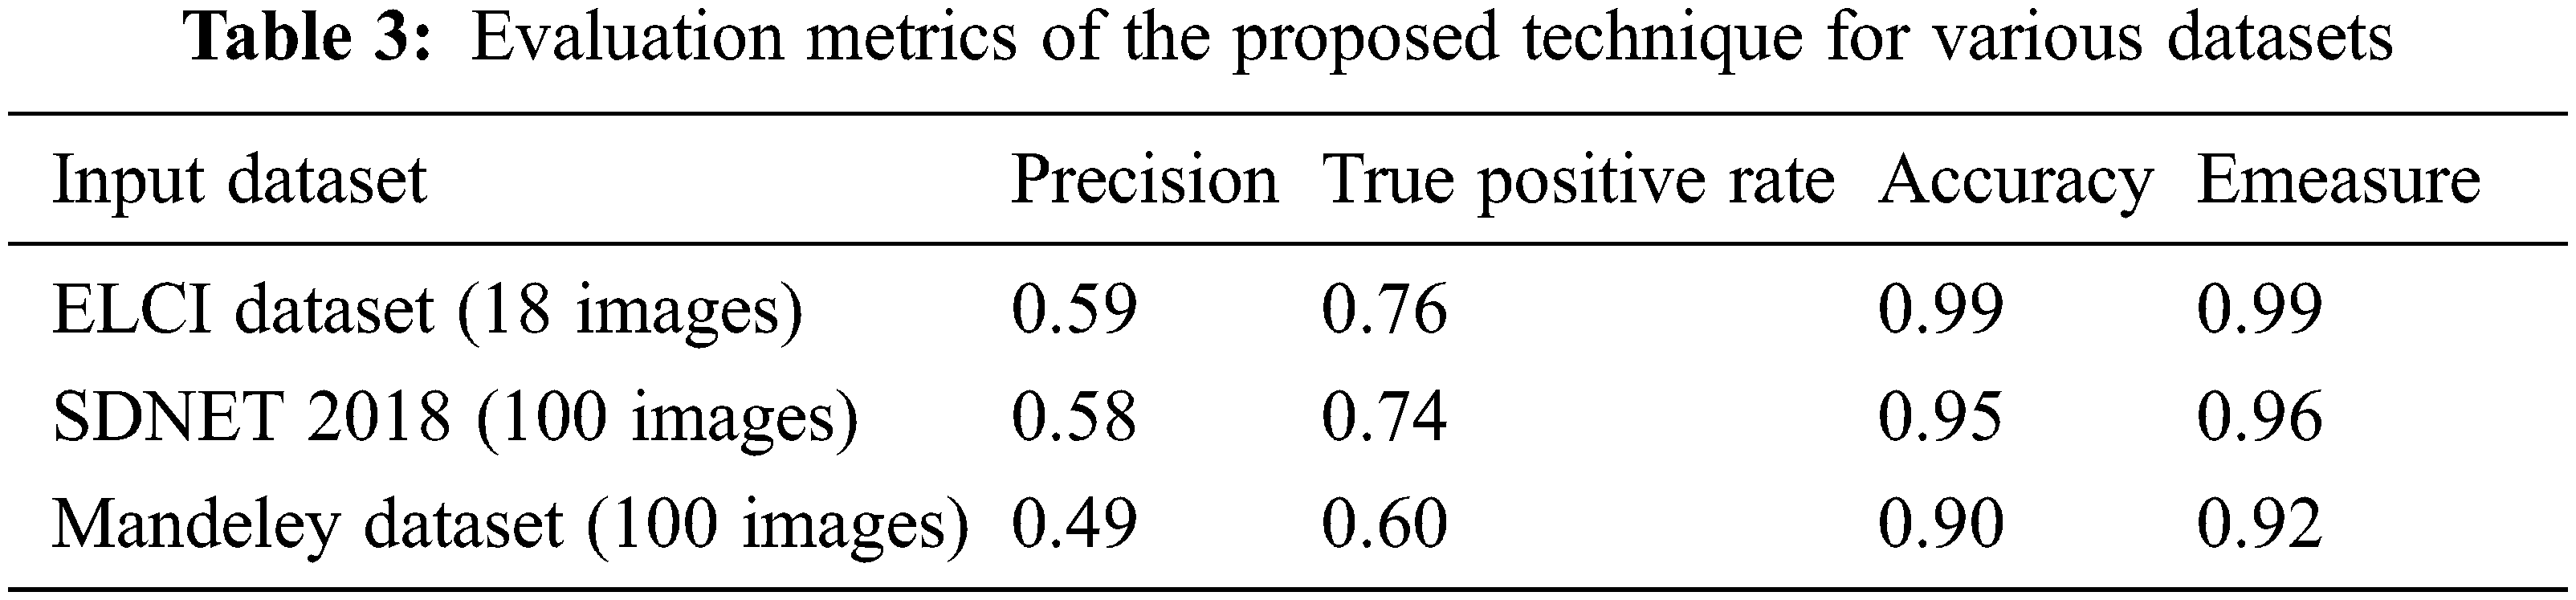
The proposed crack detection algorithm is compared with the existing crack detection techniques such as Otsu thresholding and canny edge reduction in Fig. 10. The precision, true positive rate and accuracy values are tabulated in Table 2. It shows the correctness of proposed technique under strain, texture variations, shadow and uneven illumination conditions. It works well with detection of cracks in rock and stone structures also. The accuracy and E-measure value of proposed crack detection technique for different datasets are tabulated in Table 3.

Figure 10: Comparison of the proposed detection technique with existing techniques

3.4 Ablation Study for Classifier
The detected cracks are classified based on the severity of the crack. For better classification, the area, eccentricity, orientation, and perimeter of the crack are selected as features by the classifier. The decision tree classifier, Navies Bayes classifier, SVM classifier, ensemble classifier and neural network classifier are used for classifying these cracks.
The classification algorithm used here is performed by using the MatlabR2021a software. The decision tree classifier provides a model which is unstable even for a small change in the input data. The NB classifier works on the assumption that all the predictors are not dependent. So, it is difficult to fit it for the real-time applications [36,37]. The issues of the SVM classifier are its difficulty in choosing a correct kernel function, requirement of long training time, and large memory storage. The problems with neural networks are that they require more training time and the convergence of neural networks is not confirmed [38]. Out of the six classifiers used, only the ensemble classifier, which uses both bagging and decision tree techniques, provides an overall accuracy of 98.6%.
An ensemble classifier combined with different ensemble techniques like bagging, adaboosting and rusboosting are studied in order to find out the best accuracy technique for decision tree learner with a learning rate of 0.1, using Bayes optimization function. The accuracy of the ensemble classifier for different ensemble techniques is calculated in Table 4. The performance of the classifier is evaluated by calculating its precision, true positive rate, F score and accuracy as shown in the classification report (Table 5). The training and validation accuracy curve, the training and validation loss curve and the confusion matrix for the ensemble bagged decision tree classifier is shown in Figs. 11–13 respectively.
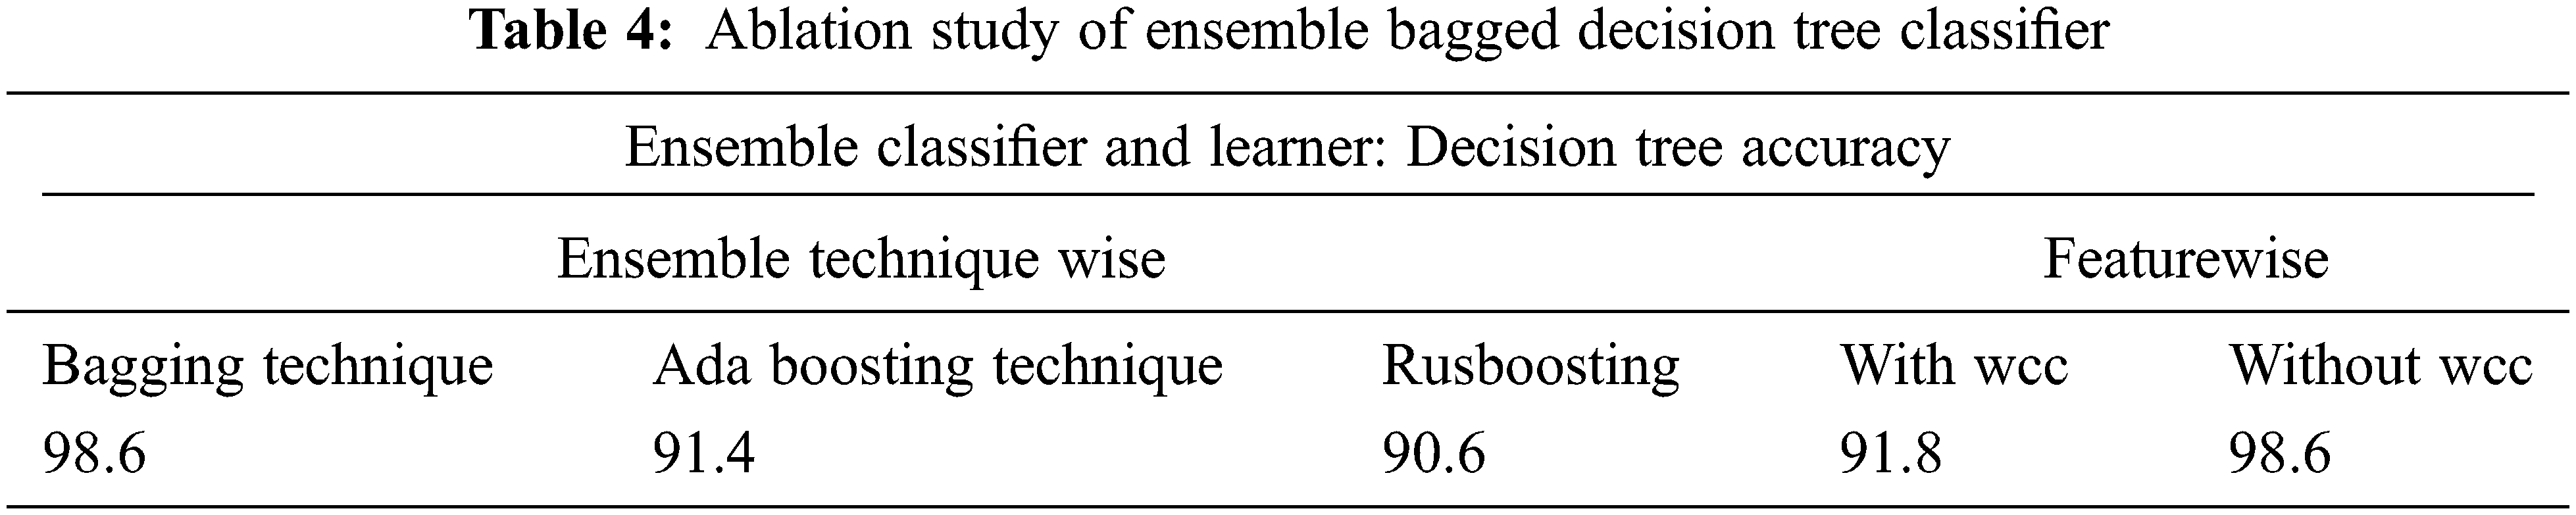
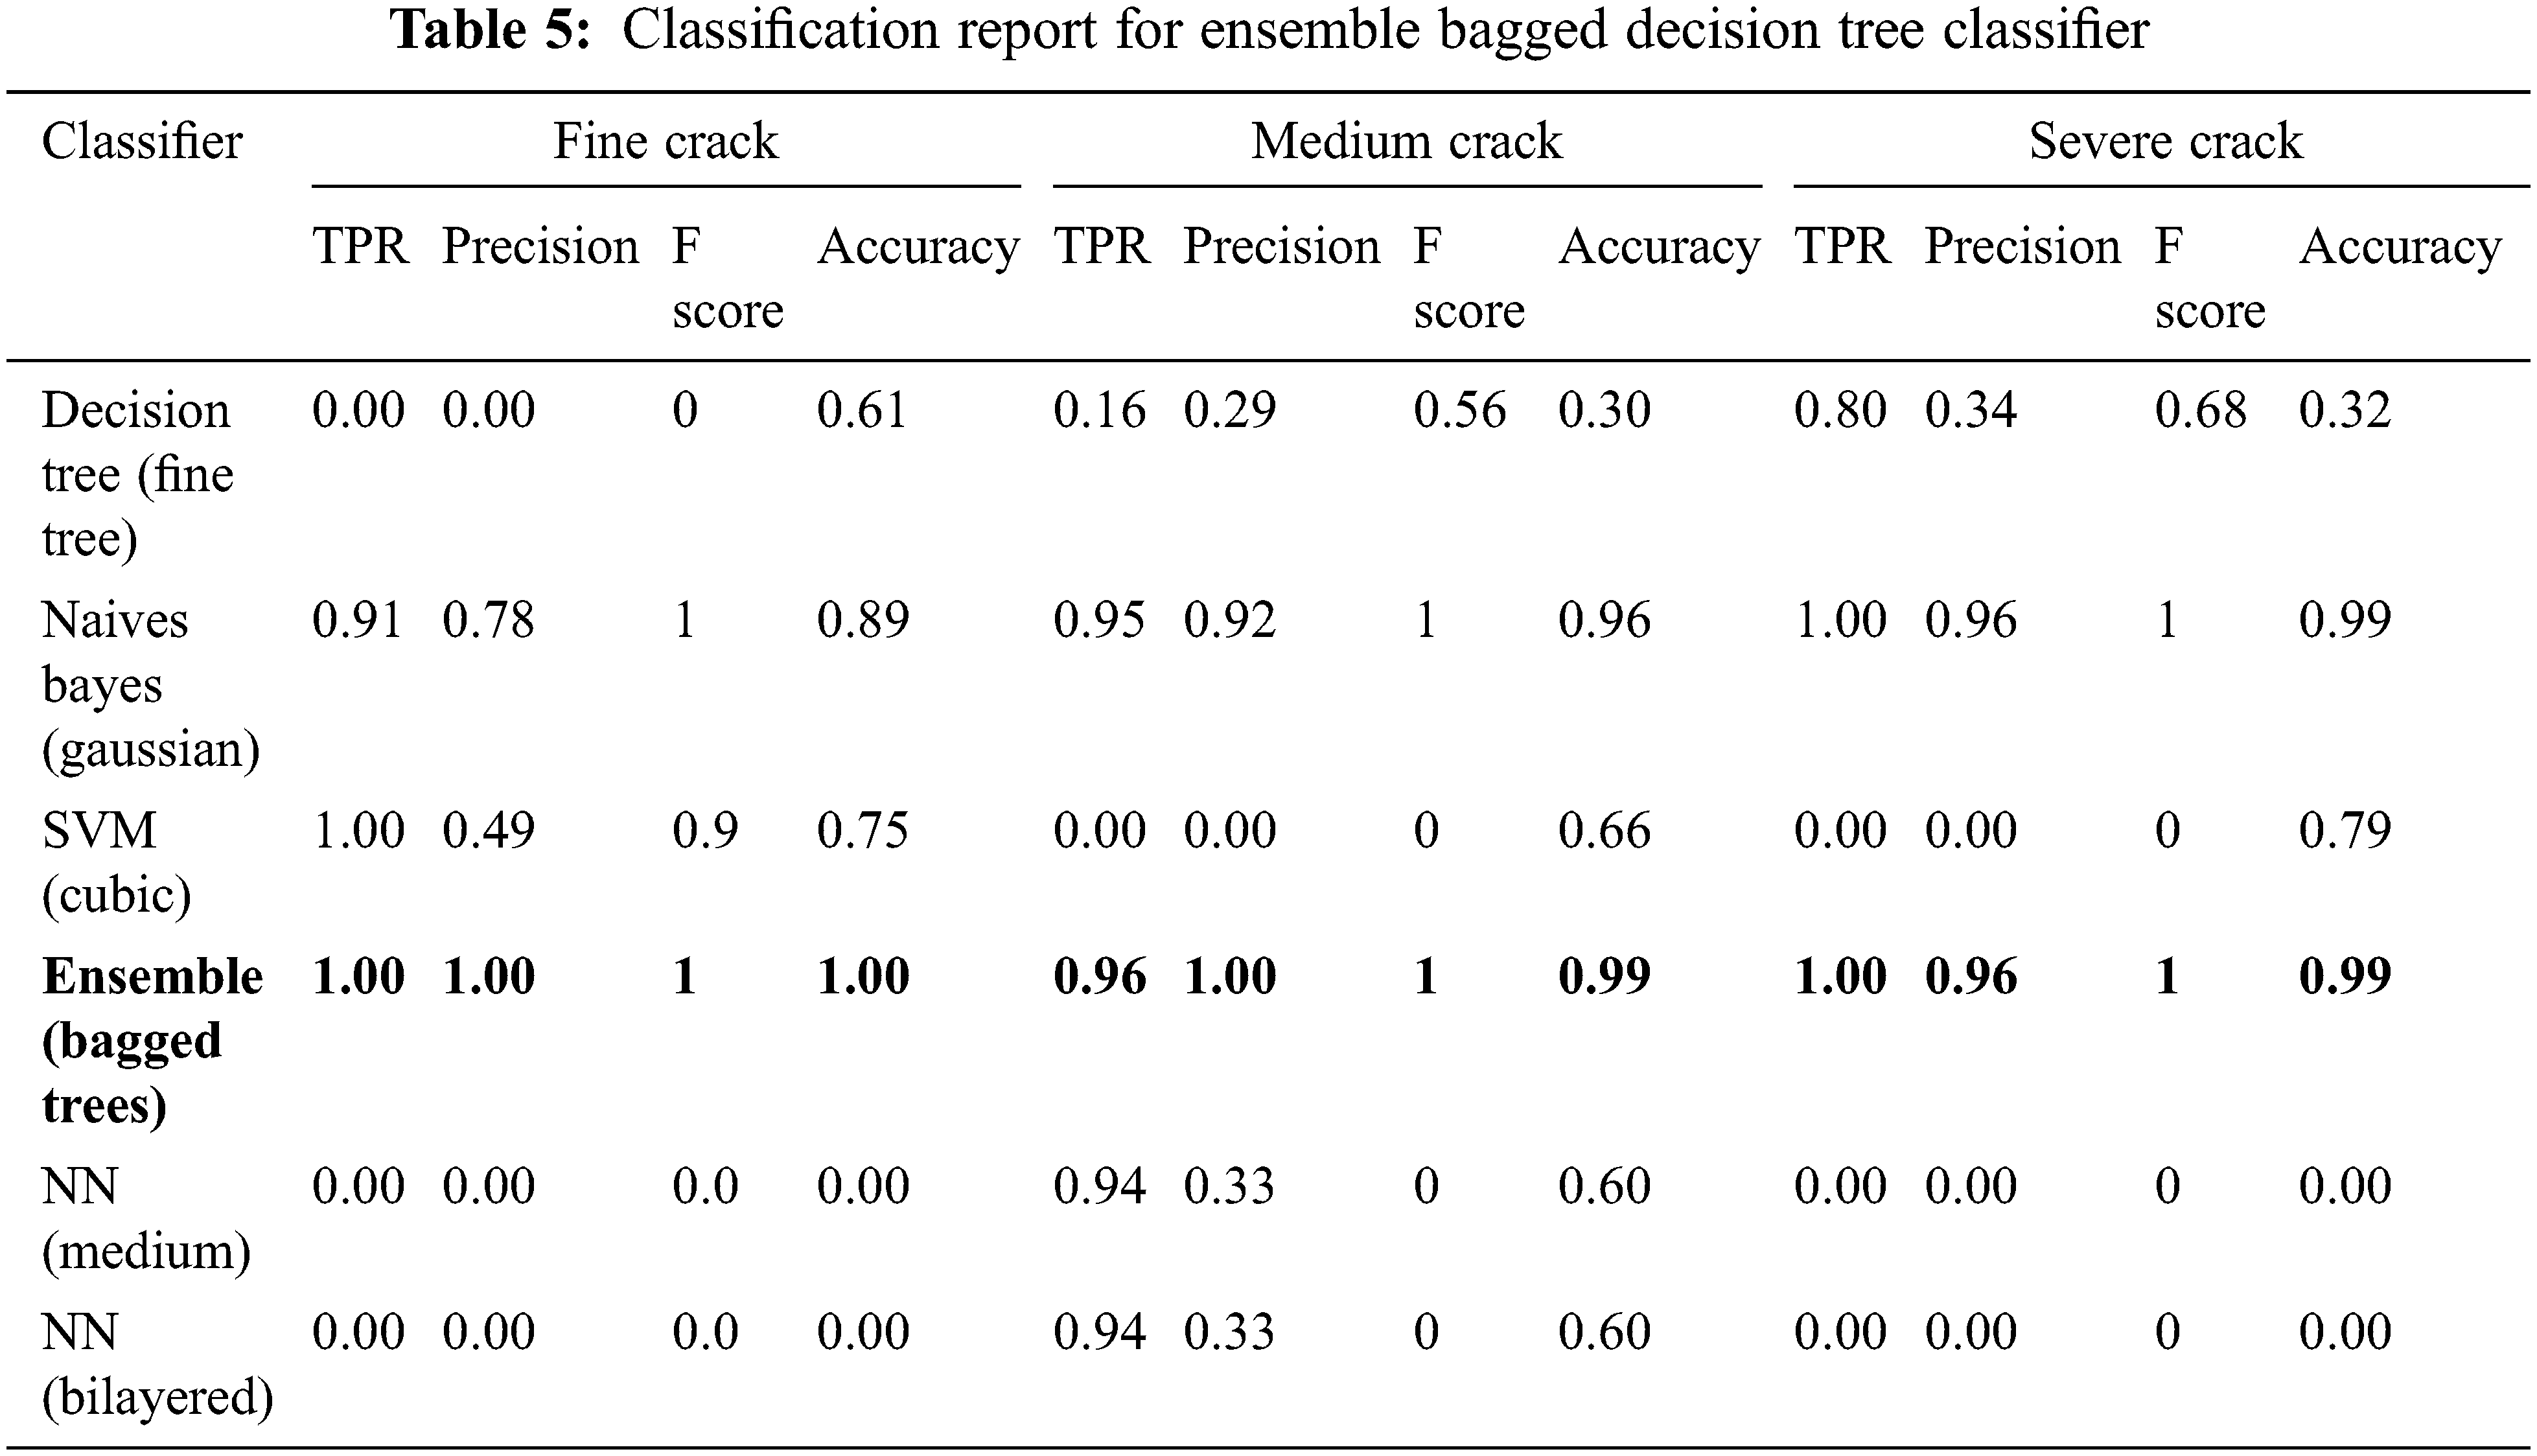

Figure 11: Training and validation accuracy

Figure 12: Training and validation loss
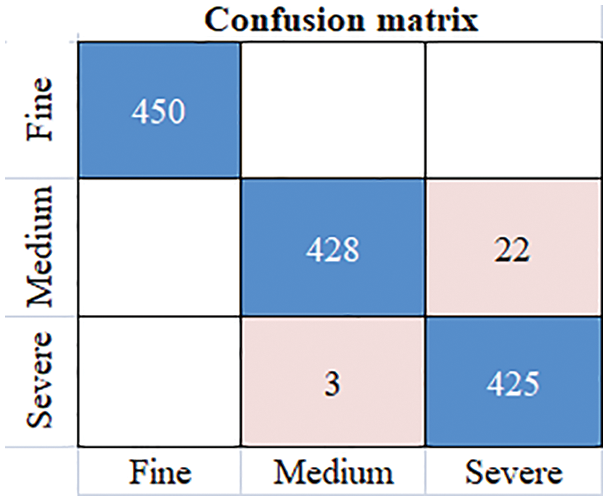
Figure 13: Confusion matrix
From the table, ensemble classifier works better for the bagged tree technique with decision tree learner.
In order to improve the accuracy further, the WCC is also added as a feature, which increases the individual accuracy and overall accuracy. The overall classification accuracy with ensemble classifier increases from 91.8% to 98.6%
To further validate the results the proposed technique is compared with other state of the art techniques too as shown in Table 6. The features area, eccentricity, orientation, and perimeter extracted from M2GLD Technique [39] are applied to the Ensemble (Bagged Trees) Classifier to find out its classifier efficiency.

From Table 6, it is found that the M2GLD technique performs well for the medium crack class and fails to classify fine crack class and severe crack classes due to the detection of a crack depending only on the orientation of crack. The improvement in accuracy with and without WCC for different classifier is depicted in Fig. 14.
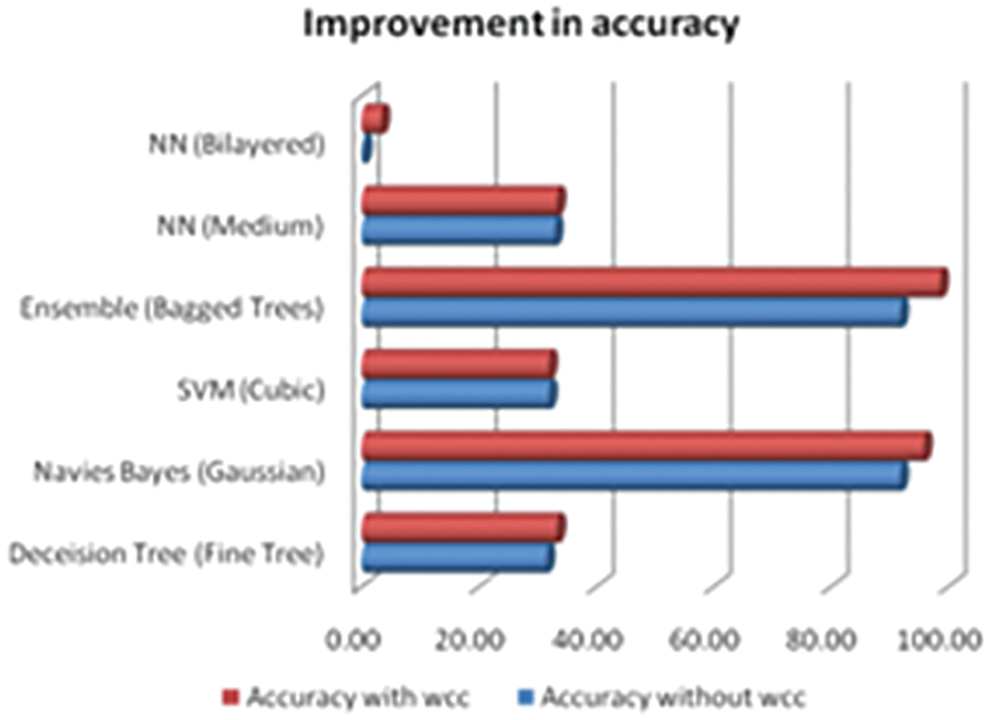
Figure 14: Accuracy with WCC and without WCC
4 Enabling Real-Time Implementation
In a real-time scenario the places to be monitored will be vast in area and inaccessible for frequent monitoring. Such regions can be monitored by remote networks. Hence this section involves the Raspberry Pi implementation of the proposed algorithm which enables network formation and continuous monitoring. The proposed technique is implemented using Python and Octave. So, it is easy to execute the coding on the ARM architecture of the Raspberry Pi(specification: power-2.5A,Processor-Quad core 64 bit SOC, memory-1GB LPD DR2 SDRAM, Clock-1.4 GHz, Connectivity-IEEE 802.11 b/g/n/ac wireless LAN). The system also has high-definition digital camera (specifications: USB camera with 1080 p 30 fps) which allows us to capture the images of the selected building. To power up Raspberry pi a power bank (specification: 10000 mAH Li-Polymer power bank with 18W fast charging) is also used.
The images captured using the digital camera is processed by the Raspberry Pi, which makes use of a bilayer crack detection algorithm. This algorithm does the extraction of crack images from the camera module, which is then sent to the end user with the application of the cloud platform. The processed image and the crack identified image from the field must be transmitted to the end user to find the defects available in the image. This can be achieved by sending the image to the cloud. So, the end user can visualize the defects from anywhere. The Raspberry Pi is connected to the cloud through Wi-Fi. The average execution time of the proposed technique is 17 s. Based on the information received about the seriousness of the crack, inspection and maintenance of the requisite places will be carried out.
This paper proposed a crack width classifier that classifies the cracks depending on width as fine, medium, or thick cracks. The features required for the classifier are extracted from the bi-layer crack detection technique. The basic crack detection layer highlights both cracks and noise. The noises are removed by an enhanced crack detection layer using shape descriptors of crack and noise. This proposed technique has achieved an increase in TPR and precision value of 16.7% and 22.4%, respectively, with respect to the crack width transform method. It has also obtained both pixel-level accuracy and an image-level similarity score Emeasure as 0.9. This technique detects cracks accurately irrespective of complex background, texture variation, shadow, uneven illuminations and strain. This technique also detects minor, major, multiple and mushroom cracks exactly. Along with the newly introduced WCC, the geometrical features of detected cracks are identified. The Ensemble Classifier using bagging and decision tree techniques is used to classify the cracks and update the status of the building to the user for maintenance. The classifier obtained an overall accuracy of 98.6%. To incorporate this technique into a regular structural monitoring system, the bilayer crack detection algorithm is implemented on the Raspberry Pi and the severity of the cracks will be intimated to the end user also.
Funding Statement: The authors received no funding for this study.
Conflicts of Interest: The authors declare that they have no conflicts of interest to report regarding the present study.
References
1. R. Moosavi, M. Grunwald and B. Redmer, “Crack detection in reinforced concrete,” NDT & E International, vol. 109, pp. 102190, 2020. [Google Scholar]
2. R. S. Narwaria and A. Tiwari, “Development of cracks in concrete, preventive measures and treatment methods: A review,” International Research Journal of Engineering and Technology, vol. 3, no. 9, pp. 671–677, 2016. [Google Scholar]
3. B. Wang, Q. Zhang and W. Zhao, “Fast concrete crack detection method via L2 sparse representation,” Electronics Letters, vol. 54, no. 12, pp. 752–754, 2018. [Google Scholar]
4. A. Mohan and S. Poobal, “Crack detection using image processing: A critical review and analysis,” Alexandria Engineering Journal, vol. 57, no. 2, pp. 787–798, 2018. [Google Scholar]
5. S. N. Yu, J. H. Jang and C. S. Han, “Auto inspection system using a mobile robot for detecting concrete cracks in a tunnel,” Automation in Construction, vol. 16, no. 3, pp. 255–261, 2007. [Google Scholar]
6. J. H. Chen, M. C. Su, R. Cao, S. C. Hsu and J. C. Lu, “A self organizing map optimization based image recognition and processing model for bridge crack inspection,” Automation in Construction, vol. 73, pp. 58–66, 2017. [Google Scholar]
7. R. G. Lins and S. N. Givigi, “Automatic crack detection and measurement based on image analysis,” IEEE Transactions on Instrumentation and Measurement, vol. 65, no. 3, pp. 583–590, 2016. [Google Scholar]
8. Z. Zhu, S. German and I. Brilakis, “Visual retrieval of concrete crack properties for automated post-earthquake structural safety evaluation,” Automation in Construction, vol. 20, no. 7, pp. 874–883, 2011. [Google Scholar]
9. W. Zhang, Z. Zhang, D. Qi and Y. Liu, “Automatic crack detection and classification method for subway tunnel safety monitoring,” Sensors, vol. 14, no. 10, pp. 19307–19328, 2014. [Google Scholar]
10. S. Liang, X. Jianchun and Z. Xun, “An extraction and classification algorithm for concrete cracks based on machine vision,” IEEE Access, vol. 6, pp. 45051–45061, 2018. [Google Scholar]
11. B. Y. Lee, Y. Y. Kim, S. T. Yi and J. K. Kim, “Automated image processing technique for detecting and analysing concrete surface cracks,” Structure and Infrastructure Engineering, vol. 9, no. 6, pp. 567–577, 2013. [Google Scholar]
12. Y. Noh, D. Koo, Y. M. Kang, D. Park and D. Lee, “Automatic crack detection on concrete images using segmentation via fuzzy C-means clustering,” in Int. Conf. on Applied System Innovation (ICASI), Sapporo, Japan, pp. 877–880, 2017. [Google Scholar]
13. H. Cho, H. J. Yoon and J. Y. Jung, “Image-based crack detection using crack width transform (CWT) algorithm,” IEEE Access, vol. 6, pp. 60100–60114, 2018. [Google Scholar]
14. S. Nedunuri, N. Thota, V. D. K. Pasupuleti and P. Kalapatapu, “Investigation of crack properties using image processing: An user interface,” Emerging Trends in Civil Engineering, vol. 61, pp. 81–90, 2020. [Google Scholar]
15. N. Gehri, J. Mata-Falcón and W. Kaufmann, “Automated crack detection and measurement based on digital image correlation,” Construction and Building Materials, vol. 256, pp. 119383, 2020. [Google Scholar]
16. W. Wang, H. Li, K. Wang, C. He and M. Bai, “Pavement crack detection on geodesic shadow removal with local oriented filter on LOF and improved level set,” Construction and Building Materials, vol. 237, pp. 117750, 2020. [Google Scholar]
17. N. Safaei, O. Smadi, B. Safaei and A. Masoud, “A novel adaptive pixels segmentation algorithm for pavement crack detection,” Engineering Archive, vol. 1479, pp. 3035, 2021. [Google Scholar]
18. B. Lei, Y. Ren, N. Wang, L. Huo and G. Song, “Design of a new low-cost unmanned aerial vehicle and vision-based concrete crack inspection method,” Structural Health Monitoring, vol. 19, no. 6, pp. 1871–1883, 2020. [Google Scholar]
19. R. Nigam and S. K. Singh, “Crack detection in a beam using wavelet transform and photographic measurements,” Structures, vol. 25, pp. 436–447, 2020. [Google Scholar]
20. P. J. Chun, S. Izumi and T. Yamane, “Automatic detection method of cracks from concrete surface imagery using two-step light gradient boosting machine,” Computer-Aided Civil and Infrastructure Engineering, vol. 36, no. 1, pp. 61–72, 2021. [Google Scholar]
21. G. P. Bu, S. Chanda, H. Guan, J. Jo, M. Blumenstein et al., “Crack detection using a texture analysis-based technique for visual bridge inspection,” Electronic Journal of Structural Engineering, vol. 14, no. 1, pp. 41–48, 2015. [Google Scholar]
22. G. Li, Q. Liu, S. Zhao, W. Qiao and X. Ren, “Automatic crack recognition for concrete bridges using a fully convolutional neural network and naive Bayes data fusion based on a visual detection system,” Measurement Science and Technology, vol. 31, no. 7, pp. 075403, 2020. [Google Scholar]
23. S. Joshi and P. T. Karule, “Review of preprocessing techniques for fundus image analysis,” Adv Modell Anal B, vol. 60, no. 3, pp. 593–612, 2017. [Google Scholar]
24. M. Umeha, R. Hemalatha and S. Radha, “Structural crack detection using high boost filtering based enhanced average thresholding,” in Int. Conf. on Communication and Signal Processing (ICCSP), Chennai, India, pp. 1026–1030, 2018. [Google Scholar]
25. G. E. Sujji, Y. V. Lakshmi and G. W. Jiji, “MRI brain image segmentation based on thresholding,” International Journal of Advanced Computer Research, vol. 1, no. 3, pp. 97, 2013. [Google Scholar]
26. F. H. Chan, F. K. Lam and H. Zhu, “Adaptive thresholding by variational method,” IEEE Transactions on Image Processing, vol. 7, no. 3, pp. 468–473, 1998. [Google Scholar]
27. Y. Fujita, Y. Mitani and Y. Hamamoto, “A method for crack detection on a concrete structure,” in 18th Int. Conf. on Pattern Recognition (ICPR’06), vol. 3, Hong Kong, China, pp. 901–904, 2006. [Google Scholar]
28. Y. Fujita, Y. Mitani and Y. Hamamoto, “A robust automatic crack detection method from noisy concrete surfaces,” Machine Vision and Applications, vol. 22, no. 2, pp. 245–254, 2011. [Google Scholar]
29. T. H. Dinh, Q. Ha and H. M. La, “Computer vision-based method for concrete crack detection,” in 14th Int. Conf. on Control, Automation, Robotics and Vision (ICARCV), IEEE, Thailand, pp. 1–6, 2016. [Google Scholar]
30. A. M. Bazen and S. H. Gerez, “Segmentation of fingerprint images,” in ProRISC 2001 Workshop on Circuits, Systems and Signal Processing, The Netherlands, pp. 276–280, 2001. [Google Scholar]
31. L. He, X. Zhao, Y. Chao and K. Suzuki, “Configuration-transition-based connected-component labeling,” IEEE Transactions on Image Processing, vol. 23, no. 2, pp. 943–951, 2013. [Google Scholar]
32. H. Cho and H. J. Yoon, “ELCI: Edge based labeled crack image,” IEEE Dataport, 2018. [Online]. Available: http://dx.doi.org/10.21227/5z39-7318. [Google Scholar]
33. L. Zhang, F. Yang, Y. D. Zhang and Y. J. Zhu, “Road crack detection using deep convolutional neural network,” in IEEE Int. Conf. on Image Processing (ICIP), Phoenix, USA, 2016. [Google Scholar]
34. L. Zhang, F. Yang, Y. Daniel Zhang and Y. J. Zhu,“Road crack detection using deep convolutional neural network,” IEEE International Conference on Image Processing (ICIP), USA, pp. 3708–3712, 2016. [Google Scholar]
35. D. P. Fan, C. Gong, Y. Cao, B. Ren, M. M. Cheng et al., “Enhanced-alignment measure for binary foreground map evaluation,” arXiv preprint arXiv:1805, 10421, 2018. [Google Scholar]
36. V. Kailkhura, S. Aravindh, S. S. Jha and N. Jayanthi, “Ensemble learning-based approach for crack detection using CNN,” in 2020 4th Int. Conf. on Trends in Electronics and Informatics (ICOEI)(48184), India, pp. 808–815, 2020. [Google Scholar]
37. G. Wang, Y. Liu and J. Xiang, “A Two-stage algorithm of railway sleeper crack detection based on edge detection and CNN,” in 2020 Asia-Pacific Int. Symp. on Advanced Reliability and Maintenance Modeling (APARM), Canada, pp. 1–5, 2020. [Google Scholar]
38. H. Babajanian Bisheh, G. Ghodrati Amiri and E. Darvishan, “Ensemble classifiers and feature-based methods for structural damage assessment,” Shock and Vibration, vol. 2020, no. 8899487, pp. 14, 2020. [Google Scholar]
39. N. D. Hoang, “Detection of surface crack in building structures using image processing technique with an improved otsu method for image thresholding,” Advances in Civil Engineering, vol. 2018, no. 3924120, pp. 10, 2018. [Google Scholar]
Cite This Article
 Copyright © 2023 The Author(s). Published by Tech Science Press.
This work is licensed under a Creative Commons Attribution 4.0 International License , which permits unrestricted use, distribution, and reproduction in any medium, provided the original work is properly cited.
 Downloads
 Citation Tools