
 Submit a Paper
 Propose a Special lssue
 Open Access
ARTICLE

An Intelligent Approach for Accurate Prediction of Chronic Diseases
Mepco Schlenk Engineering College, Sivakasi, Tamilnadu, India
* Corresponding Author: S. Kavi Priya. Email:
Computer Systems Science and Engineering 2023, 46(2), 2571-2587. https://doi.org/10.32604/csse.2023.031761
Received 26 April 2022; Accepted 26 July 2022; Issue published 09 February 2023
 View Full Text
 Download PDF
Abstract
Around the globe, chronic diseases pose a serious hazard to healthcare communities. The majority of the deaths are due to chronic diseases, and it causes burdens across the world. Through analyzing healthcare data and extracting patterns healthcare administrators, victims, and healthcare communities will get an advantage if the diseases are early predicted. The majority of the existing works focused on increasing the accuracy of the techniques but didn’t concentrate on other performance measures. Thus, the proposed work improves the early detection of chronic disease and safeguards the lives of the patients by increasing the specificity and sensitivity of the classifiers along with the accuracy. The proposed work used a hybrid optimization algorithm called the Hybrid Gravitational Search algorithm and Particle Swarm Optimization algorithm (HGSAPSO) to upgrade the detection of chronic diseases. Existing classifier parameters with their optimized parameters are compared and evaluated. Classifiers such as Artificial Neural Network (ANN), Support Vector Machines (SVM), K-Nearest Neighbor (Knn), and Decision tree (DT) are used. Health care data are obtained from the UCI machine learning repository to evaluate the proposed work. The proposed work is assessed on 6 benchmark datasets and the performance metrics such as Accuracy, Specificity, Sensitivity, F-measure, Recall, and Precision are compared. The experimental results exhibit that the proposed work attains better accuracy on Artificial Neural Network-Hybrid Gravitational Search algorithm and Particle Swarm Optimization algorithm (ANN-HGSAPSO) classifier compared to other classifiers. ANN-HGSAPSO provides 93% accuracy for Chronic Kidney Disease (CKD), Cardio Vascular Disease (CVD) 96%, Diabetes 82%, Hepatitis 94%, Wisconsin Breast Cancer (WBC) 91%, and for Liver disease dataset 96%.Keywords
The usage of computers across various applications results in gathering a large amount of data. And this leads to discovering information from the massive collection of data. Therefore, data analytics plays an important role in processing these data [1]. Data analytics are the method of identifying, cleaning, modifying, or remodeling the data primarily to figure out useful information, draw conclusions, and make decisions from a large collection of data captured or stored in repositories [2]. This method is used in various sectors such as banking and finance, marketing, education, health care, business, etc. [3]. Researchers used data analytics in the medical industry to diagnose the disease early, track patient data, and provide on-time treatment [4]. Many machine learning algorithms are used to obtain useful information by analyzing the patterns in the extracted data [5]. Metaheuristic algorithms make use of heuristic knowledge to explore the optimal solution in a reasonable period. This kind of algorithm is majorly classified into single-solution-based and population-based algorithms [6]. Recently another type of optimization algorithm joined with this class is a Memetic algorithm (MA). This algorithm is a hybrid method comprised of an evolutionary algorithm and a general optimization algorithm [7]. Some population-based algorithms discover optimal solutions by enrolling search agents for specific problems to inspect the search space. These algorithms exhibit characteristics that impersonate some living organisms’ standard behavior in groups like animals, birds, insects, and others [8]. Examples are Particle Swarm Optimization, Ant Colony Optimization, Gray Wolf Optimization, Haris Hawks Optimization, Salp Swarm Optimization Algorithm, and FireFly optimization Algorithm [9]. Whereas some optimization algorithms got inspiration from nature, such as physics-based algorithms and they are utterly dependent on the physics laws [10]. In the proposed work, the HGSAPSO algorithm is used to diagnose and predict various diseases by optimizing the classifiers’ parameters. The classifier’s parameters are optimized to enhance the accuracy, sensitivity, and specificity of the classifier. By combining the proposed optimization algorithm with the traditional classification algorithm, the classifiers’ performance has improved. The proposed work focused on hybrid optimization algorithms, namely Hybrid Gravitational Search Algorithm Particle Swarm Optimization. The parameters of six classifiers such as Simple Vector Machine, Naïve Bayes, Logistic Regression, Multiple Perceptron, Decision Tree, and k-nearest neighbor. The proposed model is evaluated in 5 benchmark datasets, such as Chronic Kidney Disease (CKD), Heart Disease, Diabetes, Hepatitis, Cancer disease, and Indian Liver Patient Disease (ILPD), to manifest the efficacy of the hybrid optimization algorithm. Based on the results, it has been shown that the proposed algorithm performs finer than individual or ensemble classifiers to classify the disease.
The remaining section of this paper is organized as follows. Section 2 describes the literature survey of the existing algorithms. Section 3 describes the features of the six classifiers with optimization algorithms utilized for parameter optimization. Section 4 describes the working of the proposed hybrid model for diagnosing disease. Section 5 summarizes the performance of the model tested over 5 datasets and the results attained, and Section 8 concludes the paper.
Alizadehsani et al. analyzed various machine learning techniques to detect cardiovascular disease [11]. Machine learning algorithms such as Artificial Neural Network, Decision Tree, Support Vector Machine, Naïve Bayes, and k-nearest neighbor are majorly used in detecting heart diseases. Cho et al. [12] diagnoses mental illness using a Support Vector Machine, Gradient Boosting Machine, Random Forest, k-nearest neighbor, and Naïve Bayes. Govindarajan et al. [13] to classify the strokes, machine learning algorithms are used. In this paper, the data are mined from the patient’s case sheets with the help of tagging and maximum entropy methodologies. Yuliang et al. [14] used artificial intelligence in diagnosing diseases at an early stage. Thus Ayon et al. used a deep learning model to predict diabetes [15]. In this work, 4 hidden neural networks are used, and the number of neurons used is 12, 14, and 16. The results explore that the deep learning technique works well than the traditional machine learning techniques. Wang et al. [16] used the Recurrent Neural Network combined with Long Term Short Memory to analyze as well as predict multiple diseases and their future risks. Long-Term Short Memory works better than Recurrent Neural Network and Gated Recurrent Unit. Shankar et al. [17] used modified grey wolf optimization to extract the features and used Multi kernel Support Vector Machine to predict thyroid disease. They classify thyroid disease as hyperthyroid or hypothyroid. To improve the classification performance, Alzubi et al. [18] used a boosted weighted optimized neural network ensemble classification algorithm. Initially, they select the features using the Newton-Raphson Maximum Likelihood Minimum Redundancy model and classified them using an ensemble classification algorithm that combines all the weak classifiers using majority voting. Results exploit that the model achieves a reasonable false positive rate, high accuracy, and minimum delay. The multi-objective artificial bee colony algorithm is used by Zhang et al. [19] to reduce the cost incurred by specific features. This approach consists of 2 operators to reduce the features and 2 archives to improve the search space. This algorithm is compared with 2 machine learning algorithms and 3 multi-objective models. This technique is cost-sensitive among other algorithms. The authors of Wang et al. [20] designed Multi Attention Interaction Enhancement (MAIE) module to detect COVID-19 in X-ray images. It is simple to use and required low equipment, but it will result in deviation and overfitting. Gui et al. [21] proposed a deep learning technique namely the convolutional DNN model to edit the image. Though it is more accurate if the training data varied the model has to train every instance of the training data. The authors of [22] proposed the Dense-MobileNet model to classify the images. This Dense-MobileNet model exhibits higher accuracy compared to another MobileNet model. Zhou et al. in [23] used Local Binary Pattern (LBP) and Local Phase Quantization (LPQ) to recognize faces. It uses the Gabor filter to extract the LBP and LPQ features. In [24] the noise in Electro Cardio Gram is removed by using Empirical Mode Decomposition. By removing the signals in ECG, the diagnosis of the disease is improved. To improve the editing performance of the images, the authors in [25] proposed a bilateral grid technique. In [26] by using the Prediction Unit mode decision algorithm CU size is predicted to execute fast in High-Efficiency Video Coding (HVAC). To detect Covid-19 and Pneumonia Zhang et al. [27] proposed Convolutional Neural Network (CNN) in X-Ray images, LightEfficientNetV2 provides better results compared to the traditional machine learning models but the proposed model has fewer parameters. In the paper [28] Covid-19 is diagnosed using a finite element model to build a deformation model of the lung images. The proposed model increases the accuracy and decreases the complexity.
The existing techniques show that there is an abundance of machine learning classifiers and ensemble algorithms. But the results manifest that the individual algorithms didn’t attain high performance for various datasets. The classifier’s performance has to be improved so that it can be able to classify or predict the diseases efficiently. Thus, the proposed work focuses on the hybrid system, which delivers global performance for different disease datasets. The classifier’s performance is improved by optimizing its parameters using Hybrid Gravitational Search Algorithm-Particle Swarm Optimization, and they are described in the following section.
3 Problem Formulation Using Multi-objective Optimization
This paper dealt with the classification of diseases from various datasets utilizing hybrid optimization techniques. This hybrid technique optimizes the parameters of machine learning algorithms like Decision Tree, Support Vector Machine, Artificial Neuron Network, and k-Nearest Neighbor to increase the classification performance. The objective function considered for optimization cover accuracy, specificity, and sensitivity. Each of the objective functions expresses a specific kind of quality to predict the disease. The measures are calculated by computing true positive, true negative, false positive, and false negative. The terms can be expressed as follows (1) True Positive (TP) indicates the sum of positive classes that are rightly positively classified. (2) False positive (FP) indicates the sum of negative classes that are wrongly positively classified. (3) True Negative (TN) indicates the sum of negative classes that are rightly negatively classified (4) False Negative (FN) indicates the sum of positive classes that are wrongly negatively classified. Two random variables are defined to compute these terms, and the terms are described as
where P+ represents the positive class label and N- represents the negative class label. ALi represents the actual class label of the ith instances, and PLi represents the predicted class label. The total value of all the random values must be equal to 1 at any point in time. By considering these terms the performance metrics of the classifiers are calculated. Consider the binary classifier used to classify the disease, and the datasets consist of x1 positive and x2 negative instances the terms True Positive (TP), True Negative (TN), False Positive (FP) and False Negative (FN) can be computed as,
In the proposed work, multi-objective optimization algorithm is considered. The optimal values of classifier parameters can be achieved by attaining maxima values of Accuracy, Sensitivity, and Specificity. While taking different datasets, the values of accuracy may have the same values, but specificity and sensitivity may have different values. Therefore, tradeoff will be needed. The issues in multi-objective optimization can be overcome by transforming the principal objective function into a single or non-linear objective function. It can be resolved by determining Pareto fronts using non-dominance [2].
Optimization Algorithms
This segment explores two optimization algorithms such as Gravitational Search Algorithm (GSA) and Particle Swarm Optimization Algorithm (PSO) in brief.
3.1 Gravitational Search Algorithm
Gravitational Search Algorithm (GSA) is a kind of metaheuristic algorithm proposed by Rashedi et al. [1], and it was majorly inspired from Newton’s law. Search agents act as the part of instances, and the performance values are considered as the masses of the instances. The instances can draw each other because of the gravitational force, and it thrust thinner onto thicker. The thicker instances are considered as optimal results may thrust slowly compared to the lighter objects. Let us take n search agents with d dimensions. The location of the ith agent can be represented as a vector Vi.
and the values of xi are the location of the agents in the corresponding dimensions. For example,
where Mi (t) and
In every iteration, agents switch their position to explore the undiscovered regions in the search space. Thus, to search for the new position, the agents add their current position with its succeeding velocity.
where vi(t + 1) can be computed by finding the acceleration of the object.
where u is the random variable lies in the range of 0 to 1. On the basis of Newton’s law, the acceleration of the object can be computed by dividing the gravitational force acting on the objects and the mass of the object.
where r is a constant, and the values are randomly assigned (0 to 1). GFij(t) is the Gravitational Force acting on the agents.
where D represents the distance between two objects. g(t) represents the gravitational constant, and as time increases, the value of g will be decreased.
3.2 Particle Swarm Optimization (PSO)
Dr. Russel Eberhart and Dr. James Kennedy proposed a population-based metaheuristic optimization algorithm majorly inspired by the insects or birds forming swarms [29]. The main aim of PSO is to move the particle such that the particle attained the optimal value. In PSO, the instances are randomly configured, and they are individuals of the population. Pid and Vid represent the location and the velocity of the instances. After initialization, the value of the fitness function is calculated and the values of pBest and gBest are determined. Based on these values, the particle’s location and the velocity are updated, and the algorithm undergoes several iterations. The velocity updation is formulated in Eq. (22).
where Vyi (t) is the velocity of the particle i at a time t. The current location of the particle is indicated by pSi(t). pB (t) and gB (t), and it describe the Personal Best and the Global Best values, respectively. Personal Best represents the best value attained by the sole particle, and the Global Best represents the total best value attained by all the particles at a particular time t. W represents the inertia weight used to control pBest, and gBest & rnd1 and rnd2 represent the random values [0, 1].
Eq. (23) is used to update the position of the particle
4 Hybrid Systems for Predicting Chronic Diseases
To diagnose the disease, the data is collected from many patients and analyzed. In the existing works, single classifiers and ensemble classifiers are proposed to predict the disease.
In the proposed work hybrid system of classification techniques and optimization algorithms are presented. Normally, a small number of hybrid systems are focused on optimizing the classifiers’ parameters [30]. Though their hypothesis is different for different applications. Fig. 2 depicts the architecture diagram of chronic disease prediction. Initially, the data is split into training data and testing data. In the training phase, the data is pre-processed and the optimization algorithm HGSAPSO is applied to train the data. In the testing phase, the data is pre-processed and the HGSAPSO algorithm is applied to test the data whether it predicts the results correctly or not.
The classifier’s performance is majorly based on three aspects such as the classification technique, information about the data (number of instances considered for training and testing set, standard deviation, size of the training and testing set, entropy, etc.), and the parameters of the classification technique (degree of the polynomial kernel, regularization parameter, momentum, activation functions, splitting criteria, etc.). In this work, the classifier performance is improved by optimizing the classifiers’ parameters using an optimization algorithm. Fig. 1 depicts the flow chart of the HGSAPSO describing the actions to diagnose the disease. Four classifiers, such as SVM, ANN, DT, and knn, are used to diagnose the disease. The classifier parameters are optimized using GSA, PSO, and HGSAPSO to maximize the classifiers’ capacity in Performance, Specificity, and Specificity. Otherwise, it can be explained that the goal is to achieve these three objectives. In the preprocessing step, the missing data are handled by normalizing the dataset. Min-max normalization is used to fill the missing data in the features. By doing so, the training time of the classifiers gets reduced. After preprocessing, classifiers such as SVM, ANN, DT, and knn are employed to classify the data. The parameters chosen for SVM are cost, MLP learning rate, and momentum. For knn, the k value is chosen. Also, for the decision tree, minimum cases for the best solution and the confidence factor are chosen. These parameters (parameter cost, learning rate, momentum, k value, minimum cases for the best solution, confidence factor) are assigned between the ranges of 0 to 1. Then the optimization algorithms, namely GSA, PSO, and HGSAPSO, are employed to discover the classifiers’ optimal values based on the three objectives: accuracy, specificity, and sensitivity. The results of the HGSAPSO are then compared with the traditional classifiers. In this hybrid system, the population of the optimization algorithm depends upon the parameters of the classifiers. When implementing an optimization algorithm, the fitness value is determined by assigning the classifiers’ performance values calculated in the previous step. Optimal values of the classifiers are attained by executing optimization algorithms and comparing their performances with their fitness values. The classifiers are combined with optimization algorithms and these four hybrid algorithms are validated on six datasets.
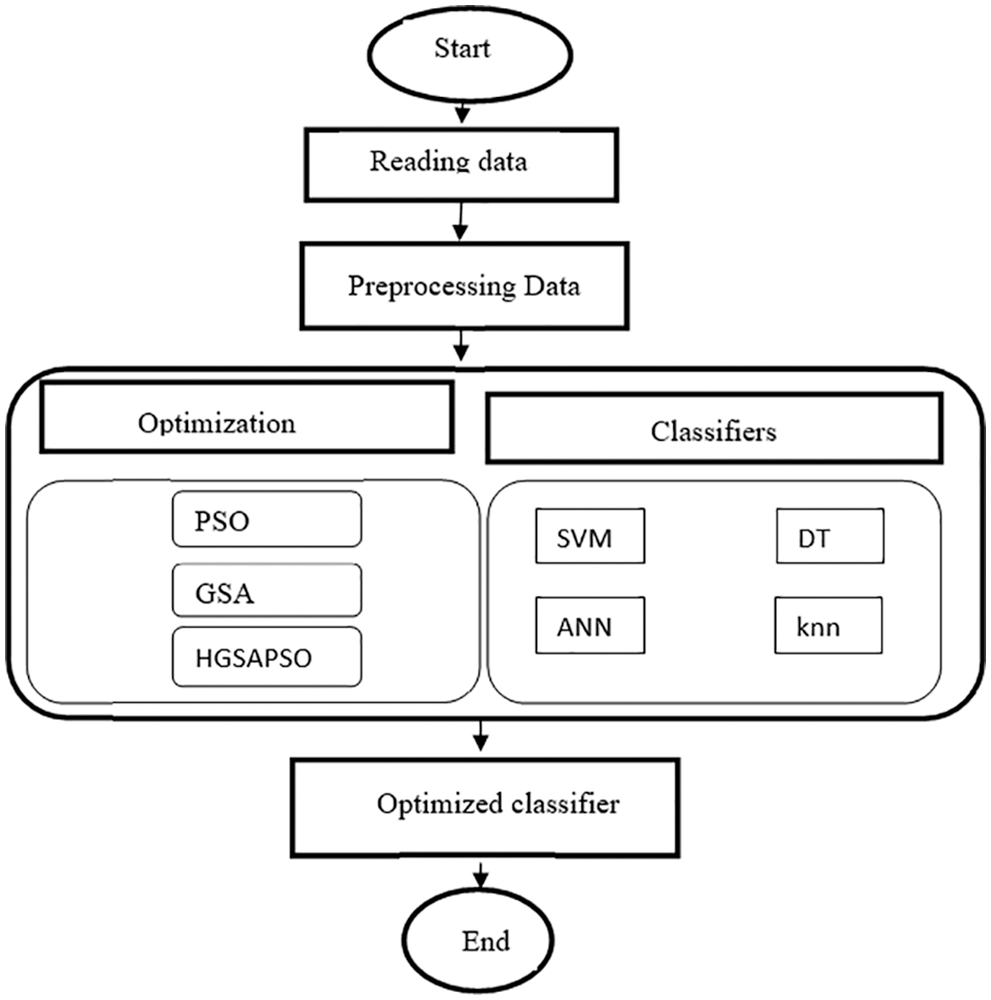
Figure 1: Flow chart of HGSAPSO
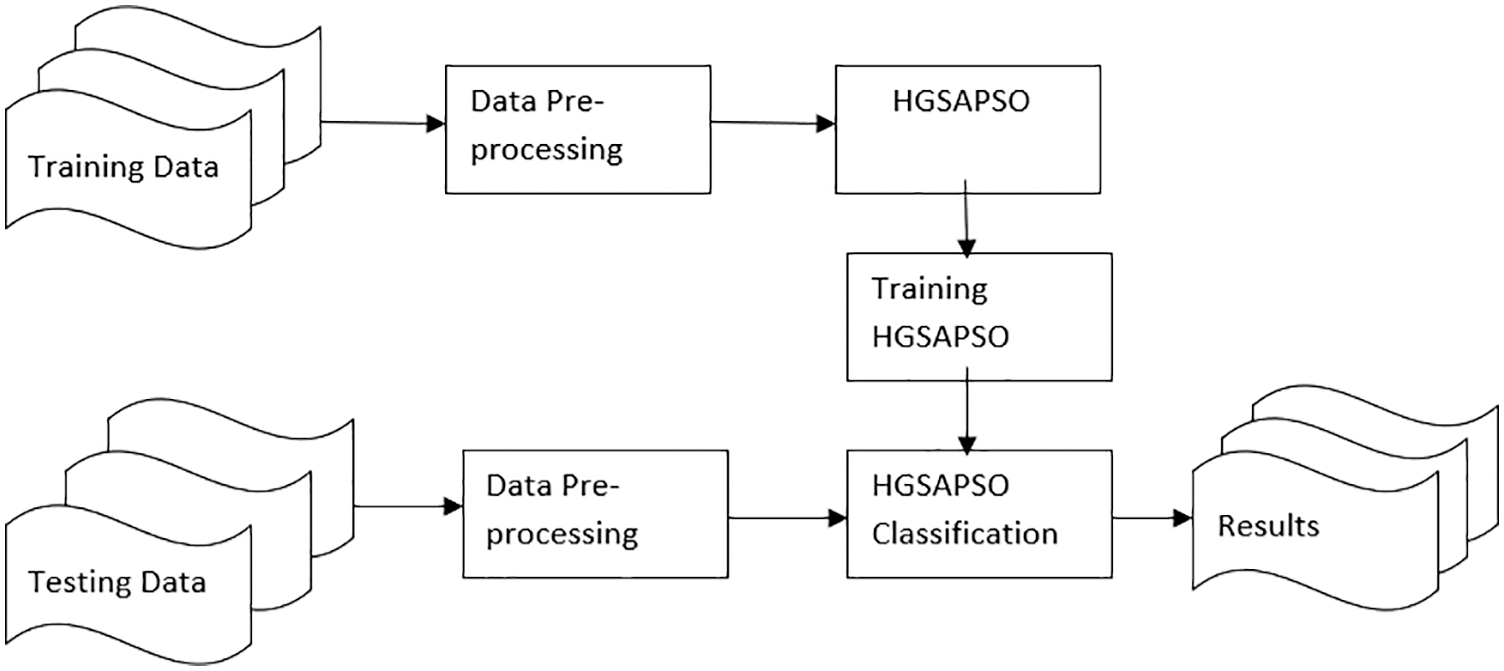
Figure 2: Architecture diagram for predicting the chronic diseases
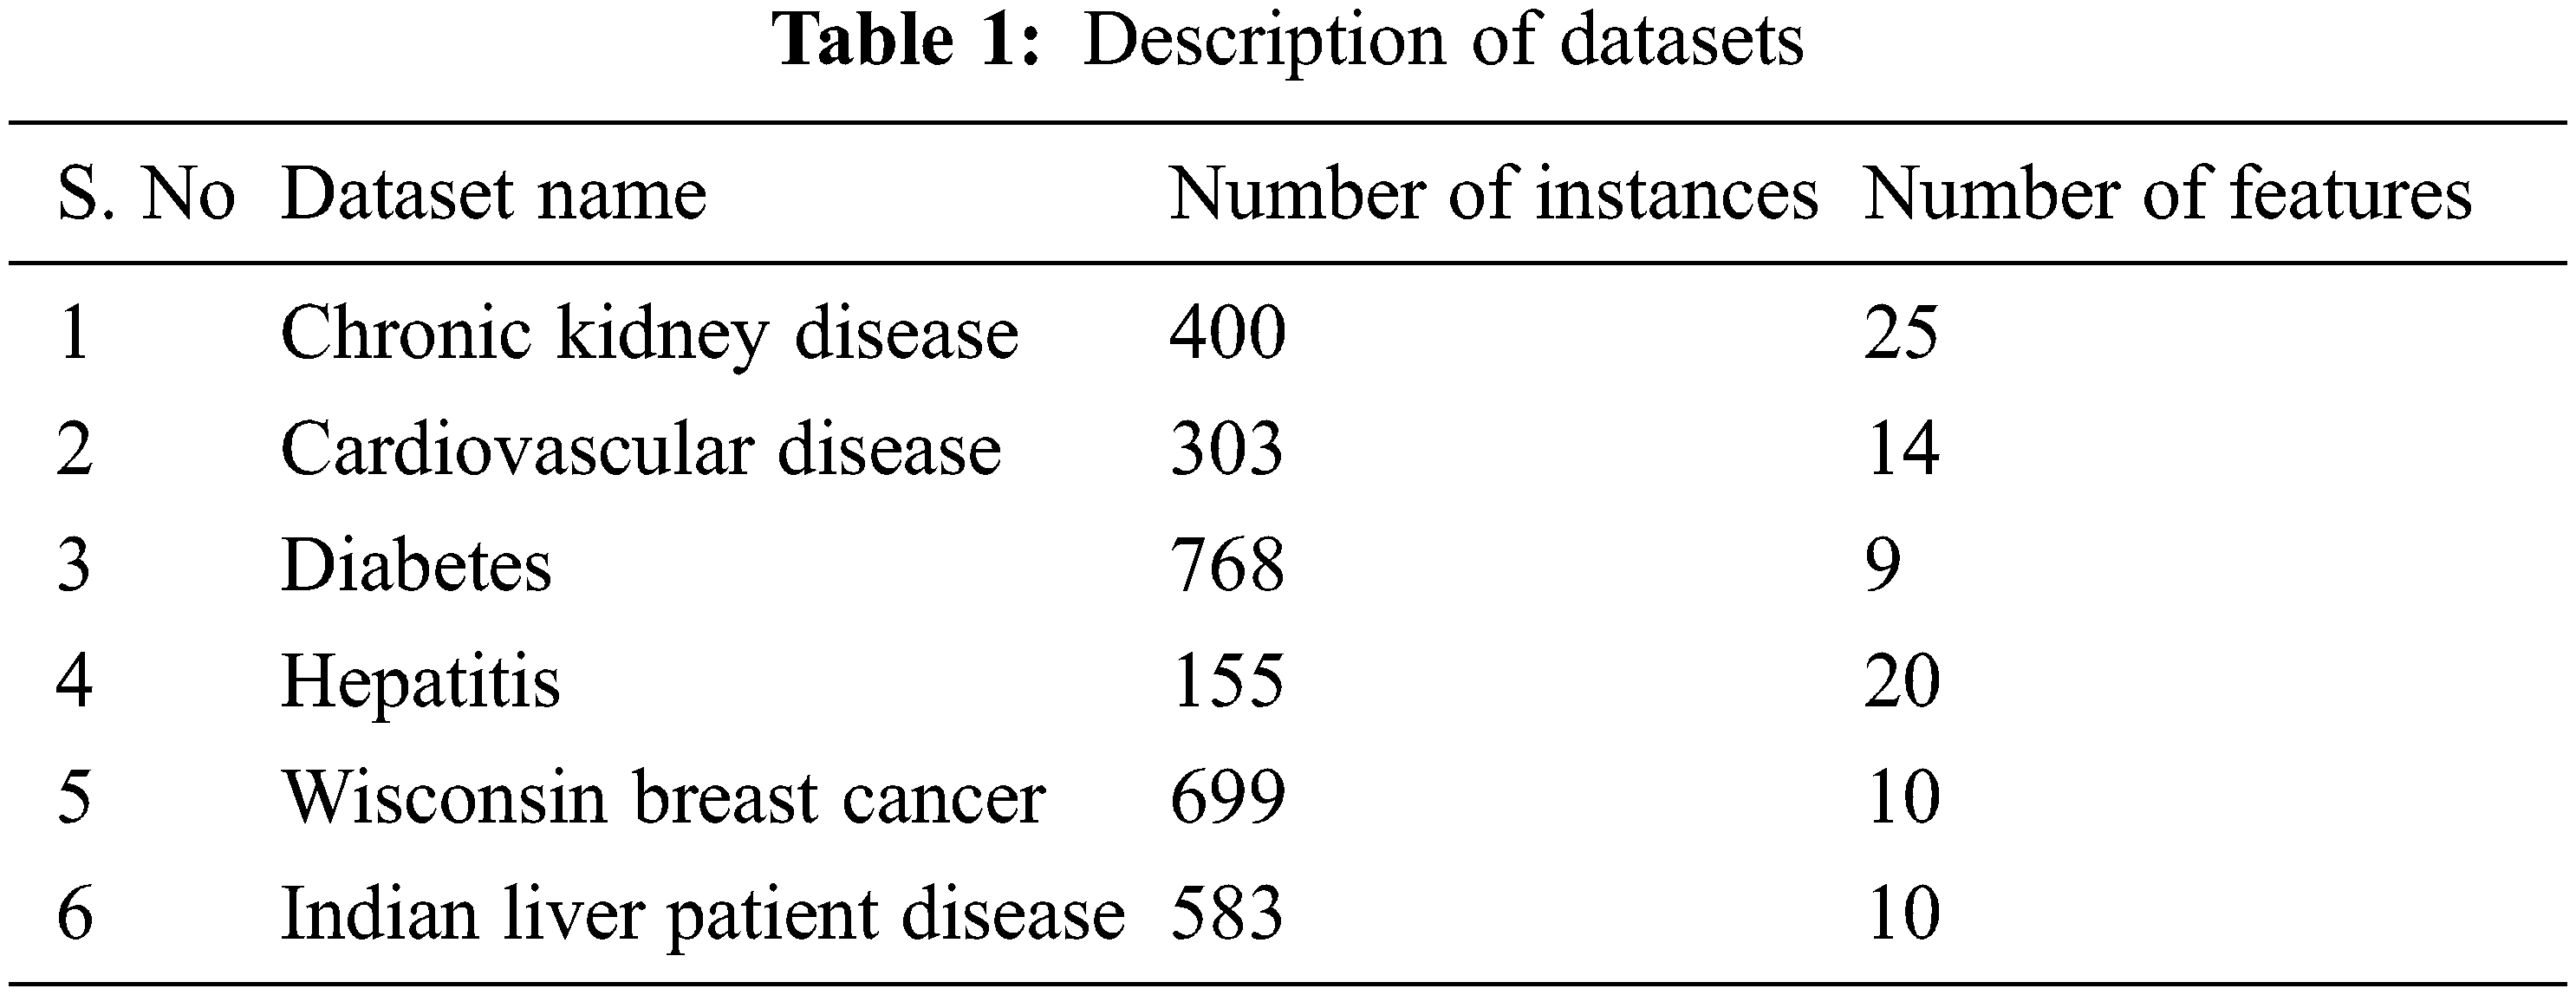
Six medical datasets such as CKD (Chronic Kidney Disease), Cardiovascular Disease (CVD), Diabetes, Hepatitis disease, Wisconsin Breast Cancer disease, and ILPD (Indian Liver Patient disease) are considered to assess the performance of the HGSAPSO. These datasets are taken from the UCI machine learning repository, and the datasets are described in Tab. 1.
The optimization algorithms GSA, PSO, and GSA-PSO, are applied to each dataset for 50 iterations, and each iteration agent considered is 20. The dataset is split into a training set, and a testing set and the algorithm’s performance is validated by applying the 10-fold cross-validation method. The individual classifiers are compared with the hybrid algorithms.
5.1.1 Artificial Neural Network (ANN)
ANN is one of the majorly manipulated neural network. This feed-forward artificial neural network consists of many layers. It is a non-linear classification technique. Each node in the layer is depicted as a neuron that processes the input features and transforms them into output by applying the activation function. The activation function is represented as f(vi), and the processed output is depicted as in the following Eq. (16).
where v is the input to the intermediate layer, which calculates the weighted sum of input along with its bias.
where wi is the weights randomly assigned and Bi is the bias. The most commonly used activation function by the ANN is the sigmoid function and they are described as follows in Eq. (18).
The artificial neural network is trained by employing a backpropagation technique (BPT). The back propagation technique is mainly used to update the weights such that the error in the classifier becomes minimum. The weights are updated according to the following Eq. (19)
where η represents the learning rate, and α represents the momentum and these parameters are optimized using an optimization algorithm. To overcome the possibility of attaining local minima in the back propagation technique, the learning rate and the momentum are optimized.
5.1.2 Support Vector Machines (SVM)
SVM is one of the supervised machine learning classifiers mainly used in binary classifications. It is widely used for classification and regression analysis [31]. According to this technique, the training data are taken as instance-value pairs (Ai, Bi). Normally SVM tries to find an optimal hyperplane that separates the positive and negative classes, and the hyperplane is represented as follows.
where wt represents the weight, x represents input instances, and Θ represents the value of bias. Two hyper planes are developed for positive classes and negative classes, and it is formulated as follows
The classification is done on the hyper planes formed. The soft margin classifier thus formed is represented as
Subject to the constraint
In this, parameter C, which is the cost parameter, is optimized using the optimization algorithm.
K nearest neighbor, majorly known as knn, is a simple classification algorithm that saves all the training data instances and classifies future instances based on similarity measures [32].
where i1 and i2 are the two instances; thus, knn has only one parameter, i.e., k. If k is assigned to 1, then the instance is assigned to its nearest neighbor’s class. And the values of k impact majorly the accuracy of the classifier. Thus, it has to be optimized using the optimization algorithm.
5.1.4 Decision Tree Classifier
The decision tree is one of the classification models that can deal with complex problems by providing perspicuous solutions [33]. The information gain is computed by calculating the entropy of the classes and the features, and the Gain ratio is formulated as
This Eq. (24) computes the information gain ratio for the attribute F relative to the collection of examples D. Values (F) depicts the probable values for the attributes F and Di is the subgroup of D in which the feature has values i. Entropy (D) is the entropy value of the dataset D, and the 2nd term in the Equation describes the expected entropy value after the dataset D is splitted based on the features. The expected entropy can be calculated by taking the sum of the entropies of Di weighed by the fraction of instances
For C5.0, two parameters are considered for optimization. Minimum cases for the best solution and the confidence factor are the two parameters optimized using PSO, GSA, and ACO.
The performance comparison of four classifiers such as SVM, ANN, DT and knn and HGSAPSO on Chronic Kidney Dataset is shown in Fig. 3. HGSAPSO exploits better results compared with PSO and GSA. In SVM, ANN, and knn technique, the GSA optimization algorithm performs better than PSO, whereas, in the DT technique, PSO performs better than GSA. Hybrid GSA-PSO achieves majorly 83% to 93% in all machine learning techniques.
Figure 3: Performance measures of HGSAPSO on CKD dataset
The performance comparison of four classifiers such as SVM, ANN, DT and knn and HGSAPSO on Cardiovascular Disease Dataset is shown in Fig. 4. In SVM, ANN, and DT technique, the traditional machine learning algorithm performs more or less equally with the optimization algorithm. Still, in ANN, the accuracy attained 96% whereas, in the knn technique, there is a tremendous increase in the machine learning algorithm’s performance when optimizing with GSA and PSO after optimization accuracy increases from 79% to 86% when applying HGSAPSO.
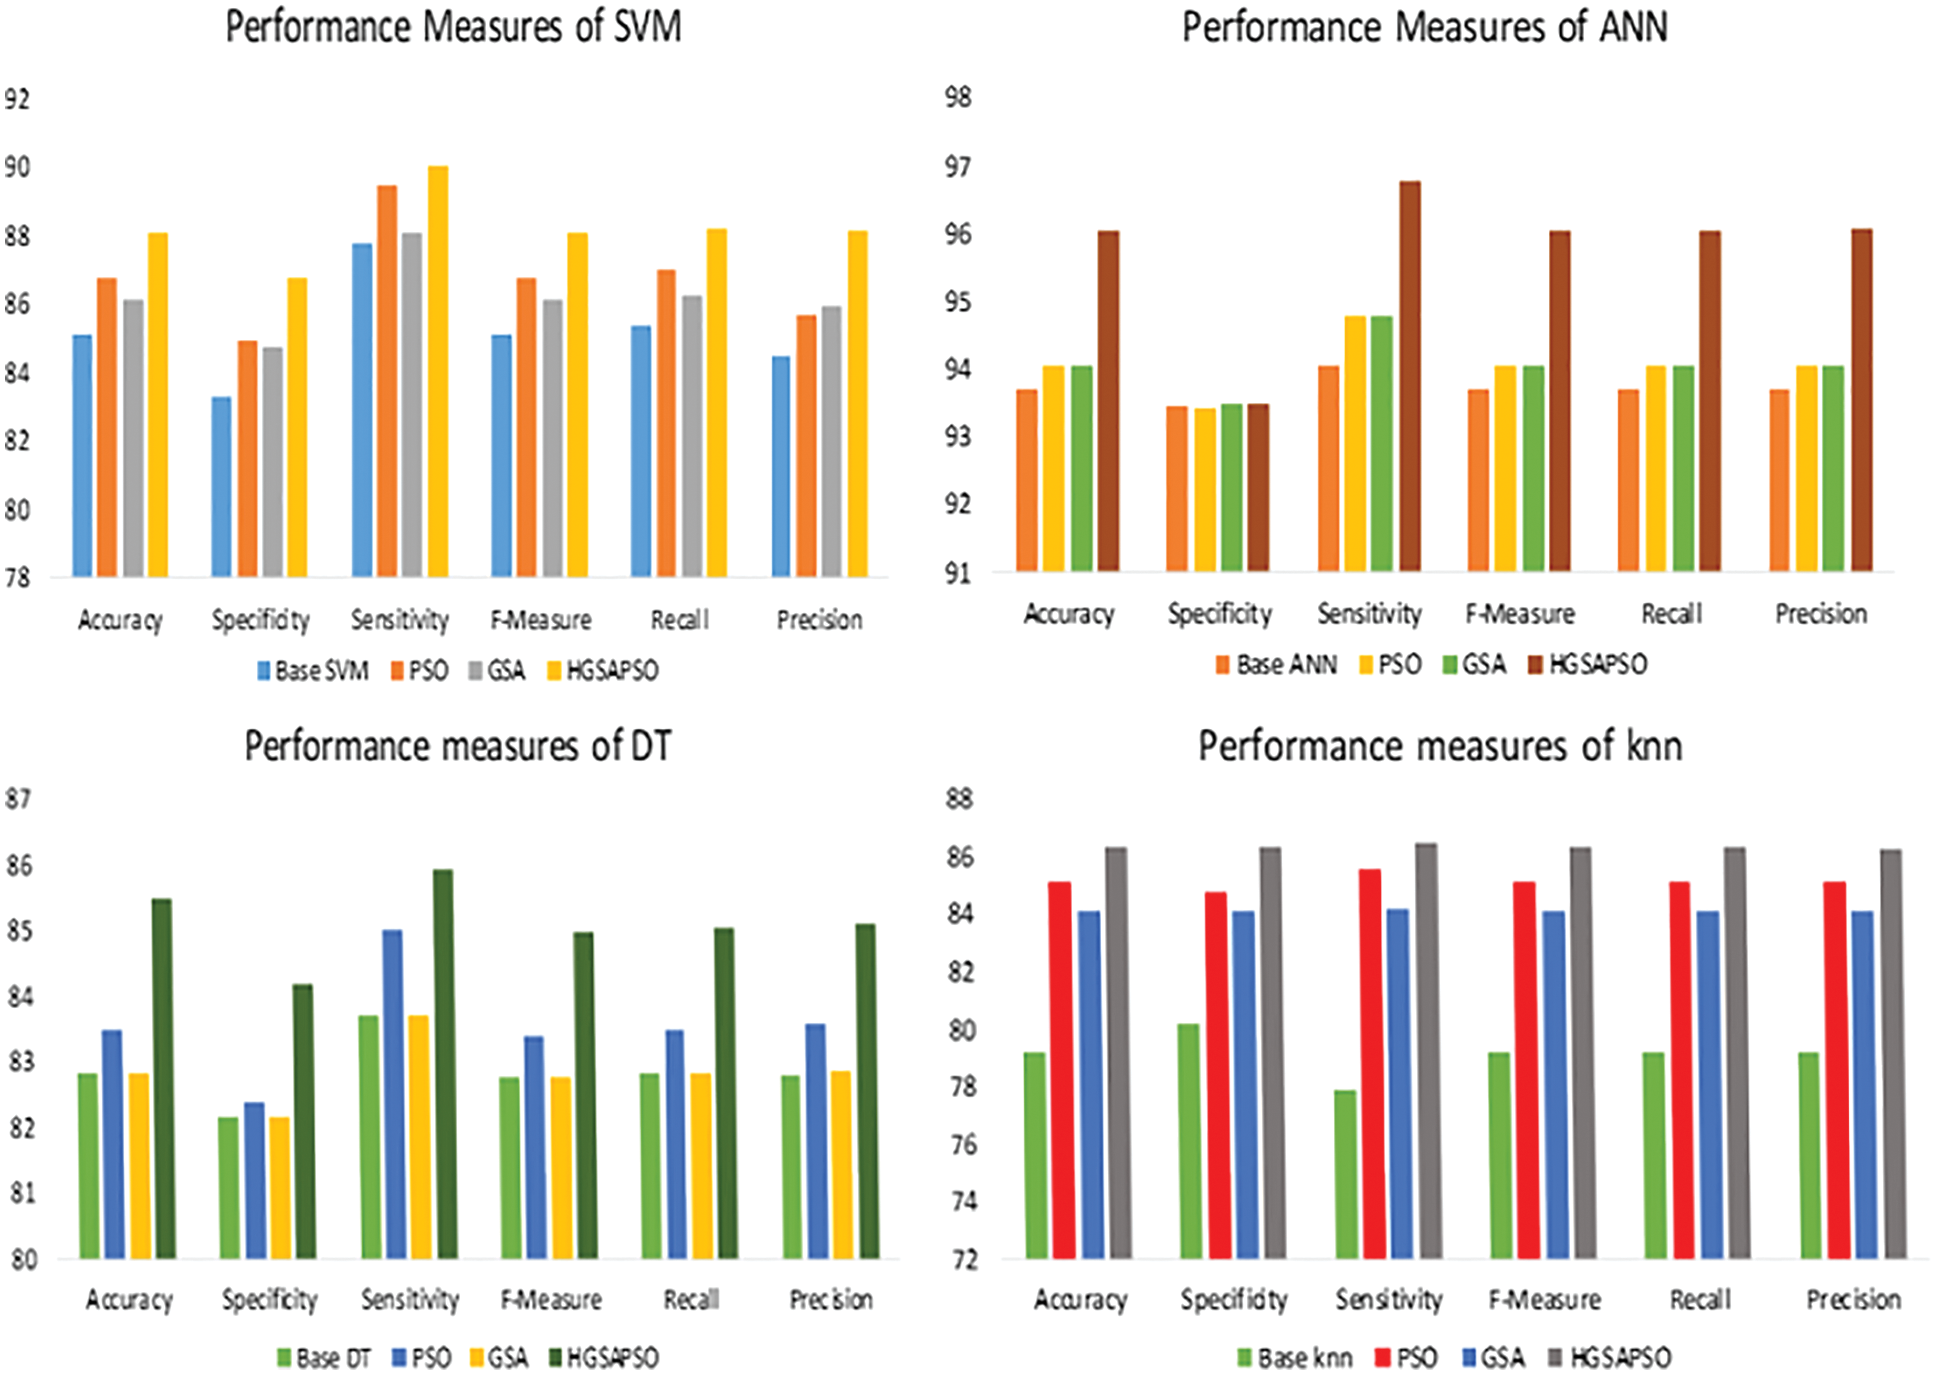
Figure 4: Performance measures of HGSAPSO on CVD dataset
The performance comparison of four classifiers such as SVM, ANN, DT and knn and HGSAPSO on Diabetes Dataset is shown in Fig. 5. The traditional machine learning techniques achieve accuracy in the range of 70%. After optimization, the performance has improved from 70% to 82%. The hybrid model attained more significant performance measures in terms of accuracy, sensitivity, specificity, F-measure, and recall precision are compared with PSO and GSA. Comparing GSA and PSO, the performance measure of GSA is greater than PSO. Among all the techniques, ANN achieves 82% in HGSAPSO. From the graph it is shown that the HGSAPSO model achieves most significant performance measures compared to traditional machine learning models.
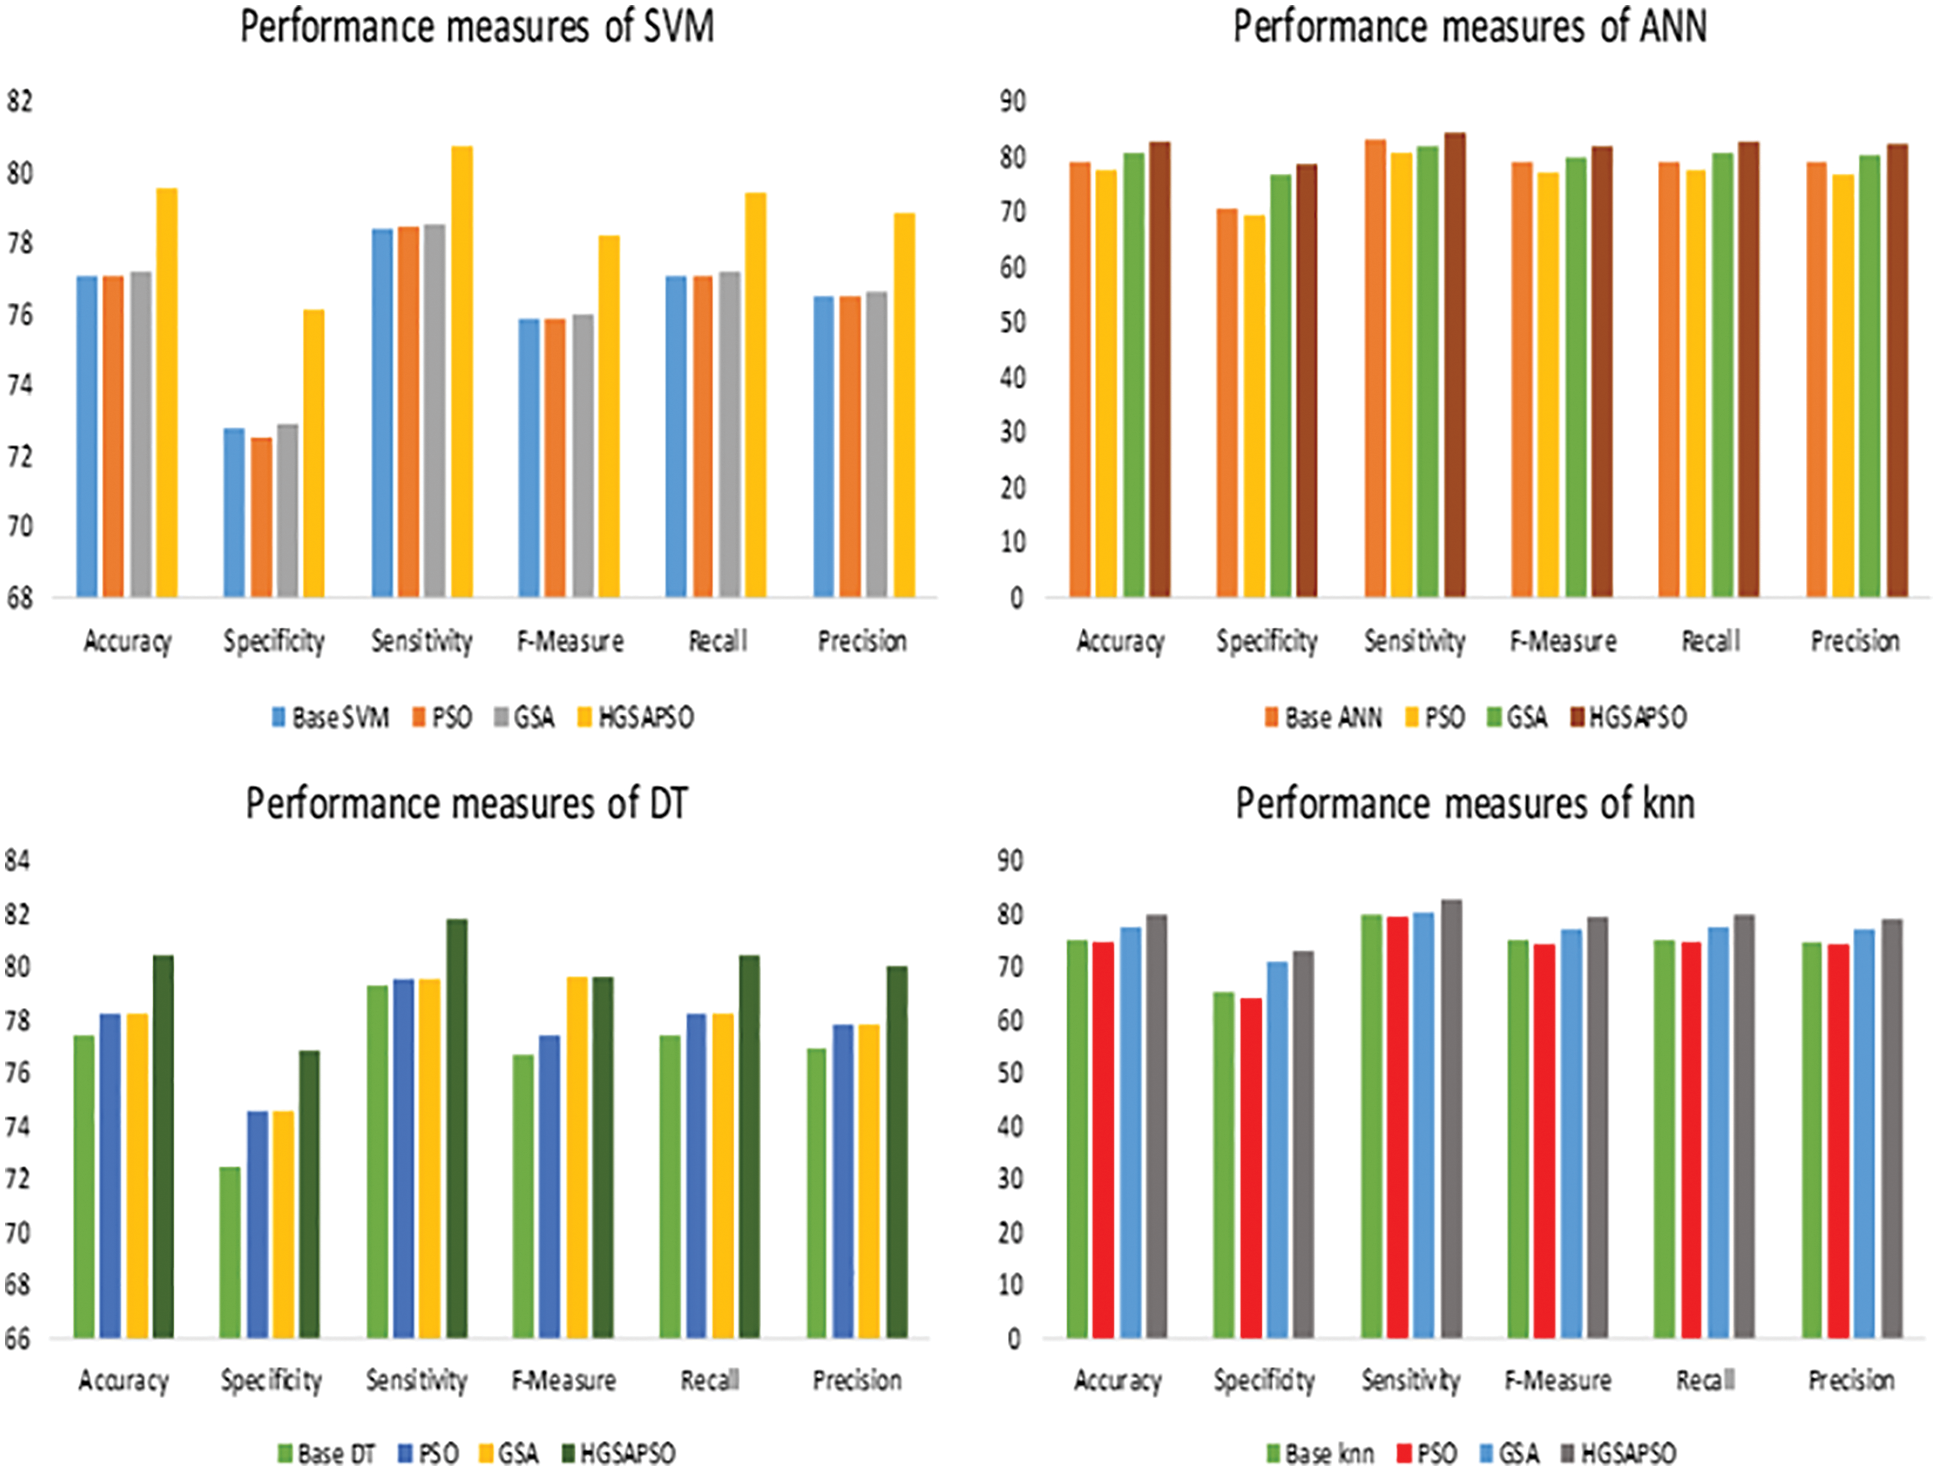
Figure 5: Performance measures of HGSAPSO on diabetes dataset
The performance comparison of four classifiers such as SVM, ANN, DT and knn and the HGSAPSO on Hepatitis Dataset is shown in Fig. 6. Among all the techniques, the ANN technique achieves higher accuracy compared to other techniques. It reaches 94% after optimizing its parameter using HGSAPSO. The least accuracy is attained by knn in this dataset, and it achieves 87%. While comparing PSO and GSA in all the techniques, GSA and PSO techniques achieve approximately equal performances. But the hybrid GSAPSO achieves greater performance than individual GSA and PSO.
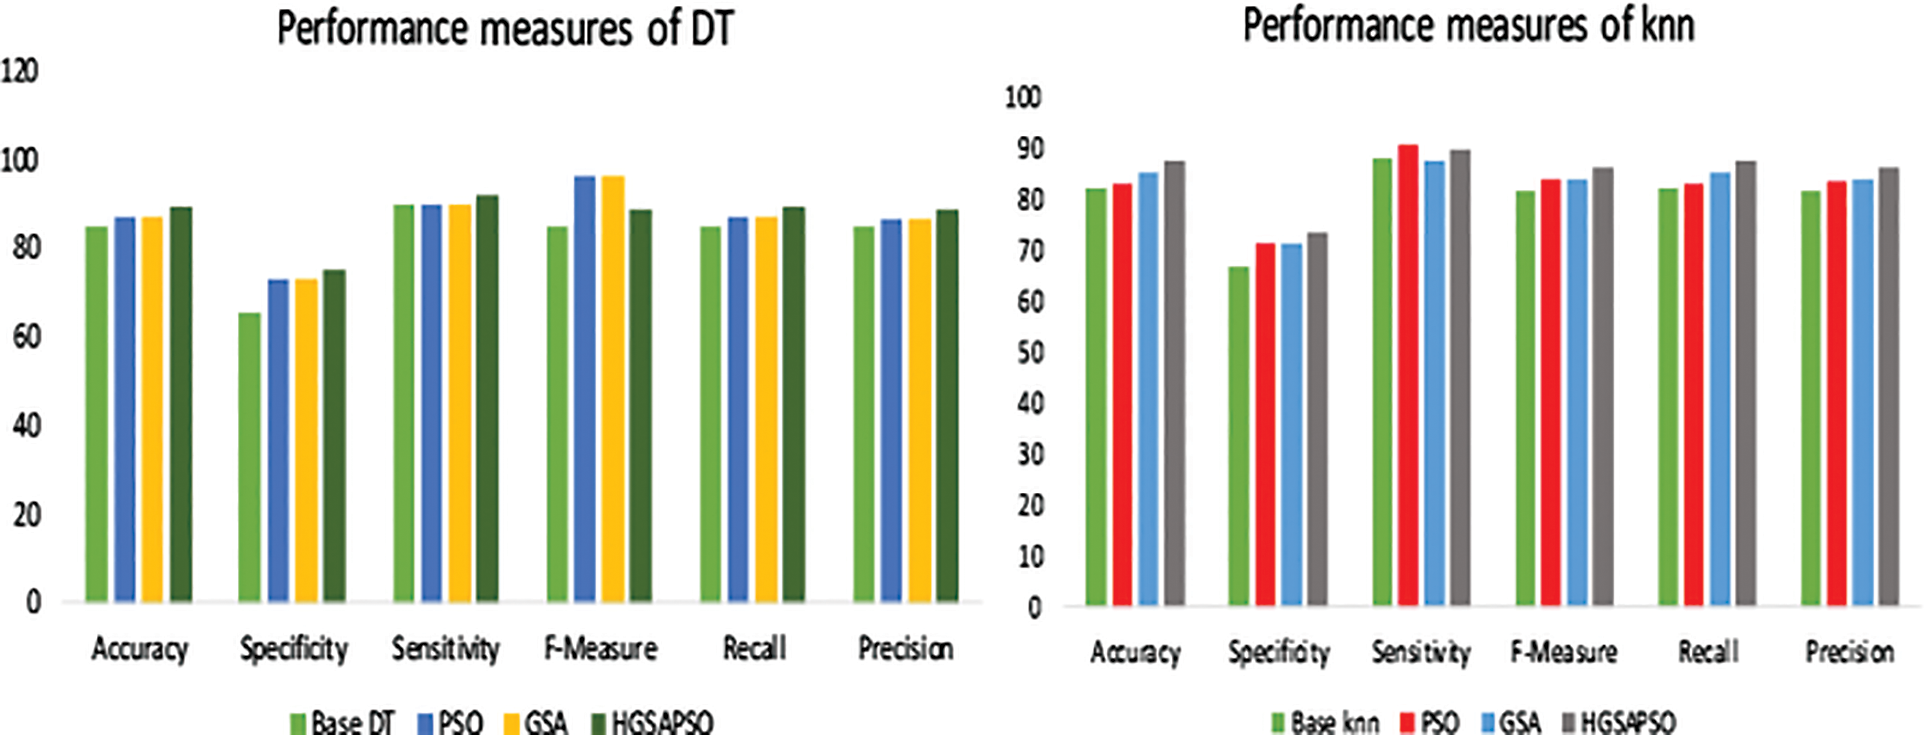
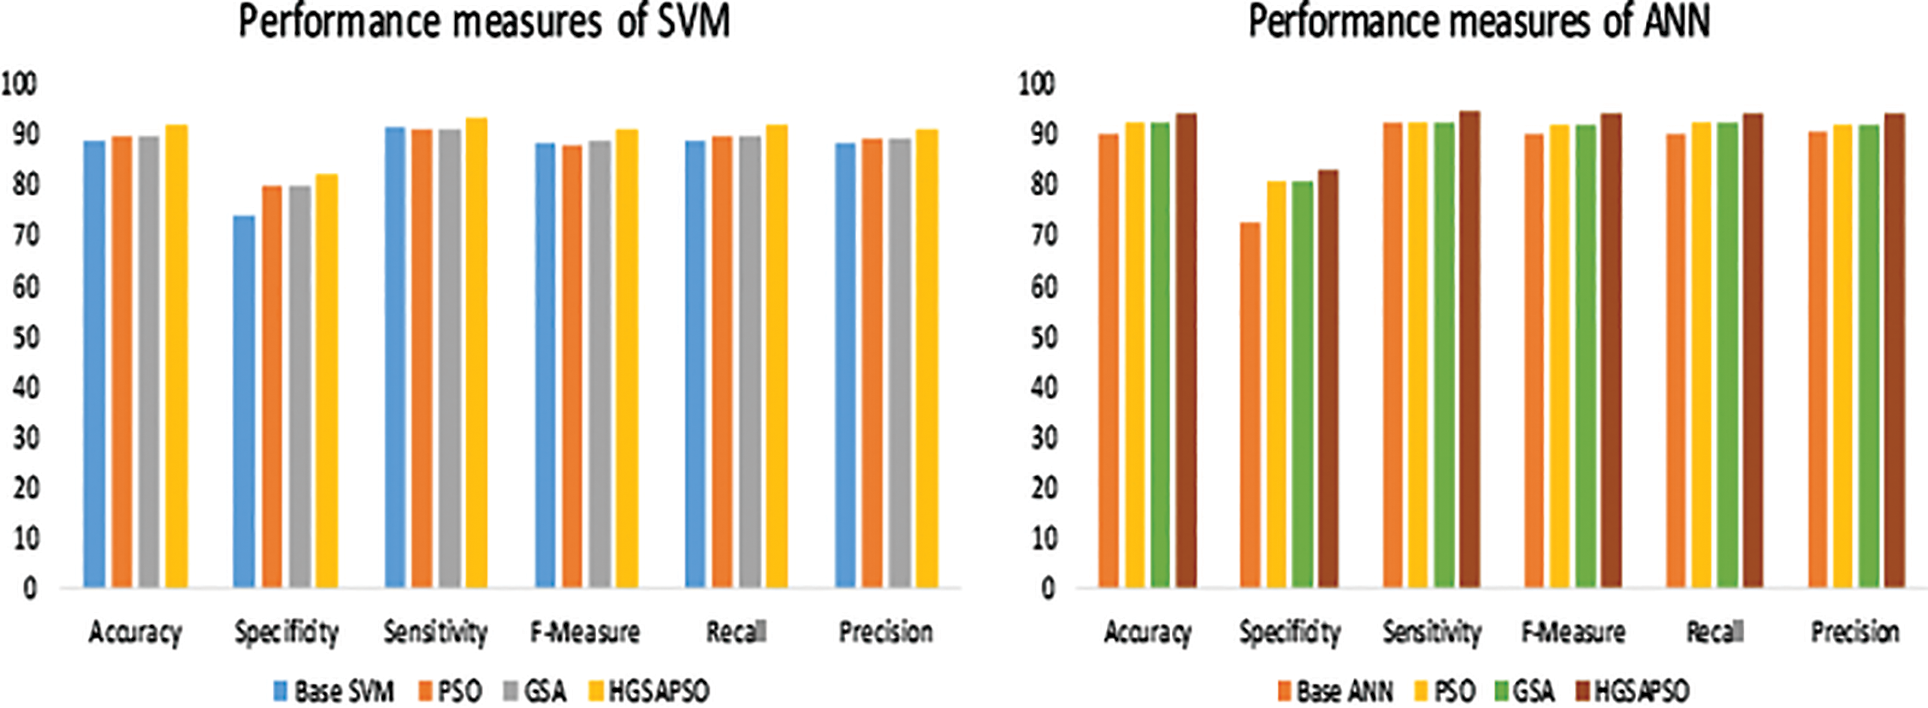
Figure 6: Performance measures of hepatitis dataset
The performance comparison of four classifiers such as SVM, ANN, DT and knn and the HGSAPSO on Wisconsin Breast Cancer Dataset is shown in Fig. 7. In this dataset, the ANN technique achieves higher accuracy than SVM, DT, and ANN techniques. After applying HGSAPSO ANN achiever higher accuracy of 91%. DT technique attains the lowest accuracy of 88% in this hepatitis dataset. While comparing PSO and GSA in all the techniques, GSA and PSO techniques achieve approximately equal performances. But the hybrid GSAPSO achieves greater performance than individual GSA and PSO, roughly in the range of 89%.
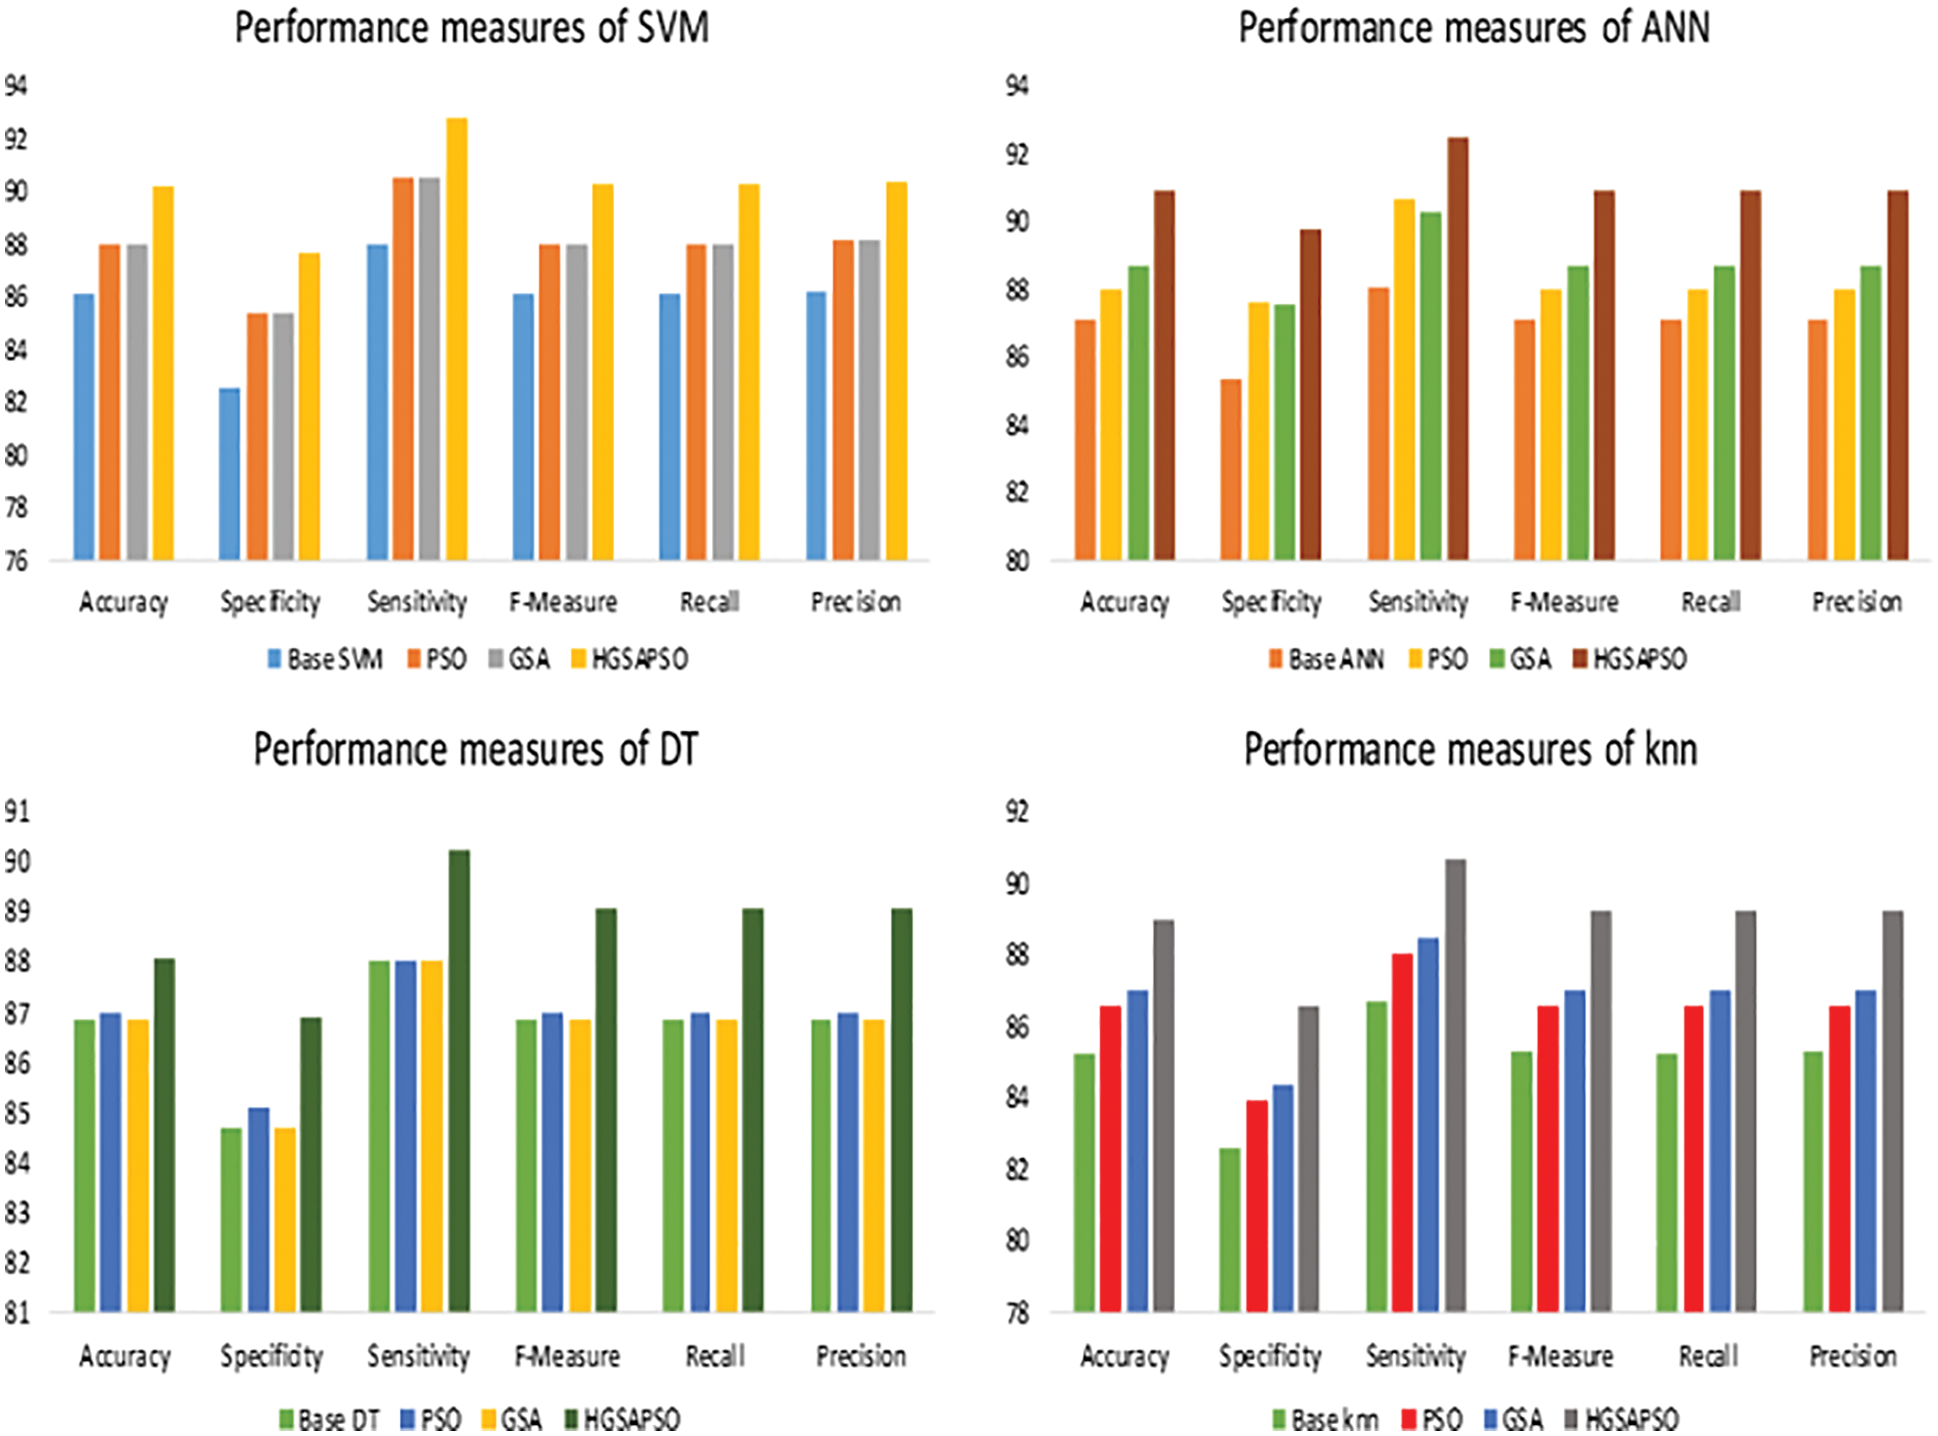
Figure 7: Performance measures of WBC dataset
The performance comparison of four classifiers such as SVM, ANN, DT and knn and the HGSAPSO on Liver Disease Dataset is shown in Fig. 8. Among all the datasets, the Indian Liver Patient has the lowest performance measure in the range of 60% to 70%. After optimization, the performance measure has improved to 75%. Both ANN and knn technique achieves higher accuracy compared to SVM, DT techniques. After applying HGSAPSO, ANN achiever higher accuracy of 76% and knn attains 75% accuracy. There is a tremendous increase in the ANN technique after using HGSAPSO.SVM technique reaches the lowest accuracy of 69%. While comparing GSA and PSO in the DT technique, PSO performs well than GSA, and in contrast, SVM, ANN, and knn GSA perform well than PSO.
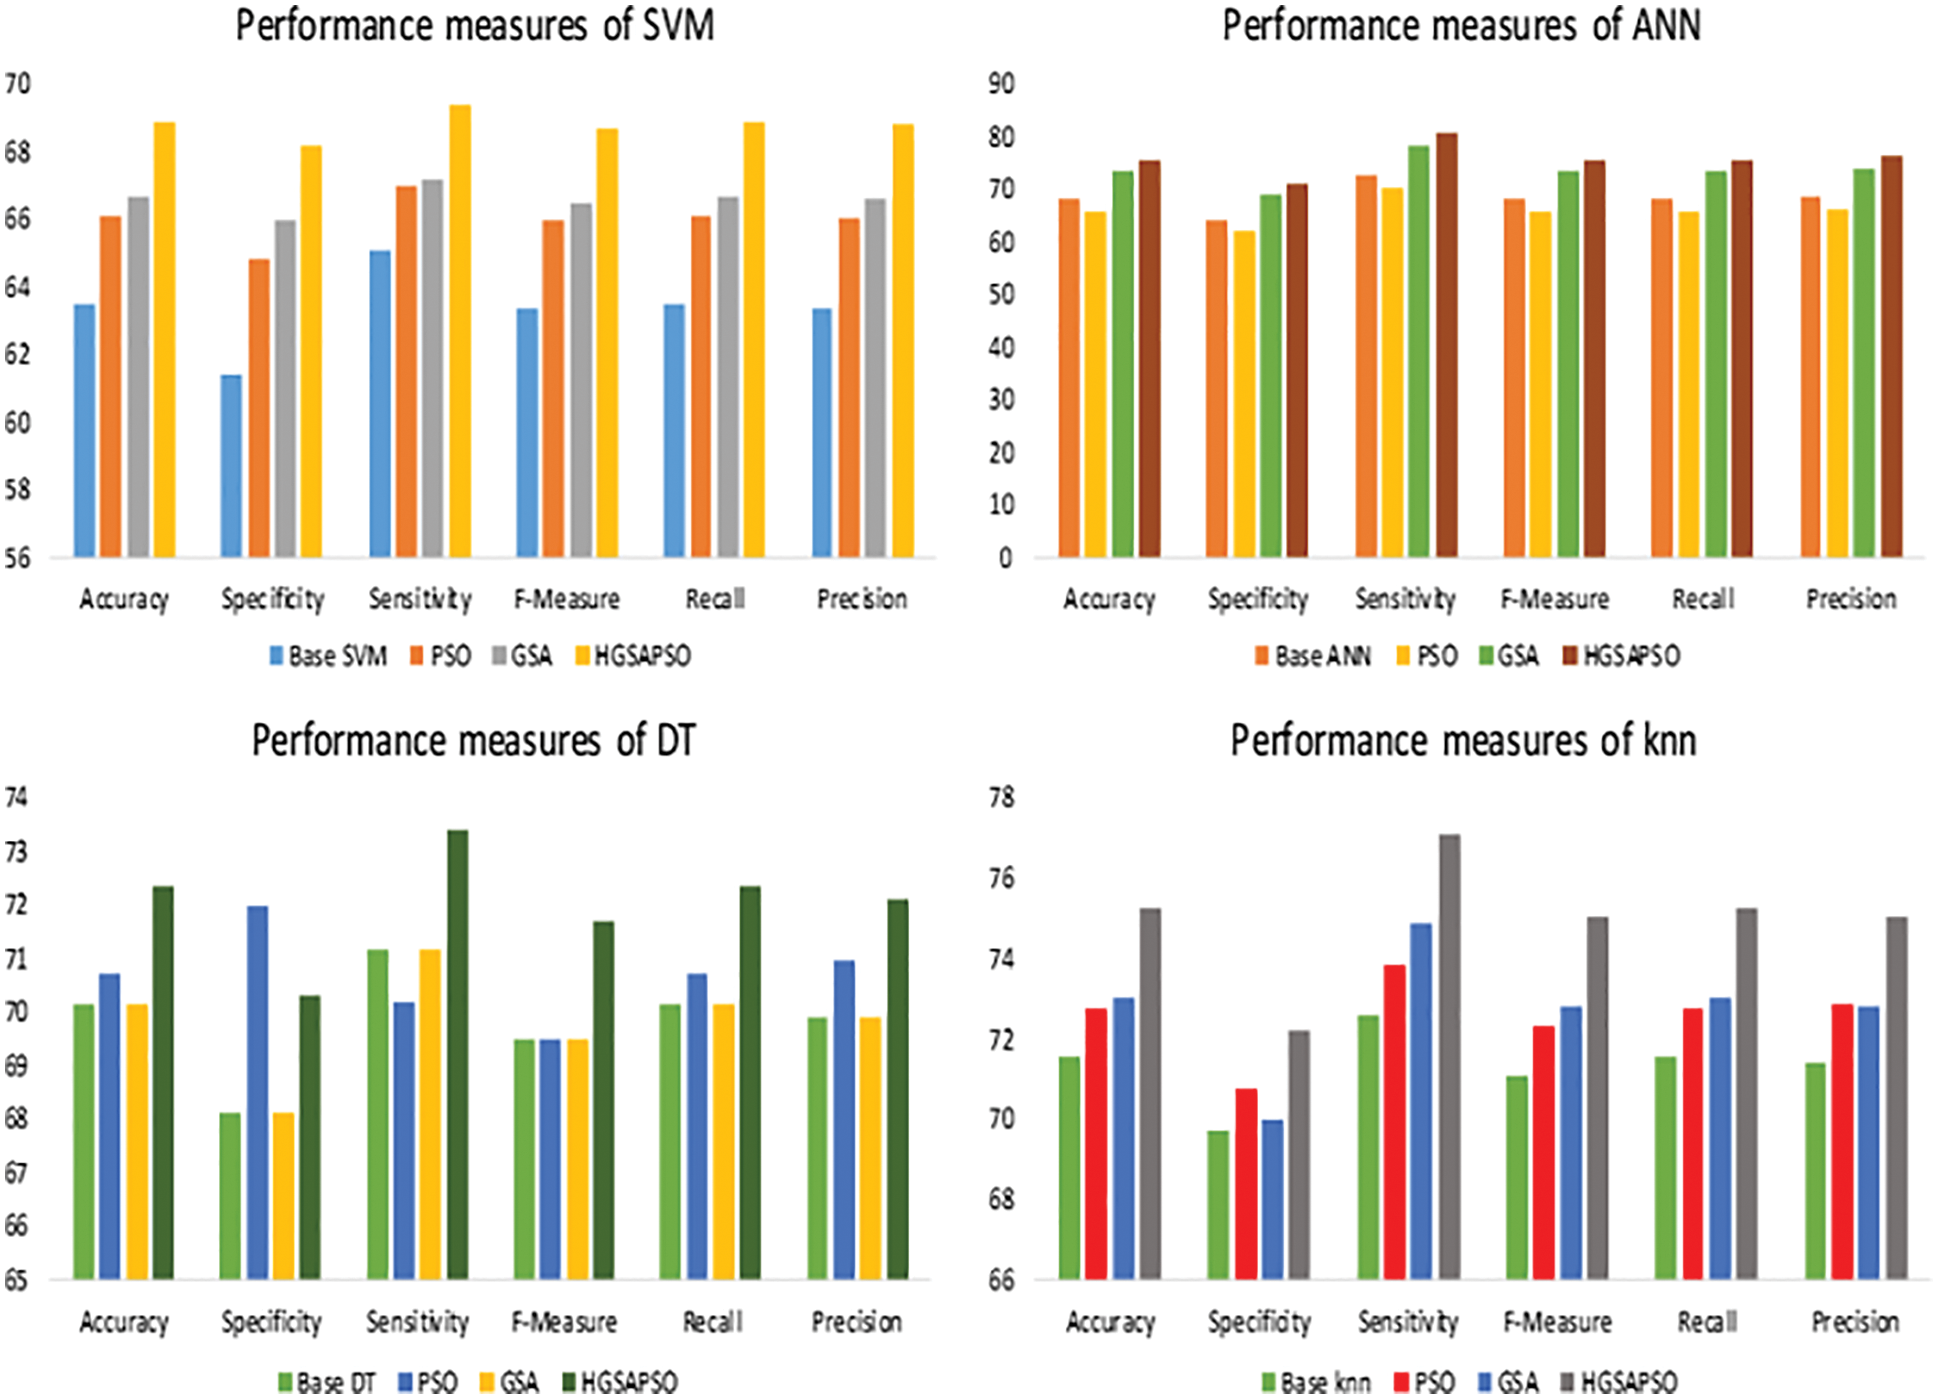
Figure 8: Performance measures of ILPD dataset
The results obtained show that our hybrid GSAPSO improved the performance of traditional machine learning techniques. It exhibits improvement in all datasets and implies that HGSAPSO performs well across various datasets. Fig. 9 shows the comparison result of paper [34] with the proposed paper. The authors used Multi-Objective Particle Swarm Optimization to enhance the performance of the Random Forest algorithm on various heart disease datasets. The proposed work implements the ANN-HGSAPSO on CVD. From the results it is shown that the accuracy of the ANN-HGSAPSO has improved compared to Multi-Objective Particle Swarm Optimization and Random Forest which attained accuracy of 96%.
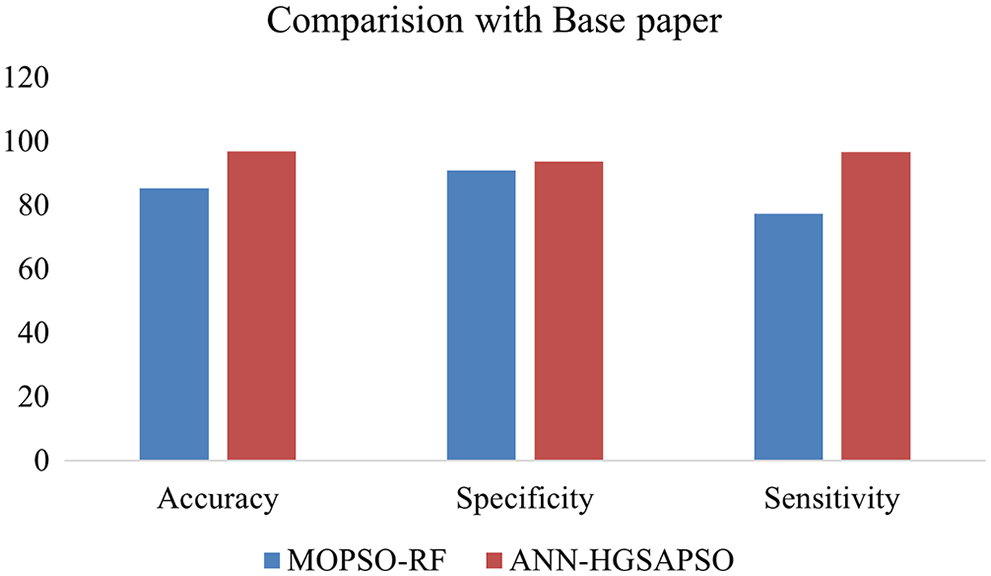
Figure 9: Comparison results with the paper [34]
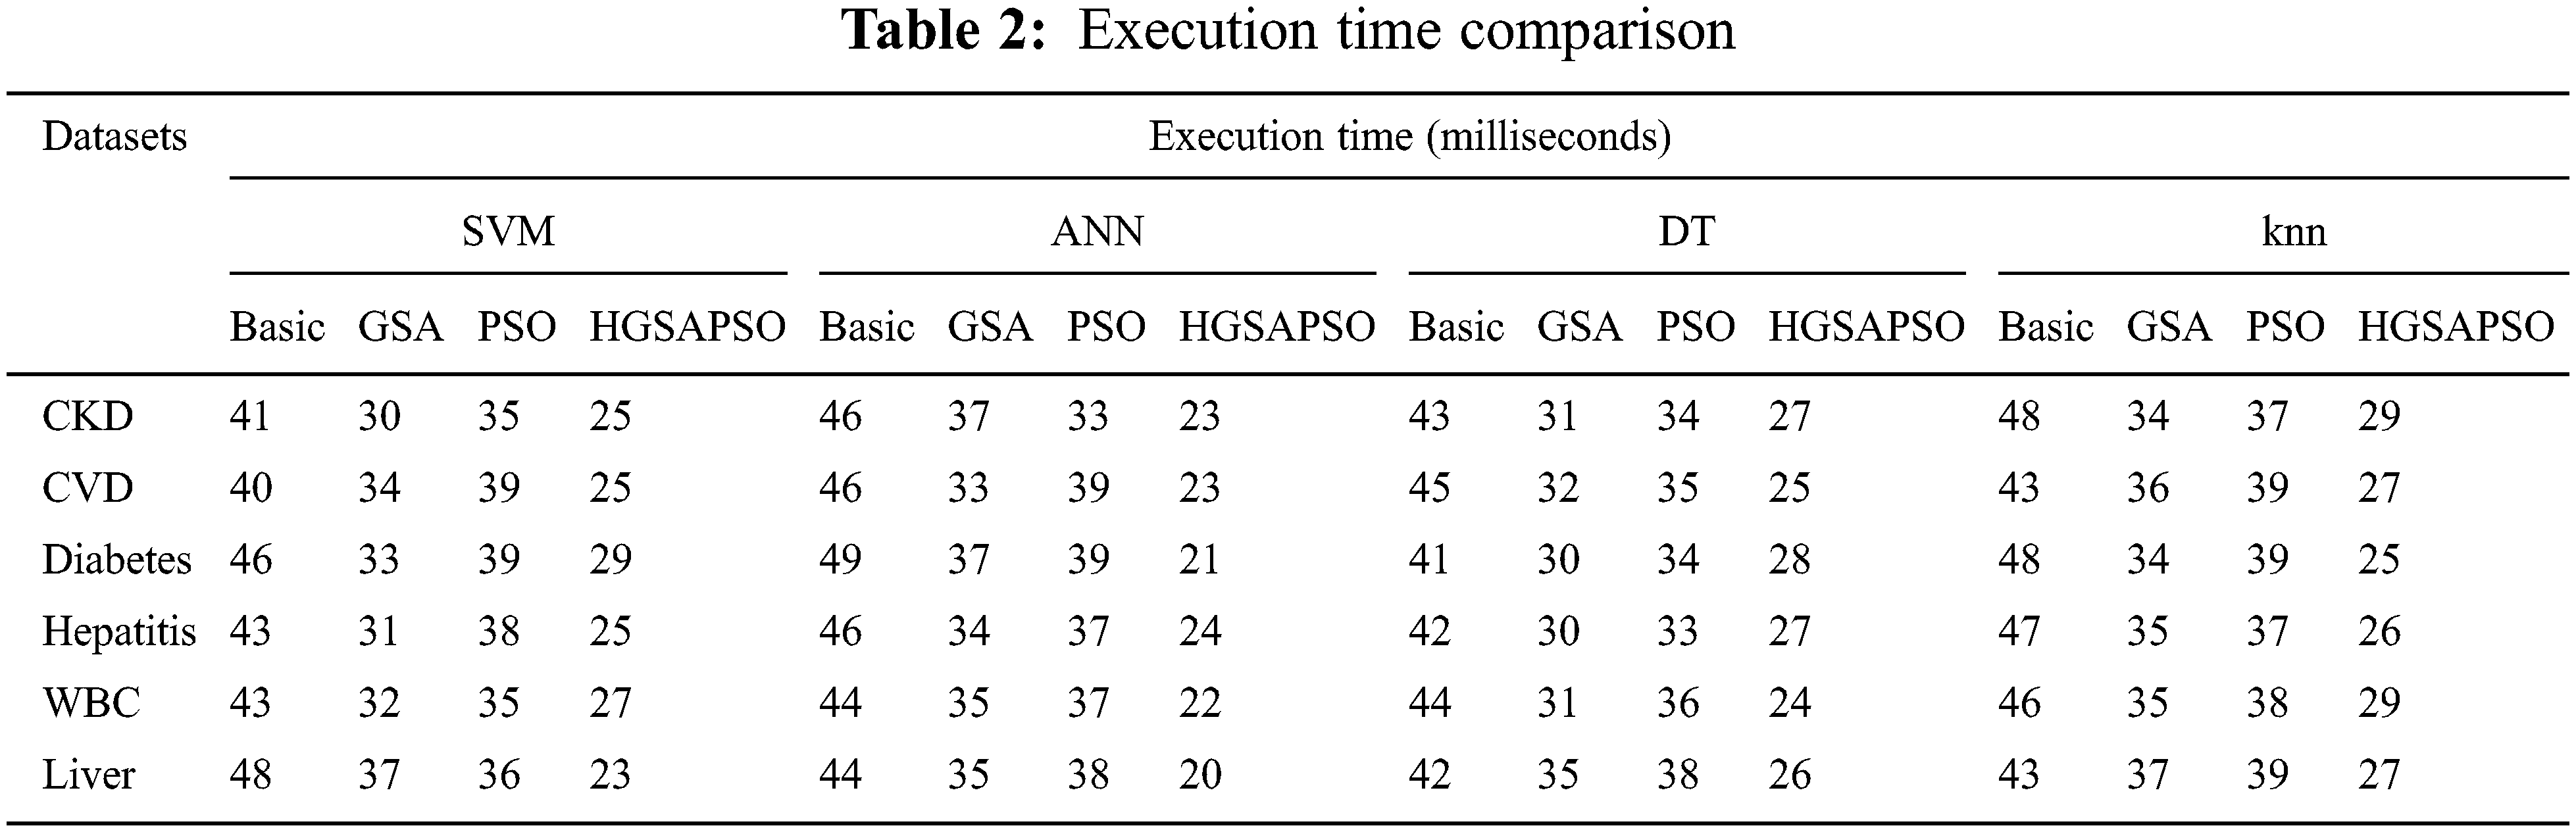
5.2.7 Execution Time Comparison
Tab. 2 compares the execution time of different classifiers on different datasets. From the table it observes that the time has reduced after applying optimization algorithm. Notably, time by HGSAPSO-ANN has reduced to a great extent compared to other algorithms. Thus, the proposed algorithm can make chronic disease prediction as early as possible.
Because of the complex structure of the various ensemble algorithms and the lower performance values of the basic machine learning classifier, a hybrid classifier provides better performance in the prediction and classification of diseases. To overcome the problems in the ensemble and the individual classifier, the hybrid gravitational search, and the particle swarm optimization (HGSAPSO) technique is used. This hybrid classifier optimizes the parameters of the base classifier and diagnoses the chronic disease. According to the results, it is shown that the hybrid algorithm comes up with better performance up to 5% with respect to the accuracy, specificity, and sensitivity compared to base classifiers covering different disease datasets. Considering different optimized classifiers ANN-HGSAPSO was perceived best in all benchmark datasets. In future work, features will be selected by incorporating a suitable feature selection algorithm and a greater number of benchmark datasets will be considered.
Funding Statement: The authors received no specific funding for this study.
Conflicts of Interest: The authors declare that they have no conflicts of interest to report regarding the present study.
References
1. E. Rashedi, H. Nezamabadi and S. Saryazdi, “GSA: A gravitational search algorithm,” Information Sciences, vol. 179, no. 13, pp. 2232–2248, 2009. [Google Scholar]
2. J. Han, J. Pei and M. Kamber, Data Mining: Concepts and Techniques, Waltham: Elsevier, 2011. [Google Scholar]
3. U. R. Acharya, O. Faust, N. A. Kadri, J. S. Suri and W. Yu, “Automated identification of normal and diabetes heart rate signals using non-linear measures,” Computers in Biology and Medicine, vol. 43, pp. 1523–1529, 2013. [Google Scholar]
4. Y. Li, C. Bai and C. K. Reddy, “A distributed ensemble approach for mining healthcare data under privacy constraints,” Information Sciences, vol. 330, pp. 245–259, 2016. [Google Scholar]
5. E. Rashedi and H. Nezamabadi, “Feature subset selection using improved binary gravitational search algorithm,” Journal of Inteligent and Fuzzy Systems, vol. 26, no. 3, pp. 1211–1221, 2014. [Google Scholar]
6. E. G. Talbi, Metaheuristics from Design to Implementation, vol. 74, New Jersey: John Wiley & Sons, 2009. [Google Scholar]
7. F. Caraffini, F. Neri and M. Epitropakis, “Hyperspam: A study on hyper-heuristic coordination strategies in the continous domain,” Information Sciences, vol. 477, pp. 186–202, 2019. [Google Scholar]
8. R. Abbassi, A. Abbasi, A. A. Heidari and S. Mirjalili, “An efficient salp swarm-inspired algorithm for parameters identification of photovoltaic cell models,” Energy Conversion and Management, vol. 179, pp. 362–372, 2019. [Google Scholar]
9. E. Rashedi, H. Nezamabadi and S. Saryazdi, “GSA: Gravitational search algorithm,” Information Sciences, vol. 179, no. 13, pp. 2232–2248, 2009. [Google Scholar]
10. S. Uddin, A. Khan, M. E. Hossain and M. A. Moni, “Comparing different supervised machine learning algorithms for disease prediction,” BMC Medical Informatics and Decision Making, vol. 19, no. 1, pp. 1–16, 2019. [Google Scholar]
11. R. Alizadehsani, M. Abdar, M. Roshanzamir, A. Khosravi, P. M. Kebria et al., “Machine learning-based coronary artery disease diagnosis: A comprehensive review, computers in biology and medicine,” Computers in Biology and Medcine, vol. 111, no. 103346, pp. 10010–4825, 2019. [Google Scholar]
12. G. Cho, J. Yim, Y. Choi, J. Ko and S. H. Lee, “Review of machine learning algorithms for diagnosing mental illness,” Psychiatry Investigation, vol. 16, no. 4, pp. 262–269, 2019. [Google Scholar]
13. P. Govindarajan, R. K. Soundarapandian, A. H. Gandomi, R. Patan, P. Jayaraman et al., “Classification of stroke disease using machine learning algorithms,” Neural Computing and Applications, vol. 32, no. 3, pp. 817–828, 2020. [Google Scholar]
14. L. Yuliang, Z. Quan. Z. Geng, Q. Zhiang, L. Guohua et al., “Detecting diseases by human-physiological-parameter-based deep learning,” IEEE Access, vol. 7, pp. 22002–22010, 2019. [Google Scholar]
15. S. I. Ayon and M. M. Islam, “Diabetes prediction: A deep learning approach,” International Journal of Information Engineering and Electronic Business, vol. 12, no. 2, pp. 21, 2019. [Google Scholar]
16. T. Wang, Y. Tian and R. G. Qiu, “Long short-term memory recurrent neural networks for multiple diseases risk prediction by leveraging longitudinal medical records,” IEEE Journal of Biomedical and Health Informatics, vol. 24, no. 8, pp. 2337–2346, 2019. [Google Scholar]
17. K. Shankar, S. K. Lakshmanaprabu, D. Gupta, A. Maseleno and V. H. C. De Albuquerque, “Optimal feature-based multi-kernel SVM approach for thyroid disease classification,” The Journal of Supercomputing, vol. 76, no. 2, pp. 1128–1143, 2020. [Google Scholar]
18. J. A. Alzubi, B. Balasubramaniam, T. Sudeep, M. Ramachandran, K. Ashish et al., “Boosted neural network ensemble classification for lung cancer disease diagnosis,” Applied Soft Computing, vol. 80, pp. 579–591, 2019. [Google Scholar]
19. Y. Zhang, S. Cheng, Y. Shi, D. W. Gong and X. Zhao, “Cost-sensitive feature selection using two-archive multi-objective artificial bee colony algorithm,” Expert Systems with Applications, vol. 137, pp. 46–58, 2019. [Google Scholar]
20. W. Wang, X. Huang, J. Li, P. Zhang and X. Wang, “Detecting COVID-19 patients in x-ray images based on MAI-NETS,” International Journal of Computational Intelligence Systems, vol. 14, no. 1, pp. 1607–1616, 2021. [Google Scholar]
21. Y. Gui and G. Zeng, “Joint learning of visual and spatial features for edit propagation from a single image,” The Visual Computer, vol. 36, no. 3, pp. 469–482, 2020. [Google Scholar]
22. W. Wamg, Y. T. Li, T. Zou, X. Wang, J. Y. You et al., “A novel image classification approach via dense-mobilenet models,” Mobile Information Systems, vol. 10, pp. 1–8, 2020. [Google Scholar]
23. S. R. Zhou, J. P. Yin and J. M. Zhang, “Local Binary Pattern (LBP) and Local Phase Quantization (LBQ) based on gabor filter for face representation,” Neurocomputing, vol. 116, pp. 260–264, 2013. [Google Scholar]
24. D. Zhang, S. Wang, F. Li, S. Tian, J. Wang et al., “An efficient ecg denoising method based on empirical mode decomposition, sample entropy, and improved threshold function,” Wireless Communications and Mobile Computing, vol. 2020, pp. 8811962:1–8811962:11, 2020. [Google Scholar]
25. F. Li, C. Ou, Y. Gui and L. Xiang, “Instant edit propagation on images based on bilateral grid,” Computers Materials & Continua, vol. 61, no. 2, pp. 643–656, 2019. [Google Scholar]
26. Y. Song, Y. Zeng, X. Y. Li, B. Y. Cai and G. B. Yang, “Fast cu size decision and mode decision algorithm for intra prediction in hevc,” Multimedia Tools and Applications, vol. 76, no. 2, pp. 2001–2017, 2017. [Google Scholar]
27. X. R. Zhang, J. Zhou, W. Sun and S. K. Jha, “A lightweight CNN based on transfer learning for COVID-1iagnosis,” Computers, Materials & Continua, vol. 72, no. 1, pp. 1123–1137, 2022. [Google Scholar]
28. X. R. Zhang, W. Z. Zhang, W. Sun, H. L. Wu, A. G. Song et al., “A real-time cutting model based on finite element and order reduction,” Computer Systems Science and Engineering, vol. 43, no. 1, pp. 1–15, 2022. [Google Scholar]
29. J. Kennedy and R. Eberhart, “Particle swarm optimization,” in Neural Networks, IEEE Int. Conf., Perth, WA, Australia, vol. 4, pp. 1942–1948, 1995. [Google Scholar]
30. S. Chatterjee, S. Sarkar, S. Hore, N. Dey, A. S. Ashour et al., “Particle swarm optimization trained neural network for structural failure prediction of multistoried RC buildings,” in Neural Computing and Applications, London: Springer, pp. 1–12, 2016. [Google Scholar]
31. N. Naicker, T. Adeliyi and J. Wing, “Linear support vector machines for prediction of student performance in school based eduction,” Mathemetical Problems in Engineering, vol. 10, pp. 1–7, 2020. [Google Scholar]
32. A. Jabbar, D. shatulu and P. Chandra, “Classification of heart disease using k-nearest neighbor and genetic algorithm,” in Int. Conf. on Computational Intelligence: Modeling Techniques and Applications, vol. 10, no. 2212–0173, Vienna, Austria, pp. 85–94, 2013. [Google Scholar]
33. B. Chandra and P. Paul Varghese, “Fuzzy SLIQ decision tree algorithm,” IEEE Transactions on Systems, Man and Cybernetics, vol. 38, no. 5, 1294–1301, 2008. [Google Scholar]
34. S. Asadi, S. E. Roshan and M. W. Kattan, “Random forest swarm optimization-based for heart disease diagnosis,” Journal of Biomedical Informatics, vol. 115, pp. 103690, 2021. [Google Scholar]
Cite This Article
 Copyright © 2023 The Author(s). Published by Tech Science Press.
This work is licensed under a Creative Commons Attribution 4.0 International License , which permits unrestricted use, distribution, and reproduction in any medium, provided the original work is properly cited.
 Downloads
 Citation Tools