
 Submit a Paper
 Propose a Special lssue
 Open Access
ARTICLE

A Method for Classification and Evaluation of Pilot’s Mental States Based on CNN
1 Chengdu Institute of Computer Application, Chinese Academy of Sciences, Chengdu, 610041, Sichuan, China
2 School of Computer Science and Technology, University of Chinese Academy of Sciences, Beijing 100080, China
3 Key Laboratory of Flight Techniques and Flight Safety, Civil Aviation Flight University of China, Guanghan, 618307, Sichuan, China
4 School of Air Traffic Management, Civil Aviation Flight University of China, Guanghan, 618307, Sichuan, China
5 Neurology Department, Deyang Second People's Hospital, Guanghan, 618307, Sichuan, China
* Corresponding Author: Qianlei Wang. Email:
Computer Systems Science and Engineering 2023, 46(2), 1999-2020. https://doi.org/10.32604/csse.2023.034183
Received 08 July 2022; Accepted 08 December 2022; Issue published 09 February 2023
 View Full Text
 Download PDF
Abstract
How to accurately recognize the mental state of pilots is a focus in civil aviation safety. The mental state of pilots is closely related to their cognitive ability in piloting. Whether the cognitive ability meets the standard is related to flight safety. However, the pilot's working state is unique, which increases the difficulty of analyzing the pilot's mental state. In this work, we proposed a Convolutional Neural Network (CNN) that merges attention to classify the mental state of pilots through electroencephalography (EEG). Considering the individual differences in EEG, semi-supervised learning based on improved K-Means is used in the model training to improve the generalization ability of the model. We collected the EEG data of 12 pilot trainees during the simulated flight and compared the method in this paper with other methods on this data. The method in this paper achieved an accuracy of 86.29%, which is better than 4D-aNN and HCNN etc. Negative emotion will increase the probability of fatigue appearing, and emotion recognition is also meaningful during the flight. Then we conducted experiments on the public dataset SEED, and our method achieved an accuracy of 93.68%. In addition, we combine multiple parameters to evaluate the results of the classification network on a more detailed level and propose a corresponding scoring mechanism to display the mental state of the pilots directly.Keywords
With the continuous improvement of aircraft automation, the proportion of flight accidents caused by equipment failure has dropped from 85% in the middle of the 20th century to 12%–21% now [1,2]. The mental state of pilots has become an essential factor in affecting flight safety [3]. Mental Fatigue, Load and Attention are the main elements of the state of pilots [4]. According to statistics from the International Civil Aviation Organization (ICAO), human factors accounted for 76% of modern aviation accidents [5,6], which more than 60% are caused by pilots. And accidents related to mental fatigue of pilots more than 21% [7,8]. Besides, the human-computer interaction systems in aircraft driving have become more complex, and the load that pilots need to undertake in actual work continues to increase. In addition, the role of the pilot gradually transforms from the operator to the inspector. The pilots often need to pay attention to multiple flight information simultaneously, and selectively pay attention to multiple pieces of information through the reasonable allocation of attention. During the flight, pilot fatigue, workload, overload, and distraction will reduce work efficiency and increase the possibility of flight accidents [9–11]. Therefore, classifying the mental state of pilots accurately and evaluating their level can realize flight safety monitoring moving forward.
At present, research on the mental state are based on EEG signals, such as ESTCNN [12], which is for fatigue from ground driving. Because the collecting of EEG has low space requirements, is mobile, and the pilot’s driving environment is narrow and occluded, EEG has become the first choice for investigating the mental state of pilots. However, the working status of pilots has some unusual points, as shown as follows. (1) Alternate work day and night. (2) The flight operation is complicated, and various instruments and controller responses need to be attention. (3) External factors such as weather are easy to interfere with the pilot's driving. The existence of these special circumstances makes the pilot EEG sequence highly complicated in different mental states [13], which increases the difficulty of research. There are currently more studies on the classification and evaluation of the mental state of ground drivers, but there are few studies on pilots. There are some human clues used to classify the mental state of pilots, but most of them are binary classifications, which are unable to evaluate the degree of mental state.
In this paper, we proposed a CNN aiming to classify the mental state of pilots. To reduce the impact of noise and other useless information when we conduct model training, we integrated the attention mechanism in CNN. We also collected the EEG data of pilot trainees during simulated flight training to verify our method. After experimenting, the results show that our method improved the accuracy compared with previous methods. In the model training, an improved K-means clustering algorithm and a semi-supervised learning method are used to improve the generalization ability of the model. In addition, we also used a multi-parameter evaluation method to evaluate the degree of the mental state of each category and proposed a corresponding scoring mechanism to present the mental state of the pilot in the form of numbers.
We highlight our main contribution here:
1. We proposed an attention mechanism-based classification network for pilot mental states.
2. An improved K-means clustering algorithm and a semi-supervised learning method are used to improve the generalization ability of the model.
3. We combined multiple parameters to evaluate the results of the classification network at a more detailed level and propose a corresponding scoring mechanism to directly display the mental state of the pilots.
The rest of this paper is organized as follows: Section 2 reviews the current status of research on EEG; Section 3 describes the method; Section 4 uses the collected data to verify the proposed network and analyzes the network performance; Section 5 concludes the whole paper.
According to the frequency characteristics of EEG signals [14], it can be divided into five rhythms δ, θ, α, β and γ. These five kinds of rhythm information belong to natural language [15] and are composed in time series [16]. They are the primary source of human emotions [17] with randomness and complexity [18].
Related works: Machine learning can effectively process this information [19]. This technology has been used in EEG classification and successfully used in lots of research. Effective results have been achieved using Long Short-Term Memory (LSTM) network with attention mechanisms to classify EEG signals [20], and CNN and Recurrent Neural Network (RNN) also get good results [21]. But simple CNN and RNN including LSTM cannot handle complex tasks, such as approximate emotion recognition.
In the research of EEG signal recognition, [22] used LSTM to learn features from EEG signals and then used the dense layer for classification. The method achieves over 85% accuracy in classifying low/high arousal, valence and liking. But this method is not robust to noise. In addition, some researchers have improved the LSTM structure, such as STACKED LSTM [23] and OPTICAL [24]. However, its generalization ability and accuracy still cannot satisfy the classification of multi-sample pilot emotions. Reference [25] proposed a multimodal residual Long Short-Term Memory model (MMResLSTM) for emotion recognition, which shares temporal weights across the multiple modalities. This method slightly improves the generalization ability, but still not enough.
Recently, CNN has become the best choice in biomedical signal diagnosis [26]. Especially when the EEG signal comes from multiple channels, [27] uses 3D CNN to predict different stages of EEG data, [28] uses CNN's novel emotion recognition method to estimate the emotional state, and the average accuracy rate reached more than 90%. Based on the good performance of CNN for EEG classification, [29–34] takes more attempts. The results of the study show that the EEG signals needed to be extracted for classification using CNN are more accurate. In the CNN structure, [35] adds semi-supervised learning for text classification and shows better performance in the research on sentiment classification and topic classification. And [36] proposed CNN-GRU which got SOTA on the DEAP dataset. In [37], a novel CNN model with a MAM mechanism was proposed for classifying age, gender, and age-gender using speech spectrograms. But the above CNN-based models are very heavy and not easy to use.
Motivation: There are three problems still exist: (1) In the current research on emotion or mental classification, the proposed classification models are relatively complex and generally have poor generalization. (2) In flight, the pilot needs to obtain a large amount of information, coupled with the influence of various noises, the collected EEG signal contains a lot of useless information, and it is very difficult to extract effective information with high accuracy. (3) At present, there is no complete pilot mental scoring mechanism in the process of flight training.
To solve the above problem, we use attention and semi-supervised learning to improve the accuracy and generalization ability of the classification model, and classify the mental state from the complex EEG signal accurately. Then, we evaluate the degree of mental state in combination with multi-parameter to make the result while being more representative and convincing. The method also satisfies a higher accuracy rate and provides a better solution for pilots' mental state assessment.
Backbone Network: The Backbone part of the network is mainly composed of three convolutional layers, two pooling layers and three BN layers as shown in Fig. 1. The size of the convolution kernel of the first convolutional layer is (1 × 63). After convolution, it can output Feature Maps of 20 × 152 EEG signals with different bandpass frequencies, and then use SELU for regularization. The mean value of SELU output is not only closer to zero, but its variance is also closer to the unit variance. Compared with other activation functions, it has stronger regularization performance, and the convergence speed will also be improved. In the stage of training, the process of changing the distribution of internal node data due to changes in network parameters is called internal covariate shift (ICS). To adapt to changes in the input data distribution. This process requires the upper network to adjust continuously, and the network training is easily falling into the gradient saturation zone and slow down the network convergence speed. For this reason, this paper adds a Batch Normalization (BN) layer [38] between the part of the linear layer and the nonlinear layer to suppress the influence of ICS on the network.

Figure 1: Network structure
Spatial filtering using a Depthwise Convolution with a convolution kernel size of (20 × 1) immediately after the first BN layer. The classic case of Depthwise Convolution is the MobileNet [39] series. The main benefit of the Depthwise Convolution is that fewer training parameters need to be fitted, as these convolutions are not fully connected to all previous Feature Maps. More specifically, when applied to EEG, this operation allows the model to efficiently learn spatial filters for specific frequencies. After Average Pooling, there is still a lot of useless information in the Feature Maps. At this time, we use an Attention module to suppress useless channel information and increase the weight of useful information to improve the efficiency of the network.
The core size of Average Pooling is (1 × 4), and its purpose is to downsampling, reduce the amounts of parameters, and improve the training speed of the model. The input size of the model in this paper is (1 × 20 × 150). After a series of convolution and pooling, the final output (16 × 1 × 16) tensor is used as the input of the clustering block.
Attention Block: The original EEG data collected by nonintrusive equipment contains a lot of useless information. The existence of such information will increase the complexity of the system and reduce the accuracy of data recognition. After filtering and other necessary preprocessing work, Principal Components Analysis (PCA) algorithm [40] is often used to remove channel information with a small contribution rate. This operation can satisfy the removal of redundant information, but it will cause the loss of more shallow information, and incomplete feature information is not conducive to deep mining EEG signals.
In this paper, the Attention module [41] is used in the CNN to maximize the suppression of useless information through weight distribution while retaining the complete information. The first Average Pooling is used as the input of the Attention module, and Global Average Pooling is used to compress the input information, and the channel characteristics are changed to a real number, thereby obtaining the global information between the channels.
Then two fully connected layers are used to compose Bottleneck to compress and restore the number of channels. The first layer compresses the channel dimension from 16 to 1 with a compression ratio of 16. After nonlinear activation, a layer of fully connected is used to restore the channel dimension, and then use Sigmoid to obtain the normalized weight between [0,1]. Finally, each channel feature is weighted by Scale. This process gives large weight to channel features that contribute a lot, the rest are small weights. While reducing the impact of useless information on the classification accuracy of the network backend, the information features are retained completely as possible.
Clustering: In the classification task, we use
Among them,
In the pretraining of the model, we used an improved K-Means to cluster the output of convnet, which is different from the classic K-Means clustering center random selection strategy. The centroid of cluster selection is based on the dissimilarity measure. The method and process are described as follows:
We use the Euclidean distance
Mean anisotropy reflects the position of sample
We select the sample point with the largest mean difference among other points as the second centroid of cluster, judge whether the dissimilarity of the selected centroid of cluster is greater than
In the division process, the centroid matrix
Applying

The evaluation is divided into three parts (Attention feature extraction, Mental Fatigue feature extraction and Load feature extraction) which are shown in Fig. 2. And each part is responsible for the corresponding feature extraction and evaluation tasks. Now the extraction scheme of each mental state is explained, the results of evaluation tasks and method will be shown in “4.1.3 Results and analysis”.

Figure 2: Evaluation module structure
Attention feature extraction: Attention index can be used to measure the degree of the pilot’s investment in the flight process. It should be emphasized that the Attention here refers to the parameters rather than the attention mechanism in the model. The ratio of β wave energy to θ wave energy in EEG signals can show people's attention to things to a certain extent [42]. However, the classification based on energy ratio alone has poor precision, and EEG signals tend to be disordered in a nonconcentrated state, which will increase the complexity of features. Sample entropy can better describe the complexity of the sequence. Using sample entropy to characterize the complexity of the analyzed signal can make up for the low accuracy defect of pure energy classification.
Among them,
Mental fatigue feature extraction: When the human brain is in a state of fatigue, the
Load feature extraction: Similar to the analysis of the degree of attention, changes in mental Load will also affect the complexity of the EEG signal [44]. Therefore, calculating the sample entropy is still a very good solution. To improve the expression ability, we also add the energy ratio of
In this chapter, we conducted experiments on the network and analysis scheme proposed in this paper on the collected EEG dataset of volunteers and analyzed the results. In addition, the negative emotion will increase the probability of fatigue appearing [45], we think the negative emotion can be seen as the precursor feature of fatigue appearing. So the emotion recognition is meaningful in flight. Then we conducted experiments on SEED public dataset [46] which divided into 3 categories (positive, negative, and neutral) to verify if our method can perform well on such emotion recognition task.
4.1 Experiment on Pilot’s EEG Dataset
We collected the EEG data of 12 volunteers aged 18–25 during the simulated flight. The experimental protocol is shown in Fig. 3.

Figure 3:experimental protocol. Note: * means the volunteer has simulated flight experience
The collection time of each object is about 2 h to ensure the comprehensiveness of data collection. The collection objects had been required to carry out a reasonable work and rest in the early stage and divided into three groups: A, B, and C according to the period (morning, afternoon, and evening). In addition, the subjects in group B were deprived of the noon break. The original acquisition frequency of all EEG signals is 512 H_Z, and the resampling frequency is 100 H_Z. The 26-channels physiological signals included 20-channels EEG signals, 2-channels ocular signals, 2-lead myoelectric signal, 1-channel skin electrical signal and 1-channel temperature recording signal of the international 10-20 system. During the collecting process, the objects are required to relax for 2 min before and after the simulation operation, and then to carry out a simulation flight of 2 h. The flight project is a five-sided flight (including take-off, climb, turn, level flight and descent stages around the airport). The data collecting environment consists of a simulated aircraft, a surround display screen and an EEG acquisition device. The environment is shown in Fig. 4.

Figure 4: Data collection environment
After processing the necessary data, the signal is divided into 1.5 S segments, and each segment serves as a sample. The sample size is
We use Pytorch1.5.1 framework to construct our classification network, and the network is initialized randomly under the default settings of PyTorch without any pretraining external dataset. The pretraining and fine-tuning of the classification network in this paper are trained on one NVIDIA Tesla V100-FHHL-16 GB. The data is divided into pretrain data, fine-tuning data and test data at a ratio of 5:3:1. It should be emphasized that pretrain data is the unlabeled data. The sample input size is 20 × 150, the optimizer is Adam, the batch size is set to 64, last 200 epochs, and the initial learning rate is 0.01. We use Random Searching to set batch size and initial learning rate. The learning rate obeys discrete descent during training. After the 160th epoch, the learning rate drops to 0.001. During the pretrain process, there are no precise classification targets generated, only the fake labels generated by the clustering which are used to update the network parameters. Due to the data in EEG dataset are divided into 8 categories, we set the Number of clusters K equal 8 while clustering. And the fine-tuning data is used to refine the network after the pretrain process is completed. The fine-tuning process is the same as the initial training except that the learning rate has been maintained at 0.001, and we conduct a tenfold cross-validation on fine-tuning process. Finally, we use test data to calculate the average test classification accuracy (test-ACC).
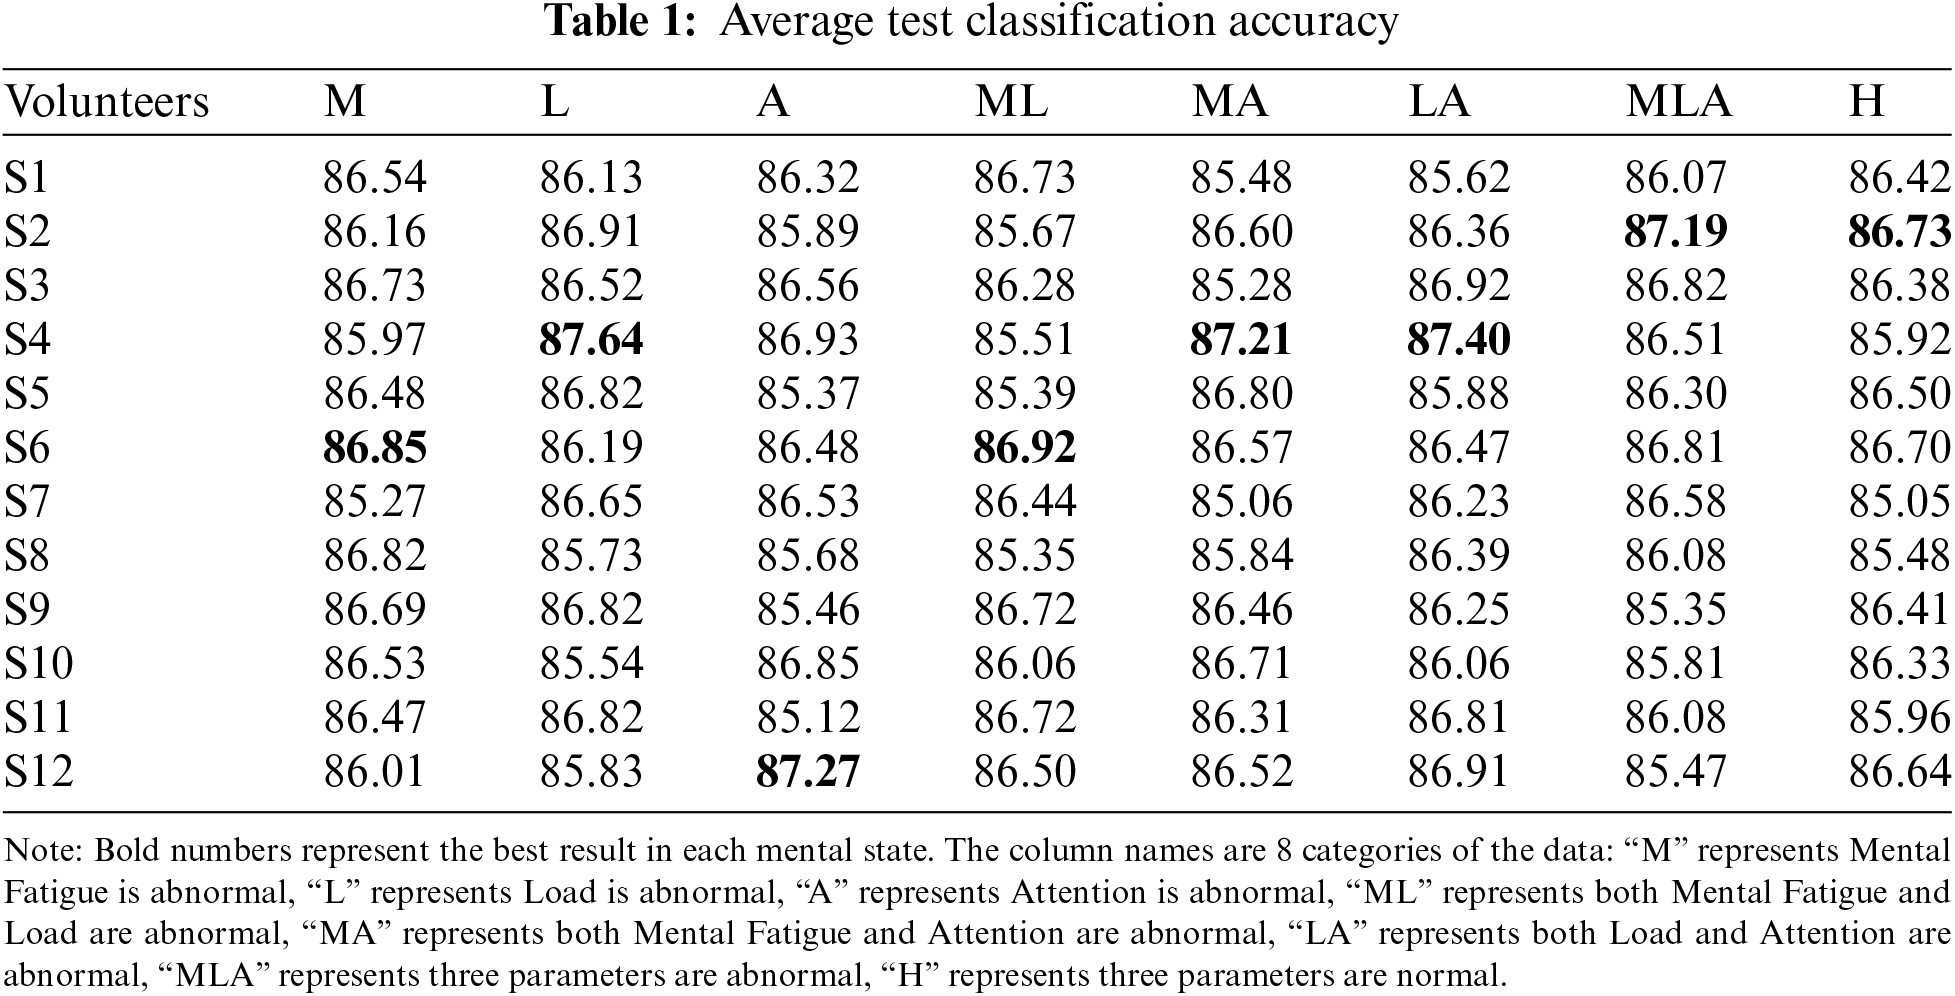
Output of classification part: Table 1 shows the evaluation results of the output accuracy of the classifier on the pilot’s EEG dataset according to the experimental rules. The average test classification accuracy is 86.29%.
At the same time, we also compared this method with others, shown in Table 2. The results show that this method has better performance on the more complex EEG signal classification task. Our method performed better than [47] using residual learning, and improved the accuracy by 10.86%. The performance of the method increased by 4% than VPR [48], which achieves the SOTA performance on the SEED dataset. However, traditional methods such as SVM and Bi-LSTM performed weakly and only achieve accuracy of 69.39% and 71.08%, respectively.

We quantified the Operational Distraction (A1), Non-operational Distraction (A2), and Physiological Distraction (A3) of pilots from the values of

Figure 5: Attention feature under parameter quantification
The values of

Figure 6: Mental fatigue feature under parameter quantification
The values of

Figure 7: Load feature under parameter quantification
After analyzing a large amount of data, we summarize the positive and negative correlations between the nine levels of pilot mental state and the five assessment parameters (“+” for positive correlation, “-” for negative correlation and “*” for no significant correlation). For example, Operational Distraction (A1) is positive correlation to Variance of Theta and negative correlation to Sample entropy. The results provide an important basis for a comprehensive assessment of pilot mental states, shown in Table 3.

Based on the above analysis, a pilot mental state scoring mechanism is developed to present the mental state of pilots more directly. Among them, the weight of the mental state representative factor is the key to constructing the scoring mechanism. The weight reflects the importance of that mental state in the scoring stage. Therefore, the mental state weight must be selected reasonably to have correct learning state assessment results. However, as the only three mental state factors selected in this paper’s methodology are Mental Fatigue, Load and Attention, if any one factor is overweighted, it will have a great impact on the learning state assessment model, so we combined the causes of flight accidents [8,9,54,55] and assigned a weight of 0.2 to the Mental Fatigue factor, 0.3 to the Load factor and the Attention factor is given a weight of 0.5. Moreover, to improve the tolerance of the mental state assessment results for classification, we chose to assess the pilot’s mental state in a comprehensive manner using the total rating over the past 60 s. Since our calculation of EEG data is based on a period of 5 s, the total score of the mental state within 60 s is the total score of the results of 12 mental state evaluations.
As we have a more detailed degree classification for each mental state factor, we also need to assign corresponding scores to the different degrees in the scoring process. Combined with the normal mental state levels, the worst condition is the time when pilots in A1, F3 and W3 states. Thus, we assign a score of 1 to A1, F3 and W3, 2 and 3 to the remaining two states for each factor in this case, shown in Table 4.

After we introduce the weight, the maximum total score of the assessment results for mental state is 48 and the minimum is 12. We consider an assessment result with a total score of less than 24 to be an unqualified mental state, because the pilot’s average score for the three types of mental state is already below half in this case. We also test for extremes, such as consistently high scores for one, and two factors and consistently low scores for another. To solve this problem, we will detect a single factor. In the stage of mental state assessment, when H is 0, if any of the Mental Fatigue factor, Attention factor and Load factor is lower than the threshold (4.8, 12, 7.2), we also think the object’s mental state is unqualified. Table 5 shows the results of scoring the volunteers.

4.2 Experiment on SEED Dataset
Both the emotion and fatigue recognition are classification tasks based on EEG, and emotion recognition is also meaningful during the flight. To demonstrate whether the method proposed in this paper can perform well in similar classification tasks, we remove the evaluation part and only retain the classification part. The experiment on SEED is used to verify the performance on emotion recognition of the method proposed in this paper, and we compare it with other networks.
The SEED dataset describes a three-emotion classification task (positive, negative, and neutral). Unlike the pilot's EEG dataset as the test object, the SEED dataset uses a supervised learning method to train the network. According to the preset of [56], using 9 sub-datasets as training data, and the rest as test data. Table 6 shows the performance comparison results of our method and other related methods on the public dataset SEED. The objects of comparison include some classic methods and novel work in the past year. In [50], DGCNN uses a graphical model to model multi-channel EEG features, which provides a 90.40% accuracy performance. In [51], RGNN considered the biological topological relationship between different brain regions, and achieved an accuracy of 94.24% on the SEED dataset. In [48] and [57], STRNN and R2G-STNN utilize the characteristics of RNN and LSTM in spatial and temporal information, respectively. Among them, STRNN unifies the learning process of two different signal sources into a time-dependent model, traversing the spatial region of each time segment from multiple angles, and shows a performance of 89.50% on the SEED dataset. R2G-STNN adopts a Bidirectional Long and Short-Term Memory (BiLSTM) network and achieves an accuracy of 93.38%. In [47], the researchers propose a heuristic Variable Path Reasoning (VPR) method to deal with EEG-based emotion recognition problems, which showed extraordinary performance and achieved a high accuracy rate of 94.39%. Unlike the above methods, this paper organically combines CNN and attention mechanism, and the accuracy rate on the public dataset SEED reaches 93.68%. This performance is close to the current SOTA results and shows that the method proposed in this paper has good generalization ability.

Attention mechanism, semi-supervised learning and multi-parameter evaluation are the core of the method in this paper. We designed related experiments to further understand its role. The experimental data set uses the pilot’s EEG dataset.
Attention block: Remove the attention block in the network, and connect the first AvgPool directly to Conv_2 as a baseline. The experimental implementation details are consistent with those given in 4.1.2, and only the output results of the classification part are considered. The experimental results are shown in Fig. 8.

Figure 8: Comparison of experimental results between baseline and proposed method
The results show that after the introduction of the attention mechanism, the method in this paper is better than the baseline in terms of accuracy and convergence speed, and the accuracy rate is increased by 14.06% compared with the baseline (72.23%). Therefore, the introduction of the attention mechanism does help the classification accuracy and convergence of the network.
Training method: To study the advantages of semi-supervised learning compared to supervised learning in complex EEG data, we collected the EEG data of three additional volunteers to verify that the semi-supervised learning model has better generalization. The experimental implementation details of semi-supervised learning are the same as those in 4.1.2. In addition to the different ways of using the dataset, the parameter settings of the network are the same as semi-supervised learning. In supervised learning method, we directly train the train dataset as a whole, without dividing it into 2 parts: pretraining and fine-tuning training. This experiment is only for the classification part.
Table 7 shows the comparison results of semi-supervised learning and supervised learning. It can be seen from the table that the accuracy of the model obtained by using semi-supervised learning on the pilot’s EEG dataset is higher than that of supervised learning. However, when we used the extra collected volunteer EEG data for testing, we found that semi-supervised learning performed better than supervised learning, and the accuracy rate increased from 78.49% to 82.33%.

Improved k-means: In order to fully verify the clustering effect of the algorithm in this paper, we conducted experiments on Iris dataset and Flame dataset. Meanwhile, we calculated accuracy, purity and normalized mutual information. The results are shown in Table 8.

Multi-parameter evaluation: Interval estimation at the 95% confidence level is used to estimate the values to be observed for each parameter, which is used to evaluate the use of parameters for redundancy.
For

For the parameter

Similar to the Mental Fatigue, for the parameters

In this research, we proposed a new method to solve the problem of pilot mental state classification and evaluation. In the classification stage, we proposed an attention mechanism-based classification network for pilot mental states.This network achieved an accuracy of 82.64% on the pilot’s EEG dataset. The results are better than the classification methods proposed by other researchers. For the rigor of the experiment, we conducted further research on the proposed network on the SEED dataset. And the results show that the network has a good generalization, thanks to the introduction of the attention and semi-supervised learning usage. In the evaluation stage, we adopted a multi-parameter evaluation method. The study found that the three mental evaluation factors of fatigue, Load and Attention have positive and negative correlations with parameters such as sample entropy and specific wave energy ratio. Based on this, we proposed a pilot mental state scoring mechanism to quantify the mental state evaluation results, which provide a direct basis for judging the mental level of pilots.
In future work, we will deploy the proposed method on some mobile and edge computing devices, and further optimize the algorithm according to the operating conditions to achieve real-time analysis of the pilot’s mental state.
Funding Statement:: This research is supported by program of Key Laboratory of Flight Technology and Flight Safety (FZ2020KF07), Ms. Zaijun Wang received the grant. This research is also supported by Postgraduate Innovation Project of CAFUC (X2021-37), Mr. Qianlei Wang received the grant.
Conflicts of Interest:: The authors declare that they have no conflicts of interest to report regarding the present study.
References
1. P. Szczepaniak, G. Jastrzębski, K. Sibilski and A. Bartosiewicz, “The study of aircraft accidents causes by computer simulations,” Aerospace, vol. 7, no. 4, pp. 41, 2020. [Google Scholar]
2. W. Deng, P. Yu, X. Y. Qiu, Z. Tang, W. M. Zhang et al., “Detecting fatigue status of pilots based on deep learning network using EEG signals,” IEEE Transactions on Cognitive and Developmental Systems, vol. 13, no. 3, pp. 575–585, 2020. [Google Scholar]
3. L. Ying, H. Chen, X. Y. Xin and M. Ji, “The influence of mindfulness on mental state with regard to safety among civil pilots,” Journal of Air Transport Management, vol. 84, no. 5, pp. 101768, 2020. [Google Scholar]
4. D. H. Lee, J. H. Jeong, K. Kim, B. W. Yu and S. W. Lee, “Continuous EEG decoding of pilots’ mental states using multiple feature block-based convolutional neural network,” IEEE Access, vol. 8, no. 1, pp. 121929–121941, 2020. [Google Scholar]
5. K. Husam, J. Murray, G. Baxter and G. Wild, “A review of human factors causations in commercial air transport accidents and incidents: From 2000 to 2016,” Progress in Aerospace Sciences, vol. 99, no. 3, pp. 1–13, 2018. [Google Scholar]
6. K. Damien and M. Efthymiou, “An analysis of human factors in fifty controlled flight into terrain aviation accidents from 2007 to 2017,” Journal of Safety Research, vol. 69, no. 4, pp. 155–165, 2018. [Google Scholar]
7. M. Ji, C. Yang, Y. Li, Q. Xu and R. He, “The influence of trait mindfulness on incident involvement among Chinese airline pilots: The role of risk perception and flight experience,” Journal of Safety Research, vol. 66, no. 1, pp. 161–168, 2018. [Google Scholar]
8. R. Olaganathan, T. B. Holt, J. Luedtke and B. D. Bowen, “Fatigue and its management in the aviation industry, with special reference to pilots,” Journal of Aviation Technology and Engineering, vol. 10, no. 1, pp. 45, 2021. [Google Scholar]
9. M. Galant, W. Zawada and M. Maciejewska, “Analysis of pilot’s cognitive overload changes during the flight,” Advances in Military Technology, vol. 15, no. 2, pp. 329–342, 2020. [Google Scholar]
10. D. Kelly and M. Efthymiou, “An analysis of human factors in fifty controlled flight into terrain aviation accidents from 2007 to 2017,” Journal of Safety Research, vol. 69, no. 1, pp. 155–165, 2020. [Google Scholar]
11. K. Julius, F. C. Mendonca and J. E. Cutter, “Collegiate aviation pilots: Analyses of fatigue related decision-making scenarios,” International Journal of Aviation, Aeronautics, and Aerospace, vol. 6, no. 4, pp. 9, 2019. [Google Scholar]
12. Z. Gao, X. Wang, Y. Yang, C. Mu, Q. Cai et al., “EEG-based spatio-temporal convolutional neural network for driver fatigue evaluation,” IEEE Transactions on Neural Networks and Learning Systems, vol. 30, no. 9, pp. 2755–2763, 2019. [Google Scholar]
13. X. Wang, J. Zhang, H. Qu, Y. Guo and X. Tong, “Intelligent analysis model of behavior decision based on EEG physiological information,” in Proc. of 2021 Chinese Intelligent Systems Conf., Fuzhou, Fujian, China, pp. 396–405, 2022. [Google Scholar]
14. A. Sharma, “Epileptic seizure prediction using power analysis in beta band of EEG signals,” in Proc. of 2015 Int. Conf. on Soft Computing Techniques and Implementations, Faridabad, Haryana, India, pp. 117–121, 2015. [Google Scholar]
15. W. Yin, K. Kann, M. Yu and H. Schütze, “Comparative study of CNN and RNN for natural language processing,” arXiv preprint arXiv:1702. 01923, 2017. [Google Scholar]
16. J. Fedjaev, Decoding eeg Brain Signals using Recurrent Neural Networks. USA: GRIN Verlag, 2019. [Online]. Available at: https://api.pageplace.de/preview/DT0400.9783668865020_A39229703/preview9783668865020_A39229703.pdf. [Google Scholar]
17. S. Alhagry, A. A. Fahmy and R. A. El-Khoribi, “Emotion recognition based on EEG using LSTM recurrent neural network,” Emotion, vol. 8, no. 10, pp. 355–358, 2017. [Google Scholar]
18. H. Apaydin, H. Feizi, M. T. Sattari, M. S. Colak, S. Shamshirband et al., “Comparative analysis of recurrent neural network architectures for reservoir inflow forecasting,” Water, vol. 12, no. 5, pp. 1500, 2020. [Google Scholar]
19. J. León, J. J. Escobar, A. Ortiz, J. Ortega, J. González et al., “Deep learning for EEG-based motor imagery classification: Accuracy-cost trade-off,” PloS One, vol. 15, no. 6, pp. e0234178, 2020. [Google Scholar]
20. G. Zhang, V. Davoodnia, A. Sepas-Moghaddam, Y. Zhang and A. Etemad, “Classification of hand movements from EEG using a deep attention-based LSTM network,” IEEE Sensors Journal, vol. 20, no. 6, pp. 3113–3122, 2019. [Google Scholar]
21. A. Craik, Y. He and J. L. Contreras-Vidal, “Deep learning for electroencephalogram (EEG) classification tasks: A review,” Journal of Neural Engineering, vol. 16, no. 3, pp. 031001, 2019. [Google Scholar]
22. S. Alhagry, A. A. Fahmy and R. A. El-Khoribi, “Emotion recognition based on EEG using LSTM recurrent neural network,” Emotion, vol. 8, no. 10, pp. 355–358, 2017. [Google Scholar]
23. D. Wu, H. Wan, S. Liu, W. Yu, Z. Jin et al., “DeepBrain: Towards personalized EEG interaction through attentional and embedded LSTM learning,” arXiv preprint arXiv:2002.02086, 2002. [Google Scholar]
24. S. Kumar, A. Sharma and T. Tsunoda, “Brain wave classification using long short-term memory network based OPTICAL predictor,” Scientific Reports, vol. 9, no. 1, pp. 1–13, 2019. [Google Scholar]
25. J. Ma, H. Tang, W. L. Zheng and B. L. Lu, “Emotion recognition using multimodal residual LSTM network,” in Proc. of the 27th ACM Int. Conf. on Multimedia, Nice, Alpes-Maritimes, France, pp. 176–183, 2019. [Google Scholar]
26. H. Alaskar, “Convolutional neural network application in biomedical signals,” J Comput Sci Inform Tech, vol. 6, no. 2, pp. 45–59, 2018. [Google Scholar]
27. X. Wei, L. Zhou, Z. Chen, L. Zhang and Y. Zhou, “Automatic seizure detection using three-dimensional CNN based on multi-channel EEG,” BMC Medical Informatics and Decision Making, vol. 18, no. 5, pp. 71–80, 2018. [Google Scholar]
28. S. Hwang, K. Hong, G. Son and H. Byun, “Learning CNN features from DE features for EEG-based emotion recognition,” Pattern Analysis and Applications, vol. 23, no. 3, pp. 1323–1335, 2020. [Google Scholar]
29. J. Thomas, L. Comoretto, J. Jin, J. Dauwels, S. S. Cash et al., “EEG classification via convolutional neural network-based interictal epileptiform event detection,” in Proc. of 2018 40th Annual Int. Conf. of the IEEE Engineering in Medicine and Biology Society, Honolulu, Hawaii, USA, pp. 3148–3151, 2018. [Google Scholar]
30. Q. Liu, J. Cai, S. Z. Fan, M. F. Abbod, J. S. Shieh et al., “Spectrum analysis of EEG signals using CNN to model patient’s consciousness level based on anesthesiologists’ experience,” IEEE Access, vol. 7, no. 1, pp. 53731–53742, 2019. [Google Scholar]
31. J. Lee, K. Won, M. Kwon, S. C. Jun and M. Ahn, “CNN with large data achieves true zero-training in online P300 brain-computer interface,” IEEE Access, vol. 8, no. 1, pp. 74385–74400, 2020. [Google Scholar]
32. J. Cho and H. Hwang, “Spatio-temporal representation of an electoencephalogram for emotion recognition using a three-dimensional convolutional neural network,” Sensors, vol. 20, no. 12, pp. 3491, 2020. [Google Scholar]
33. K. Yue and D. Wang, “EEG-based 3D visual fatigue evaluation using CNN,” Electronics, vol. 8, no. 11, pp. 1208, 2019. [Google Scholar]
34. J. León, J. J. Escobar, A. Ortiz, J. Ortega and J. González, “Deep learning for EEG-based motor imagery classification: Accuracy-cost trade-off,” PloS One, vol. 15, no. 6, pp. e0234178, 2018. [Google Scholar]
35. R. Johnson and T. Zhang, “Semi-supervised convolutional neural networks for text categorization via region embedding,” Advances in Neural Information Processing Systems, vol. 28, pp. 919, 2015. [Google Scholar]
36. T. Wilaiprasitporn, A. Ditthapron, K. Matchaparn, T. Tongbuasirilai, N. Banluesombatkul et al., “Affective EEG-based person identification using the deep learning approach,” IEEE Transactions on Cognitive and Developmental Systems, vol. 12, no. 3, pp. 486–496, 2019. [Google Scholar]
37. A. Tursunov, J. Y. Choeh and S. Kwon, “Age and gender recognition using a convolutional neural network with a specially designed multi-attention module through speech spectrograms,” Sensors, vol. 21, no. 17, pp. 5892, 2021. [Google Scholar]
38. S. Ioffe and C. Szegedy, “Batch normalization: Accelerating deep network training by reducing internal covariate shift,” in Proc. of Int. Conf. on Machine Learning, Lille, Nord, France, pp. 448–456, 2015. [Google Scholar]
39. A. G. Howard, M. Zhu, B. Chen, D. Kalenichenko, W. Wang et al., “Mobilenets: Efficient convolutional neural networks for mobile vision applications,” arXiv preprint arXiv:1704.04861, 2017. [Google Scholar]
40. M. A. Rahman, M. F. Hossain, M. Hossain and R. Ahmmed, “Employing PCA and t-statistical approach for feature extraction and classification of emotion from multichannel EEG signal,” Egyptian Informatics Journal, vol. 21, no. 1, pp. 23–35, 2020. [Google Scholar]
41. J. Hu, L. Shen and G. Sun, “Squeeze-and-excitation networks,” in Proc. of the IEEE Conf. on Computer Vision and Pattern Recognition, Salt Lake City, UT, USA, pp. 7132–7141, 2018. [Google Scholar]
42. P. Golnar-Nik, S. Farashi and M. S. Safari, “The application of EEG power for the prediction and interpretation of consumer decision-making: A neuromarketing study,” Physiology & Behavior, vol. 207, no. 1, pp. 90–98, 2019. [Google Scholar]
43. H. F. Posada-Quintero, N. Reljin, J. B. Bolkhovsky, A. D. Orjuela-Cañón and K. H. Chon, “Brain activity correlates with cognitive performance deterioration during sleep deprivation,” Frontiers in Neuroscience, vol. 13, pp. 1001, 2019. [Google Scholar]
44. G. D. Flumeri, G. Borghini, P. Aricò, N. Sciaraffa, P. Lanzi et al., “EEG-based mental workload neurometric to evaluate the impact of different traffic and road conditions in real driving settings,” Frontiers in Human Neuroscience, vol. 12, no. 1, pp. 509, 2018. [Google Scholar]
45. H. Tang, W. Liu, W. L. Zheng and B. L. Lu, “Multimodal emotion recognition using deep neural networks,” in Proc. of Int. Conf. on Neural Information Processing, Guangzhou, Guangdong, China, pp. 811–819, 2017. [Google Scholar]
46. Y. Liu, “The relationship between negative emotions and burnout in military medical university students: The mediating effect of fatigue,” Journal of the Second Military Medical University, vol. 4, no. 5, pp. 554–559, 2019. [Google Scholar]
47. T. Zhang, Z. Cui, C. Xu, W. Zheng and J. Yang, “Variational pathway reasoning for EEG emotion recognition,” in Proc. of AAAI Conf. on Artificial Intelligence, New York, NY, USA, vol. 34, no. 3, pp. 2709–2716, 2020. [Google Scholar]
48. T. Zhang, W. Zheng, Z. Cui, Y. Zong and Y. Li, “Spatial-temporal recurrent neural network for emotion recognition,” IEEE Transactions on Cybernetics, vol. 49, no. 3, pp. 839–847, 2018. [Google Scholar]
49. T. Song, W. Zheng, P. Song and Z. Cui, “EEG emotion recognition using dynamical graph convolutional neural networks,” IEEE Transactions on Affective Computing, vol. 11, no. 3, pp. 532–541, 2018. [Google Scholar]
50. P. Zhong, D. Wang and C. Miao, “EEG-based emotion recognition using regularized graph neural networks,” IEEE Transactions on Affective Computing, vol. 1, no. 1, pp. 1, 2020. [Google Scholar]
51. C. C. Chang and C. J. Lin, “LIBSVM: A library for support vector machines,” ACM Transactions on Intelligent Systems and Technology, vol. 2, no. 3, pp. 1–27, 2011. [Google Scholar]
52. X. Hu, S. Yuan, F. Xu, Y. Leng, K. Yuan et al., “Scalp EEG classification using deep Bi-LSTM network for seizure detection,” Computers in Biology and Medicine, vol. 124, pp. 103919, 2020. [Google Scholar]
53. J. Li, Z. Zhang and H. He, “Hierarchical convolutional neural networks for EEG-based emotion recognition,” Cognitive Computation, vol. 10, no. 2, pp. 368–380, 2021. [Google Scholar]
54. F. Shen, G. Dai, G. Lin, J. Zhang, W. Kong et al., “EEG-based emotion recognition using 4D convolutional recurrent neural network,” Cognitive Neurodynamics, vol. 14, no. 6, pp. 815–828, 2020. [Google Scholar]
55. G. Xiao, M. Shi, M. Ye, B. Xu, Z. Chen et al., “4D attention-based neural network for EEG emotion recognition,” Cognitive Neurodynamics, vol. 3, no. 1, pp. 1–14, 2022. [Google Scholar]
56. V. B. Strelets, Z. V. Garakh, V. Y. Novototskii-Vlasov and R. A. Magomedov, “Relationship between EEG power and rhythm synchronization in health and cognitive pathology,” Neuroscience and Behavioral Physiology, vol. 36, no. 6, pp. 655–662, 2006. [Google Scholar]
57. Y. Li, W. Zheng, L. Wang, Y. Zong and Z. Cui, “From regional to global brain: A novel hierarchical spatial-temporal neural network model for EEG emotion recognition,” IEEE Transactions on Affective Computing, vol. 13, no. 2, pp. 568–578, 2019. [Google Scholar]
58. A. Shamsoshoara, F. Afghah, A. Razi, L. Zheng, P. Z. Fulé et al., “Aerial imagery pile burn detection using deep learning: The FLAME dataset,” Computer Networks, vol. 193, no. 8, pp. 108001, 2021. [Google Scholar]
59. D. Dua and C. Graff, “UCI machine learning repository [http://archive.ics.uci.edu/ml]. Irvine, CA: University of california, school of information and computer science,” IEEE Transactions on Pattern Analysis and Machine Intelligence, vol. 1, no. 1, pp. 1–29, 2019. [Google Scholar]
Cite This Article
 Copyright © 2023 The Author(s). Published by Tech Science Press.
This work is licensed under a Creative Commons Attribution 4.0 International License , which permits unrestricted use, distribution, and reproduction in any medium, provided the original work is properly cited.
 Downloads
 Citation Tools