
 Submit a Paper
 Propose a Special lssue
 Open Access
ARTICLE

Extraction of Strain Characteristic Signals from Wind Turbine Blades Based on EEMD-WT
1 School of Mechanical Engineering, Inner Mongolia University of Technology, Hohhot, 010051, China
2 School of Energy and Power Engineering, Inner Mongolia University of Technology, Hohhot, 010051, China
3 Inner Mongolia Key Laboratory of Wind energy and Solar Energy Utilization Mechanism and Optimization, Hohhot, 010051, China
* Corresponding Author: Zhen Liu. Email:
(This article belongs to the Special Issue: Wind Energy Development and Utilization)
Energy Engineering 2023, 120(5), 1149-1162. https://doi.org/10.32604/ee.2023.025209
Received 28 June 2022; Accepted 14 November 2022; Issue published 20 February 2023
 View Full Text
 Download PDF
Abstract
Analyzing the strain signal of wind turbine blade is the key to studying the load of wind turbine blade, so as to ensure the safe and stable operation of wind turbine in natural environment. The strain signal of the wind turbine blade under continuous crosswind state has typical non-stationary and unsteady characteristics. The strain signal contains a lot of noise, which makes the analysis error. Therefore, it is very important to denoise and extract features of measured signals before signal analysis. In this paper, the joint algorithm of ensemble empirical mode decomposition (EEMD) and wavelet transform (WT) is used for the first time to achieve sufficient noise reduction and effectively extract the feature signals of non-stationary strain signals. The application process of EEMD-WT is optimized. This optimization can avoid the repeated selection of wavelet basis function and the number of decomposition layers due to different crosswind conditions. EEMD adaptively decomposes the strain signal into intrinsic mode functions, to judge the frequency of IMFs, remove the high-frequency noise components, retain the useful components. The useful components are denoised twice by the wavelet transform, the components and residual terms after the secondary denoising are reconstructed to obtain the characteristic signal. The EEMD-WT was applied to process the simulating signals and measured the strain signals. The results were compared with the results of the EEMD. The results showed that the EEMD-WT method has better noise reduction performance, and can effectively extract the characteristics of strain signals, which lays a solid foundation for accurate analysis of wind turbine blade strain signals under crosswind conditions.Keywords
The wind direction of natural wind is influenced by terrain, temperature and other factors. The operation process of wind turbine is affected by different wind directions. [1,2]. The continuously changing wind direction makes the load of the wind turbine blade change dynamically. The variable load will cause damage to the blades. Therefore, the noise reduction and characteristic extraction of blade strain signals during the operation are beneficial to improving the reliability of signal analysis, and have positive effects on accurately avoiding damage to wind turbines caused by extreme wind direction changes and prolonging the service life of wind turbines.
The crosswind angle changed continuously from 0° to 45°. The measured strain signals showed typical non-stationary and unsteady characteristics with the variation of crosswind angle. However, there are few studies on blade strain signal processing under continuous crosswind condition, simple methods such as taking average value and Butterworth low-pass filtering are mostly used, which is extremely difficult to accurately analyze the influence of crosswind on strain [3]. Actual wind turbine operation, on the other hand, in the process of the strain signal is affected by factors such as environment, test system, with high frequency noise, the noise can make the original signal frequency, amplitude distortion, make the analysis error, unable to guarantee the reliability of the strain analysis results. Therefore, it is necessary to start with the processing method of the measured strain signal, decompose and de-noise the signal and extract the characteristic signal [4].
In recent years, the methods used for non-stationary signal processing mainly include short-time Fourier transformation (STFT), empirical mode decomposition (EMD), wavelet transform (WT), local mean decomposition (LMD), etc. Li et al. [5] conducted wavelet processing on gear mechanical vibration signals, analyzed the influence of the number of wavelet decomposition layers on the noise reduction performance by selecting correlation thresholds. Lin et al. [6] used sym5 as the wavelet function to decompose and reconstruct heart sound signals, achieving the purpose of noise removal. Liu et al. [7] studied the signal decomposition and noise reduction of maglev gyro rotor by using the method of local mean decomposition.
At present, the non-stationary signal processing methods are not limited to the above, more methods are used to combine the above improved algorithm with other algorithms to make the signal after noise reduction pure. Kaergaard et al. [8] considered the mode mixing effect of empirical mode decomposition and the ability of neural network algorithm to de-noise efficiently, adopted the method of combining ensemble empirical mode decomposition (EEMD) and neural network algorithm. The combined algorithm could avoid mode mixing and achieve better de-noising performance. Zhao et al. [9] proposed a method combining the least square mutual information algorithm and chaotic quantum particle swarm optimization algorithm for signal decomposition in view of the mode mixing problem in the decomposition of surface EMG signals. The least square mutual information algorithm calculates the correlation between the intrinsic mode function, reduces the mode mixing, the chaotic quantum particle swarm optimization algorithm improves the iteration rate. Jia et al [10] used the method of combining grey criterion and ensemble empirical mode decomposition to reduce the noise of non-stationary hob vibration signals.
The method of reference [8] can eliminate mode mixing, the combination with neural network realizes the adaptation of wavelet transform. However, according to the analysis in this paper, the noise reduction effect of wavelet neural network is not optimal. In reference [9], an optimized complementary ensemble empirical mode decomposition (OCEEMD) method was proposed. Chaotic quantum particle swarm optimization (CQPSO) was used to search for the optimal solution of the standard deviation of Gaussian white noise to improve the iteration efficiency of CEEMD. The RMSE of OCEEMD is smaller than that of CEEMD and CEEMDAN, OCEEMD has better noise reduction performance. The method of reference [10] can achieve good noise reduction performance in most cases, but the noise reduction performance is not good when the analog input SNR value is high. Combined with the above non-stationary signal processing method and the two characteristics of the measured strain signal including high-frequency noise interference and non-stationary characteristics, in order to avoid mode mixing and accurately extract feature signals, in this paper, EEMD and WT are combined to EEMD-WT [11], compared with EEMD method. The above two methods are used to process the wind turbine blade strain signal under continuous crosswind condition.
EMD and WT are common methods for processing non-stationary signals, but the single algorithm has some problems such as mode mixing and poor adaptability in practical use. In this paper, EEMD and EEMD-WT algorithms are used to de-noise the strain signals, respectively.
2.1 Theory of Ensemble Empirical Mode Decomposition
EEMD takes EMD as the core. This algorithm inherits all the advantages of EMD, it does not need to set the basis function in advance before decomposition, it has good adaptive characteristics. The improvement of EEMD compared with EMD is that EEMD adds white noise to the signal to be decomposed, so as to solve the problem of mode mixing. Because white noise has the characteristic of uniform spectrum distribution, the signals of different time scales can be automatically decomposed into appropriate reference scales during signal decomposition, then the intrinsic mode function (IMF) after multiple decomposition is calculated on the whole average, so as to realize the mutual cancellation of noises.
EEMD can be divided into the following steps [12]:
Step 1: Gaussian white noise
Step 2: Find the maximum and minimum points in signal
Step 3: Subtract the mean
Step 4: Check whether
Step 5: After the first intrinsic mode function
Step 6: Take
The stop criterion usually takes standard deviation parameter (SD) as the judgment criterion, namely:
The signal
2.2 Theory of Wavelet Transform
When the non-stationary signal is denoised by wavelet threshold, the following steps should be experienced: ① The appropriate wavelet basis function should be selected according to the characteristics of signals, the wavelet system with orthogonality and compact support should be generally selected; ② To consider the appropriate number of decomposition layers, however, there is no fixed empirical formula for the selection of decomposition layers, it is necessary to carry out repeated tests and verification according to the characteristics of signals; ③ Select the threshold function, and use the selected threshold form to process the detail component to achieve the effect of removing noise; ④ The signal is reconstructed to get the signal after noise reduction.
The wavelet coefficients obtained by soft threshold denoising decomposition have good continuity. When the absolute value of the wavelet coefficients is greater than the set threshold, the threshold is subtracted. When it is below the threshold, set it to zero. The relation of soft threshold is as follows:
2.3 Joint Noise Reduction Method of EEMD-WT
In the process of signal decomposition, EEMD can avoid mode mixing and has self-adaptability, which can decompose the signal adaptively into several intrinsic mode functions and a residual term. Wavelet can further filter the noise in the signal based on the algorithm of ensemble empirical mode decomposition. Wavelet denoising algorithm firstly to determine the wavelet functions and decomposition scale, in terms of the choice of wavelet basis function, the primary choice engineering with orthogonality and compactly supported wavelet series, such as,
(1) The original signal
(2) Calculate the instantaneous frequency of each intrinsic mode function and judge the physical significance of each layer of IMF according to the frequency;
(3) If IMF is a noise signal, it is eliminated; If IMF at this layer is a useful signal, then ‘coif4’ wavelet is used to carry out wavelet decomposition and reconstruction, so as to further reduce IMF noise at this layer and obtain IMF′;
(4) The useful signal IMF′ of each layer after wavelet decomposition and reconstruction is reconstructed to obtain the signal after noise reduction.
To sum up, the joint noise reduction algorithm flow of EEMD-WT is shown in Fig. 1.
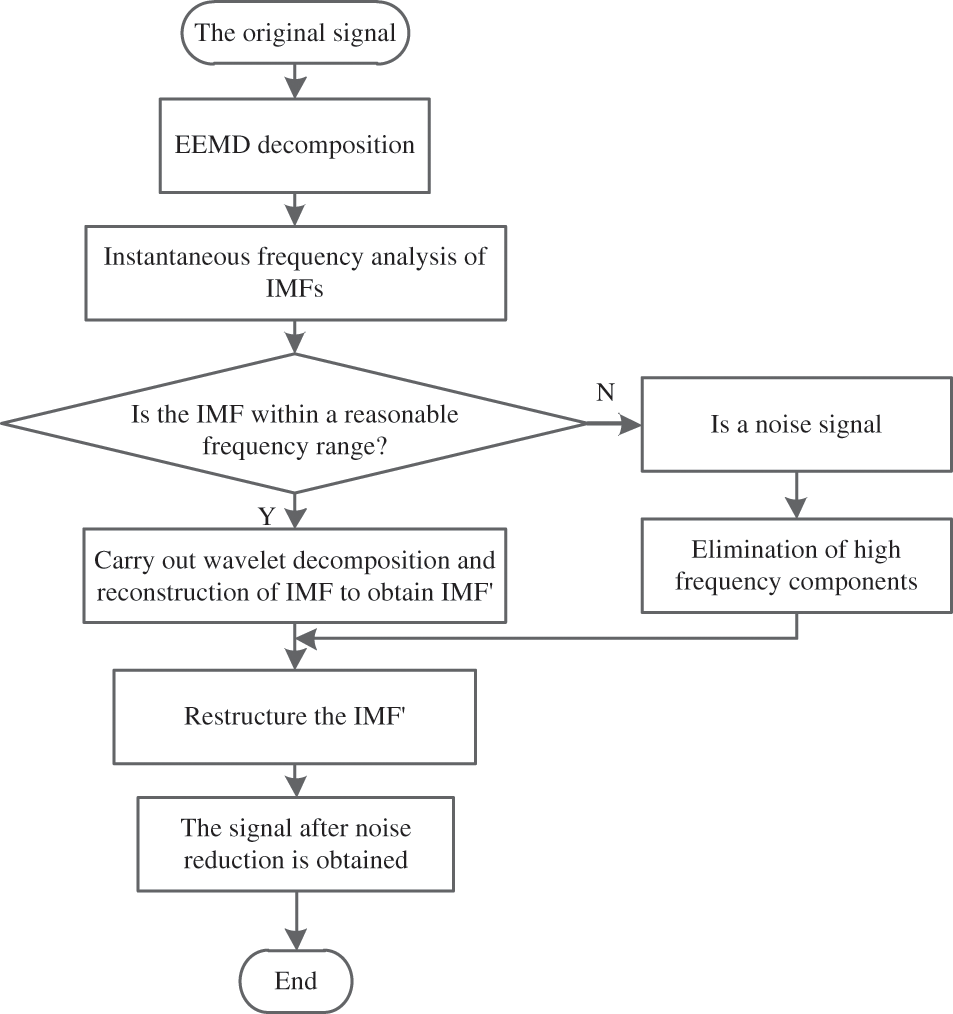
Figure 1: EEMD-WT joint noise reduction algorithm flow
In this paper, the EEMD-WT method is based on the preliminary analysis of the reasonable frequency range of the wind turbine blade strain signal. Judging the IMFs frequency obtained by decomposition, IMFs greater than the reasonable frequency range are noise components, which are removed, otherwise judged as useful IMFs, and wavelet denoising. Its advantage is that it avoids noise reduction for useless IMFs and only performs wavelet noise reduction for useful IMFs. The efficiency of signal noise reduction is improved, the noise reduction process is more reasonable.
3.1 Construction of Simulation Signal
The joint algorithm of EEMD-WT can de-noise non-stationary signals. In order to verify the feasibility and reliability of the algorithm, the simulation is carried out according to the time-frequency characteristics of the measured strain signals. The simulation signals are decomposed and reconstructed to obtain the characteristic signals, and the de-noising effect is evaluated. As the crosswind angle changes continuously from 0° to 45°, the frequency and amplitude of the measured strain signal decrease gradually, the strain variation trend in the whole crosswind condition is approximately sinusoidal. Therefore, the `fmlin' function is used to generate the linear frequency modulation signal z(t), function
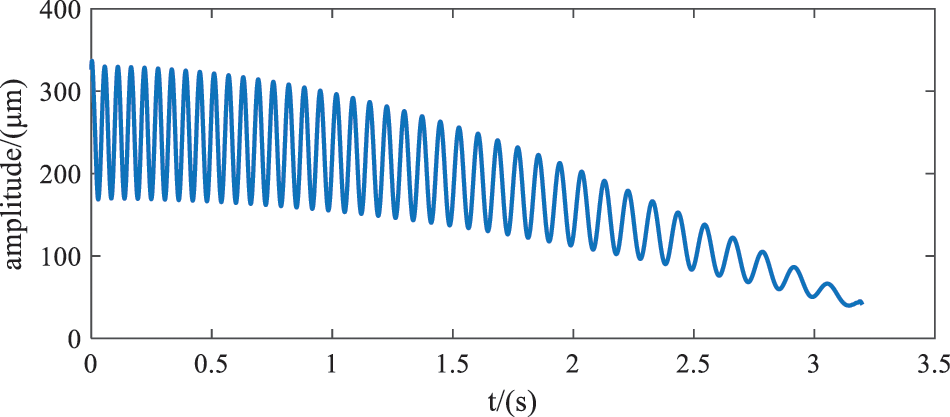
Figure 2: The ideal signal
According to the noise type of the measured strain signal, three types of noise are added to the ideal signal: random noise generated by ‘randn’ function, cosine noise with frequency of 100 Hz, and intermittent cosine noise with frequency of 50 Hz. Thus, the simulation signal is:
Simulation signal is shown in Fig. 3.
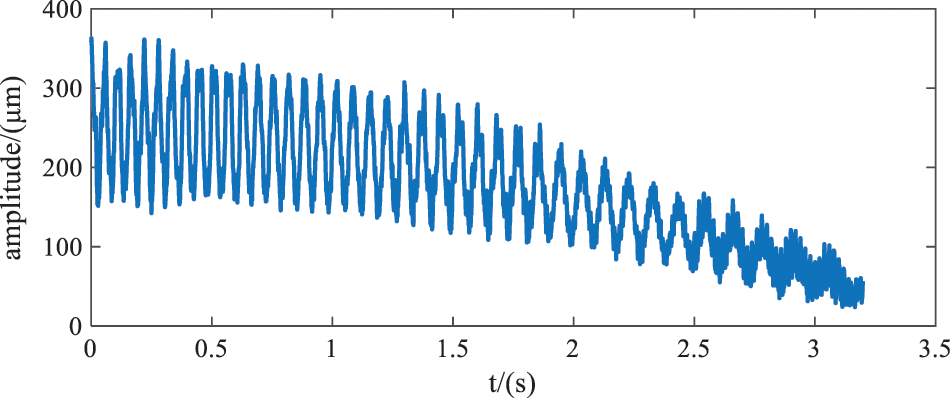
Figure 3: Simulation signal
3.2 Simulation Signal Processing
The results of EEMD and IMF instantaneous frequency of simulation signals are shown in Fig. 4. As can be seen from Fig. 4b, the frequency components of IMF1 was disorderly. Fig. 4b clearly shows that IMF2 contains 100 Hz frequency and other frequency components, which is difficult to obtain a single frequency component by decomposition, 100 Hz is the main frequency of IMF2. The frequency of IMF3 changes with time, the frequency intermittently appears 50 and 100 Hz, indicating that the decomposed signal IMF3 has mode mixing, making the main frequency component of IMF 50 Hz and a small amount of 100 Hz frequency, which is related to the intermittent noise added to the simulation signal. The frequency of IMF4 is mainly 16.88 Hz. Since EEMD extracts a detail signal each time, the component with the highest signal frequency is extracted first, the frequency of the remaining signal is lower than all the extracted signal frequencies, that is, it is obtained by the filtering characteristics of EEMD, then the frequency gradually decreases. The subsequent frequencies are 12.5, 8.125, 2.5 Hz, etc. Therefore, it can be judged that IMF4~IMF10 is the intrinsic mode function containing the characteristic components of the simulation signal.
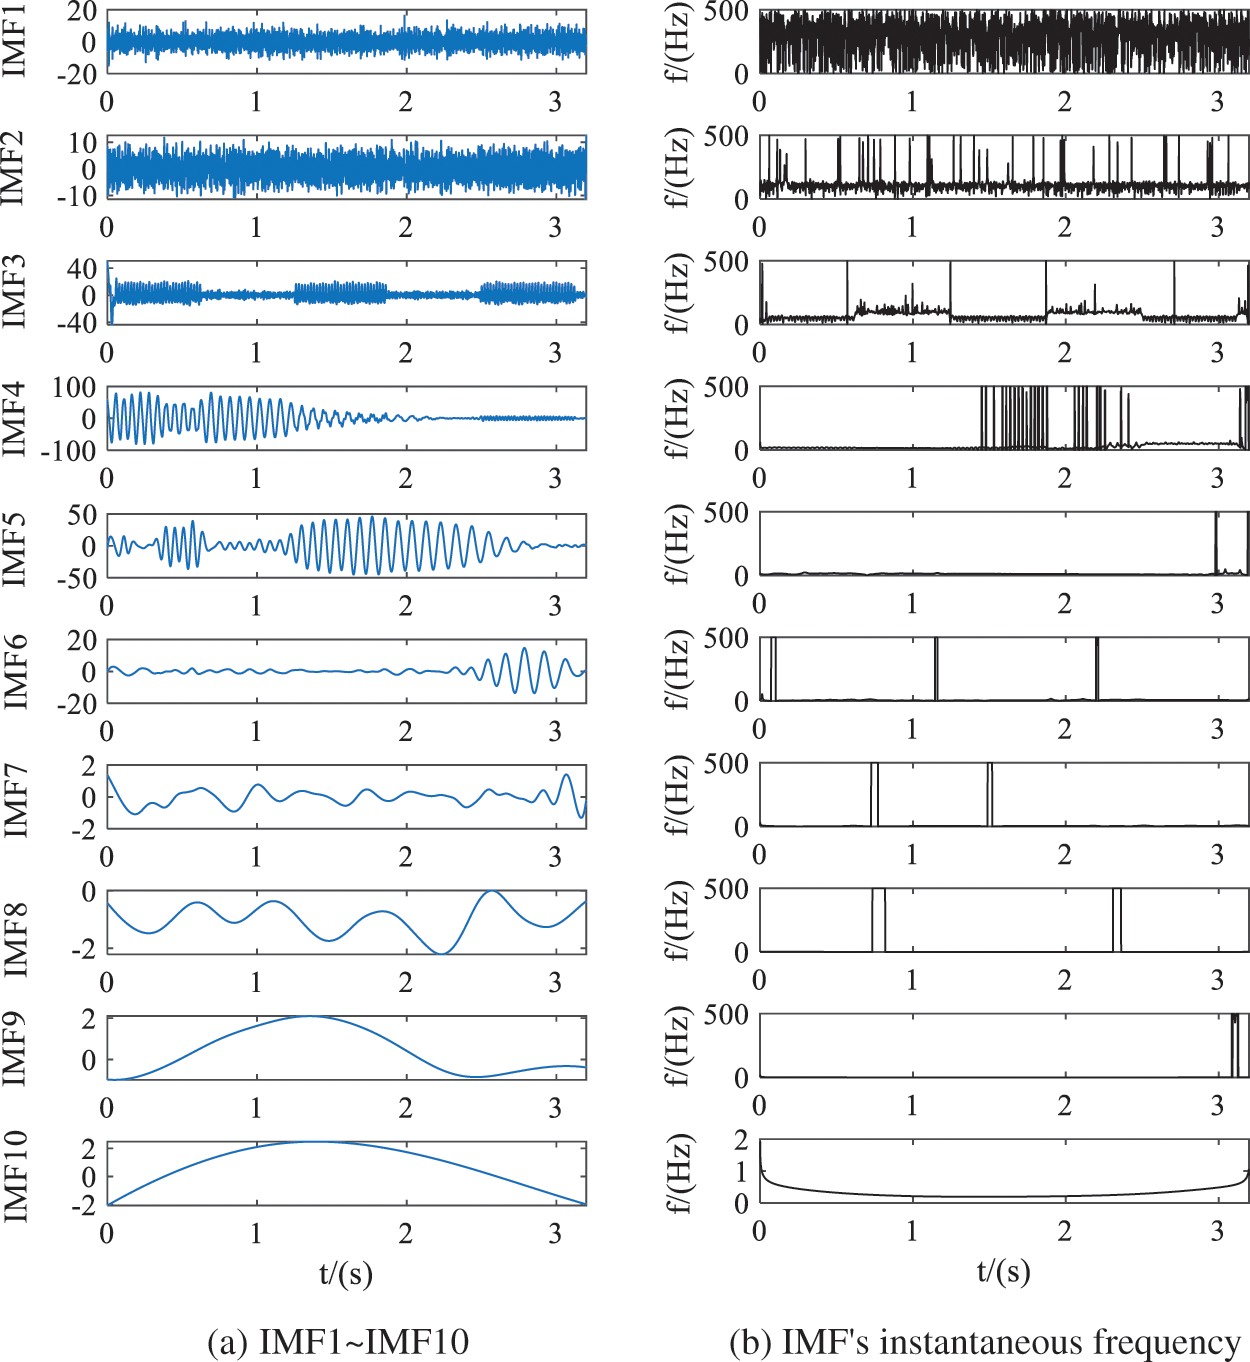
Figure 4: Decomposition results and instantaneous frequency of EEMD
Joint denoising algorithm is based on EEMD to carry out wavelet secondary denoising. According to the above analysis, IMF1–IMF3 has been judged as noise signal, wavelet is used to further de-noise IMF4–IMF10. The results and instantaneous frequency of EEMD-WT combined de-noising algorithm are shown in Fig. 5. By comparing the intrinsic mode functions corresponding to Figs. 4a and 5a, the high-frequency components of IMF4 in Fig. 5a are filtered out after 2 s. By comparing the instantaneous frequencies corresponding to IMF in Figs. 4b and 5b, it can be found that the noise in IMF4 is greatly weakened.
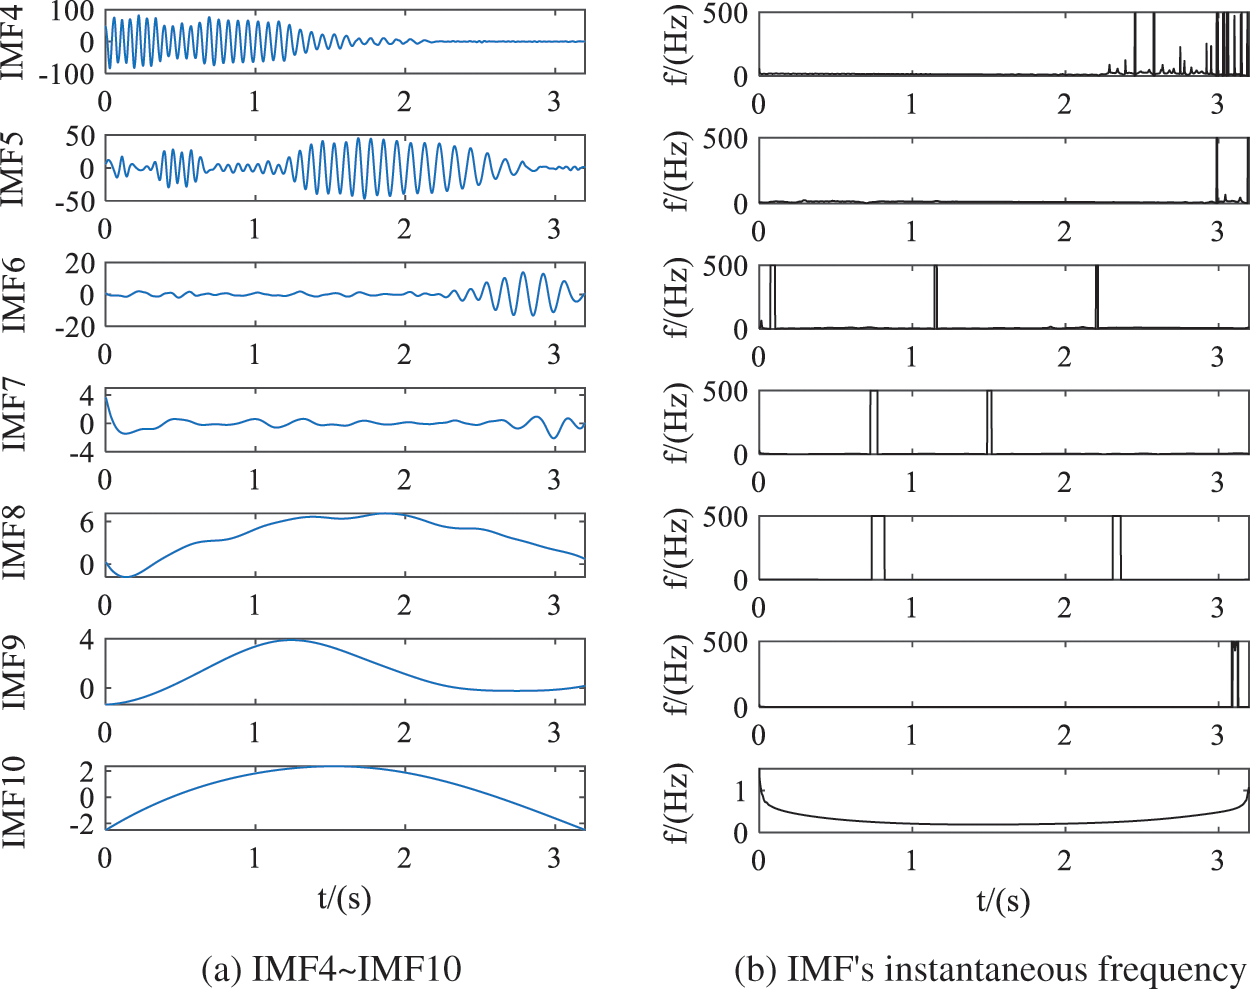
Figure 5: Decomposition results and instantaneous frequency of the joint algorithm
The intrinsic mode functions of EEMD-WT joint algorithm and the residual terms of EEMD were reconstructed to obtain the characteristic signals of simulation signals. The waveform comparison of reconstructed signals, simulation signals and ideal signals of the two algorithms is shown in Fig. 6. Green is the simulation signal, blue is the reconstruction signal of EEMD, red is the ideal signal, and black is the reconstruction signal of EEMD-WT. By comparing the reconstructed signal waveform of EEMD-WT and the simulated signal waveform, it can be seen intuitively that the joint algorithm can eliminate signal noise to a large extent. Compared with the reconstructed signal waveform using EEMD alone and EEMD-WT, EEMD-WT has better noise reduction performance. It can be seen from the comparison between the time domain waveform of EEMD-WT reconstructed signal and the simulation signal waveform that the signal can better reveal the real characteristics of the signal after EEMD-WT decomposition, screening and reconstruction. The correlation coefficient between the reconstructed characteristic signal and the ideal signal is 0.9996, highly correlated.
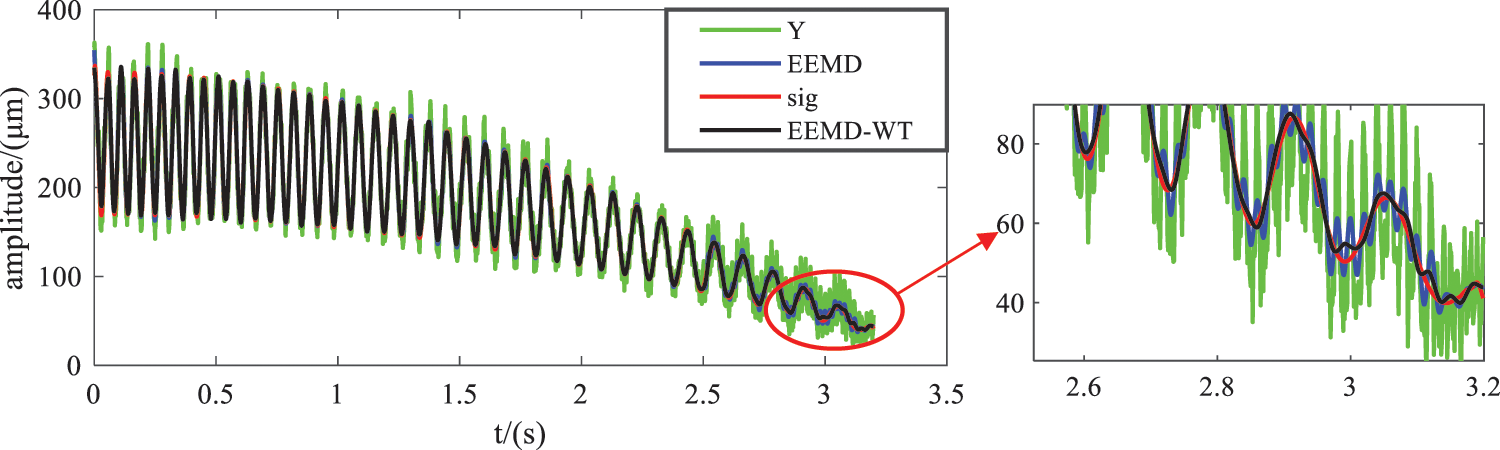
Figure 6: Comparison of reconstructed signals of the two algorithms
In the field of signal processing, signal-to-noise ratio (SNR), root mean square error (RMSE), smoothness (R) and determination coefficient (DC) are often used as evaluation indexes of noise reduction performance. SNR and RMSE focus on the details of signal, while R and DC focus on the approximate information of signal. The larger SNR indicates the better noise reduction performance. The smaller the root mean square error, smoothness and determination coefficient, the better [13,14]. In this paper, the above four indicators are selected to evaluate and compare the two noise reduction results of simulation signals. The calculation results are shown in Table 1.
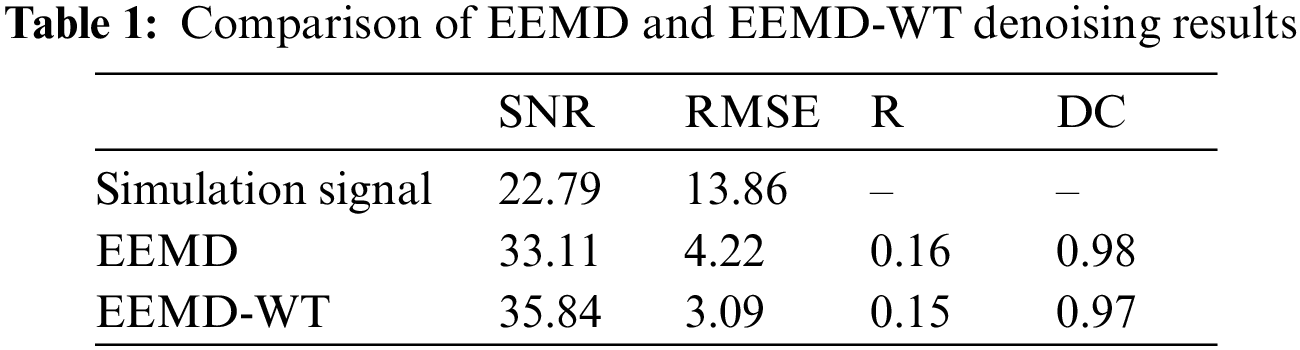
According to Table 1, the SNR of simulation signal is 22.79, and that of EEMD reconstructed signal is 33.11. The SNR of EEMD reconstructed signal is 45% higher than that of simulation signal, and that of EEMD-WT reconstructed signal is 57% higher. Both EEMD and EEMD-WT algorithms have certain noise reduction performance. By comparing the four evaluation indexes of reconstructed signals of EEMD and EEMD-WT algorithms, the combined algorithm has higher signal-to-noise ratio, smaller root mean square error, smoothness and determination coefficient of reconstructed signals, EEMD-WT combined algorithm has better noise reduction performance.
4 EEMD-WT Joint Algorithm Processing the Wind Turbine Blade Strain Signals
In this paper, the wind turbine blade strain experiment was carried out in the wind tunnel of the Key Laboratory of Wind energy and Solar Energy Utilization Technology of Ministry of Education, Inner Mongolia University of Technology. A three-blade horizontal axis wind turbine with a tower height of 1.7 m and a diameter of 1.4 m was used in the experiment. S series airfoil blades are made of wood. The rated wind speed of the wind turbine is 8 m/s, and the rated tip velocity ratio is 5. The flow direction provided by the wind tunnel was unchanged. The experimental wind turbine tower was installed on the dynamic yaw experimental platform developed by the research group. The servo motor drove the wind turbine tower to rotate, the method of rotation of the wind turbine tower was used to simulate the crosswind. In the experiment, the strain was measured by pasting two-axis strain gauges, the spanwise and chordal strains of each measurement point were measured in two directions. DH5953G stress test system was used to collect data, the computer was connected to DH5953G in the way of wireless AP for data transmission. The accuracy of the stress test system is 0.5% ± 3 με, the nonlinearity is less than 0.1%, the stability of the system is 1%/h, the time drift is less than 3 μV/h, temperature drift is less than 1 μV/°C, to ensure the accuracy and accuracy of the experimental data. The cross-wind angle changes continuously from 0° to 45°, the sampling frequency is 500 Hz. The speed of the cross-wind angle change is defined as the crosswind angular velocity. Six crosswind angular velocities are set in this test, namely 0.5°/s, 1°/s, 2°/s, 3°/s, 4°/s and 5°/s. The signal studied in this paper is the strain signal at the blade root position with the crosswind angular velocity of 3°/s, which is used to verify the effectiveness of EEMD-WT algorithm in noise reduction and feature extraction in the wind turbine blade strain signals.
Fig. 7 shows the original strain signal and spectrum of the wind turbine blade under continuous crosswind condition. As shown in Fig. 7a, the amplitude and frequency of the original signal strain change over time, showing non-stationary characteristics, as the crosswind angular velocity changes at a uniform speed of 3°/s. With the increase of the crosswind angle, the strain amplitude and frequency of the original signal decrease gradually. Fig. 7b shows the spectrum of the strain signal. The initial frequency value of the signal is between 8 and 9 Hz, then the frequency gradually decreases, so the overall frequency of the strain signal is less than 9 Hz. In this paper, EEMD and EEMD-WT methods were used to de-noise and extract characteristic signals of the strain signal.
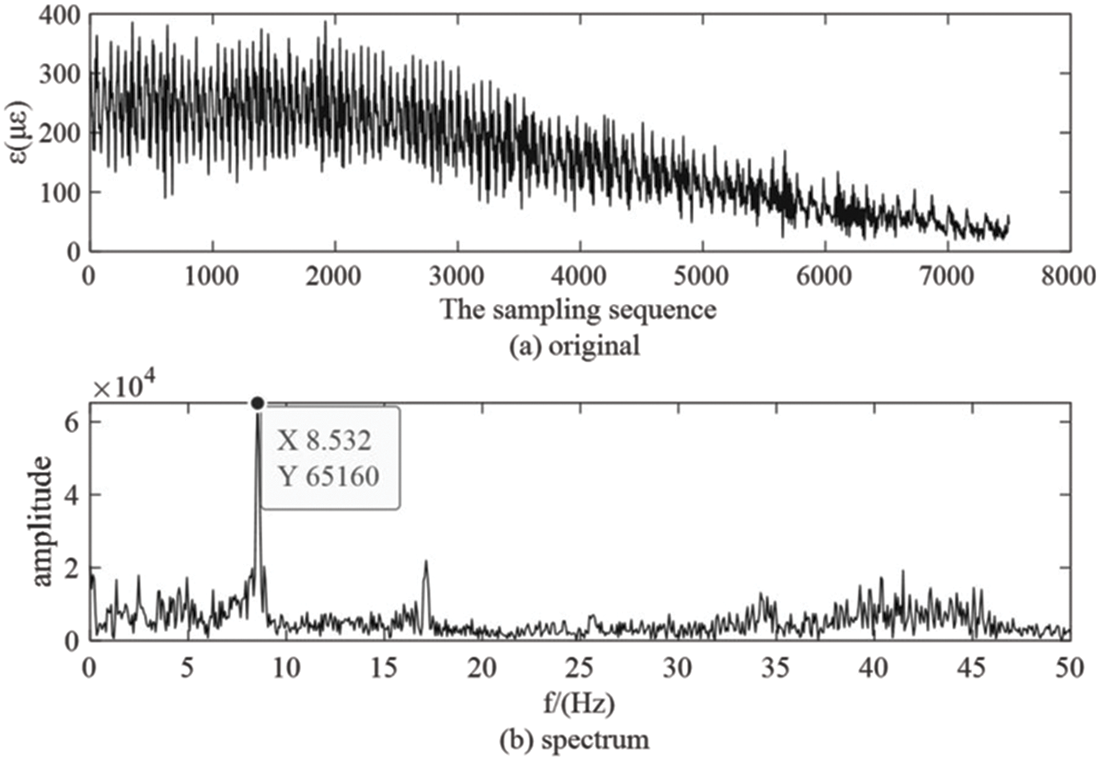
Figure 7: The original strain signal and spectrum measured at 3°/s blade root position
As shown in Fig. 8a, the original signal was decomposed by EEMD to obtain 11 layers of IMFs and one residual term. Compared with Figs. 8a and 8b, the instantaneous frequency of IMF1 was disorderly, which was caused by high-frequency noises such as vibration of wind turbine during operation. The frequency of IMF2 and IMF3 is between 40 and 50 Hz, this is the interference from the power noise and the natural frequency interference of the first mode shape. The instantaneous frequency of IMF4 is about 9 Hz, this is the frequency produced by a wind turbine blade rotating one turn, it is basically consistent with the ideal initial frequency obtained from the tip velocity ratio. As the crosswind angle increases, the signal frequency gradually decreases, according to the decomposition principle of EEMD, the frequencies of IMF5~IMF11 are lower than 9 Hz, IMF4~IMF11 are useful signals. Therefore, IMF1~IMF3 is judged as noise component, and wavelet denoising is carried out for IMF4 to IMF11.
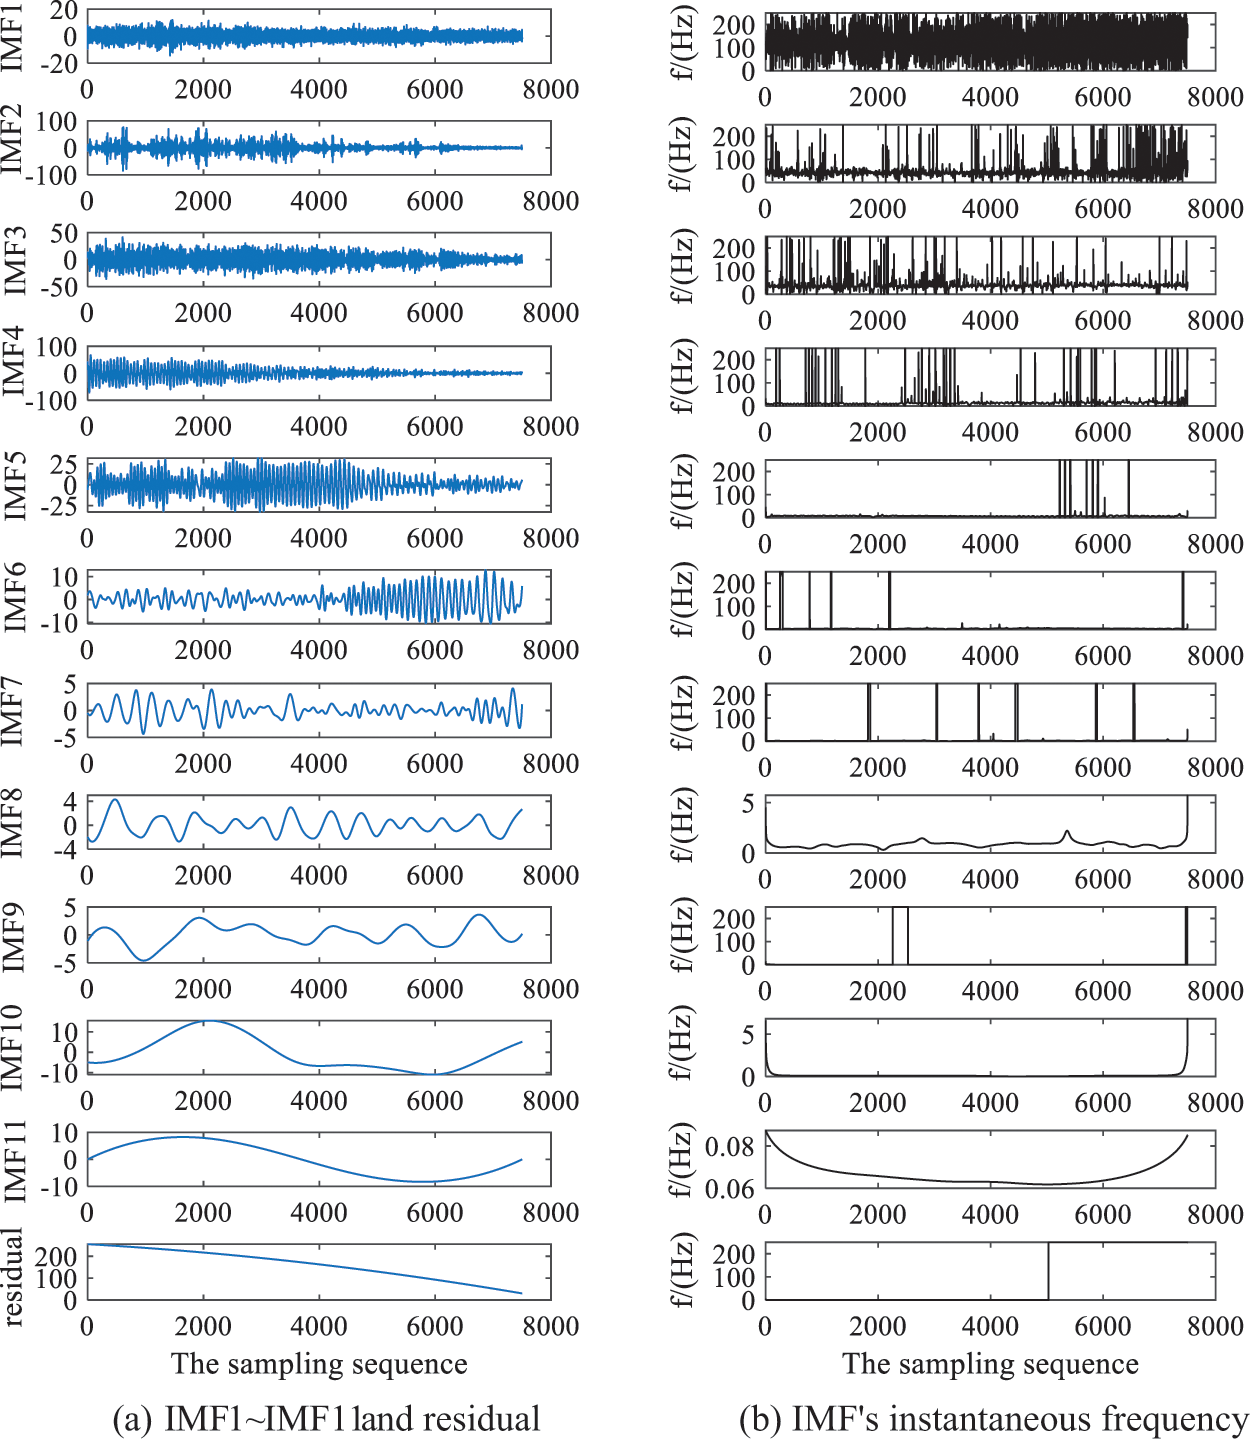
Figure 8: Decomposition results and instantaneous frequency of EEMD
Fig. 9a shows the IMF denoised by EEMD-WT, and Fig. 9b shows the instantaneous frequency of IMF. Compared with the instantaneous frequency in Figs. 9b and 8b, the noise of each layer is reduced. Fig. 9c shows the comparison of the original signal, the reconstructed signal of EEMD and the reconstructed signal of EEMD-WT. Green is the original signal, red is the reconstructed signal of EEMD and blue is the reconstructed signal of EEMD-WT. By comparing the two reconstructed signal waveforms with the original signal waveforms, the noise in the original signal has been filtered to a certain extent, but it is still not clear which algorithm has better noise reduction performance. The evaluation index is used to evaluate the noise reduction results of the two algorithms.
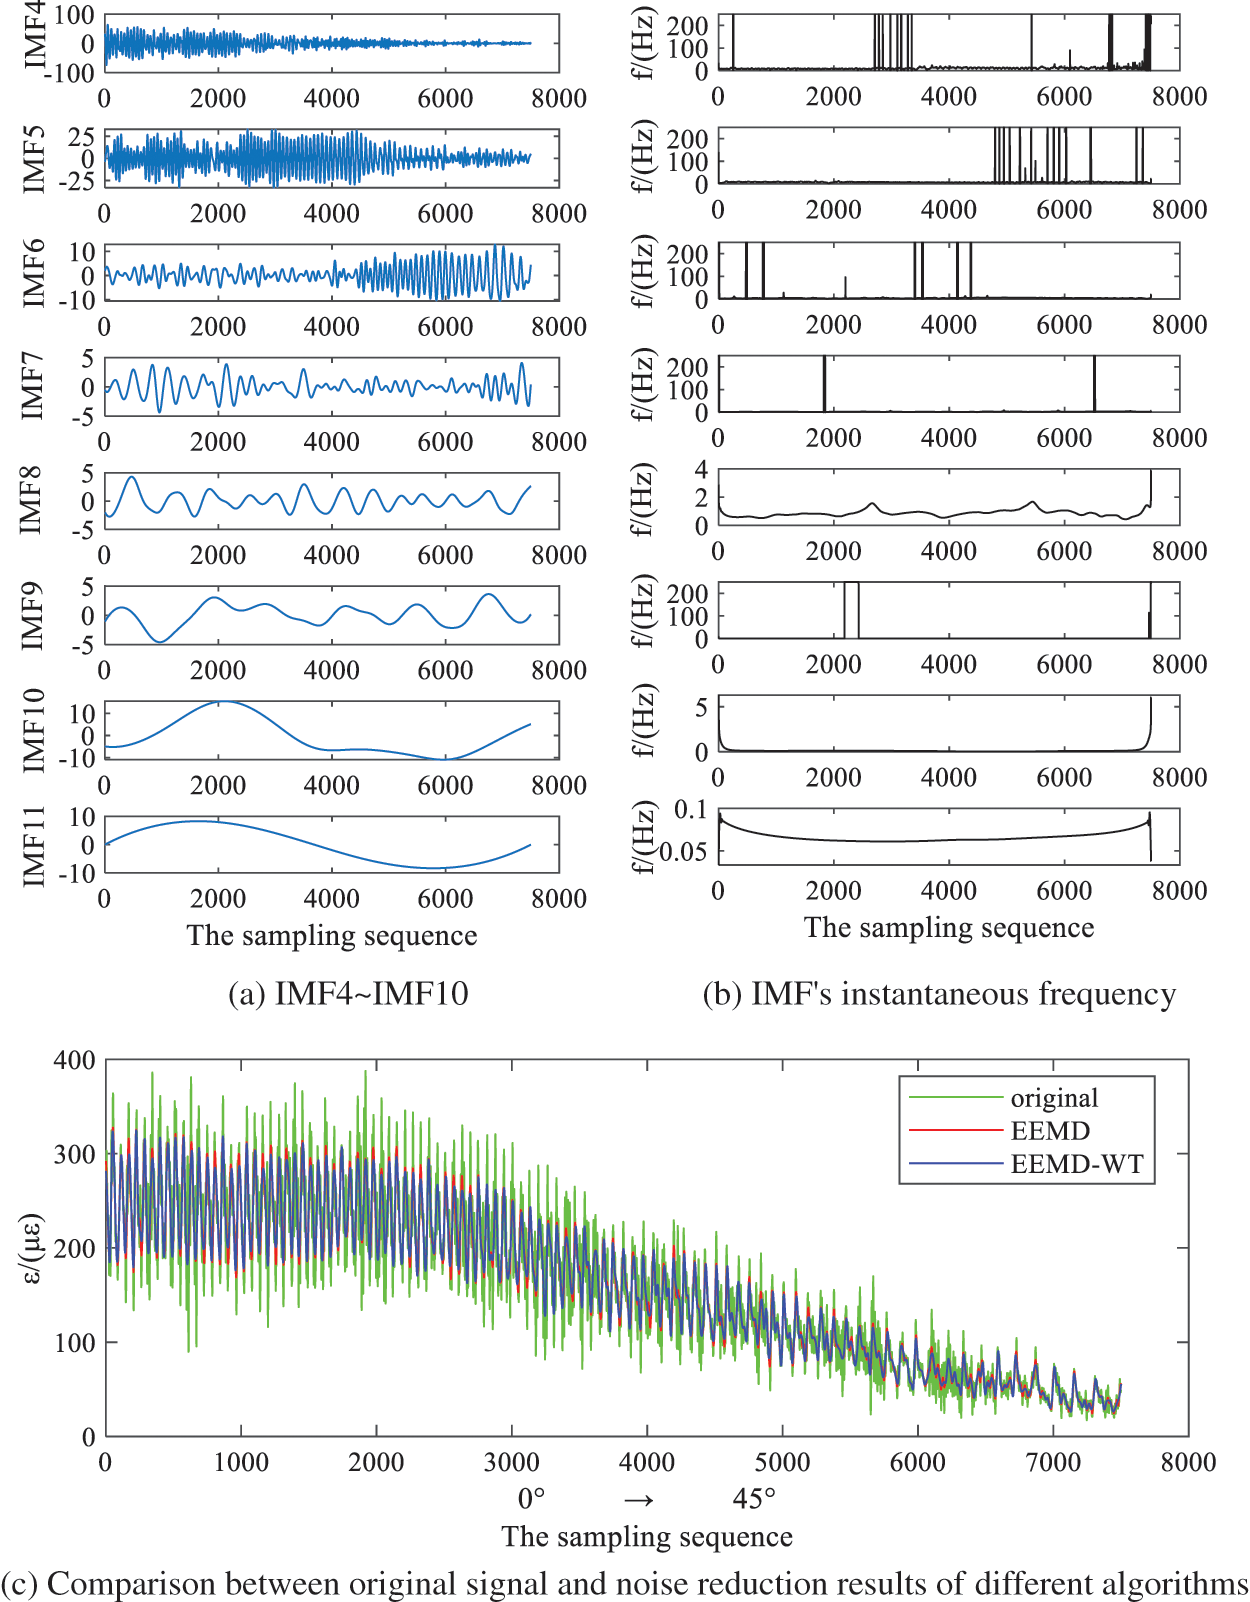
Figure 9: Comparison of EEMD-WT processing results and noise reduction results of different algorithms
The ideal signal cannot be obtained during the experiment, so smoothness and determination coefficient are taken as evaluation indexes of noise reduction performance, the results are shown in Table 2.
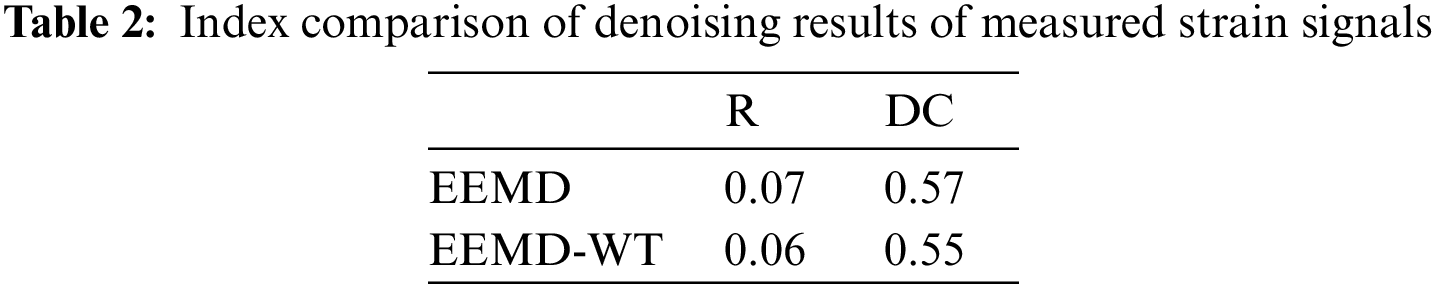
Two indexes, smoothness and determination coefficient, prove that the processing result of EEMD-WT joint noise reduction algorithm is better than that of EEMD.
The ultimate purpose of the wind turbine blade strain signal denoising is to extract strain characteristic signal and obtain the relationship between strain and continuous crosswind variation. In the case of cross wind velocity is constant, the strain amplitude and frequency with the change of crosswind angle, as shown in Fig. 9c, with the increase of crosswind angles, strain decreases, general and cannot directly reflect the changes of amplitude and frequency. Therefore, the frequency needs to be reflected through time-frequency diagram, and the characteristic signal should be de-trended first to avoid the influence of trend on frequency. As the crosswind angle changes continuously from 0° to 45°, the crosswind angular velocity deflects at an angular velocity of 3°/s, and the working time is 15 s.
The detrended characteristic signals are shown in Fig. 10a, the strain changes periodically. The reason is that under crosswind conditions, the axial induced speeds of blades rotating to different azimuth angles are different, resulting in different loads on blades rotating one circle, which shows periodic strain changes. With the increase of the crosswind angle, the periodic characteristics after the 5000th sampling point are gradually blurred, because the strain signal is similar to the noise signal, it is difficult to separate the strain signal from the noise signal. With the increase of the crosswind angle, the strain amplitude gradually decreases, which is because the centrifugal load decreases as the blade rotation speed decreases with the increase of crosswind angle.
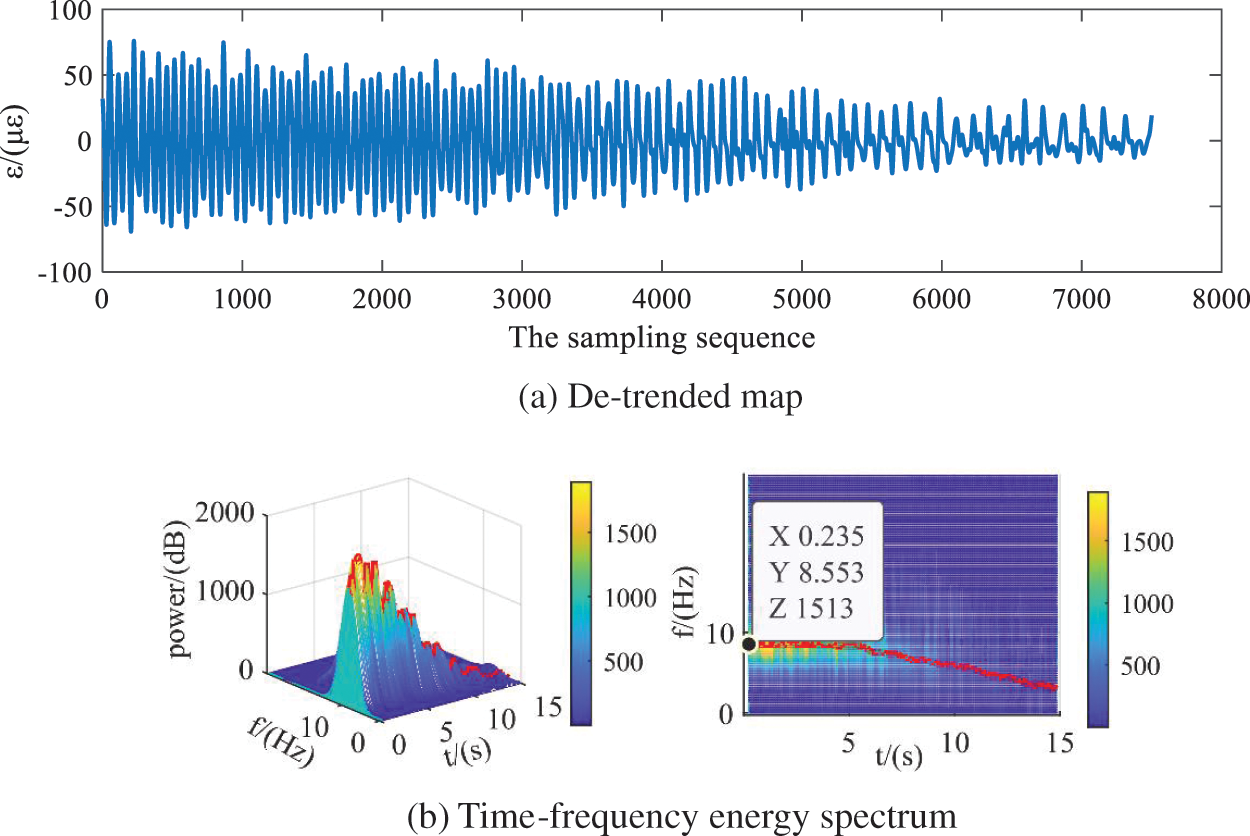
Figure 10: Detrended signal and time-frequency energy spectra
Fig. 10b for the time-frequency energy spectrum diagram, represents the changing relationship between frequency and time, the initial signal frequency is 8.553 Hz, it is basically consistent with the ideal initial frequency obtained from the tip velocity ratio, frequency along with the increase of crosswind angle became smaller, this is because with the increase of the crosswind angle, the blade speed decreases and the time for the periodic change of strain becomes longer.
The reconstructed signal processed by EEMD-WT joint algorithm is strain characteristic signal, which can reflect the change of strain amplitude and frequency with the crosswind angle. The EEMD-WT algorithm in this paper is applied to other crosswind angular velocities set in this experiment: 0.5°/s, 1°/s, 2°/s, 4°/s and 5°/s. EEMD-WT algorithm shows feasibility, adaptive and effectiveness in strain signal processing of the wind turbine blade.
In this paper, EEMD-WT joint algorithm was used to de-noise and reconstruct the strain signals of the wind turbine blade under crosswind condition, the noise of the measured signal has been filtered to a large extent. Refactoring to obtain the characteristics of the signal more accurately reflect the blade strain along with the change and the change law of crosswind angle, improve the reliability of the follow-up for blade strain signal feature extraction.
(1) EEMD and EEMD-WT algorithm are used to process the noise reduction and reconstruction of the simulation signal. The feature signal reconstructed by EEMD-WT algorithm has obvious noise reduction performance and is highly correlated with the ideal signal, which verifies the feasibility of the joint algorithm to process non-stationary signals.
(2) The feasibility of EEMD and EEMD-WT algorithms in processing the strain signals of the wind turbine blade is verified. By comparing various evaluation indexes of noise reduction performance, EEMD-WT algorithm has better performance in processing strain signals of the wind turbine blade in crosswind condition.
(3) After EEMD-WT processing the strain signal of the wind turbine, the noise in the reconstructed characteristic signal is greatly weakened, the initial frequency of the characteristic signal is basically consistent with the ideal initial frequency, so the characteristic signal can accurately reflect the change of strain signal frequency and amplitude with the crosswind angle. It is of great significance to explore the variation characteristics of blade strain under continuous crosswind.
Funding Statement: This work was supported by the National Natural Science Foundation of China (No. 51766014), the Natural Science Foundation of Inner Mongolia Autonomous Region (Nos. 2019MS05024, 2020MS05005) and Basic Scientific Research Funds of Colleges and Universities directly under the Autonomous Region (JY20220247).
Conflicts of Interest: The authors declare that they have no conflicts of interest regarding the present study.
References
1. Zhao, S., Li, X., Wang, J. (2022). Study of the flow mechanism of wind turbine blades in the yawed condition. Energy Engineering, 119(4), 1379–1392. DOI 10.32604/ee.2022.019776. [Google Scholar] [CrossRef]
2. Wang, J., Zhang, L., Huang, X., Zhang, J., Yuan, C. (2022). Initiation mechanism of transverse cracks in wind turbine blade trailing edge. Energy Engineering, 119(1), 407–418. DOI 10.32604/EE.2022.016439. [Google Scholar] [CrossRef]
3. Zhu, A., Xiao, Z., Zhao, Q. (2021). Power data preprocessing method of mountain wind farm based on POT-DBSCAN. Energy Engineering, 118(3), 549–563. DOI 10.32604/EE.2021.014177. [Google Scholar] [CrossRef]
4. Wang, Q., Li, D. (2017). Based on the analysis of EEMD signal feature extraction turbine swing degrees. The People of the Yangtze River, 48(5), 96–100. [Google Scholar]
5. Li, Y., Wang, Z., Li, Z., Li, H. (2021). Research on gear signal fault diagnosis based on wavelet transform denoising. Journal of Physics: Conference Series, 1971(1), 012074. DOI 10.1088/1742-6596/1971/1/012074. [Google Scholar] [CrossRef]
6. Lin, H. Y., Liang, S. Y., Ho, Y. L., Lin, Y. H., Ma, H. P. (2014). Discrete-wavelet-transform-based noise removal and feature extraction for ECG signals. IRBM, 35(6), 351–361. [Google Scholar]
7. Liu, D., Yang, Z., Wang, D., Li, H. (2022). Rotor maglev gyroscope signal local mean decomposition noise reduction research. Journal of Electronic Measurement and Instrument, 36(1), 20–27. [Google Scholar]
8. Kaergaard, K., Jensen, H., Puthusserypady, S. (2016). A comprehensive performance analysis of EEMD-BLMS and DWT-NN hybrid algorithms for ECG denoising. Biomed Signal Process Control, 25, 178–187. [Google Scholar]
9. Zhao, J., She, J., Fukushima Edwardo, F., Wang, D., Wu, M. et al. (2020). Muscle fatigue analysis with optimized complementary ensemble empirical mode decomposition and multi-scale envelope spectral entropy. Frontiers in Neurorobotics, 14, 566172. DOI 10.3389/fnbot.2020.566172. [Google Scholar] [CrossRef]
10. Jia, Y., Li, G., He, C., Xin, D. (2019). Based on gray code and EEMD hob vibration signal noise reduction method. Journal of Instruments and Meters, 40(7), 187–194. [Google Scholar]
11. Xiong, C., Wang, M., Yu, L. (2021). CEEMDAN-WT joint noise reduction method for bridge GNSS-RTK deformation monitoring data. Journal of Vibration and Shock, 40(9), 12–18. [Google Scholar]
12. Xu, T., Meng, L., Kong, X., Su, Y., Sun, Y. (2022). ICNN fault diagnosis method based on the EEMD. Journal of Beijing University of Posts and Telecommunications, 45(2), 110–116. [Google Scholar]
13. Yuan, J., Biao, S., Zeng, J. (2022). Based on the improved algorithm of wavelet threshold EEMD application in ultrasonic water meter. Journal of Vibration and Shock, 41(5), 208–213. [Google Scholar]
14. Li, S., Wang, Z., Kang, Y., Hou, J. (2021). Noise reduction of safety valve emission acoustic signal based on improved wavelet threshold function. Journal of Vibration and Shock, 40, 143–150. [Google Scholar]
Cite This Article
 Copyright © 2023 The Author(s). Published by Tech Science Press.
This work is licensed under a Creative Commons Attribution 4.0 International License , which permits unrestricted use, distribution, and reproduction in any medium, provided the original work is properly cited.
 Downloads
 Citation Tools