
 Submit a Paper
 Propose a Special lssue
 Open Access
ARTICLE

Effect of Velocity Ratio, Viscosity Ratio, Contact Angle, and Channel Size Ratio on Droplet Formation
Biomedical Engineering Laboratory, Abu Bakr Belkaid University, Tlemcen, 13000, Algeria
* Corresponding Author: Mohammed Bourega. Email:
Fluid Dynamics & Materials Processing 2023, 19(10), 2471-2480. https://doi.org/10.32604/fdmp.2023.028661
Received 31 December 2022; Accepted 03 April 2023; Issue published 25 June 2023
 View Full Text
 Download PDF
Abstract
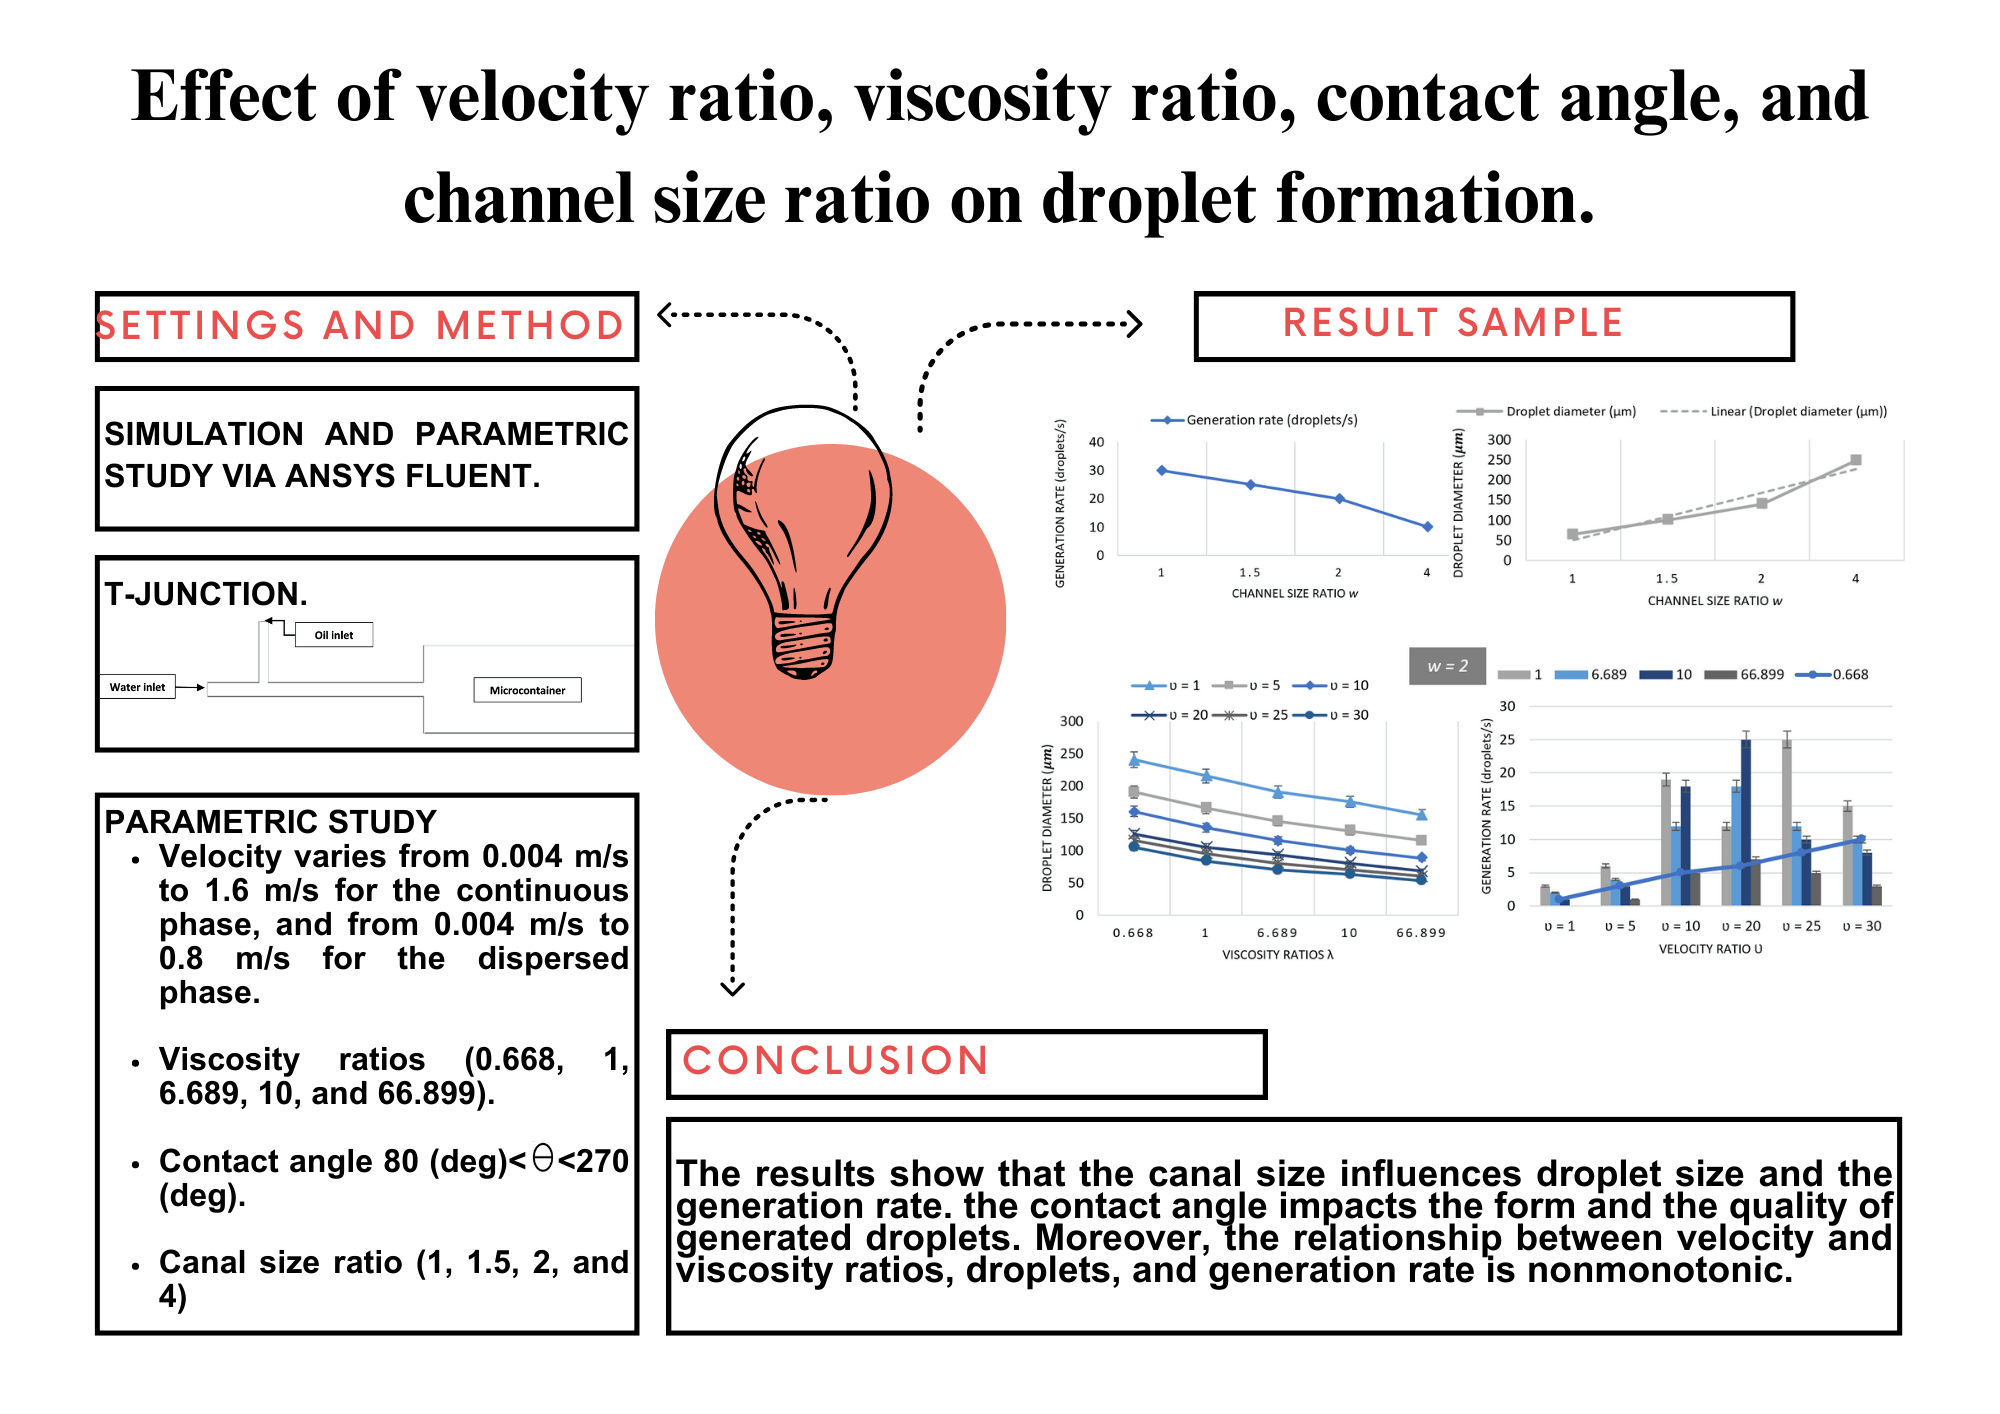
This study uses a T-junction to examine the effects of different parameters (velocity ratio, viscosity, contact angle, and channel size ratio) on the generation of microdroplets, related rate, and size. More specifically, numerical simulations are exploited to investigate situations with a velocity varying from 0.004 to 1.6 m/s for the continuous phase and from 0.004 to 0.8 m/s for the dispersed phase, viscosity ratios (0.668, 1, 6.689, 10, 66.899), contact angle 80° < θ < 270° and four different canal size ratios (1, 1.5, 2 and 4). The results show that canal size influences droplet size and the generation rate. The contact angle has an impact on the form and the quality of generated droplets. Moreover, the relationship between velocity and viscosity ratios, droplet size, and generation rate is non-monotonic.Graphic Abstract
Keywords
The manipulation of small droplets from two non-homogeneous fluids, such as water and oil [1], is known as digital microfluidics. Drug administration to target organs is one of the direct uses, which can be quite comforting during chemotherapy [2], as well as many other biomedical applications [3]. One of the fundamental unit processes in droplet-based microfluidics is droplet formation [4,5]. Several structures have been proposed and studied in the literature to address the microdroplet formation issue. These structures include different generation techniques, such as T-junction [6–9], flow focusing [10–12], step emulsification [13,14], and liquid di-electrophoresis [15], which have recently been developed for the quick and precise generation of microdroplets. The utilization of the T-junction is shown and demonstrated in this study.
Several researchers contributed to the study of droplet behavior under various conditions to develop a complete understanding of droplet generation in T-junction. Venkateshwarlu et al. [16] used the level set method (LSM) and finite element approach (FEM) in computational analysis. The two-phase flow and droplet production behavior has been examined for a wide variety of conditions, as a function of contact angle, Reynolds number, and the capillary number of the continuous phase in a T-shaped cross-flow microfluidic system. The results show, when the surface is hydrophilic, the droplet is unable to retain a correct form for the contact angle (<90 deg). The higher the contact angle (>90 deg), the more exact and distinct the droplet. When the surface is superhydrophobic, the size of the droplet is found to be proportional to the contact angle. It is also noted that increasing the capillary number of the continuous phase as a function of Reynolds number reduces droplet length. The main focus of Samadder et al. [17] study’s is to investigate the effect of phase velocity on different flow regimes, droplet size, and droplet detachment time. The results were investigated by changing the Reynolds number for the two phases, and the interfacial surface tension varies from 5 to 10 mN/m. It has been discovered that a large value of Rec produces a smaller droplet and increases droplet detachment time. Furthermore, with a fixed low capillary number, changes in surface tension have a less substantial effect on droplet size. Using a typical T-junction microfluidic droplet generator design, Yao et al. [18] studied the influence of multiple carrier oil viscosities on water-in-oil emulsification, especially how droplet size and generation rate are affected. The results showed that when the oil viscosity increased, the droplet size dropped regardless of the flow pressure levels; a similar pattern was observed in the droplet generation rate. Loizou et al. [19] focused their work to examine the effect of flow rate (Qd/Qc) on a regime transition from squeezing to dripping at constant capillary numbers and discuss the effect of the flow rate ratio on the volume of droplets generated in a microfluidic T-junction, as well as a new scaling law is proposed to estimate their volume. The effects of injection angle, flow rate ratio, density ratio, viscosity ratio, contact angle, and slip length on the generation of uniform droplets in microfluidic T-junctions are investigated by Jamalabadi et al. [20], the findings demonstrate that contact angle, slip length, and injection angles near perpendicular and parallel conditions increase the diameter of formed droplets, however, flow rate, density, viscosity ratios, and other injection angles decrease it. Chakraborty et al. [14] have investigated numerically and experimentally the impact of the capillary number and channel cross-section aspect ratio and the flow rate ratio on the dynamics of droplet formation using the quasi-2D Hele-Shaw approximation based on coupled Level-Set and Volume-of-Fluid approaches. The numerical predictions based on the Hele-Shaw flow approximation are in excellent agreement with our in-house experimental results. Wehking et al. [21] experimented with a wide variety of interfacial tension between the two immiscible fluids, viscosity ratios, channel geometries, and droplet formation using a T-junction microfluidic device. According to the experiments, as the channel aspect ratio (h/wc) is increased, the droplet volume drops, and the production frequency increases. For a given capillary number, larger viscosity ratios (µd/µc) and interfacial tension values also tend to lower the transition flow rate ratio. In general, the surface tension coefficient σ, the dynamic viscosities of the dispersed (µd) and continuous phases (µc), and the flow rates of the two phases Qd and Qc are the commonly used parameters of two immiscible fluid flow that affect the droplet size. The formulas for these variables are Q = Qd/Qc, λ = µd/µc, Ca = µcQc/hwσ, where Q is the flow rate ratio, λ is the viscosity ratio, Ca is the capillary number, and w and h are the width and height of the main channel.
The purpose of this study is to find out more about the droplets generation process in oil-in-water emulsification by studying the influence of velocity ratios (υ = υc/υd), viscosity ratio (λ = µd/µc), contact angle θ, and canal size ratio (w = wc/wd) on the generation rate and the size of microdroplets in a microfluidic T-junction. Using Fluent’s Volume-Of-Fraction method (VOF) to track the droplet generation steps.
The geometry used in this study is presented below in Fig. 1. Two inlets and one outlet make up the T-junction channel. While Fluid 1 (Liquid water) flows through the main channel as the continuous phase, Fluid 2 (Oil) enters by injection through the lateral channel as the dispersed phase. At the end of the T-junction, a micro container is used to store all the created droplets for further assessment of droplet size and generation rate.
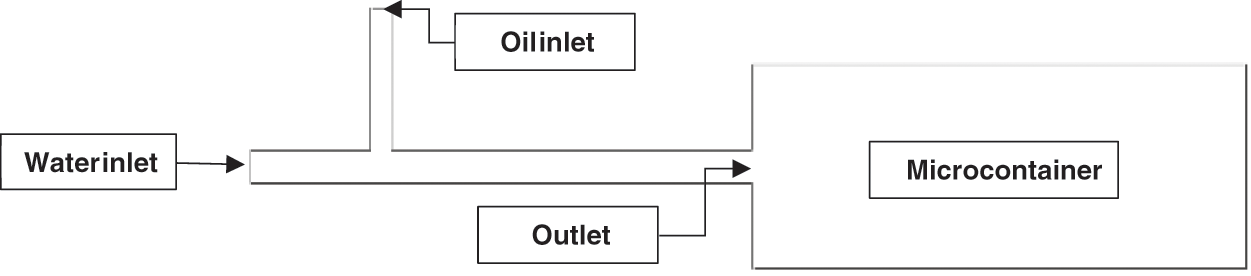
Figure 1: A schematic illustration of the T-junction droplet generator with a microcontainer
As shown in Table 1 and Fig. 2, the channel length is selected to offer both computational efficiency and the effect of droplet formation.
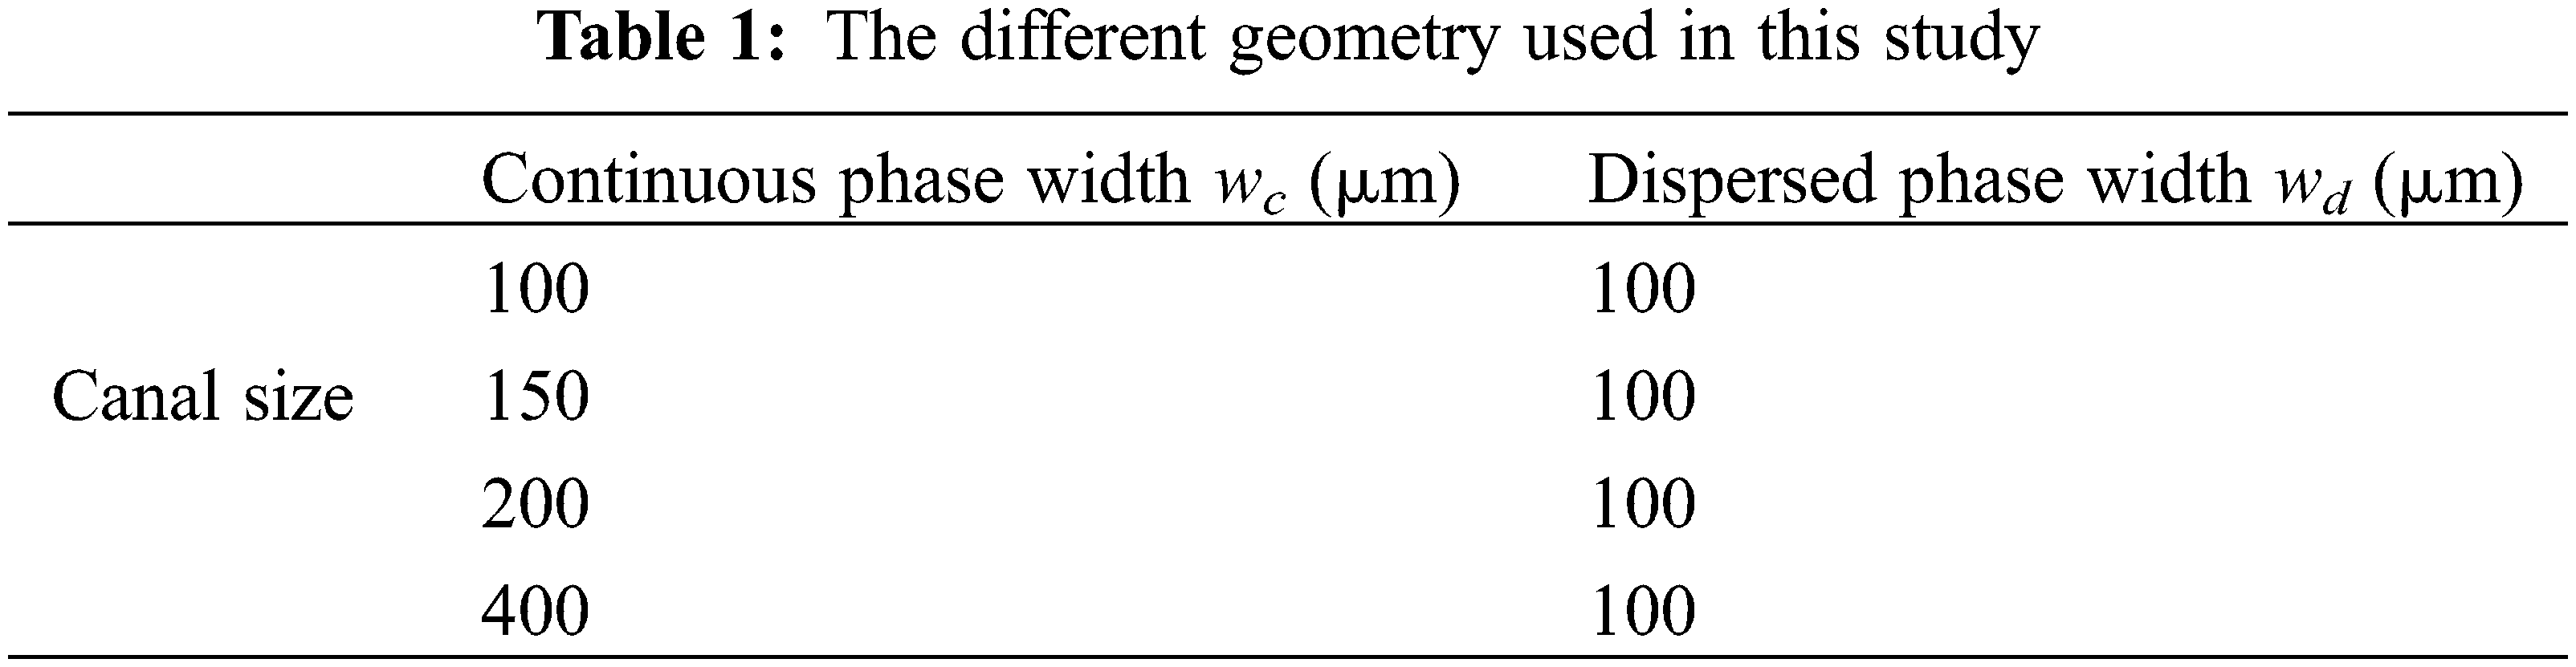
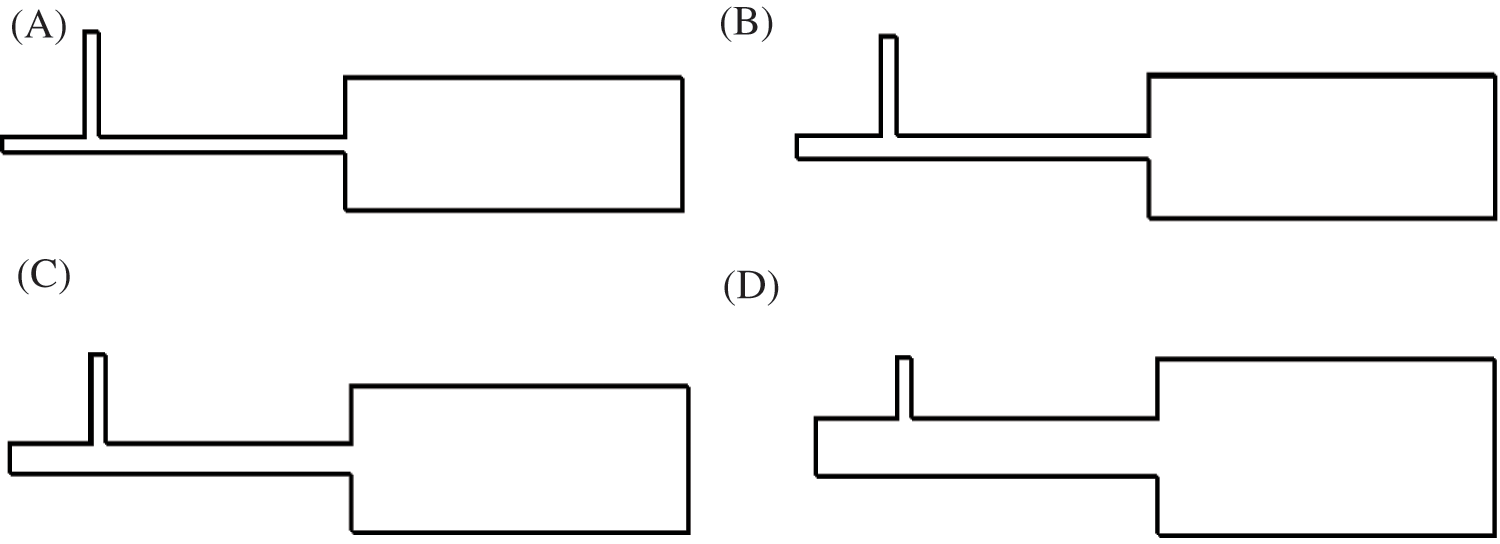
Figure 2: A schematic of the T-junction droplet generator and a microcontainer for droplet storage. (A) w = 1, (B) w = 1.5, (C) w = 2, (D) w = 4
Based on the volume fraction within each grid cell, the VOF approach is used in our simulations to track the boundary between the continuous phase and the dispersed phase. To define the flow field throughout, a single set of continuity and Navier-Stokes (N-S) equations are solved.
where
where the primary and secondary phases, respectively, are represented by the subscripts 1 and 2, with α2 = α and α1 = 1 – α. The Continuum Surface Force (CSF) model [22] is used to define
where k is the interface curvature determined by the formula
ANSYS Fluent is used to implement every simulation. For a solution method, the Coupled Scheme with Coupled with Volume Fractions is used for pressure-velocity coupling, the least squares cell based is used for gradient developing, the pressure staggering option scheme is handled for pressure interpolation, and the second order upwind difference method is adopted for the momentum equation. A physically controlled meshing approach is employed to adopt a collocated grid design. Squared cells were used to mesh the simulation domain. We employed inflation with five (05) layers to create a more accurate resolution for the mesh around the walls. Because one of the primary goals of this study is to determine the size of the droplets, the mesh grid size (β = wc/g) becomes significant. We conducted numerical simulations on a T-junction design to determine the effect of the mesh grid size on droplet size. Simulations were conducted using a constant velocity and viscosity ratio (υ = 10, λ = 6.689) and four (04) different channel size ratio (w = 1, w = 1.5, w = 2, and w = 4). The results are shown in Fig. 3. We found that for β ≥ 10, the variation in the droplet size is about 2%, while for β < 10 it is bigger than 5%. Therefore, a mesh element size of 10 μm is used in this study (we did not use β > 10 to optimize computing time).
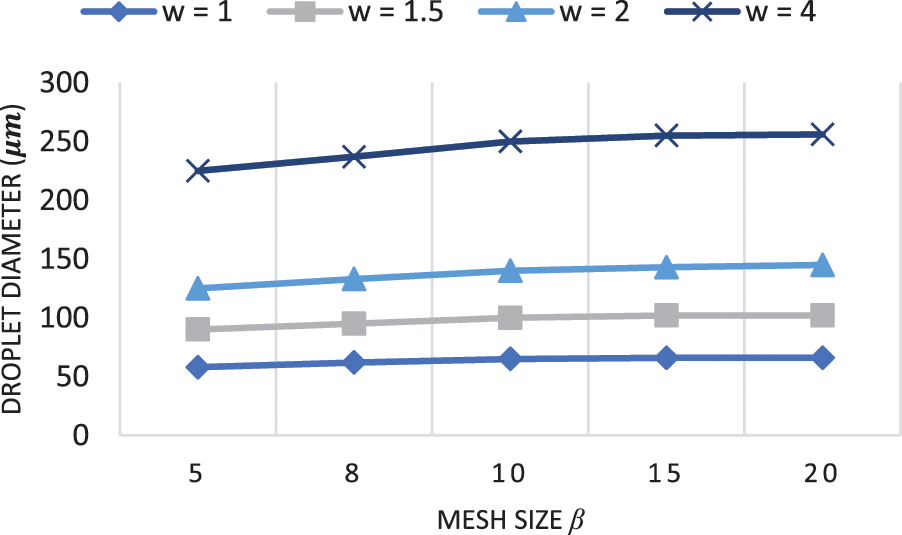
Figure 3: Effect of mesh size on the generated droplet diameter in a T-junction geometry with different channel size ratio (w = 1, w = 1.5, w = 2, and w = 4) for λ = 6.689,
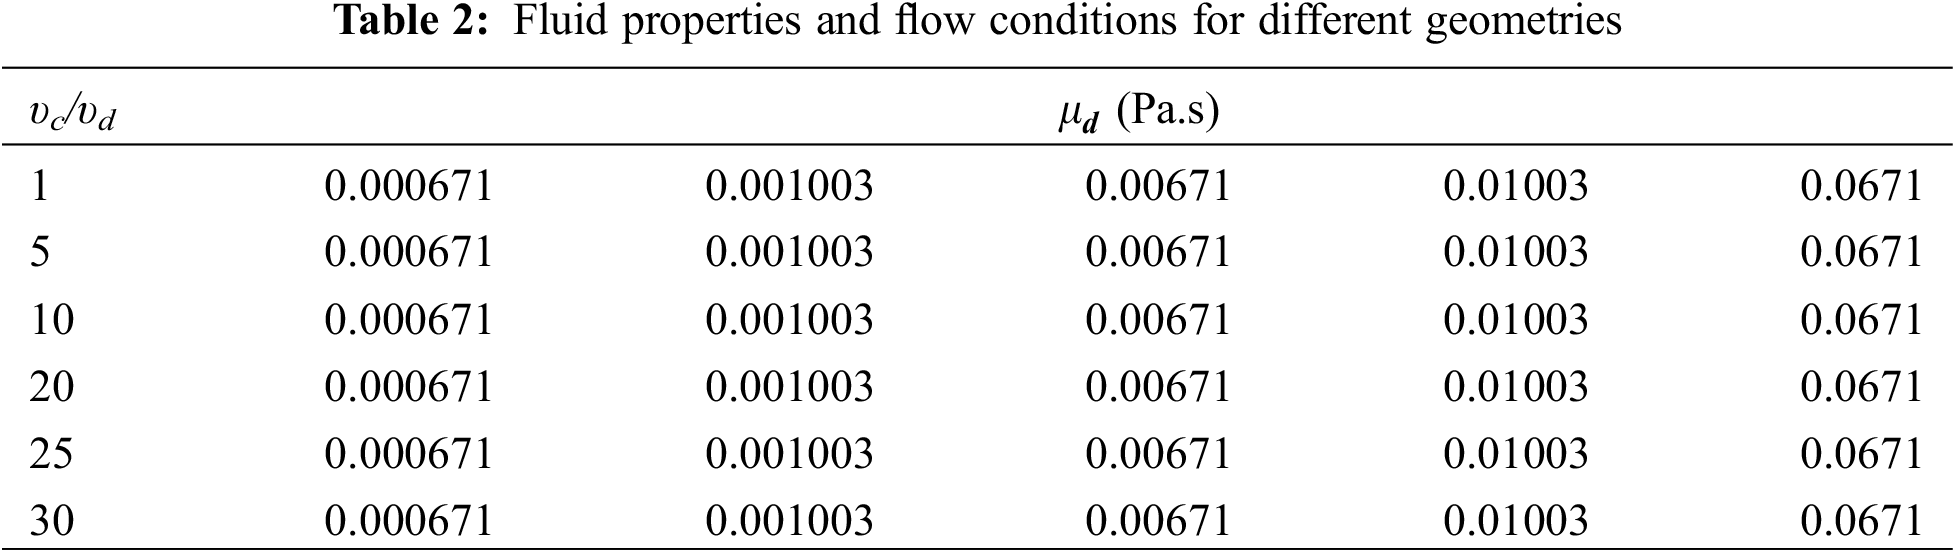
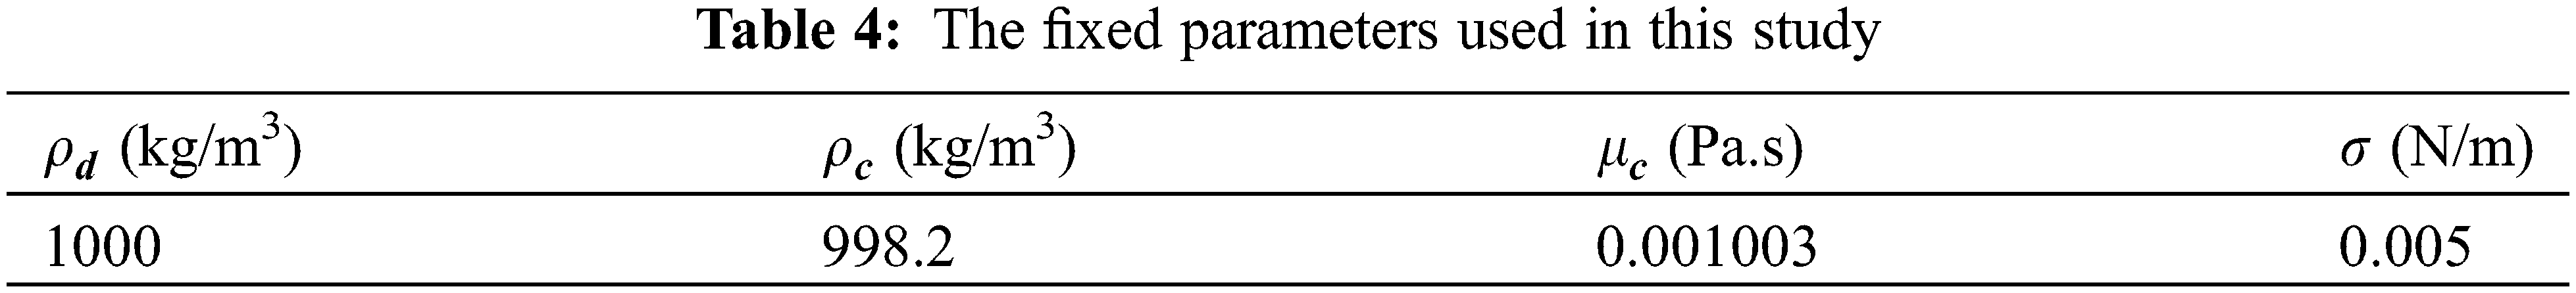
The velocity inlets are assigned to the inlets of the side and main channels as the boundary conditions, and fixed atmospheric pressure is set to the outlet. The walls are configured as fixed and non-slip surfaces. The initial time step is fixed at 10−5 s. The flow conditions and values of parameters are listed in Table 2 with the variation of one parameter at a time, the contact angles used in these simulations are tabled in Table 3. In Table 4, we listed the fixed parameters used in this study.

The size of the microdroplets is heavily influenced by the channel geometry. This study investigates the effects of several geometries on droplet formation rate and droplet diameter. Due to the correlative increase or decrease in interaction between two aqueous streams, modifying the geometric parameter affects the droplet generation rate and droplet diameter. As shown in Figs. 4A and 4C, the droplet diameter increased as the channel size ratio increased. For instance, for channel size ratio of w = 1, the droplet diameter is an average of 65 μm and increased to 100 μm (35% increase), 140 μm (53.57% increase), 250 μm (74% increase) as the channel size ratio increased to w = 1.5, w = 2 and to w = 4, respectively. In Figs. 4A and 4B, the channel size ratio has a decreasing effect on the droplet generation rate due to the decreasing flow pressure of the continuous phase as the channel size ratio increases. For example, the generation rate decreased from 30 droplets/s to 25 droplets/s, 20 droplets/s, and 10 droplets/s for a channel size ratio of w = 1, w = 1.5, w = 2, and w = 4, respectively.
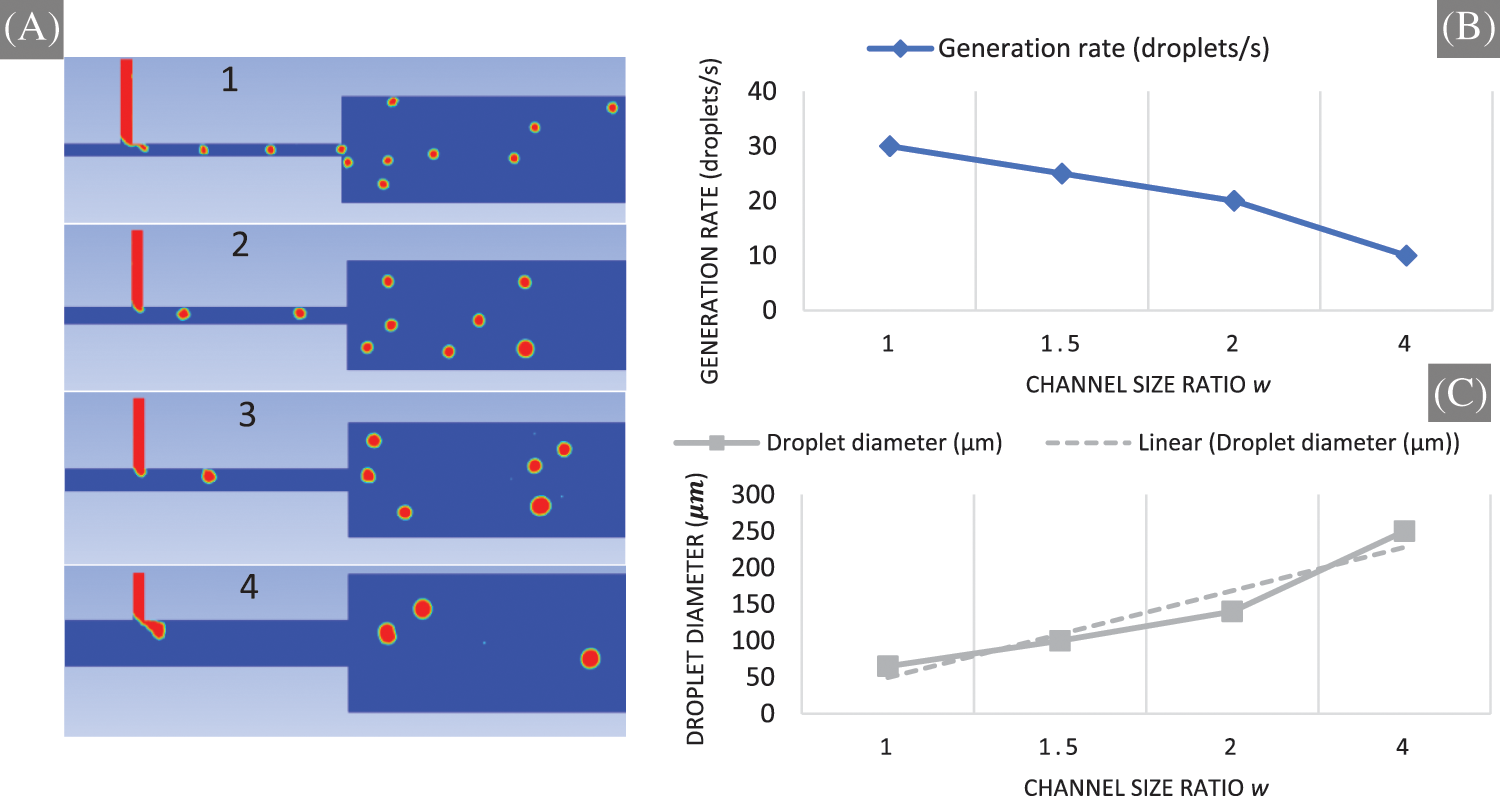
Figure 4: The influence of channel size ratio (w) on generated droplets. (A) Snapshots of our simulation results show the influence of channel size (w = 1, w = 1.5, w = 2, and w = 4, respectively) on the generation rate and the size of generated droplets for λ = 6.689,
The effects of different contact angles on droplet formation rate and droplet diameter are studied and presented in this study. Figs. 5A and 5B show that the variation in contact angle has a slightly impact on the droplet formation rate and droplet diameter, for example, for a contact angle of
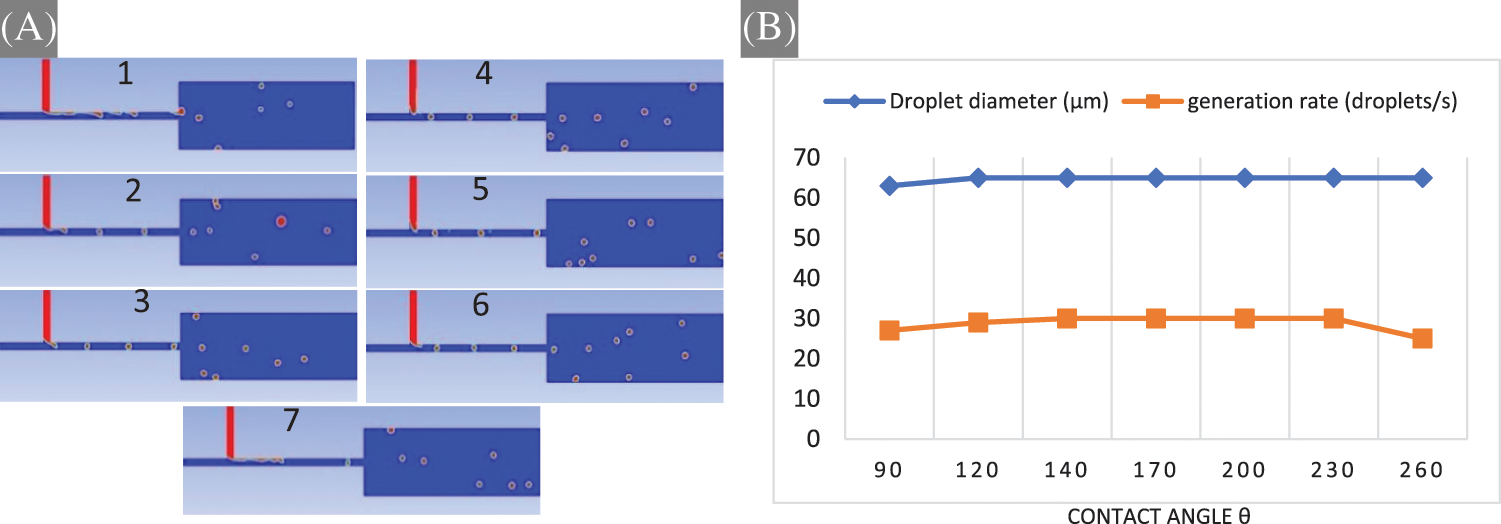
Figure 5: The influence of contact angle on generated droplets with λ = 6.689,
3.3 Velocity and Viscosity Effects
In this situation, droplet diameters were measured and compared at different oil viscosities and velocity ratios to study how oil viscosity changes affect droplet size and generation rate. As shown in Figs. 6A and 6B, the droplet size generally decreased as the velocity ratio increased. For instance, the average droplet diameter reduced from 150 to 100 μm (33.33% decrease), 75 μm (50.0% decrease), 50 μm (66.66% decrease), 45 μm (70.0% decrease), 35 μm (76.67% decrease) as the velocity ratio changed from 1 to 5, 10, 20, 25 and 30 at viscosity ratio of λ = 0.668, respectively. The declining trend of the droplet diameter displayed similar profiles over the increasing viscosity ratio, for example, the droplet diameter decreased from 150 to 140 μm (6.67% decrease), 120 μm (20.0% decrease), 117 μm (22.0% decrease), 100 μm (33.33% decrease) as the oil viscosity changed from 0.000671 Pa.s to 0.001003 Pa.s, 0.00671 Pa.s, 0.01003 Pa.s, and 0.0671 Pa.s at a velocity ratio of υ = 1, respectively.
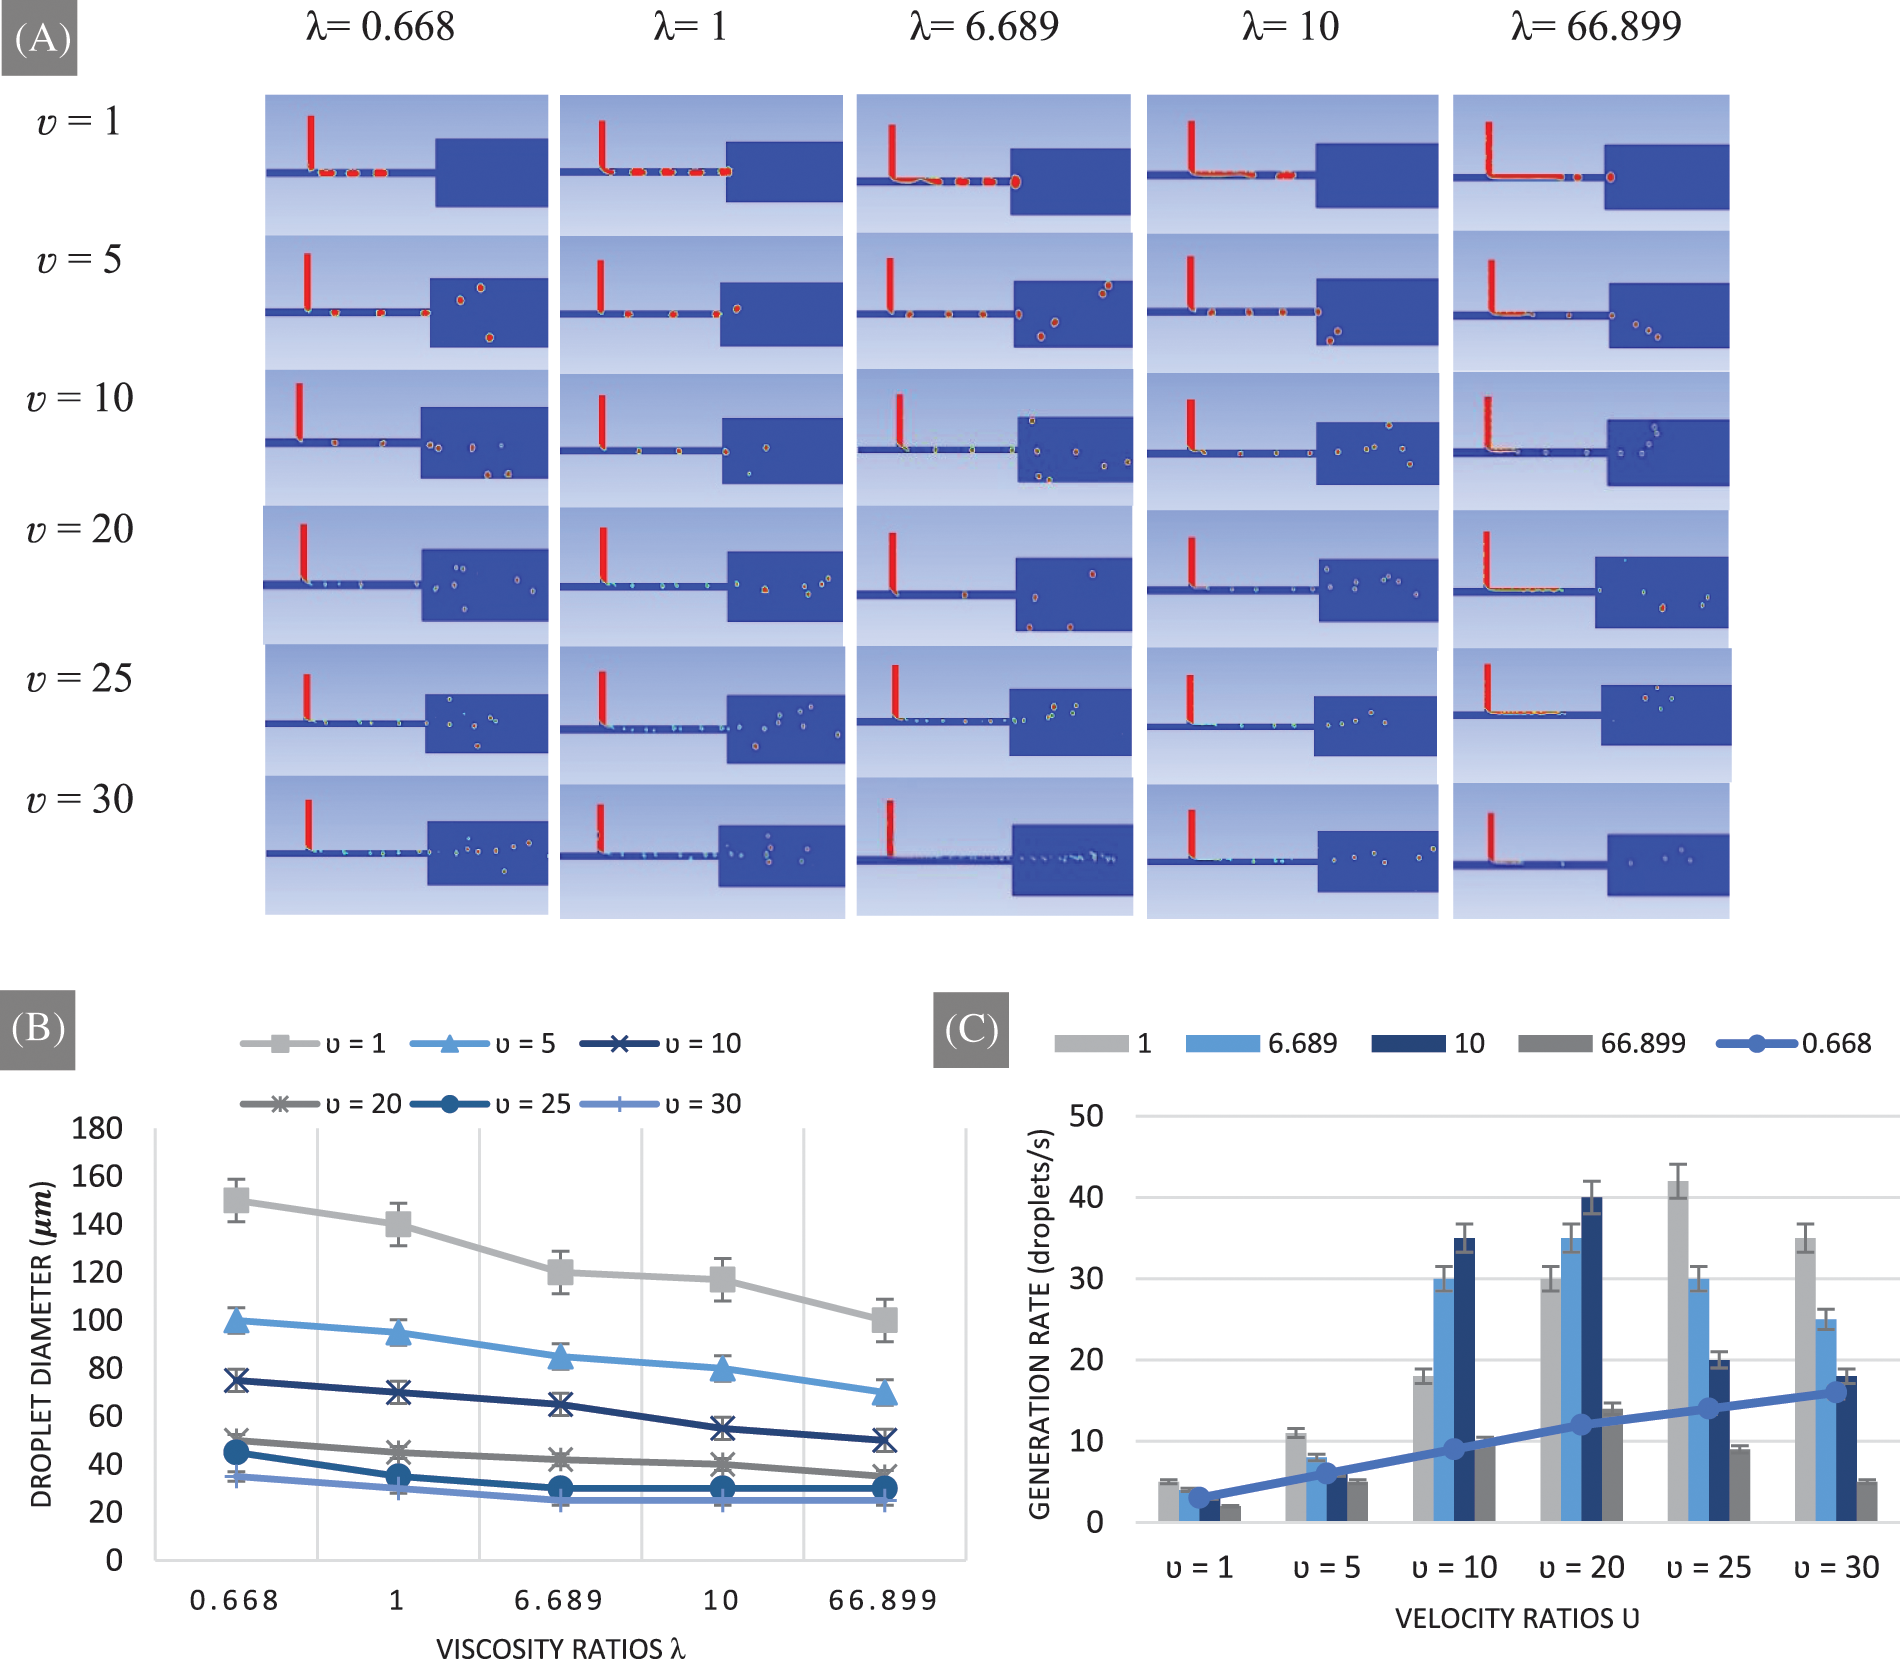
Figure 6: The viscosity and velocity ratio influence on the generation rate and the size of generated droplets. (A) Snapshots of our simulation results show the influence of viscosity and velocity ratio on the generation rate and the size of generated droplets for w = 1 and the contact angle is fixed at 140 deg. (B) Representation of the average droplet sizes by different viscosity and velocity ratios. (C) Analysis of the droplet generation rate change by different velocity and viscosity ratios
The increase in oil viscosity and velocity ratio at the same time has a decreasing effect on droplet diameter. For instance, the overall droplet diameter decreased from 150 to 95 μm (36.67% decrease), 65 μm (56.67% decrease), 40 μm (73.33% decrease), 25 μm (83.33% decrease) as the velocity ratio changed from 1 to 5, 10, 20 and 25, respectively, as well as the viscosity ratio changes from 0.668 to 1, 6.689, 10 and 66.899, respectively.
On the other hand, Figs. 6A and 6C show that the generation rate increased as the velocity ratio increased to a certain limit. For instance, for a low viscosity ratio (λ < 1), the generation rate increased from 3 droplets/s to 9 droplets/s, 12 droplets/s, and 16 droplets/s as the velocity ratio increased from υ = 1, υ = 10, υ = 20 and υ = 30, respectively. For a viscosity ratio of λ = 1, the generation rate decreased by an average of 19% when the velocity ratio surpass 25 (υ > 25), and when the viscosity ratio is superior to 1 (λ > 1) the generation rate increased as the velocity ratio increased until it reaches velocity ratio of υ = 20, after that the generation rate decreased for an average rate of 33% and 50% for υ = 25, and υ = 30, respectively. The generation rate increased as the viscosity and velocity ratios increases until they eventually attained υ = 20 and λ = 10. Following that, the generation rate dropped for a viscosity ratio of λ > 10 and a velocity ratio of υ > 20. Furthermore, the generation rate decreased as the viscosity ratio increased for the following velocity ratio υ = 1, υ = 10, υ = 25 and υ = 30.
As shown in Fig. 7, similar patterns in droplet size and generation rate behavior were observed for different geometrical settings (w = 1.5, w = 2, and w = 4), as well as discussed earlier in this paper, the generation rate decreased as the channel size ratio increased. For instance, for all three settings, zero droplets were generated in the first second forhigh-viscosityosity ratio (λ = 66.899) and low-velocity ratio (υ = 1). In the fourth setup (w = 4), the generation rate drops dramatically as demonstrated in Fig. 7 (w = 4). As shown in Figs. 6C and 7, υ = 10, and λ = 0.668 are the optimal velocity and viscosity ratios for a linear droplet generation rate in all the geometrical settings studied in this article. On the other hand, the size of the droplets shows a more stable behavior for all setups as demonstrated in Figs. 6B and 7, the droplet diameter varied from 150 to 25 µm, 190 to 40 µm, 240 to 53 µm and from 360 to 155 µm as the channel size ratio changed from 1 to 1.5, 2, and 4, respectively, the viscosity ratio varied from 0.668 to 66.899, and a velocity ratio of 1, 5, 10, 20, 25, and 30.
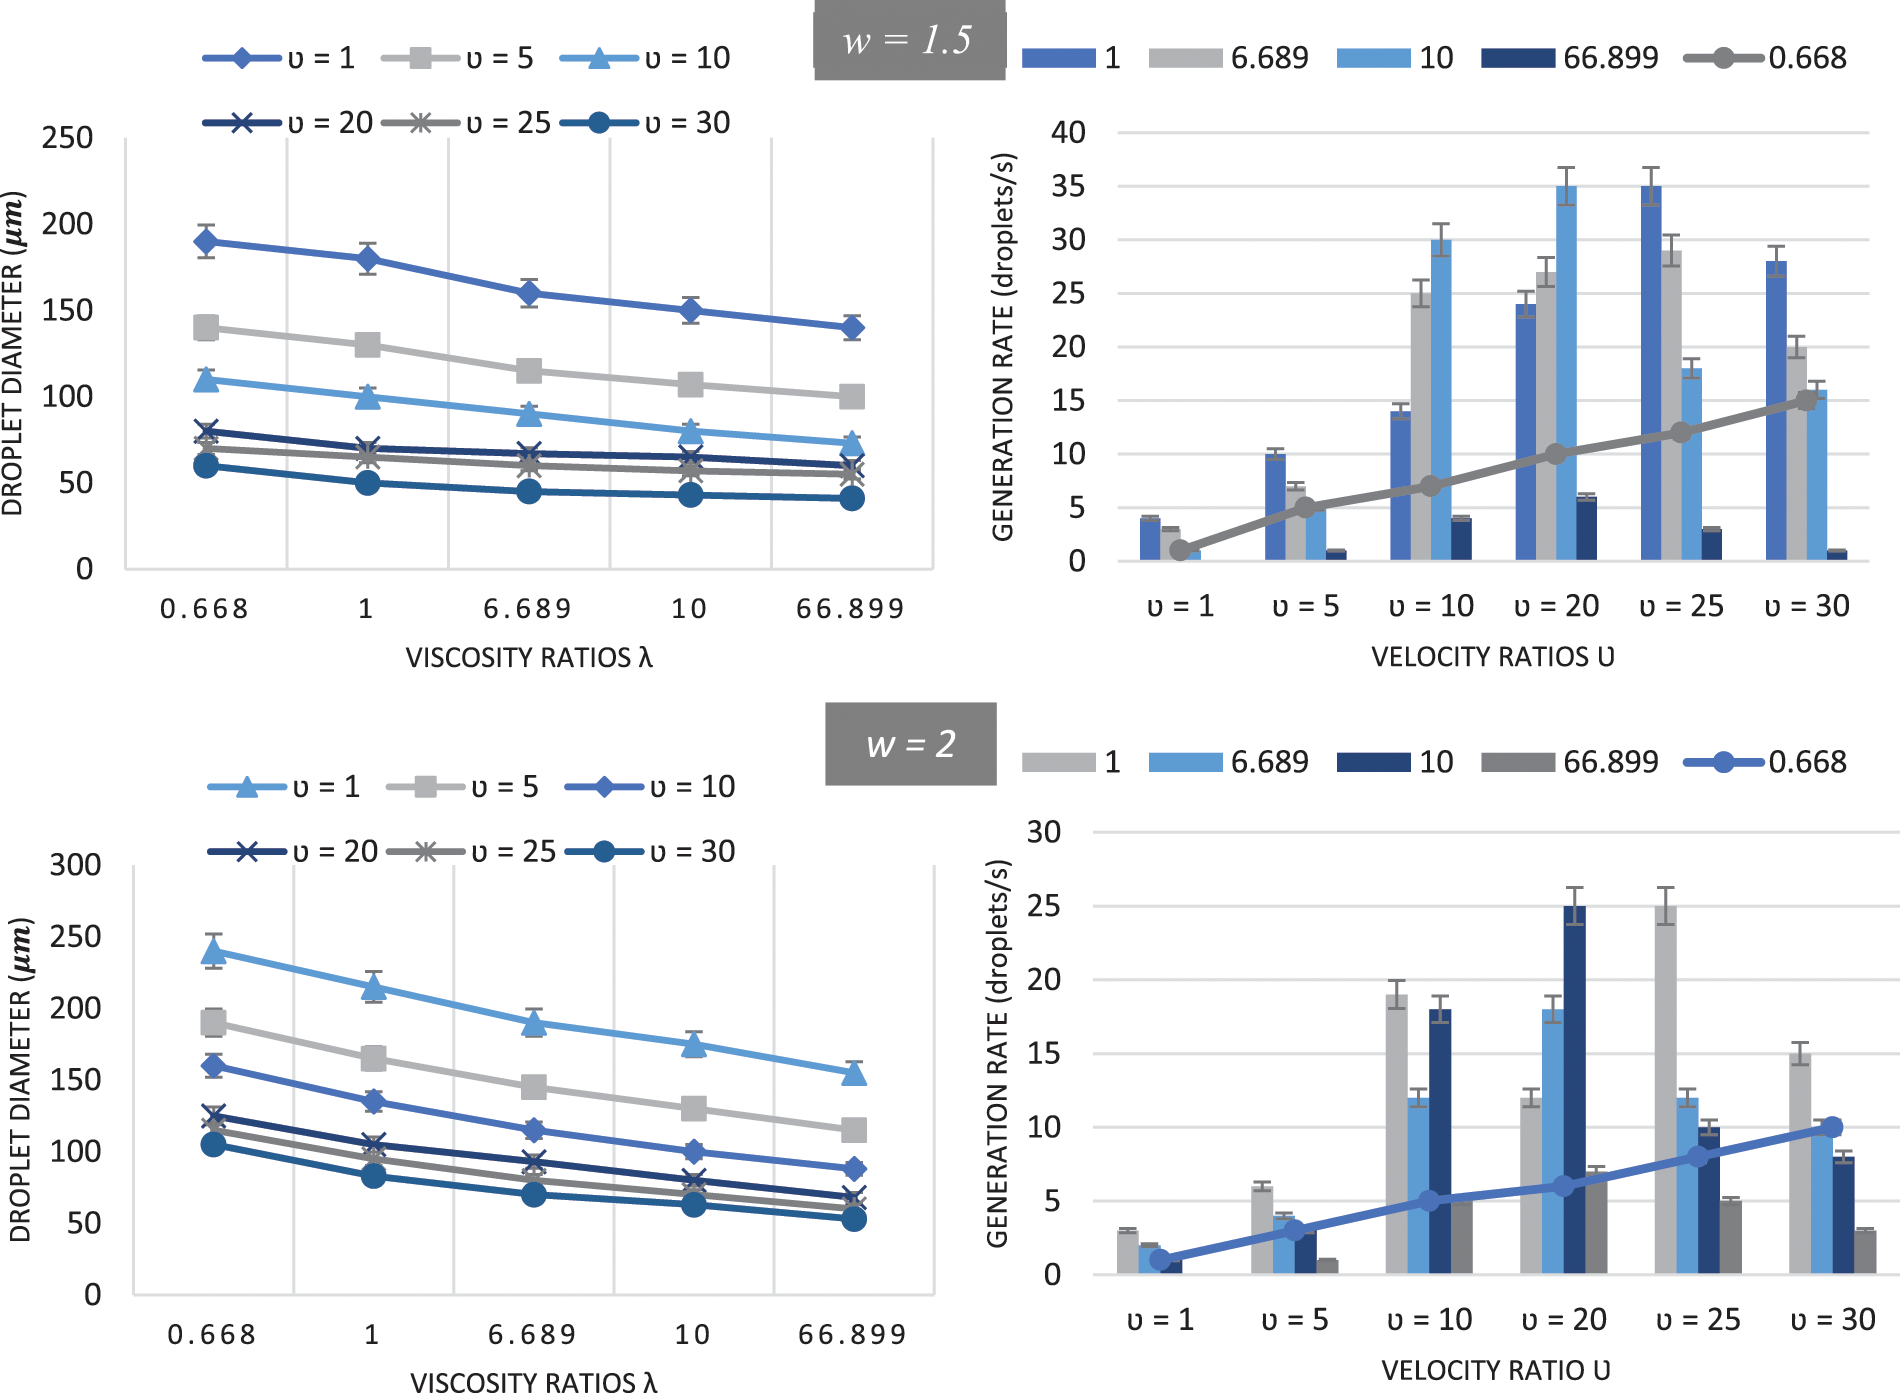
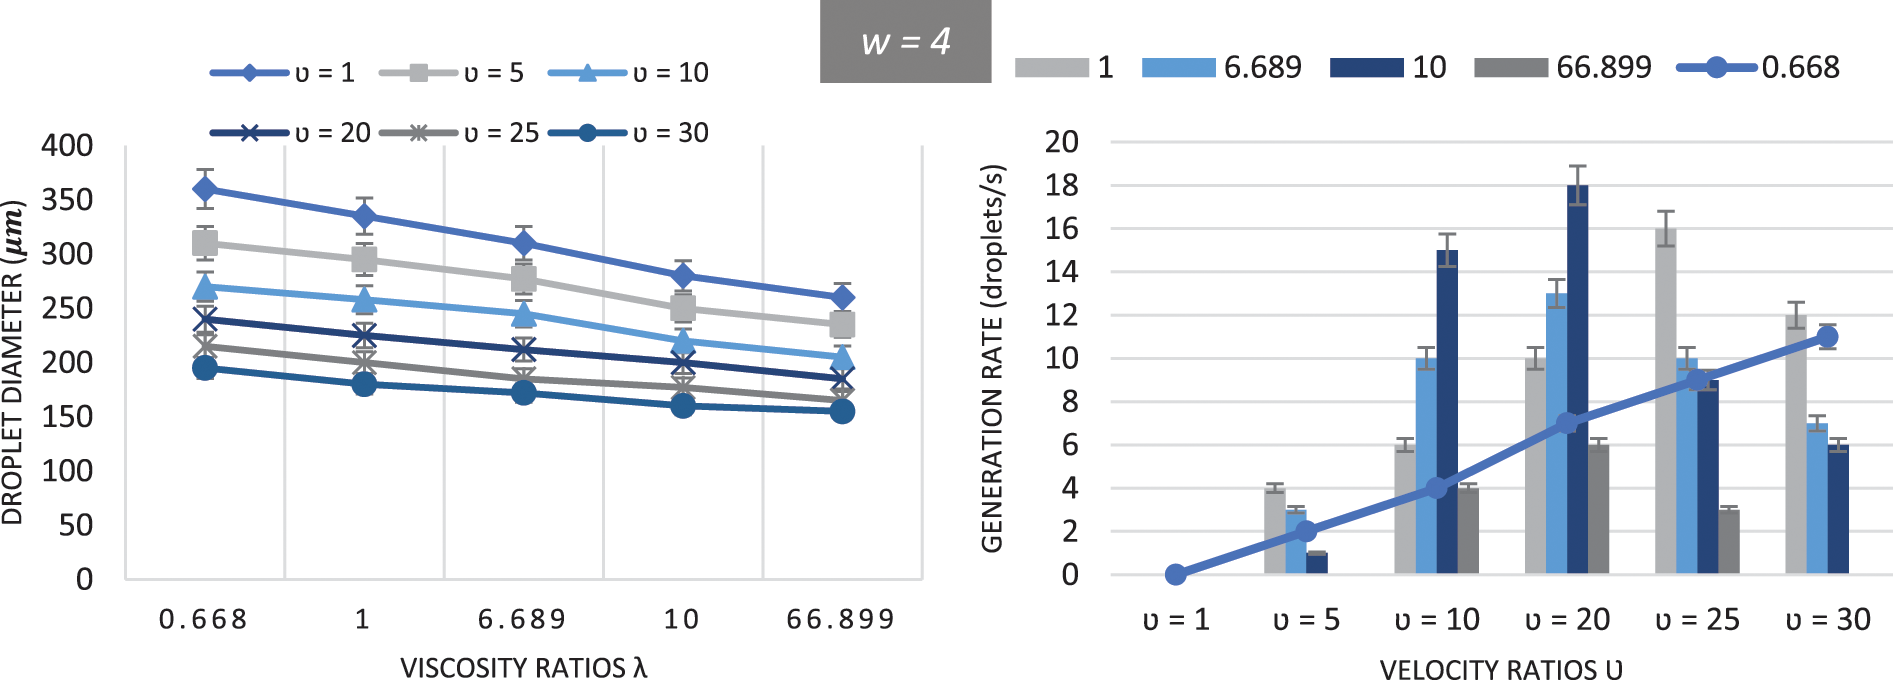
Figure 7: Representation of the average droplet sizes by different viscosity and velocity ratios, and Analysis of the droplet generation rate against different velocity and viscosity ratios for different geometrical setups (w = 1.5, w = 2, and w =4) for contact angle of θ = 140 deg
Droplet formation behavior in T-junction microchannel was studied in this article. The VOF method is employed to study the multiphase flow using ANSYS Fluent. The velocity ratio is varied from 1 to 5, 10, 20, 25, and to 30, five different viscosity ratios (i.e., 0.668, 1, 6.689, 10, and 66.899) used in this study, four different canal size ratios (i.e., 1, 1.5, 2 and 4), as well as, the used contact angle in this study is
The results showed that the channel size ratio has a decreasing effect on the droplet generation rate by 33.33%, and an increasing effect on droplet size for an average rate of 48.78% as the canal size ratio varied from 1 to 2, and 4. Contact angle variation has a minor impact on droplet formation rate and diameter, but the main impact is on the quality (dissimilar or nonidentical) of formed droplets. The increase in viscosity ratio and velocity ratio at the same time has a decreasing effect on droplet diameter. For instance, the overall droplet diameter decreased from 150 to 95 μm (36.67% decrease), 65 μm (56.67% decrease), 40 μm (73.33% decrease), 25 μm (83.33% decrease) as the velocity ratio changed from 1 to 5, 10, 20 and 25, respectively, as well as the viscosity ratio changes from 0.668 to 1, 6.689, 10 and 66.899, respectively. The generation rate increased as the viscosity and velocity ratios increases until they eventually attained υ = 20 and λ = 10. Following that, the generation rate dropped for a viscosity ratio of λ > 10 and a velocity ratio of υ > 20.
Funding Statement: The authors received no specific funding for this study.
Conflicts of Interest: The authors declare that they have no conflicts of interest to report regarding the present study.
References
1. Urbanski, J. P., Thies, W., Rhodes, C., Amarasinghe, S., Thorsen, T. (2006). Digital microfluidics using soft lithography. Lab on a Chip, 6(1), 96–104. https://doi.org/10.1039/B510127A [Google Scholar] [PubMed] [CrossRef]
2. Lu, C. H., Willner, I. (2015). Stimuli-responsive DNA-functionalized nano-/microcontainers for switchable and controlled release. Angewandte Chemie International Edition, 54(42), 12212–12235. https://doi.org/10.1002/anie.201503054 [Google Scholar] [PubMed] [CrossRef]
3. Ling, S. D., Liu, Z., Ma, W., Chen, Z., Du, Y. et al. (2022). A novel step-T-junction microchannel for the cell encapsulation in monodisperse alginate-gelatin microspheres of varying mechanical properties at high throughput. Biosensors, 12(8), 659. https://doi.org/10.3390/bios12080659 [Google Scholar] [PubMed] [CrossRef]
4. Christopher, G. F., Anna, S. L. (2007). Microfluidic methods for generating continuous droplet streams. Journal of Physics D: Applied Physics, 40(19), R319–R336. https://doi.org/10.1088/0022-3727/40/19/R01 [Google Scholar] [CrossRef]
5. Baroud, C. N., Gallaire, F., Dangla, R. (2010). Dynamics of microfluidic droplets. Lab on a Chip, 10(16), 2032–2045. https://doi.org/10.1039/c001191f [Google Scholar] [PubMed] [CrossRef]
6. Xu, J. H., Li, S. W., Tan, J., Luo, G. S. (2008). Correlations of droplet formation in T-junction microfluidic devices: From squeezing to dripping. Microfluidics and Nanofluidics, 5(6), 711–717. https://doi.org/10.1007/s10404-008-0306-4 [Google Scholar] [CrossRef]
7. Liu, H., Zhang, Y. (2009). Droplet formation in a T-shaped microfluidic junction. Journal of Applied Physics, 106(3), 034906. https://doi.org/10.1063/1.3187831 [Google Scholar] [CrossRef]
8. Gupta, A., Kumar, R. (2010). Effect of geometry on droplet formation in the squeezing regime in a microfluidic T-junction. Microfluidics and Nanofluidics, 8(6), 799–812. https://doi.org/10.1007/s10404-009-0513-7 [Google Scholar] [CrossRef]
9. Sivasamy, J., Wong, T. N., Nguyen, N. T., Kao, L. T. H. (2011). An investigation on the mechanism of droplet formation in a microfluidic T-junction. Microfluidics and Nanofluidics, 11(1), 1–10. https://doi.org/10.1007/s10404-011-0767-8 [Google Scholar] [CrossRef]
10. Anna, S. L., Bontoux, N., Stone, H. A. (2003). Formation of dispersions using “flow focusing” in microchannels. Applied Physics Letters, 82(3), 364–366. [Google Scholar]
11. Jensen, M. J., Stone, H. A., Bruus, H. (2006). A numerical study of two-phase stokes flow in an axisymmetric flow-focusing device. Physics of Fluids, 18(7), 077103. [Google Scholar]
12. Malloggi, F., Vanapalli, S. A., Gu, H., van den Ende, D., Mugele, F. (2007). Electrowetting-controlled droplet generation in a microfluidic flow-focusing device. Journal of Physics: Condensed Matter, 19(46), 462101. https://doi.org/10.1088/0953-8984/19/46/462101 [Google Scholar] [CrossRef]
13. Li, Z., Leshansky, A., Pismen, L., Tabeling, P. (2015). Step-emulsification in a microfluidic device. Lab on a Chip, 15(4), 1023–1031. [Google Scholar] [PubMed]
14. Chakraborty, I., Ricouvier, J., Yazhgur, P., Tabeling, P., Leshansky, A. (2017). Microfluidic step-emulsification in axisymmetric geometry. Lab on a Chip, 17(21), 3609–3620. [Google Scholar] [PubMed]
15. Kumemura, M., Yoshizawa, S., Collard, D., Fujita, H. (2009). Droplet formation and fusion for enzyme activity measurement by liquid dielectrophoresis, pp. 813–816. Piscataway: IEEE. [Google Scholar]
16. Venkateshwarlu, A., Bharti, R. P. (2022). Effect of contact angle on droplet generation in a T-junction microfluidic system. In: Bharti, R. P., Gangawane, K. M. (Eds.Recent trends in fluid dynamics research, pp. 137–147. Singapore: Springer Nature Singapore. [Google Scholar]
17. Samadder, S., Venkateshwarlu, A., Bharti, R. P. (2022). Effects of inertial force and interfacial tension on droplet generation in a T-junction microfluidic system. In: Bharti, R. P., Gangawane, K. M. (Eds.Recent trends in fluid dynamics research, pp. 173–182. Singapore: Springer Nature Singapore. [Google Scholar]
18. Yao, J., Lin, F., Kim, H., Park, J. (2019). The effect of oil viscosity on droplet generation rate and droplet size in a T-junction microfluidic droplet generator. Micromachines, 10(12), 808. https://doi.org/10.3390/mi10120808 [Google Scholar] [PubMed] [CrossRef]
19. Loizou, K., Wong, V. L., Hewakandamby, B. (2018). Examining the effect of flow rate ratio on droplet generation and regime transition in a microfluidic T-junction at constant capillary numbers. Inventions, 3(3), 54. https://doi.org/10.3390/inventions3030054 [Google Scholar] [CrossRef]
20. Jamalabadi, M. Y. A., DaqiqShirazi, M., Kosar, A., Shadloo, M. S. (2017). Effect of injection angle, density ratio, and viscosity on droplet formation in a microfluidic T-junction. Theoretical and Applied Mechanics Letters, 7(4), 243–251. https://doi.org/10.1016/j.taml.2017.06.002 [Google Scholar] [CrossRef]
21. Wehking, J. D., Gabany, M., Chew, L., Kumar, R. (2014). Effects of viscosity, interfacial tension, and flow geometry on droplet formation in a microfluidic T-junction. Microfluidics and Nanofluidics, 16(3), 441–453. https://doi.org/10.1007/s10404-013-1239-0 [Google Scholar] [CrossRef]
22. Brackbill, J. U., Kothe, D. B., Zemach, C. (1992). A continuum method for modeling surface tension. Journal of Computational Physics, 100(2), 335–354. https://doi.org/10.1016/0021-9991(92)90240-Y [Google Scholar] [CrossRef]
Cite This Article
 Copyright © 2023 The Author(s). Published by Tech Science Press.
This work is licensed under a Creative Commons Attribution 4.0 International License , which permits unrestricted use, distribution, and reproduction in any medium, provided the original work is properly cited.
 Downloads
 Citation Tools