
 Submit a Paper
 Propose a Special lssue
 Open Access
ARTICLE
An Intelligent Hybrid Ensemble Gene Selection Model for Autism Using DNN
Department of Information Science and Technology, College of Engineering, Anna University, Chennai, 600025, India
* Corresponding Author: G. Anurekha. Email:
Intelligent Automation & Soft Computing 2023, 35(3), 3049-3064. https://doi.org/10.32604/iasc.2023.029127
Received 25 February 2022; Accepted 05 May 2022; Issue published 17 August 2022
 View Full Text
 Download PDF
Abstract
Autism Spectrum Disorder (ASD) is a complicated neurodevelopmental disorder that is often identified in toddlers. The microarray data is used as a diagnostic tool to identify the genetics of the disorder. However, microarray data is large and has a high volume. Consequently, it suffers from the problem of dimensionality. In microarray data, the sample size and variance of the gene expression will lead to overfitting and misclassification. Identifying the autism gene (feature) subset from microarray data is an important and challenging research area. It has to be efficiently addressed to improve gene feature selection and classification. To overcome the challenges, a novel Intelligent Hybrid Ensemble Gene Selection (IHEGS) model is proposed in this paper. The proposed model integrates the intelligence of different feature selection techniques over the data partitions. In this model, the initial gene selection is carried out by data perturbation, and the final autism gene subset is obtained by functional perturbation, which reduces the problem of dimensionality in microarray data. The functional perturbation module employs three meta-heuristic swarm intelligence-based techniques for gene selection. The obtained gene subset is validated by the Deep Neural Network (DNN) model. The proposed model is implemented using python with six National Center for Biotechnology Information (NCBI) gene expression datasets. From the comparative study with other existing state-of-the-art systems, the proposed model provides stable results in terms of feature selection and classification accuracy.Keywords
ASD is a complicated neurodevelopmental disorder that is often identified in toddlers. Children with ASD suffer from interminable difficulties such as social interaction, speech, non-verbal communication, and restricted or repetitive actions [1]. The prevalence of the disease is increasing worldwide, and the estimated probability of occurrence in the United States is one in 44 children [2]. The probability of behavioral improvement has been drastically increased when ASD is diagnosed in its earlier stages [3]. Microarrays are involved in analyzing the gene expression of the autism-affected patients’ from its control, contributing to novel insights [4]. In the microarray dataset, genes are the features. The microarray data is voluminous and has a high dimension, which suffers from a problem of dimensionality. Generally, the number of samples of microarray data is in the range of hundreds, and the number of corresponding genes is ten times greater. Thus, the gene selection process is both a time-consuming and challenging issue because of the huge imbalance of data in terms of feature selection and classification. An efficient gene selection and classification model is required to select the appropriate gene features and classify them to effectively detect ASD. Although, from the literature, there are several feature selection and classification techniques [5,6] proposed in the past, the selecting and classification of relevant genes from high dimensional microarray data is an important and challenging issue for the early diagnosis of ASD efficiently.
In the view of an epidemiologist, the subset of genes with high classification accuracy contributes insights about the disease, but techniques that could produce stable and robust result are desired. Meanwhile, gene selection strategies that are used for cancer gene identification cannot be used for autism as the variance of gene expression is high in corresponding to the same class [7]. Hence, it is necessary to focus research on several ensemble techniques for stable and robust gene selection [8]. An ensemble-based feature selection model consists of three major types: Data perturbation, functional perturbation, and hybrid ensemble [9]. Applying a single feature selection model to all the sample data is termed “data perturbation”. Employing various feature selection techniques on the same sample of data is termed “functional perturbation” whereas, applying different feature selection techniques to the different sampled versions is termed a hybrid ensemble. Motivated by all these observations, a hybrid ensemble-based gene selection model has been proposed for efficient gene feature selection and classification for a better and more effective diagnosis of ASD.
The remainder of the manuscript is organized as follows: Section 2 briefly outlines the related works. Section 3 describes the proposed model. Section 4 presents the experimental findings and discussion. Finally, Section 5 details the conclusion and the future scope.
Discussion of the existing approaches from the literature can complement the proposed methodology. A hybrid feature selection method in [10] for ASD is designed to analyze Single Nucleoid Polymorphism (SNP) to classify diseased SNPs from their control. In this method, Conditional Mutual Information Maximization (CMIM) with Support Vector Machine–Recursive Feature Elimination (SVM-RFE) is used for SNP selection. A combination of statistical measures and wrapper approach was proposed in [11]. In this model, three statistical measures are employed for the initial selection of genes, namely two-sample t-test, feature correlation with class, and Wilcoxon rank-sum. Later, the wrapper approach incorporating binary Particle Swarm Optimization (PSO) with Support Vector Machine (SVM) is utilized for final gene optimization and classification. The accuracy obtained by this approach is 92.1%. A hybrid deep learning model [12] is proposed with information gain ratio for dimension reduction and Deep Belief Network (DBN) based on Gaussian Restricted Boltzmann Machine (GRBM) for classification of samples from disease to its control. K. Sekaran and M. Sudha proposed a gene selection strategy in [13] for recognizing the autistic gene in the genomic microarray data. The optimum features are selected by the signal-to-noise ratio holding a logistic sigmoid function, the Hilbert–Schmidt Independence Criterion Lasso, along with a regularized genetic algorithm employed for gene classification. The ASD’s prediction accuracy rate is better using this method than compared with the other existing systems.
Various researchers from the literature have experimented with ensemble models for feature selection in recent years. In [14] Bakrutheen et al. -Pour proposed multiple filter such as relieff and Fast Correlation Based Filter (FCBF), are used to reduce the dimensionality of the initial set of genes from microarray data. An improved binary gravitational search algorithm is used in their approach to optimize the selected genes. In this ensemble model, the authors used a simple voting strategy for selecting top n-ranked genes. Classifiers like Decision Tree (DT), K-Nearest Neighbor (KNN), and SVM are used for the performance evaluation of selected optimal genes. A hybrid ensemble-filter wrapper feature selection approach is described in [15] for medical data classification. In this model, authors have adopted a subset-based filter approach such as Correlation-based Feature Selection (CFS) and Consistency (CONS) and a rank-based filter approach such as chi-square test, information gain, and relieff for initial gene selection. The proposed system uses maximum cardinality to select the top n-rank feature subset. A sequential feature selection model is employed to obtain the optimal features.
From the literature, it is clear that many researchers have focused on gene selection based on improving classification accuracy rather than obtaining stable and robust results. Furthermore, microarray data are a highly imbalanced dataset that may can lead to overfitting problems, and high variance in gene expression values leads to misclassification. Hence an intelligent model is necessary to mitigate the problems identified by the existing approaches. In this paper, a novel Intelligent Hybrid Ensemble Gene Selection (IHEGS) model is proposed. The proposed IHEGS model classifies the best performing genes with high rank from multiple feature selection techniques and they are aggregated moving towards the final gene subset thus excluding the poor performing and redundant genes. For that reason, it reduces the dimensionality problem considerably. Hence, towards the motivation of finding a stable and robust autism gene subset from high-dimensional microarray data, the following contributions are carried out in this work.
• An Intelligent Hybrid Ensemble Gene Selection (IHEGS) model is proposed.
• The data perturbation module employs the Standardized Cost pruning Extra Tree Classifier (SCP-ETC) for initial gene subset selection and feature cut-off process.
• Three swarm intelligence-based algorithms, Confidence Interval-Based Flamingo Search Algorithm (CI-FSA), Hinge Loss-Based Garra-Rufa Optimization (HL-GRO), Euclidean Distance-Based Seagull Optimization Algorithm (ED-SOA), are proposed in the functional perturbation module for selecting the final gene subset.
The proposed IHEGS model is depicted in Fig. 1. The key components of the proposed model are data partitioning, data similarity, the IHEGS module which in turn contains two submodules: The data perturbation module, and functional perturbation module, and finally the validation module.

Figure 1: Proposed model
To begin with, the microarray data is shuffled and divided into n partitions as Dp1, Dp2, Dpn by employing stratified subsampling. Through this practice, the data in each partition is balanced. Each partition contains m rows of samples and n columns of genes which are denoted by Eq. (1).
This module emphasizes redundant data partition removal. A one-way ANOVA test [16] was utilized to detect the similarity among the data groups. For every group, a null hypothesis and an alternative hypothesis are formulated as given in Eq. (2)
The one-way ANOVA test was carried out with a significance of 0.05. The significance of the hypothesis proves 95% confidence interval on the F-value. The groups with a similar spread of data are eliminated, and the obtained data frame is detailed in Eq. (3).
where Ω′′ signifies the similarity measures of the sampled data.
3.3 Intelligent Hybrid Ensemble Gene Selection
The objective of the proposed model is to predict the autism gene subset from high-dimensional microarray data. The proposed IHEGS model is formed by merging data perturbation and functional perturbation modules. The sampled data partition
The selection of the initial gene subset is achieved by the data perturbation module. In this module, the same feature selection strategy is applied to all data samples and aggregated by intersection operation. Which in turn assists in the recognition of a predictive subset of appropriate genes with higher classification accuracy. Small perturbations are prioritized by the data perturbation module. It is functional for avoiding instability problems when selecting the initial gene subset. To select an initial gene subset in the data perturbation module, SCP-ETC is proposed. SCP-ETC is made up of decision tree stumps. Each decision tree in the Extra Trees Forest is created from the training data. Then, the trees are arbitrarily chosen as the gene feature subset. The best feature to separate the data is determined by each tree as per calculated entropy at every test node. A slew of an independent decision tree is produced by the random selection of features. The importance of a feature is measured by the entropy of the genes. It is presented in Eq. (5).
where
where
where Fz,i signifies the primary gene subset and IGS is the initial gene subset. The common features that are selected across data partitions by the data perturbation module are retained by the intersection operation, and the uncommon features are removed.
The selection of a final gene subset of the ASD is identified by the functional perturbation module. The three proposed swarm intelligence techniques (CI-FSA, HL-GRO, and ED-SOA) are applied to the initial gene subset IGS selected by the data perturbation module.
CI-FSA (Feature Selection Model 1)
Feature selection model 1 employed in the proposed IHEGS is the Confidence Interval-based Flamingo Search Algorithm (CI-FSA). The Flamingo Search Algorithm (FSA) is inspired by the migratory and foraging behavior of flamingos. The basic understanding and theory of FSA are detailed in [17]. A confidence interval parameter is added to the existing FSA to avoid the fluctuations caused by the randomness of the diffusion factor. The confidence interval-based diffusion factor provides an exact range to control the exploitation and exploration to find the best features. In the proposed CI-FSA flamingos are the features, and fitness value is the best score of the features. The foraging and migratory behavior of the proposed CI-FSA are detailed below.
Foraging Behavior: Initialize Flamingo population P, Migrating flamingos MPb and Maximum Iteration Imax. Assume the Flamingo (Abj ) has the most food in the jth dimension. Consider Abij is the position of the ith and jth dimension of the flamingo population. The uncertainty of each flamingo disturbs the foraging behavior of an individual that encounters an error in the information transmitted. To simulate this, the maximum distance of the flamingo’s beak scan in foraging behavior is quantified, as given in Eq. (11).
where, η2 is a random number between −1 or 1, where
where,
The equation for updating the location of flamingos’ foraging behavior is given in Eq. (14).
Zβ/2 denotes the confidence interval value, and S.D denotes the standard deviation of the sample. It is used to increase the size of the flamingos’ foraging range to simulate the chance of individual selection in nature increase their global merit-seeking ability.
Migratory Behavior: The flamingos migrate to the next area due to the scarcity of food in the present area. Assume that the location of the food-rich area in the jth dimension is Abj, the formula for the migration of the flamingo’s population is as given in Eq. (16).
where ω = N(0, n) represents the random number based on a normal distribution with degrees of freedom n that increases the search space and simulates the randomness of individual behaviors of flamingos in the specific migration process. Finally, when the maximum iteration is reached an optimal solution is obtained. The obtained optimal solution is substituted to the objective function and sorted to find the most relevant features. The most relevant features are framed inside the data frame using FGS1 as given in Eq. (17).
HL-GRO (Feature Selection Model 2)
HL-GRO is employed as the feature selection model 2 in the functional perturbation module. It is a modified version of the existing GRO algorithm. The GRO algorithm is inspired by the behavior of Garra-Rufa fish, commonly used in massage centers for the commercial purposes detailed in [18]. To avoid a high exploration rate and to identify the worst leaders among mobile and follower fish, the proposed work has combined learning rate and hinge loss. Here, the fish is the gene profile. The detailed steps of HL-GRO are explained as follows
Step 1: Initially, for each leg fishes are equally distributed, and one leader is assigned to each group.
Step 2: Based on the optimal convergence speed of the fish, it has to be decided whether it is a leader or follower. Then, the number of leaders is chosen as per the problem complexity. The respective optimal points are selected for the objective functions.
Step 3: A few fish that travel into other group during each iteration offer the best optimal value among all groups. The traveling fish is deemed to be random and is indicated as mobile fish. However, the number of fish is kept constant.
Step 4: For every leader, sub-global fitness is assessed and the global fitness for each iteration is determined.
Step 5: After a random number of iterations, all the fish must follow one leader. First, the number of Followers can be calculated as given in Eq. (18).
where n implies the total particles and
Step 6: Using Eqs. (19) and (20), the change in the numbers of mobile and follower fish is calculated for the worst leaders.
where
To conclude, an optimal solution is offered by the maximum iteration attained to substitute in the objective function along with a group for finding the most relevant features. Utilizing HL-GRO (B), the most appropriate features are framed inside the data frame as shown in Eq. (23).
ED-SOA (Feature Selection Model 3)
The third gene selection strategy used in the functional perturbation module is the ED-SOA. It is based on the former SOA. SOA is a bio-inspired algorithm inspired by the seagull behavior in nature described in [19]. The proposed ED-SOA is an advanced version of the existing SOA. To avoid low convergence problems with the existing SOA algorithm, it should be adapted to find the balanced value that generates an accurate position of the search agents. Hence, a Euclidean distance-based SOA (ED-SOA) is proposed. The ED-SOA controls the slow convergence of the dimensions by handling dimension rates while updating the new position of the search agents. The selection of the features is based on the migration and attacking behaviors of a seagull. The exploration and exploitation approach of ED-SOA are illustrated below in detail.
Step1: Exploration
During the optimization process, three rules are followed to move seagulls from one group to another. The three rules are
Rule 1: To avoid the congestion between two seagulls, a variable is introduced for the evaluation of the new search agent position as shown in Eq. (24).
wherein
where ηs is presented for controlling the frequency of employing variable χ which is linearly reduced as of ηs to 0. The value ηs is fixed to 2 and t = 0, 1, 2…..maxiter.
Rule 2: After avoiding the collision, the search agent moves towards the best neighbor that is modeled as in Eq. (26).
where ATs indicates the search agent’s position Abs towards the best-fit search agent
Rule 3: Lastly, utilizing Euclidean distance, the position of the search agent is updated. It is formulated as shown in Eq. (27).
wherein, Ds denotes the distance between the search agent and the best-fit ones (i.e., the best seagull whose fitness value is less).
Step 2: Exploitation
As the Seagulls change their speed and position of attack by maintaining their altitude using their wings and weight. While attacking the prey, a spiral movement behavior occurs in the air. This behavior in the x, y, and z planes is explained as given in Eq. (28).
whereas r denotes the radius of every turn of the spiral, κ implies random number, u and ν are the constants for defining the spiral shape, and e denotes the natural logarithm’s base. Thus, the position of the search agent is updated as shown in Eq. (29).
where,
Overall, the functional perturbation ensemble component aggregates its inputs via a union operation, as shown in Eq. (31), to obtain the best feature subset, i.e., the final gene subset. The intelligence of various feature selection can be leveraged through the function perturbation cycle, and the obtained final gene set is less vulnerable to overfitting.
Lastly, the final gene subset

Figure 2: The proposed IHEGS algorithm
Validation is a process where selected genes are trained and evaluated with testing data to predict ASD genes. Validation is performed using a DNN model. The Fully Connected Neural Network (FCNN) is initiated by the selected features that are given by Eq. (32).
Thereafter, the input features get aggregated with their corresponding weights to get trained. The hidden layer output is given in Eq. (33).
where b denotes the bias, which is initialized randomly, wi is the weight of the respective input node, and Act denotes the activation function. The activation function for hidden neurons is leakyRelu and sigmoid for output neurons. Finally, the output layer provides the prediction of ASD. Based on the result, the error rate
The results obtained from the proposed IHEGS model for selecting ASD genes were analyzed and compared with existing techniques.
The six-benchmark microarray dataset from the NCBI with accession numbers GSE25507 (dataset 1) [7], GSE26415 (dataset 2) [20], GSE27044 (dataset 3) [21], GSE109905 (Dataset 4) [22], GSE42133 (Dataset 5) [23], and GSE123302 (Dataset 6) [24] were used for analysis. GSE25507 dataset contains gene expression of 82 autism and 64 controls with 54,614 probes. GSE26415 dataset comprises gene profiles of 21 adults with autism, 21 healthy mothers with autistic children, and 42 controls with 19,194 probes. GSE27044 microarray data holds the DNA methylation profile of autistic children and non-autistic siblings as control with 27,578 CpG sites. GSE109905 dataset comprises genome-wide DNA methylation of 38 ASD patients and 31Controls with 410620 CpG sites. GSE42133 dataset comprises a blood-based gene expression signature relevant to the brain pathophysiology of 87 ASD and 55 control with 47323 genes. GSE123302 dataset comprises 36459 genes with 59 ASD and 92 non-Typically Developing (non-TD) and 120 Typically Developing (TD) samples. Here gene expression of umbilical cord blood between ASD and TD, and between Non-TD and TD, was analyzed.
The proposed IHEGS model was implemented on the Windows 10 operating system with Intel i7 CPU @ 3.60 GHz processor and 8GB RAM. Python 3.7 with Numpy, Pandas, Seaborn, Matplotlib, Sklearn, Keras libraries are used for implementation.
The proposed IHEGS model is evaluated using the metrics classification accuracy, precision, recall, f-measure, error rate, False Positive Rate (FPR), False Negative Rate (FNR), and False Discovery Rate (FDR). The corresponding formulae are given from Eqs. (34) to (41) respectively.
where TP is true positive, TN is true negative, FP is false positive, FN is false negative.
4.4 Evaluation of Proposed Ensemble Feature Selection Technique
Here, for selecting ASD genes, the proposed IHEGS technique is compared based on the Jaccard Index (JI) and Spearman Correlation Coefficient (SCC) on the benchmark datasets. It is analyzed with the existing methods, namely: Feature similarity-based Feature Selection (FSFS) [25], Multi Cluster-based Feature Selection (MCFS) [26], Unsupervised Discriminative Feature Selection (UDFS) [27], PSO [28], and Genetic Algorithm (GA) [29]. Figures Figs. 3 and 4 depict the JI and SCC on the subset of 5% best features for the proposed IHEGS and the existing feature selection algorithm respectively.

Figure 3: Analysis of the robustness of proposed IHEGS based on JI

Figure 4: Analysis of the robustness of proposed IHEGS based on SCC
The proposed IHEGS technique is efficient since it attains an average JI of 0.858 and SCC of 0.886. But the average JI and SCC of existing algorithms range from 0.51–0.65 and 0.53–0.76 respectively. Therefore, from the results, the proposed IHEGS is signified by the high value of JI and SCC. Hence, it is clear that the proposed IHEGS can select gene features with robustness when compared with the other state-of-the-art techniques. In general, it is observed that ensemble feature selection provides stable and robust results since it depends on the multiple feature selection technique and the utilization of data samples. The proposed IHEGS has handled the data efficiently by adopting data partitioning and the removal of redundant data by the data similarity module. Moreover, the ensemble of data perturbation and functional perturbation has resulted in selecting relevant gene features resulting in highly stable and robust results.
4.5 Evaluation of DNN-IHEGS for Predicting ASD
Here, the proposed DNN- IHEGS model for selecting ASD gene is compared based on classification accuracy with the benchmark datasets and contrasted with the existing methodologies such as Naive Bayes-Feature Similarity-based Feature Selection (NB-FSFS) [25], Support Vector Machine-Multi Cluster-based Feature Selection (SVM-MCFS) [26], K-Nearest Neighbors-based Unsupervised Discriminative Feature Selection (KNN-UDFS) [27], Boosting based Particle Swarm Optimization (BOOST-PSO) [28], and Multi-Layer Perceptron based Genetic Algorithm (MLP-GA) [29]. The evaluation of the proposed IHEGS with the DNN model is illustrated in Tab. 1.
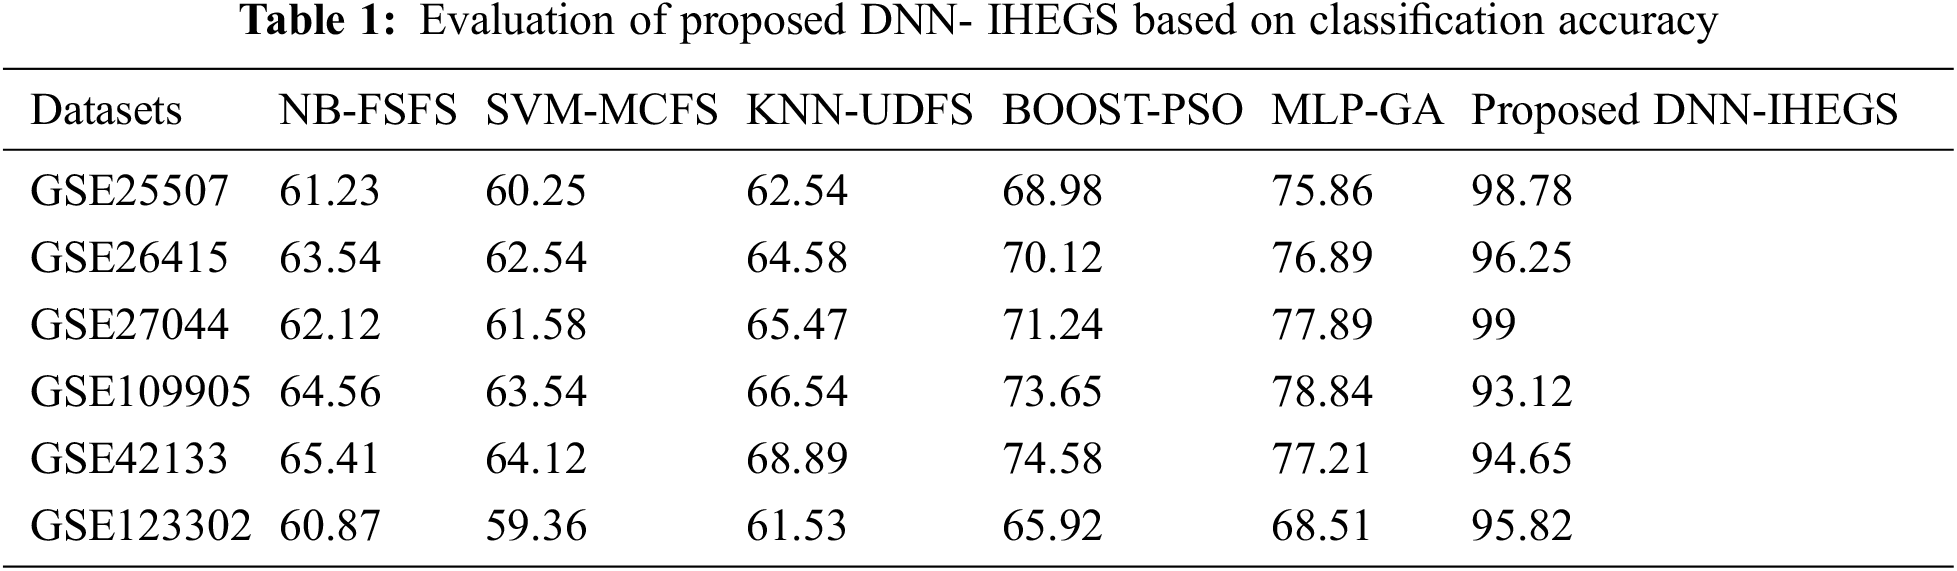
The proposed DNN-IHEGS predicts the ASD genes accurately by obtaining a range of accuracy values between 93.12%–99%. The existing methodologies tend to achieve an overall classification accuracy rate ranging from 60.25% to 77.89%, which is comparatively lower than the proposed DNN-IHEGS model. Thus, the DNN-IHEGS model achieves a better classification accuracy rate and tends to be more robust compared with the existing methods. An ensemble of proposed three intelligent swarm-based metaheuristic algorithms such as CI-FSA, HL-GRO, and ED-SOA in the functional perturbation module has resulted in selecting the most appropriate gene features that can distinctly classify diseased autistic gene from their control. Thus, a highly relevant feature leads to a better accuracy score with a lower error rate. The proposed technique also provides a low false prediction that is, a misclassification of the data by obtaining low FPR, FNR, and FDR values as illustrated in Fig. 5.

Figure 5: Analysis of proposed IHEGS-DNN based on FPR, FNR, and FDR
The metrics FPR, FNR, and FDR illustrate the possibility of misclassification. The lower value of the above metrics represents a better model. Accordingly, the proposed method achieves an average of 6.12% of FPR, 5.64% of FNR, and 2.23% of FDR, whereas the existing techniques tend to achieve an overall value ranging between 33.21% to 58.98% which leads to high misclassification and high error rate model. As a result of low FPR, FNR, and FDR the proposed IHEGS mode has obtained better precision, recall, f-measure, and low error rate as detailed in Tab. 2.

The stated metrics in Tab. 2 give a detailed analysis of reliability, sensitivity, and handling of complex data. The robust model has a higher value when the metrics are measured. Accordingly, the proposed technique tends to obtain an average precision of 95.95%, recall of 96.05%, F-Measure of 96.01%, and an error rate of 3.73% for the six benchmark datasets. Hence, the proposed IHEGS method achieved a better metrics value for detecting ASD and proved to be efficient. Thus, the proposed IHEGS method achieves better reliability and avoids misclassification of ASD genes as compared to the existing methods. The frequently selected genes and CpG sites by the proposed IHEGS with its confidence interval are given in Supplementary file 1. The selected gene subset is validated by the domain expert.
ASD is a neurodevelopment disorder that affects children between the ages of 2 and 5. Genetic and environmental factors influence the cause of ASD. Analyzing gene expression profiles from microarray data can provide meaningful etiologic insights into the disorder. But the complex patterns of genes due to irregular molecular interactions during the transcription process, and the sample size of microarray data make the data difficult for analysis. Hence an Intelligent Hybrid Ensemble Gene selection model was proposed to identify stable and robust gene subsets from high dimensional microarray data. The proposed model comprises both data perturbation and function perturbation modules. SCP-ETC was employed by the data perturbation module to identify the initial gene subset. The functional perturbation module was built with three intelligent swarm-based metaheuristic algorithms such as CI-FSA, HL-GRO, and ED-SOA to identify the final gene subset. The predicted autism genes subset was validated using the DNN model. 6 benchmark microarray datasets were used for the implementation. From the experimental results, it was proved that the proposed IHEGS model was stable and robust enough to identify the autism gene subset from the microarray dataset. The proposed IHEGS obtains an average JI of 0.858 and SCC of 0.886 and predicts the ASD with an average accuracy of 96.25%, precision of 95.95%, recall of 96.06, and an f-measure of 96.01% for the six NCBI benchmark datasets. The prediction model avoids misclassification and overall remains to be stable and robust as compared to existing state-of-the-art methods. In the future, the proposed IHEGS model could be used as a feature selection technique for various other engineering problems and high dimensional datasets that need optimization.
Acknowledgement: We thank Dr. Amala for the validation of the results obtained by the proposed system.
Funding Statement: The authors received no specific funding for this study.
Conflicts of Interest: The authors declares that they have no conflicts of interest to report regarding the present study.
References
1. American Psychiatric Association, “What is autism spectrum disorder?,” American psychiatric pub, 2018. [online]. Available: https://www.psychiatry.org/patients-families/autism/what-is-autism-spectrum-disorder. [Google Scholar]
2. M. J. Maenner, K. A. Shaw, A. V. Bakian, D. A. Durkin, M. S. Esler et al., “Prevalence and characteristics of autism spectrum disorder among children aged 8 years—Autism and developmental disabilities monitoring network, 11 sites, United States, 2018,” MMWR. Surveillance Summaries, vol. 70, no. 11, pp. 1–16, 2021. [Google Scholar]
3. G. Anurekha and P. Geetha, “Performance analysis of supervised approaches for autism spectrum disorder detection,” International Journal of Trend in Research and Development (IJTRDSpecial Issue RIET, pp. 16–18, 2017. [Google Scholar]
4. O. Pain, A. J. Pocklington, P. A. Holmans, N. J. Bray, H. E. O’Brien et al., “Novel insight into the etiology of autism spectrum disorder gained by integrating expression data with genome-wide association statistics,” Biological Psychiatry, vol. 86, no. 4, pp. 265–273, 2019. [Google Scholar]
5. X. Zhang, X. Sun, W. Sun, T. Xu, P. Wang et al., “Deformation expression of soft tissue based on bp neural network,” Intelligent Automation & Soft Computing, vol. 32, no. 2, pp. 1041–1053, 2022. [Google Scholar]
6. X. Zhang, J. Zhou, W. Sun and S. K. Jha, “A lightweight CNN based on transfer learning for COVID-19 diagnosis,” Computers, Materials & Continua, vol. 72, no. 1, pp. 1123–1137, 2022. [Google Scholar]
7. M. D. Alter, R. Kharkar, K. E. Ramsey, D. W. Craig, R. D. Melmed et al., “Autism and increased paternal age related changes in global levels of gene expression regulation,” PLoS ONE, vol. 6, no. 2, pp. e16715, 2011. [Google Scholar]
8. W. Awada, T. M. Khoshgoftaar, D. Dittman, R. Wald and A. Napolitano, “A review of the stability of feature selection techniques for bioinformatics data,” in Proc. of the IEEE Conf. on Information Reuse and Integration (IRI 2012), Las Vegas, NV, USA, pp. 356–363, 2012. [Google Scholar]
9. R. Alzubi, N. Ramzan and H. Alzoubi, “Hybrid feature selection method for autism spectrum disorder SNPs,” in Proc. of the IEEE Conf. on Computational Intelligence in Bioinformatics and Computational Biology (CIBCB 2017), Manchester, UK, pp. 1–7, 2017. [Google Scholar]
10. K. L. Chiew, C. L. Tan, K. S. Wong, K. S. C. Yong and W. K. Tiong, “A new hybrid ensemble feature selection framework for machine learning-based phishing detection system,” Information Sciences, vol. 484, pp. 153–166, 2019. [Google Scholar]
11. S. S. Hameed, R. Hassan and F. F. Muhammad, “Selection and classification of gene expression in autism disorder: Use of a combination of statistical filters and a GBPSO-SVM algorithm,” PLoS ONE, vol. 12, no. 11, pp. 1–25, 2017. [Google Scholar]
12. N. Samy, R. Fathalla, N. A. Belal and O. Badawy, “Classification of autism gene expression data using deep learning,” in Proc. of the Int. Conf. on Intelligent Data Communication Technologies and Internet of Things (ICICI 2019), Coimbatore, India, vol. 38, pp. 583–596, 2019. [Google Scholar]
13. K. Sekaran and M. Sudha, “Predicting autism spectrum disorder from associative genetic markers of phenotypic groups using machine learning,” Journal of Ambient Intelligence and Humanized Computing, vol. 12, no. 3, pp. 3257–3270, 2021. [Google Scholar]
14. A. Rouhi and H. Nezamabadi-Pour, “A hybrid-ensemble based framework for microarray data gene selection,” International Journal of Data Mining and Bioinformatics, vol. 19, no. 3, pp. 221–242, 2017. [Google Scholar]
15. N. Singh and P. Singh, “A hybrid ensemble-filter wrapper feature selection approach for medical data classification,” Chemometrics and Intelligent Laboratory Systems, vol. 217, pp. 104396, 2021. [Google Scholar]
16. G. A. Churchill, “Using ANOVA to analyze microarray data,” Biotechniques, vol. 37, no. 2, pp. 173–177, 2004. [Google Scholar]
17. W. Zhiheng and L. Jianhua, “Flamingo search algorithm: A new swarm intelligence optimization algorithm,” IEEE Access, vol. 9, pp. 88564–88582, 2021. [Google Scholar]
18. A. S. Jaber, H. A. Abdulbari, N. A. Shalash and A. N. Abdalla, “Garra rufa-inspired optimization technique,” International Journal of Intelligent Systems, vol. 35, no. 11, pp. 1831–1856, 2020. [Google Scholar]
19. G. Dhiman and V. Kumar, “Seagull optimization algorithm: Theory and its applications for large-scale industrial engineering problems,” Knowledge-Based Systems, vol. 165, pp. 169–196, 2019. [Google Scholar]
20. Y. Kuwano, Y. Kamio, T. Kawai, S. Katsuura, N. Inada et al., “Autism-associated gene expression in peripheral leucocytes commonly observed between subjects with autism and healthy women having autistic children,” PLoS ONE, vol. 6, no. 9, pp. e24723, 2011. [Google Scholar]
21. R. S. Alisch, B. G. Barwick, P. Chopra, L. K. Myrick, G. A. Satten et al., “Age-associated DNA methylation in pediatric populations,” Genome Research, vol. 22, no. 4, pp. 623–632, 2012. [Google Scholar]
22. R. Kimura, M. Nakata, Y. Funabiki, S. Suzuki, T. Awaya et al., “An epigenetic biomarker for adult high-functioning autism spectrum disorder,” Scientific Reports, vol. 9, no. 1, pp. 1–7, 2019. [Google Scholar]
23. T. Pramparo, K. Pierce, M. V. Lombardo, C. C. Barnes, S. Marinero et al., “Prediction of autism by translation and immune/inflammation coexpressed genes in toddlers from pediatric community practices,” JAMA Psychiatry, vol. 72, no. 4, pp. 386–394, 2015. [Google Scholar]
24. C. E. Mordaunt, B. Y. Park, K. M. Bakulski, J. I. Feinberg, L. A. Croen et al., “A meta-analysis of two high-risk prospective cohort studies reveals autism-specific transcriptional changes to chromatin, autoimmune, and environmental response genes in umbilical cord blood,” Molecular Autism, vol. 10, no. 1, pp. 1–21, 2019. [Google Scholar]
25. Y. Li, S. J. Hu, W. J. Yang, G. Z. Sun, F. W. Yao et al., “Similarity-based feature selection for learning from examples with continuous values,” in Proc. Pacific-Asia Conf. on Knowledge Discovery and Data Mining (PAKDD 2009), Berlin, Heidelberg, pp. 957–964, 2009. [Google Scholar]
26. D. Cai, C. Zhang and X. He, “Unsupervised feature selection for multi-cluster data,” in Proc. KDD, New York, NY, United States, pp. 333–342, 2010. [Google Scholar]
27. Y. Yang, H. T. Shen, Z. Ma, Z. Huang and X. Zhou, “L2,1-norm regularized discriminative feature selection for unsupervised learning.” in Proc. Int. Joint Conf. on Artificial Intelligence (IJCAI 2010), Barcelona, Spain, pp. 333–342, 2010. [Google Scholar]
28. B. Xue, M. Zhang and W. N. Browne, “Particle swarm optimization for feature selection in classification: A multi-objective approach,” IEEE Transactions on Cybernetics, vol. 43, no. 6, pp. 1656–1671, 2013. [Google Scholar]
29. F. Tan, X. Fu, Y. Zhang and A. G. Bourgeois, “A genetic algorithm-based method for feature subset selection,” Soft Computing, vol. 12, no. 2, pp. 111–120, 2008. [Google Scholar]
Cite This Article
 Copyright © 2023 The Author(s). Published by Tech Science Press.
This work is licensed under a Creative Commons Attribution 4.0 International License , which permits unrestricted use, distribution, and reproduction in any medium, provided the original work is properly cited.
 Downloads
 Citation Tools