
 Submit a Paper
 Propose a Special lssue
 Open Access
ARTICLE

Parkinson’s Disease Classification Using Random Forest Kerb Feature Selection
1 Department of Computer Science and Engineering, University College of Engineering, Villupuram, Kakupppam, 605 103, India
2 Department of Science and Humanities, University of College of Engineering, Ariyalur, Kavanur, 621 705, India
* Corresponding Author: E. Bharath. Email:
Intelligent Automation & Soft Computing 2023, 36(2), 1417-1433. https://doi.org/10.32604/iasc.2023.032102
Received 06 May 2022; Accepted 08 June 2022; Issue published 05 January 2023
 View Full Text
 Download PDF
Abstract
Parkinson’s disease (PD) is a neurodegenerative disease cause by a deficiency of dopamine. Investigators have identified the voice as the underlying symptom of PD. Advanced vocal disorder studies provide adequate treatment and support for accurate PD detection. Machine learning (ML) models have recently helped to solve problems in the classification of chronic diseases. This work aims to analyze the effect of selecting features on ML efficiency on a voice-based PD detection system. It includes PD classification models of Random forest, decision Tree, neural network, logistic regression and support vector machine. The feature selection is made by RF mean-decrease in accuracy and mean-decrease in Gini techniques. Random forest kerb feature selection (RFKFS) selects only 17 features from 754 attributes. The proposed technique uses validation metrics to assess the performance of ML models. The results of the RF model with feature selection performed well among all other models with high accuracy score of 96.56% and a precision of 88.02%, a sensitivity of 98.26%, a specificity of 96.06%. The respective validation score has an Non polynomial vector (NPV) of 99.47%, a Geometric Mean (GM) of 97.15%, a Youden’s index (YI) of 94.32%, and a Matthews’s correlation method (MCC) 90.84%. The proposed model is also more robust than other models. It was also realised that using the RFKFS approach in the PD results in an effective and high-performing medical classifier.Keywords
Parkinson’s disease (PD) is a progressive neurodegenerative condition, 1.5 times more severe in men than in women [1]. It causes dopaminergic neurons to break or die. Genetic and environmental factors affect the risk of Parkinson’s disease. PD impacts between 1–2 people per 1000 in over 60-year-olds and primarily influencing the body’s motor function [2,3]. Four main PD signs are tremor, rigidity, postural dysfunction, and bradykinesia [4,5]. Regarding cognitive measures, researchers observed poorer performance in males specifically, PD males reported higher deficits in verbal fluency [6], color word -9] intervention [7] and processing speed [8,9]. The emergence of prodromal Parkinsonism may be indicated by sleep disorder [10,11] namely Parkinson’s disease [12]. In most groups, PD happens twice as much for men as in women [13,14]. Findings from the last decade indicate that the relationship of genetics to family PD types is much greater than earlier.
PD early diagnosis strengthens health by proper treatment. Vocal defacementsbecome more frequent among affected individuals during the initial PD period. Advanced vocal disorder studies provide more support for precise PD detection. In this paper, the significant vocal features of PD are identified using RF Kerb Feature Selection (RFKFS). Furthermore, through this features the Machine Learning (ML) model performance is enhanced [15–18]. For PD classification, Decision Tree [19] Random Forest [20], Logistic Regression [21], SVM [22,23], and Neural Network [24–26] models are employed. We accessed the PD dataset from the University of California (UCI) [27], Irvine ML repository to conduct the experimental analysis. The number of instances trained and tested for classification performance evaluation can be improved using real-world datasets in PD studies.
Data mining is a method to extract valuable knowledge of data interpretation from training samples [28]. Several ML models are used to find hidden data patterns [29]. Classification and prediction [30,31] is a data mining techniques applied to various fields such as disease diagnosis, fraud deduction, web page categorization. The three main categories of ML include supervised learning, semi-supervised learning, and unsupervised learning [32,33]. Expert systems built using machine learning techniques will help physicians identify and predict diseases [34,35]. Due to the importance of human disease diagnosis, several studies have been conducted to establish strategies for classification. Of medical data mining, literature indicates that many researchers have used different classification schemes to forecast chronic disease of order to obtain strong test outcomes and statistical precision. Numerous classifiers have been introduced and used in the past to classify chronic diseases [36].
Machine Learning is a cognitive intelligence branch, enabling a computer to improve its efficiency. This growth, however, also led to difficulties in pattern recognition and knowledge exploration. Despite traditional methods, adequate efficiency cannot be achieved when dealing with complex data such as imbalanced, high-dimensional, noisy, etc. The explanation is that capturing a number of characteristics and the underlying nature of the results is difficult for these approaches. In this sense, a key issue in data mining is how to create an efficient information discovery and mining platform [37]. As a single hot-spot analysis, the embedded method aims to combine data fusion, data processing and data mining into a coherent system.
In machine learning, dimensionality reduction helps to increase overall performance. Dimensionality reduction divided into feature selection [38] and feature extraction [39,40]. Designing effective disease detection classifier would cross the challenges of scalable, predictive and informative systems. Adequate selection of features significantly impacts classifier accuracy and reliability. This implies a significant change in the PD detection accuracy. UCI voice samples PD dataset has 754 attributes, including 21 baseline attributes, 731 extracted attributes, patient ID and gender. This study’s outcome emphasizes the significance of intelligent learning models in complex disease diagnosis. Another important contribution of this study is comparing ML models using RFKFS feature selection, which combines five classifier predictions [41,42].
There are four types of feature selection in the machine learning algorithm: Filter, Wrapper, Hybrid and Embedded. One of the famous techniques for pre-processing data is to reduce dimensionality by removing irrelevant and redundant features. Feature extraction and feature selection are the two categories of dimensional reduction approaches [43,44]. Data dimensionality is minimized in feature extraction by deriving additional features from the baseline features provided. The representative feature extraction methodologies are Principal Component Analysis (PCA), Linear Discriminant Analysis (LDA), and Singular Value Decomposition (SVD) [45]. Feature selection, on the other hand, tries to select a small group of baseline features from all potential features based on a predetermined assessment criterion. In general, feature selection is necessary when a dataset has a high number of features and users want to develop generalizable models, minimize computational complexity, and reduce storage requirements. These can also be accomplished through feature extraction, however feature selection is more necessary when readability and interpretability of models or data are critical, as the originality of features is preserved in the smaller space [46].
Usually, the selection method requires four phases, including selection, evaluation, stopping and validation. A function subset is chosen in the first stage using a predefined search technique such full search, sequential search, or sequential floating search [47]. A second stage criterion will be used to evaluate the selected feature subset. After you’ve reached the stop condition, choose the subset with the highest evaluation value out of all the subsets that are accessible. Finally, the subset is tested using valid metrics. Both regulated and unsupervised concepts will categorize the methods of collection of functions as follows:
Filters try to select an appropriate subset of feature based on general data properties. They measure a subset score based on certain evaluation parameters and choose the best-scoring subset. The criterion for the test can be multivariate or uni-variable. While multi variable measures take into account more than two-way interactions within the feature set, univariate measures analyse each function separately [48].
Wrappers help a learner to determine the value of possible subsets. This improves the effectiveness of the predefined learning algorithm, but it seems more technical than filters. Next, using search techniques, wrappers achieve a subset function. Then a learning algorithm tests the selected subset’s consistency. Follow this process until the stop is reached. Hybrid approaches are designed for both wrapping and filter advantages. Two hybridization methods are often used. To obtain the final sub-set, one approach is to use a two-stage filtering operation to decrease the set of features, followed by a wrapper approach to the reduced set. The other way is to utilize a wrapper (filter) as a local search mechanism in a wrapper (filter) approach. The latter way is able to give higher results in terms of learning performance and feature subset size.
Embedded method, known as the wrapper-filter method, provides feature selection in the learning process. First, wrapping integrates with ML models. Then the learning algorithm is not needed many times, as the wrappers yield optimal results. Often, integrated approaches cannot achieve better learning than wrappers. For categorical datasets with discrete variables, most filter selection algorithms work well. Wrapper techniques can be safer if the dataset comprises constant or mixed variables, as many ML algorithms can handle data in different ways. Using embedded approach depends heavily on the ML ability to handle categorical data. Hybrid methods are often used with many different and distinct features. If the dataset size is small, then pre-process, filter method with fine-tuned parameters helps in ignoring over fitting and bias.
Our main contributions can be summarized as follows:
Our prediction approach, first and foremost, assists in the construction of robust feature representations from diverse speech signal baseline and extracted features. The number of irrelevant and noisy features increases as feature size grows. In addition, an effective feature selection process is required for recreating less noisy and compact features from baseline features. In order to accomplish this, an RFKFS mechanism based on feature selection was revealed. The proposed mechanism combines the baseline and extracted features and selects only the significant ones using an attribute threshold. The attribute threshold interval range is achieved by taking the maximum mean decrease in accuracy and gini of RF.
Our next contribution is the use of machine learning models for the classification of Parkinson’s disease. Learning models such as Decision Tree, Random Forest, Logistic Regression, SVM, and Neural Network ML are used for this. To conduct the experimental analysis, the real PD dataset is accessed from the UCI, ML repository. Accuracy, sensitivity, specificity, fall-out, miss rate, precision, LR+, LR−, F1 score, geometric mean, and Youden’s index are used to evaluate the performance of ML models.
The rest of the paper is organized as follows. The concepts integrated in this system alongside the RCFS are complete in Section 2. For better representation, the PD dataset used in this experiment is projected as tables and graphs, which are addressed in depth in Section 3. Section 4 describes the suggested research and finishes by emphasizing the study’s importance.
The most popular machine-learning algorithms are the random forests. They are as powerful as they have generally strong predictive performance, low over fitting and clear interpretability. The estimation of how much each variable contributes to the classification decision is quick. Selection of features using the Random Forest involves integrated approaches. Embedded approaches incorporate filter and wrapper efficiency with built-in filtering methods of their own. More precise, systematic and interpretable is the key benefit of embedded methods.
The investigational work of our mechanism is created with Parkinson’s disease dataset, obtained from the ML depository of UCI. In 756 cases, 564 cases are affected by Parkinson’s (class–1) and 192 cases (class–0) are not affected. It has 754 attributes, including 21 baseline attributes, 731 extracted attributes, patient Id and gender.
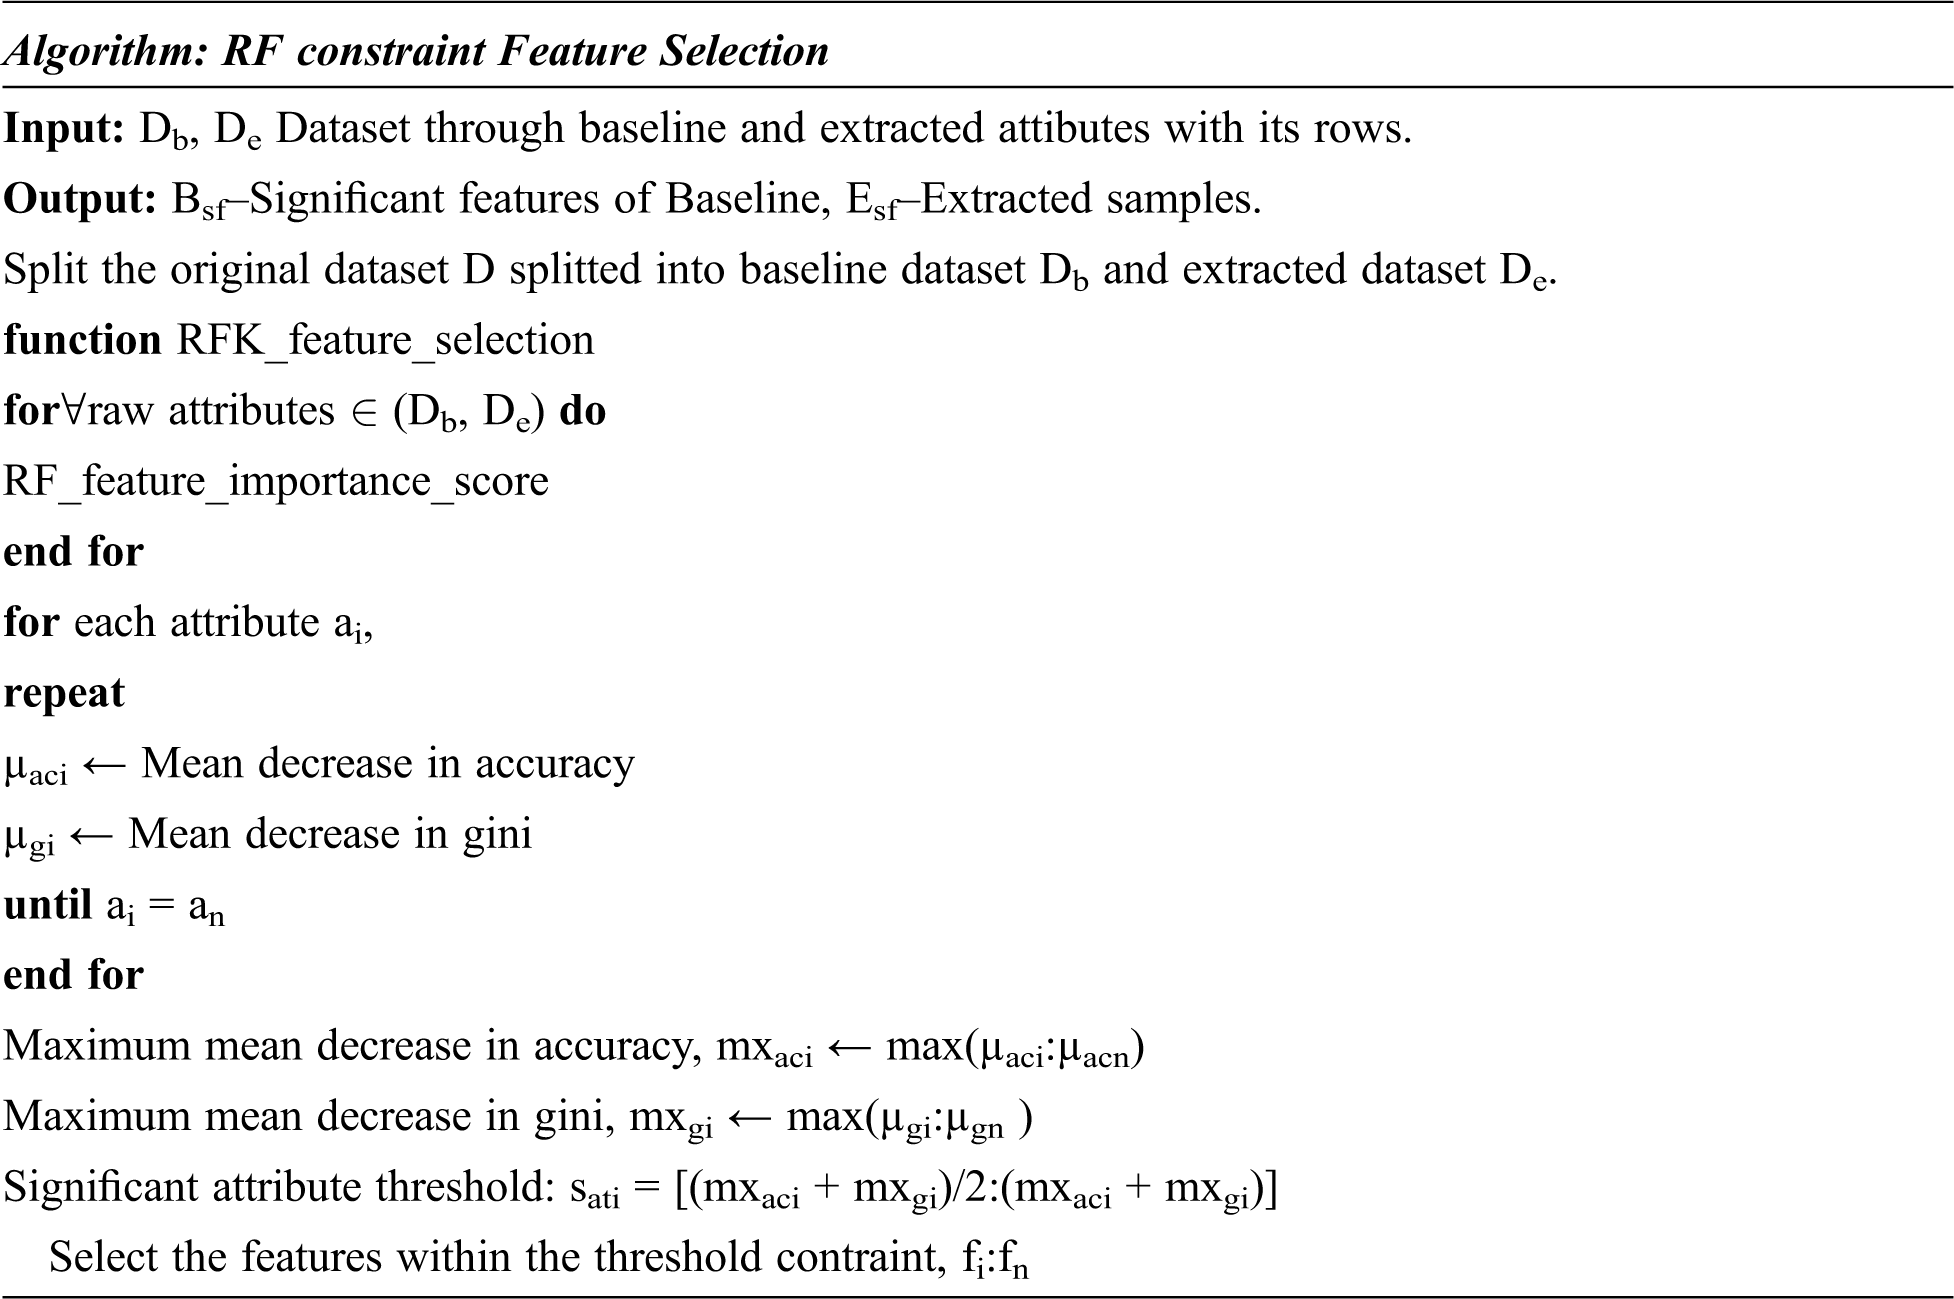
The RFKFS algorithm is an embedded method used to evaluate the learning model and will be described in more detail in this section. Before applying RFKFS, the performance of the classifier is recorded with respect to the baseline and extracted features of Parkinson’s disease. Fig. 1 shows the RFKFS evaluation of the experiment. Based on the accuracy of the model, the performance features are chosen in order to select significant features from the RFKFS. Let the training set of baseline and extracted attributes Db, De contains the Parkinson samples in the system of
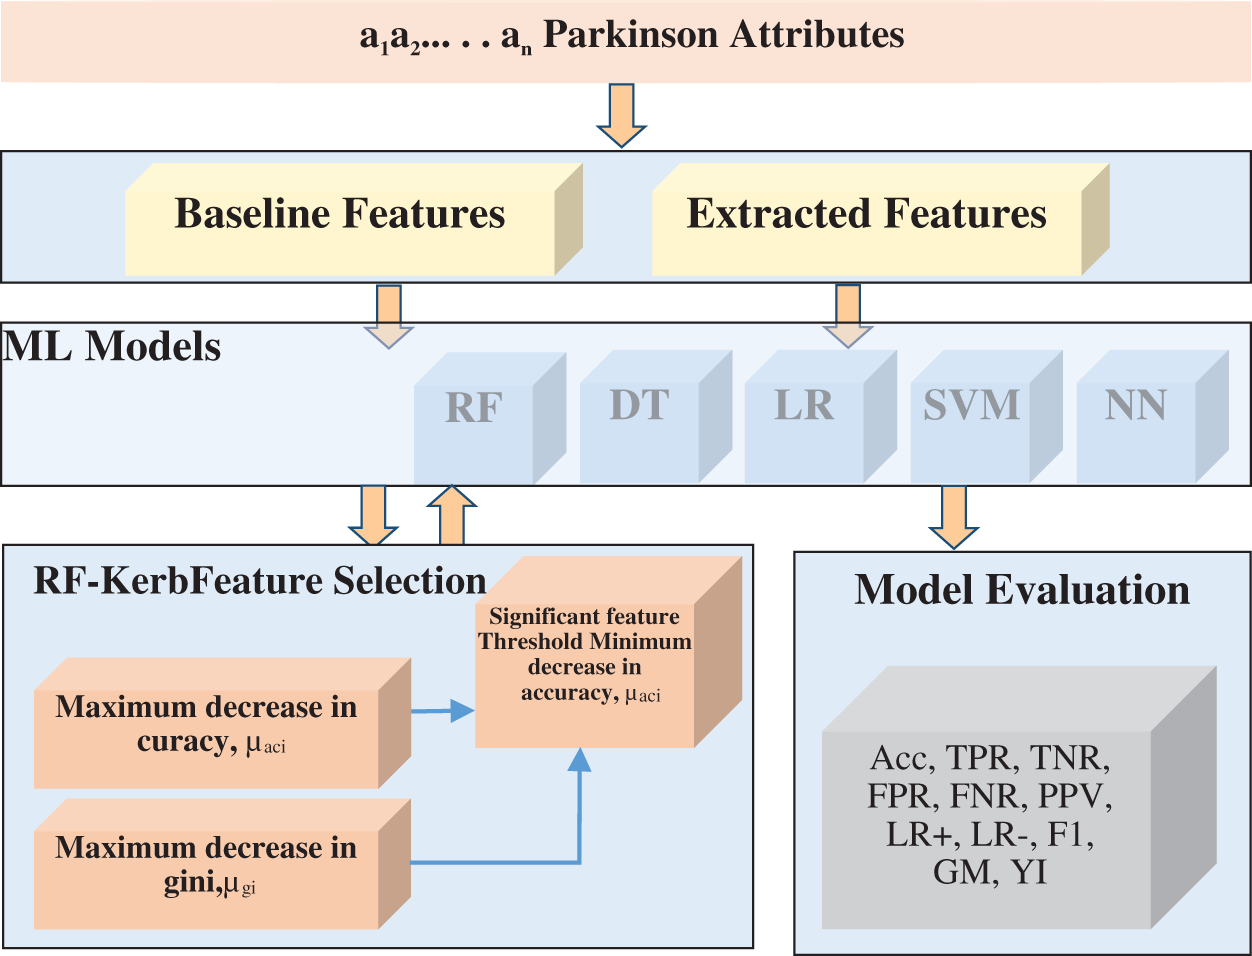
Figure 1: RF kerb feature selection architecture
In this section, we evaluate the performance of the proposed system and analyze the results. Significance observation revealed using PD selected RFKFS features had the best results over the three experiments with classifiers. In order to classify Parkinson disease from the repository of UCI we used an R with a ML package and R-Studio interface. The PD dataset contains a wide range of baseline-based voice recordings and measurements. Classification is developed using the five current DT, RF, LR, SVM and NN models. All the models are tested using full cross validation.
Confusion matrix is used to calculate classification performance when the target includes two or more labels. Model evaluation is carried out with TP (True Positive), TN (True Negative), FP (False Positive) and FN (False Negative). Accuracy, TPR (true positive ratio), TNR (true negative ratio), FPR (false positive ratio), FNR (false negative ratio), PPV (positive predictive value), NPV (Negative predictive value), LR+ (likelihood ratio positive), LR- (likelihood ratio negative), Matthew’s correlation method, F-measure, Geometric mean and Youden’s index are the most performance indicators using the above measures. The proposed model was tested with Parkinson disease dataset from the UCI repository. We conducted three sets of experiments to obtain a comprehensive evaluation of several state-of-the-art algorithms. For the classifiers all performance metrics are measured in percentage.
True positive TP’s are those with a disease, and then the model tested correctly as positive. True negative TN’s are those with no disease, and then the model tested correctly as negative. False positive FP’s are those without disease, but the model had been incorrectly tested as positive. False negatives FN’s are those with disease, but the model had been incorrectly tested as negative is presented in Tab. 1. Accuracy can be defined as the number of correct predictions produced by the ratio of total predictions.

TPR is a classifier sensitivity measure to correctly identify the positive class proportion.
TNR is a classifier specificity measure to correctly identify the negative class proportion.
FPR is a fall-out classification measure calculated as the number of incorrect positive predictions divided by the total number of negatives. The best FPR is in the lower range, while the worst is higher.
FNR is a miss rate classification measure calculated as the number of incorrect negative predictions divided by the total number of positives. The best FNR is in the lower range, while the worst is higher.
PPV is calculated as the number of correct positive predictions divided by the total number of positive predictions.
Positive Likelihood (LR+) measures how much the disease odds increase when a positive diagnosis test is performed.
That is, a person with the disease, predicted correctly as positive by a person without the disease, predicted incorrectly as positive = Pr (T+ | D+)/Pr (T+ | D−)
Negative Likelihood (LR−) measures how much the disease odds decrease when a negative diagnosis test is performed. The best LR− is in the lower range, while the worst is higher. Both LR+ and LR− rely on TPR and TNR indicators, making them suitable for balanced, imbalanced data.
That is, a person with the disease predicted incorrectly as negative by a person without the disease predicted correctly as negative = Pr (T− | D+) / Pr (T− | D−). Here (T+, T−) indicates that the test results are positive and negative. Similarly, (D+, D−) indicates that the disease is actually present and absent.
F1 score is PPV and TPR harmonic mean. It ranges from 0 to 1 wherein 1 indicates perfect accuracy and recall.
Geometric Mean (GM) is intended to aggregate TPR and TNR.
Youden’s Index (YI) aggregates TPR and TNR as in GM. Mostly, for highly skewed data, GM and YI are used to measure model performance.
The first experiment included only 21 basic attributes and the second one involved 731 extraction attributes are presented in Tabs. 2 and 3, respectively. On this data set, each row lists performance measurements of ML methods. Among all methods the best result is marked in bold. In order to perform significant feature selection we have used the proposed RFKFS algorithm. Finally, the significant features are selected for classifiers evaluation and the same is presented in Tab. 4. The comparative performance of our experiments is shown in Figs. 2–14 along with different classifiers.


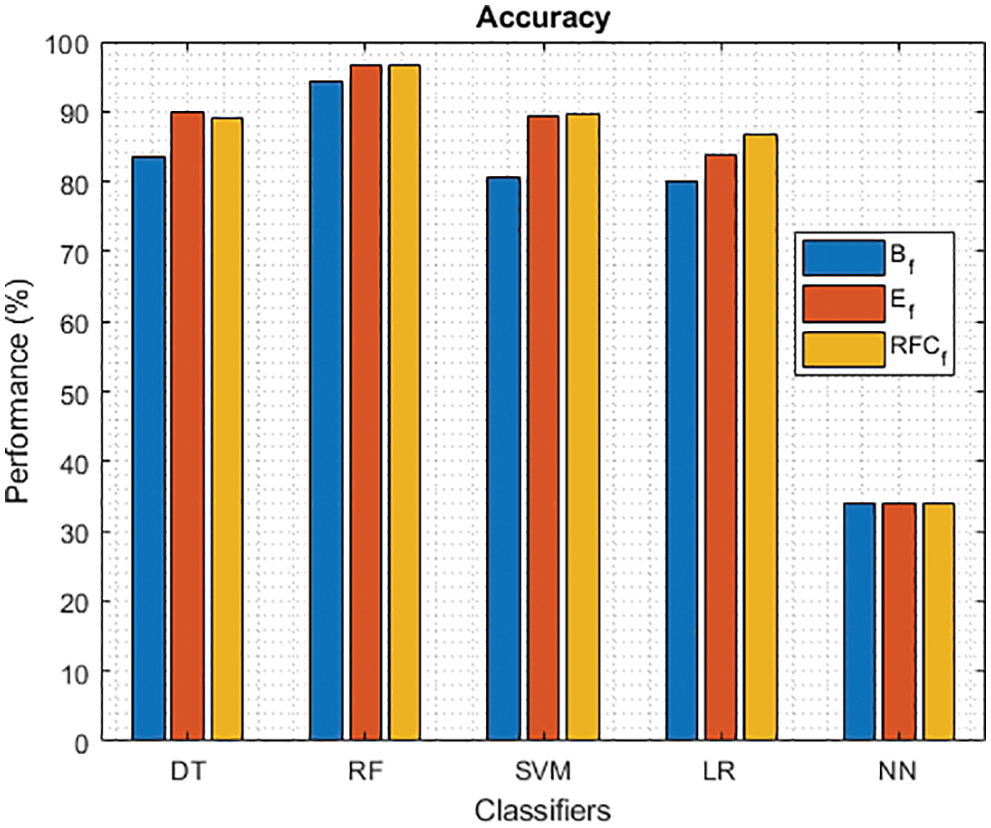
Figure 2: Accuracy of different classifiers using baseline, extracted and RFKFS features

Figure 3: TPR of different classifiers using baseline, extracted and RFKFS features
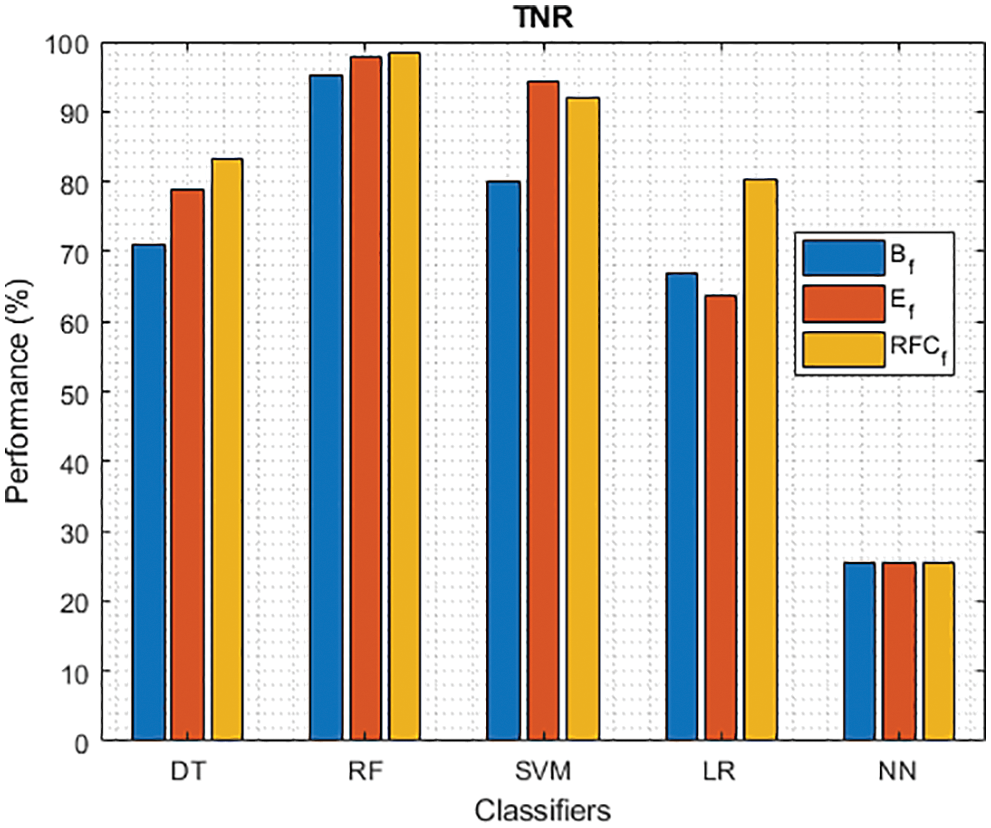
Figure 4: TNR of different classifiers using baseline, extracted and RFKFS features
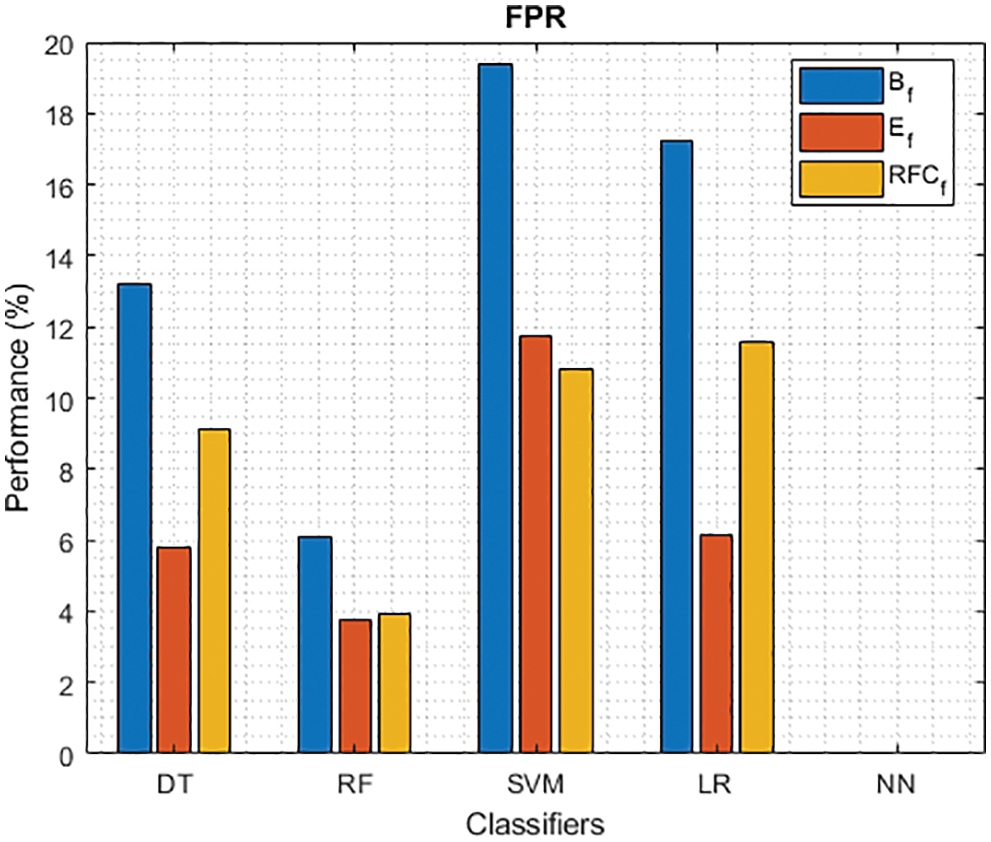
Figure 5: FPR of different classifiers using baseline, extracted and RFKFS features
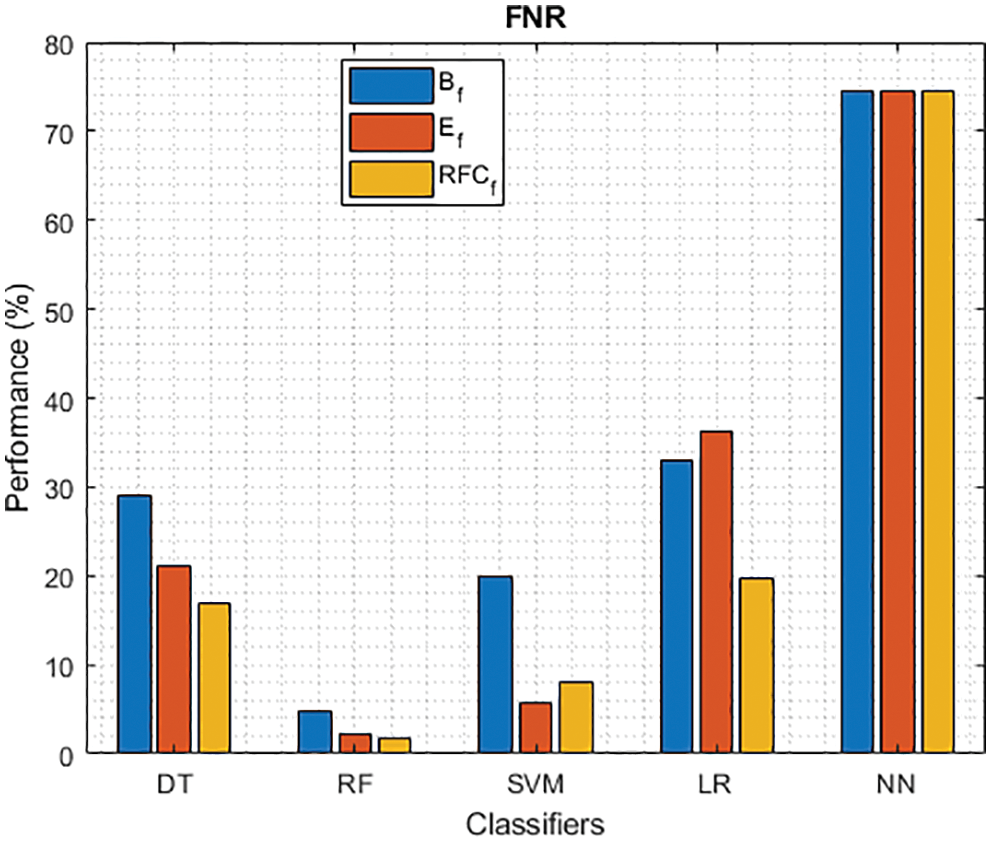
Figure 6: FNR of different classifiers using baseline, extracted and RFKFS features
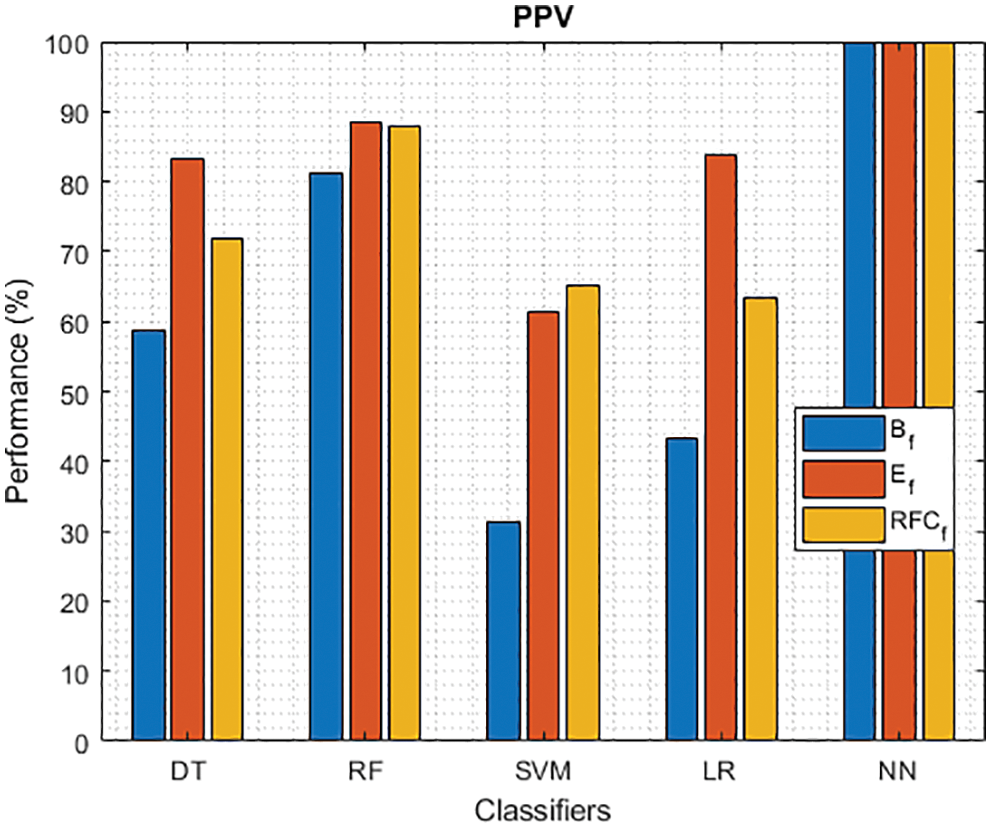
Figure 7: PPV of different classifiers using baseline, extracted and RFKFS features
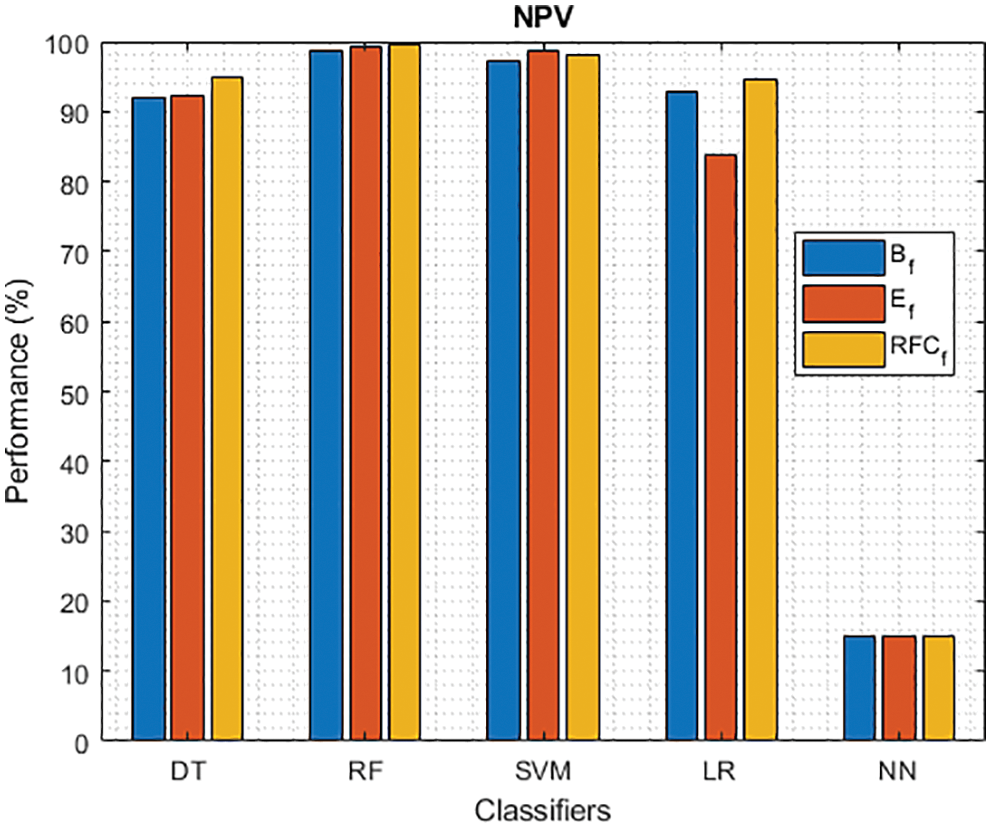
Figure 8: NPV of different classifiers using baseline, extracted and RFKFS features
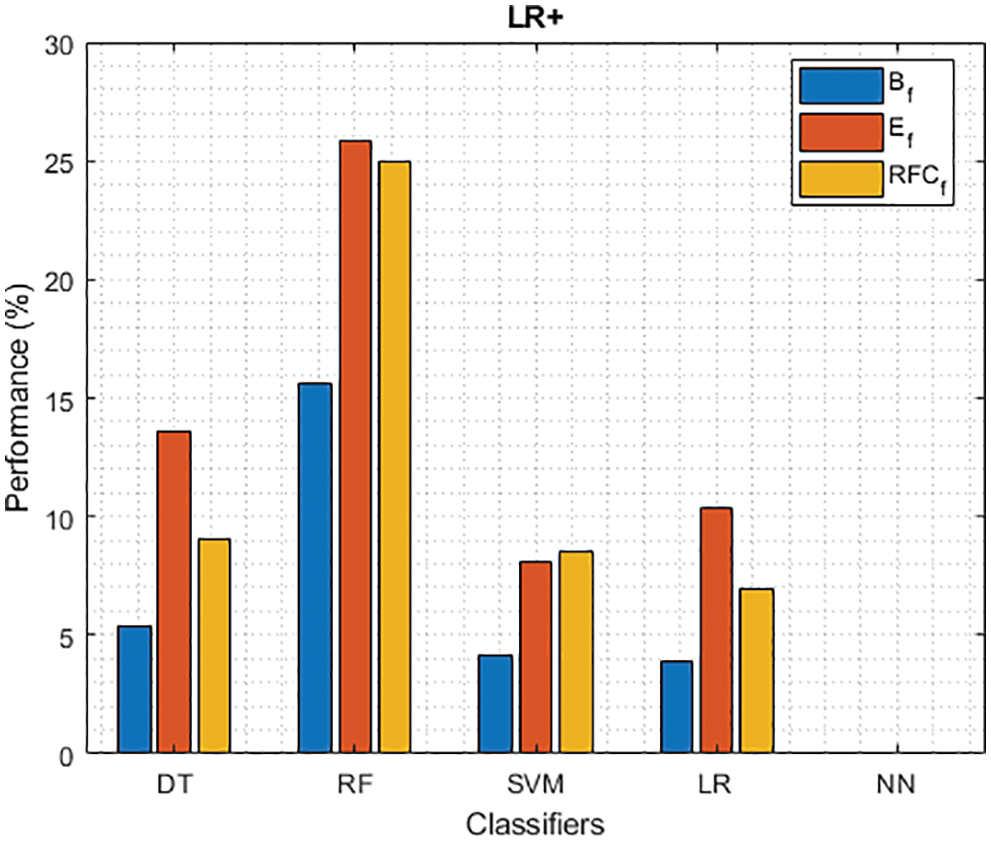
Figure 9: LR+ of different classifiers using baseline, extracted and RFKFS features
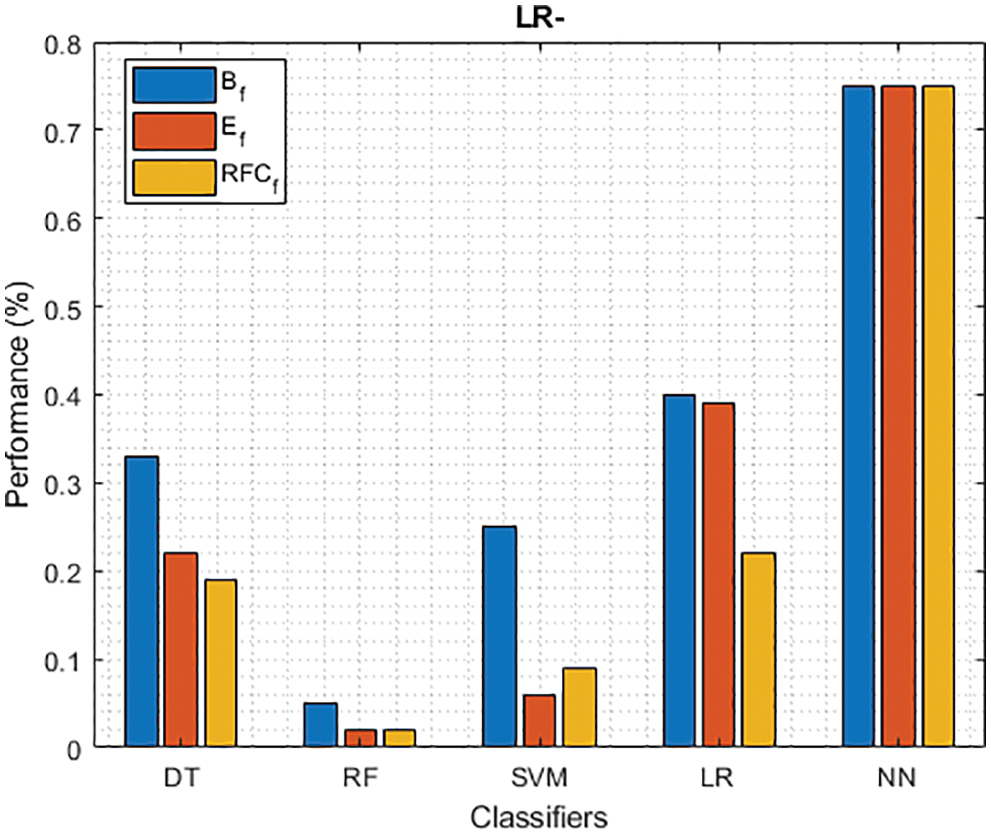
Figure 10: LR− of different classifiers using baseline, extracted and RFKFS features
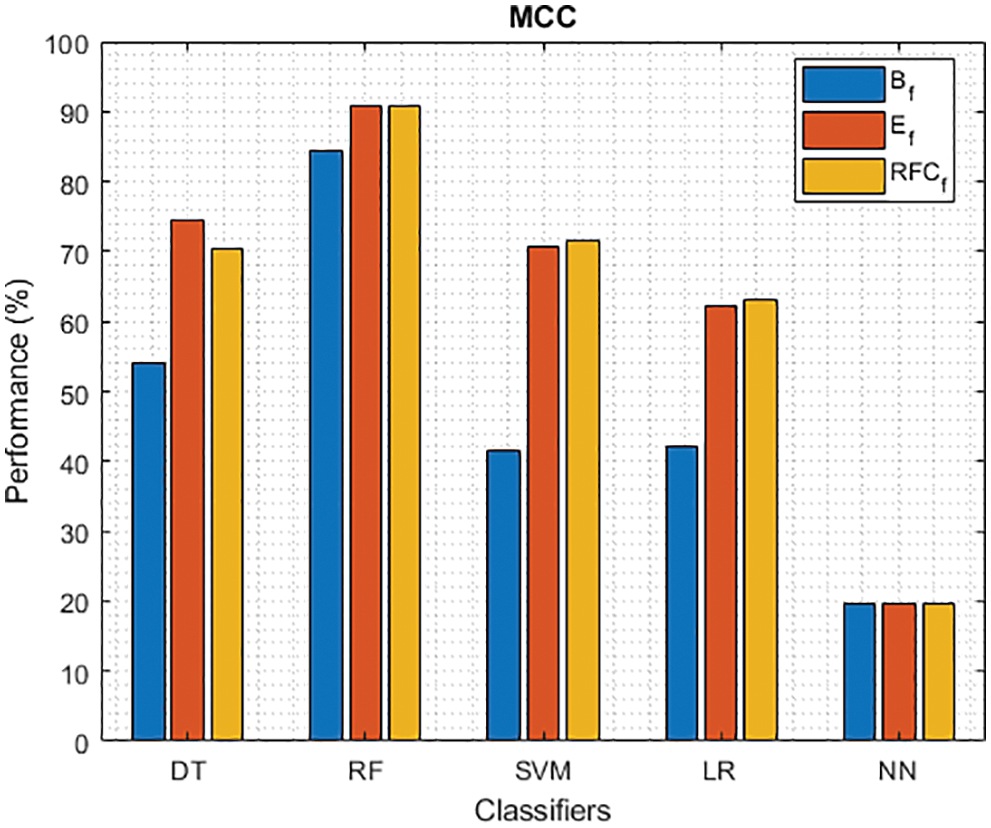
Figure 11: MCC of different classifiers using baseline, extracted and RFKFS features
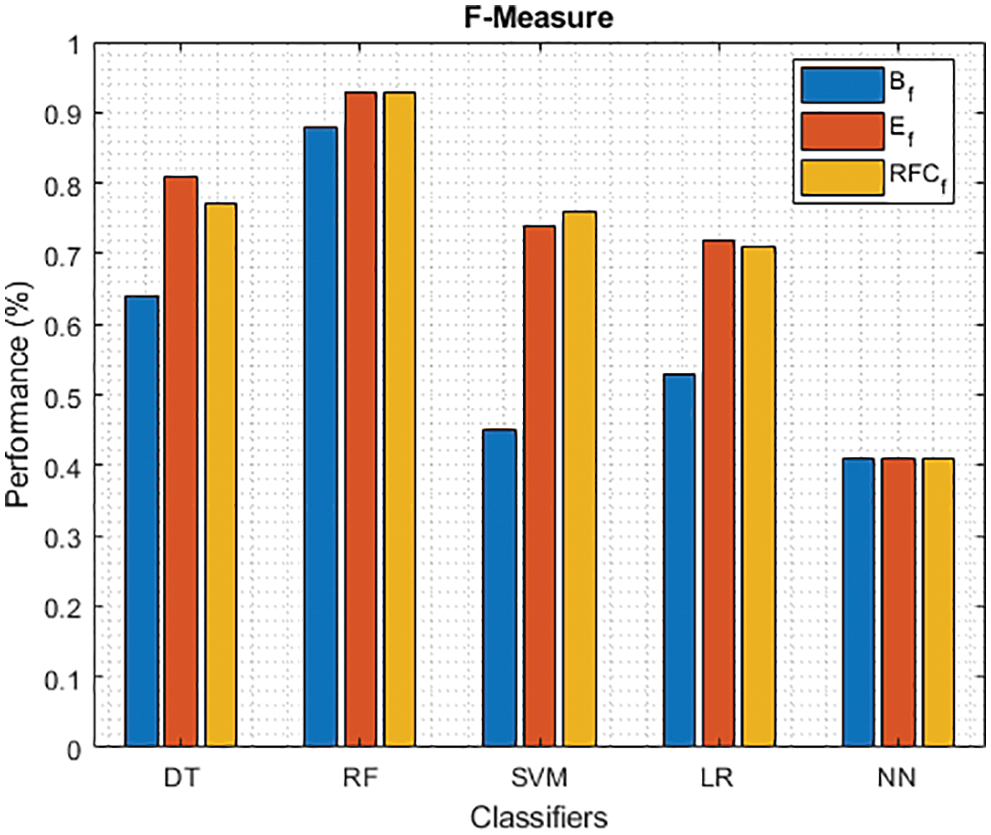
Figure 12: F-Measure of different classifiers using baseline, extracted and RFKFS features
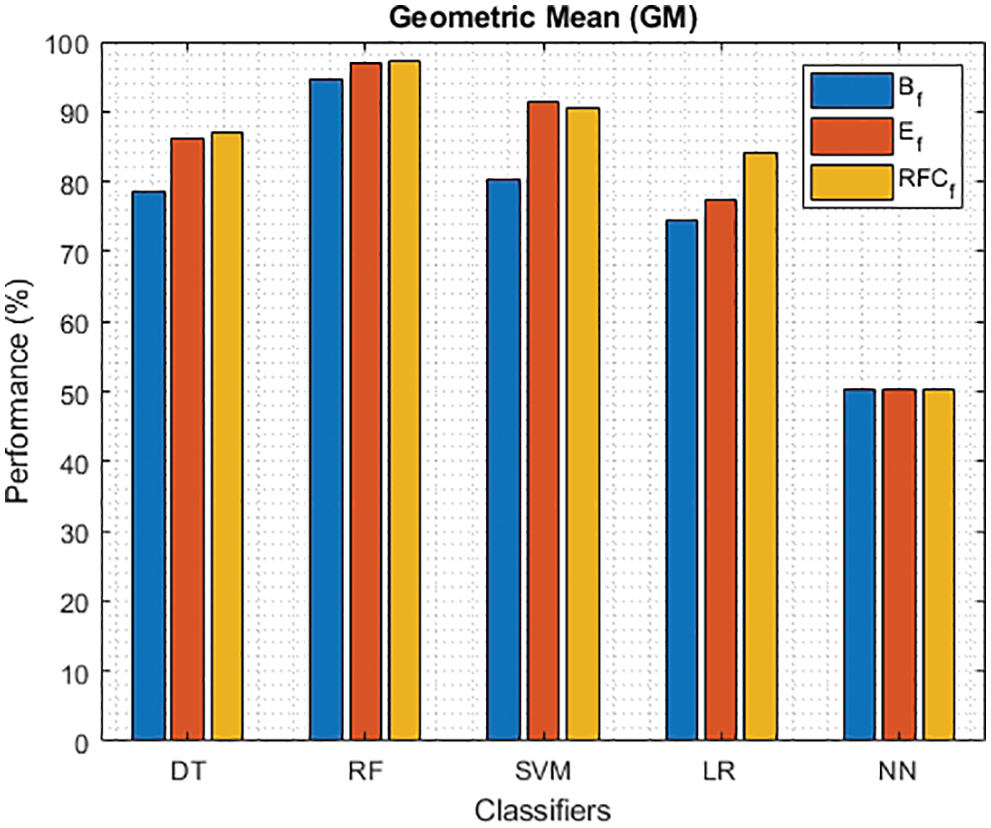
Figure 13: GM of different classifiers using baseline features, extracted features and RFKFS features
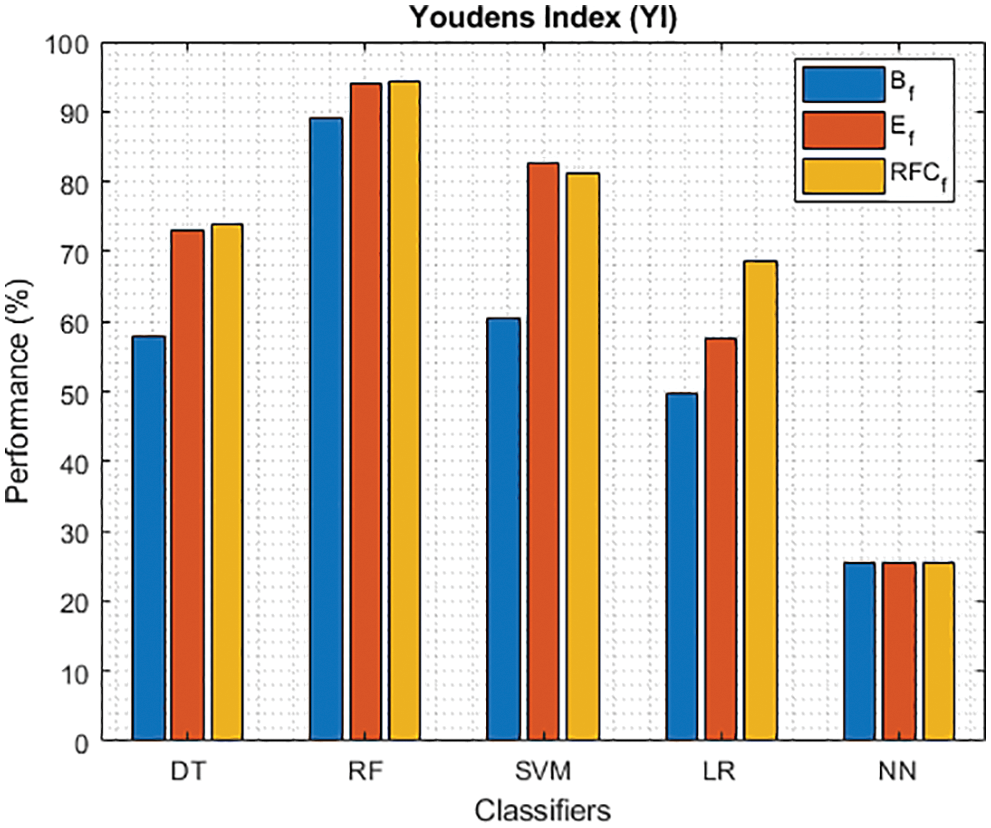
Figure 14: YI of different classifiers using baseline features, extracted features and RFKFS features
Tab. 2 shows the performance of classifier models relative to the PD baseline features. From the confusion matrix, RF outperforms other models by achieving the highest accuracy rate of 94.18%. Followed by RF gives TPR with 95.12%, FNR with 4.88%, NPV with 98.58%, LR+ with 15.64%, LR− with 0.05, MCC with 84.31%, F-measure with 0.88, GM with 94.52%. Compared to other models, NN detects the TNR and PPV with 100% and FPR with 0%.
Tab. 3 shows the performance of the classifier models relative to the extracted PD features. From the confusion matrix, RF is outperforming other models by achieving the highest accuracy rate with an improvement of 96.56%. Followed by RF, TPR has improved by 97.70%, FNR improved by 2.30%, NPV improved by 99.29%, LR+ improved by 25.85%, LR− bettered by 0.02, MCC improved by 90.83%, F- and GM are improved by 0.93% and 96.96%. As in the previous result, the NN values for TNR and PPV are consistent.
Finally, Tab. 4 shows the performance of classifier models compared to the significant features of RFKFS. From the confusion matrix, RF performance is consistent with the accuracy rate of 96.56%. Followed by RF results in the highest improvement using RFKFS in TPR with an improvement of 98.26%, FNR with an improvement of 1.74%, NPV with an improvement of 99.47%, MCC with an improvement of 90.84%, F-Measure with an improvement of 0.93, GM and YI with an improvement of 97.15% and 94.32%. The RF LR-and F-measurement values and the NN TNR and PPV values remain consistent. It is evident that the RFKFS TPR has improved to 3.14% and 1.7% compare to the baseline and extracted RF performance feature.
We investigated the efficiency of ML models in classifying PD. This contrasts with existing models studied in various works [41–48]. Based on the results presented in Tabs. 3–4, RF performs significantly better than other models. RF model achieved the highest TPR and NPV through RFKFS features. Also, F-measure and MCC improved, which is desirable when a data set is unbalanced. Thus, perhaps other disease predictions in which RFKFS even shines in ML data.
As shown in Fig. 2, five models on PD classification are performed, and RF achieves the best accuracy in the three experiments. Especially, LM achieves the highest performance over significant RFKFS features compared to its baseline and extracted. DT accuracy also increased from its PD baseline to 90.08% on extracted features and 89.15% on RFKFS features. While NN’s accuracy is consistent with all these experiments.
As shown in Figs. 3 and 4, in the three experiments, RF achieves the best true positive and true negative PD rate. On both TPR and TNR, SVM achieves the highest performance on its extracted features. DT and LR performance of TPR and TNR also increased with RFKFS features. As in the case of NN, the accuracy of all these experiments is consistent. The NN and RF achieve the highest performance at false positive and false negative PD rates, and the same can be seen in Figs. 5 and 6. In all experimental cases the FPR-NN model and in RFKFS case the FNR-RF model have reached the best classification. The FPR classification did well on feature extracted from PD.
As shown in Fig. 7, in the extracted case, RF achieves the best predictive PD value of 88.54% next to NN. Whereas for PD negative predictive, the RF achieves the highest performance of 99.47% on RFKFS and the same is shown in Fig. 8. Again RF attains the highest performance at PD’s positive and negative likelihood ratio as shown in Figs. 9 and 10. To be specific, in the extracted case, LR+ achieves maximum performance of 24.95% and 0.02% in both the extracted and RFKFS cases. In addition to RF, DT and SVM assess LR+ at the extracted case well at 13.62% and 10.33%. Subsequently SVM performs 0.06% and 0.09% in extracted and RFKFS in the case of LR−. The PD classification of Matthew’s correlation and Fischer-score has been significantly achieved by RF in case 3 outcomes of 0.91 and 0.93 as shown in Figs. 11 and 12. Again RF attains the highest performance at Geometric mean and Youden’s index of 97.15% and 94.32% as shown in Figs. 13 and 14.
An expert system has been developed that can identify between people with Parkinson’s disease and healthy controls by employing accurate RF kerb feature selection. The proposed method for binary classification has been developed and tested in conjunction with other similar machine learning models. This model outperformed all others in terms of accuracy, with a score of 96.56%, according to the results obtained using the RFKFS model with feature selection. The development and refinement of novel extraction procedures is a never-ending process, because the more discriminative the traits, the higher the accuracy rates are expected to get. Overall, the results suggest that the system produces good results, while more feature selection algorithms could be developed to improve the system. The construction of a prototype intelligent tele diagnostic system based on mobile terminal devices will be evaluated in the field as part of future expert system research for Parkinson’s disease identification.
Funding Statement: The authors received no specific funding for this study.
Conflicts of Interest: The authors declare that they have no conflicts of interest to report regarding the present study.
References
1. T. H. Reekes, C. I. Higginson and C. R. Ledbetter, “Sex specific cognitive differences in Parkinson disease,” NPJ Parkinson’s Disease, vol. 6, no. 1, pp. 7, 2020. [Google Scholar]
2. J. Jankovic, “Parkinson’s disease: Clinical features and diagnosis,” Journal of Neurology, Neurosurgery and Psychiatry, vol. 79, no. 4, pp. 368–376, 2008. [Google Scholar]
3. S. Heinzel, D. Berg, T. Gasser, H. Chen and C. Yaoe, “Update of the MDS research criteria for prodromal Parkinson’s disease,” Movement Disorders, vol. 34, no. 10, pp. 1464–1470, 2019. [Google Scholar]
4. N. M. Aly, J. R. Playfer, S. L. Smith and D. M. Halliday, “A novel computer-based technique for the assessment of tremor in Parkinson’s disease,” Age Ageing, vol. 36, no. 4, pp. 395–399, 2007. [Google Scholar]
5. C. Painous, M. J. Martí, C. Simonet, A. Garrido and F. Valldeoriola, “Prediagnostic motor and non-motor symptoms in progressive supranuclear palsy: The step-back PSP study,” Parkinsonism & Related Disorders, vol. 74, pp. 67–73, 2020. [Google Scholar]
6. W. C. Koller, S. Glatt, B. Vetereverfield and R. Hassanein, “Falls and Parkinson’s disease,” Clinical Neuropharmacology, vol. 12, no. 2, pp. 98–105, 1989. [Google Scholar]
7. L. M. Chahine, A. W. Amara and A. Videnovic, “A systematic review of the literature on disorders of sleep and wakefulness in Parkinson’s disease from 2005 to 2015,” Sleep Medicine Reviews, vol. 35, no. 15, pp. 33–50, 2017. [Google Scholar]
8. J. Zhang, C. Y. Xu and J. Liu, “Meta-analysis on the prevalence of REM sleep behavior disorder symptoms in Parkinson’s disease,” BMC Neurology, vol. 17, no. 1, pp. 23, 2017. [Google Scholar]
9. A. Al-Qassabi, S. M. Fereshtehnejad and R. B. Postuma, “Sleep disturbances in the prodromal stage of Parkinson disease,” Current Treatment Options in Neurology, vol. 19, no. 6, pp. 22, 2017. [Google Scholar]
10. S. Lysen, S. L. Darweesh, M. Kamram and M. Arfanikram, “Sleep and risk of Parkinsonism and Parkinson’s disease: A population-based study,” Brain Journal of Neurology, vol. 142, no. 7, pp. 2013–2022, 2019. [Google Scholar]
11. S. K. Van, “Incidence of Parkinson’s disease: Variation by age, gender, and race/ethnicity,” American Journal of Epidemiology, vol. 157, pp. 1015–1022, 2003. [Google Scholar]
12. M. Baldereschi, “Parkinson’s disease and Parkinsonism in a longitudinal study: Two-fold higher incidence in men. ILSA working group. Italian longitudinal study on aging,” Neurology, vol. 55, pp. 1358–1363, 2000. [Google Scholar]
13. G. Santangelo, F. Garramone, C. Baiano, A. Iorio and F. Piscopo, “Personality and Parkinson’s disease: A meta-analysis,” Parkinsonism & Related Disorders, vol. 49, pp. 67–74, 2018. [Google Scholar]
14. J. Michely, L. J. Volz, F. Hoffstaedter, M. Tittgemeyer and S. B. Eickhoff, “Network connectivity of motor control in the ageing brain,” NeuroImage: Clinical, vol. 18, no. 1, pp. 443–455, 2018. [Google Scholar]
15. H. Chen, E. J. Zhao and W. Zhang, “Meta-analyses on prevalence of selected Parkinson’s nonmotor symptoms before and after diagnosis,” Translational Neurodegeneration, vol. 4, no. 1, pp. 1–8, 2015. [Google Scholar]
16. M. Mcgregor and A. Nelson, “Circuit mechanisms of Parkinson’s disease,” Neuron Review, vol. 101, no. 6, pp. 1042–1056, 2019. [Google Scholar]
17. A. Little, F. Patrick, H. Mcsharry and O. Ramig, “Suitability of dysphonia measurements for telemonitoring of Parkinson’s disease,” IEEE Transactions on Biomedical Engineering, vol. 56, no. 4, pp. 1015– 1022, 2009. [Google Scholar]
18. J. Han, J. Pei and M. Kamber, Data Mining: Concepts and Techniques. Amsterdam: Elsevier, 2011. [Google Scholar]
19. M. Nilashi, O. Ibrahim, H. Ahmadi and L. Shahmoradi, “An analytical method for diseases prediction using machine learning techniques,” Computers & Chemical Engineering, vol. 106, no. 10, pp. 212–223, 2017. [Google Scholar]
20. R. Das, “A comparison of multiple classification methods for diagnosis of Parkinson disease,” Expert Systems with Applications, vol. 37, no. 2, pp. 1568–1572, 2010. [Google Scholar]
21. M. Dash and H. Liu, “Feature selection for classification,” Intelligent Data Analysis, vol. 1, no. 1, pp. 131–156, 1997. [Google Scholar]
22. I. Kononenko, “Machine learning for medical diagnosis: History, state of the art and perspective,” Artificial Intelligence in Medicine, vol. 23, no. 1, pp. 89–109, 2001. [Google Scholar]
23. F. Froelich, K. Wojciech, M. Wrobel, R. Krzysz and F. Piotr, “Diagnosis of Parkinson’s disease using speech samples and threshold-based classification,” Journal of Medical Imaging and Health Informatics, vol. 5, no. 6, pp. 1358–1363, 2015. [Google Scholar]
24. J. C. Ang, A. Mirzal, H. Haron and H. N. A. Hamed, “Supervised, unsupervised, and semi-supervised feature selection: A review on gene selection,” IEEE/ACM Transactions on Computational Biology and Bioinformatics, vol. 13, no. 5, pp. 971–989, 2016. [Google Scholar]
25. M. Lones, S. L. Smith, J. E. Alty, S. E. Lacy and K. L. Possin, “Evolving classifiers to recognize the movement characteristics of Parkinson’s disease patients,” IEEE Transactions on Evolutionary Computation, vol. 18, no. 4, pp. 559–576, 2014. [Google Scholar]
26. K. Buza and N. Agnesvarga, “ParkinsoNET: Estimation of UPDRS score using hubness-aware feedforward neural networks,” Applied Artificial Intelligence, vol. 30, no. 6, pp. 541–555, 2016. [Google Scholar]
27. H. Zhang, L. Yang, Y. Liu, P. Wang and J. Yin, “Classification of Parkinson’s disease utilizing multi-edit nearest neighbor and ensemble learning algorithms with speech samples,” BioMedical Engineering OnLine, vol. 15, no. 1, pp. 122, 2016. [Google Scholar]
28. C. M. Bishop, Pattern Recognition and Machine Learning. Berlin: Springer, 2006. [Google Scholar]
29. J. R. Quinlan, “Induction of decision trees,” Machine Learning, vol. 1, no. 1, pp. 81–106, 1986. [Google Scholar]
30. E. Gürbüz and E. Kılıç, “A new adaptive support vector machine for diagnosis of diseases,” Expert Systems, vol. 31, no. 5, pp. 389–397, 2014. [Google Scholar]
31. T. J. Hirschauer, H. Adeli and J. A. Buford, “Computer-aided diagnosis of Parkinson’s disease using enhanced probabilistic neural network,” Journal of Medical Systems, vol. 39, no. 11, pp. 179, 2015. [Google Scholar]
32. J. C. Ang, A. Mirzal, H. Haron and H. Hamed, “Supervised, unsupervised and semi-supervised feature selection: A review on gene selection,” IEEE/ACM Transactions on Computational Biology and Bioinformatics, vol. 13, no. 5, pp. 99, 2015. [Google Scholar]
33. R. Morisi, D. Manners, G. Gnecco, N. Lanconelli and C. Testa, “Multi-class Parkinsonian disorders classification with quantitative MR markers and graph-based features using support vector machines,” Parkinsonism & Related Disorders, vol. 47, pp. 64–70, 2018. [Google Scholar]
34. L. Ali, C. Zhu, M. Zhou and Y. Liu, “Early diagnosis of Parkinson’s disease from multiple voice recordings by simultaneous sample and feature selection,” Expert Systems with Applications, vol. 137, pp. 22–28, 2019. [Google Scholar]
35. I. Guyon and A. Elisseeff, “An introduction to variable and feature selection,” Journal of Machine Learning Research, vol. 3, pp. 1157–1182, 2003. [Google Scholar]
36. D. Jain and V. Singh, “Feature selection and classification systems for chronic disease prediction: A review,” Egyptian Informatics Journal, vol. 19, no. 3, pp. 179–189, 2018. [Google Scholar]
37. H. Liu and L. Yu, “Toward integrating feature selection algorithms for classification and clustering,” IEEE Transactions on Knowledge and Data Engineering, vol. 17, no. 4, pp. 491–502, 2005. [Google Scholar]
38. S. Cang and H. Yu, “Mutual information based input feature selection for classification problems,” Decision Support Systems, vol. 54, no. 1, pp. 691–698, 2012. [Google Scholar]
39. I. Guyon, S. Gunn, M. Nikravesh and L. A. Zadeh, Feature Extraction: Foundations and Applications. Berlin: Springer, 2018. [Google Scholar]
40. B. Xiao, N. He, Q. Wang, Z. Cheng and Y. Jiao, “Quantitative susceptibility mapping based hybrid feature extraction for diagnosis of Parkinson’s disease,” NeuroImage: Clinical, vol. 24, pp. 2213–1582, 2019. [Google Scholar]
41. Y. Xiong and Y. Lu, “Deep feature extraction from the vocal vectors using sparse autoencoders for Parkinson’s classification,” IEEE Access, vol. 8, pp. 27821–27830, 2020. [Google Scholar]
42. F. Nissar, L. Raza, M. Masood and R. Mir, “Voice-based detection of Parkinson’s disease through ensemble machine learning approach: A performance study,” Endorsed Transactions on Pervasive Health and Technology, vol. 5, no. 19, pp. 1–8, 2020. [Google Scholar]
43. C. O. Sakar, G. Serbes, A. Gunduz, H. C. Tunc, H. Nizam et al., “A comparative analysis of speech signal processing algorithms for Parkinson’s disease classification and the use of the tunable Q-factor wavelet transform,” Applied Soft Computing Journal, vol. 74, no. 4, pp. 255–263, 2019. [Google Scholar]
44. J. Tran, H. Anastacio and C. Bardy, “Genetic predispositions of Parkinson’s disease revealed in patient-derived brain cells,” NPJ Parkinson’s Disease, vol. 6, no. 1, pp. 8, 2020. [Google Scholar]
45. J. Jankovic, A. H. Rajput, M. P. McDermott and D. P. Perl, “The evolution of diagnosis in early Parkinson disease,” Archives of Neurology, vol. 57, no. 3, pp. 369–372, 2000. [Google Scholar]
46. E. Hancer, B. Xue and M. Zhang, “A survey on feature selection approaches for clustering,” Artificial Intelligence Review, vol. 53, no. 6, pp. 4519–4545, 2020. [Google Scholar]
47. L. Naranjo, C. J. Pérez, Y. Campos-Roca and J. Martín, “Addressing voice recording replications for Parkinson’s disease detection,” Expert Systems with Applications, vol. 46, pp. 286–292, 2016. [Google Scholar]
48. B. E. Sakar, M. E. Isenkul, C. O. Sakar, A. Sertbas and F. Gurgen, “Collection and analysis of a Parkinson speech dataset with multiple types of sound recordings,” IEEE Journal of Biomedical and Health Informatics, vol. 17, no. 4, pp. 828–834, 2013. [Google Scholar]
Cite This Article
 Copyright © 2023 The Author(s). Published by Tech Science Press.
This work is licensed under a Creative Commons Attribution 4.0 International License , which permits unrestricted use, distribution, and reproduction in any medium, provided the original work is properly cited.
 Downloads
 Citation Tools