
 Submit a Paper
 Propose a Special lssue
 Open Access
ARTICLE

Breast Cancer Detection Using Breastnet-18 Augmentation with Fine Tuned Vgg-16
1 Department of Computer Science and Engineering, Kathir College of Engineering, Coimbatore, 641062, India
2 Department of Computer Science and Engineering, Bannari Amman Institute of Technology, Sathyamangalam, 638401, Tamilnadu, India
3 Electrical Engineering Department, Faculty of Engineering, Benha University, Benha, 13518, Egypt
4 Department of Computer Science, College of Computers and Information Technology, Taif University, P.O. Box 11099, Taif, 21944, Saudi Arabia
5 Department of Information Technology, College of Computers and Information Technology, Taif University, P.O. Box 11099, Taif, 21944, Saudi Arabia
6 Department of Mathematics, Faculty of Science, Mansoura University, Mansoura, 35516, Egypt
7 Department of Computational Mathematics, Science, and Engineering (CMSE), Michigan State University, East Lansing, MI, 48824, USA
* Corresponding Author: Mohamed Abouhawwash. Email:
Intelligent Automation & Soft Computing 2023, 36(2), 2363-2378. https://doi.org/10.32604/iasc.2023.033800
Received 28 June 2022; Accepted 22 September 2022; Issue published 05 January 2023
 View Full Text
 Download PDF
Abstract
Women from middle age to old age are mostly screened positive for Breast cancer which leads to death. Times over the past decades, the overall survival rate in breast cancer has improved due to advancements in early-stage diagnosis and tailored therapy. Today all hospital brings high awareness and early detection technologies for breast cancer. This increases the survival rate of women. Though traditional breast cancer treatment takes so long, early cancer techniques require an automation system. This research provides a new methodology for classifying breast cancer using ultrasound pictures that use deep learning and the combination of the best characteristics. Initially, after successful learning of Convolutional Neural Network (CNN) algorithms, data augmentation is used to enhance the representation of the feature dataset. Then it uses BreastNet18 with fine-tuned VGG-16 model for pre-training the augmented dataset. For feature classification, Entropy controlled Whale Optimization Algorithm (EWOA) is used. The features that have been optimized using the EWOA were utilized to fuse and optimize the data. To identify the breast cancer pictures, training classifiers are used. By using the novel probability-based serial technique, the best-chosen characteristics are fused and categorized by machine learning techniques. The main objective behind the research is to increase tumor prediction accuracy for saving human life. The testing was performed using a dataset of enhanced Breast Ultrasound Images (BUSI). The proposed method improves the accuracy compared with the existing methods.Keywords
Breast cancer became one of the major causes of death in women around the world. It is becoming increasingly common across both industrialized and developing economies. This disease attacks the breast cells widely. It is the world’s 2nd most common tumor, after lung cancers [1]. Breast cancer tumors are detected using x-rays. Around 1.8 million cases of cancer were detected in 2020, with breast cancer representing 30% of those instances. Breast cancer is classified as either malignant or benign. The many properties of cells are used to classify them. Breast cancer must be detected at such an earlier point in time to lower fatality rates [1].
Mammography, functional magnetic resonance (MRI), ultrasonography, and digitized chest tomosynthesis are some techniques suggested for the identification of breast cancers. Mammography is a low-cost, limited technique that is recommended for the early detection of breast cancer. The MRI is a non-invasive method of confirming the existence of a tumor. Throughout this MRI test, an allergic response to the contrast material is possible. The MRI test had an unforeseen result. Mammography is the preferred test in the early stages. Therapy for breast cancer is achievable in the early stages [2]. Surgeries to correct the defective area, medicine, radiotherapy, chemotherapeutic, hormone therapy, and immunology are only a few of the possible treatments. When it is used soon on, such medicines have the potential to help. If discovered early, the rate of survival in wealthy countries is 90 percent, 40 percent in Southern Africa, and 66 percent in India. Because the Baltic States possess limited resources, earlier diagnostic and therapeutic procedures can help preserve women’s lives.
The main motivation of this research is the Deep Learning method can identify breast cancer early. There is a variety of Deep Learning techniques open right now, and not all of them have indeed been tested for potential effectiveness in breast cancer detection. Such methods are being used to perform highly autonomous mass segmentation methods by identifying essential unique information from images with no need for direct human involvement. When the number of pictures required for training a Deep CNN (DCNN) network is inadequate. Transfer learning (TL) can help improve diagnostic accuracy inside the health sector, particularly when combined with the complicated forms of breast radiographs. Studies have increasingly become interested in fine-tuned TL systems using pre-trained parameters for performing multiple supervised classifications with substantial interpreting efficiency [3].
Selective choice of the best characteristics from the initial features extracted is a research area that is currently being investigated. Several options are best, including such Genetic Algorithm (GA), Particle Swarm Optimization (PSO), and others, which are reported in the literature and used in diagnostic imaging. Rather than use the whole feature space, these strategies use the optimal subset of features. The primary benefit of attribute selection approaches is that they increase accuracy whilst reducing processing time [4]. Furthermore, a few key traits are sometimes overlooked throughout the best feature set, which has an impact on network reliability. As a result, feature matching algorithms were developed by machine vision scientists [5]. Nuclear fusion expands the number of predictions and improves the program’s reliability [6].
To enhance the characteristics, the Improved Entropy Whale Optimization Algorithm (EWOA) is used. By lowering the computing price, the service’s efficiency rate would improve. The attribute selection process is carried out. The attribute selection strategies will improve the model’s performance by lowering the computation complexity and classifying burden. A features extraction method is used to identify the most significant features for the modeling which will enhance its validity. The purpose of feature fusion is to combine the inherent information of multi-input combined into digital input vectors. Feature matching aids in the consolidation of many data systems into a single location.
The major contribution of the proposed work is given below:
❖ The BreastNet18 model is offered, which is implemented on a fine-tuned VGG16 design and produced the best performance among pre-trained systems.
❖ Transfer learning was used to train the enhanced ultrasound pictures.
❖ Machine learning techniques are employed to classify the best-selected features, which are merged using a probability-based method.
The rest of our research article is written as follows: Section 2 discusses the related work on various classification methods of breast cancer and feature selection methods. Section 3 shows the algorithm process and general working methodology of the proposed work. Section 4 evaluates the implementation and results of the proposed method. Section 5 concludes the work and discusses the result evaluation.
A lot of new vision-based computerized approaches for breast cancer categorization employing ultrasound pictures are presented by scientists [7,8]. A number of them focused on fragmentation, then feature retrieval [9], and a couple obtained features using digital photos. Within a few instances, the authors used the preprocessing phase to boost the quality of the input photos and emphasize the diseased area for improved extracting features [10]. For instance, described a computer-aided diagnostic (CAD) technique for breast cancer identification. To recreate brightness-mode pictures from the original information, they used the Hilbert Transform (HT) [11].
The K-Nearest Neighbor (KNN) classifiers and the ensemble tree-based models are then used to collect and classify structure and texture data. For breast tumor segmentation from ultrasound pictures, it used semantic segmentation, fuzzy logic, and deep learning. Researchers utilized fuzzy logic inside the pre-processing stage and applied extraction of features to divide the tumor. For the final tumor categorization, eight pre-trained algorithms were used [12].
The author [13] proposed a radionics-based categorization pipeline machine learning-based (ML). The ROI was delineated, and valuable features were derived. Again, for the final prediction, classifiers were used to classify the retrieved characteristics. The BUSI dataset has been used in the study, and the results revealed an improvement in inaccuracy. In [14] the author proposed a deep learning-based architecture for breast mass detection using computed tomography. To increase the flow of information, they applied transfer learning (TL) and inserted deep representation scaling (DRS) layers between pre-trained CNN segments. After the training phase, only the DRS layer settings were changed to alter the pre-trained CNN for analyzing breast mass categorization from the input photos. When compared to more current methodologies, the DRS technique performed much better.
The author [15] suggested a method for segmenting breast cancers using contextual level sets. To grasp easily explain characteristics from knowledge representation, they used a UNet-style encoder-decoder architectural net. A large double-supervised transfer learning network for breast cancer categorization is described in [16]. The Maximum Mean Discrepancy (MMD) standard was used to implement the Learning using Privileged Information (LUPI) model. Eventually, they integrated both strategies and improved performance using a unique double-supervised TL network (DDSTN).
The researchers [17] developed a computerized breast cancer categorization method based on ultrasound images. They used a picture fusion method with image feature representations and numerous CNN models to create a new image fusion technique. The testing was performed on BUSI and commercial datasets, and the results were impressive. In [18] developed a computational approach for detecting breast tumor sections (BTS) from MRI sections of the breast. To enhance and retrieve the BTS from 2D MRI slices, the research uses a hybrid thresholding and classifier model. Watershed Integration is used to mine the BTS, tri-level thresholding is built just on Slime Mould Algorithm and Shannon’s Entropy is built to enhance the BTS. During the recovery of the BTS, the BTS and ground reality are compared, and the requisite Image Performance Values are calculated. An Extreme Learning Machine (ELM) was utilized by scientists [19] to detect breast cancer. Secondly, irrelevant features are excluded using the information gain feature selection method.
This technique of transfer learning [20] is being used to improve the effectiveness of the learning algorithms which are needed to execute categorization. This method facilitates and accelerates learning. When there isn’t a lot of data, transfer learning comes in handy. Whenever the weights are initialized, transfer training with fine-tuning is way quicker and retraining is simpler. To use a modest number of [21–24], it quickly acquired transfer features. Various types of features, such as histology cancer images, digital mammograms, and chest X-ray images, have been classified using the deep learning approach with CNNs [25].
Machine learning models CNN, ResNet-50, and Inception-ResNetV2 were utilized to categorize the breast and DDSM databases. The pictures of a mammogram might be classed as benign and malignant. The accuracy of the breast dataset was 88.74 percent, 92.55 percent, and 95.32 percent [26]. Faster-RCNN was employed in this other research to recognize and identify the breast and CBIS-DDSM databases. On the breast dataset, an area under a ROC curve (AUC) of 0.95 was obtained [27]. Because a significant number of information sets are required to build deep neural networks, the rotating and flipped technique is used to expand the mini-MIAS dataset. After augmentation, 450,000 photos of MIAS are taken and scaled to 192 192 pixels. By using the multi-resolution convolutional neural network approach (MCNN), the pictures are categorized into three parts: normal, benign, and malignant.
To answer the regular and non-linear system of equations, the researchers were using a physics-inspired neural network (PINN) with a regressed adaptable perceptron to forecast smoother and discontinuity outcomes. The nonlinear Klein Gordon equation has indeed been resolved to produce a smoother answer, and the nonlinear Burgers equations and the Helmholtz equation, in particular, have been employed to exploit different elevation answers. The operational amplifier hypervariable is modified by modifying the topology gradient descent that engages in the optimization method to get the optimal connection speeds. The adaptable non-linear activation excels in the case of knowledge skills to enhance the convergence speed during basic training and solution accuracy. To use this strategy, productivity can be boosted [28].
This segment describes the design structure for the classification of breast cancer utilizing ultrasound pictures. Fig. 1 demonstrates the efficiency of the suggested system. The primary ultrasound pictures receive actual data augmentation before being transferred to a fine-tuned convolutional model BreastNet18 for training and testing purposes. The training is done with TL, and features are extracted from the average global pool level. The Modified Entropy Whale Optimization Algorithm is used to enhance the selected features. A probability-based technique is utilized to merge the best classification characteristics. Lastly, machine learning classifiers are utilized to classify the fused characteristics [29–33].
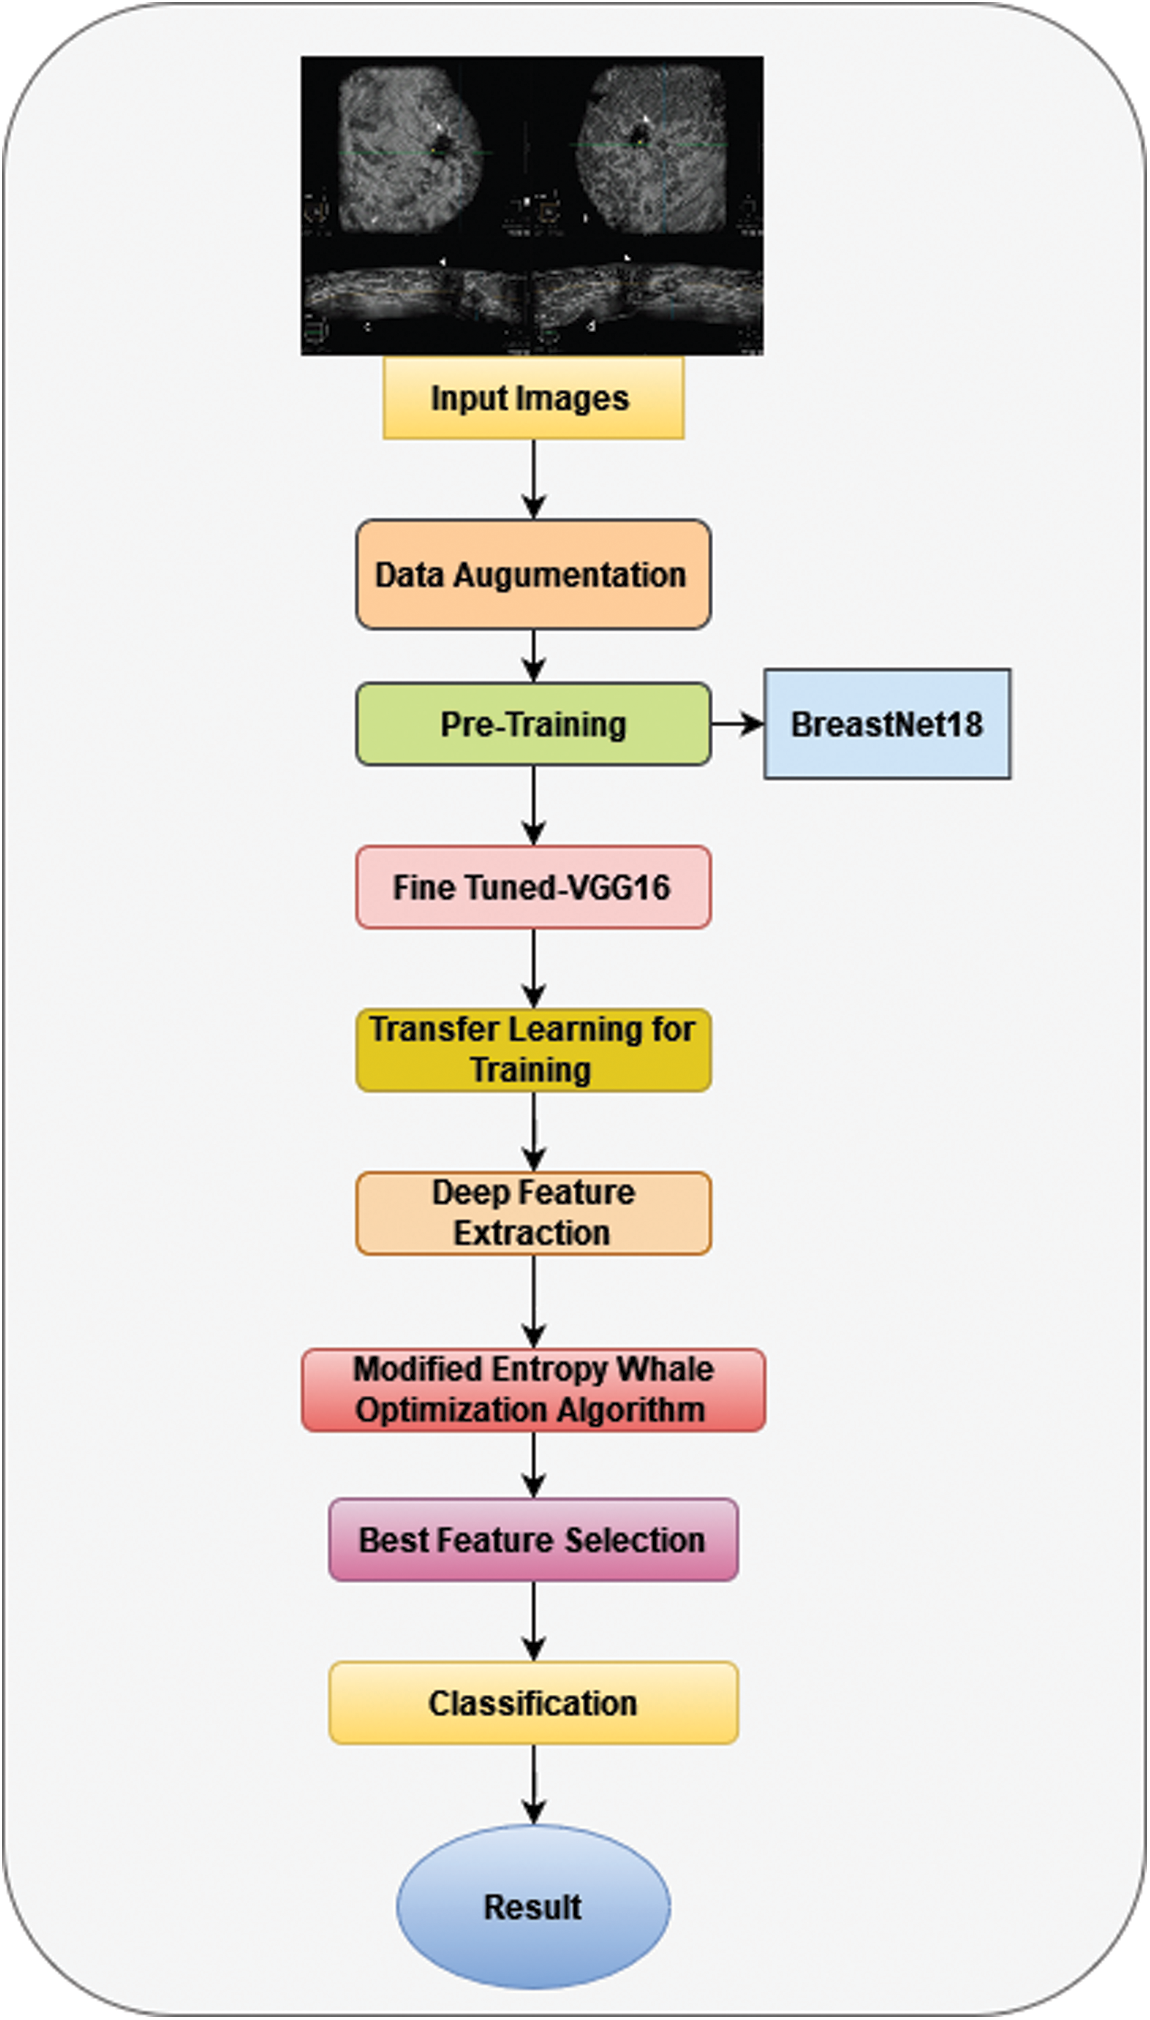
Figure 1: Architecture of the proposed system
In recent times, data augmentation has become a popular topic in the field of deep learning. Neural networks involve a large number of training instances [34–36] in deep learning; yet, previous sets of data in the healthcare area are in the limited resource area. As a result, to improve the variety of the entire dataset, a data augmentation phase is required.
The BUSI database has been used in the study to validate the results. The package includes 780 photos with an aggregate file size of 500 by 500 pixels. As shown in Fig. 2 this information is categorized into three parts: normal (133 pictures), malignant (210 pictures), and benign (487 pictures). This original dataset was split into 50:50 training and testing groups. Following that, each class’s training photos were divided into three categories: normal (56 images), malignant (105 images), and benign (106 images) (243 images). Because this database [37] is insufficient to construct the deep learning method, a data augmentation phase is used.
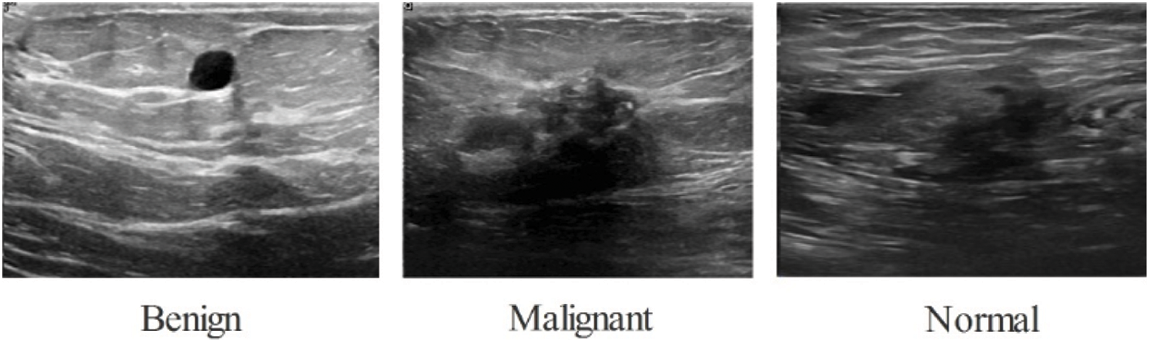
Figure 2: BUSI dataset
BreastNet18 which is based on a fine-tuned VGG16 structure has undergone multiple tests using our datasets to assess its efficiency [38–40]. Furthermore, elimination research is conducted to improve the technology’s robustness again for mammography classification problems. Fig. 3 depicts the structure of BreastNet18 and fine-tuned VGG16 Network.
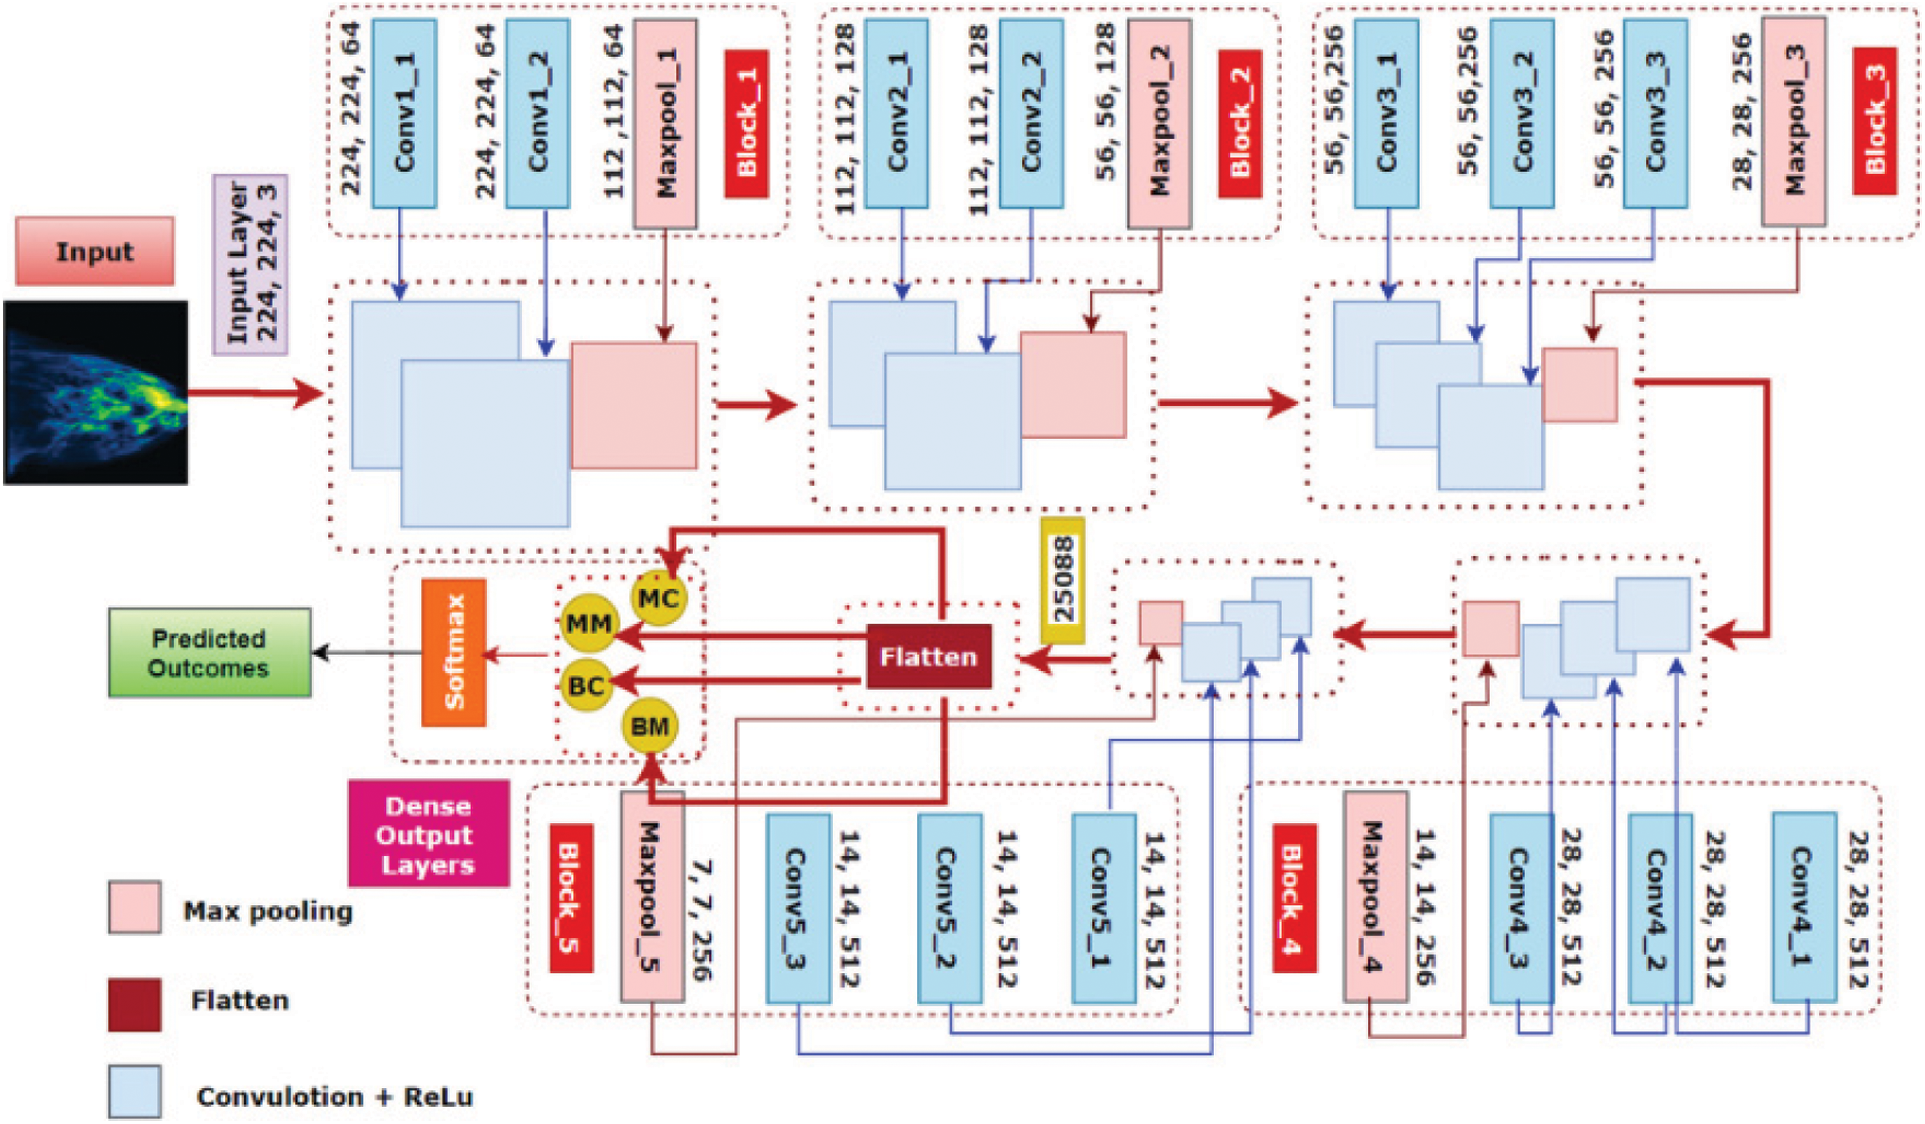
Figure 3: Structure of BreastNet18 and fine-tuned VGG16 network
An initial VGG16 does have a thickness dimension of 23 and 16 layers, as the title suggests. This is divided into five frames, each with 2 or 3 convolution layers and a Maxpooling layer. Through the multiplication of arrays of input information with such two-dimensional arrays of values, called just filters or kernels, convolution, r accomplishes a linear approach.
The inputs and kernels values are g() and f(), respectively, and (f*g) signifies a dot product of such values above several parameters N. The Maxpooling layer reduces the size of the map data by adding filters or kernels upon receiving the similarity matrix out from the convolution operation. The output vector upon adding the filtering to an input sequence with an input picture size of (m × m) and a filter size of ((f × f)) is:
Just after the sixth block of VGG16, we add a flattening and a hidden state to create our modified model BreastNet18. Because the input layer of the design demands that picture length, it is an RGB picture, be 224 × 224 × 3, a first convolutional layer’s input dimensions is 224 × 224 × 3. A first block, in this case, has 2 convolutional layers with 64 layers and the same padding, followed by a 2 × 2 Maxpooling layer with stride 2 × 2. A second segment, like the first, has two convolution layers with 128 layers and a kernel size of 3 × 3, followed by a Maxpooling level of two inputs and one output [41].
Three convolutional layers are separated by a Maxpooling structure within the last three phases. The 3 fully connected layers in phases 3, 4, and 5 have channel sizes of 256, 512, and 512, correspondingly, with the same convolution kernel of 3 × 3. In each Maxpooling layer, the original image data is reduced to half of its original length. A corresponding output region of interest from the last Maxpooling level is of size 7 × 7 × 512 just after stacking of convolutional and Maxpooling levels. To create a 1 × 25,088 feature representation, a flattened layer was applied. There was also a thick layer that produces 4 layers for each of the 4 categories. These light blue squares in five lines in Fig. 3 are convolutional blocks loaded from the VGG16 network, which has been pre-trained just on the ImageNet dataset.
As previously stated, our suggested BreastNet18 design is produced by adding one flattening and hidden layer to the VGG16 network after the sixth phase. The thicknesses of the strata are frozen during the pre-training stage and the training step of our study. Inside the fine-tuning stage, the pink lines represent BreastNet18’s flattening level and hidden layers that are upgraded by the innovative capabilities of mammography. Rather than 1000 classes, the last FC layer is updated to categorize 4 courses. This system was again trained up with the mammography dataset after the pre-trained weights of VGG16 were imported using a deep learning approach.
Transfer learning (TL) is a machine learning technique that involves reusing previously learned models for a new assignment [42,43]. Practically, reusing or transferring information from previous knowledge jobs for freshly learned activities does have the potential of increasing a supervised training agent’s sample selection effectiveness. TL is used to identify feature representations in this case. To accomplish this, a pre-trained model is fine-tuned before being trained with TL. TL is mathematically specifically defined:
Two factors characterize a domain
A characteristic area FY and distribution of frontier probability
If two domains are distinct, then possess the divergent marginal probability
The modified deep model inherits the information from the previous design (resource domains). Following that, the redesigned model is trained with the relevant hyper-parameters: The learning rate is 0.001, the mini-batch size is 16, the epochs are 200, and the stochastic gradient descent learning method is used. The parameters are taken from the updated deeper model’s Global Average Pooling (GAP) layers. Two redesigned scheduling algorithms are then used to optimize the features extracted.
3.4 Feature Selection Using Entropy Controlled Whale Optimization Algorithm (EWOA)
From the evaluation stage, the WOA finds the best available response, which quickly finally succumbed to the optimal solution and diminished feature subset. Within the discovery phase, the random individualized learning process has certain blind spots and it does not execute any efficient exchange of information across units, disrupting the algorithm’s convergence speed. To address these shortcomings, the WOA needs to be enhanced. EWOA, a novel method, is presented. The controlling input B is utilized to optimize the WOA’s explorative and exploitative capabilities. During repeated operation of the method, the discovery frequency in WOA is just 0.1535. WOA’s capabilities are restricted.
The EWOA’s growth and discovery process is governed by raising the likelihood linearly. Whenever individuals understand from the top as well as other individuals of an animal’s big group, then their technical quality will increase. Unique neighborhoods are established by appropriate social learning techniques that take into account the individual’s social status, social pressure, and the establishment of social networks. This adaptable social media strategy is being utilized to help create whales’ adaptable communities, increase group dynamics, and enhance EWOA computation precision. The new technique is presented as a neighborhood-based method that will promote demographic diversity as well. By integrating the wavelet mutation met the EWOA’s convert vertical rises whenever the population rises from a locally optimal, as well as the method demonstrates an overfitting problem whenever the population returns to the local optimal solution.
3.4.1 Linear Increasing Probability
To variables absolute vertical controlled variables absolute variables
Whenever the
Exploration and exploitation are governed by a linearly increasing probabilities Pi, which improves the method’s exploration capability
3.4.2 Adaptive Social Learning Strategy
Every whale may form a neighborhood participation association and modify its existing right solution behavior of copying in social behavior. By strengthening and enhancing information exchange between groupings, the algorithms (EWOA) go away from the common optimal solution population numbers are given by PN for the existing population,
The greatest individual conduct can be adopted by a larger number of others. The stronger an individual’s social impact, hence more people connect with one other. Individual relationships were set up by the ESHi (c) adaptable neighborhood of individuals:
The exploiting step has been at the heart of a great search answer in the algorithms, and the exploring capability is completed thanks to group discussion. To use a community improved method and exponentially rising likelihood, a whale’s novel research method is identified. Here’s how the new strategy has worked.
Then
When individuals are updated using Eqs. (14) and (15), the latest best answer and individual task neighborhood data are completely utilized, significantly enhancing population variety.
For optimization issues containing high locations of intensive distribution, EWOA provides the potential to bursting out from the locally optimal. Alteration is the most important factor in biological growth. Increasing the solution rate by dynamically adjusting the mutation region helps to identify more accurately. The magnitude functional could be lowered by expanding variables, setting the mutations area of a number of rounds to a certain limitation, and grasping the changing operations by applying the fine-tuning impact. The WOA is implemented by employing wavelet mutation to increase the algorithm’s convergence and accuracy speed, as well as to free this from local optimum by increasing its capability.
Whenever the number of iterations grows, the scaling parameter V tends to increase as well, allowing the method to discover the optimal solution even when the number of iterations is large towards the final.
3.5 Classification and Fusion of Features
For such classification purpose, the EWOA algorithm’s best features are merged into a single feature vector. A probability-based sequential method is used for the fusing of chosen deep features. In this method, the likelihood of both chosen vectors is determined first, but only single features are used considering the high probability level. A comparison has been made given the high chance values component, and the characteristics are merged into one matrices. The major goal of this analysis is to address the issue of both vectors having redundant characteristics. For the final classification, machine learning methods are utilized to classify the fused characteristics. After fusion, the vector has a size of 4788 × 704 bytes.
An essential hyper variables are used during construction of a fine-tuned deep learning model: a learning rate of 0.001, a small mini-batch of 16, epochs of 200, Adam as the optimization technique, and sigmoid as the feature activation function. Furthermore, the loss is calculated using the multiclass crossing entropy gradient descent.
The tests were carried on MATLAB2020b on a personal computer with such a Core i7 processor, 8 GB of graphics memory, and 16 GB of RAM. In this part, the suggested program’s findings are presented in the form of tables and graphical charts. Various training/testing proportions, such as 70:30, 60:40, and 50:50, are evaluated for assessment. With all tests, the cross-validation point is fixed to 10.
In Table 1 shows the findings of first test. Cubic support vector machine (SVM) had the maximum accuracy of 99.6 percent, as shown in these tables. Sensitivity rate, precision rate, F1 score, FNR, and time complexity are among the other parameters estimated for this classifier, and their values are 99.4, 99.3, 99.0, 0.8 percent, and 20.50 (s), accordingly. The accuracy of the quantum based SVM (Q-SVM) and median gaussian (MGSVM) was 99.4 percent, which was the second best. The remaining categories, such as ensemble model (ESD) Lagrangian SVM (LSVM), ensemble subset k-nearest neighbour(ESKNN), Fuzzy K-NN (FKNN), Linear discriminant (LD), coarse gaussian SVM (CGSVM), and weighted KNN (WKNN), have accuracies of 99%, 98.9%, 98.8%, 98.7 percent, 98.5 percent, and 98%, correspondingly.
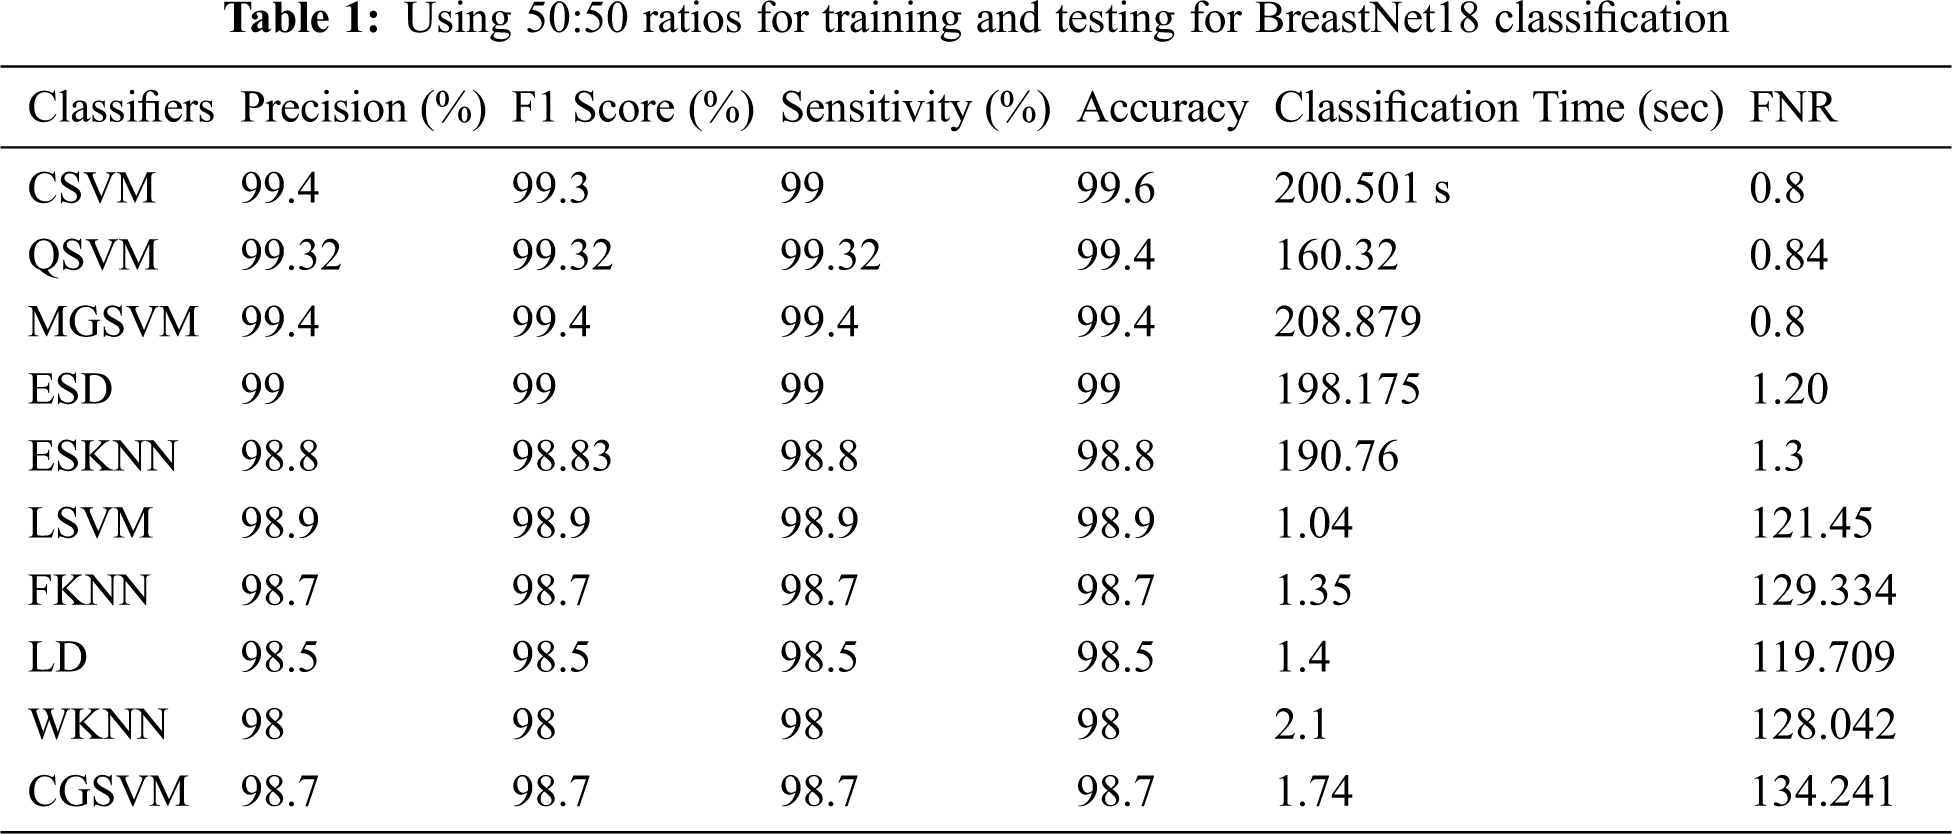
The confusion matrix in Fig. 4 is used to evaluate the sensitivity rates of Cubic SVM. In particular, every classifier’s processing complexity is mentioned, with the perfect time being 119.709 (s) for linear discriminant analysis (LDA) but worst time being 208.879 (s) for MGSVM.
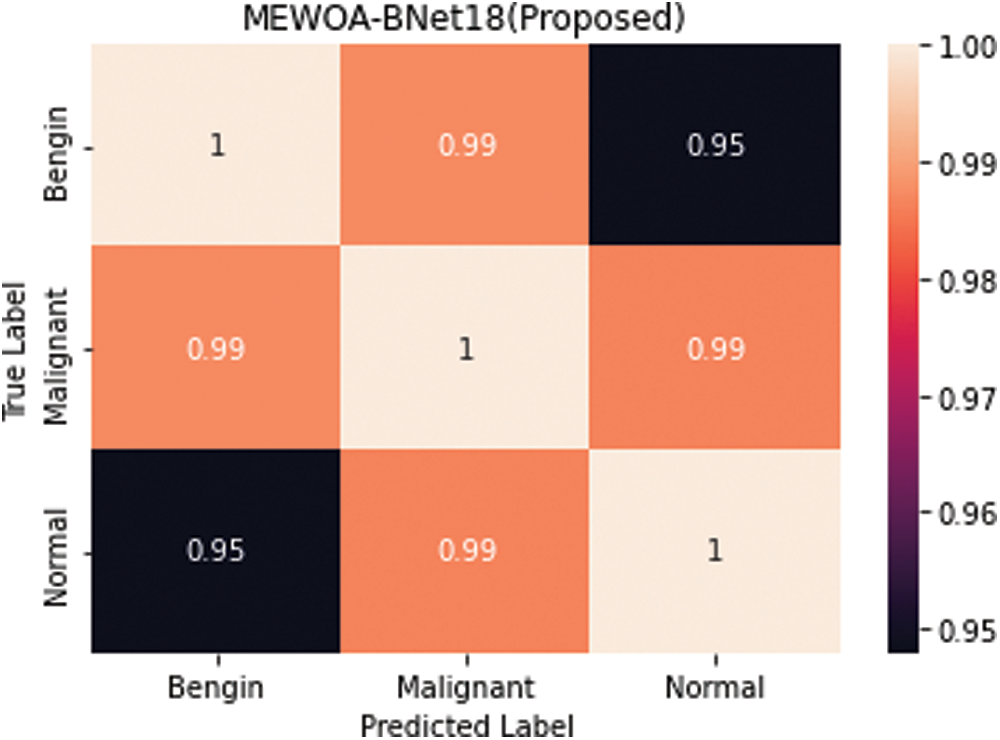
Figure 4: Confusion matrix of cubic SVM 50:50
Table 2 summarizes the findings of the experiment 2. Cubic SVM was found to have the highest accuracy of 99.5%. Sensitivity rate, precision rate, F1 score, accuracy, FNR, and calculation time are among the other metrics calculated, and their scores are 99.5 percent, 99.5 percent, 99.5 percent, 0.6 percent, and 11.100 (s), correspondingly. With accuracy of 99.5 percent and 99.3 percent, respectively, the MGSVM and Q-SVM classifiers came in second. The performance of the remaining classifiers improved as well. Fig. 5 depicts the confusion matrix of a Cubic SVM. The computing duration of each classifier is also recorded, with the Cubic SVM taking the shortest time at 111.100 s and ESD taking the longest at 167.130 s.
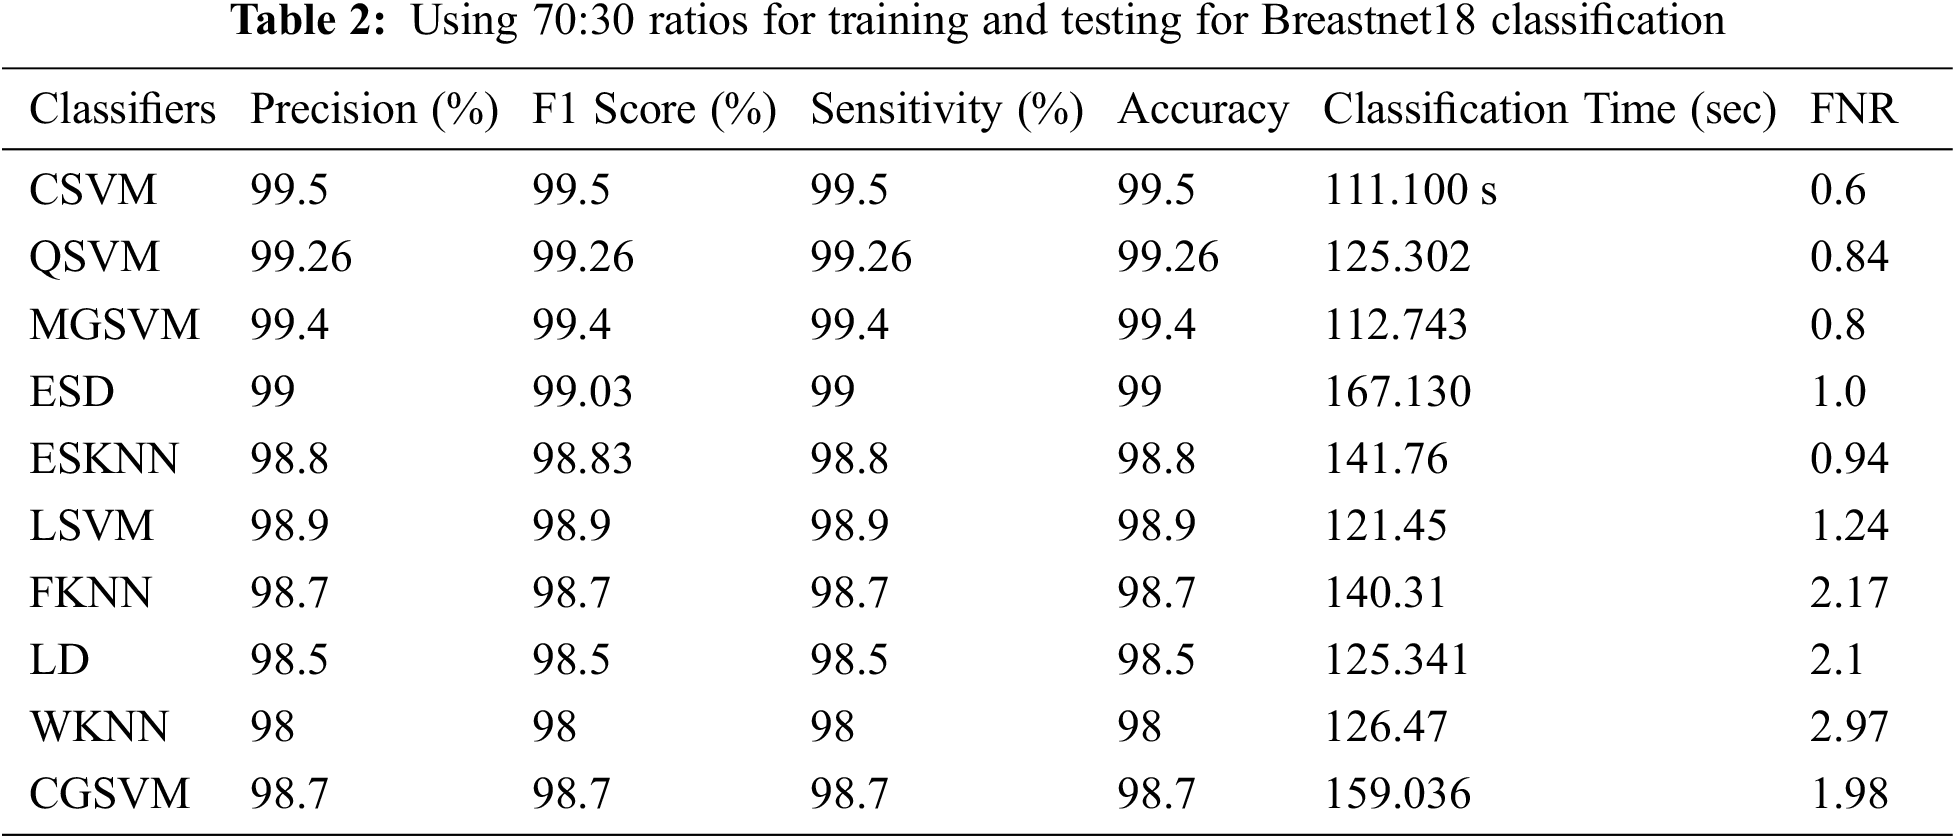
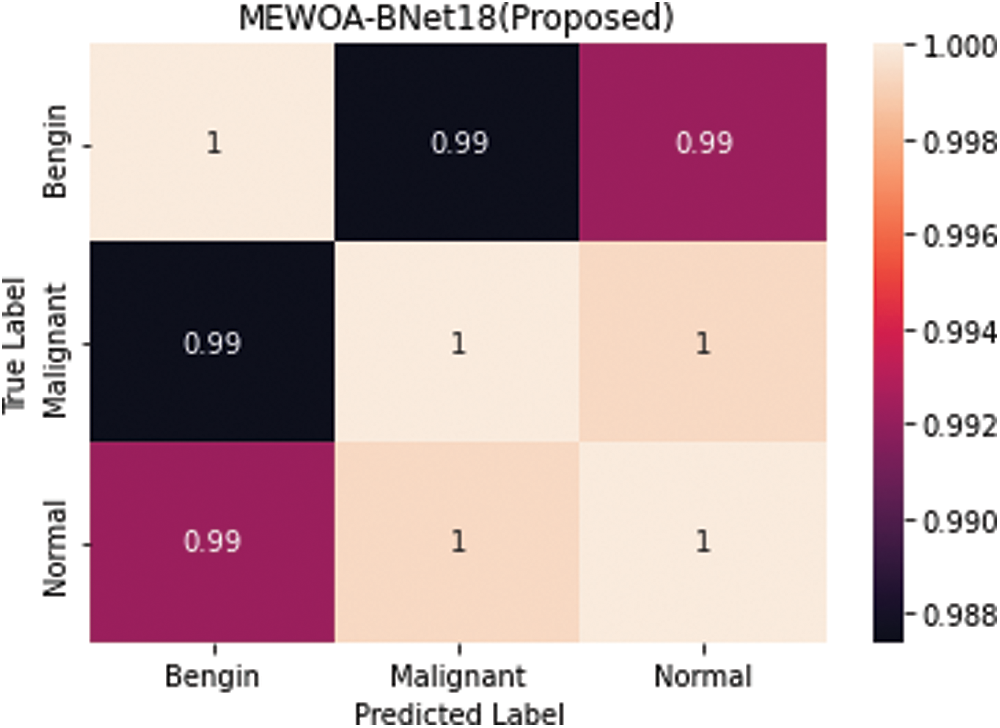
Figure 5: Confusion matrix of cubic SVM 70:30
The Table 3 shows the findings of the experiment 3. Cubic SVM had the highest accuracy of 99.2%, as shown in these tables. The MGSVM and Q-SVM tied for second with a 98.9% accuracy. The overall accuracy of the remaining classifiers, such as ESD, LSVM, ESKNN, FKNN, LD, CGSVM, and WKNN, are 98.8 percent, 98.7 percent, 98.8 percent, 98.1 percent, 97.9 percent, and 97.2 percent, correspondingly. Fig. 6 depicts the confusion matrix for Cubic SVM. The computing duration of every classifier is also recorded, with Cubic SVM having the greatest duration of 78.2 (s) and the ESKNN classifier having a worst duration of 109.879 (s).
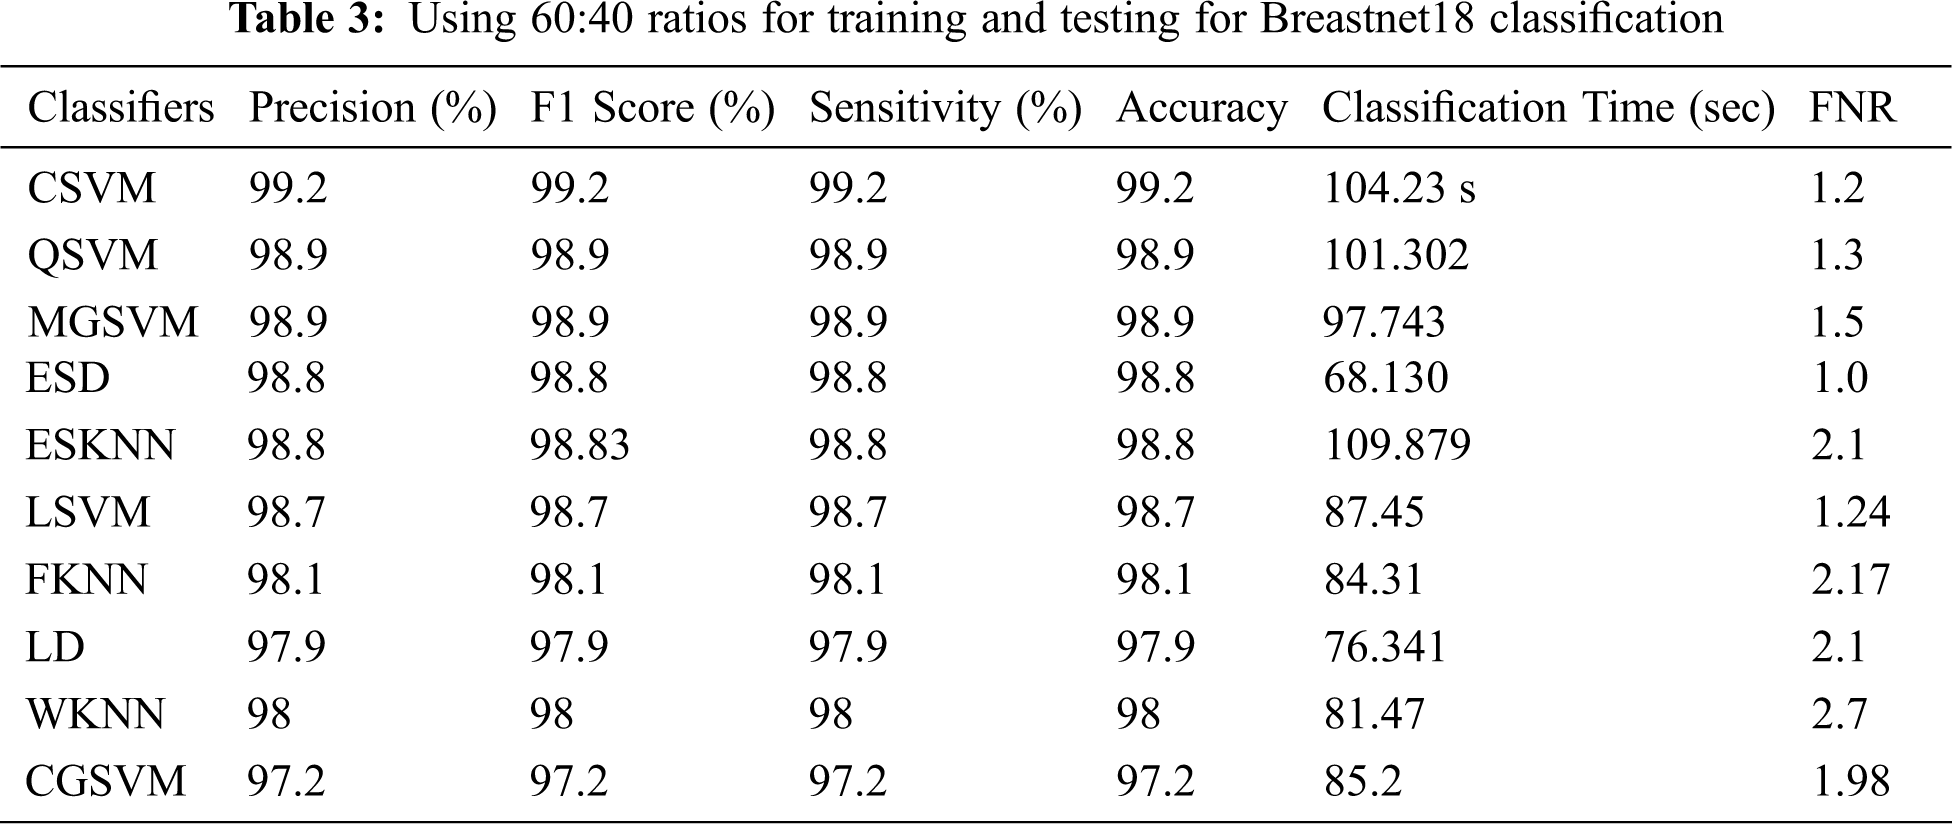
Figure 6: Confusion matrix of cubic SVM 60:40
Computational Time
In Fig. 7 shows the computing time for the original parts, EWOA features, and features fusing. The computing duration of the original parts was shown to be excessive in this image; however it was reduced following the feature stage of the selection process. In addition, the suggested fusion approach enhances results in terms of computing speed and accurate reliability. The proposed method takes 11.782 s for computing more than 50 features in dataset.
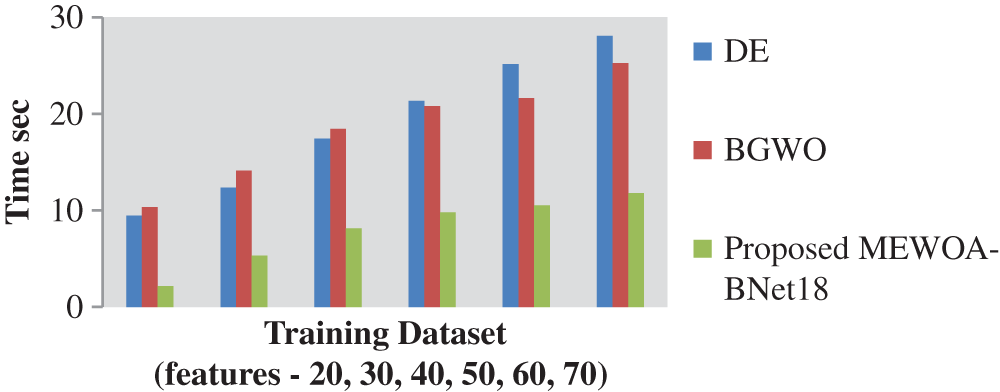
Figure 7: Computation time
Applying ultrasound pictures, we suggested an efficient technique for breast cancer classifications. The recommended process was made up of a few phases that must be followed in order. By using BreastNet18 deep learning method, the breast ultrasound data is first enhanced and then trained up. Following that, the characteristics from max pooling were retrieved, as well as the best feature was chosen using optimization methods, EWOA. Lastly, using a proposed technique, the selected features are fused and then categorized using machine learning techniques. The use of fusion technology improves the quality of life for people. The data is more accurate, but the process takes longer. MEWOM is used in this case. By reducing computing time, the features were improved. These methods have resulted in a significant increase in the rates of false negatives and genuine positives have both dropped. This approach will be beneficial in the long run. As a feedback, radiologists can help with issues like feature extraction and segmentation. Perform categorization based on the best features available. Many tests were conducted, with the suggested methodology (including feature fusion and a CSVM classifier) achieving the highest accuracy of 99.4%. In future, the accuracy of cancer will be improved by using advanced optimization models.
Acknowledgement: Authors would like to thank for the support of Taif University Researchers Supporting Project Number (TURSP-2020/211), Taif University, Taif, Saudi Arabia.
Funding Statement: Taif University Researchers are supporting project number (TURSP-2020/211), Taif University, Taif, Saudi Arabia.
Conflicts of Interest: The authors declare that they have no conflicts of interest to report regarding the present study.
References
1. A. M. Farhan, K. Jabeen, M. A. Khan, M. Alhaisoni, U. Tariq et al., “Breastcancer classification from ultrasound images using probabilitybased optimal deep learning feature fusion,” Sensors, vol. 22, no. 3, pp. 12–26, 2022. [Google Scholar]
2. S. Zahoor, S. Umar and U. Ikram, “Breast cancer mammograms classification using deep neural network and entropy-controlled whale optimization algorithm,” Diagnostics, vol. 12, no. 2, pp. 1–15, 2022. [Google Scholar]
3. S. Montaha, S. Azam, A. Rafid, P. Ghosh, M. Hasan et al., “Breastnet18: A high accuracy fine-tuned VGG16 model evaluated using ablation study for diagnosing breast cancer from enhanced mammography images,” Biology, vol. 10, no. 12, pp. 40–56, 2021. [Google Scholar]
4. M. I. Sharif, M. Alhussein, K. Aurangzeb and M. Raza, “A decision support system for multimodal brain tumor classification using deep learning,” Complex Intelligent System, vol. 12, no. 3, pp. 1–14, 2021. [Google Scholar]
5. S. Alinsaif and J. Lang, “Alzheimer’s disease neuroimaging initiative. 3D shearletbased descriptors combined with deep features for the classification of Alzheimer’s disease based on MRI data,” Computers in Biology and Medicine, vol. 138, no. 4, pp. 1–15, 2021. [Google Scholar]
6. M. Masud, A. E. Rashed and M. S. Hossain, “Convolutional neural networkbased models for diagnosis of breast cancer,” Neural Computing & Applications, vol. 11, no. 5, pp. 1–12, 2020. [Google Scholar]
7. Y. J. Gaona, A. Rodríguez and M. J. Lakshminarayanan, “Deeplearning basedcomputeraided systems for breast cancer imaging: Acritical review,” Applied Science, vol. 10, no. 3, pp. 1–16, 2020. [Google Scholar]
8. D. Q. Zeebaree, “A review on region of interest segmentation based on clustering techniques for breast cancer ultrasound images,” Journal of Applied Science and Technology Trends, vol. 1, no. 6, pp. 78–91, 2020. [Google Scholar]
9. K. Huang, Y. Zhang, H. Cheng and P. Xing, “Shapeadaptive convolutional operator for breast ultrasound image segmentation,” in Proc. IEEE Int. Conf. on Multimedia and Expo (ICME), Shenzhen, China, pp. 5–9, 2021. [Google Scholar]
10. T. Sadad, A. Hussain, A. Munir, M. Habib, S. A. Khan et al., “Identification of breast malignancy by marker-controlled watershed transformation and hybrid feature set for healthcare,” Applied Science, vol. 10, no. 3, pp. 1–24, 2020. [Google Scholar]
11. S. M. Badawy, A. E. Mohamed, A. A. Hefnawy, H. E. Zidan, M. T. Gadallah et al., “Automatic semantic segmentation of breast tumors in ultrasound images based on combining fuzzy logic and deep learninga feasibility study,” PLoS One, vol. 16, no. 3, pp. 1–16, 2021. [Google Scholar]
12. A. K. Mishra, P. Roy, S. Bandyopadhyay and S. Das, “Breast ultrasound tumour classification: A machine learning radiomics based approach,” Expert System, vol. 38, no. 2, pp. 1–12, 2021. [Google Scholar]
13. M. Byra, “Breast mass classification with transfer learning based on scaling of deep representations,” Biomedical Signal Processing and Control, vol. 69, no. 3, pp. 102828, 2021. [Google Scholar]
14. S. Hussain, X. Xi, I. Ullah, Y. Wu, C. Ren et al., “Contextual levelset method for breast tumor segmentation,” IEEE Access, vol. 8, no. 2, pp. 189343–189353, 2020. [Google Scholar]
15. X. Han, J. Wang, W. Zhou, C. Chang, S. Ying et al., “Deep doubly supervised transfer network for diagnosis of breast cancer with imbalanced ultrasound imaging modalities,” in Proc. Int. Conf. on Medical Image Computing and Computer Assisted Intervention, France, Strasbourg, pp. 141–149, 2021. [Google Scholar]
16. W. K. Moon, Y. W. Lee, H. H. Ke, S. H. Lee, C. S. Huang et al., “Computer-aided diagnosis of breast ultrasound images using ensemble learning from convolutional neural networks,” Computer Methods and Programs in Biomedicine, vol. 190, pp. 105361, 2020. [Google Scholar]
17. M. Byra, P. Jarosik, A. Szubert, M. Galperin, H. O. Fournier et al., “Breast mass segmentation in ultrasound with selective kernel UNet convolutional neural network,” Biomed Signal Process Control, vol. 61, no. 4, pp. 34–47, 2020. [Google Scholar]
18. S. Kadry, R. Damaševi, D. Taniar, V. Rajinikanth and I. A. Lawal, “Extraction of tumor in breast MRI using joint thresholding and segmentationa study,” in Proc. Seventh Int. Conf. on Bio Signals, Images, and Instrumentation(ICBSII), Chennai, India, pp. 25–27, 2021. [Google Scholar]
19. V. Lahoura, H. Singh, A. Aggarwal, B. Sharma, M. Mohammed et al., “Cloud computing-based framework for breast cancer diagnosis using extreme learning machine,” Diagnostics, vol. 11, no. 241, pp. 56–66, 2021. [Google Scholar]
20. S. Maqsood, R. Damasevicius and F. M. Shah, “An efficient approach for the detection of brain tumor using fuzzy logic and U-NET CNN classification,” in Proc. Int. Conf. on Computational Science and Its Applications, Springer, Cham, Cagliari, Italy, pp. 105–118, 2021. [Google Scholar]
21. S. J. Gardezi, A. Elazab, B. Lei and T. Wang, “Breast cancer detection and diagnosis using mammographic data: Systematic review,” Journal of Medical Internet Research, vol. 21, no. 24, pp. 23–43, 2019. [Google Scholar]
22. A. Abbas, M. M. Abdelsamea and M. Gaber, “Transfer learning of class decomposed medical images in convolutional neural networks,” IEEE Access, vol. 8, no. 12, pp. 74901–74913, 2020. [Google Scholar]
23. M. A. Antari, S. M. Han and T. S. Kim, “Evaluation of deep learning detection and classification towards a computer-aided diagnosis of breast lesions in digital X-ray mammograms,” Computer Methods Programs Biomed, vol. 196, no. 4, pp. 1–13, 2020. [Google Scholar]
24. D. Ribli, A. Horváth, Z. Unger, P. Pollner and I. Csabai, “Detecting and classifying lesions in mammograms with deep learning,” Scientific Report, vol. 8, no. 3, pp. 1–7, 2018. [Google Scholar]
25. S. A. Agnes, J. Anitha, S. A. Pandian and J. D. Peter, “Classification of mammogram images using multiscale all convolutional neural network (MA-CNN),” Journal of Medical System, vol. 44, no. 12, pp. 1–9, 2020. [Google Scholar]
26. A. D. Jagtap, K. Kawaguchi and G. E. Karniadakis, “Adaptive activation functions accelerate convergence in deep and physics informed neural networks,” Journal of Computer Physics, vol. 404, no. 4, pp. 1–16, 2020. [Google Scholar]
27. A. Ouahabi and A. T. Ahmed, “Deep learning for realtime semantic segmentation: Application in ultrasound imaging,” Pattern Recognition Letter, vol. 144, no. 5, pp. 27–34, 2021. [Google Scholar]
28. A. E. Ilesanmi, U. Chaumrattanakul and S. S. Makhanov, “A method for segmentation of tumors in breast ultrasound images using the variant enhanced deep learning,” Biocybernetics and Biomedical Engineering, vol. 41, no. 2, pp. 802–818, 2021. [Google Scholar]
29. X. R. Zhang, X. Sun, W. Sun, T. Xuand and P. P. Wang, “Deformation expression of soft tissue based on BP neural network,” Intelligent Automation & Soft Computing, vol. 32, no. 2, pp. 1041–1053, 2022. [Google Scholar]
30. Q. Liu, Z. Yang, X. Liu and S. Mbonihankuye, “Analysis of the efficiency energy with regression and classification in household using KNN,” Journal of New Media, vol. 1, no. 2, pp. 101–113, 2019. [Google Scholar]
31. M. Masud, G. S. Gaba, K. Choudhary, M. Hossain, M. F. Alhamid et al., “Lightweight and anonymity-preserving user authentication scheme for IoT-based healthcare,” IEEE Internet of Things Journal, vol. 2, no. 4, pp. 1–14, 2021. [Google Scholar]
32. M. Abouhawwash and K. Deb, “Karush-kuhn-tucker proximity measure for multi-objective optimization based on numerical gradients,” in Proc. 2016 on Genetic and Evolutionary Computation Conf. Companion, ACM, Denver Colorado USA, pp. 525–532, 2016. [Google Scholar]
33. A. H. El-Bassiouny, M. Abouhawwash and H. S. Shahen, “New generalized extreme value distribution and its bivariate extension,” International Journal of Computer Applications, vol. 173, no. 3, pp. 1–10, 2017. [Google Scholar]
34. A. H. El-Bassiouny, M. Abouhawwash and H. S. Shahen, “Inverted exponentiated gamma and its bivariate extension,” International Journal of Computer Application, vol. 3, no. 8, pp. 13–39, 2018. [Google Scholar]
35. A. H. El-Bassiouny, H. S. Shahen and M. Abouhawwash, “A new bivariate modified weibull distribution and its extended distribution,” Journal of Statistics Applications & Probability, vol. 7, no. 2, pp. 217–231, 2018. [Google Scholar]
36. M. Abouhawwash and M. A. Jameel, “KKT proximity measure versus augmented achievement scalarization function,” International Journal of Computer Applications, vol. 182, no. 24, pp. 1–7, 2018. [Google Scholar]
37. H. S. Shahen, A. H. El-Bassiouny and M. Abouhawwash, “Bivariate exponentiated modified weibull distribution,” Journal of Statistics Applications & Probability, vol. 8, no. 1, pp. 27–39, 2019. [Google Scholar]
38. M. Abouhawwash and M. A. Jameel, “Evolutionary multi-objective optimization using benson’skarush-kuhn-tucker proximity measure,” in Int. Conf. on Evolutionary Multi-Criterion Optimization, East Lansing, Michigan, USA, pp. 27–38, 2019. [Google Scholar]
39. M. Abouhawwash, M. A. Jameel and K. Deb, “A smooth proximity measure for optimality in multi-objective optimization using benson’s method,” Computers \& Operations Research, vol. 117, no. 2, pp. 104900, 2020. [Google Scholar]
40. M. Abouhawwash, K. Deb and A. Alessio, “Exploration of multiobjective optimization with genetic algorithms for PET image reconstruction,” Journal of Nuclear Medicine, vol. 61, no. 1, pp. 572–572, 2020. [Google Scholar]
41. S. Ibrahim, H. Alhumyani, M. Masud, S. S. Alshamrani, O. Cheikhrouhou et al., “Framework for efficient medical image encryption using dynamic S-boxes and chaotic maps,” IEEE Access, vol. 8, no. 13, pp. 160433–160449, 2020. [Google Scholar]
42. M. Rawashdeh, M. Zamil, S. M. Samarah, M. Obaidat and M. Masud, “IoT-Based service migration for connected communities,” Computers & Electrical Engineering, vol. 96, no. 2, pp. 1–10, 2021. [Google Scholar]
43. M. AbdelBasset, R. Mohamed, M. Elhoseny, M. Abouhawwash, Y. Nam et al., “Efficient MCDM model for evaluating the performance of commercial banks: A case study,” Computers, Materials & Continua, vol. 67, no. 3, pp. 2729–2746, 2021. [Google Scholar]
Cite This Article
 Copyright © 2023 The Author(s). Published by Tech Science Press.
This work is licensed under a Creative Commons Attribution 4.0 International License , which permits unrestricted use, distribution, and reproduction in any medium, provided the original work is properly cited.
 Downloads
 Citation Tools