
 Submit a Paper
 Propose a Special lssue
 Open Access
ARTICLE

Real-Time CNN-Based Driver Distraction & Drowsiness Detection System
1 University of Jeddah, College of Computing and Information Technology at Khulais, Department of Information Technology, Jeddah, Saudi Arabia
2 University of Jeddah, College of Computer Science and Engineering, Department of Software Engineering, Jeddah, Saudi Arabia
3 Department of Computer Science, National College of Business Administration & Economics, Bahawalpur Campus, 63100, Pakistan
4 Department of Computer Science and Information Technology, The Islamia University of Bahawalpur, Rahim Yar Khan Campus, Punjab, 64200, Pakistan
* Corresponding Author: Abdulwahab Ali Almazroi. Email:
(This article belongs to the Special Issue: Computer Vision and Machine Learning for Real-Time Applications)
Intelligent Automation & Soft Computing 2023, 37(2), 2153-2174. https://doi.org/10.32604/iasc.2023.039732
Received 13 February 2023; Accepted 23 April 2023; Issue published 21 June 2023
 View Full Text
 Download PDF
Abstract
Nowadays days, the chief grounds of automobile accidents are driver fatigue and distractions. With the development of computer vision technology, a cutting-edge system has the potential to spot driver distractions or sleepiness and alert them, reducing accidents. This paper presents a novel approach to detecting driver tiredness based on eye and mouth movements and object identification that causes a distraction while operating a motor vehicle. Employing the facial landmarks that the camera picks up and sends to classify using a Convolutional Neural Network (CNN) any changes by focusing on the eyes and mouth zone, precision is achieved. One of the tasks that must be performed in the transit system is seat belt detection to lessen accidents caused by sudden stops or high-speed collisions with other cars. A method is put forth to use convolution neural networks to determine whether the motorist is wearing a seat belt when a driver is sleepy, preoccupied, or not wearing their seat belt, this system alerts them with an alarm, and if they don’t wake up by a predetermined time of 3 s threshold, an automatic message is sent to law enforcement agencies. The suggested CNN-based model exhibits greater accuracy with 97%. It can be utilized to develop a system that detects driver attention or sleeps in real-time.Keywords
The number of fatalities and non-fatal injuries on the world’s roads totals roughly 1.3 million per year [1]. The global epidemic of injury sustained by transportation is spreading quickly around the globe. Driving while exhausted or sleepy behind the wheel of a vehicle is referred to as “drowsy driving,” also known as tired or fatigued driving. Daily, individuals utilize cars for transportation, which increases the risk of a very serious or fatal collision involving either another car or any other moving or still item. But every luxury comes at a price. Because of this excess, there is now greater traffic in metropolitan areas and on the highways. As a result, there are more accidents on the side of the road. One of the main factors in this region is sleepiness [2]. Drivers are less aware of their surroundings and are more susceptible to distractions, as a result, their ability to react quickly declines, making it challenging to avoid the coming risk of a potentially fatal traffic accident. Another significant factor that contributes to numerous roadside collisions is the failure to use a seat belt. Fig. 1 below shows some serious fatalities that occurred via roadside ac-accidents in various countries between 2013 and 2018.

Figure 1: European commission data on most roadside fatalities worldwide [3]
A statistic for worldwide traffic crashes from 2010 to 2021 is shown in Table 1 below, along with the number of fatalities that occurred.
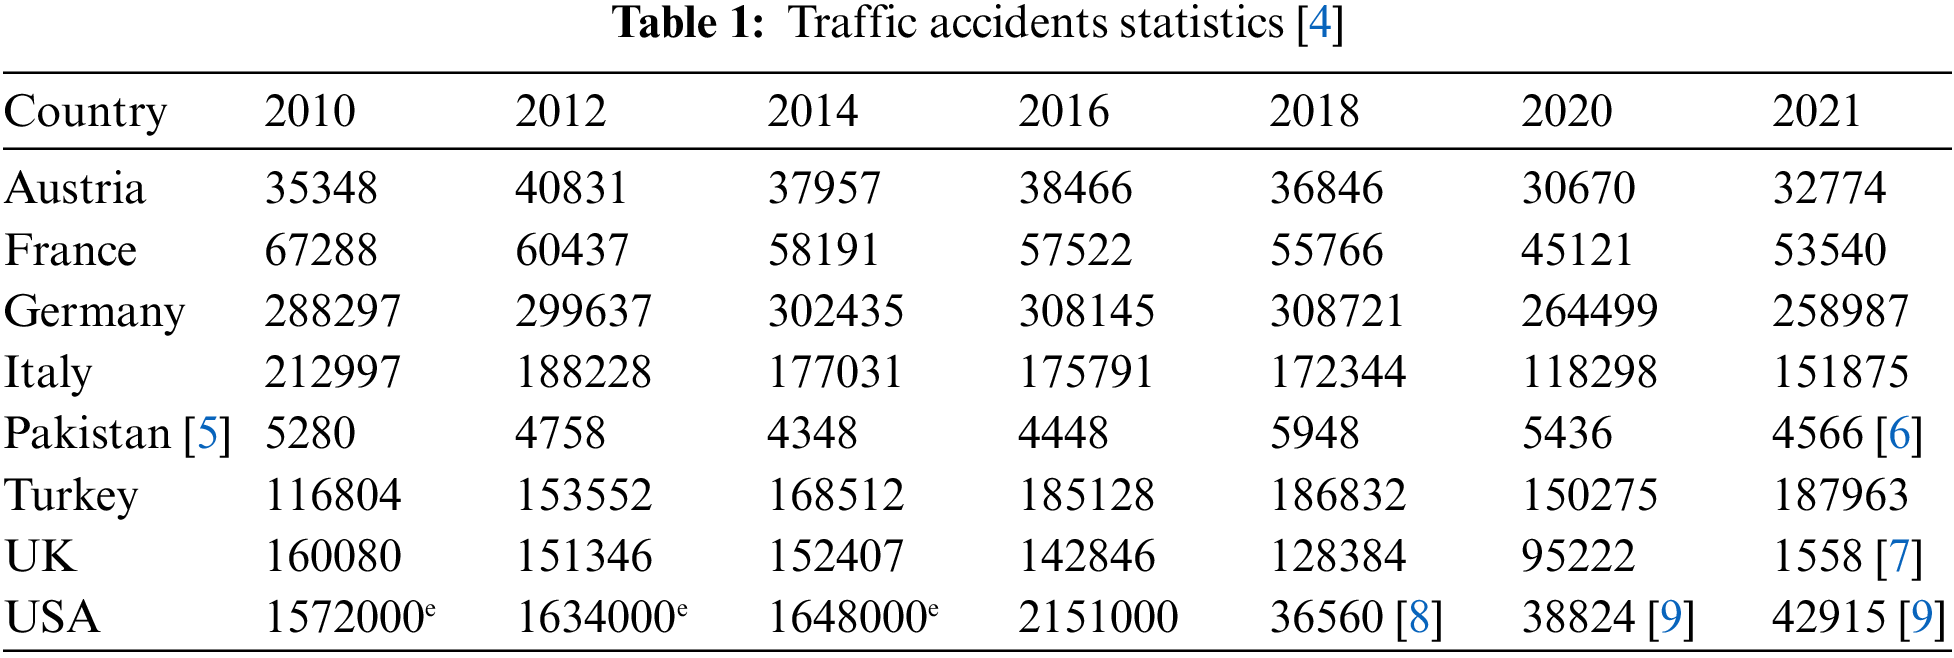
Fig. 1 and Table 1 both used to show worldwide data with the number of causalities that have occurred over various years. It is gloomy to see how many precious lives were gone. Therefore, it is imperative to create a reliable system that can warn drivers when there are any signs of distraction or tiredness to lessen such major deadly vehicle-related difficulties. Below Fig. 2, which is a graphical representation of the proposed system, it depicts how the driver drowsiness system generally operates.

Figure 2: Driver drowsiness technique
Fig. 2 shows a basic block diagram of driver drowsiness methodology that starts when the image has been attained and the whole process will end with alertness given to the driver.
A chief goal of this research paper is to suggest a structure or mechanism that informs motorists whenever they feel sleepy or preoccupied for more than a few seconds utilizing an alarm or a sound. These types of technologies are already present in some of the most opulent vehicles, such as Ford, Volo, and Mercedes, but our goal is to develop this system for the norm of regular car users and tiny vehicles, allowing an average driver to also have access to such fantastic life-saving technology.
1.1 Drowsiness’s Underlying Causes
Although every human being is prone to making mistakes, everyone needs to remain vigilant while driving. However, occasionally, people may overlook this because of a variety of factors and causes. We shall go into detail about several factors that can identify distinct causes of driver drowsiness.
Loss or absence of sleep is the main contributor to people feeling drowsy or lethargic during the day [10]. These occurrences may result in issues like microsleep or other risky behaviors that may prove lethal. An adult person must sleep the recommended amount each day, which is seven to nine hours. But because people have so many successes, whether they are related to their jobs or not, they fail to follow this trend.
Obstructive sleep apnea can be one of many problems of sleep some people suffer, which can make it difficult to fall asleep or cause it to be less restful than usual [11]. Some of these sleep-related diseases go undetected and contribute to tiredness during the day.
It is a big factor in why a driver might be drowsy behind the wheel. This may have occurred because the diver spent an inordinate amount of time behind the wheel or had to complete some tedious, demanding activity before driving [12].
A few pills or tablets slow down human reaction speed. Additionally, some things can make you sleepy or have a relaxing impact that makes you more likely to go to sleep [13].
1.2 Strategies Used by Automakers to Address This Issue
To make driving a safe setting for human lives, automobile manufacturers employ a variety of measures, such as the prevention of driver fatigue or the detection of sleepiness. Numerous automakers worldwide have implemented sleepiness detection systems for this reason.
The vehicle system computes steering movement [14]. Additionally, it is effective when using very abrupt and severe breaks as well as lane switching.
Skoda car [15] records steering motions under normal circumstances (beginning minutes after the car begins), analyses those movements at any later time and notifies the driver if the steering movements behave abnormally with the aid of a warning system.
The Driver Drowsiness Detection system is a device created by Bosch. The system evaluates the aberrant trajectory of the car using data from the sensor (installed in the steering wheel), generates warning signals for the driver, and uses data about sudden movements of the steering vehicle [16].
□ How have former approaches effectually solved the driver’s sleepiness, seat belt, and attention detection systems?
□ In what ways will diverse technologies integrate into the proposed approach?
□ How to evaluate the driver’s sleepiness, seat belt, and distraction system?
□ What might the driver’s sleepiness and distraction detection system be used for?
In our research part, we offered an inspired solution to the subject. Eyes and mouth are both taken into consideration as we address the issue of tiredness in this. We compute the pace at which the eyes open and close, and we take the rate at which the mouth closes and opens into consideration. We are identifying several objects that drivers use while driving that can be distracting. Additionally, we are tracking driver seat belt usage.
As, according to their physical nature and the behaviors they engage in, three fundamental groups can be used to classify driver sleepiness detections.
□ Considering the driver’s actions.
□ Using the vehicle’s specifications.
□ Based on the physiology of the driver.
Fig. 3 below illustrates various techniques for detecting driver intoxication that considers the driver’s physical state, or it can be vehicle measures or body signals like calculation of Electro Encephalography (EEG) & Electrocardiography (ECG).

Figure 3: Various methods to assess distraction and tiredness
As shown in Fig. 3 above, different measures to determine driver drowsiness and distraction level. They can be done by using vehicle parameters or by using the driver’s body postures or parts.
Here, we’ll go over many works of literature that specifically address the problem of driver drowsiness and the various approaches that various academics have taken to address it.
The author presents a unique Support Vector Machine-based driver condition recognition method to avoid accidents caused by driver fatigue [17]. Utilizing the wearable device’s sensors, it is possible to assess the driver’s status. The suggested alert system worked as follows: To identify the peculiarities of the driver’s condition, researchers first collected biodata from a Photoplethysmography (PPG) sensor in the device. To improve classification accuracy, the obtained data is next processed by segmentation and averaging. The SVM classifies the driver’s condition using feature vectors from the processed data. Precision, the margin of error, accuracy, and recollection measures are utilized to assess the performance of the suggested techniques.
The utilization of image processing techniques to track the driver’s head motions to identify drowsiness and heart rate has been given in [18]. By employing the frame variance algorithm to identify gestures of the head and the R-peak recognition algorithm to measure heart rate, drowsiness can be detected. For the driver’s safety as well as the safety of the passengers, a buzzer alarm is sent to the driver if any irregularities are discovered during detection.
A highly accurate sleepiness detection system that warns the driver when they are becoming fatigued while driving has been proposed [19]. The development of a unique drowsiness detection system based on facial, eye, and mouth movement detection. The technology warns the driver by monitoring important features like head motions, yawning, and eyelid opening and closing.
A heart rate monitoring system that determines a driver’s breathing by identifying variations in Electrocardiogram, and then extrapolates the driver’s level of tiredness from those changes has been discussed in [20]. The system is less expensive and more accurate than one that uses heart rate directly, even though it is directly in contact with skin and is affected by the driver’s activities. After a validation trial, it’s been found that the system can accurately detect driver tiredness.
A novel method that suggests a heart rate variability-based methodology for detecting driver tiredness and verifies it by contrasting it with a sleep score based on electroencephalography has been given in [21]. Methods of the autonomic nerve system, which is characterized as an interval variation on an electroencephalography trace, are impacted by changes in sleep quality. Using multivariate statistical process control, a well-known anomaly detection technique, eight heart rate variability variables are tracked for changes in heart rate variability.
A drowsiness detection technique based on variations in the respiratory signal is suggested in this research, Ref. [22]. To evaluate if a driver is tired or awake, employing an inductive plethysmography belt to acquire the breathing signal has been analyzed in real time. The proposed approach uses an analysis of respiratory rate variability to identify people who struggle to fall asleep. In addition, a technique for providing breathing indication’s quality level is suggested. Each approach has been integrated to decrease wrong alarms brought on by variations in recorded respiratory rate variability related to movements of the body rather than drowsiness.
A set of smart wearable spectacles, an in-vehicle infotainment telematics stand, and an automobile diagnostic bridge consisting of an on-board diagnostics-II vehicle backlight alert method also a cloud-based management platform makes suggested a system has been proposed in [23]. For the low-cost, lightweight wearable smart glasses, a dedicated miniature bandpass infrared light sensor is also suggested and implemented. This sensor can offer a developed signal-to-noise ratio than an all-purpose commercial infrared light sensor, reduce the image of ambient environmental light, and effectively improve detection accuracy. Real-time detection of the driver’s level of sleepiness or exhaustion is possible with the proposed system.
The authors of this paper developed the intuitionistic fuzzy entropy derived symmetric implicational (IFESI) method based on the concepts of maximum fuzzy entropy and symmetric implicational mechanism in the context of intuitionistic fuzzy sets [24]. Fresh symmetric implicational principles are introduced, and the unified IFESI algorithm solutions for the intuitionistic fuzzy modus ponens (IFMP) and IFMT (intuitionistic fuzzy modus ponens), which are based on residual intuitionistic implications, are acquired. The IFESI algorithm’s continuity and reductive features are then verified for IFMP and IFMT. Furthermore, the IFESI algorithm is extended to the-IFESI method and the unified solutions of the-IFESI algorithm are derived for IFMP and IFMT.
The density Viewpoint-based Weighted Kernel Fuzzy Clustering (VWKFC) technique is suggested in this paper [25]. As a requirement, the kernel distance rather than the Euclidean distance is used in the kernel-based hypersphere density initialization (KHDI) procedure. Moreover, a brand-new density radius is proposed. Second, a two-part notion known as the weight information granule is established. A feature weight matrix is given, in which various weights are given to various features to lessen the impact of unrelated features. At the same time, each data point is given a sample weight, which might somewhat lessen the impact of noise and outliers on grouping. Third, the density viewpoint is the data point with the highest local density discovered by KHDI. Then, we design the VWKFC algorithm and demonstrate its convergence by combining the kernel mechanism, density viewpoints, weight information granules, and maximum entropy regularization.
Localization, as well as classification of objects, are both included in object detection. Over recent decades, researchers have tried a variety of methods to achieve detection and classification. There are numerous ways to decide object detection, both of which use one- and two-stage algorithms. Each algorithm has unique properties. Fig. 4 below shows there are numerous ways to decide object detection, both of which use one- and two-stage algorithms.

Figure 4: Various object detection techniques
Here above in Fig. 4, it is shown that various techniques can be used to detect objects. Some of them are traditional and others are deep learning based, each method has its advantages.
The Mask-Refined R-CNN (MR R-CNN), which modifies the ROI Align (region of interest aligns) stride, is suggested [26]. Also, a new semantic segmentation layer is added to replace the original fully convolutional layer. This layer achieves feature fusion by building a feature pyramid network and combining the forward and backward transmissions of feature maps with the same resolution. By integrating the feature layers that concentrate on the global and detailed information, segmentation accuracy is significantly increased.
Using multi-layer convolution feature fusion (MCFF) and online hard example mining, an efficient object detection technique for small and occluded objects is proposed in this study (OHEM) [27]. The region proposal network optimized by MCFF is used to create the candidate regions first. After that, the region based ConvNet Detector is trained using an efficient OHEM technique. To increase training effectiveness, the challenging cases are automatically chosen. The model training’s convergence time is accelerated by avoiding invalid examples. In an intelligent traffic scenario, the tests are run using the KITTI data set.
This study [28] proposes dynamic weighted DPA (DWDPA) to improve the DP of the chosen DCTCs without a pre-masking window, i.e., without optimizing the form and size of the pre-masking window. According to their values for discrimination power, DCTCs are picked adaptively (DPVs). There are higher DP DCTCs preserved. The chosen coefficients are dynamically weighted and normalized by their DPVs. With normalization, it is ensured that the DP of the other DCTCs with lower absolute values but higher DPVs won’t be ruined by the DCTCs with big absolute values. The performance of recognition is optimized and improved by dynamic weighting, which gives bigger weights to the DCTCs with larger DPVs.
A neural network model for detection that takes cues from saliency that forecasts the collection of class-neutral bounding boxes together with a single score for every box that reflects the likelihood that it will contain any item of attention that has been given in [29]. At the highest layers of the network, the model automatically accommodates a variable number of cases for each class and permits cross-class generalization. Even with a limited number of neural network evaluations and the top few predicted locations in each image, authors achieve competitive recognition performance.
The “You-only-look-once” method as the framework for object identification in real-time unmanned Ariel vehicle applications has been proposed in [30]. Convolutional neural network and the “YOLO” technique, both are deep learning-based algorithms and are thought to be the most effective also widely used object detectors built into the vision-based unmanned Ariel vehicle navigation system.
An advance perception performance, the authors specifically implement the YOLOv4-Tiny approach for semantic object recognition, Kalman filter is improved when it is paired with a 3D object pose estimation. The technique is given in ref [31]. To complete, the completely autonomous system, combined with UAV path planning for a surveillance maneuver. The perception module is tested on a quad-rotor UAV, and flying tests are used to validate the entire system. The experiment’s findings demonstrated that the autonomous object-tracking UAV system is reliable, effective, and capable of fulfilling surveillance tasks.
It’s been suggested here in [32] that initially, one might capture and take advantage of such a reality by merely decreasing the dimensionality of a layer, hence decreasing the dimensionality of the working space. This has also been integrated into accurate system designs of other networks. MobileNetV1 effectively employed this to tradeoff between computation and accuracy using a width multiplier parameter.
Various researchers have given their contributions to the detection of driver drowsiness using different techniques, Table 2 shows some of their works.
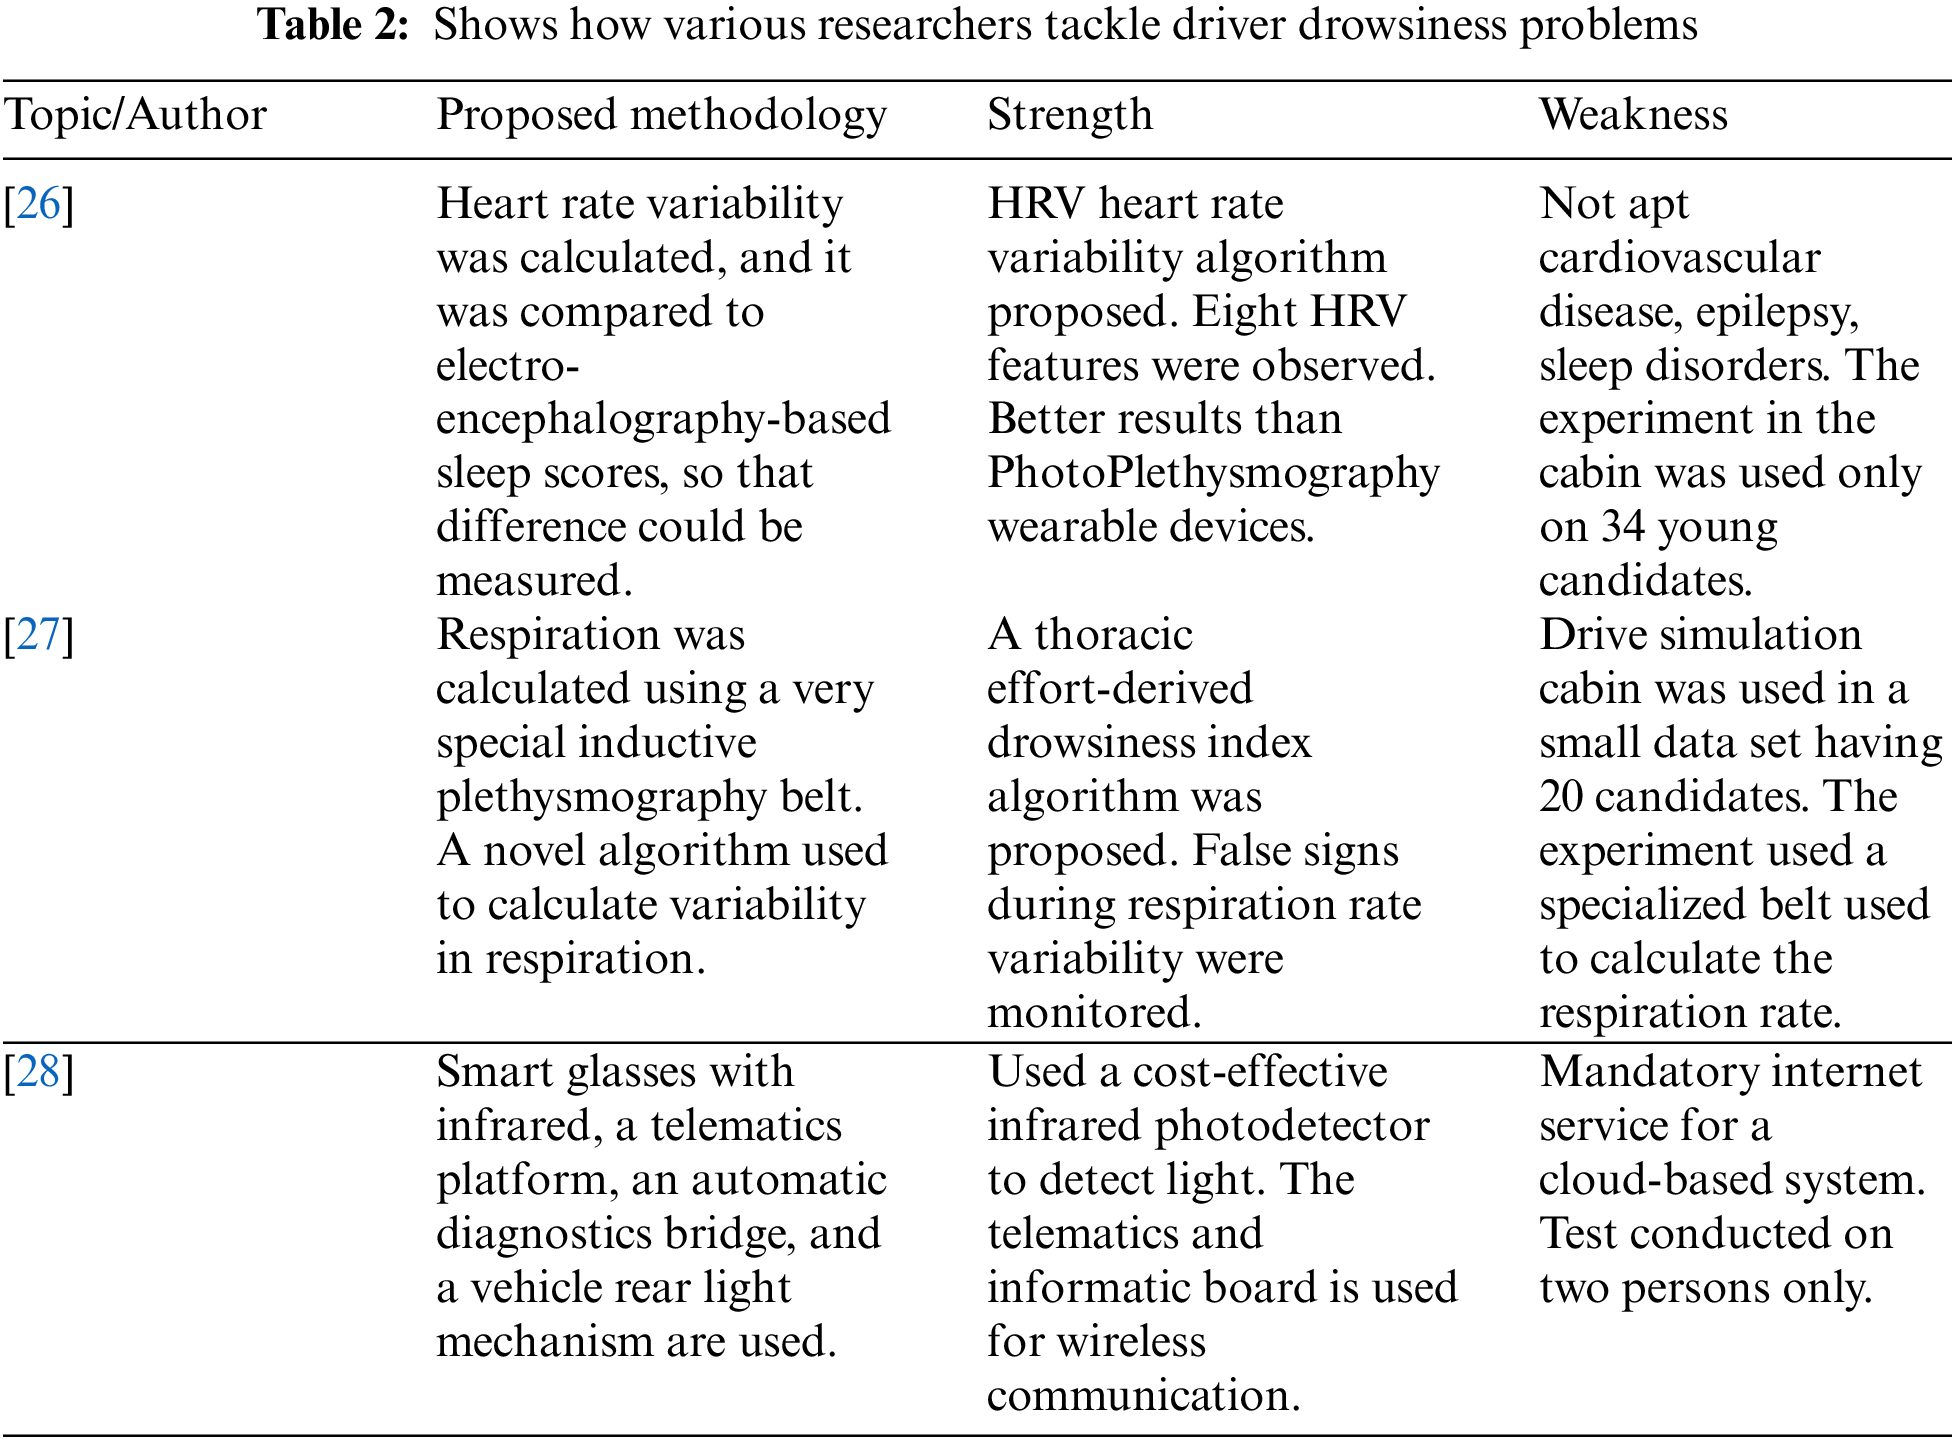
As shown in Table 2 above, different techniques for driver drowsiness detection. Some used physical measures and others used infrared technology. The results of them can vary from each other. Each method has its strengths and weakness too.
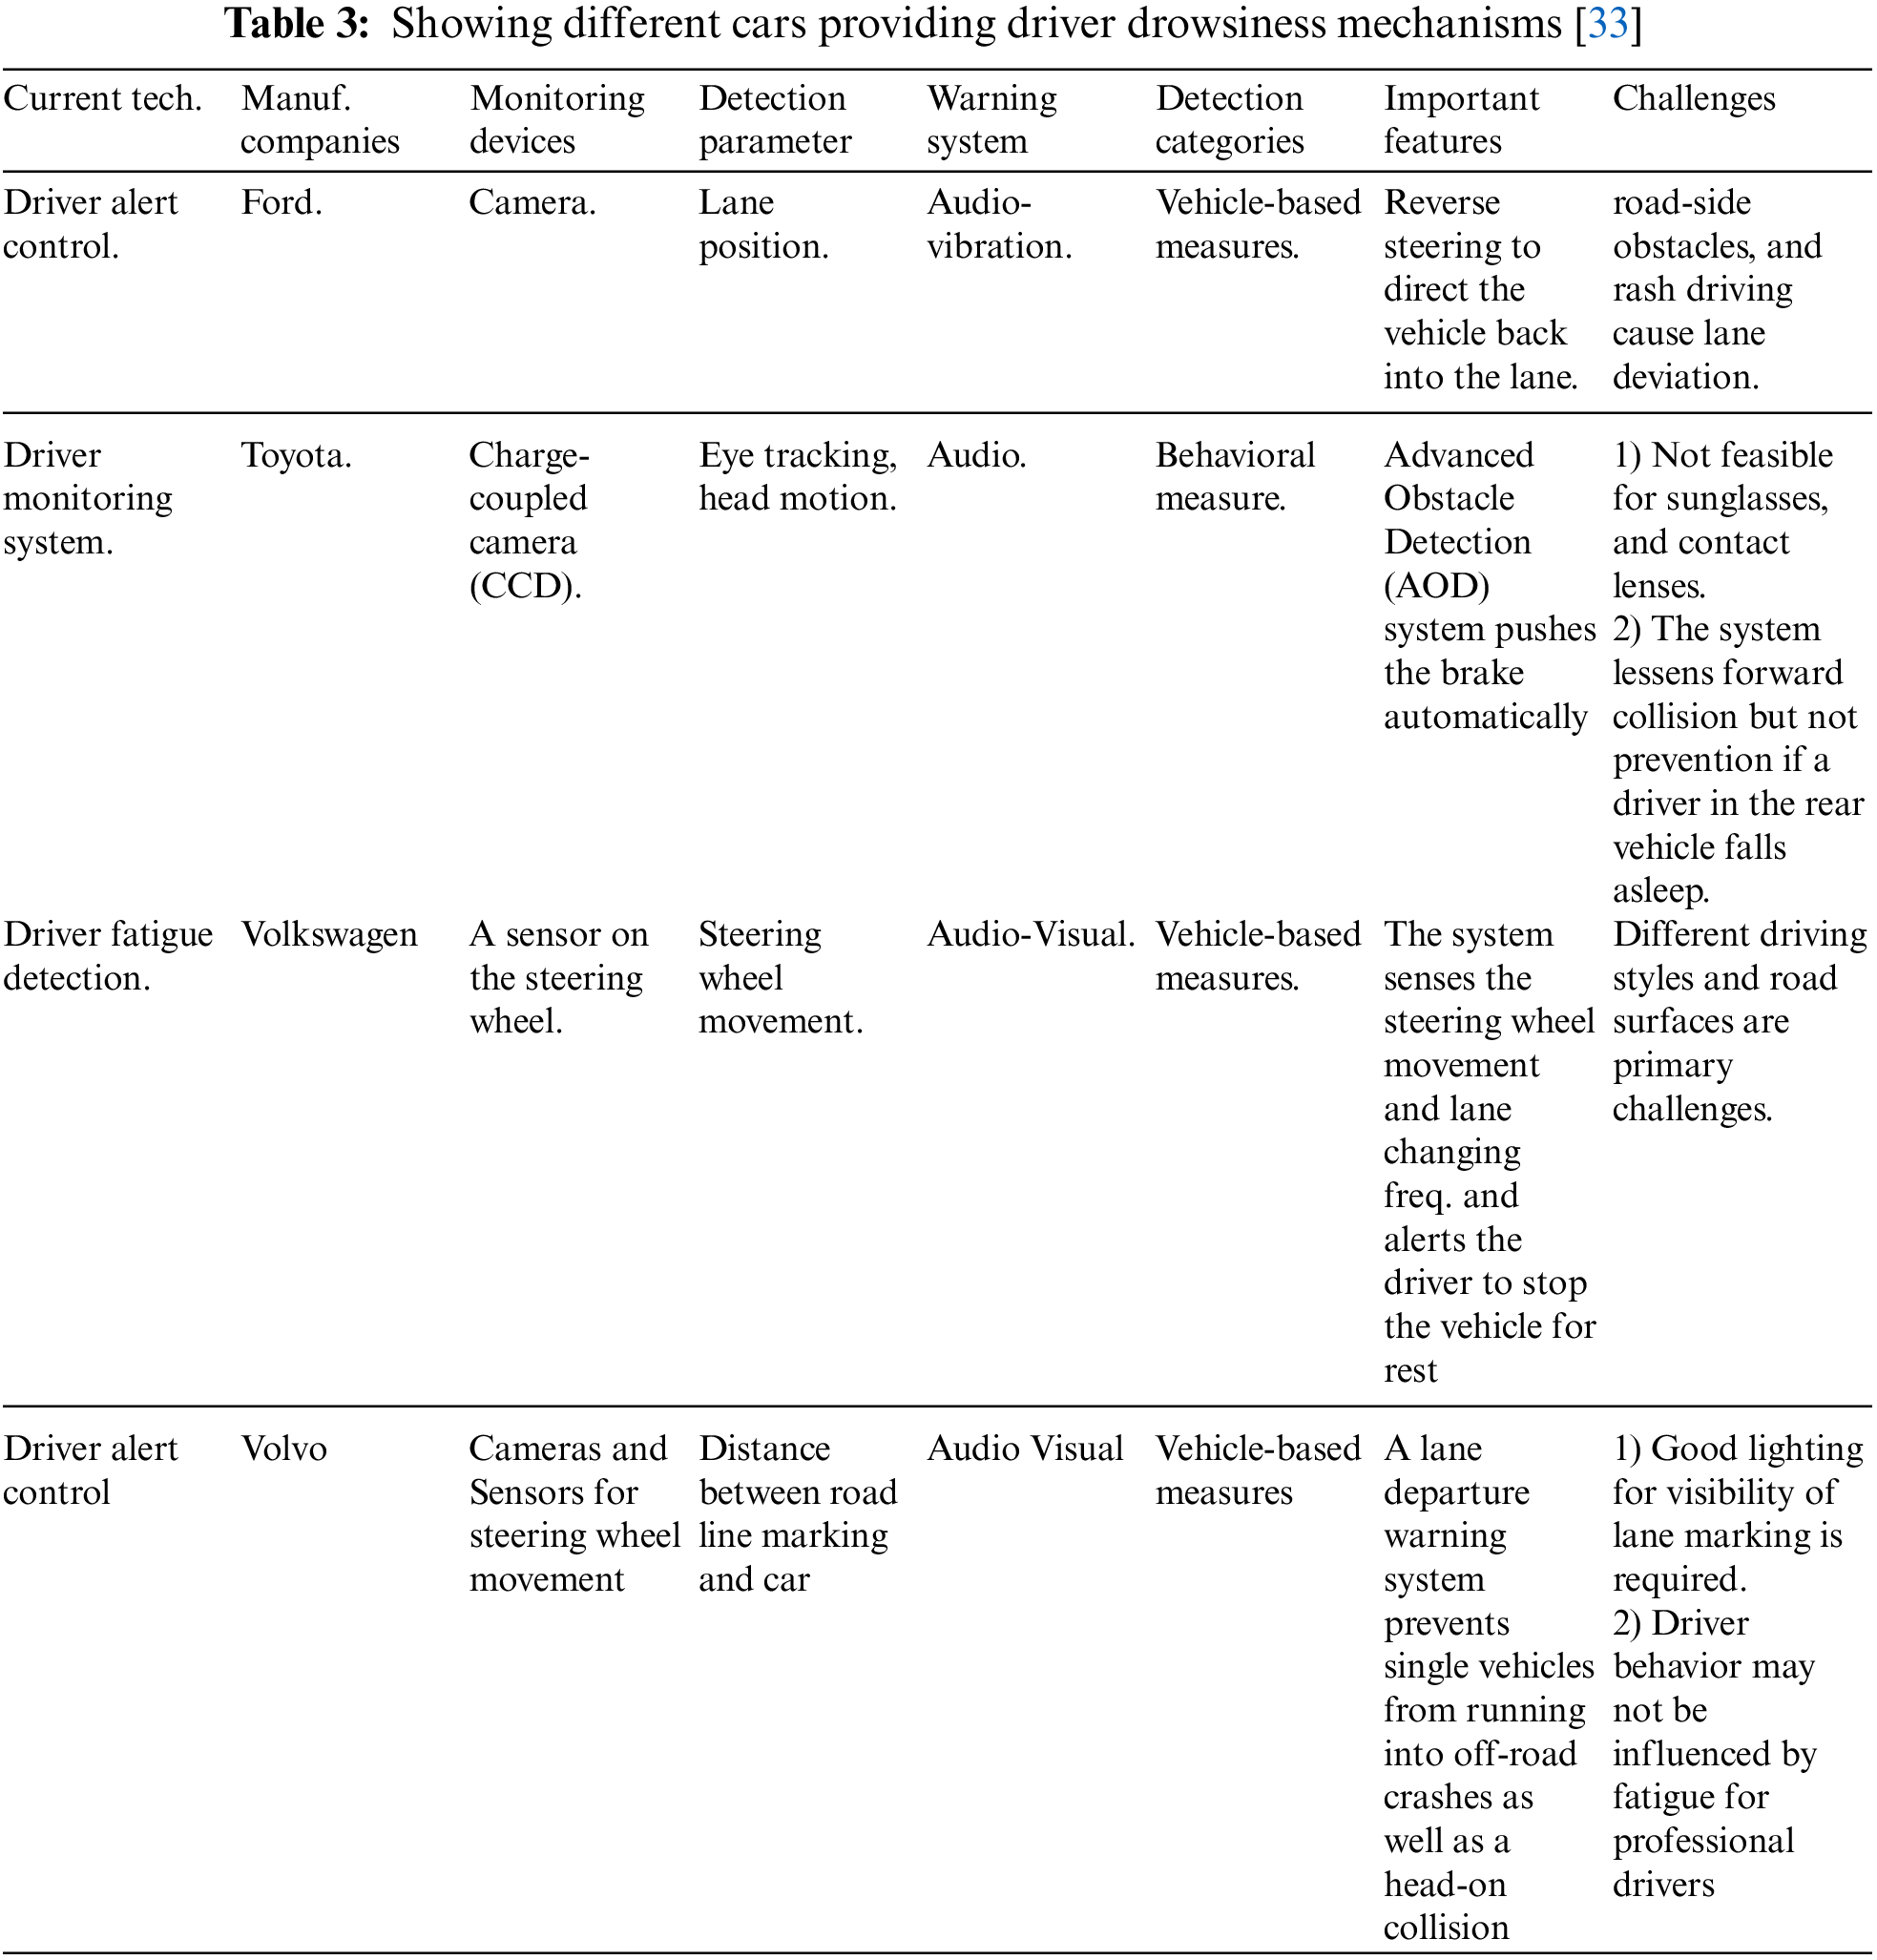
Here below, a table shows different luxury vehicles that have driver drowsiness detection systems in them.
Table 3 above shows how different car manufacturing companies deal with driver drowsiness and detection systems. Each car company gives a unique system but has some drawbacks and benefits.
5 Hardware Specs for Methodology
The system used for this process consists of an Intel® Core™ i5-6200U CPU @ 2.30 GHz 2.40 GHz processor, 6.00 GB of RAM, an x64-based processor, and a 64-bit OS system, with Windows 10, Raspberry Pie 4, Web camera, Liquid crystal display, and GSM module. Fig. 5 below shows how the whole driver drowsiness and distraction detection system work.

Figure 5: Network connection and sequence of the hardware components used in the proposed solution
Fig. 5 shows network connections of different hardware components along with the actors of the proposed solution. Different hardware components showing the sequence of execution that will be used to carry out this experiment are also mentioned here.
In Fig. 5 it’s been shown that the driver is monitored via the webcam and then a video is sent to Raspberry 4 for any drowsiness, seat belt, or distraction happen, if yes is detected then an alarm is sounded as well as a message is displayed on an LCD screen with a warning generated after the set threshold has been crossed, a message will be forwarded to driver’s emergency contacts and to law enforcement agencies to alert the driver along with the location of the vehicle via GPS module. Here the message contains a snapshot of the driver as well as the exact location (fetch via GPS) of the automobile.
There will be tools needed to implement our suggested process. The system will operate with outstanding accuracy and efficacy thanks to this tool combination mentioned in Table 4 down below.
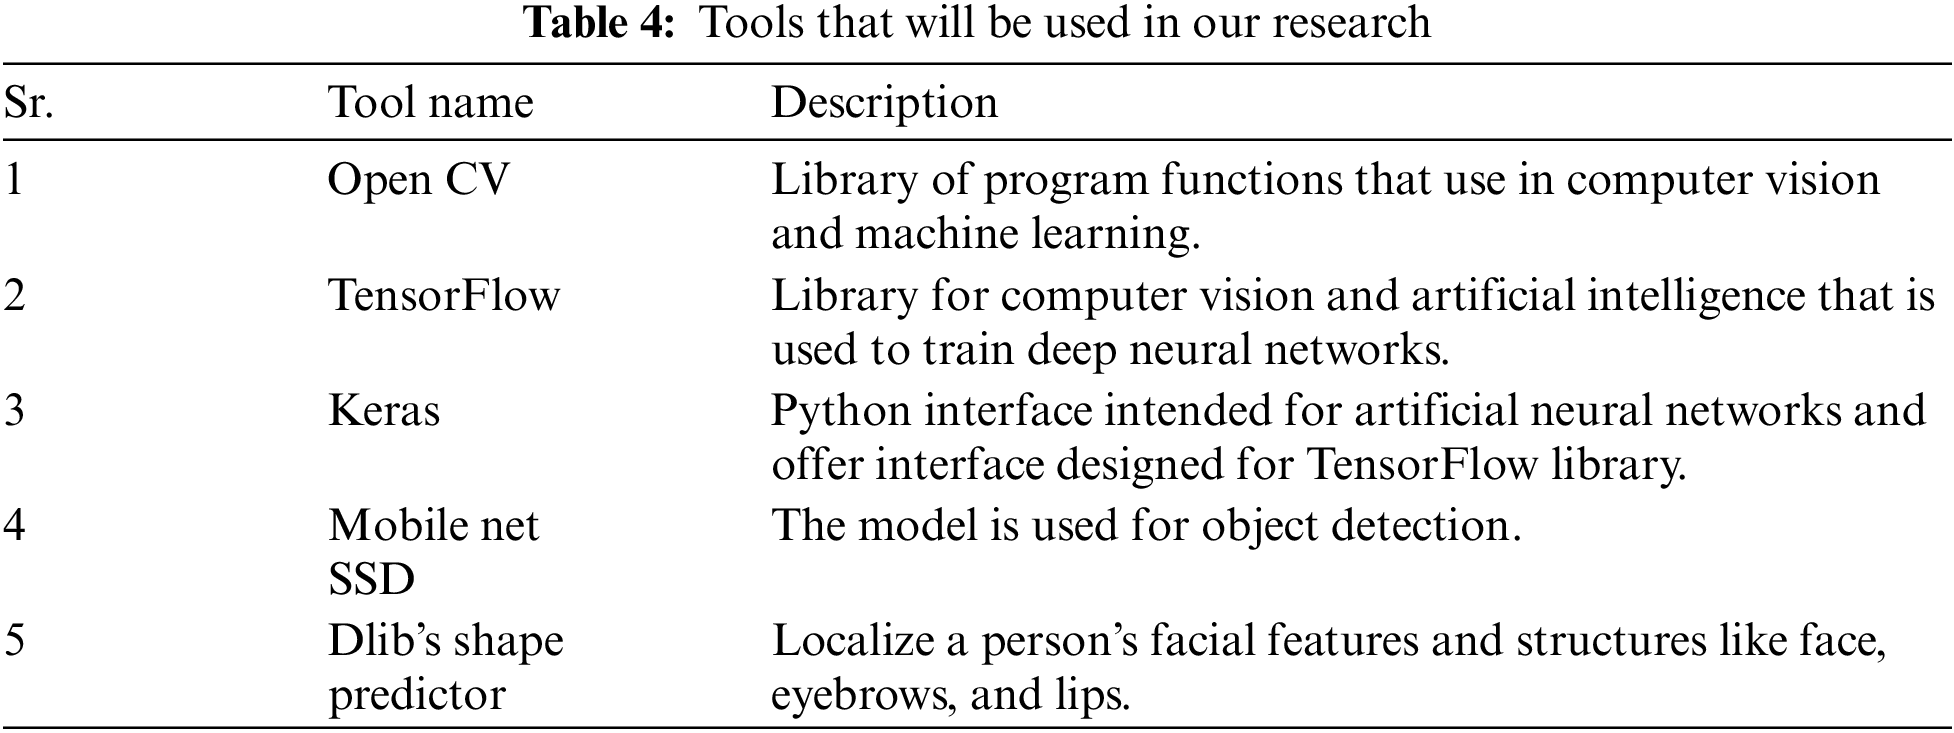
In above, Table 4, it’s been shown that different tools have been used to make this experiment successful. All these tools have their purposes and methodologies in which TensorFlow is the main framework with Keras and rest algorithms will be used in determinations of driver drowsiness or yawn detections also seat belt and object detection.
The whole mechanism of driver drowsiness and distraction is shown in Fig. 6 down below, in flowchart form.

Figure 6: Flow chart illustration of driver drowsiness seat belt and distraction system
Fig. 6, shown in the form of a flow chart how our work will be done regarding the detection of driver drowsiness or yawn detections and seat belt detections starting with when driver video will be captured.
This paper has discussed a novel approach. Previous studies have concentrated mostly on the drowsiness that occurs when a driver’s eyes are closed, but the mouth region can also be quite important in the form of yawning, which can cause a driver to become fatigued and fall asleep. Additionally, a novel strategy has been proposed to inform the driver as well as notify law enforcement officials of the driver’s whereabouts, enabling them to stop any further mishaps.
To determine whether the driver is either drowsy or distracted, this purposed methodology pseudocode has been given below in Fig. 7.

Figure 7: Pseudocode for drowsiness detection
Above in Fig. 7, pseudocode for drowsiness has been shown. The formula for calculating ratios regarding eyes and mouth is low. Using these formulas, we can determine ratios of the opening and closing of eyes and mouth regions.
For eyes aspect ratio the formula is:
For mouth aspect ratio formula is:
The pseudocode for object detection has been shown down below in Fig. 8.

Figure 8: Pseudocode for object detection
Above Fig. 8, shows object detection pseudocode and the how whole mechanism will work. Now down in Fig. 9 illustration of object detection has been shown.

Figure 9: Flow diagram for illustration of object detection
Mobile net SSD’s object-detecting technology has been used to sense undesirable things the driver uses during driving. The TensorFlow framework has been combined with Keras to adopt this model. When a driver uses an undesired object while driving. Mobile net v3 SSD (single shot detector) employs real-time object detection to identify it. It’s very lightweight and gives the most accurate results. Regarding this trained model it uses the famous data set Coco which has 80 classes. Images that have been provided are 320 × 320 pixels in size, in which RGB color channel has been used for all images. How objects are positioned in the image Bounding Box Dimensions and the confidence score that the value showing the precision of these objects detecting shows the accuracy of the model. Additionally, the Mobile net SSD will assess whether the driver is buckled up or not.
The algorithm offers a better balance of both speed and accuracy, increasing production. It is speedier than several related algorithms since it skips some steps that they employ. It includes a convolution filter with a declining slope for determining object classes and offsets in bounding box regions.
Euclidean Distance
It’s a distance between two points, and that distance is a straight line. The mathematical formula is given as:
When using Euclidean calculation, two numbers are fixed on a line, and the root of the equation is chosen. The distance between these centers is the unit of a bundle, and the positive bearing is represented as the direction from one inspiration to the next point. This line segment might be used to explain what happens along the line to longer divisions whose lengths correspond to the isolated unit’s outcomes. Then, astonishingly, the point on hold that is at a unit of one specific unit from the combined earliest beginning stage is chosen. The precise determination of the mathematical difference between two objects’ directions is the division between any two on a verified line. With its Cartesian assistance, it is entirely expected to see the name of a point. Fig. 10 below discusses a graph of Euclidean distances with two dimensions.

Figure 10: Computation of the two-dimensional euclidian distance
Fig. 10, shows the Euclidean distance between two-dimensional points. Based on these graph values, we calculate eye and mouth aspect ratios. The formula to calculate ratios regarding the eyes and the mouth is shown below.
While a real-time video is being recorded, a calculated EAR value is used to register the eye’s blinking condition (formula 1) and is compared to a predetermined threshold. Value (i.e., 0.5). Blinking is explained by an abrupt change in the EAR to a greater value than the threshold value. Similar is for MAR if a person’s mouth is open for a time.
Two figures with ratios and graphical representations are shown below. Fig. 11 shows the eyes-to-mouth ratio, as well as the mouth to eyes ratio with various points of the eyes and mouth, accounted for. Fig. 12, demonstrates charts with the eyes-to-mouth ratio with values considered. The upper value of 0.30 shows that eyes are open and the lowest value, which is 0.05 shows eyes closed as the driver blinked. Values that are at 0 show that the mouth is closed, and the upper value that is 0.8 shows that the mouth is open.

Figure 11: EAR and MAR for eyes and mouth regions

Figure 12: Graphical representations of eyes and mouth closing opening ratios
Figs. 11 and 12, it has been shown how eye and mouth aspect ratios work with different aspects that consist of eyes open and closed and mouth aspects with open and close.
In this case, we added landmarks to the face using the pre-trained DLib shape predictor, which was trained on the COWF (Caltech Occluded Faces in the wild) dataset, and it has almost 100% accuracy when applying facial landmarks to it. Further, after training, we tried our proposed methodology on different drivers and promising results were shown with great accuracy. Table 5 shows the driver drowsiness dataset with various persons tested.
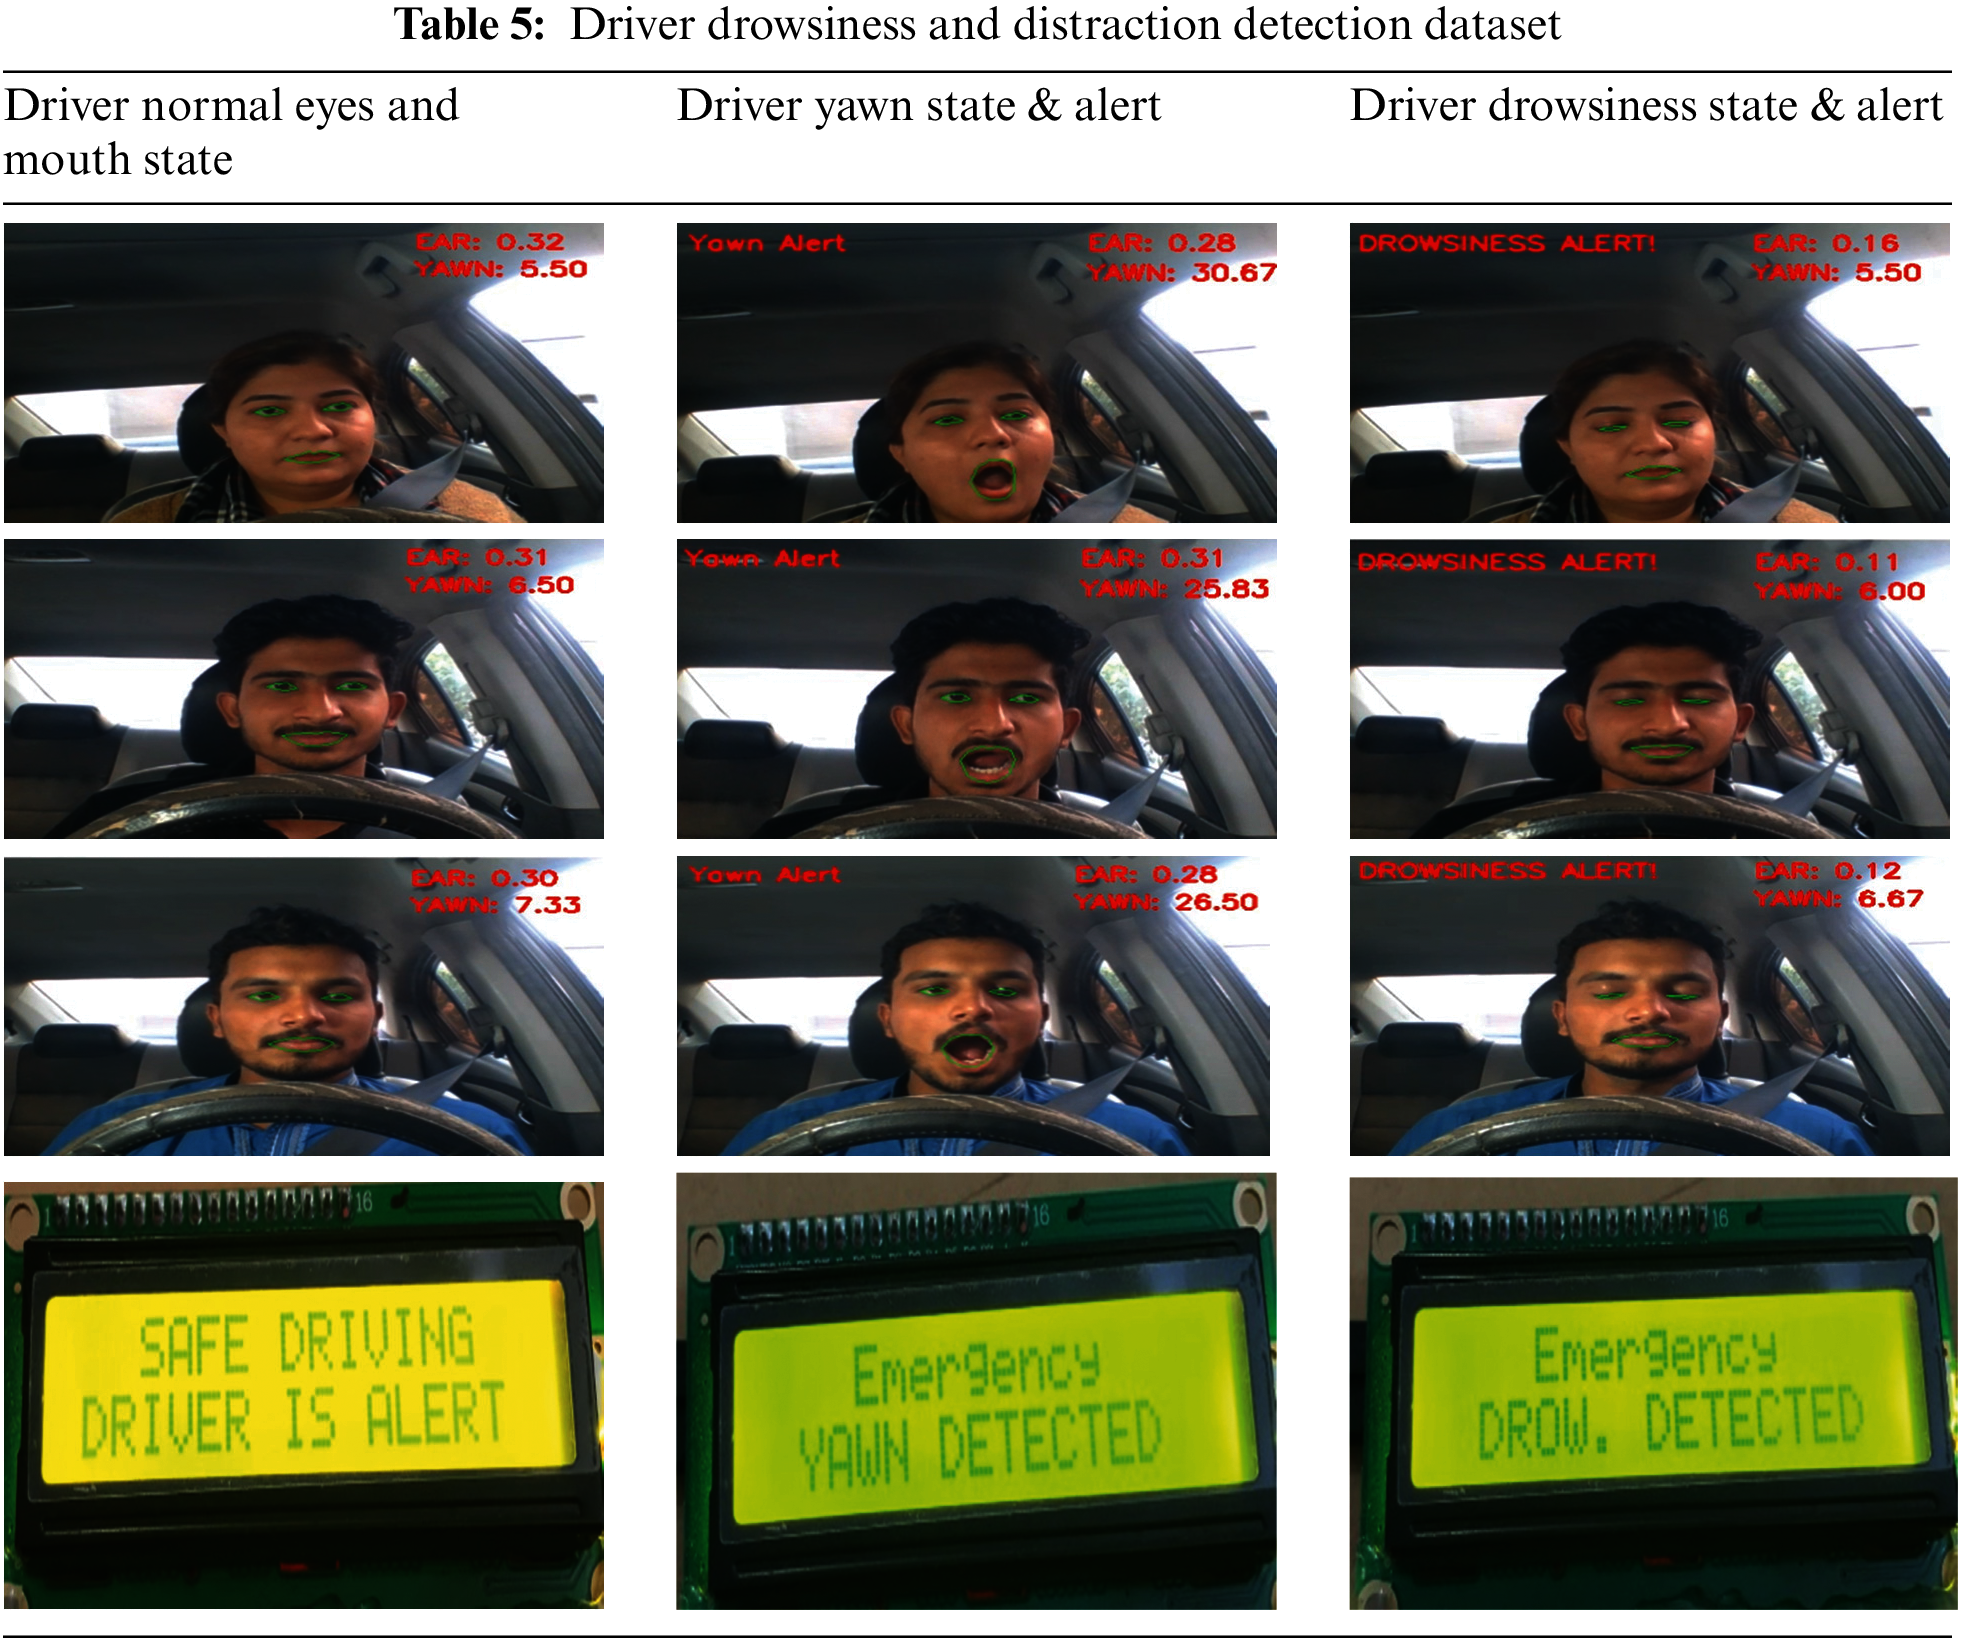
Table 5 above shows a dataset that has been prepared with different driver’s table’s three aspects under consideration are the driver’s normal state in which the eyes and mouth aspect ratio was normal than in the second column yawn and third drowsiness status was detected.
Fig. 13, below shows an alert sent message shown on the LCD screen and how the GSM module will be able to send alerts to driver emergency contacts and law enforcement agencies.

Figure 13: Alert message sent and shown on the mobile phone
Fig. 13, shows that an alert message was sent to the contact number that has been added, and an alert message shown on the LCD screen showing that in the next figure message sent and received on a mobile phone has been shown about the driver’s drowsiness or yawning.
The system will sound an alarm using a specified play sound library with a warning message to the driver if this observation occurs three times in a row. If somehow the driver doesn’t respond following three buzzers, an alert message will be issued to law enforcement authorities. Table 6 below shows various research on driver drowsiness with their accuracy as well as proposed system accuracy.
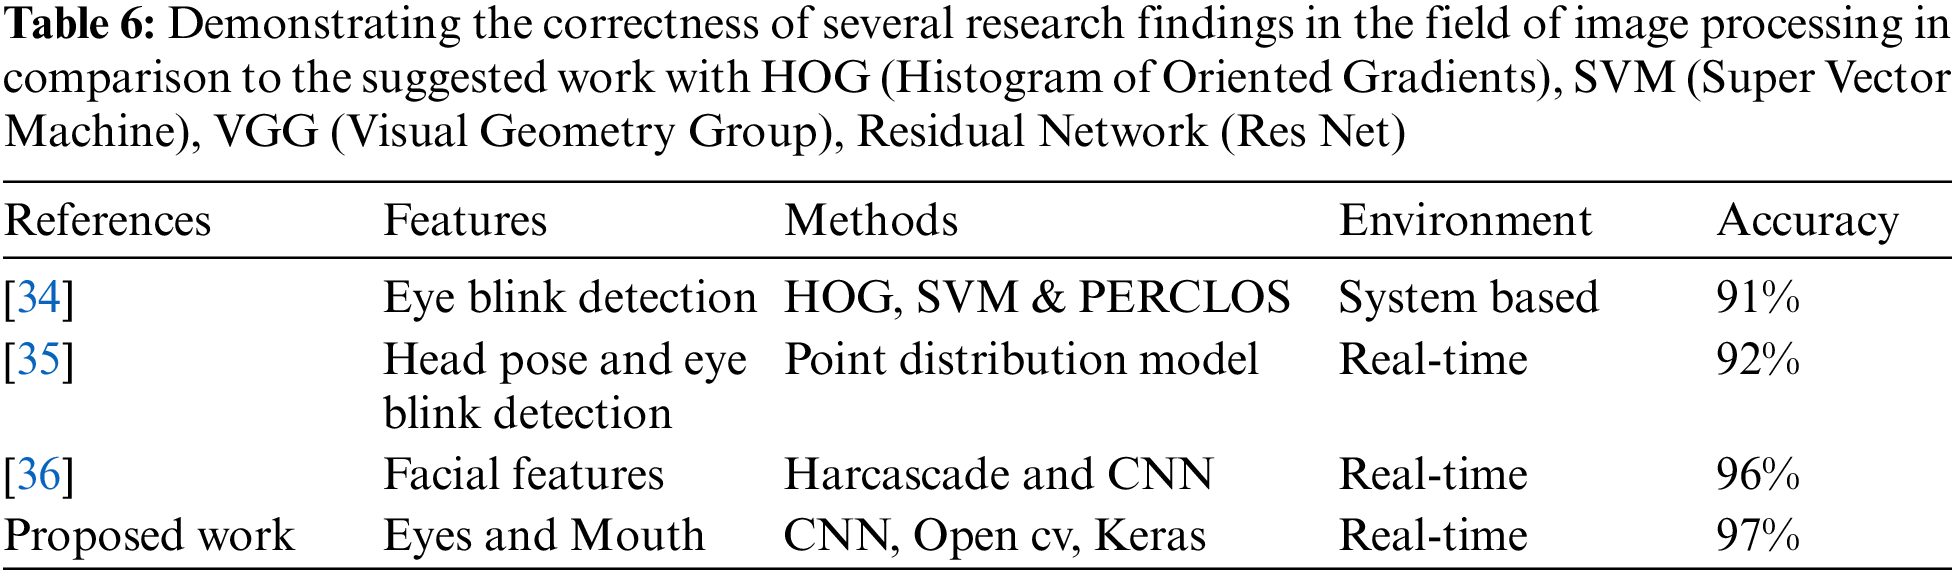
Table 6 above shows the different algorithm’s accuracy, and it’s been shown that the proposed work has been given more accuracy than any other methods mentioned. Our main target is the eyes region and mouth region specifically and great accuracy has been achieved.
For our object detection, we used MS COCO, which has various classes. The precision and recall values have been given for comparison in Table 7 below. The F1 score we were able to achieve was 99.7.
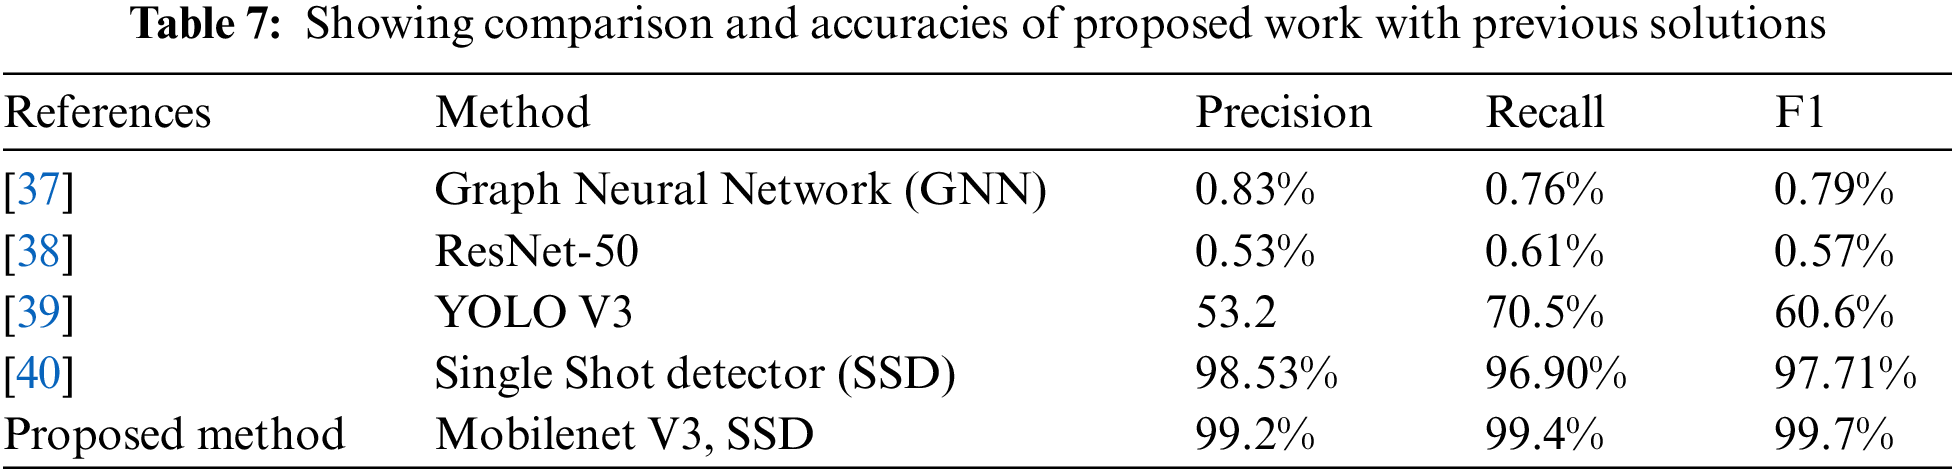
Below, Table 7 compares different authors’ data accuracy with our proposed system accuracy for object detection. This table shows a comparison of various author works with Feature Enhanced Single shot detector (FE SSD) You Only Look Once (YOLO) to our proposed work.
It’s been seen in Table 7 above that as compared to different models for object detections, Mobile-Net version 3 single shot detectors have shown the highest value of our F1 score with 99.7%. This version of the proposed work shows a greater F1 score with precision and recall values than any previous models.
The detection of several objects that were employed by the driver while driving is displayed in Table 8 below, in which different aspects of objects detections have been taken into consideration.
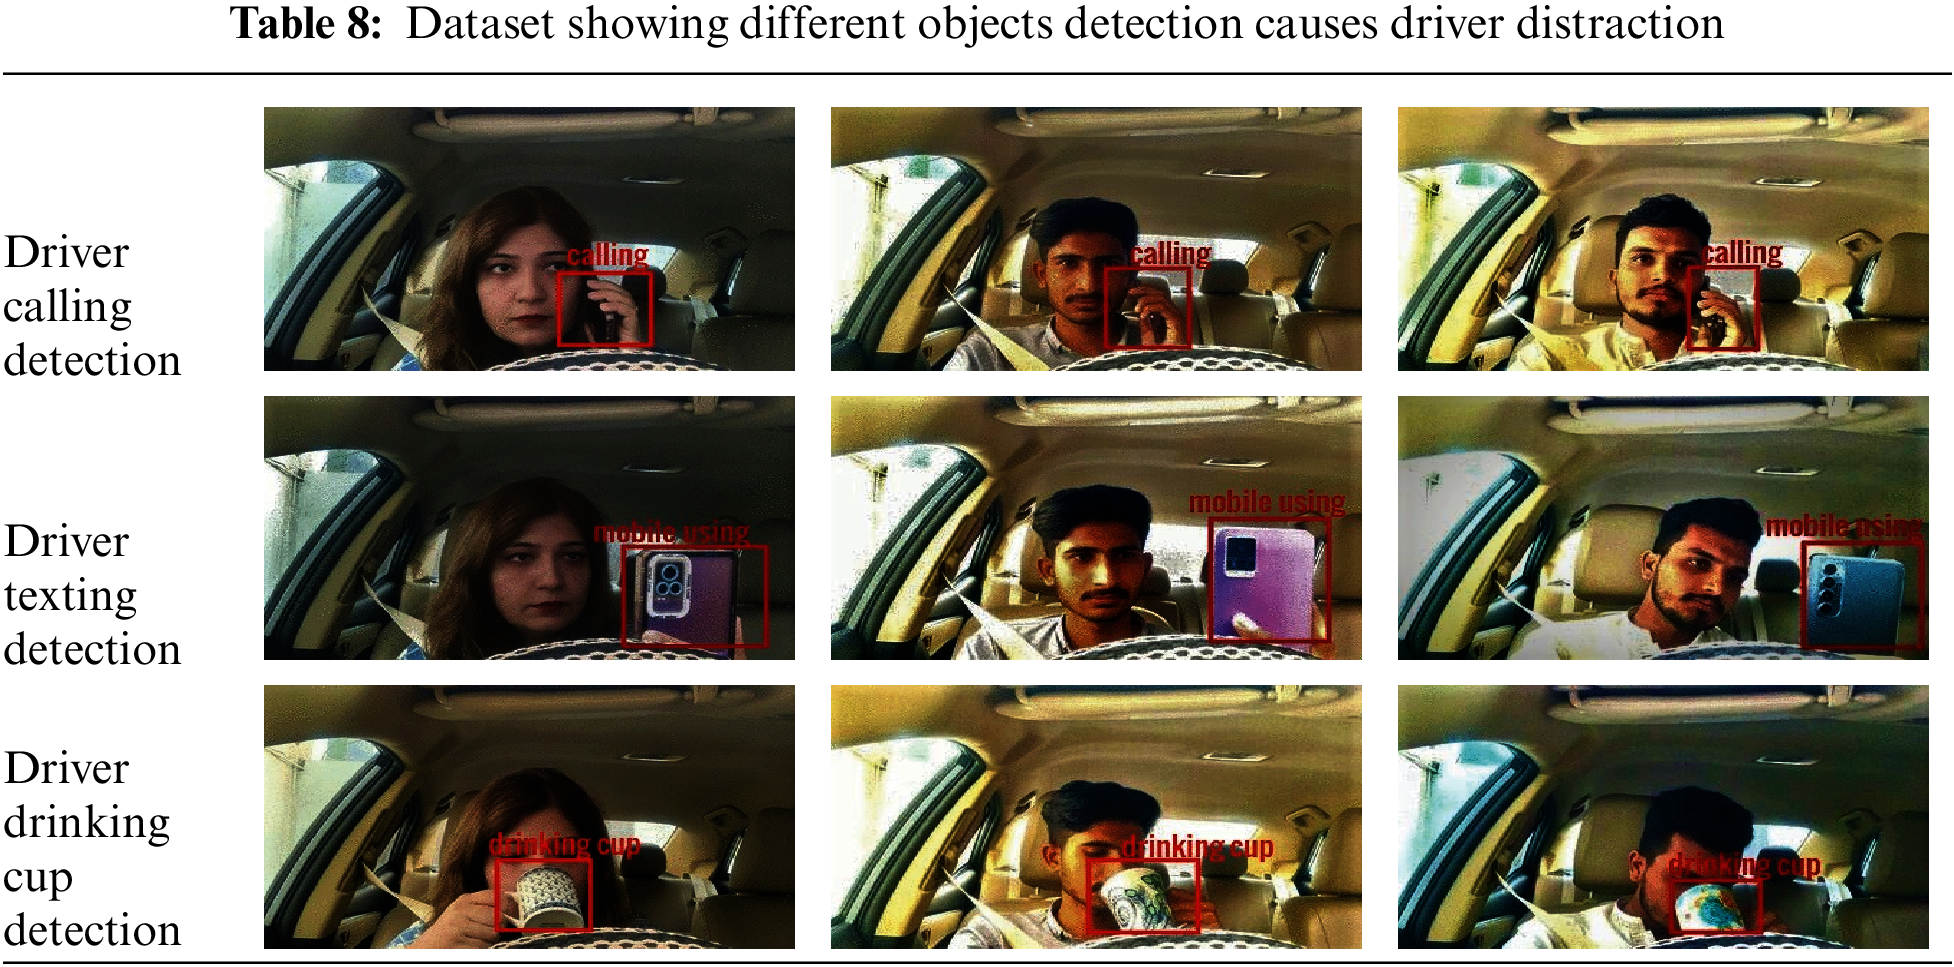
The detection of several objects that were employed by the driver while driving is displayed in Table 8 above.
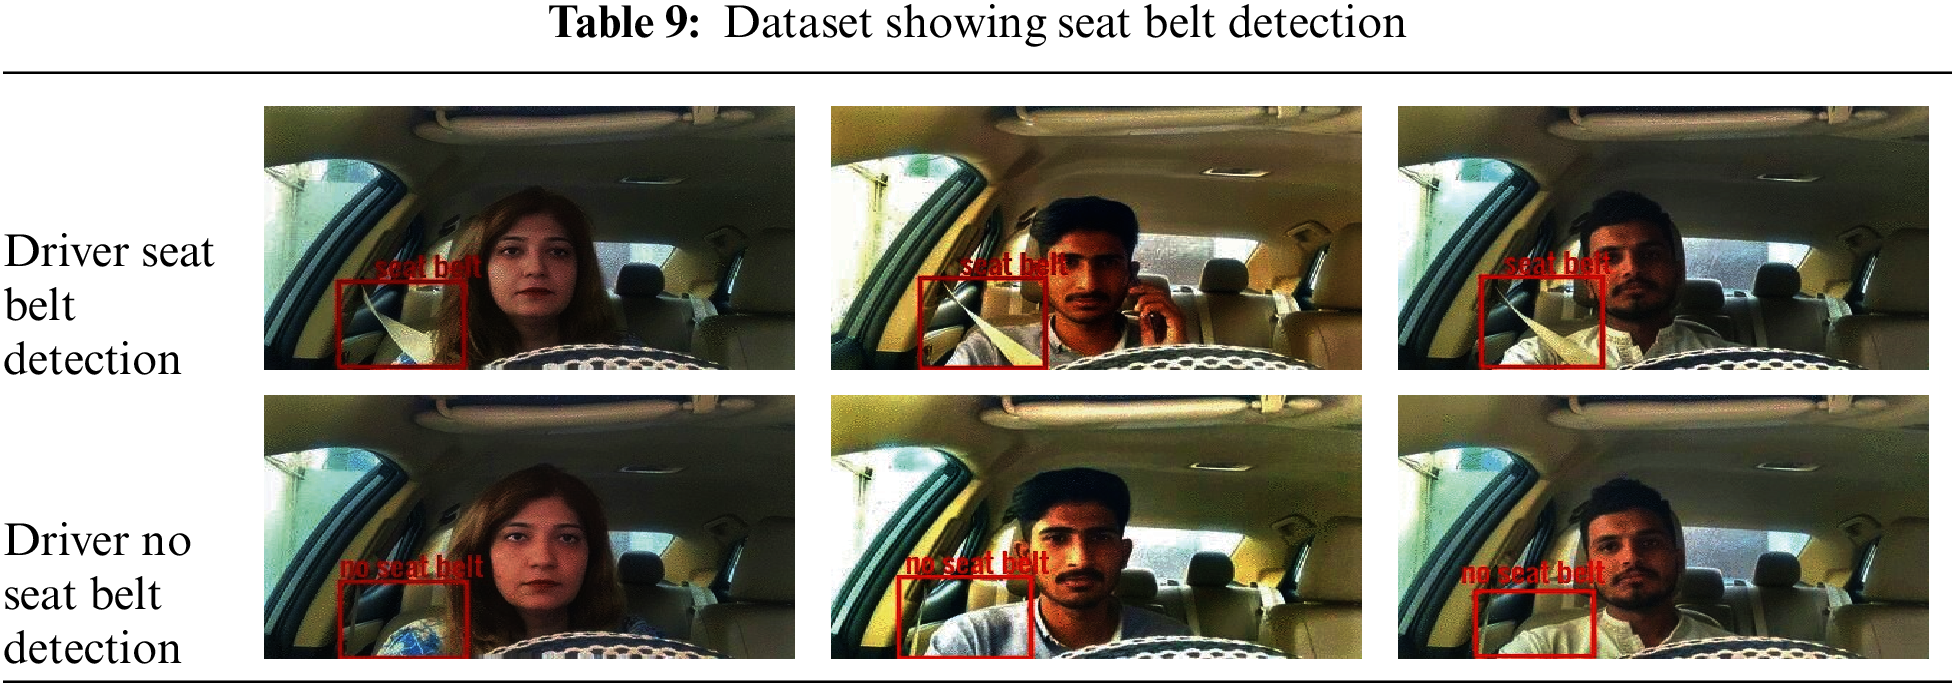
Table 9 above shows if the driver is wearing a seat belt or not detection. Driver distraction can be recognized by the system as soon as it reaches a certain threshold, allowing the driver to be warned in time to prevent any injury. Because the pre-trained models employed in the method are very specific for object detection, they produce good results quickly while utilizing a small amount of memory. Wearing the seat belt will also be detected using the same methodology of Mobile-Net SSD.
By using Keras and TensorFlow with the use of Mobile net SSD, we were able to achieve great accuracy and precision that has not been achieved with any algorithm before. We in this research paper present a novel approach for driver drowsiness, seat belt, and distraction detection system using Convolutional Neural Network. Wearing the seat belt is essential for every person during driving but, many times in emergencies or in a hurry people forget to wear it, so our system will indicate if this issue occurs. Use of facial features including eyes as well as mouth region to calculate the area of attention and then eye and mouth aspect ratio has been calculated and Keras classifier has been used with open CV to detect drowsiness and yawn. For different object detections that distract driver attention during driving, Mobile net SSD has been used. The same Mobile net SSD has been used to detect seat belt wearing. Three consecutive Alert messages with a buzzer will be given to the driver to avoid drowsiness, seat belt wearing, and distraction. After that, if the driver’s response is negative after three consecutive alarms, sending a mobile message and the location of the vehicle using GSM can also help in alerting the driver and stopping any harmful event to occur. Presented techniques used in this paper can work more efficiently and robustly as compared to different techniques used by various researchers and more promising results can be achieved. However, there is much that can be improved in mentioned techniques to give more precise and accurate statistics.
The utilization of external elements for more accurate and thorough measurements of weariness and sleepiness can be the focus of this paper’s future work. Weather conditions, vehicle conditions, sleeping hours, and mechanical data are some other variables that may be considered. In the future, further work can be done to automate the zoom on the eyeballs after they are localized. In the future, we will test several hypotheses, attempt to increase accuracy at night and in bad weather, and generally try to increase object detection accuracy. We want to ensure that the driver and any passengers in the vehicle always wear safety seat belts for future prospective. The challenge will be handled in the future by utilizing edge computing’s advantages to speed up detection and lower latency. We will test a few approaches to further improve our results. We’ll work on taking the driver’s head poster into account. Also, we will use AI to drive the automobile if the driver is sleepy or preoccupied.
Acknowledgement: The authors extend their appreciation to the Deputyship for Research & Innovation, Ministry of Education in Saudi Arabia for funding this research work through Project Number MoE-IF-UJ-22-4100409-1.
Funding Statement: The authors extend their appreciation to the Deputyship for Research & Innovation, Ministry of Education in Saudi Arabia for funding this research work through Project Number MoE-IF-UJ-22-4100409-1.
Conflicts of Interest: The authors declare that they have no conflicts of interest to report regarding the present study.
References
1. “Road traffic injuries,” 2022. [Online]. Available: https://www.who.int/news-room/fact-sheets/detail/road-traffic-injuries [Google Scholar]
2. A. Bener, E. Yildirim, T. Özkan and T. Lajunen, “Driver sleepiness, fatigue, careless behavior and risk of motor vehicle crash and injury: Population based case and control study,” Journal of Traffic and Transportation Engineering (English Edition), vol. 4, no. 5, pp. 496–502, 2017. https://doi.org/10.1016/J.JTTE.2017.07.005 [Google Scholar] [CrossRef]
3. “File: People killed in road accidents, by country, 2013 and 2018 (rate). png-statistics explained,” 2020. [Online]. Available: https://ec.europa.eu/eurostat/statistics-explained/index.php?title=File:People_killed_in_road_accidents,_by_country,_2013_and_2018_(rate).png&oldid=482857 [Google Scholar]
4. “Transport-road accidents-OECD data,” 2021. [Online]. Available: https://data.oecd.org/transport/road-accidents.htm [Google Scholar]
5. “At least 20 killed in Pakistan as bus-tanker crash causes fire news Al Jazeera,” 2022. [Online]. Available: https://www.aljazeera.com/news/2022/8/16/at-least-20-killed-in-pakistan-as-bus-tanker-crash-causes-fire [Google Scholar]
6. “Reported road casualties Great Britain, annual report: 2021-GOV.UK,” 2022. [Online]. Available: https://www.gov.uk/government/statistics/reported-road-casualties-great-britain-annual-report-2021/reported-road-casualties-great-britain-annual-report-2021 [Google Scholar]
7. “Traffic deaths decreased in 2018, but still 36,560 people died NHTSA,” 2019. [Online]. Available: https://www.nhtsa.gov/traffic-deaths-decreased-2018-still-36560-people-died [Google Scholar]
8. “NHTSA releases 2020 traffic crash fatality data FARS NHTSA,” 2022. [Online]. Available: https://www.nhtsa.gov/press-releases/2020-traffic-crash-data-fatalities [Google Scholar]
9. “U.S. traffic deaths hit 16-year high in 2021, DOT says,” 2022. [Online]. Available: https://www.cnbc.com/2022/05/17/us-traffic-deaths-hit-16-year-high-in-2021-dot-says.html [Google Scholar]
10. M. L. Jackson, R. J. Croft, G. A. Kennedy, K. Owens and M. E. Howard, “Cognitive components of simulated driving performance: Sleep loss effects and predictors,” Accid. Anal. Prev., vol. 50, pp. 438–444, 2013. https://doi.org/10.1016/j.aap.2012.05.020 [Google Scholar] [PubMed] [CrossRef]
11. M. H. Smolensky, L. di Milia, M. M. Ohayon and P. Philip, “Sleep disorders, medical conditions, and road accident risk,” Accid. Anal. Prev., vol. 43, no. 2, pp. 533–548, 2011. https://doi.org/10.1016/j.aap.2009.12.004 [Google Scholar] [PubMed] [CrossRef]
12. D. de Waard, The Measurement of Drivers’ Mental Workload, The Traffic Research Centre VSC, University of Groningen, Thesis fully internal (DIVUniversity of Groningen, 1996. [Google Scholar]
13. A. Behnood and F. L. Mannering, “The effects of drug and alcohol consumption on driver-injury severities in single-vehicle crashes,” Traffic Inj. Prev., vol. 18, no. 5, pp. 456–462, 2017. https://doi.org/10.1080/15389588.2016.1262540 [Google Scholar] [PubMed] [CrossRef]
14. “Ford driver alert system,” 2022. [Online]. Available: https://www.ford.com/support/how-tos/ford-technology/driver-assist-features/what-is-the-driver-alert-system/ [Google Scholar]
15. J. Dybała, P. Skalski, D. Sałapatek and P. Czapski, “Driver drowsiness detection systems prototype of a magnetorheological damper with a magnetorheological elastomer-research and development view project,” Proceedings of the Institute of Vehicles, vol. 3, no. 112, pp. 41–48, 2017. [Online]. Available: https://www.researchgate.net/publication/319464008 [Google Scholar]
16. R. Jabbar, K. Al-Khalifa, M. Kharbeche, W. Alhajyaseen, M. Jafari et al., “Real-time driver drowsiness detection for android application using deep neural networks techniques,” Procedia Computer Sci, vol. 130, pp. 400–407, 2018. https://doi.org/10.1016/j.procs.2018.04.060 [Google Scholar] [CrossRef]
17. S. P. Cheon and S. J. Kang, “Sensor-based driver condition recognition using support vector machine for the detection of driver drowsiness,” IEEE Intelligent Vehicles Symposium, Proceedings, pp. 1517–1522, 2017. https://doi.org/10.1109/IVS.2017.7995924 [Google Scholar] [CrossRef]
18. C. V. Anilkumar, A. Mansoor, R. Sahana, R. Thejashwini and P. S. Anisha, “Design of drowsiness, heart beat detection system and alertness indicator for driver safety,” in 2016 IEEE Int. Conf. on Recent Trends in Electronics, Information and Communication Technology, RTEICT 2016-Proc., Bangalore, India, pp. 937–941, January 2017. https://doi.org/10.1109/RTEICT.2016.7807966 [Google Scholar] [CrossRef]
19. J. Rajevenceltha, V. H. Gaidhane and V. Anjana, “A novel approach for drowsiness detection using local binary patterns and histogram of gradients,” in 2019 Int. Conf. on Electrical and Computing Technologies and Applications, ICECTA 2019, Ras Al Khaimah, United Arab Emirates, November 2019. https://doi.org/10.1109/ICECTA48151.2019.8959669 [Google Scholar] [CrossRef]
20. S. Tateno, X. Guan, R. Cao and Z. Qu, “Development of drowsiness detection system based on respiration changes using heart rate monitoring,” in 2018 57th Annual Conf. of the Society of Instrument and Control Engineers of Japan, SICE 2018, Nara, Japan, pp. 1664–1669, October 2018. https://doi.org/10.23919/SICE.2018.8492599 [Google Scholar] [CrossRef]
21. K. Fujiwara, E. Abe, K. Kamata, C. Nakayama, Y. Suzuki et al., “Heart rate variability-based driver drowsiness detection and its validation with EEG,” IEEE Trans. Biomed. Eng., vol. 66, no. 6, pp. 1769–1778, 2019. https://doi.org/10.1109/TBME.2018.2879346 [Google Scholar] [PubMed] [CrossRef]
22. F. Guede-Fernández, M. Fernández-Chimeno, J. Ramos-Castro and M. A. García-González, “Driver drowsiness detection based on respiratory signal analysis,” IEEE Access, vol. 7, pp. 81826–81838, 2019. https://doi.org/10.1109/ACCESS.2019.2924481 [Google Scholar] [CrossRef]
23. W. J. Chang, L. B. Chen and Y. Z. Chiou, “Design and implementation of a drowsiness-fatigue-detection system based on wearable smart glasses to increase road safety,” IEEE Transactions on Consumer Electronics, vol. 64, no. 4, pp. 461–469, 2018. https://doi.org/10.1109/TCE.2018.2872162 [Google Scholar] [CrossRef]
24. Y. M. Tang, L. Zhang, G. Q. Bao, F. J. Ren and W. Pedrycz, “Symmetric implicational algorithm derived from intuitionistic fuzzy entropy,” Iranian Journal of Fuzzy Systems, vol. 19, no. 4, pp. 27–44, 2022. https://doi.org/10.22111/ijfs.2022.7084 [Google Scholar] [CrossRef]
25. Y. Tang, Z. Pan, W. Pedrycz, F. Ren and X. Song, “Viewpoint-based kernel fuzzy clustering with weight information granules,” IEEE Trans Emerge Top Computer Intel, 2022. https://doi.org/10.1109/TETCI.2022.3201620 [Google Scholar] [CrossRef]
26. Y. Zhang, J. Chu, L. Leng and J. Miao, “Mask-refined R-CNN: A network for refining object details in instance segmentation,” Sensors (Switzerland), vol. 20, no. 4, 2020. https://doi.org/10.3390/s20041010 [Google Scholar] [PubMed] [CrossRef]
27. J. Chu, Z. Guo and L. Leng, “Object detection based on multi-layer convolution feature fusion and online hard example mining,” IEEE Access, vol. 6, pp. 19959–19967, 2018. https://doi.org/10.1109/ACCESS.2018.2815149 [Google Scholar] [CrossRef]
28. L. Leng, J. Zhang, J. Xu, M. K. Khan and K. Alghathbar, “Dynamic weighted discrimination power analysis in DCT domain for face and palmprint recognition,” in 2010 Int. Conf. on Information and Communication Technology Convergence (ICTC), Jeju, pp. 467–471, 2010. https://doi.org/10.1109/ICTC.2010.5674791 [Google Scholar] [CrossRef]
29. E. Lygouras, N. Santavas, A. Taitzoglou, K. Tarchanidis, A. Mitropoulos et al., “Unsupervised human detection with an embedded vision system on a fully autonomous uav for search and rescue operations,” Sensors (Basel), vol. 19, no. 16, 2019. https://doi.org/10.3390/S19163542 [Google Scholar] [PubMed] [CrossRef]
30. Y. Feng, K. Tse, S. Chen, C. Y. Wen and B. Li, “Learning-based autonomous uav system for electrical and mechanical (E&m) device inspection,” Sensors (Switzerland), vol. 21, no. 4, pp. 1–23, 2021. https://doi.org/10.3390/S21041385 [Google Scholar] [PubMed] [CrossRef]
31. I. H. Choi, C. H. Jeong and Y. G. Kim, “Tracking a driver’s face against extreme head poses and inference of drowsiness using a hidden markov model,” Applied Sciences, vol. 6, no. 5, pp. 137, 2016. https://doi.org/10.3390/APP6050137 [Google Scholar] [CrossRef]
32. X. Zhang, X. Zhou, M. Lin and J. Sun, “ShuffleNet: An extremely efficient convolutional neural network for mobile devices,” in Proc. of the IEEE Computer Society Conf. on Computer Vision and Pattern Recognition, Salt Lake City, UT, USA, pp. 6848–6856, July 2017. https://doi.org/10.48550/arxiv.1707.01083 [Google Scholar] [CrossRef]
33. A. Chowdhury, R. Shankaran, M. Kavakli and M. M. Haque, “Sensor applications and physiological features in drivers’ drowsiness detection: A review,” IEEE Sens. J., vol. 18, no. 8, pp. 3055–3067, 2018. https://doi.org/10.1109/JSEN.2018.2807245 [Google Scholar] [CrossRef]
34. L. Pauly and D. Sankar, “Detection of drowsiness based on HOG features and SVM classifiers,” in 2015 IEEE Int. Conf. on Research in Computational Intelligence and Communication Networks (ICRCICN), Kolkata, India, pp. 181–186, November 2015. https://doi.org/10.1109/ICRCICN.2015.7434232 [Google Scholar] [CrossRef]
35. S. Thornton, B. Flowers and S. Dey, “Multi-source feature fusion for object detection association in connected vehicle environments,” IEEE Access, vol. 10, pp. 131841–131854, 2022. https://doi.org/10.1109/ACCESS.2022.3228735 [Google Scholar] [CrossRef]
36. R. Tamanani, R. Muresan and A. Al-Dweik, “Estimation of driver vigilance status using real-time facial expression and deep learning,” IEEE Sens. Lett., vol. 5, no. 5, 2021. https://doi.org/10.1109/LSENS.2021.3070419 [Google Scholar] [CrossRef]
37. L. Zhao and S. Li, “Object detection algorithm based on improved YOLOv3,” Electronics (Switzerland), vol. 9, no. 3, 2020. https://doi.org/10.3390/electronics9030537 [Google Scholar] [CrossRef]
38. J. Chen, M. Xie, Z. Xing, C. Chen, X. Xu et al., “Object detection for graphical user interface: Old fashioned or deep learning or a combination?” in ESEC/FSE 2020-Proc. of the 28th ACM Joint Meeting European Software Engineering Conf. and Symp. on the Foundations of Software Engineering, Sacramento, California, United States, pp. 1202–1214, November 2020. https://doi.org/10.1145/3368089.3409691 [Google Scholar] [CrossRef]
39. K. Guo, X. Li, M. Zhang, Q. Bao and M. Yang, “Real-time vehicle object detection method based on multi-scale feature fusion,” IEEE Access, vol. 9, pp. 115126–115134, 2021. https://doi.org/10.1109/ACCESS.2021.3104849 [Google Scholar] [CrossRef]
40. S. Soares, T. Monteiro, A. Lobo, A. Couto, L. Cunha et al., “Analyzing driver drowsiness: From causes to effects,” Sustainability (Switzerland), vol. 12, no. 5, 2020. https://doi.org/10.3390/su12051971 [Google Scholar] [CrossRef]
Cite This Article
 Copyright © 2023 The Author(s). Published by Tech Science Press.
This work is licensed under a Creative Commons Attribution 4.0 International License , which permits unrestricted use, distribution, and reproduction in any medium, provided the original work is properly cited.
 Downloads
 Citation Tools
.png&oldid=482857)