
 Submit a Paper
 Propose a Special lssue
 Open Access
ARTICLE

Predicting Lumbar Spondylolisthesis: A Hybrid Deep Learning Approach
1 Department of Computer Application, SAGE University, Indore, 452012, Madhya Pradesh, India
2 IAC, SAGE University, Indore, 452012, Madhya Pradesh, India
3 Shivang College of Physiotherapy, Ratlam, 4570021, Madhya Pradesh, India
4 Medi-Caps University, Rau Indore, Madhya Pradesh, 453331, India
5 Chitkara University Institute of Engineering and Technology, Chitkara University, Punjab, India
6 Department of Electronics and Communication Engineering, Kuwait College of Science and Technology (KCST), Doha, Kuwait
7 Department of Computer Science and Engineering, Sreenivasa Institute of Technology and Management Studies, Chittoor, Andra Pradesh, India
* Corresponding Authors: Shweta Agrawal. Email: ; Abolfazl Mehbodniya. Email:
Intelligent Automation & Soft Computing 2023, 37(2), 2133-2151. https://doi.org/10.32604/iasc.2023.039836
Received 20 February 2023; Accepted 14 April 2023; Issue published 21 June 2023
 View Full Text
 Download PDF
Abstract
Spondylolisthesis is a chronic disease, and a timely diagnosis of it may help in avoiding surgery. Disease identification in x-ray radiographs is very challenging. Strengthening the feature extraction tool in VGG16 has improved the classification rate. But the fully connected layers of VGG16 are not efficient at capturing the positional structure of an object in images. Capsule network (CapsNet) works with capsules (neuron clusters) rather than a single neuron to grasp the properties of the provided image to match the pattern. In this study, an integrated model that is a combination of VGG16 and CapsNet (S-VCNet) is proposed. In the model, VGG16 is used as a feature extractor. After feature extraction, the output is fed to CapsNet for disease identification. A private dataset is used that contains 466 X-ray radiographs, including 186 images displaying a spine with spondylolisthesis and 280 images depicting a normal spine. The suggested model is the first step towards developing a web-based radiological diagnosis tool that can be utilized in outpatient clinics where there are not enough qualified medical professionals. Experimental results demonstrate that the developed model outperformed the other models that are used for lumbar spondylolisthesis diagnosis with 98% accuracy. After the performance check, the model has been successfully deployed on the Gradio web app platform to produce the outcome in less than 20 s.Keywords
Spondylolisthesis is the term for the displacement of a vertebrae over the next one [1]. It is a chronic disease that is caused by continuous stress (either by load bearing or bad posture) on the lumbar vertebrae (pars interarticularis). It affects persons of all ages, and a recent study shows that nowadays it is found most commonly in school going children (6%–7%), adults (18%), and elite athletes (7%–8%) [2,3]. According to a study, approximately 50% of low back pain problems in athletes are caused by spondylolisthesis due to hyperextension [4]. 85%–95% of the time, lumbar spondylolisthesis is found between the fifth lumbar vertebrae (L5) and the first sacral vertebrae (S1). The L5-S1 motion segment is the most common region [5,6]. Fig. 1 highlights both regions where lumbar spondylolisthesis may occur.
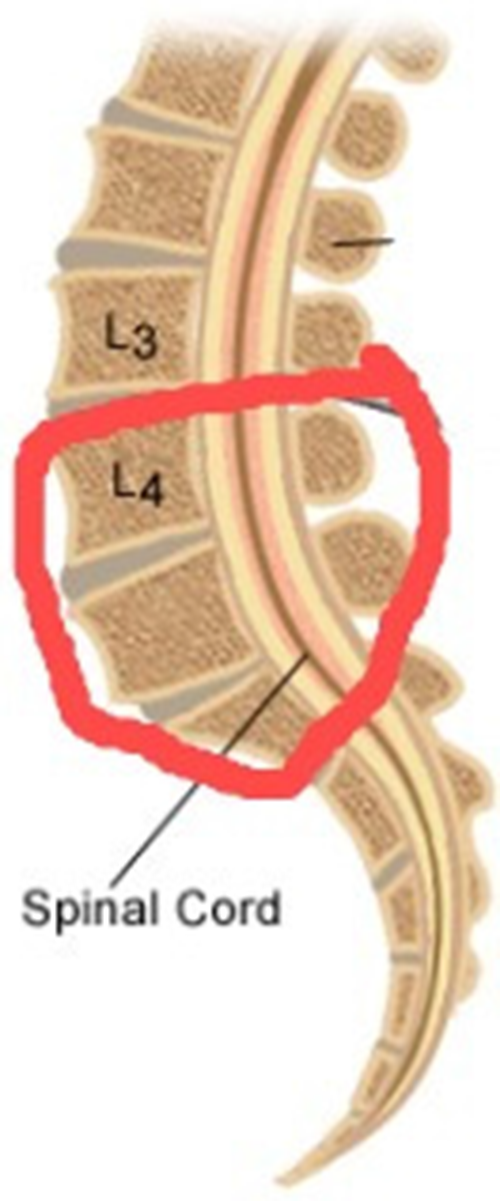
Figure 1: Lumbar spondylolisthesis region
Spondylolisthesis diagnosis requires radiological images produced by using Magnetic Resonance Images (MRI), Computer Tomography (CT), and X-ray radiography technologies [7]. But the identification is commonly done qualitatively in today’s clinical practice. Although Meyerding grading provides for a better quantitative assessment of spondylolisthesis, it still relies on time-consuming and inaccurate physical measurements [8].
A CT scan and an MRI require an expert person but an X-ray can be done by a technician, and it is also the first line of investigation [9,10], i.e., before proceeding with any investigation, the doctor prescribed X-ray first. If there is any doubt about in X-rays, then only CT or MRI scans are prescribed. These scans are not easily available in rural areas and very costly [11,12].
Modern healthcare systems make extensive use of Machine Learning (ML) technology for automated solutions that may improve the accuracy and repeatability of crucial job execution [13,14]. The Deep Learning (DL) model learns features from pictures in datasets rather than from explicit programs that must be written for each task [15]. It integrates computational statistics and data mining techniques. DL focuses on teaching computers to learn from data in the same way that humans learn from experiences [16,17].
Multidisciplinary collaboration in technology has produced unique DL models with significant potential and good results to study spondylolisthesis related concerns. A Computer Automated Diagnosis (CAD) system can interpret the number of cases immediately, and reproducible results can be generated using them. This makes an automated spondylolisthesis diagnostic technique appealing for treatment planning and follow-up This mechanism is greatly increasing measurement effectiveness [18].
Convolutional Neural Networks (CNNs) are best suited for image classification tasks. Due to CNN’s strength in recording structure and spatial information, it is used for medical images. Visual Geometry Group (VGG) is a well-known tool of CNN for resolving medical image categorization challenges. It is a strong model having a two-dimensional (2D) architecture for feature detection at different positions on targeted images. The transfer learning feature of these models made them popular among researchers. It requires less training, and modification and needs less time to produce results. It is seen in many studies that VGG has achieved results with remarkable accuracy.
Out of various variants of VGG-Net, VGG-16, and VGG-19 were the best performing models, and made public. A few models (MobileNet and ResNets) had many parameters and required a huge number of training images. When evaluated against the VGG16 model, the MobileNet and ResNets models were unable to match the accuracy it provided. It proves the superiority of the VGG16 model over other models. Even though VGG16 is ideally adapted for visual categorization but it has the following constraints:
• VGG16 lost the entity’s positional information while max pooling. It ignores a few local structures between simpler objects. However, due to down sampling, VGG16 has some limitations in terms of view invariance and information loss.
• For rotated, tilted, or other abnormal image orientations, VGG16 performs poorly.
• VGG16 proved to be time-consuming as well as requiring a lot of computing resources.
This raises issues related to developing improved disease detection techniques. Capsule network (also known as CapsNet) [19] is one of the most advanced algorithms to resolve these logical restrictions in terms of its generative and deterministic characteristics. CapsNet algorithm uses vectors, which makes it more image-sensitive than the VGG16 that had previously been used. It is a novel approach for capturing the properties and spatial relationships of features in images that has shown promise in image classification [20,21]. Multiple convolutional layers are squashed into capsules by these networks, which are subsequently exposed to nonlinearity.
Vector-based models perform poorly at getting features from images. The original capsule network is inadequate for the classification tasks that involve sophisticated internal representations. To resolve these issues, an integrated model (a combination of VGG16 and CapsNet) named S-VCNet is proposed to predict lumbar spondylolisthesis in X-ray images with better accuracy and loss minimization [22,23].
The proposed model is deployed to the Gradio web app for real time diagnosis of the disease. Furthermore, the results obtained were compared to radiologists’ manual observations. This finding directs doctors and practitioners in the proper direction for disease prediction, which can protect many susceptible people and reduce disease rates.
The following are the key goals of this paper:
• To evaluate the performance of VGG16 for lumbar spondylolisthesis diagnosis.
• To design and implement a novel hybrid model (S-VCNet) and compare its performance with VGG16.
• To implement a Gradio-based web interface for real-time diagnosis of lumbar spondylolisthesis quickly and accurately.
The subsection of article include: A review of previously available work is discussed in Section 2, model architecture is described in Section 3, details of the dataset used and the applied methodology are discussed in Section 4, result analysis and discussion are covered in Section 5, and a conclusion is given in Section 6.
This section discusses the methods used by various practitioners to identify the existence of medical disease in humans based on X-ray radiographs.
Tiwari et al. [24] have proposed the VGG-CapsNet model for COVID-19 detection in x-ray images. Experimental results suggest that VGG-CapsNet outperforms CapsNet. By integrating CNN with CapsNet, the authors overcome the problems in CNN-based decision support.
Mittal et al. [25] developed two models by integrating “convolutions with capsules” and “ensemble convolutions with capsules” for pneumonia detection using x-ray radiographs. The models have achieved a good accuracy rate.
Yousra et al. [26] presented a useful image categorization model for chest X-rays (CNN-CapsNet). Where feature extractor VGG19 was completely trained on the ImageNet dataset, and the output is passed to CapsNet’s initial feature maps to get the final classification result.
Bharati et al. [27] developed a novel integrated model (VGG + data augmentation + spatial transformer network) with CNN for lung disease diagnosis. According to the findings of this study, the integrated model takes less training time and outperforms the standalone model.
DRISTI (Diabetic Retinopathy classIfication by analyzing reTinal Images) is a study that proposes a hybrid model containing VGG16 and CapsNet to classify diabetic retinopathy. This model is developed for the detection of visual loss earlier and timely treatment of the disease [28].
Nguyen et al. [29] have compared various methods for colorectal tissue classification. The soft voting ensemble model, which included one VGG and one CapsNet model, outperformed independent or ensemble learning with a single base estimator. A hybrid capsule network was created by Boaro et al. [30] for the identification of malignancy in medical images. The VGG16 and a capsule network are coupled in the suggested design. When compared to the literature, the results produced by the suggested model were positive.
Gunasinghe et al. [31] have developed a model utilizing CNN with CapsNet to diagnose lung disorders, including combining patient information with data from chest X-rays. Toraman et al. [32] presented the difficulties in recognizing COVID-19 owing to symptoms that are similar to those of lung infections. The authors used CapsNet to create a system that was trained and evaluated for pneumonia patients.
Saif et al. [33] introduced CapsNet for musculoskeletal radiograph anomaly identification, and it has been shown that its architecture has very promising features that can assist in solving CNN’s limitations. Singh et al. [34] have proposed a method for glaucoma prediction in images using both early and late fusion. They have successfully implemented fusion based on features and image levels.
For the identification of COVID-19, Aksoy et al. [35] developed a capsule network on a cloud platform for quicker and easier processing. Abdollahi et al. [36] have applied the VGG16 model for epidemic-type identification in chest x-ray radiographs.
Sharma et al. [37] have used CapsNet with shallow architecture for COVID-19 diagnosis. They have used 5 fold-cross validation technique on the dataset having multiclass classification.
Qiu et al. [38] have developed several novel model architectures by combining various CNN models with CapsNet. The proposed models have achieved accuracy ranges from 95% to 98% for COVID-19 detection in both multi-class and binary classification.
Table 1 summarizes the literature and indicates that integrated models are used in different application fields specifically for disease detection. But very little work has been done for lumbar spondylolisthesis diagnosis and there is scope for improving accuracy and making models generalize. So, the study proposed an integrated deep learning-based web interface to diagnose lumbar spondylolisthesis.
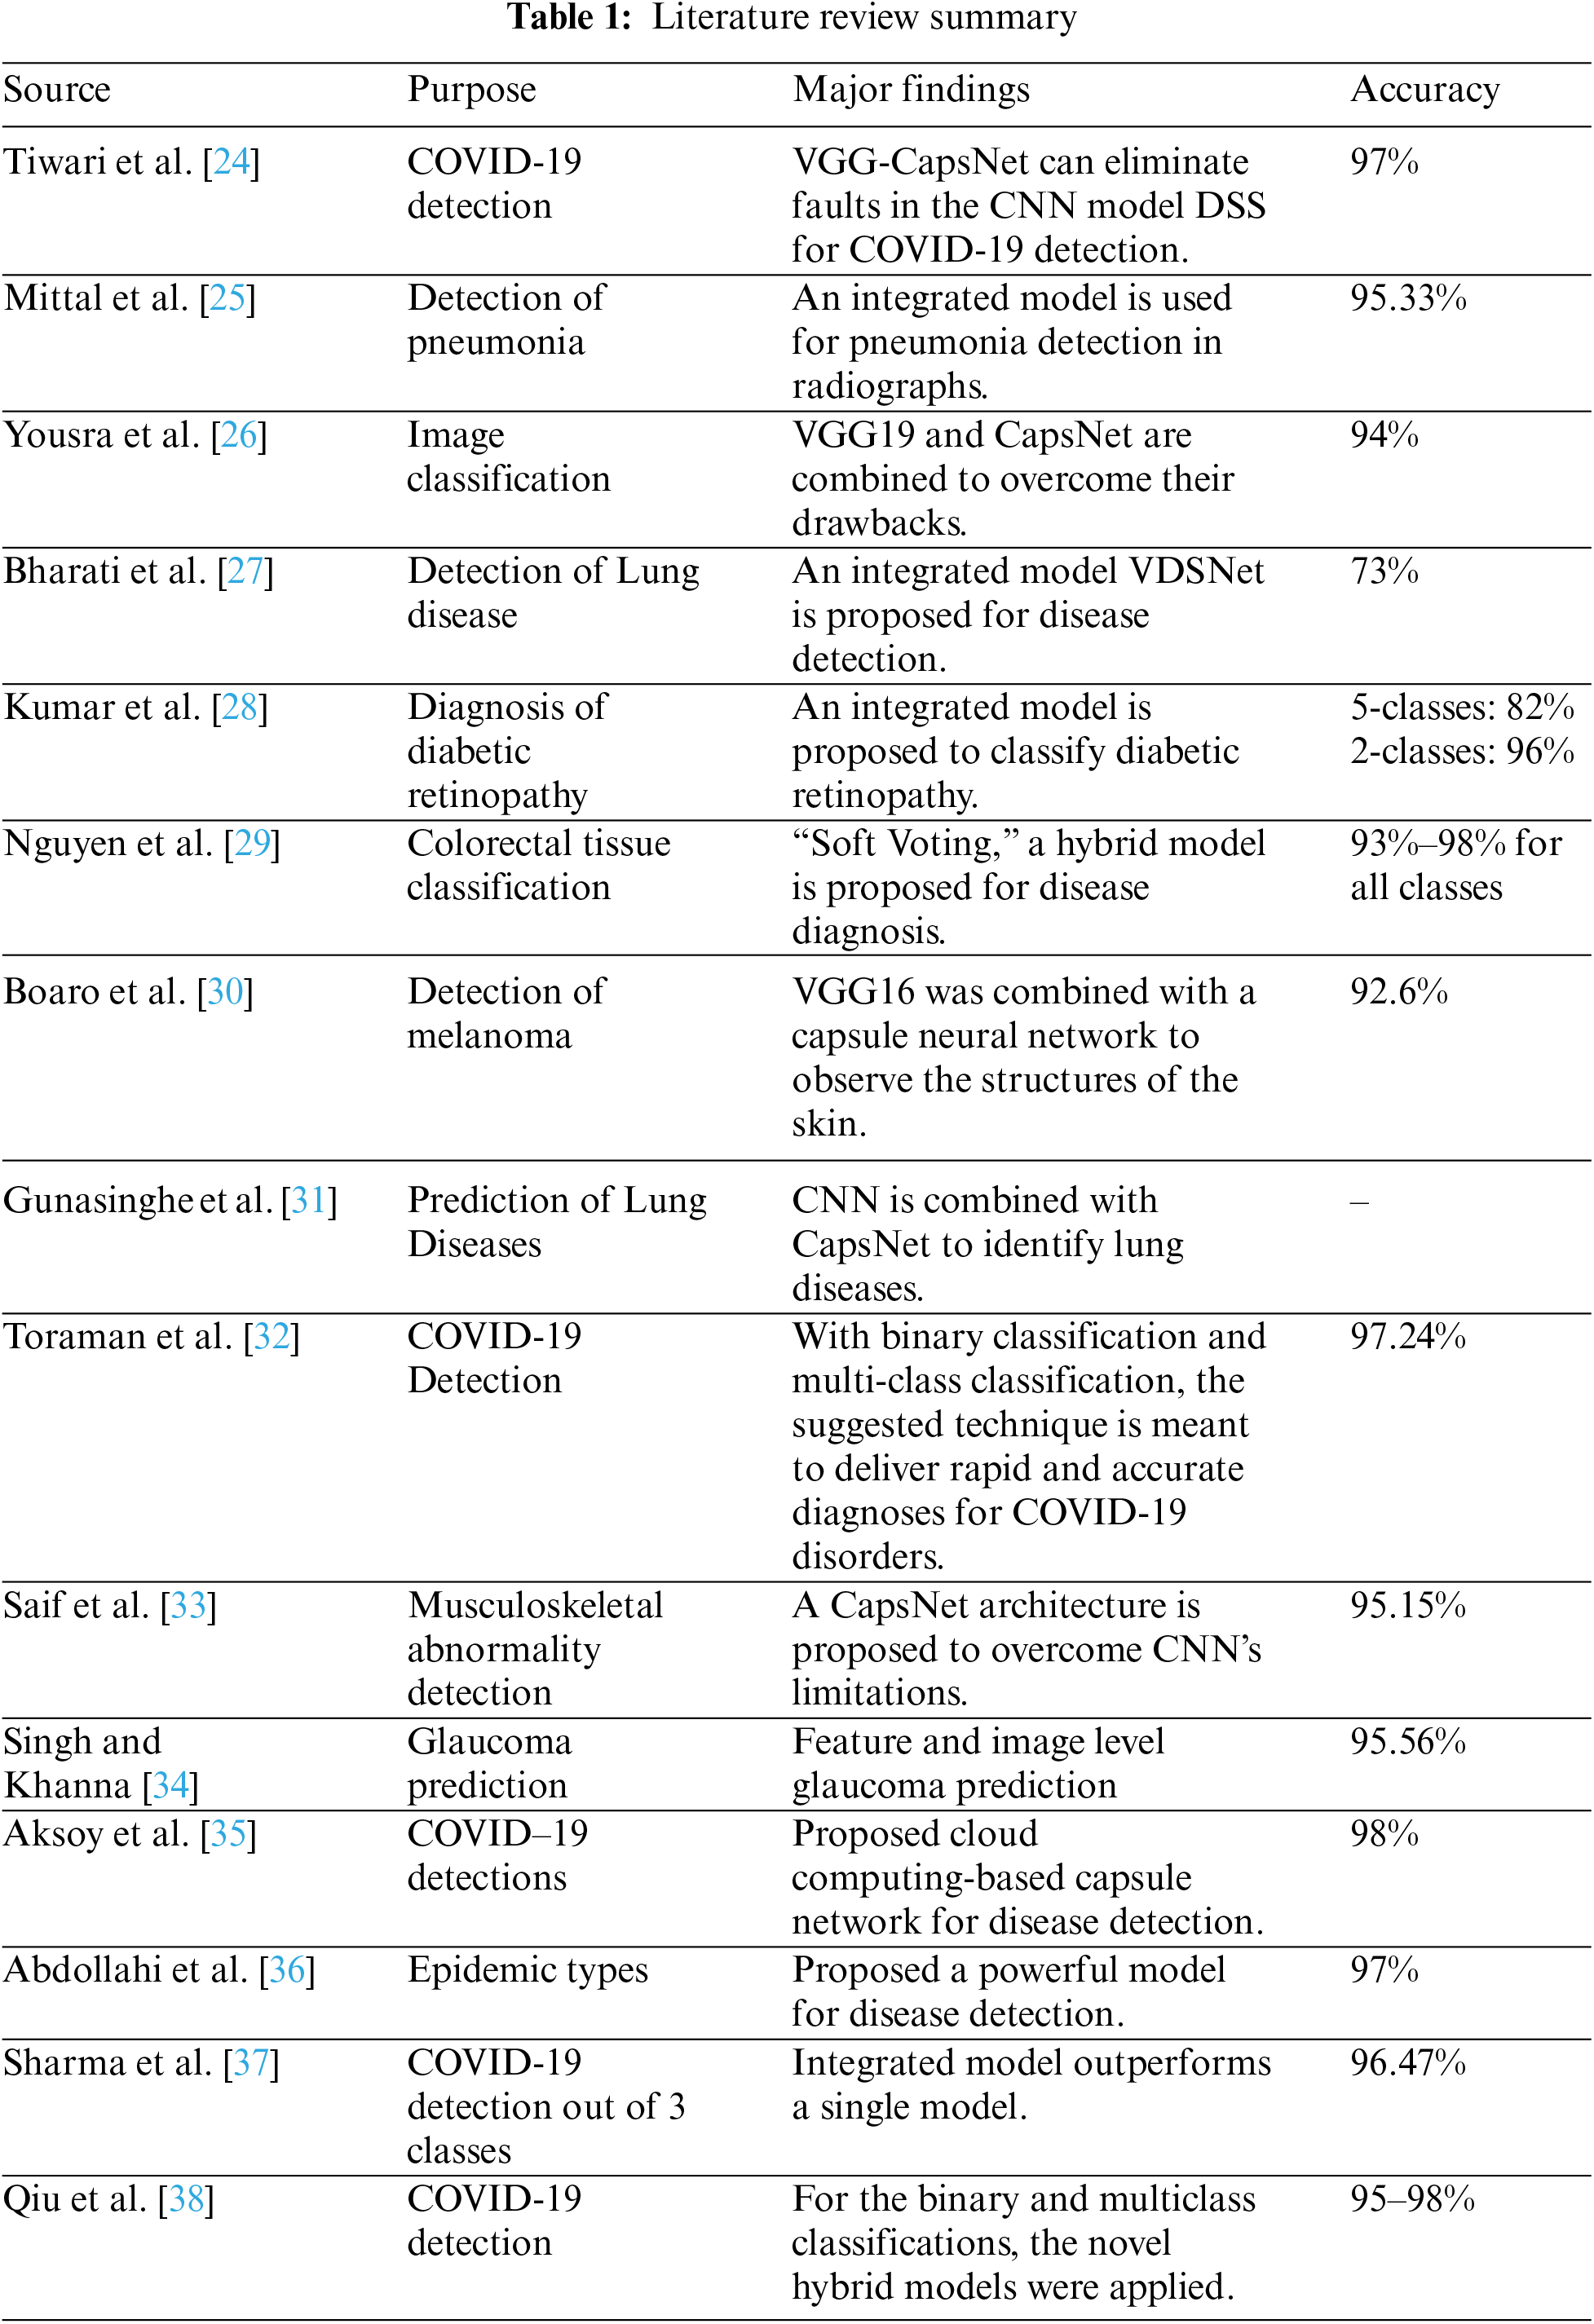
VGG-Net is a widely used CNN architecture that gains popularity due to its outstanding performance on the ImageNet dataset. TheVGG16 architecture works well with various datasets; therefore, it was chosen for this study. It consists of convolutional layers, ReLU (activation function), pooling layers, and fully connected layers. In input, a 2D convolutional layer with 3 × 3 convolutional filters was used. Images (reduced to the size of 224 × 224 pixels) are fed to the first convolution layer for detecting low-level features. It contains position definitions for lines and edge points.
An activation function (ReLU) along with max pooling is applied to all hidden layers. It uses the pixel positions for generating the feature map. This is a high-level feature used for sharing weights to reduce unnecessary or redundant load. Image area is reduced by combining a few neurons by using the pooling technique. At last, three fully connected layers were used, which contain the SoftMax function for classification tasks. VGG Net’s architecture is depicted in Fig. 2.
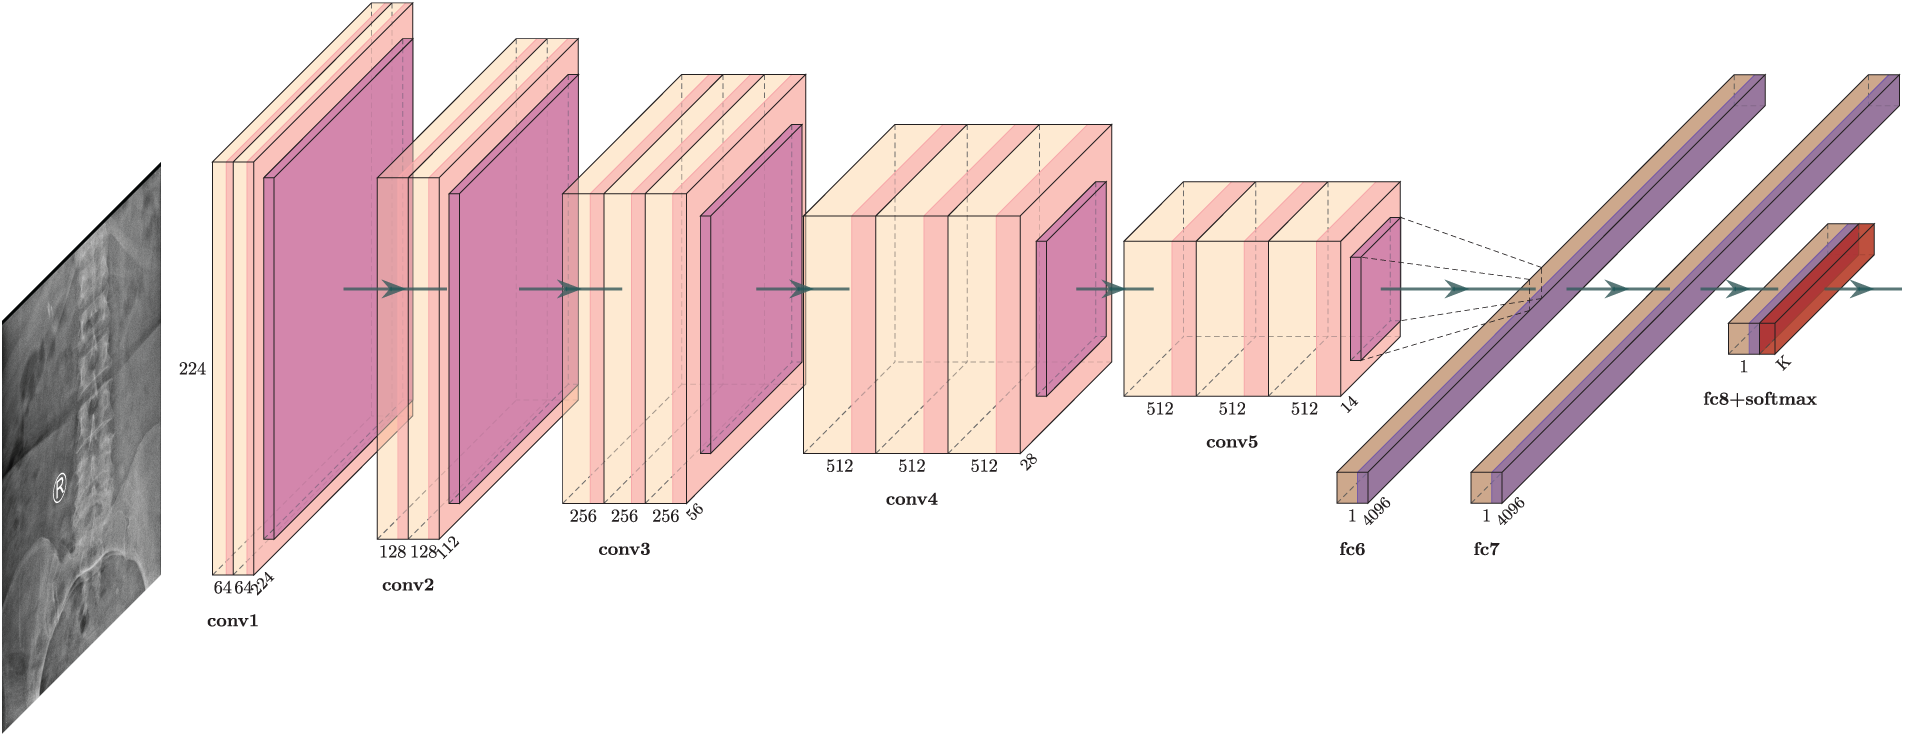
Figure 2: VGG16 model architecture for lumbar spondylolisthesis prediction
Deep models commonly encode the entities with vectors. However, this concept is rarely applied to image categorization. The capsule networks (CapsNets) use “vector-wise” encoding, in which items are encoded by capsules (groups of neurons). It helps in fixing the position of objects and managing the relationship between them. It overcomes the problem of information loss caused by pooling layers in CNN, such as location, size, rotation, and scale, as described in Fig. 3.
Figure 3: CapsNet vs. CNN Model
A capsule is made up of a pose vector or matrix for encoding the object’s instantiation of various layers parameters and an activation. The instantiation parameters change as the viewing circumstances change, but the capsule remains active. With the ability to assign parts to wholes, equivariance, and invariance are two qualities that are utilized to build visual hierarchical connections.
CapsNets may simulate visual hierarchical relationships due to the “Dynamic routing” method [39]. In CapsNets, dynamic routing is used to establish visual hierarchical relationships via a method called “routing-by-agreement” to repeatedly route information transitioning from lower to higher level capsules, which is the key concept of dynamic routing in CapsNets.
Fig. 4 depicts the CapsNet architecture for spine x-ray image classification. In this first layer, the ReLU function is activated with 256 filters and takes the parameter of size
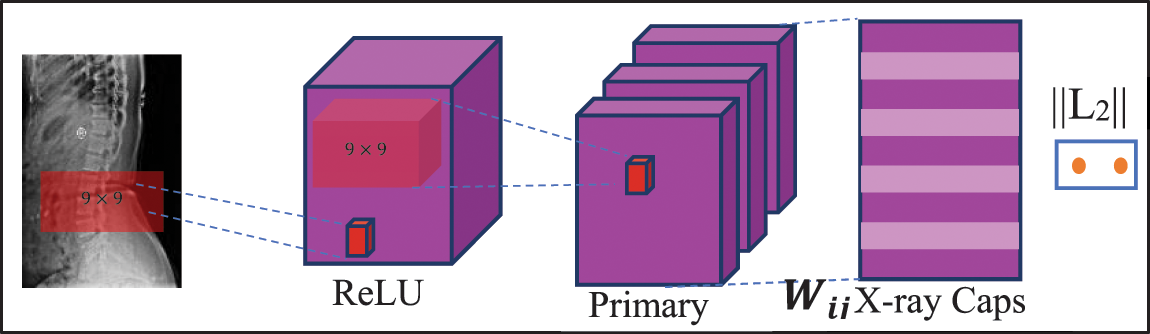
Figure 4: CapsNet architecture for spine x-ray diagnosis
3.2.1 CapsNet’s Basic Mathematics
CapsNet employed three unique mechanisms:
• Convolution,
• Reshaping function, and
• Squash function.
The input is given to the convolutional layers in the convolution process that is used to generate a list of “feature maps”. These feature maps are now reshaped using the Reshaping function. Finally, each vector’s length is kept inside the range of 1 and 0, according to the squash function. Because it represents the probability that an item will be found at a specific spot in the image and it does not cause the positional data contained in a high-dimensional vector to be destroyed [40].
Assume that layer
For a capsule
1. At layer
2. Now the output vector for capsule
3. Scalar
4. To obtain the activation
5. Long vectors are pushed toward 1 and shot vectors are pushed toward 0 by the squashing function.
3.2.2 Dynamic Routing Algorithm
Dynamic Routing Algorithm is more efficient than max pooling. It gives solid support to those capsules that have reached the parent output. It provides a non-linear relationship by using mathematical concepts explained in the earlier section. It is generally applicable to scalar values.
The layer
The predictions for high-level capsules from a low-level capsule should add up to one (i.e.,
The
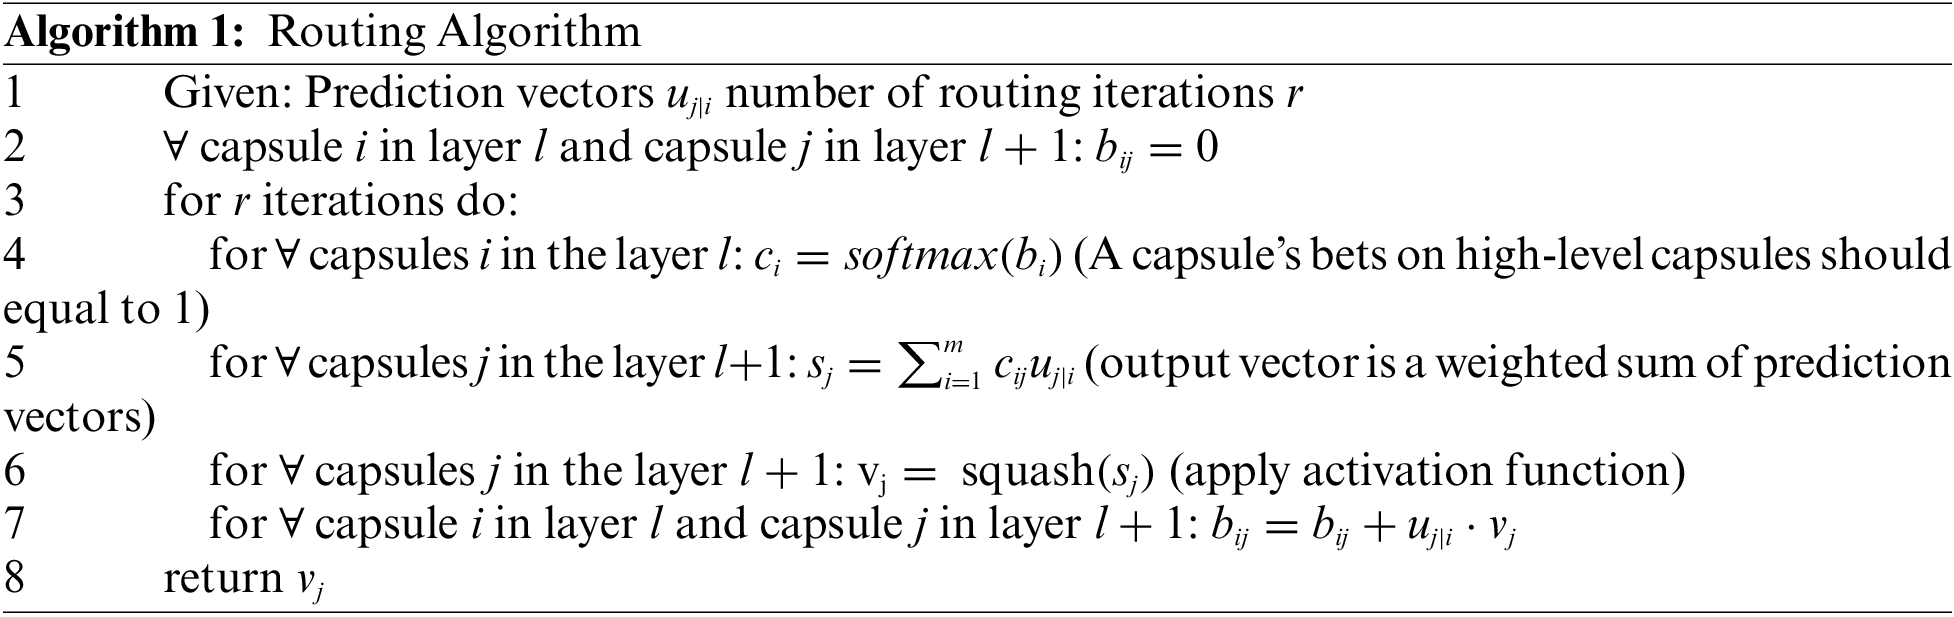
The routing takes place at the last line of the loop. If the product
3.3 Proposed Model Architecture
Transfer learning technique is used as a preliminary step for a few tasks. Utilizing knowledge from other areas to improve the quality of learning in the actual environment is the aim of transfer learning.
Reducing the amount of training time is possible through transfer learning. This approach could be connected to the creation of deep learning visual categorization models. A deep CNN and a smaller kernel size can improve model performance, as demonstrated by VGG16. As a result, the VGG16 architecture of CNN has been proposed as an integrated with CapsNet for faster processing. As a mixture of these two powerful architectures, the VGG16 is used to replace the feature extraction section of CapsNet in the research work. Fig. 5 shows the proposed integrated model architecture that includes a two-stage recommended paradigm.
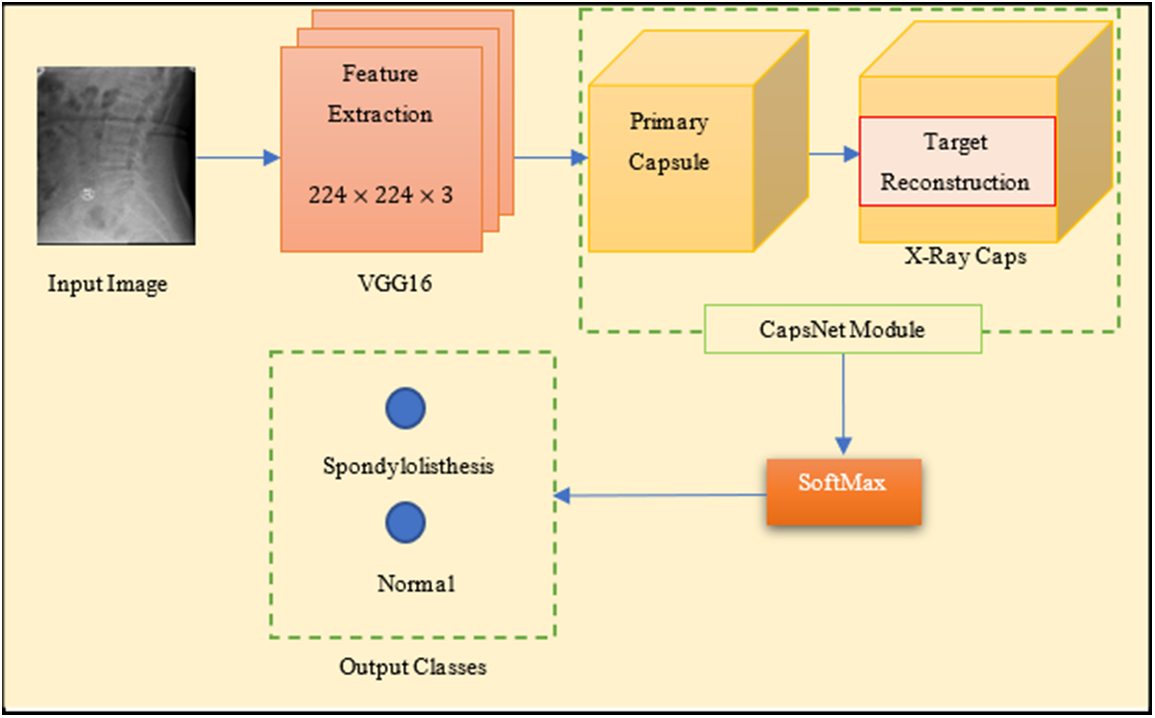
Figure 5: Integrated model (S-VCNet) architecture
The base network architecture is the VGG16 network with 2D kernels. In the first phase, Initial feature maps are derived from a spine X-ray radiograph using a VGG16 model. Conv1 kernels in VGG16 have been modified to support x-ray radiographs. VGG16 is invariant as a result of the pooling procedure, the model is reduced at the block
In the second phase, the features hierarchy is encoded to multi-dimensional main capsules via the global average-pooling layer. The pooling layer in VGG16 selects the backward-transmitted input and transfers the parameters between the two convolutional layers. CapsNet minimizes this marginal loss by dynamically adjusting the network’s parameters. For binary class prediction tasks, the lambda function is used.
The experiment was performed on programming language “Python3” by using Google Colab IDE. The Keras and TensorFlow frameworks were used as a feature extractor, and for scientific computing, various open-source libraries such as Pandas, NumPy, and Scikit-learn were applied. Pyplot module from the matplotlib package is utilized for accuracy and loss curve visualization.
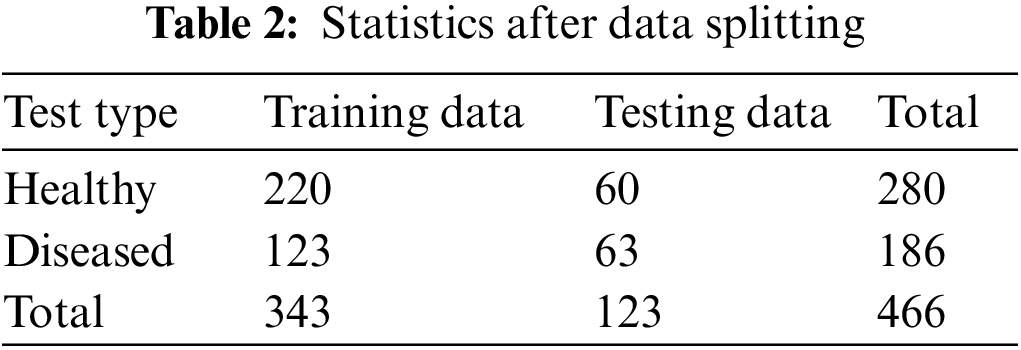
A private dataset of 466 spinal x-ray radiographs was used in this investigation. There are 186 images of the patient with spondylolisthesis, compared to 280 images of the healthy patient. The images were converted into 224 × 224 pixels. Fig. 6 displays a few pictures of patients with normal and spondylolisthesis cases from the dataset.
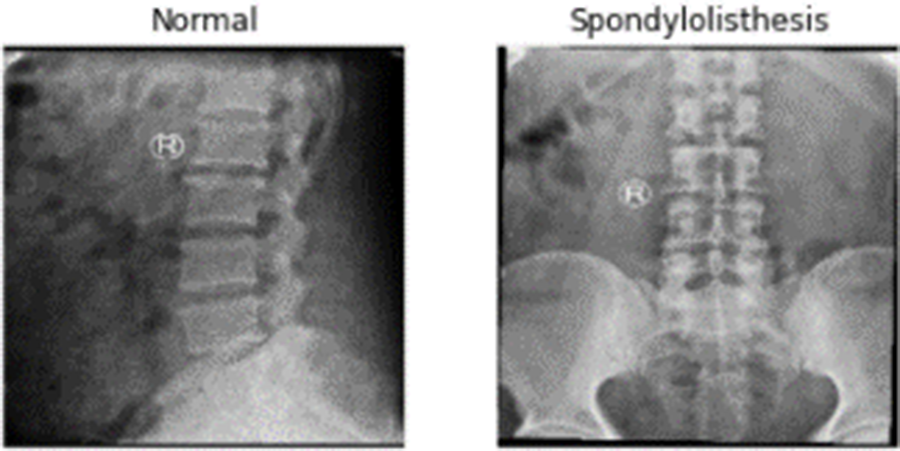
Figure 6: X-ray Radiographs from dataset
Collected data is split into two parts: training data, and testing data. A balanced set of images were selected from each category of image. A total of 343 samples are used to train the model. For performance checking, 123 images are randomly selected from the total sample. A quantitative breakdown of data splitting is shown in Table 2.
The foundational network design was provided by the VGG16 network with 2D kernels, and it has utilized a fixed image size of 224 × 224. The Conv1 kernels of VGG16 have been modified to accept the input. After block5_pool was reached, the capsule network was combined with VGG16. For binary class prediction tasks, a lambda function was utilized. The overall model contains a total of 21 M trainable parameters. Out of those 13 M parameters are trainable and 7 M parameters are non-trainable. The pre-trained ImageNet weights are used to train all the tasks end-to-end simultaneously using an ‘Adam’ optimizer. It is a simple and computationally efficient gradient-based loss function optimization technique. The loss function’s objective during training is to reduce the model’s loss. Loss is defined as the discrepancy between the expected and actual value.
A loss function, namely categorical cross entropy, is used to find the variation between two quantities. It is a strengthening tool that can differentiate the given quantities. An example is given below, in Table 3, to understand this example a bit more. Suppose we take the first case where:
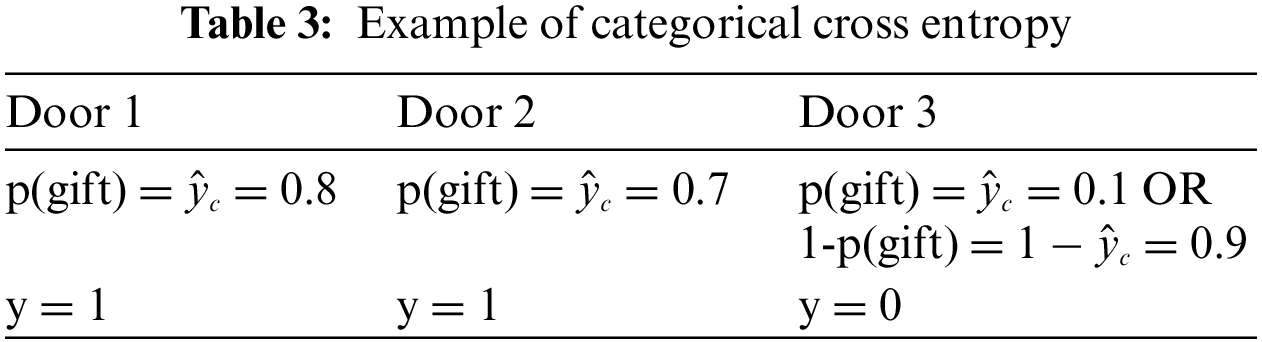
Door 3 shows the negative likelihood or 1, the probability that is the probability of not getting a gift. Here, y shows the number of gifts is behind the door. Categorical cross-entropy (CCE) can be formulated as follows,
For the given example, the above formula is used to calculate entropy. The cross-entropy is calculated by the negative logarithm. It is allowed for the two functions,
The goal of the Adam optimizer is to minimize the loss function. It is a method of calculating current gradients using prior gradients. Adam is a hybrid combination of the AdaGrad and RMSProp methods. Adam also applies the concept of momentum to the current gradient by combining fractions of prior gradients. This optimizer has gained a lot of popularity and is now widely used in neural network training.
Adam uses two moments in the gradients: variable
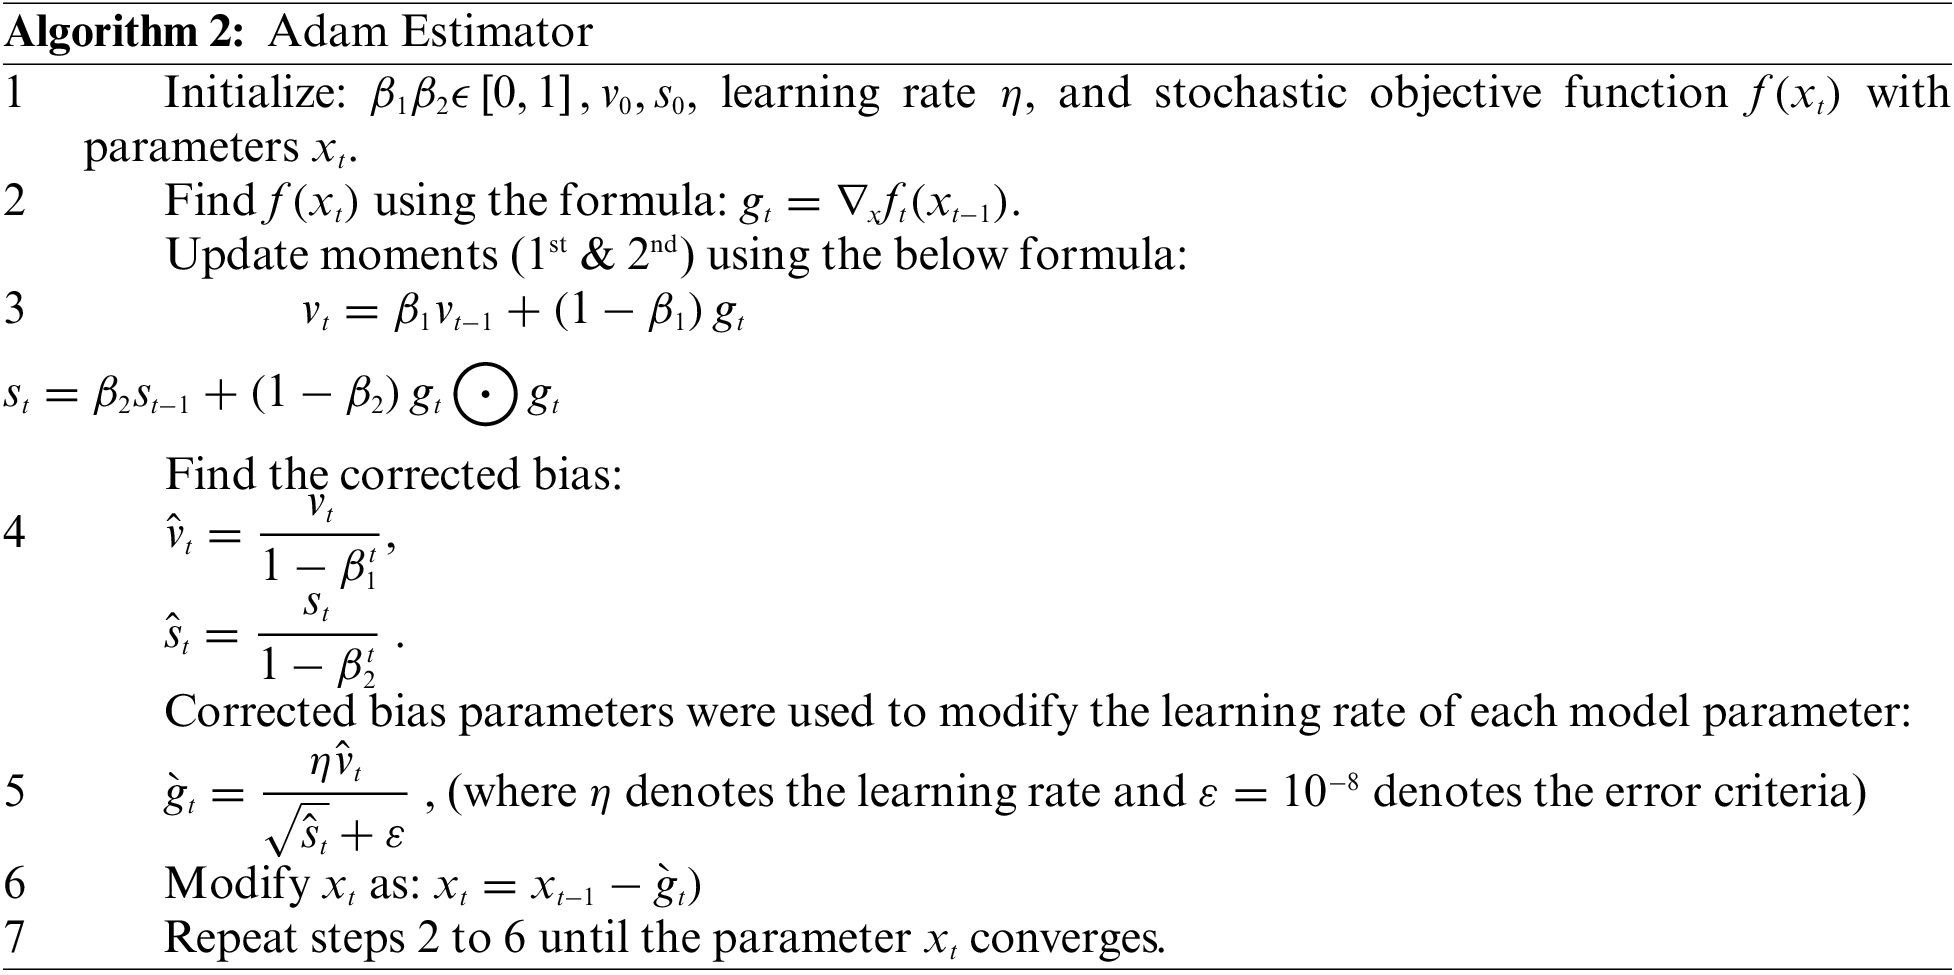
Adam used stochastic gradient descent to keep all weight updates and assured that the learning rate remains constant throughout the training. Each network weight (parameter) has its learning rate, which is maintained and changed as learning progresses. In addition, the algorithm computes an exponential moving average of the gradient as well as the squared gradient, with hyper parameters
4.4 Performance Evaluation Tools
The effectiveness of any DL model is defined by several performance assessment measures in the field of soft computing. The selection of metrics is decided according to the task handled. The current study is concerned with image classification tasks, therefore, the accuracy/loss graph, confusion matrix etc. are used as performance assessment metrics. Loss and accuracy will be used to assess model performance in this investigation. A confusion matrix is a much better approach to assessing a classifier’s performance in a classification problem for determining the model’s accuracy and precision. It works for both binary and multi-class classification systems.
A confusion matrix is not a performance metric itself, but it does allow for the computation of certain useful performance measures based on the true positive (TP), false positive (FP), false negative (FN), and true negative (TN) values. The words TP, FP, FN, and TN have been described below in the context of the considered situation:
• TP: A case is true positive if the patient has spondylolisthesis (class 1) and the classifying model predicted the case to be spondylolisthesis as well (class 1).
• FP: It has occurred when a patient with a healthy spine (class 0) is diagnosed with spondylolisthesis (class 1).
• FN: It is the reverse of FP, in which a patient with spondylolisthesis (class 1) is anticipated as healthy (class 0).
• TN: If a patient has a healthy spine (class 0) and is also predicted as healthy (class 0), the situation falls into the TN category.
For performance assessment, all the samples were observed from training and test categories. Some useful parameters for performance measures are computed using the confusion matrix. These metrics can be defined as follows:
Accuracy: This term is described by the number of right predictions divided by the total number of predictions.
Precision: Precision is a metric for determining the accuracy of a prediction.
Recall: Recall is the measure of successful identification of the ground truth.
F1 Score: The F1 score is calculated using the harmonic mean of precision and recall.
Sensitivity (SN): This term is described by the number of correct positive predictions divided by the total number of positive predictions.
Specificity (SP): This term is described by the number of correct negative predictions divided by the total number of negative predictions.
Confusion metrics were used to evaluate the prediction ability of developed models. To reduce over fitting and increase training data artificially, data augmentation techniques such as rotation, flipping, and zooming were used in this study. The history object was used to collect metric values for performance measurement during training. Continued learning of the VGG16 and S-VCNet is visualized using an accuracy/loss graph shown in Figs. 7 and 8, respectively.
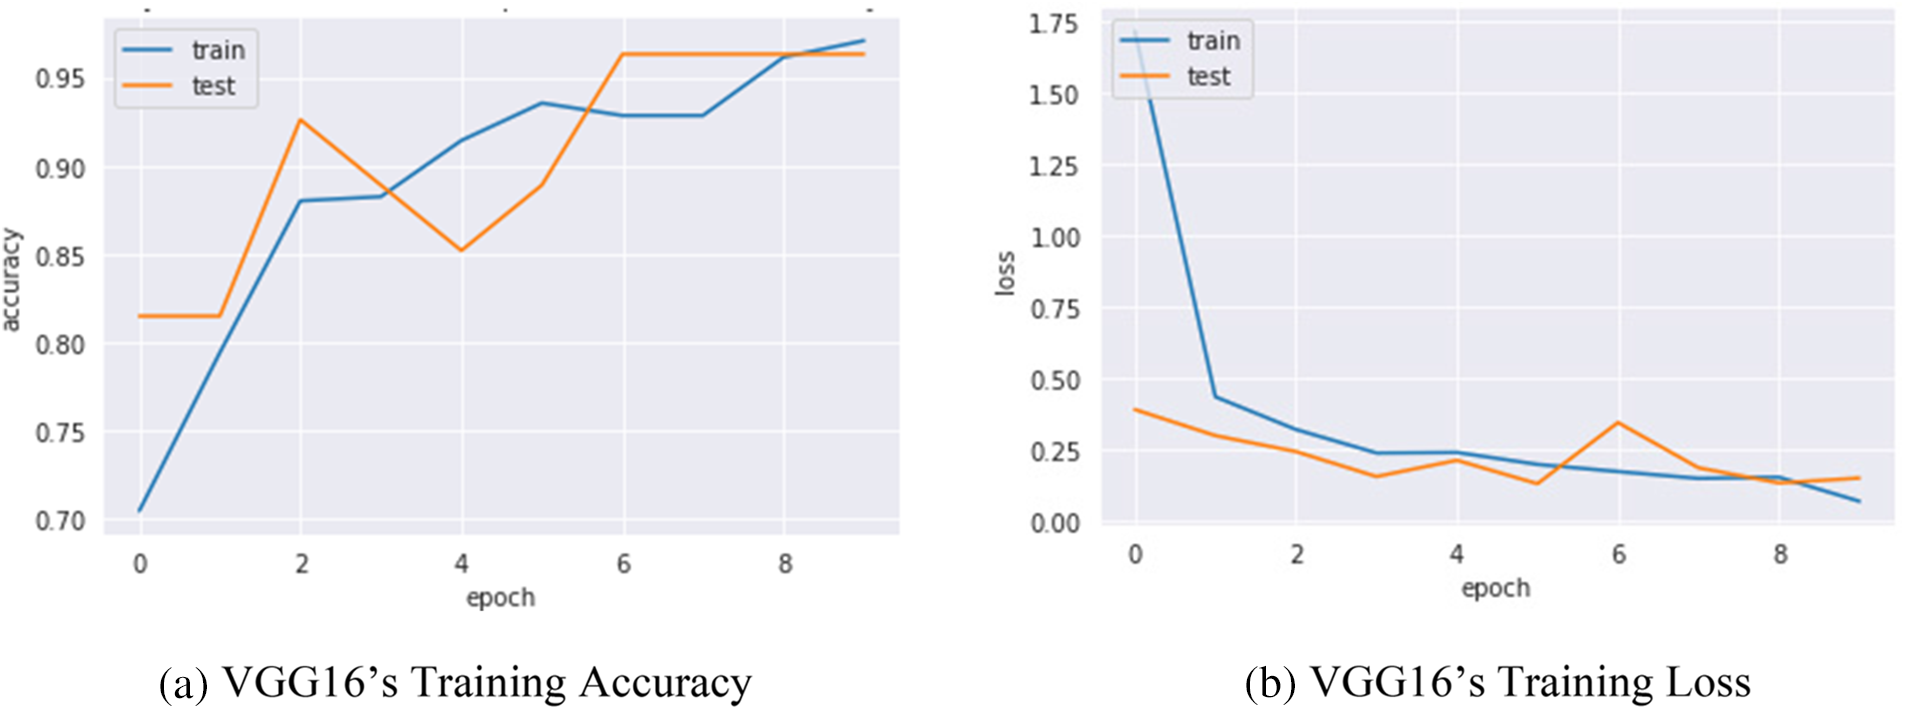
Figure 7: VGG16’s performance graph
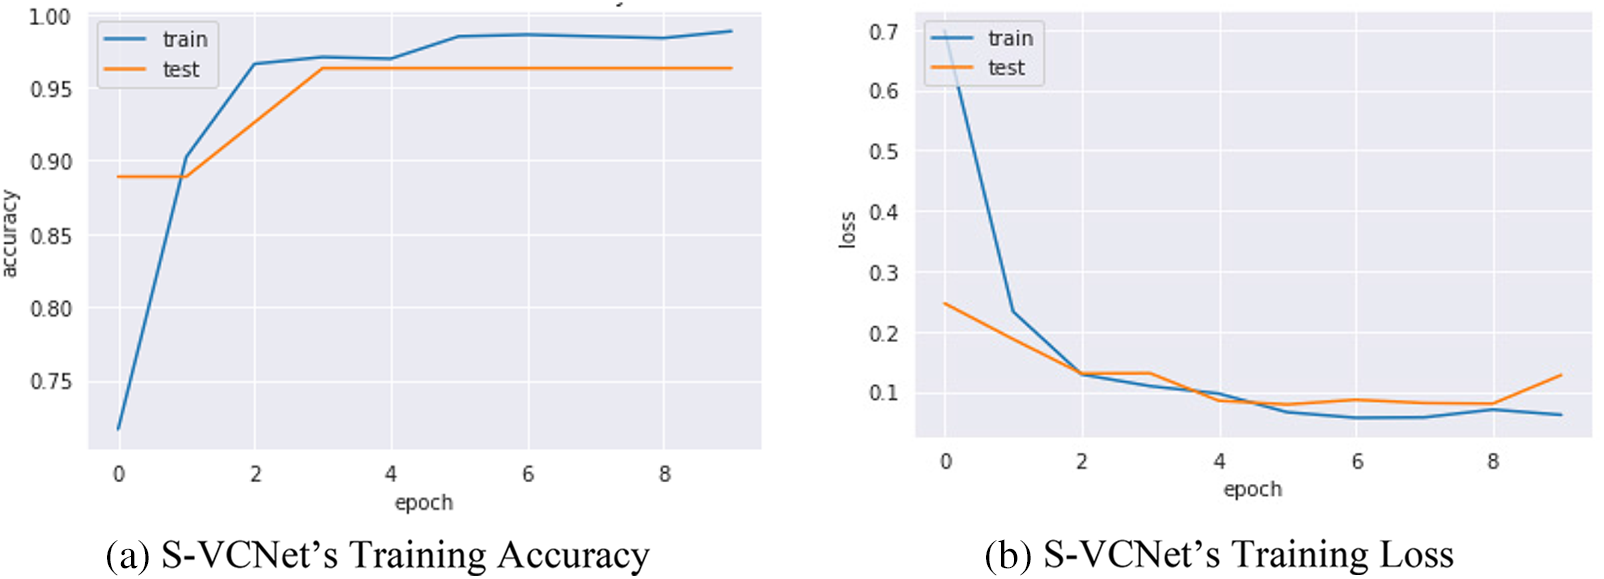
Figure 8: S-VCNet’s performance graph
The confusion matrix of selected models was displayed in Fig. 9 Actual instances were grouped in rows in the confusion matrix, whereas expected cases were grouped in columns and denoted as normal and spondylolisthesis cases.
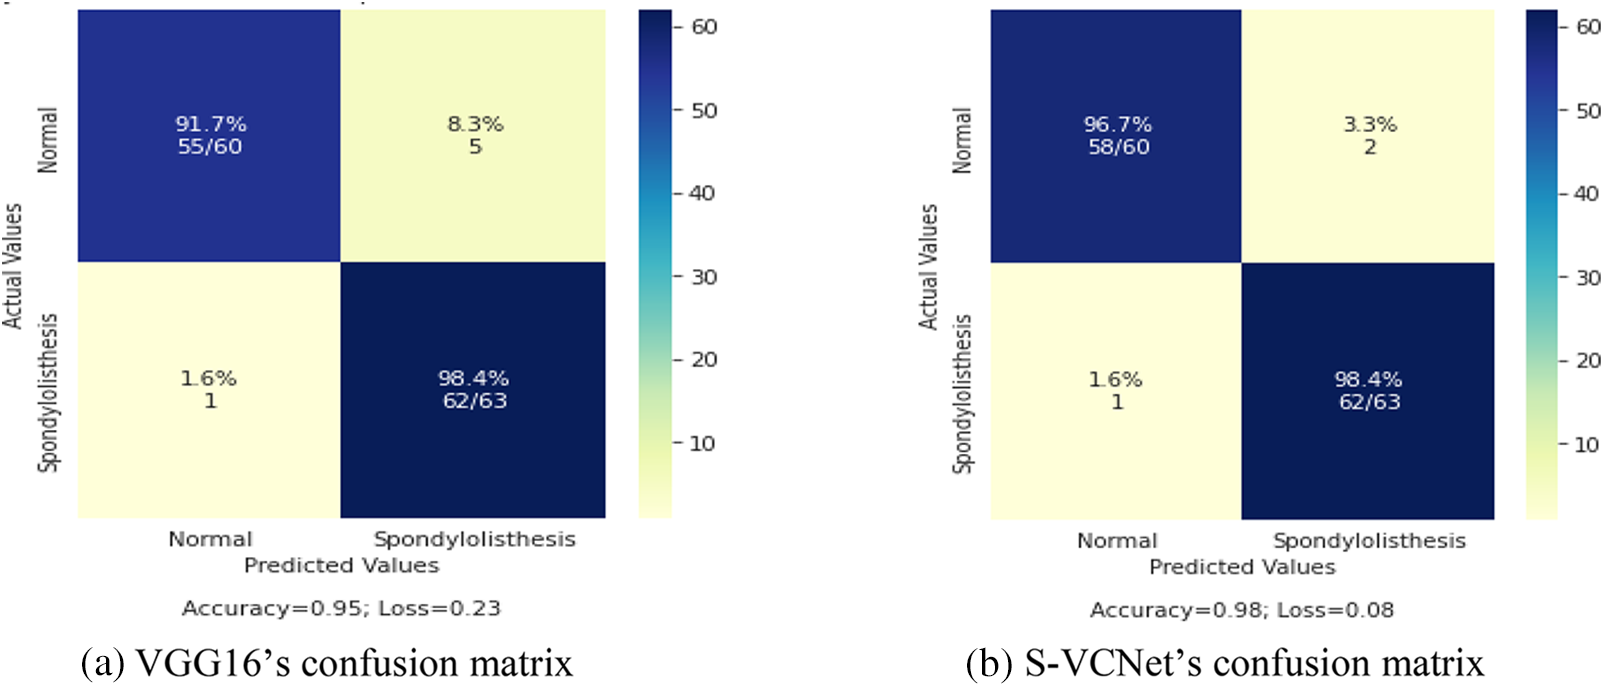
Figure 9: Confusion matrix of VGG16 and S-VCNet
The test set included a total of 123 X-ray radiographs (63 for spondylolisthesis and 60 for normal). Table 4 lists the performance metrics of the VGG16 and VGG-CapsNet classifiers for each class (Spondylolisthesis vs. Normal).
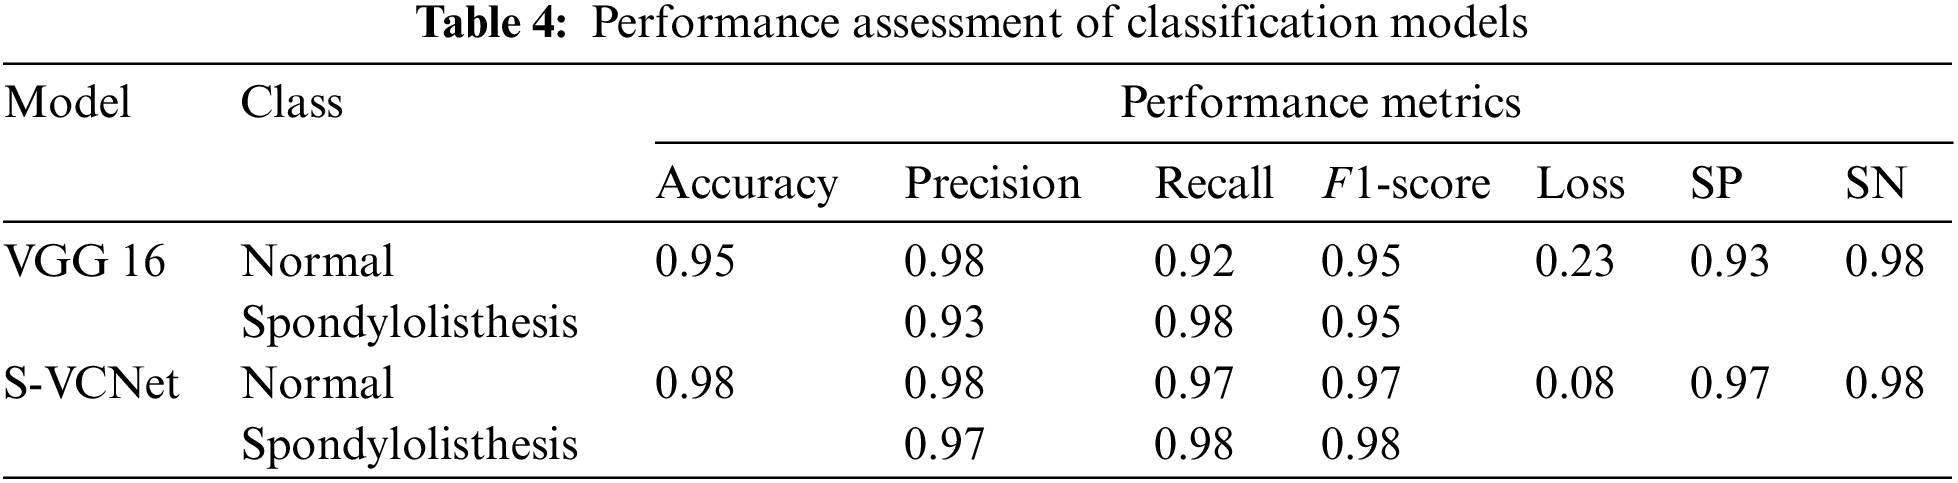
The above table shows that models have learned effectively. VGG16 has achieved 95% accuracy by misclassifying only 1 case as normal and 5 cases as spondylolisthesis. The suggested integrated model has achieved 98% accuracy by misclassifying only 1 case as normal and 2 cases as spondylolisthesis. The training loss of VGG16 and the integrated model are recorded as 0.23 and 0.08, respectively. After the result analysis, it is confirmed, the S-VCNet model outperformed for the spondylolisthesis detection.
The architecture of Gradio is based on a client-server model, where the client is a web browser and the server is a Python-based web application. While creating the Gradio interface a Python function needs to be defined that takes input from the user and returns an output. Then it generates a web page that allows users to interact with functions through a web form. After form submission the input is sent to the server, which runs those functions and returns the output to the user’s browser [42].
Gradio uses Flask, a lightweight web framework, as its server technology. It handles the HTTP requests and responses and provides a simple way to create routes that map to your Python functions. Gradio also uses Socket.IO to handle real-time communication between the client and server, allowing for a smooth and responsive user experience.
Under the hood, Gradio uses JavaScript and CSS to create the user interface, and it includes several pre-built components that you can use to customize your interface. Gradio also supports a wide variety of input and output types, including images, text, audio, and video. Overall, the architecture of Gradio is designed to be simple and flexible, allowing you to quickly create and deploy web interfaces for your ML models with minimal overhead [43].
After testing the integrated model, it is used as a web app for Lumbar Spondylolisthesis diagnosis on the Gradio platform. To access this application, the patient must first complete a hospital-based spine X-ray screening. Take a photo of the X-ray film and upload it using the “Drop Image Here or Click to Upload”, then hit the Submit button. Finally, spondylolisthesis may be detected using the Gradio platform.
Fig. 10 illustrates that the Gradio-based tool successfully recognized normal and spondylolisthesis cases within 20 s. The probability of the two classes will be presented as a percentage after hitting the Submit button (as shown in Figs. 10a and 10b). The X-ray image of the spine will most likely fall into one of two categories.
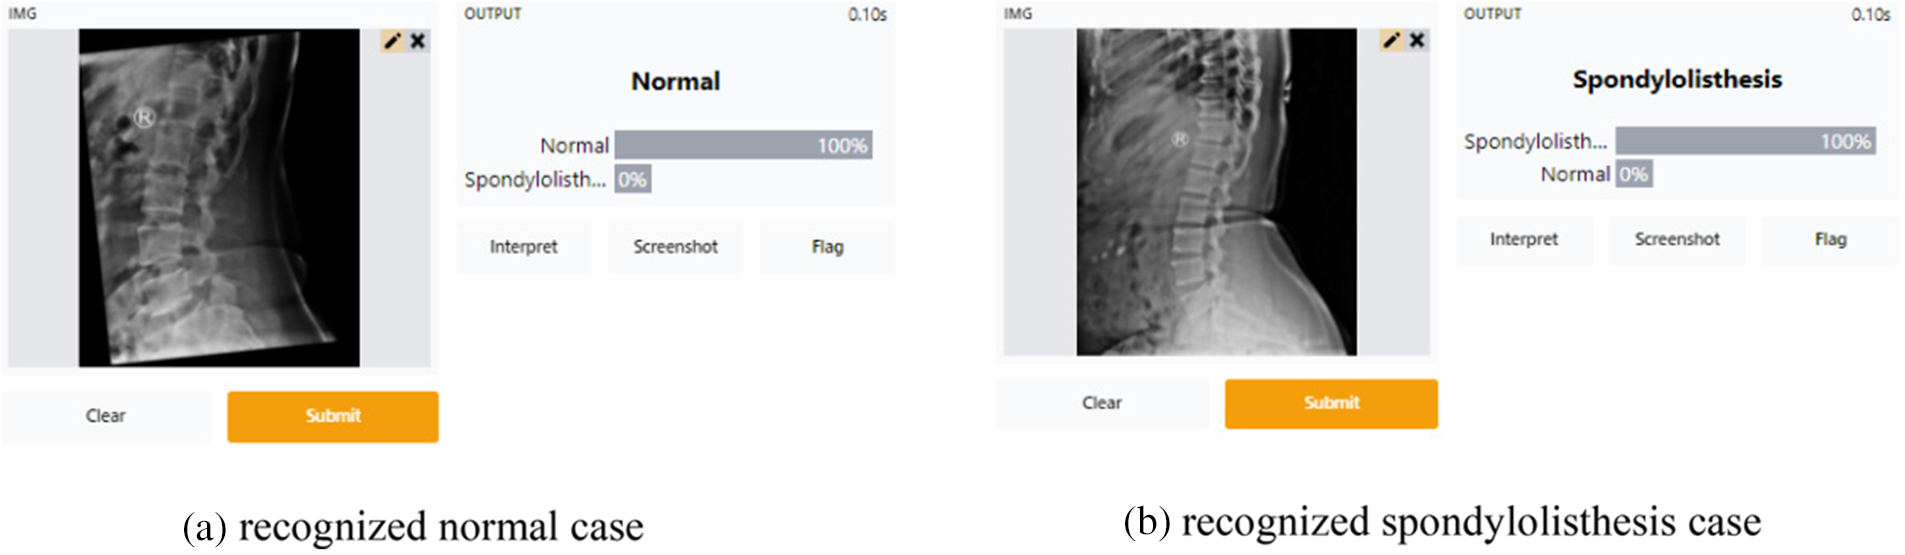
Figure 10: Screenshots of the gradio web application tool
The suggested model, S-VCNet, is found to take less time to diagnose lumbar spondylolisthesis and have high sensitivity and specificity, as shown by the figures and tables presented above. The model could be utilized in building a real-time diagnostic system for routine clinical practice. The results produced by VGG16 alone are not that beneficial, but the transferred weights from VGG16 to CapsNet for the classification task are found to be beneficial. The ultimate objective of the model is to minimize marginal loss for accurate and swift diagnosis, which was discovered to be significantly better than training the CapsNet from scratch. Compared to previous studies on integrated CapsNet models by Tiwari et al. [24], Kumar et al. [28], and Bharati et al. [27], the proposed model in this study achieved a peak accuracy of 98%.
In this study, a novel integrated model called “S-VCNet” is created using a web application for the prediction of Lumbar Spondylolisthesis, as an alternative to manual radiological examination. The suggested model improved the performance of the VGG16 model by utilizing the initial feature map. Comparative experiments demonstrated that the overall performance of S-VCNet was superior to previously created models. However, the model had significant limitations in accurately classifying some spondylolisthesis positive cases as negative or vice versa, indicating the need for further research in the diagnosis of lumbar spondylolisthesis. Although this study provides a foundation for predicting lumbar spondylolisthesis, grading the spondylolisthesis is important. Therefore, future studies should focus on (1) improving this algorithm for lumbar spondylolisthesis grading, and (2) developing a mobile app for the disease identification.
Acknowledgement: No grant is received for this paper from any funding organization.
Funding Statement: The authors received no funding for this study.
Conflicts of Interest: The authors declare that they have no conflicts of interest to report regarding the present study.
References
1. R. V. Johny and R. Roseline Mary, “Classification and correlational analysis on lower spine parametersusing data mining techniques,” International Journal of Recent Technology and Engineering, vol. 7, no. 6, pp. 1450–1456, 2019. [Google Scholar]
2. L. Kalichman and D. J. Hunter, “Diagnosis and conservative management of degenerative lumbar spondylolisthesis,” European Spine Journal, vol. 17, no. 3, pp. 327–335, 2008. https://doi.org/10.1007/s00586-007-0543-3 [Google Scholar] [PubMed] [CrossRef]
3. S. Tenny and C. C. Gillis, “Spondylolisthesis,” in The Growing Spine: Management of Spinal Disorders in Young Children, Second ed., pp. 415–448, 2017. Accessed: Oct. 11, 2021, http://europepmc.org/books/NBK430767 [Google Scholar]
4. N. Ebraheim, H. Elgafy, P. Gagnet, K. Andrews and K. Kern, “Spondylolysis and spondylolisthesis: A review of the literature,” Journal of Orthopaedics, vol. 15, no. 2, pp. 404–407, 2018. https://doi.org/10.1016/j.jor.2018.03.008 [Google Scholar] [PubMed] [CrossRef]
5. F. Varcin, H. Erbay, E. Cetin, I. Cetin and T. Kultur, “Diagnosis of lumbar spondylolisthesis via convolutional neural networks,” in Proc. 2019 Int. Conf. on Artificial Intelligence and Data Processing Symp. (IDAP), Malatya, Turkey, pp. 1–4, 2019. https://doi.org/10.1109/IDAP.2019.8875988 [Google Scholar] [CrossRef]
6. V. M. Ravindra, S. S. Senglaub, A. Rattani, M. C. Dewan, R. Härtl et al., Degenerative lumbar spine disease: Estimating global incidence and worldwide volume, Los Angeles, CA: SAGE Publications, 2018. [Google Scholar]
7. A. Jamaludin, Automated analysis of spinal MRI using deep learning, England: University of Oxford, 2017. [Google Scholar]
8. S. Liao, Y. Zhan, Z. Dong, R. Yan, L. Gong et al., “Automatic lumbar spondylolisthesis measurement in CT images,” IEEE Transactions on Medical Imaging, vol. 35, no. 7, pp. 1658–1669, 2016. https://doi.org/10.1109/TMI.2016.2523452 [Google Scholar] [PubMed] [CrossRef]
9. L. Saba, M. Biswas, V. Kuppili, E. C. Godia, H. S. Suri et al., “The present and future of deep learning in radiology,” European Journal of Radiology, vol. 114, no. February, pp. 14–24, 2019. https://doi.org/10.1016/j.ejrad.2019.02.038 [Google Scholar] [PubMed] [CrossRef]
10. K. Singh, B. Sharma, J. Singh, G. Srivastava, S. Sharma et al., “Local statistics-based speckle reducing bilateral filter for medical ultrasound images,” Mobile Networks and Applications, vol. 25, pp. 2367–2389, 2020. [Google Scholar]
11. D. Koundal, B. Sharma and Y. Guo, “Intuitionistic based segmentation of thyroid nodules in ultrasound images,” Computers in Biology and Medicine, vol. 121, pp. 103776, 2020. [Google Scholar] [PubMed]
12. S. Jalal, W. Parker, D. Ferguson and S. Nicolaou, “Exploring the role of artificial intelligence in an emergency and trauma radiology department,” Canadian Association of Radiologists Journal, vol. 72, no. 1, pp. 167–174, 2021. https://doi.org/10.1177/0846537120918338 [Google Scholar] [PubMed] [CrossRef]
13. D. Saravagi, S. Agrawal and M. Saravagi, “Opportunities and challenges of machine learning models for prediction and diagnosis of spondylolisthesis: A systematic review,” International Journal of Engineering Systems Modelling and Simulation, vol. 12, no. 2–3, pp. 127–138, 2021. https://doi.org/10.1504/IJESMS.2021.115534 [Google Scholar] [CrossRef]
14. Z. Ahmed, K. Mohamed, S. Zeeshan and X. Dong, “Artificial intelligence with multi-functional machine learning platform development for better healthcare and precision medicine,” Database, vol. 2020, no. 104, pp. 23, 2020. https://doi.org/10.1093/database/baaa010 [Google Scholar] [PubMed] [CrossRef]
15. M. Sethi, S. Ahuja and V. Kukreja, “An empirical study for the deep learning models,” Journal of Physics: Conference Series, vol. 1950, no. 1, pp. 012071, 2021. https://doi.org/10.1088/1742-6596/1950/1/012071 [Google Scholar] [CrossRef]
16. M. Agrawal and S. Agrawal, “A systematic review on artificial intelligence/deep learning applications and challenges to battle against covid-19 pandemic,” Disaster Advances, vol. 14, no. 8, pp. 90–99, 2021. https://doi.org/10.25303/148da9021 [Google Scholar] [CrossRef]
17. R. Tandon, S. Agrawal and P. Goyal, “Sequential convolutional neural network for automatic breast cancer image classification using histopathological images,” Journal of Critical Reviews, vol. 7, no. 15, pp. 6104–6117, 2020. [Google Scholar]
18. D. Saravagi, S. Agrawal, M. Saravagi and M. H. Rahman, “Diagnosis of lumbar pondylolisthesis using a pruned CNN model,” Computational and Mathematical Methods in Medicine, vol. 2022, no. 6, pp. 1–10, 2022. https://doi.org/10.1155/2022/2722315 [Google Scholar] [PubMed] [CrossRef]
19. S. Sara, F. Nicholas and G. E. Hinton, “Dynamic routing between capsules Advances in Neural Information Processing Systems 30,” in Proc. of the Annual Conf. on Neural Information Processing Systems, pp. 3856–3866, 2017. [Google Scholar]
20. G. Zhao, Y. Wu, M. He, J. Bai, J. Cheng et al., “Preprocessing and grading of glioma data acquired from multicenter,” Journal of Medical Imaging and Health Informatics, vol. 9, no. 6, pp. 1236–1245, 2019. https://doi.org/10.1166/JMIHI.2019.2724 [Google Scholar] [CrossRef]
21. M. Raghu, C. Zhang, J. Kleinberg and S. Bengio, “Transfusion: Understanding transfer learning for medical imaging,” Advances in Neural Information Processing Systems, vol. 32, no. NeurIPS, 2019. [Google Scholar]
22. V. K. Sakshi and S. Ahuja, “Recognition and classification of mathematical expressions using machine learning and deep learning methods,” in 2021 9th Int. Conf. on Reliability, Infocom Technologies and Optimization (Trends and Future DirectionsICRITO 2021, Noida, pp. 1–5, 2021. https://doi.org/10.1109/ICRITO51393.2021.9596161 [Google Scholar] [CrossRef]
23. D. Saravagi, S. Agrawal, M. Saravagi, J. M. Chatterjee and M. Agarwal, “Diagnosis of lumbar spondylolisthesis using optimized pretrained CNN models,” Computational Intelligence and Neuroscience, vol. 2022, pp. 1–12, 2022. https://doi.org/10.1155/2022/7459260 [Google Scholar] [PubMed] [CrossRef]
24. S. Tiwari and A. Jain, “Convolutional capsule network for COVID-19 detection using radiography images,” International Journal of Imaging Systems and Technology, vol. 31, no. 2, pp. 525–539, 2021. https://doi.org/10.1002/IMA.22566 [Google Scholar] [PubMed] [CrossRef]
25. A. Mittal, D. Kumar, M. Mittal, T. Saba, I. Abunadi et al., “Detecting pneumonia using convolutions and dynamic capsule routing for chest X-ray images,” Sensors, vol. 20, no. 4, pp. 1068, 2020. https://doi.org/10.3390/S20041068 [Google Scholar] [PubMed] [CrossRef]
26. D. Yousra, A. B. Abdelhakim and B. A. Mohamed, “A novel model for detection and classification coronavirus (COVID-19) based on chest x-ray images using CNN-CapsNet,” Sustainable Smart Cities and Territories, vol. 253, no. 8, pp. 187–199, 2021. https://doi.org/10.1007/978-3-030-78901-5_17 [Google Scholar] [CrossRef]
27. S. Bharati, P. Podder and M. R. H. Mondal, “Hybrid deep learning for detecting lung diseases from X-ray images,” Informatics in Medicine Unlocked, vol. 20, pp. 1–23, 2020. https://doi.org/10.1016/j.imu.2020.100391 [Google Scholar] [PubMed] [CrossRef]
28. G. Kumar, S. Chatterjee and C. Chattopadhyay, “DRISTI: A hybrid deep neural network for diabetic retinopathy diagnosis,” Signal Image and Video Processing, vol. 15, no. 8, pp. 1679–1686, 2021. https://doi.org/10.1007/s11760-021-01904-7 [Google Scholar] [PubMed] [CrossRef]
29. H. G. Nguyen, A. Blank, H. E. Dawson, A. Lugli and I. Zlobec, “Classification of colorectal tissue images from high throughput tissue microarrays by ensemble deep learning methods,” Scientific Reports, vol. 11, no. 1, pp. 1–11, 2021. https://doi.org/10.1038/s41598-021-81352-y [Google Scholar] [PubMed] [CrossRef]
30. J. M. C. Boaro, P. T. C. Dos Santos, C. V. M. Rocha, T. Fontenele, G. B. Junior et al., “Hybrid capsule network architecture estimation for melanoma detection,” in Int. Conf. on Systems, Signals, and Image Processing, Niteroi, vol. 2020, pp. 93–98, 2020. https://doi.org/10.1109/IWSSIP48289.2020.9145127 [Google Scholar] [CrossRef]
31. A. D. Gunasinghe, A. C. Aponso and H. Thirimanna, “Early prediction of lung diseases,” in 2019 IEEE 5th Int. Conf. for Convergence in Technology, I2CT 2019, Bombay, pp. 1–4, 2019. https://doi.org/10.1109/I2CT45611.2019.9033668 [Google Scholar] [CrossRef]
32. S. Toraman, T. B. Alakus and I. Turkoglu, “Convolutional capsnet: A novel artificial neural network approach to detect COVID-19 disease from X-ray images using capsule networks,” Chaos, Solitons, and Fractals, vol. 140, pp. 110122, 2020. https://doi.org/10.1016/J.CHAOS.2020.110122 [Google Scholar] [PubMed] [CrossRef]
33. A. F. M. Saif, C. Shahnaz, W. P. Zhu and M. O. Ahmad, “Abnormality detection in musculoskeletal radiographs using capsule network,” IEEE Access, vol. 7, pp. 81494–81503, 2019. https://doi.org/10.1109/ACCESS.2019.2923008 [Google Scholar] [CrossRef]
34. L. K. Singh and M. Khanna, “A novel multimodality based dual fusion integrated approach for efficient and early prediction of glaucoma,” Biomedical Signal Processing and Control, vol. 73, pp. 103468, 2022. https://doi.org/10.1016/j.bspc.2021.103468 [Google Scholar] [CrossRef]
35. B. Aksoy and O. K. M. Salman, “Detection of COVID-19 disease in chest X-ray images with capsul networks: Application with cloud computing,” Journal of Experimental & Theoretical Artificial Intelligence, vol. 33, no. 3, pp. 527–541, 2021. https://doi.org/10.1080/0952813X.2021.1908431 [Google Scholar] [CrossRef]
36. J. Abdollahi and L. Mahmoudi, “An artificial intelligence system for detecting the types of the epidemic from X-rays: Artificial intelligence system for detecting the types of the epidemic from x-rays,” in 2022 27th International Computer Conference, Computer Society of Iran (CSICC) Iran, Tehran-Iran, pp. 1–6, 2022. https://doi.org/10.1109/CSICC55295.2022.9780523 [Google Scholar] [CrossRef]
37. P. Sharma, R. Arya, R. Verma and B. Verma, “Conv-CapsNet: Capsule based network for COVID-19 detection through X-Ray scans,” Multimedia Tools And Applications, pp. 1–25, 2023. https://doi.org/10.1007/s11042-023-14353-w [Google Scholar] [PubMed] [CrossRef]
38. S. Qiu, “IRCM-Caps: An X-ray image detection method for COVID-19,” The Clinical Respiratory Journal, pp. 1–10, 2023. https://doi.org/10.1111/crj.13599 [Google Scholar] [PubMed] [CrossRef]
39. L. Zhao, X. Wang and L. Huang, “An efficient agreement mechanism in CapsNets By pairwise product,” arXiv Preprint. arXiv:2004.00272, 2020. [Google Scholar]
40. “Understanding capsule network architecture,” Intel, https://www.intel.com/content/www/us/en/developer/articles/technical/understanding-capsule-network-architecture.html [Google Scholar]
41. S. Kurumalla and P. S. Rao, “K-nearest neighbor based DBSCAN clustering algorithm for image segmentation,” Journal of Theoretical and Applied Information Technology, vol. 92, no. 2, pp. 395, 2016. [Google Scholar]
42. A. Abid, A. Abdalla, A. Abid, D. Khan, A. Alfozan et al., “Gradio: Hassle-free sharing and testing of ML models in the wild,” accessed Feb. 10, 2022, 2019. [Online]. Available: https://arxiv.org/abs/1906.02569v1 [Google Scholar]
43. A. Abid, A. Abdalla, A. Abid, D. Khan, A. Alfozan et al., “An online platform for interactive feedback in biomedical machine learning,” Nature Machine Intelligence, vol. 2, no. 2, pp. 86–88, 2020. [Google Scholar]
Cite This Article
 Copyright © 2023 The Author(s). Published by Tech Science Press.
This work is licensed under a Creative Commons Attribution 4.0 International License , which permits unrestricted use, distribution, and reproduction in any medium, provided the original work is properly cited.
 Downloads
 Citation Tools